Drugs, Health Technologies, Health Systems
Reimbursement Review
Belantamab Mafodotin (Blenrep), Pomalidomide, Dexamethasone
Sponsor: GlaxoSmithKline Inc.
Therapeutic area: Multiple myeloma
This multi-part report includes:
Clinical Review
Pharmacoeconomic Review
Clinical Review
Abbreviations
AE
adverse event
ASCT
autologous stem cell transplant
BCVA
best corrected visual acuity
BPd
belantamab mafodotin, pomalidomide, and dexamethasone
CDA-AMC
Canada’s Drug Agency
CI
confidence interval
CMRG
Canadian Myeloma Research Group
CR
complete response
CRR
complete response rate
CTCAE
Common Terminology Criteria for Adverse Events
DOR
duration of response
DRd
daratumumab, lenalidomide, and dexamethasone
DVd
daratumumab, bortezomib, and dexamethasone
ECOG
Eastern Cooperative Oncology Group
EORTC QLQ-C30
European Organisation for Research and Treatment of Cancer Quality of Life Questionnaire Core 30
GHS
global health status
GRADE
Grading of Recommendations Assessment, Development and Evaluation
hKd
high-dose carfilzomib and dexamethasone
hKDd
high-dose carfilzomib, daratumumab, and dexamethasone
HR
hazard ratio
HRQoL
health-related quality of life
IA1
interim analysis 1
IA2
interim analysis 2
IA3
interim analysis 3
IMiD
immunomodulatory drug
IMWG
International Myeloma Working Group
IRC
independent review committee
IsaKd
isatuximab, carfilzomib, and dexamethasone
IsaPd
isatuximab, pomalidomide, and dexamethasone
ISS
International Staging System
ITC
indirect treatment comparison
ITT
intention to treat
Kd
carfilzomib and dexamethasone
KM
Kaplan-Meier
KVA
Keratopathy and Visual Acuity
MID
minimal important difference
MM
multiple myeloma
MRD
minimal residual disease
NMA
network meta-analysis
OH (CCO)
Ontario Health (Cancer Care Ontario)
ORR
overall response rate
OS
overall survival
Pd
pomalidomide and dexamethasone
PFS
progression-free survival
PI
proteasome inhibitor
PR
partial response
PVd
pomalidomide, bortezomib, and dexamethasone
RCT
randomized controlled trial
RD
risk difference
RP2D
recommended phase 2 dose
r/r
relapsed or refractory
SAE
serious adverse event
sCR
stringent complete response
SLR
systematic literature review
SVd
selinexor, bortezomib, and dexamethasone
TEAE
treatment-emergent adverse event
Vd
bortezomib and dexamethasone
VGPR
very good partial response
Executive Summary
An overview of the submission details for the drug under review is provided in Table 1.
Table 1: Background Information of Application Submitted for Review
Item | Description |
|---|---|
Drug product | Belantamab mafodotin, in combination with pomalidomide and dexamethasone Strength: 70 mg and 100 mg vials Route of administration: IV infusion |
Sponsor | GlaxoSmithKline Inc. |
Indication | Belantamab mafodotin for injection is indicated, in combination with pomalidomide and dexamethasone, for the treatment of adults with relapsed or refractory multiple myeloma who have received at least 1 prior line of therapy, including lenalidomide. |
Reimbursement request | As per indication |
Health Canada approval status | NOC |
Health Canada review pathway | Standard review |
NOC date | July 21, 2025 |
Recommended dose (Cycle length = 4 weeks) | Dosage: Cycle 1: 2.5 mg/kg administered once Cycle 2 and onward: 1.9 mg/kg administered once every 4 weeks until disease progression or unacceptable toxicity |
NOC = Notice of Compliance.
Source: Draft product monograph for belantamab mafodotin.1
Introduction
Multiple myeloma (MM) is an incurable, progressive, malignant plasma cell cancer, characterized by the abnormal proliferation of clonal B cells in the bone marrow and overproduction of the abnormal immunoglobulin M protein.2 MM accounts for approximately 1% of all cancers and about 10% of all hematologic malignancies.3 MM is more common in males than females and about twice as common in Black people compared with white or Asian people.4-7 The incidence of MM is related to older age. In 32,065 patients with MM in Canada between 1992 and 2010, approximately 80% were diagnosed at the age of 60 years or older.7 It is estimated that 4,100 new cases of MM were diagnosed in 2024 in Canada.8 The 5-year net survival for patients with MM in Canada is approximately 50%.9 The clinical course of MM, although variable, typically includes periods of treatment and remission separated by inevitable relapses, with the duration of response to treatment decreasing with each subsequent line of therapy.10,11 Relapsed or refractory (r/r) MM is defined as MM that is nonresponsive to therapy or has progressed within 60 days of the last line of treatment in patients who previously achieved a minimal response or better.12,13
Autologous stem cell transplant (ASCT) is the standard of care for newly diagnosed patients with MM if they are eligible. Patients who are ineligible for ASCT are typically treated with a combination of immunomodulatory drugs, proteasome inhibitors (PIs), and mAbs. Lenalidomide is recommended to be used as part of the front-line therapy for newly diagnosed MM (regardless of ASCT eligibility) by the International Myeloma Working Group (IMWG) and the Canadian Myeloma Research Group (CMRG) Consensus Guideline Consortium due to the overall survival (OS) benefits seen in clinical trials.14 Treatment choice in r/r MM is individualized and multifactorial, taking into consideration prior treatment history and response, timing and aggressiveness of the relapse, patient factors (e.g., performance status, age, frailty, and comorbidities), personal preferences, and jurisdictional funding and rules around reimbursement.15,16 The general strategy for treatment beyond first line includes the use of a drug that the patient has either not been exposed to previously or demonstrated sensitivity to in the treatment regimen.17 Based on the IMWG recommendations, for patients whose disease is not refractory to lenalidomide, the preferred options for the second line are daratumumab, lenalidomide, and dexamethasone (DRd) or a combination of carfilzomib, lenalidomide, and dexamethasone, although alternatives are available.15,17
The objective of this report is to review and critically appraise the evidence submitted by the sponsor on the beneficial and harmful effects of belantamab mafodotin 70 mg and 100 mg vials for infusion in combination with pomalidomide and dexamethasone (Pd) in the treatment of MM in adult patients who have received at least 1 prior therapy including lenalidomide. The focus will be placed on comparing belantamab mafodotin, pomalidomide, and dexamethasone (BPd) with relevant comparators and identifying gaps in the current evidence.
Perspectives of Patients, Clinicians, and Drug Programs
The information in this section is a summary of input provided by the patient and clinician groups who responded to our call for input and from clinical expert(s) consulted by for the purpose of this review.
Patient Input
One patient group, Myeloma Canada, submitted input for this review via a survey (N = 100 completed surveys).
Patients identified infections as the most important symptom to control, followed by kidney problems, mobility, and pain. Daily activities that were most impacted were ability to travel and work, while the most impacted specific aspects of their quality of life were interruptions to life goals or accomplishments and loss of sexual desire.
Outcomes of most interest to patients were prolonged life expectancy, improved quality of life, and survival without progression of their disease. Various ocular side effects (eye pain or irritation, blurred vision, foreign body sensation, dry eyes) and infections were identified as the worst tolerability issues among 89 patients eligible to receive BPd and the 7 patients who had been treated with BPd.
The key toxicities of concern identified from the patient input are ocular harms and infections.
Clinician Input
Input From Clinical Experts Consulted for This Review
The clinical experts noted that because there are no curative therapies for MM, it is important to have new therapies with novel mechanisms of action for the patients who become resistant to current therapies. The clinical experts added the BPd will mostly be used in patients who have experienced relapse after 1 to 3 prior lines of therapy. According to the clinical experts, older patients who have already received DRd would be good candidates for BPd given the favourable toxicity profile with respect to myelosuppression. They added that any patients with pre-existing eye conditions would not be good candidates for belantamab mafodotin–containing regimens due to the ocular toxicities.
The clinical experts noted the importance of health-related quality of life (HRQoL) in assessing BPd in MM, because patients survive for a long time with this type of cancer, and due to the ocular toxicities, which may negatively impact quality of life. The clinical experts added that the main reasons to discontinue treatment would be disease progression or toxicity, namely ocular adverse events (AEs).
Clinician Group Input
Two clinician groups, Ontario Health (Cancer Care Ontario) (OH [CCO]) Hematology Cancer Drug Advisory Committee and CMRG, provided input for this Clinical Review. The OH (CCO) Hematology Cancer Drug Advisory Committee gathered information from 7 clinicians, while CMRG collected input from 20 clinicians.
There were no obvious areas of disagreement between the clinician groups and the clinical experts consulted on this review.
The OH (CCO) Hematology Cancer Drug Advisory Committee noted that BPd could fit into current second-line treatments for patients whose disease is resistant to lenalidomide or bortezomib. CMRG noted that BPd would pertain to patients who have had 1 to 3 prior lines of therapy.
Both clinician groups noted that BPd should be discontinued upon disease progression or significant toxicity, especially significant ocular toxicity. Both clinician groups noted that the outpatient setting is the appropriate setting for treatment with BPd, and ophthalmological assessment is needed.
Drug Program Input
In response to a question about how BPd compares with therapies like carfilzomib and dexamethasone (Kd); selinexor, bortezomib, and dexamethasone (SVd); isatuximab, pomalidomide, and dexamethasone (IsaPd); isatuximab, carfilzomib, and dexamethasone (IsaKd); and Pd, the clinical experts believed BPd to have very good and perhaps even superior efficacy to many of these regimens; however, 1 clinical expert also noted that it is difficult to compare to IsaPd and IsaKd, which are also quite effective. In response to a question about whether certain groups of patients should be considered for BPd, the clinical experts believed that patients with active plasma cell leukemia and patients who have experienced intolerance to (or whose disease is refractory to) bortezomib could be considered for BPd, and 1 clinical expert noted that although there are limited data, BPd will likely be used in patients with light chain amyloidosis.
In response to a question as to whether patients receiving Pd or other treatments be switched to belantamab mafodotin, the clinical experts said they believed this could be allowed. In response to a question about sequencing of belantamab mafodotin with other BCMA-targeting therapies, the clinical experts noted that belantamab mafodotin likely has some efficacy; however, 1 clinical expert noted data from an IMWG sequencing paper that suggested efficacy may be reduced. In response to a question, the clinical experts noted that if a patient experiences disease progression on a bortezomib- and lenalidomide-containing regimen in the first-line setting, there would be no reason to exclude them from BPd.
Clinical Evidence
Systematic Review
Description of Studies
The DREAMM-8 study is an ongoing phase III, open-label, multinational (140 centres in 18 countries, including 3 sites in Canada) randomized controlled trial (RCT) evaluating the efficacy and safety of BPd versus pomalidomide, bortezomib, and dexamethasone (PVd) in 302 participants with r/r MM. Patients in the BPd group received belantamab mafodotin intravenously 2.5 mg/kg on day 1 of cycle 1 and a dose of 1.9 mg/kg of cycle 2 or more in each 28-day cycle. Following screening, participants were stratified based on the number of prior lines of therapy (1 versus 2 or 3 versus ≥ 4), prior bortezomib treatment (yes or no), and prior anti CD38 treatment (yes or no). International Staging System (ISS) status (I versus II or III) was a randomization factor but was replaced with prior anti-CD38 treatment (yes or no) in Protocol Amendment 1. Treatment was continued in both groups until progressive disease per IMWG criteria, death, unacceptable toxicity, start of a new antimyeloma therapy, withdrawal of consent, or the end of the study, whichever occurred first. In the case of progressive disease, participants were followed to ascertain receipt of subsequent antimyeloma therapy, progression-free survival (PFS) on subsequent line of therapy, and survival status every 12 weeks (± 14 days) until the withdrawal of consent, loss to follow-up, death, or the end of the study. The primary outcome of the DREAMM-8 study was PFS, while key secondary outcomes included OS, duration of response (DOR) and minimal residual disease (MRD) negativity. The primary and secondary end points of the DREAMM-8 study were analyzed based on the data cut-off date of January 29, 2024.18,19
Most patients were male (60%; about 40% were female) and had an average age of 66 years; approximately 61% were aged 65 years or older. Most patients (59%) were at ISS stage I at screening, only 10% had extramedullary disease and ███ had lytic bone lesions. The most common myeloma immunoglobulin was IgG (62% of patients), with IgA being the next most common (22%). With respect to prior lines of therapy completed before screening, 53% of patients had 1 line, 34% had 2 or 3 lines, and 14% had 4 or more lines. Most patients (91%) had a prior PI, and all patients had a previous immunomodulatory drug and had received lenalidomide. Sixty percent of patients had a prior stem cell transplant. With respect to the cytogenetic risk profile, one-third were considered high risk. Most patients (98%) had Eastern Cooperative Oncology Group (ECOG) performance status scores of 0 or 1.
Efficacy Results
Progression-Free Survival
PFS was assessed by an independent review committee (IRC). After a median follow-up of 21.8 months, progression or death occurred in 62 participants (40%) in the BPd arm versus 80 (54%) participants in the PVd arm, for a hazard ratio (HR) of 0.52 (95% confidence interval [CI]: 0.37 to 0.73; P < 0.001). The median PFS was not reached in the BPd arm (95% CI, 20.6 to not reached) and was 12.7 months (95% CI, 9.1 to 18.5) in the PVd arm. Landmark analyses of PFS at 12 months showed a higher PFS rate in the BPd arm compared with the PVd arm (71% versus 51%), as well as at 18 months (███ versus ███). █████ ███████████ or supplemental analyses were conducted, all of which yielded results consistent with the primary PFS analysis, with HRs ranging from ████ ██ ████.
The PFS benefit observed was consistent across all subgroups, with HRs ranging from 0.26 to 0.76.19 In the protocol-specified subgroups of the DREAMM-8 trial, the HR was 0.52 (95% CI, 0.31 to 0.88) for participants with 1 prior line of therapy and 0.52 (95% CI, 0.33 to 0.80) for those with more than 1 prior line. For patients exposed to bortezomib, the HR was 0.55 (95% CI, 0.38 to 0.78). Among participants whose disease is refractory to lenalidomide, the HR was 0.45 (95% CI, 0.31 to 0.65). Regarding cytogenetic risk, the HR was 0.57 (95% CI, 0.34 to 0.96) for patients at high risk and 0.51 (95% CI, 0.30 to 0.86) for those with standard risk.
Overall Survival
At the data cut-off date (January 29, 2024), median OS was not reached in either treatment arm. The OS data had reached 34.8% (105 of 302 participants) overall maturity and an information fraction equal to 48.4% (105 of 217), where 217 deaths were planned for OS analysis according to the statistical analysis plan. Follow-up for OS is ongoing and will continue until the planned interim analysis 3 (IA3) of OS at approximately 60% information fraction. The 12-month OS survival rate was higher in the BPd arm compared with the PVd arm (83% [95% CI, 76% to 86%] versus 76% [95% CI, 68% to 82%]), for a risk difference (RD) of ████ ████ ███ ██████ ██████ and this was also the case at 18 months ████ █████ ████ versus ███ █████ ████, for a RD of ████ ████ ███ ██████ ██████.
European Organisation for Research and Treatment of Cancer Quality of Life Questionnaire Core 30
At least 50% of participants in both treatment arms were on treatment during the initial 12 months and had regular assessments every 4 weeks. Therefore, the patient-reported outcome dataset is more complete during this time. The European Organisation for Research and Treatment of Cancer Quality of Life Questionnaire Core 30 (EORTC QLQ-C30) global health status (GHS) domain, physical domain, role functioning domain, and fatigue domain remained stable across both treatment arms over time.
Conventional Assessment of DOR
DOR was defined as the time from first documented evidence of partial response (PR) or better until progressive disease or death due to any cause based on IRC assessment per IMWG criteria. The median DOR was not reached in the BPd arm (95% CI, 24.9 to not reached) and was 17.5 months (95% CI, 12.1 to 26.4) in the PVd arm. In the BPd arm, 66 (55%) participants with response had not progressed or died and had follow-up for PFS ongoing at the data cut-off date compared with 33 (31%) participants in the PVd arm.
MRD Negativity Rate
At the time of the primary analysis, the proportion of participants with a complete response or greater who achieved MRD negativity was higher in the BPd arm (37 of 155 patients, 24%) compared with the PVd arm (7 of 147 patients, 5%). Because the OS analysis was not statistically significant (because the data were immature) at the time of the PFS analysis data cut-off date, MRD negativity could not be formally tested at that time. Results of the MRD negativity analysis using investigator-confirmed response or in participants with very good partial response (VGPR) or better were consistent with the primary MRD analysis.
Complete Response Rate
There were 62 patients (40%) in the BPd group compared to 24 patients (16%) in the PVd group who had an IRC-assessed complete response (CR) or better. No formal testing of this outcome was completed.
Harms Results
When assessing harms, it should be noted that exposure to BPd was longer than PVd. For example, the median exposure to belantamab mafodotin was 13.19 months, pomalidomide 15.92 months, and dexamethasone 14.00 months in the BPd group, while exposure to bortezomib was 7.62 months, pomalidomide 8.51 months, and dexamethasone 8.08 months in the PVd group.
Adverse Events
Overall, 149 patients (more than 99%) in the BPd group and 139 patients (96%) in the PVd group had at least 1 AE, and 136 patients (91%) in the BPd group and 106 patients (73%) in the PVd group had a grade 3 or 4 AE. The 3 most frequent AEs, all more common in BPd than PVd, included vision blurred, (119 patients [79%] versus 22 patients [15%]), dry eye (91 patients [61%] versus 14 patients [10%]), and foreign body sensation in eyes (91 patients [61%] versus 9 patients [6%]). Under the category of infections and infestations, the AEs where there were differences for BPd versus PVd, were COVID-19 (56 patients [37%] versus 31 patients [21%]), upper respiratory tract infection (40 patients [27%] versus 25 patients [17%]), and pneumonia (36 patients [24%] versus 17 patients [12%]).
The most common grade 3 or greater AEs, all more common with BPd versus PVd, were neutropenia (63 patients [42%] versus 41 patients [28%]), thrombocytopenia (36 patients [24%] versus 29 patients [20%]), and pneumonia (26 patients [17%] versus 11 patients [8%]).19
Serious AEs
Overall, there were 95 patients (63%) in the BPd arm and 65 patients (45%) in the PVd arm who had a serious AE (SAE). The exposure-adjusted incidence rate for SAEs was comparable between the 2 treatment arms (45.87 per 100 person-years versus 47.87 per 100 person-years, respectively).19 The most frequently reported SAE in both treatment arms was pneumonia, which occurred in ██ patients █████ in the BPd group and ██ patients ████ in the PVd group.
Withdrawals Due to AEs
The incidence of AEs leading to discontinuation of study treatment (any component of study treatment) was 15% (22 patients) with BPd and 12% (18 patients) with PVd.19 The most common AEs leading to treatment discontinuation in the BPd arm were fatigue, keratopathy, muscular weakness, and neuralgia ███ ██████19
Mortality
The incidence of fatal SAEs (related and not related to study treatment) was the same in the 2 treatment arms (11% in both BPd and PVd arms).19 The most common fatal SAE was COVID-19 pneumonia (3% [n = 5] in the BPd arm versus 1% [n = 2] in the PVd arm) and death due to unknown cause (0 in the BPd arm versus 2% [n = 3] in the PVd arm). All other fatal SAEs were reported in 1% or less of participants.19
Notable Harms
Ocular exams were performed regularly for all participants in both treatment arms throughout the study. They were performed more frequently in the BPd arm (every 4 weeks, then decreased to every 3 months if there were no significant ocular findings after the sixth dose) than in the PVd arm (every 6 months).19 Under the original trial protocol, all ocular symptoms and examination findings were to be reported as AEs and graded by the Common Terminology Criteria for Adverse Events (CTCAE) criteria. Belantamab mafodotin dose modification was based on these assessments.
Ocular AEs (CTCAE grade) occurred in 89% of participants in the BPd arm. Vision blurred, dry eye, foreign body sensation in eyes, and eye irritation were each reported in 50% or more of the participants in this treatment arm.19 The incidence of ocular AEs (CTCAE grade) in the PVd arm was lower (30%). The most frequently reported ocular AE in this treatment arm was vision blurred (15%). Grade 3 or 4 ocular AEs (CTCAE grade) were reported in more participants in the BPd arm (43%) than in the PVd arm (2%).19 The most common grade 3 or greater ocular AEs, occurring more commonly in the patients taking BPd than those taking PVd, were blurred vision (26 patients [17%] versus none), reduced visual acuity (20 patients [13%] versus 1 patient [less than 1%]), impaired vision ███ ████████ █████ ██ █ ███████ █████ ████ ████, corneal epithelial microcysts and dry eye (12 patients each [8%] versus none), cataract (9 patients [6%] versus 6 patients [4%]), foreign body sensation (9 patients [6%] versus none), and punctate keratitis (9 patients [6%] versus 1 patient [less than 1%]).
Critical Appraisal
The open-label design of the DREAMM-8 study introduces the potential for bias, particularly with respect to patient-reported outcomes such as HRQoL. Assessment of HRQoL was also complicated by high attrition rates and missing data from patients who were unable to complete assessments due to disease progression or death, with data reported for less than half of the original intention-to-treat (ITT) population by week 53. Although study withdrawals were relatively low (less than 10%) across groups, there was a large number of patients who discontinued treatment in both groups; therefore, there was a large imbalance in patients going on to subsequent treatment in the BPd group compared with the PVd group (27% versus 52%), and this complicated the interpretation of OS.
OS data are not yet mature; therefore, this limits any conclusions that can be drawn about the data. PFS is considered a valid surrogate for OS and is frequently used as a primary outcome in pivotal trials, consistent with FDA guidance.
GRADE Summary of Findings and Certainty of the Evidence
For pivotal studies and RCTs identified in the sponsor’s systematic review, the Grading of Recommendations Assessment, Development and Evaluation (GRADE) approach was used to assess the certainty of the evidence for outcomes considered most relevant to inform expert committee deliberations. A final certainty rating was determined as outlined by the GRADE Working Group.20,21
Following the GRADE approach, evidence from RCTs started as high-certainty evidence and could be rated down for concerns related to study limitations (which refers to internal validity or risk of bias), inconsistency across studies, indirectness, imprecision of effects, and publication bias.
When possible, certainty was rated in the context of the presence of an important (nontrivial) treatment effect. If that was not possible, certainty was rated in the context of the presence of any treatment effect (i.e., the clinical importance is unclear). In all cases, the target of the certainty of evidence assessment was based on the point estimate and where it was located relative to the threshold for a clinically important effect (when a threshold was available) or to the null. The minimal important difference (MID) for PFS and OS were obtained by asking the clinical experts for their impression of what it should be. For PFS, the clinical experts suggest that a 10% difference between groups would be considered clinically significant, while for OS they suggested it should be 5% because any gain in survival would be considered clinically meaningful to patients. For HRQoL, an MID of 10 points was identified by the sponsor as clinically significant, and the clinical experts agreed that this seemed reasonable. However, given the challenges in trying to identify 1 specific time point in which to assess response to the EORTC QLQ-C30 given the constant attrition over the course of the study, it was decided that instead of seeking 1 specific target of certainty, an overall impression of the direction of effect over time would be ascertained.
The selection of outcomes for GRADE assessment was based on the sponsor’s Summary of Clinical Evidence, consultation with clinical experts, and input received from patient and clinician groups and public drug plans. The following list of outcomes was finalized in consultation with expert committee members:
PFS
OS
HRQoL (EORTC QLQ-C30 GHS)
harms (ocular AEs, SAEs).
Table 2: Summary of Findings for BPd vs. PVd for Patients With r/r MM
Outcome and follow-up | Patients (studies), N | Relative effect (95% CI) | Absolute effects (95% CI) | Certainty | What happens | ||
|---|---|---|---|---|---|---|---|
PVd | BPd | Difference | |||||
PFS (median follow-up 21.8 months) | |||||||
Probability of being progression-free at 12 months | N = 302 (1 RCT) | NR | ██ ███ ███ | ██ ███ ███ ███ ███ ███ ██ ██ ███ ████ | ███ ████ ███ ████ ███ ████ ██ ███ ████ ███ █████ | Moderatea | Belantamab mafodotin in combination with Pd likely results in a clinically important improvement in the probability of being progression-free compared with PVd. |
Probability of being progression-free at 18 months | N = 302 (1 RCT) | NR | ██ ███ ███ | ██ ███ ███ ███ ███ ███ ██ ██ ██ ████ | ███ ████ ███ ████ ███ ████ ██ ███ ████ ███ █████ | Moderatea | Belantamab mafodotin in combination with Pd likely results in a clinically important improvement in the probability of being progression-free compared with PVd. |
OS | |||||||
Probability of being alive at 12 months | N = 302 (1 RCT) | NR | ██ ███ ███ | ██ ███ ███ ███ ███ ███ ██ ██ ███ ████ | ██ ████ ███ ████ ███ █████ ██ ███ ████ ███ █████ | Lowb | Belantamab mafodotin in combination with Pd may result in a clinically important improvement in the probability of being alive compared with PVd. |
Probability of being alive at 18 months | N = 302 (1 RCT) | NR | ██ ███ ███ | ██ ███ ███ ███ ███ ███ ██ ██ ███ ████ | ██ ████ ███ ████ ███ █████ ██ ███ ████ ███ █████ | Lowb | Belantamab mafodotin in combination with Pd may result in a clinically important improvement in the probability of being alive compared with PVd. |
Health-related quality of life | |||||||
EORTC QLQ-C30 GHS Patients with improvement of ≥ 10 points from baseline | N = 302 (1 RCT) | NR | There was no clear difference between groups in this instrument, although there appeared to be a trend where both groups remained relatively stable over the follow-up. | Very lowc | The evidence is very uncertain regarding whether belantamab mafodotin in combination with Pd may result in a clinically important improvement in HRQoL compared with PVd. | ||
Harms | |||||||
Patients with an ocular AE | N = 302 (1 RCT) | NR | ██ ███ ███ | ██ ███ ███ | ██ ████ ███ ███ ███ ████ ██ ██ ████ ███ ████ | High | Belantamab mafodotin in combination with Pd results in a clinically important increase in ocular AEs compared with PVd. |
Patients with an SAE | N = 302 (1 RCT) | NR | ██ ███ ███ | ██ ███ ███ | ██ ████ ███ ███ ██ ████ ██ ██ ████ ███ ████ | Lowd | Belantamab mafodotin in combination with Pd may result in a clinically important increase in SAEs compared with PVd. |
AE = adverse event; CI = confidence interval; EORTC QLQ-C30 = European Organisation for Research and Treatment of Cancer Quality of Life Questionnaire Core 30; GHS = Global Health Status; HRQoL = health-related quality of life; ITT = intention to treat; MID = minimal important difference; NR = not reported; OS = overall survival; Pd = pomalidomide and dexamethasone; PFS = progression-free survival; PVd = pomalidomide, bortezomib, and dexamethasone; RCT = randomized controlled trial; r/r MM = relapsed or refractory multiple myeloma; SAE = serious adverse event; vs. = versus.
Note: Study limitations (which refer to internal validity or risk of bias), inconsistency across studies, indirectness, imprecision of effects, and publication bias were considered when assessing the certainty of the evidence. All serious concerns in these domains that led to the rating down of the level of certainty are documented in the table footnotes.
aRated down 1 level for imprecision because the lower boundary of the 95% CI did not exceed the MID (10%) identified by the clinical experts.
bRated down 1 level for study limitations. Results are from an interim analysis, and there is a risk of bias due to confounding as a result of transition of patients to subsequent treatment postprogression. Also rated down 1 level for imprecision.
cRated down 2 levels for study limitations. Assessments of HRQoL may have been biased by a lack of blinding, and there was a significant amount of attrition and missing data. Also rated down 1 level for imprecision because of low sample size relative to the ITT.
dRated down 1 level for study limitations. Exposure to BPd was longer than exposure to PVd. Also rated down 1 level for imprecision because the lower boundary of the 95% CI did not exceed the MID (10%) identified by the clinical experts.
Sources: Details included in the table are from the sponsor’s Summary of Clinical Evidence22 and from an additional information request.23
Indirect Comparisons
Description of Studies
Direct evidence of comparative efficacy and safety comparing BPd with PVd has been established in the pivotal study (i.e., the DREAMM-8 study). However, due to the lack of direct evidence comparing the combination of BPd with other existing relevant comparators in the treatment of MM in adult patients who have received at least 1 prior therapy including lenalidomide, the sponsor submitted a network meta-analysis (NMA) comparing BPd with the relevant comparators in the treatment of patients with MM who were lenalidomide exposed. Analyses were also performed for a subgroup of lenalidomide-refractory population. According to the investigators, a fixed model approach was preferable over the random-effect model of analysis because the networks were sparse (with only 1 study informing most treatment comparisons) and had insufficient sample data to inform the between-study standard deviation in treatment effects.
Efficacy Results
In the treatment of MM in patients who were lenalidomide-exposed, based on the fixed-effect model analysis, a favourable effect was observed when compared BPd with some of the comparator therapies (such as BPd versus high-dose carfilzomib and dexamethasone [hKd] and BPd versus SVd for PFS and overall response rate [ORR], as well as BPd versus bortezomib and dexamethasone [Vd] for some outcomes [PFS and/or OS and/or ORR]).
In the lenalidomide-refractory population, in terms of PFS, a favourable effect was observed for BPd based on the fixed-effect model analysis when BPd was compared with hKd, Kd, and Vd.
No indirect treatment comparisons (ITCs) comparing BPd with IsaPd or BPd with Pd were conducted because the studies assessing the efficacy of IsaPd and Pd could not form a connected network with the DREAMM-8 study.
No HRQoL outcome was assessed in the NMA.
Harms Results
In the NMA, safety outcomes were not assessed.
Critical Appraisal
Overall, the sponsor’s NMA was conducted according to accepted methodological guidance. The potential key limitation of the NMA was the considerable heterogeneity across the included studies due to factors such as the prior line of therapy, ISS stages, ECOG performance status, and follow-up time at which outcomes were assessed. The heterogeneity suggests that the assumption of similarity across the included studies may not hold true for the NMA, increasing the likelihood of bias and uncertainty about the validity of the comparative efficacy results for BPd versus relevant comparator therapies used in Canada. Another important limitation is the sparsity of the networks, with most treatment comparisons informed by only 1 trial. These limitations undermine the robustness of the NMA and could bias the treatment effect estimates. Therefore, the results of NMA should be interpreted with consideration of the previously mentioned limitations. In addition, HRQoL, which patients have identified as an important outcome, and harms outcomes were not assessed in the NMA. In the lenalidomide-refractory population, only PFS was assessed. OS and ORR were not assessed due to a lack of data to form a network.
Studies Addressing Gaps in the Evidence From the Systematic Review
Description of Studies
The sponsor submitted 1 phase I/II, single-arm, open-label, multicentre study (the ALGONQUIN study) to address gaps in the evidence.
The ALGONQUIN study evaluated various doses and schedules of BPd for patients with MM whose disease was lenalidomide-refractory and who had been exposed to a proteasome inhibitor (PI). The ALGONQUIN study comprised of a dose-escalation phase (part 1) and a dose-expansion phase (part 2). A total of 87 patients with r/r MM from 9 sites in Canada were enrolled, with 61 patients in part 1 and 26 in part 2. The primary objectives of the ALGONQUIN study were to determine the recommended phase 2 dose (RP2D) and the schedule of belantamab mafodotin in part 1 as well as to establish the efficacy, as determined by ORR, for participants treated at the RP2D in part 2. The secondary objectives were to assess the safety and tolerability of the BPd in part 1 and to assess additional efficacy outcomes including PFS, DOR, and OS at the RP2D in part 2.
Efficacy Results
Maximum Tolerated Dose and RP2D
The maximum tolerated dose based on the first cycle (28 days) of treatment was determined to be 2.5 mg/kg belantamab mafodotin. The regimen of 2.5 mg/kg every 8 weeks combined with 4 mg of pomalidomide and 40 mg of dexamethasone was selected as the RP2D.
ORR, OS, and PFS in Patients Treated at RP2D
In part 2, the median duration of follow-up for patients treated at RP2D (n = 38) was 13.9 months (range, 1.1 to 28.2). Out of these 38 patients treated at RP2D, 34 had 2 consecutive assessments and were considered response evaluable. The ORR for the patients whose responses were evaluable was 85.3% (29 of 34), with 32.4% (11 of 34) reaching CR or stringent complete response (sCR), 41.2% (14 of 34) achieving VGPR, and 11.8% (4 of 34) having PR. In the 38 patients treated at RP2D, the median OS (months) was not reached (95% CI, not reached to not reached). The median PFS (months) was not reached (95% CI, 13.7 to not reached).
In the 38 patients treated at RP2D during part 2, 12 were from part 1. The median duration of follow-up for the 12 patients was 17.2 months (range, 6.0 to 28.2). The ORR was 91.7% (11 of 12), with 33.3% (4 of 12) reaching CR or sCR, 50.0% (6 of 12) achieving VGPR, and 8.3% (1 of 12) having PR. The median OS was not reached (95% CI, not reached to not reached). The median PFS was 18.3 months (95% CI, 10.8 to not reached).
ORR, OS, and PFS in All Treated Patients
The median duration of follow-up for all treated patients was 14.5 months (range, 0.9 to 42.5). Out of the 87 patients, 81 had 2 consecutive assessments and were considered response evaluable. The ORR for the patients whose responses were evaluable was 87.7% (71 of 81), with 33.3% (27 of 81) reaching CR or sCR, 39.5% (32 of 81) achieving VGPR, and 14.8% (12 of 81) having PR. The median OS was 34.0 months (95% CI, 24.4 to not reached). The median PFS was 21.8 months (95% CI, 17.8 to 32.5).
Harms Results
In patients treated at RP2D, the most common treatment-emergent AE (TEAE) of any grade was decreased visual acuity (71.1%, 27 of 38), followed by keratopathy (65.8%, 25 of 38), fatigue (57.9%, 22 of 38), infection (47.4%, 18 of 38), neutropenia (39.5%, 15 of 38), and thrombocytopenia (39.5%, 15 of 38). The most common grade 3 to 4 TEAEs included keratopathy (52.6%, 20 of 38), decreased visual acuity (39.5%, 15 of 38), neutropenia (36.8%, 14 of 38), and thrombocytopenia (34.2%, 13 of 38). Of patients treated at RP2D, 55.3% (21 of 38) had an objective decrease in best corrected visual acuity (BCVA) of grade 3 to 4, 13.2% (5 of 38) had blurred vision of grade 3 to 4, and 10.5% (4 of 38) had other ocular AEs, including dry eyes, photophobia, and eye pain.
Critical Appraisal
The ALGONQUIN study provided insights into the use of belantamab mafodotin of various doses (1.92 mg/kg, 2.5 mg/kg, and 3.4 mg/kg) and schedules (every 4 weeks, every 8 weeks, and every 12 weeks). However, it did not address major gaps or limitations existing in the pivotal DREAMM-8 study (e.g., immaturity of OS data, high uncertainty in HRQoL outcomes due to the open-label design). Overall, the certainty of the evidence generated from the ALGONQUIN study is very low due to the single-arm design. Lacking comparative data made the inferences on the efficacy and safety of BPd over currently available therapies challenging and unreliable. For instance, when there were no comparison groups, the interpretation of the OS results could be prone to bias because OS can be sensitive to natural history and progression of the disease as well as heterogeneity of patient characteristics.24-26 The ALGONQUIN study was open label, in which investigators and patients were aware of the treatment received. The assessment for response and progression end points, such as ORR and PFS, which relies on investigators’ knowledge and experience, was prone to the impact of detection bias due to the open-label design. Additionally, the risk of reporting bias due to the open-label study design could not be ruled out for subjective harms outcomes.
Conclusions
One open-label RCT was included in this systematic review. The DREAMM-8 study was a multinational (140 centres in 18 countries with 3 sites in Canada), sponsor-funded study that randomized 302 patients with r/r MM, 1:1, to either BPd or PVd, until progressive disease, unacceptable toxicity, death, start of new antimyeloma therapy, withdrawn consent, or end of study. The findings suggest that BPd likely results in a clinically important improvement in PFS compared with treatment with PVd, after a median follow-up of 21.8 months. BPd may improve OS compared with PVd; however, the OS is still not mature at the time of this interim analysis, with an information fraction of only 48%. The evidence is less clear regarding whether BPd improves HRQoL compared with PVd after 53 weeks of treatment, and assessment of patient-reported outcomes may have been biased by the lack of blinding in this study. The main harms associated with belantamab mafodotin are ocular AEs such as blurred vision and changes in visual acuity. Belantamab mafodotin also appears to increase the risk of SAEs, including pneumonia; however, assessment of harms outcomes is complicated by the fact that patients in the BPd group were exposed to study drug longer than patients in the PVd group. Based on the fixed-effect model analysis, the sponsor-provided NMA suggested the benefit of BPd was not consistent and was influenced by both the end point assessed (PFS, OS, or ORR), as well as the choice of comparator drug, in the treatment of MM in adult patients who have received at least 1 prior therapy including lenalidomide. However, the results of the NMA should be interpreted with consideration of its associated limitations as described elsewhere in the report.
Introduction
The objective of this report is to review and critically appraise the evidence submitted by the sponsor on the beneficial and harmful effects of belantamab mafodotin 70 mg and 100 mg vials for infusion in combination with pomalidomide and dexamethasone in the treatment of MM in adult patients who have received at least 1 prior therapy including lenalidomide.
Disease Background
Contents within this section have been informed by materials submitted by the sponsor and clinical expert input. The following has been summarized and validated by the review team.
MM is an incurable, progressive, malignant plasma cell cancer, characterized by the abnormal proliferation of clonal B-cells in the bone marrow and overproduction of the abnormal immunoglobulin M protein.2 MM accounts for approximately 1% of all cancers and about 10% of all hematologic malignancies.3 MM is more common in males than females and about twice as common in Black people compared with Asian or white people.4-7 The incidence of MM is related to older age. In 32,065 patients with MM in Canada between 1992 and 2010, approximately 80% were diagnosed at the age of 60 years or older.7 It is estimated that 4,100 new cases of MM were diagnosed in 2024 in Canada.8 The 5-year net survival for patients with MM in Canada is approximately 50%.9
The clinical course of MM, although variable, typically includes periods of treatment and remission separated by inevitable relapses, with the DOR to treatment decreasing with each subsequent line of therapy.10,11 r/r MM is defined as MM that is nonresponsive to therapy or has progressed within 60 days of the last line of treatment in patients who previously achieved a minimal response or better.12,13
Patients with MM typically present with nonspecific symptoms, including anemia, bone pain, fatigue, weight loss, and renal dysfunction.27 At diagnosis, the clinical manifestations of symptomatic MM are present in approximately 70% of patients and are commonly defined using the term “CRAB” (hypercalcemia, renal insufficiency, anemia, and bone lesions).28,29 The requirements to establish the diagnosis of MM include 10% or more clonal bone marrow plasma cells or biopsy-proven plasmacytoma plus the presence of at least 1 MM-defining event (which refers to the presence of CRAB attributable to the plasma cell disorder), clonal bone marrow plasma cell percentage (equal to or greater than 60%), free light chain ratio (equal to or greater than 100), or more than 1 focal lesion on MRI studies.3
In Canada, the International Staging System (ISS) is often used to stage MM.30 The ISS disease stages are classified based on serum beta-2-microglobulin level and serum albumin level:30,31
Stage I: Serum beta-2-microglobulin level greater than 3.5 mg/L and serum albumin level less than 3.5 g/dL
Stage II: Serum beta-2-microglobulin level greater than 3.5 mg/L or serum albumin level less than 3.5 g/dL
Stage III: Serum beta-2-microglobulin level 5.5 mg/L or greater with either elevated lactate dehydrogenase or high-risk cytogenetics
It was reported that the median survival is 62 months for patients with ISS stage I MM, 44 months for those with ISS stage II disease, and 29 months for patients with ISS stage III MM.31
Standards of Therapy
Contents within this section have been informed by materials submitted by the sponsor and clinical expert input. The following has been summarized and validated by the review team.
ASCT is the standard of care for newly diagnosed patients with MM if they are transplant eligible. Induction therapy with lenalidomide, bortezomib, and dexamethasone or cyclophosphamide, bortezomib, and dexamethasone, followed by ASCT and then maintenance therapy, most commonly with lenalidomide, is the standard treatment course.28 Patients who are ineligible for ASCT are typically treated with a combination of immunomodulatory drugs (IMiDs) (e.g., lenalidomide, pomalidomide), PIs (e.g., bortezomib, carfilzomib), and mAbs (e.g., daratumumab, isatuximab).28 Lenalidomide is recommended to be used as part of the front-line therapy for newly diagnosed MM (regardless of ASCT eligibility) by the IMWG and the CMRG Consensus Guideline Consortium due to the overall survival (OS) benefits seen in clinical trials.14 The CMRG Consensus Guideline Consortium report recommends DRd as the preferred first-line therapy for fit patients who are eligible for ASCT, and note that first-line therapy should include an anti-CD38 antibody. For patients with frailty, first-line therapy with DRd is also the first-choice regimen provided there are no contraindications; however, if a triplet regimen is not tolerated by the patient, a doublet regimen consisting of lenalidomide and dexamethasone (Rd) could be a good option.32
Treatment selection for patients with r/r MM can be challenging as there is currently no uniform standard treatment that addresses the cause of nonresponse to initial treatment. Rather, treatment choice in r/r MM is individualized and multifactorial, taking into consideration prior treatment history and response, timing and aggressiveness of the relapse, patient factors (e.g., performance status, age, frailty, and comorbidities), personal preferences, and jurisdictional funding and rules around reimbursement.15,16 The general strategy for treatment beyond the first line includes the use of a drug that the patient has either not been exposed to previously or demonstrated sensitivity to in the treatment regimen.17 Based on the IMWG recommendations, for patients whose disease is not refractory to lenalidomide, the preferred options for the second line are DRd or a combination of carfilzomib, lenalidomide, and dexamethasone, although alternatives are available.15,17
For patients with r/r MM in Canada, options for treatment at first relapse (second line) and beyond are based on the patient’s sensitivity or resistance to treatments and can include the following combinations: lenalidomide and dexamethasone; carfilzomib and dexamethasone (Kd); isatuximab, carfilzomib, and dexamethasone (IsaKd); pomalidomide, bortezomib, and dexamethasone (PVd); daratumumab, bortezomib, and dexamethasone (DVd); selinexor, bortezomib, and dexamethasone (SVd); isatuximab, pomalidomide, and dexamethasone (IsaPd); and pomalidomide and dexamethasone (Pd).15 Although lenalidomide is a possible option for patients in the second line and beyond, clinical experts consulted by Canada’s Drug Agency (CDA-AMC) have stated that it is most likely to be used as a first-line treatment option or maintenance and would not likely be used in later lines of therapy.15 In addition, pomalidomide-based regimens are only funded after patients have experienced treatment failure on lenalidomide and a PI, which limits their use to later lines of therapy. BCMA-directed therapies, including teclistamab and elranatamab, are approved (funding is under review) in the fourth line and beyond for patients who have received a PI, an IMiD, and an anti-CD38 drug, and whose disease has progressed or is refractory to their last line of therapy.32 CDA-AMC has recently recommended ciltacabtagene autoleucel (cilta-cel) for those who have received 1 to 3 prior lines of therapy (including a PI and IMiD) and whose disease is refractory to lenalidomide.33
The current CDA-AMC funding algorithm for r/r MM in Canada is presented in Figure 1.
Figure 1: Current Treatment Paradigm for MM in Canada
ASCT = autologous stem cell transplant; CGP = clinical guidance panel; cilta-cel = ciltacabtagene autoleucel; DCyBord = daratumumab plus cyclophosphamide, bortezomib, and dexamethasone; DRd = daratumumab, lenalidomide, and dexamethasone; DVd = daratumumab, bortezomib, and dexamethasone; DVMp = daratumumab-bortezomib-melphalan plus prednisone; IMiD = immunomodulatory drug; IsaKd = isatuximab, carfilzomib, and dexamethasone; IsaPd = isatuximab, pomalidomide, and dexamethasone; Kd = carfilzomib and dexamethasone; KRd = carfilzomib, lenalidomide, and dexamethasone; LVEF = left ventricular ejection fraction; MM = multiple myeloma; pERC = pan-Canadian Oncology Drug Review Expert Review Committee; Pd = pomalidomide and dexamethasone; PI = proteasome inhibitor; PVd = pomalidomide, bortezomib, and dexamethasone; R = lenalidomide; Rd = lenalidomide and dexamethasone; r/r MM = relapsed or refractory multiple myeloma; RVd = lenalidomide, bortezomib, and dexamethasone; SVd = selinexor, bortezomib, and dexamethasone; V = bortezomib; Vd = bortezomib and dexamethasone.
Notes: Patients with drug resistance cannot be retreated with the same drug(s).
Cyclophosphamide may be added to Kd, Pd, and Rd.
PVd is not represented in the algorithm as it is not commonly used or a standard of care. PVd has been recommended by pERC for r/r MM in patients who have received at least 1 prior treatment regimen including R.
aMaintenance optional.
bIf not resistant to an anti-CD38 biologic.
cOnly if also sensitive to R and V.
dMust have a PI treatment-free interval of at least 6 months before first day of SVd.
eIf no prior treatment with any therapy that targets BCMA or any CAR T-cell therapy.
fIf no prior treatment with any therapy that targets BCMA.
gCyclophosphamide may be added to Kd, Pd, and Rd.
Source: CDA-AMC Funding Algorithm for Multiple Myeloma, 2024.15
Drug Under Review
The drug under review is belantamab mafodotin for injection, 70 mg vial, 100 mg vial, and 50 mg/mL IV infusion. Belantamab mafodotin is an antibody-drug conjugate that binds to the cell surface BCMA (i.e., a protein expressed on normal B lymphocytes and MM cells), internalizes into tumour cells rapidly, releases a cytotoxic agent once inside the tumour cells, and results in cell cycle arrest and apoptosis of tumour cells.1
The current reimbursement request for the drug aligns with its Health Canada–approved indication, which is as follows: belantamab mafodotin for injection, is indicated in combination with pomalidomide and dexamethasone for the treatment of adults with r/r MM who have received at least 1 prior line of therapy, including lenalidomide.
Belantamab mafodotin has not previously been reviewed by CDA-AMC. However, CDA-AMC is currently conducting a parallel Reimbursement Review of the drug based on a different Health Canada indication, which is as follows: “Belantamab mafodotin for injection is indicated in combination with bortezomib and dexamethasone, for the treatment of adults with relapsed or refractory multiple myeloma who have received at least 1 prior line of therapy.”
The FDA and European Medicines Agency are reviewing BPd in patients with MM.
Key characteristics of belantamab mafodotin are summarized in Table 3 with other treatments available for MM.
Table 3: Key Characteristics of Belantamab Mafodotin and Main Comparators
Treatment | Mechanism of action | Indicationa | Route of administration and recommended dose | Serious adverse effects and/or safety issues |
|---|---|---|---|---|
Drug under review | ||||
Belantamab mafodotin | A BCMA-targeted ADC that is fused to the microtubule inhibitor auristatin F by a protease-resistant cysteine linker. BCMA is an established therapeutic target for MM due to its highly selective expression on malignant plasma cells. |
| IV infusion In combination with pomalidomide and dexamethasone (BPd):
|
|
Bortezomib | Inhibiting the chymotrypsin-like activity of the 26S proteasome, which disrupts normal homeostatic mechanisms and lead to cell death. |
| IV or subcutaneous injection In combination with dexamethasone (Vd):
|
|
Pomalidomide | Immunomodulatory and antineoplastic activity; inhibits proliferation and induces apoptosis of hematopoietic tumour cells. | PVd:
Pd:
| Orally In combination with bortezomib and dexamethasone (PVd):
In combination with dexamethasone alone (Pd):
|
|
Isatuximab | An IgG1-derived mAb that binds to CD38 and triggers several mechanisms regarding the death of CD38-expressing tumour cells. | IsaPd:
IsaKd:
| In combination with pomalidomide and dexamethasone (IsaPd):
In combination with carfilzomib and dexamethasone (IsaKd):
|
|
Daratumumab | An IgG1κ human mAb targeting the CD38 protein and inhibiting the growth of CD38-expressing tumour cells. |
DRd or DVd:
| IV infusion In combination with lenalidomide and dexamethasone (DRd):
In combination with or bortezomib and dexamethasone (DVd):
|
|
Carfilzomib | A tetrapeptide epoxyketone PI that binds to the N-terminal threonine containing active sites of the 20S proteasome. |
| IV infusion In combination with dexamethasone (Kd):
In combination with lenalidomide and dexamethasone (KRd):
In combination with daratumumab and dexamethasone (KdD):
|
|
Selinexor | Inhibits nuclear export of tumour suppressor proteins, growth regulators, and mRNAs of growth promoting (oncogenic) proteins by blocking exportin 1 specifically. | SVd:
| Orally In combination with bortezomib and dexamethasone (SVd):
|
|
Cyclophosphamide | A polyfunctional alkylating drug; a potent immunosuppressive drug. |
| IV infusion
|
|
ADC = antibody-drug conjugate; BPd = belantamab mafodotin, pomalidomide, and dexamethasone; DRd = daratumumab, lenalidomide, and dexamethasone; DVd = daratumumab, bortezomib, and dexamethasone; iMiD = immunomodulatory drug; IsaKd = isatuximab, carfilzomib, and dexamethasone; IsaPd = isatuximab, pomalidomide, and dexamethasone; Kd = carfilzomib and dexamethasone; KDd = carfilzomib, daratumumab, and dexamethasone; KRd = carfilzomib, lenalidomide, and dexamethasone; MM = multiple myeloma; mRNA = messenger ribonucleic acid; Pd = pomalidomide and dexamethasone; PI = proteasome inhibitor; PVd = pomalidomide, bortezomib, and dexamethasone; r/r MM = relapsed or refractory multiple myeloma; SVd = selinexor, bortezomib, and dexamethasone; Vd = bortezomib and dexamethasone.
aHealth Canada–approved indication.
bOnly presented indication related to MM.
Sources: Draft product monograph for belantamab mafodotin,1 product monograph for bortezomib,34 product monograph for pomalidomide,35 product monograph for isatuximab,36 product monograph for daratumumab,37 product monograph for carfilzomib,38 product monograph for selinexor,39 product monograph for cyclophosphamide.40
Perspectives of Patients, Clinicians, and Drug Programs
The full patient and clinician group submissions received are available in the consolidated patient and clinician group input document for this review on the project website.
Patient Group Input
This section was prepared by the review team based on the input provided by patient groups.
One patient group, Myeloma Canada, submitted input for this review. Myeloma Canada gathered the input from a survey among patients and caregivers with respect to BPd for the treatment of r/r MM in adult patients who have previously received lenalidomide. Survey eligibility was determined by patient and caregiver self-report of their experience with myeloma, regarding treatment with lenalidomide, or BPd.
Of a total 356 responses to the survey, 100 were complete, eligible, and analyzed. Among these respondents, 90 were patients who were eligible for the treatment with BPd (n = 78) and their caregivers (n = 12). Of the 90 respondents, 7 had received 1 line of therapy, 27 had received 2 lines of therapy, 23 had received 3 lines of therapy, 21 had received 4 lines, 9 had received 5 lines or more, and 7 respondents were unsure. Of the 90 respondents, 72% had received an ASCT. Additionally, 94% of the 90 respondents had received an IMiDs, 76% had received a PI, 54% had received an anti-CD38 mAb, 9% had received a BCMA-targeted therapy (CAR T-cell therapy, bispecific, or antibody-drug conjugate), 2 had received a GPRC5D-targeted therapy, and 26 indicated “other,” most of which mentioned dexamethasone and cyclophosphamide.
Seven of the 100 survey respondents were patients who had experience with BPd (n = 4) and their caregivers (n = 3), of whom, 4 had received 4 lines of therapy, 2 had received 3 lines of therapy, and 1 had received 2 lines of therapy. Among the respondents, there were 3 patients who had experience with belantamab mafodotin as a monotherapy.
On a scale of 1 (not important or no impact) to 5 (extremely important or extreme impact), the 100 respondents rated that infections (4.58) was the most important myeloma symptom to control, followed by kidney problems (4.52), mobility (4.46), and pain (4.38). Regarding the impact of myeloma on patients’ day-to-day activities, the respondents indicated that ability to travel (3.60) and ability to work (3.49) were most significantly impacted, followed by ability to exercise (3.37) and ability to conduct volunteer activities (3.28). With respect to the psychosocial impact of myeloma, the respondents rated that interruption of life goals or accomplishments (career, retirement, and so forth) (3.51) had the most impact on quality of life, followed by loss of sexual desire (3.43), anxiety or worry (3.35), and difficulty sleeping (3.03). Regarding the financial implications of myeloma, travel costs and parking costs were identified by 35 of the 100 respondents, respectively; followed by drug costs (n = 34); lost income or pension funds due to absence from work, disability, or early retirement (n = 33); drug administration fees (n = 13); accommodation costs (n = 8); and medical supply costs (n = 6). In terms of the key factors that are important to myeloma treatment, 86 of the 100 respondents identified quality of life, manageable side effects, effectiveness of treatment (especially in achieving remission and having a long, durable, response), and accessibility or portability of treatment (including fewer or minimal visits to the hospital or cancer centre).
Regarding the outcomes that were considered extremely important, of the 89 respondents who were eligible for BPd and their caregivers, 70% selected prolongation in life expectancy, and 62% selected improvement in overall quality of life. Furthermore, 78% of respondents indicated that they were very much in favour of an estimated 2 to 3 years of extended life without myeloma getting worse. In terms of the tolerability of side effects in respondents who were eligible for the treatment with BPd and their caregivers, on a scale of 1 (not at all tolerable or bearable) to 5 (extremely tolerable or bearable), eye pain (1.99) was considered as the least tolerable side effect, followed by blurry vision (2.14), foreign body sensation in eye (2.14), infections (2.23), eye irritation (2.26), and diarrhea (2.39). Among the 7 respondents who had experience with BPd, blurry vision (3.00), dry eyes (3.29), and eye irritation (3.29) were rated the least bearable side effects, followed by infections (3.57).
Regarding the overall experience with BPd, 4 of the 7 respondents who had experience with the treatment considered that quality of life was mostly or somewhat improved, and 6 considered that the side effects were mostly or somewhat manageable.
Lastly, Myeloma Canada noted that some patients with myeloma are unable to tolerate lenalidomide and are not included in the Health Canada indication. Myeloma Canada noted that these patients may also be eligible for the treatment with BPd.
Clinician Input
Input From Clinical Experts Consulted for This Review
All CDA-AMC review teams include at least 1 clinical specialist with expertise regarding the diagnosis and management of the condition for which the drug is indicated. Clinical experts are a critical part of the review team and are involved in all phases of the review process (e.g., providing guidance on the development of the review protocol, assisting in the critical appraisal of clinical evidence, interpreting the clinical relevance of the results, and providing guidance on the potential place in therapy). The following input was provided by 3 clinical specialist(s) with expertise in the diagnosis and management of MM.
Unmet Needs
The clinical experts noted that because there are no curative therapies for MM, the focus is on having multiple classes of drugs, with distinct mechanisms, so that these alternatives can be initiated when a patient’s disease becomes resistant to their current therapy. In summary, the clinical experts noted that the more drug classes that work through different mechanisms, the better the treatment outcomes will be. One of the clinical experts added the specific example of quadruple therapies, which are coming soon (such as daratumumab in combination with lenalidomide, bortezomib, and dexamethasone) for front-line therapy, for both patients who are transplant eligible and ineligible, leaving little room for subsequent options for patients who develop resistance.
One of the clinical experts also noted that there is a need for treatments that have better toxicity profiles, are easier to administer, and require fewer clinic visits.
The clinical experts also noted options for patients whose disease becomes resistant to lenalidomide have another unmet need. One of the clinical experts added that patients whose disease is lenalidomide refractory and those with anti-CD38–refractory disease have poor outcomes, particularly if they are older adults receiving DRd, as these patients have very limited options upon relapse (Kd or SVd) and may not be eligible for more aggressive therapies like CAR T-cell therapy or bispecifics. The clinical experts added that BPd could potentially be used instead of SVd. SVd could still be an option on relapse, and Kd could be used after failure of SVd. One of the clinical experts also noted that it is important to be able to use pomalidomide-containing regimens in the second line; however, some jurisdictions limit it to after second line.
Place in Therapy
The clinical experts noted that, by their first relapse, nearly all patients have disease that is refractory to lenalidomide and have been exposed to a PI (to which their disease was not refractory). According to the clinical experts, for patients who have not been exposed to anti-CD38 therapy, the current standard of care in those who can tolerate it is IsaKd, IsaPd, or DVd for patients who are more frail. This is 1 setting where BPd could be used, although there is no evidence that BPd has superior clinical activity over IsaKd or even DVd, according to the clinical experts. Most likely, BPd could be an option after failure of IsaKd or DVd, according to the clinical experts. With respect to other BCMA therapies, although there are others on the horizon, the clinical experts noted that, at present, only cilta-cel BCMA CAR T-cell therapy would be competing in this space, and few patients will be eligible and have access to this therapy.
The clinical experts were of the opinion that most use of BPd will be in early relapse (1 to 3 prior lines of therapy). One of the clinical experts also noted that if the rule in younger patients with cilta-cel is no prior BCMA, then there may be little use of BPd in this setting as it would prevent subsequent access to cilta-cel. The other clinical expert noted that the mechanism of belantamab mafodotin is distinct from that of BCMA or CAR T-cell therapy; therefore, resistance to belantamab mafodotin may not need to equate to resistance to immunotherapies targeting BCMA. Another clinical expert added that even if CAR T-cell therapy is used in the second line, there will still be room for other BCMA-targeted therapies. One clinical expert also added that they could foresee belantamab mafodotin potentially being added to some regimens used in the first line, as BCMA is not currently being targeted in these patients. The clinical experts were of the opinion that, in older patients, BPd will likely replace Kd, SVd, and Pd, given the efficacy data, and that in later lines (fourth line or beyond), BCMA BiTEs will likely be funded this year, so most patients will likely receive those.
Patient Population
The clinical experts noted that older patients who had previously been treated with DRd would be great candidates for BPd, particularly given the favourable toxicity profile with respect to myelosuppression.
One clinical expert noted that the use of BPd in younger patients may be somewhat limited by the fact that cilta-cel is available second line and beyond, and the current requirement is for no prior BCMA exposure when using cilta-cel. This clinical expert added that, in these patients, BPd may be used in much later relapse, but that would not be common either, if BCMA BiTEs are available in fourth line or later.
One clinical expert added that patients with pre-existing eye conditions would not be good candidates for this drug, due to the ocular toxicities.
Assessing the Response to Treatment
One clinical expert highlighted the importance of improving health-related quality of life (HRQoL), while also noting that the ocular toxicity may adversely impact quality of life. The other clinical expert agreed that ocular toxicities are an important issue, adding that these toxicities will require specialized monitoring by ophthalmologists and/or optometrists. This is not currently part of the routine care of patients with MM. Otherwise the clinical experts noted that routine blood tests are used to monitor patient progress.
Discontinuing Treatment
The clinical experts noted 2 key reasons for discontinuing BPd: disease progression and harms, namely ocular toxicity. The clinical experts noted the importance of knowing how to manage dose reductions or delays to mitigate the harm associated with ocular toxicity.
Prescribing Considerations
The clinical experts emphasized the need for specialized (ophthalmologist and/or optometrist) support for managing the ocular toxicities. One of the clinical experts also noted that myeloma should be managed by hematologist oncologists.
Clinician Group Input
This section was prepared by the review team based on the input provided by clinician groups.
Two clinician groups, the OH (CCO) Hematology Cancer Drug Advisory Committee and CMRG, provided input for this Clinical Review. The OH (CCO) Hematology Cancer Drug Advisory Committee gathered information from 7 clinicians, while CMRG collected input from 20 clinicians.
The OH (CCO) Hematology Cancer Drug Advisory Committee noted that the treatment goals for adult patients with MM who have received at least 1 prior therapy including lenalidomide include disease control, improvement in symptoms, prolonged survival, and prevention of end-organ damage. CMRG noted that myeloma is incurable, as patients’ disease eventually becomes refractory to all available funded antimyeloma drugs. Both clinician groups noted that, overall, there is an unmet need for effective treatments for patients with myeloma who have progressed on prior effective drugs.
Similar to the clinical experts consulted by the CDA-AMC review team, CMRG noted that BPd would pertain to patients who have had 1 to 3 prior lines of therapy. The OH (CCO) Hematology Cancer Drug Advisory Committee noted that BPd could fit into current second-line treatments for patients whose disease is resistant to lenalidomide or bortezomib.
The OH (CCO) Hematology Cancer Drug Advisory Committee noted that BPd could be suitable for patients who are unlikely to receive CAR T-cell therapy as BPd may preclude future use of BCMA-targeted CAR T-cell therapy. CMRG noted that patients whose disease is refractory to lenalidomide or anti-CD38s may be eligible for BPd based on the subgroup results from the DREAMM-8 study. According to the input from CMRG, patients with adequate performance status and organ function, and older patients are likely to have good outcomes with BPd. Patients with other disease-related adverse prognostic factors (e.g., high-risk cytogenetics, extramedullary disease ISS II or III, and functional patients at high risk who do not perform significantly worse) could be eligible for BPd. CMRG also noted that it is uncertain whether patients who are exposed to anti-BCMA or whose disease is refractory to bortezomib are suitable for BPd, because these patients were not included in the DREAMM-8 study. According to the input from CMRG, patients who are least suitable for BPd are those whose disease is refractory to pomalidomide.
The OH (CCO) Hematology Cancer Drug Advisory Committee noted that standard myeloma response outcomes used in clinical practice should be used to determine whether a patient’s disease is responding to treatment. According to the input from CMRG, treatment responses are evaluated based on the monoclonal protein markers in the serum and/or urine, bone marrow biopsy, and, in some instances, by imaging studies. CMRG noted that clinically meaningful responses usually correlate with at least a partial remission as defined by IMWG Consensus Criteria, including improvement in symptoms (e.g., cessation of bone destruction with less pain, fractures, and need for radiotherapy), improvement in energy, and better ability to perform activities of daily living. CMRG noted treatment responses are generally assessed every 1 to 3 months, depending on clinical stability and regimen used for therapy.
Both clinician groups noted that BPd should be discontinued upon disease progression or significant toxicity, especially significant ocular toxicity. Both clinician groups noted that the outpatient setting is the appropriate setting for treatment with BPd, and ophthalmological assessment is needed.
Drug Program Input
The drug programs provide input on each drug being reviewed through the Reimbursement Review processes by identifying issues that may impact their ability to implement a recommendation. The implementation questions and corresponding responses from the clinical experts consulted by for this review are summarized in Table 4.
Table 4: Summary of Drug Plan Input and Clinical Expert Response
Drug program implementation questions | Clinical expert response |
|---|---|
Relevant comparators | |
The trial compared BPd against PVd in patients who were heavily pretreated for myeloma (including patients whose disease is refractory to lenalidomide and/or anti-CD38 antibodies). At the time of the review, PVd is hardly used in Canada. Question: How does BPd compare with Kd, SVd, IsaPd, IsaKd, and Pd? | According to the clinical experts, efficacy of BPd is very good and likely superior to many of the other listed regimens more than 1 of the clinical experts noted; however, that it is difficult to compare to IsaPd with IsaKd, which are also quite effective, also noting that the toxicity of BPd is unique but manageable. Another clinical expert noted that BPd appears to have improved PFS, compared with many of the regimens listed here. |
At the time of this input, first-line quadruplet regimens (daratumumab-VRd for patients with transplant-eligible myeloma and isatuximab-VRd for patients who were transplant ineligible) are under CDA-AMC review. Cilta-cel (1 to 3 prior lines; 4L), elranatamab, and teclistamab are also in active negotiations. | This is a comment from the drug plans to inform pERC deliberations. |
Considerations for prescribing of therapy | |
Another belantamab mafodotin regimen (BVd) is also under review, with a different dosing schedule. Caution is needed to ensure that the correct dosing schedule is chosen for BPd, especially in the event of dose reductions. | This is a comment from the drug plans to inform pERC deliberations. |
Due to the ocular toxicity, eye exams are required. PAG is concerned that patients may not be able to access ophthalmologists in a timely manner. | This is a comment from the drug plans to inform pERC deliberations. |
In the trial, patients who had to stop 1 of the study agents were permitted to continue with the remaining study agents at the discretion of the investigator. | This is a comment from the drug plans to inform pERC deliberations. |
Generalizability | |
Question: Should these patients be considered for BPd?
| According to the clinical experts consulted by the CDA-AMC review team:
|
Question: Should patients on Pd or other alternative treatments be switched to belantamab mafodotin? | The clinical experts believed that this option could be allowed but not mandatory. |
Funding algorithm (oncology only) | |
Request an initiation of a rapid provisional funding algorithm. Note that if the final reimbursement recommendation for this drug under review is “Do not Reimburse,” the project will be suspended indefinitely. | This is a comment from the drug plans to inform pERC deliberations. |
The trial excluded patients with prior BCMA-targeted therapies. Question: Is there sufficient evidence to support the sequencing of belantamab mafodotin with other BCMA-targeted therapies? Question: If a patient progresses on a bortezomib- and lenalidomide-containing regimen in the first-line setting (i.e., RVd), would the patient be eligible for BPd in a later-line setting? | One of the clinical experts noted that there is no evidence yet that immunotherapies work through different mechanisms than ADC; therefore, resistance to 1 does not indicate resistance to the other. Another clinical expert noted that belantamab mafodotin likely has some efficacy in this case. The clinical experts responded that in this case, where a patient progressed on bortezomib- and lenalidomide-containing regimens in first line, there would be no reason to exclude patents from BPd. |
Care provision issues | |
Belantamab is supplied as 70 mg and 100 mg vials. It has a relatively short stability. Dose reductions were also needed in the trial to manage side effects. These can result in drug wastage. | This is a comment from the drug plans to inform pERC deliberations. |
System and economic issues | |
Feasibility of adoption (budget impact) may need to be considered depending on the extent of uptake. | This is a comment from the drug plans to inform pERC deliberations. |
There may be potential out-of-pocket eye care costs (e.g., eye exams, eye drops) that are not affordable for some patients. This in turn may impact the management of ocular side effects. | This is a comment from the drug plans to inform pERC deliberations. |
There are confidential prices for carfilzomib, isatuximab, pomalidomide, and selinexor. Negotiations are ongoing for cilta-cel, elranatamab, and teclistamab. | This is a comment from the drug plans to inform pERC deliberations. |
4L = fourth line; ADC = antibody-drug conjugate; BPd = belantamab mafodotin, pomalidomide, and dexamethasone; BVd = belantamab mafodotin, bortezomib, and dexamethasone; CDA-AMC = Canada’s Drug Agency; cilta-cel = ciltacabtagene autoleucel; IsaKd = isatuximab, carfilzomib, and dexamethasone; IsaPd = isatuximab, pomalidomide, and dexamethasone; Kd = carfilzomib and dexamethasone; PAG = Provincial Advisory Group; Pd = pomalidomide and dexamethasone; pERC = pan-Canadian Oncology Drug Review Expert Review Committee; PVd = pomalidomide, bortezomib, and dexamethasone; RVd = lenalidomide, bortezomib, and dexamethasone; SVd = selinexor, bortezomib, and dexamethasone; VRd = bortezomib, lenalidomide, and dexamethasone.
Clinical Evidence
The objective of this report is to review and critically appraise the evidence submitted by the sponsor on the beneficial and harmful effects of belantamab mafodotin 70 mg and 100 mg vials for infusion in combination with Pd in the treatment of MM in adult patients who have received at least 1 prior therapy including lenalidomide. The focus will be placed on comparing BPd to relevant comparators and identifying gaps in the current evidence.
A summary of the clinical evidence included by the sponsor in the review of BPd is presented in 3 sections with our critical appraisal of the evidence included at the end of each section. The first section, the systematic review, includes pivotal studies and randomized controlled trials (RCTs) that were selected according to the sponsor’s systematic review protocol. Our assessment of the certainty of the evidence in this first section using the GRADE approach follows the critical appraisal of the evidence. The second section includes indirect evidence from the sponsor. The third section includes additional studies that were considered by the sponsor to address important gaps in the systematic review evidence.
Included Studies
Clinical evidence from the following is included in the review and appraised in this document:
1 pivotal study identified in systematic review
1 indirect treatment comparison
1 additional study addressing gaps in evidence.
Systematic Review
Contents within this section have been informed by materials submitted by the sponsor. The following has been summarized and validated by the review team.
Description of Studies
Characteristics of the included studies are summarized in Table 5.
Table 5: Details of Studies Included in the Systematic Review
Detail | DREAMM-8 study |
|---|---|
Designs and populations | |
Study design | Phase III, randomized, open-label, multicentre study |
Locations | 140 centres in 18 countries,b including Canada |
Patient enrolment dates | First patient first dose: October 1, 2020 Cut-off date for primary analysis: January 29, 2024 End date: May 1, 2029 (estimated) |
Randomized (N) | Total N: 302 BPd: 155 PVd: 147 |
Inclusion criteria |
|
Exclusion criteria |
|
Drugs | |
Intervention | Treatment arm A dosing schedule (BPd treatment arm)
|
Comparator(s) | Treatment arm B dosing schedule (PVd treatment arm)
|
Study duration | |
Screening phase | During the 28-day screening phase, participants were evaluated for study eligibility according to the inclusion and exclusion criteria outlined in the protocol |
Treatment phase | Treatment was continued (up to 84 months) in both arms until disease progression per IMWG criteria, death, unacceptable toxicity, investigator's discretion, withdrawal of consent, or end of study, whichever occurred first |
Follow-up phase | Disease evaluations were performed q.4.w. (± 3 days) until confirmed (documented) disease progression, death, the start of a new antimyeloma treatment, withdrawal of consent, loss to follow-up, or end of the study, whichever occurred first. In the case of disease progression, participants were followed to ascertain subsequent antimyeloma therapy, PFS2, and survival status q.12.w. (± 14 days) until the withdrawal of consent, loss to follow-up, death, or the end of the study |
Outcomes | |
Primary end point | PFS, defined as the time from the date of randomization until the earliest date of documented disease progression or death due to any cause |
Secondary and exploratory end points | Key secondary:
Secondary:
Exploratory:
|
Publication status | |
Publications |
|
ADA = antidrug antibody; AE = adverse event; ASCT = allogeneic stem cell transplant; AUC = area under the concentration time curve; BPd = belantamab mafodotin, pomalidomide, and dexamethasone; CR = complete response; CRR = complete response rate; Cmax = maximum plasma concentration; DOR = duration of response; EORTC IL52 = European Organisation for Research and Treatment of Cancer Item Library 52; EORTC QLQ-C30 = European Organisation for Research and Treatment of Cancer Quality of Life Questionnaire Core 30; EORTC QLQ-MY20 = European Organisation for Research and Treatment of Cancer Quality of Life Questionnaire 20-Item Multiple Myeloma Module; EQ-5D-3L = European Quality of Life 5 Dimensions 3 Level Scale; FACT-GP5 = Functional Assessment of Cancer Therapy – General Population; HRQoL = health-related quality of life; IMWG = International Myeloma Working Group; MM = multiple myeloma; MRD = minimal residual disease; NGS = next-generation sequencing; ORR = overall response rate; OS = overall survival; OSDI = ocular surface disease index; PFS = progression-free survival; PFS2 = progression-free survival on subsequent line of therapy; PGIC = Patient Global Impression of Change, PGIS = Patient Global Impression of Severity; PK = pharmacokinetic; PR = partial response; PRO-CTCAE = Patient-Reported Outcomes version of the Common Terminology Criteria for Adverse Events; PVd = pomalidomide, bortezomib, and dexamethasone; q.3.w. = every 3 weeks; q.4.w. = every 4 weeks; RNA = ribonucleic acid; SC = subcutaneous; sCR = stringent complete response; TTBR = time to best response; TTP = time to disease progression; TTR = time to response; VGPR = very good partial response; vs. = versus.
aEORTC IL52 applies to participants enrolled under the original protocol; EORTC QLQ-MY20 applies to participants enrolled under Protocol Amendment 1.
bThe participating countries included Australia, Brazil, China, Czech Republic, France, Germany, Greece, Israel, Italy, Japan, Republic of Korea, New Zealand, Poland, the Russian Federation, Spain, Turkey, the UK, and the US.
Source: Details included in the table are from the sponsor’s Summary of Clinical Evidence.22
The DREAMM-8 study is a phase III, randomized, open-label, multicentre study evaluating the efficacy and safety of BPd versus PVd in patients with r/r MM.18,19 The study included 3 sites in Canada. The DREAMM-8 study included a screening period, treatment period, and follow-up period.18,19 During the 28-day screening period, participants were evaluated for study eligibility per protocol as defined in the inclusion and exclusion criteria. Randomization was done centrally using a randomization schedule generated by the Cenduit Interactive Response Technology, which assigned participants in a 1:1 ratio to either treatment arm A (BPd) and treatment arm B (PVd) (Figure 2). No crossover was allowed, and no more than 50% of participants with 2 or more prior lines of therapy were enrolled.18,19
Treatment was continued in both arms until progressive disease per IMWG criteria, death, unacceptable toxicity, start of a new antimyeloma therapy, withdrawal of consent, or the end of the study, whichever occurred first.18,19 For participants who discontinued study treatment for reasons other than progressive disease or death, disease evaluations were performed every 3 days until confirmed progressive disease (documented), death, start of a new antimyeloma treatment, withdrawal of consent, loss to follow-up, or end of the study, whichever occurred first.18,19 In the case of progressive disease, participants were followed to ascertain receipt of subsequent antimyeloma therapy, PFS on subsequent lines of therapy, and survival status every 12 weeks (± 14 days) until the withdrawal of consent, loss to follow-up, death, or the end of the study.18,19
Following Protocol Amendment 1, belantamab mafodotin dose modifications were required to be based on the results of the ocular examination graded by the investigator using a Keratopathy and Visual Acuity (KVA) scale.19 The KVA scale has 2 components: the corneal exam component grades the corneal exam findings from slit lamp exam (superficial punctate keratopathy, microcyst-like deposits, subepithelial haze, stromal opacity, and corneal epithelial defects), and the best corrected visual acuity (BCVA) component grades the change in BCVA. The overall KVA grade is a composite of these 2 components and is driven by the more severe finding or grade of the 2 components. Separate grades for individual components (corneal exam findings and change in BCVA) are reported in addition to the overall grade.19
The primary and secondary end points of the DREAMM-8 study were analyzed based on the data cut-off date of January 29, 2024.18,19
Figure 2: Schematic of Study Design of DREAMM-8 Study
ECOG = Eastern Cooperative Oncology Group; G2 = grade 2; OS = overall survival; PD = progressive disease; PFS = progression-free survival; PO = orally; PS = performance score; RRMM = relapsed or refractory multiple myeloma; SC = subcutaneous.
Source: Sponsor’s Summary of Clinical Evidence.
Populations
Inclusion and Exclusion Criteria
Patients were eligible to be enrolled in the DREAMM-8 study if they were aged 18 years or older with a confirmed diagnosis of MM as defined by the IMWG criteria.16 Participants were required to have an ECOG performance status score of 0 to 2, must have received previous treatment with at least 1 prior line of MM therapy including a lenalidomide-containing regimen with documented disease progression during or after their most recent therapy, and have at least 1 aspect of measurable disease. Key exclusion criteria included prior ASCT, prior treatment or intolerance to pomalidomide, prior treatment with BCMA therapy, and intolerance or refractoriness to bortezomib.
Interventions
Belantamab Mafodotin Treatment Arm (Arm A: BPd Arm)
Belantamab mafodotin was administered intravenously at a single dose of 2.5 mg/kg on day 1 of cycle 1 and 1.9 mg/kg on day 1 of cycle 2 onwards in each 28-day cycle (Figure 3).18 Prophylaxis to mitigate ocular events was instituted for all participants. Pomalidomide 4 mg per day was administered orally on days 1 to 21 of each 28-day cycle. Dexamethasone 40 mg per day was administered orally on days 1, 8, 15, and 22 of each 28-day cycle. The starting dose of dexamethasone was reduced to 20 mg for participants older than 75 years.18
Figure 3: Summary of Dosing Schedule for BPd Treatment Arm
Belamaf = belantamab mafodotin; BPd = belantamab mafodotin, pomalidomide, and dexamethasone; q4w = every 4 weeks.
Source: Sponsor’s Summary of Clinical Evidence.22
Ocular prophylaxis was instituted for all participants in treatment arm A.18 While not yet clinically demonstrated, it is theoretically possible that the application of a cooling eye mask during belantamab mafodotin administration and in the first few hours after infusion may subsequently decrease ocular side effects. A cooling mask was applied at the start of belantamab mafodotin infusion during the first hour for up to 4 hours as tolerated. Corticosteroid eye drops were not required but could be used if clinically indicated at the discretion of an eye care specialist. In the event of ocular symptoms (i.e., dry eyes), the use of artificial tears could be increased up to every 2 hours, as needed.18 Dose delays and reductions were permitted throughout the study.18
The recommended dosage modifications for ocular adverse reactions are based on ophthalmic examination findings, which included corneal examination findings and changes in BCVA. During the ophthalmic examination, the eye care professional should assess the following:
any corneal examination findings and/or any change in BCVA
if there is a decline in BCVA, the relationship to belantamab mafodotin should be determined
the category grading for examination findings and BCVA should be communicated to the treating physician.
The recommended dose modification of belantamab mafodotin due to ocular adverse reactions was to be determined based on the worst finding in the worse-affected eye. This finding was to be based on either a corneal examination finding or a change in BCVA. The worst category grading for ophthalmic examination findings should be communicated to the treating physician by the eye care professional. The corneal examination findings may or may not be accompanied by changes in BCVA. The recommended dose of belantamab mafodotin in the case of ocular adverse reactions was 1.9 mg/kg every 8 weeks (as opposed to every 4 weeks) but could go as low as 1.4 mg/kg every 8 weeks. The dose of belantamab mafodotin was not to be re-escalated after a dose reduction was made for ocular adverse reactions.
Pomalidomide Treatment Arm (Arm B: PVd Arm)
Pomalidomide 4 mg was administered orally daily on days 1 to 14 of each 21-day cycle, with bortezomib 1.3 mg/m2 injected subcutaneously on days 1, 4, 8, and 11 of each 21-day cycle for cycles 1 through 8, and on days 1 and 8 of each 21-day cycle for cycles 9 and beyond.18 Dexamethasone was administered orally at a dose of 20 mg on the day of and day after bortezomib of each 21-day cycle or on days 1, 2, 4, 5, 8, 9, 11, and 12 of each 21-day cycle for cycles 1 through 8 and then on days 1, 2, 8, 9, and every 3 weeks for cycles 9 and beyond. For participants who were older than 75 years, had comorbidities, or were intolerant to 20 mg, dexamethasone could be administered at the lower dose of 10 mg on the day of and the day after bortezomib in treatment arm B at the discretion of the investigator. Dose delays and reductions were permitted throughout the study.18
Figure 4: Dosing Schedule for Treatment Arm B (PVd Arm) in DREAMM-8 Study
PVd = pomalidomide, bortezomib, and dexamethasone; q3w = every 3 weeks.
Source: Sponsor’s Summary of Clinical Evidence.22
Outcomes
A list of efficacy end points assessed in this Clinical Review Report is provided in Table 6, followed by descriptions of the outcome measures. Summarized end points are based on outcomes included in the sponsor’s Summary of Clinical Evidence, outcomes identified as important to this review according to the clinical experts consulted for this review, and input from patient and clinician groups and public drug plans. Using the same considerations, we selected end points that were considered to be most relevant to inform expert committee deliberations and finalized this list of end points in consultation with members of the expert committee.
Table 6: Outcomes Summarized From the Studies Included in the Systematic Review
Study outcome measure | Time point | Outcome priority |
|---|---|---|
Efficacy | ||
Progression-free survival probability | 12 months 18 months | Primary |
Overall survival probability | 12 months 18 months | Key secondary |
Duration of response | Time to event Primary analysis up to January 29, 2024, data cut-off | Key secondary |
MRD negativity | Primary analysis up to January 29, 2024, data cut-off | Key secondary |
CRR | Primary analysis up to January 29, 2024, data cut-off | Secondary |
Patient-reported outcomes or health-related quality of life | ||
GHS/QoL domain (EORTC QLQ-C30) | Week 53 | Secondary |
Harms | ||
Adverse events | Primary analysis up to January 29, 2024, data cut-off | Secondary |
Serious adverse events | Primary analysis up to January 29, 2024, data cut-off | Safety |
Study drug discontinuation due to adverse events | Primary analysis up to January 29, 2024, data cut-off | Secondary |
Deaths as adverse events | Primary analysis up to January 29, 2024, data cut-off | Safety |
Notable harm: Ocular events | Primary analysis up to January 29, 2024, data cut-off | Safety |
Notable harms
| Primary analysis up to January 29, 2024, data cut-off | Safety |
BCVA = best corrected visual acuity; CRR = complete response rate; EORTC QLQ C30 = European Organisation for Research and Treatment of Cancer Quality of Life Questionnaire Core 30; GHS = global health status; KVA = Keratopathy and Visual Acuity; MRD = minimal residual disease; QoL = quality of life.
The following outcomes were chosen for GRADE assessment: PFS, OS, and EORTC QLQ-C30 (GHS), as well as 2 harms outcomes (ocular AEs and total SAEs). OS was chosen because the ultimate goal of any therapy for MM is to improve survival. PFS was chosen because it was the primary outcome in the DREAMM-8 study and because it is considered by the clinical experts to be an established surrogate for OS. Both OS and PFS are of clear importance to patients. HRQoL was chosen because this is clearly important to patients. In addition, the clinical experts noted that patients with this type of cancer can survive a long time and, given their older age and the significant number of harms associated with drugs used to treat MM, it is important to assess the impact of a new intervention on HRQoL. The EORTC QLQ-C30 instrument was specifically chosen from the numerous instruments used in the DREAMM-8 study because it is a widely used instrument that is specific to oncology. The GHS domain was chosen because the clinical experts agreed that it would best capture all aspects of HRQoL for these patients. Among the harms outcomes, ocular AEs were chosen because this is a known harm associated with belantamab mafodotin. SAEs were chosen because the clinical experts believed this to be an important harm to capture.
DOR, minimal residual disease (MRD) negativity, and complete response rate (CRR) were other outcomes that data were summarized but were not assessed with GRADE.
Progression-Free Survival
The primary end point of the DREAMM-8 study was PFS, which was defined as the time from the date of randomization until the earliest date of documented disease progression or death due to any cause.18 PFS was assessed by an independent review committee (IRC) and sensitivity analyses were conducted using alternative PFS censoring rules and investigator-assessed responses.19 The analysis for PFS was conducted with a median duration of follow-up (defined as time to censoring or death) of 21.8 months.
There is no established or published MID for PFS as an end point in r/r MM. The clinical experts consulted on this review believed PFS to be an important and valid surrogate for OS in patients with r/r MM. When asked, 1 clinical expert suggested that a reasonable MID for landmark analyses at 12 and 18 months would be a 10% absolute difference between groups.
Overall Survival
OS was a key secondary end point in the DREAMM-8 study and was defined as the interval of time from randomization to the date of death due to any cause. Assessments for survival were conducted every 12 weeks (± 14 days).18
There is no established or published MID for OS as an end point in r/r MM.18 However, OS is considered the gold standard primary outcome measure in clinical studies and is a measure of direct clinical benefit to patients. It is considered the most reliable and preferred end point in oncology trials when they can be conducted to adequately assess survival.41,42 The measurement of OS is not impacted by potential bias, and the FDA recommends that it be assessed in RCTs in oncology.41,42 When asked, 1 clinical expert consulted on this review thought a 5% absolute difference between groups for landmark analyses at 12 and 18 months would be a reasonable MID for patients with r/r MM.
Duration of Response
DOR was a key secondary end point in the DREAMM-8 study and was defined as the time from first documented evidence of partial response (PR) or better until the earliest date of progressive disease or death due to any cause based on IRC assessment per IMWG criteria.18 Responders without disease progression were censored at the censoring time point for time to progression. There is no established or published MID for DOR as an end point in r/r MM.18
MRD Negativity
MRD was a key secondary end point in the DREAMM-8 study and was defined as the percentage of participants who achieved MRD negative status (as assessed by next-generation sequencing at 10-5 threshold) at least once during the time of confirmed CR or better based on IRC assessment per IMWG.18 There is no established or published MID for MRD as an end point in r/r MM. The FDA considers MRD a biomarker that is a reliable quantitation of tumour burden, independent of assay.43 In MM, the FDA recommends that MRD should be assessed only in patients who are in CR.
Complete Response Rate
CRR was a secondary end point in the DREAMM-8 study and was defined as the percentage of participants with a confirmed CR or better (i.e., CR or stringent complete response [sCR]) based on IRC assessment per IMWG criteria.18 While both CR and sCR require the absence of detectable M-protein in serum and urine and fewer than 5% plasma cells in the bone marrow, sCR also requires a normal free light chain ratio and no clonal cells detectable by immunohistochemistry, indicating a deeper level of response. There is no established or published MID for CRR as an end point in r/r MM.
Health-Related Quality of Life
Patients’ self-reported HRQoL was collected using the EORTC QLQ-C30. Measurement properties of the instrument are in Table 7.
Table 7: Summary of Outcome Measures and Their Measurement Properties
Outcome measure | Type | Conclusions about measurement properties | MID |
|---|---|---|---|
EORTC QLQ-C30 | A cancer-specific, patient-reported standardized questionnaire that is commonly used in oncology clinical trials to evaluate HRQoL. The core questionnaire consists of 30 questions that are scored to create 5 multi-item functional scales (physical, role, emotional, cognitive, social), 3 multi-item symptom scales (fatigue, nausea, and vomiting, pain), 6 single-item symptom scales (dyspnea, insomnia, appetite loss, constipation, diarrhea, financial difficulties), and a global health status/QoL scale.44,45 Most items have 4 response options (“not at all,” “a little,” “quite a bit,” “very much”), with scores on these items ranging from 1 to 4, respectively. For the global health status/QoL scale, a 7-point Likert-type scale is used, with anchors between 1 (very poor) and 7 (excellent).45 Thus, a decline in score on the symptom scale would reflect an improvement, whereas an increase in score on the function and QoL scales would reflect an improvement.45 | Osborne et al.46 conducted a systematic literature review of validated HRQoL tools in MM. For EORTC QLQ-C30, the sample included patients with newly diagnosed MM, relapsed MM, mixed disease stages of MM and treatment experiences, and treated with HSCT.46 Validity: For construct validity, the subscales for pain, fatigue, physical and global QoL were considered able to discriminate between patients (mixed disease stages and treatment experiences, including 69 patients (29%) with relapsed MM or disease progression) who improved vs. patients whose health was stable or had deteriorated (N = 239).47 All subscales, with the exception of the single-item diarrhea scale, were considered able to discriminate between patients with newly diagnosed MM according to their performance and response status (N = 484).48 Reliability: For internal consistency, the Cronbach alpha ranged from 0.54 to 0.89 for all subscales in patients with newly diagnosed MM, mixed disease stages and treatments, and treated with HSCT.48-51 Responsiveness: Responsiveness of the subscales to change over time varied depending on the sample population (listed previously) studied.46 To assess responsiveness, Kvam et al.52 used the global rating of change to identify whether patients with mixed disease stages and treatments changed over time. Of note, 69 patients (29%) had relapsed or progressive disease.a,52 For the global QoL scale, the SRMb in patients who reported improvement and deterioration over a period of 3 months was 0.32 and 0.57, respectively (N = 239). In patients rating themselves as unchanged, the SRM was negligible.52 | From the systemic review of validated HRQoL tools in MM conducted by Osborne et al.,46 the following estimated MIDs were reported for patients with mixed disease stages and treatments: Mean score changes of 6 to 17 in the QLQ-C30 were considered to be important to patientsc (N = 239).53 Of note, changes in the patient’s internal standard of measurement over time (i.e., response shift) may impact the estimated MID in MM; in particular, in patients with deteriorating disease.47 A change of 8 and 12 points in patients who improved and deteriorated, respectively, on the global QoL score was considered to be important to patientsc (N = 239).52 Kvam et al. (2010)47 assessed the MID of the EORTC QLQ-C30 by recruiting 239 patients with MM to complete the EORTC QLQ-C30 at baseline (T1) and after 3 months (T2). At T2, patients were asked if they had noticed any change in the domains pain, fatigue, physical function, and global QoL. The MID was determined using the mean score changes as observed by the patients’ stating improvement or deterioration for each domain. A combination anchor and distribution approach were used. The MIDs (SD) for patients rating themselves as improved was 6.2 (15.3) for physical function, −14.7 (35.9) for pain, −13.5 (24.7) for fatigue and 7.6 (23.7) for QoL. Patients reporting deterioration had MIDs (SD) of 8.6 (23.4) for fatigue, 17.3 (23.1) for pain, −12.8 (19.2) for physical function, and −12.1 (21.2) for QoL. However, there was considerable variation in the observed scores. |
EORTC QLQ-C30 = European Organisation for Research and Treatment of Cancer Quality of Life Questionnaire Core 30; HRQoL = health-related quality of life; HSCT = hematopoietic stem cell transplant; MID = minimal important difference; MM = multiple myeloma; QoL = quality of life; SD = standard deviation; SRM = standardized response mean; T1 = time 1; T2 = time 2; vs. = versus.
aThe European Group for Blood and Marrow transplant criteria for response were used to determine the patients’ disease phase.
bTo assess the magnitude of the difference in scores between patients who improved, deteriorated, and remained stable, SRMs were calculated and compared against Cohen rule of thumb for interpreting the magnitude of mean differences in HRQoL scores: 0.20 represents a small change, 0.50 a moderate change, and > 0.80 a large change.
cThe MIDs were estimated using an anchor-based approach, anchored to a structured quality-of-life interview (response options were “improved,” “deteriorated,” or “unchanged”).
Statistical Analysis
Sample Size and Power Calculation
Based on data from the OPTIMISMM study, the median PFS in treatment arm B (PVd) was expected to be approximately 12 months.54 It was hypothesized that treatment with BPd would lead to a 40% reduction in the risk of progression or death (i.e., an expected HR of 0.6), which corresponded to an increase in median PFS from 12 months to 20 months under the exponential assumption.18 To ensure 85% power to test the null hypothesis, in which PFS HR = 1 (versus the specific alternative hypothesis, in which PFS HR = 0.6), a total of 139 PFS events were needed. The calculation assumed a comparison of PFS by log-rank test at the 1-sided alpha level of 2.5% with a 1:1 randomization ratio and an interim analysis using gamma spending function with a parameter of −3 to define a nonbinding boundary for stopping for early harm (inferior efficacy) when observing approximately25% PFS events.18
Assuming a total of 300 participants were randomized in a 1:1 ratio to receive treatment arm A (BPd) or treatment arm B (PVd) with a uniform enrolment rate of 12 participants per month, enrolment continued for approximately 25 months.18 It was estimated that the targeted 139 PFS events would be observed approximately 29 months from the time when the first participant was randomized under the alternative hypothesis, assuming an annual dropout rate of 5%. These calculations were conducted using East v6.5.18
Statistical Test or Model
PFS was analyzed across treatment arms using Kaplan-Meier (KM) analysis. The nonparametric KM method was used to estimate the survival curves for PFS, with KM curves presented by the treatment arm.18 The PFS rates at 6, 12, and 18 months with corresponding 95% CIs were also estimated from the KM analysis. The 95% CI was estimated using the Brookmeyer-Crowley method.55 A stratified Cox proportional hazard model, with the Efron method of tie handling and the treatment arm as the sole explanatory variable, was used to assess the magnitude of the treatment difference (i.e., the HR) in PFS between the treatment arms.18 The treatment difference was compared by the stratified log-rank test at a 1-sided alpha level of 0.025. The stratified log-rank test (stratified by randomization factors) was only performed for the primary analysis of the primary estimand of PFS (i.e., based on IRC-assessed response and primary event and censoring rules).18
Multiple Testing Procedure
At the primary efficacy analysis, the family-wise error rate for testing multiple end points was strongly controlled with a step-down or hierarchical testing procedure.18 A hierarchical multiple testing strategy is illustrated in Figure 5.
The evaluation of the primary and key secondary end points was structured in terms of 2 families of hypotheses:18
The first family focused on the primary end point, PFS. PFS was planned to be tested across 3 analyses: an analysis for harm (interim analysis 1 [IA1]), an interim analysis for efficacy (interim analysis 2 [IA2]), and the primary PFS analysis (interim analysis 3 [IA3]). IA1 was scheduled to occur after approximately 35 PFS events, representing about 25% of the PFS information fraction. IA2 was scheduled to occur after approximately 145 PFS events, representing about 84% of the PFS information fraction. If PFS did not demonstrate statistical significance at IA2, IA3 would take place after approximately 173 PFS events, corresponding to 100% of the PFS information fraction. A gamma beta-spending function with a parameter of −3 was applied to set a nonbinding boundary at IA1. The Lan-DeMets approach, which approximates the O’Brien and Fleming spending function, was used to maintain an overall 1-sided 2.5% type I error rate when testing PFS across IA2 and IA3 because these analyses provided the opportunity to claim efficacy. Efficacy boundaries were adjusted based on the actual number of PFS events observed at each analysis.
The second family was based on the 3 key secondary end points: OS, DOR, and MRD negativity. Testing of the second family was conditional on the successful rejection of the null hypothesis for the first family. Given the testing of the first family was successful, the full alpha was propagated to the second family of hypotheses, with OS being tested first. OS was assessed across 4 planned analyses: IA2, IA3, interim analysis 4, and the final analysis. IA3 is planned after approximately 163 OS events (about 75% OS information fraction) and the final OS analysis will be conducted after approximately 217 OS events (100% OS information fraction). In cases where the null hypothesis for PFS was not rejected at IA2 but subsequently rejected at the IA3, the full alpha was propagated to allow OS testing at the 1-sided 2.5% significance level. The Lan-DeMets approach, approximating the O’Brien and Fleming spending function, was also used for OS, with efficacy boundaries adjusted according to the actual number of OS events at the time of each analysis.
Testing of MRD negativity was conditional on the successful rejection of the null hypothesis for OS, aligned with a step-down or hierarchical testing procedure. Regardless of the timing of this rejection, MRD negativity was only tested using data from IA2, with the full alpha initially allocated to OS propagated accordingly.
A significance level of 0.025 (1-sided) was used at each step of the hierarchy testing procedure.18 The remaining secondary efficacy end points were analyzed without alpha adjustment.18 The results reported herein are based on the successful IA2 of PFS (making it the primary analysis of PFS), conducted after 249 events (data cut-off of January 29, 2024).
Data Imputation Methods
For the patient-reported outcomes, if values were missing for more than half of the scale for a given patient, then the entire score for that patient was counted as missing, while if less than half of the scores were missing, only those scores with missing values were reported as missing. There does not appear to have been any attempts made to impute missing data.
For overall response rate (ORR), patients with unknown or missing responses were counted as nonresponders.
Figure 5: Multiple Testing Strategy
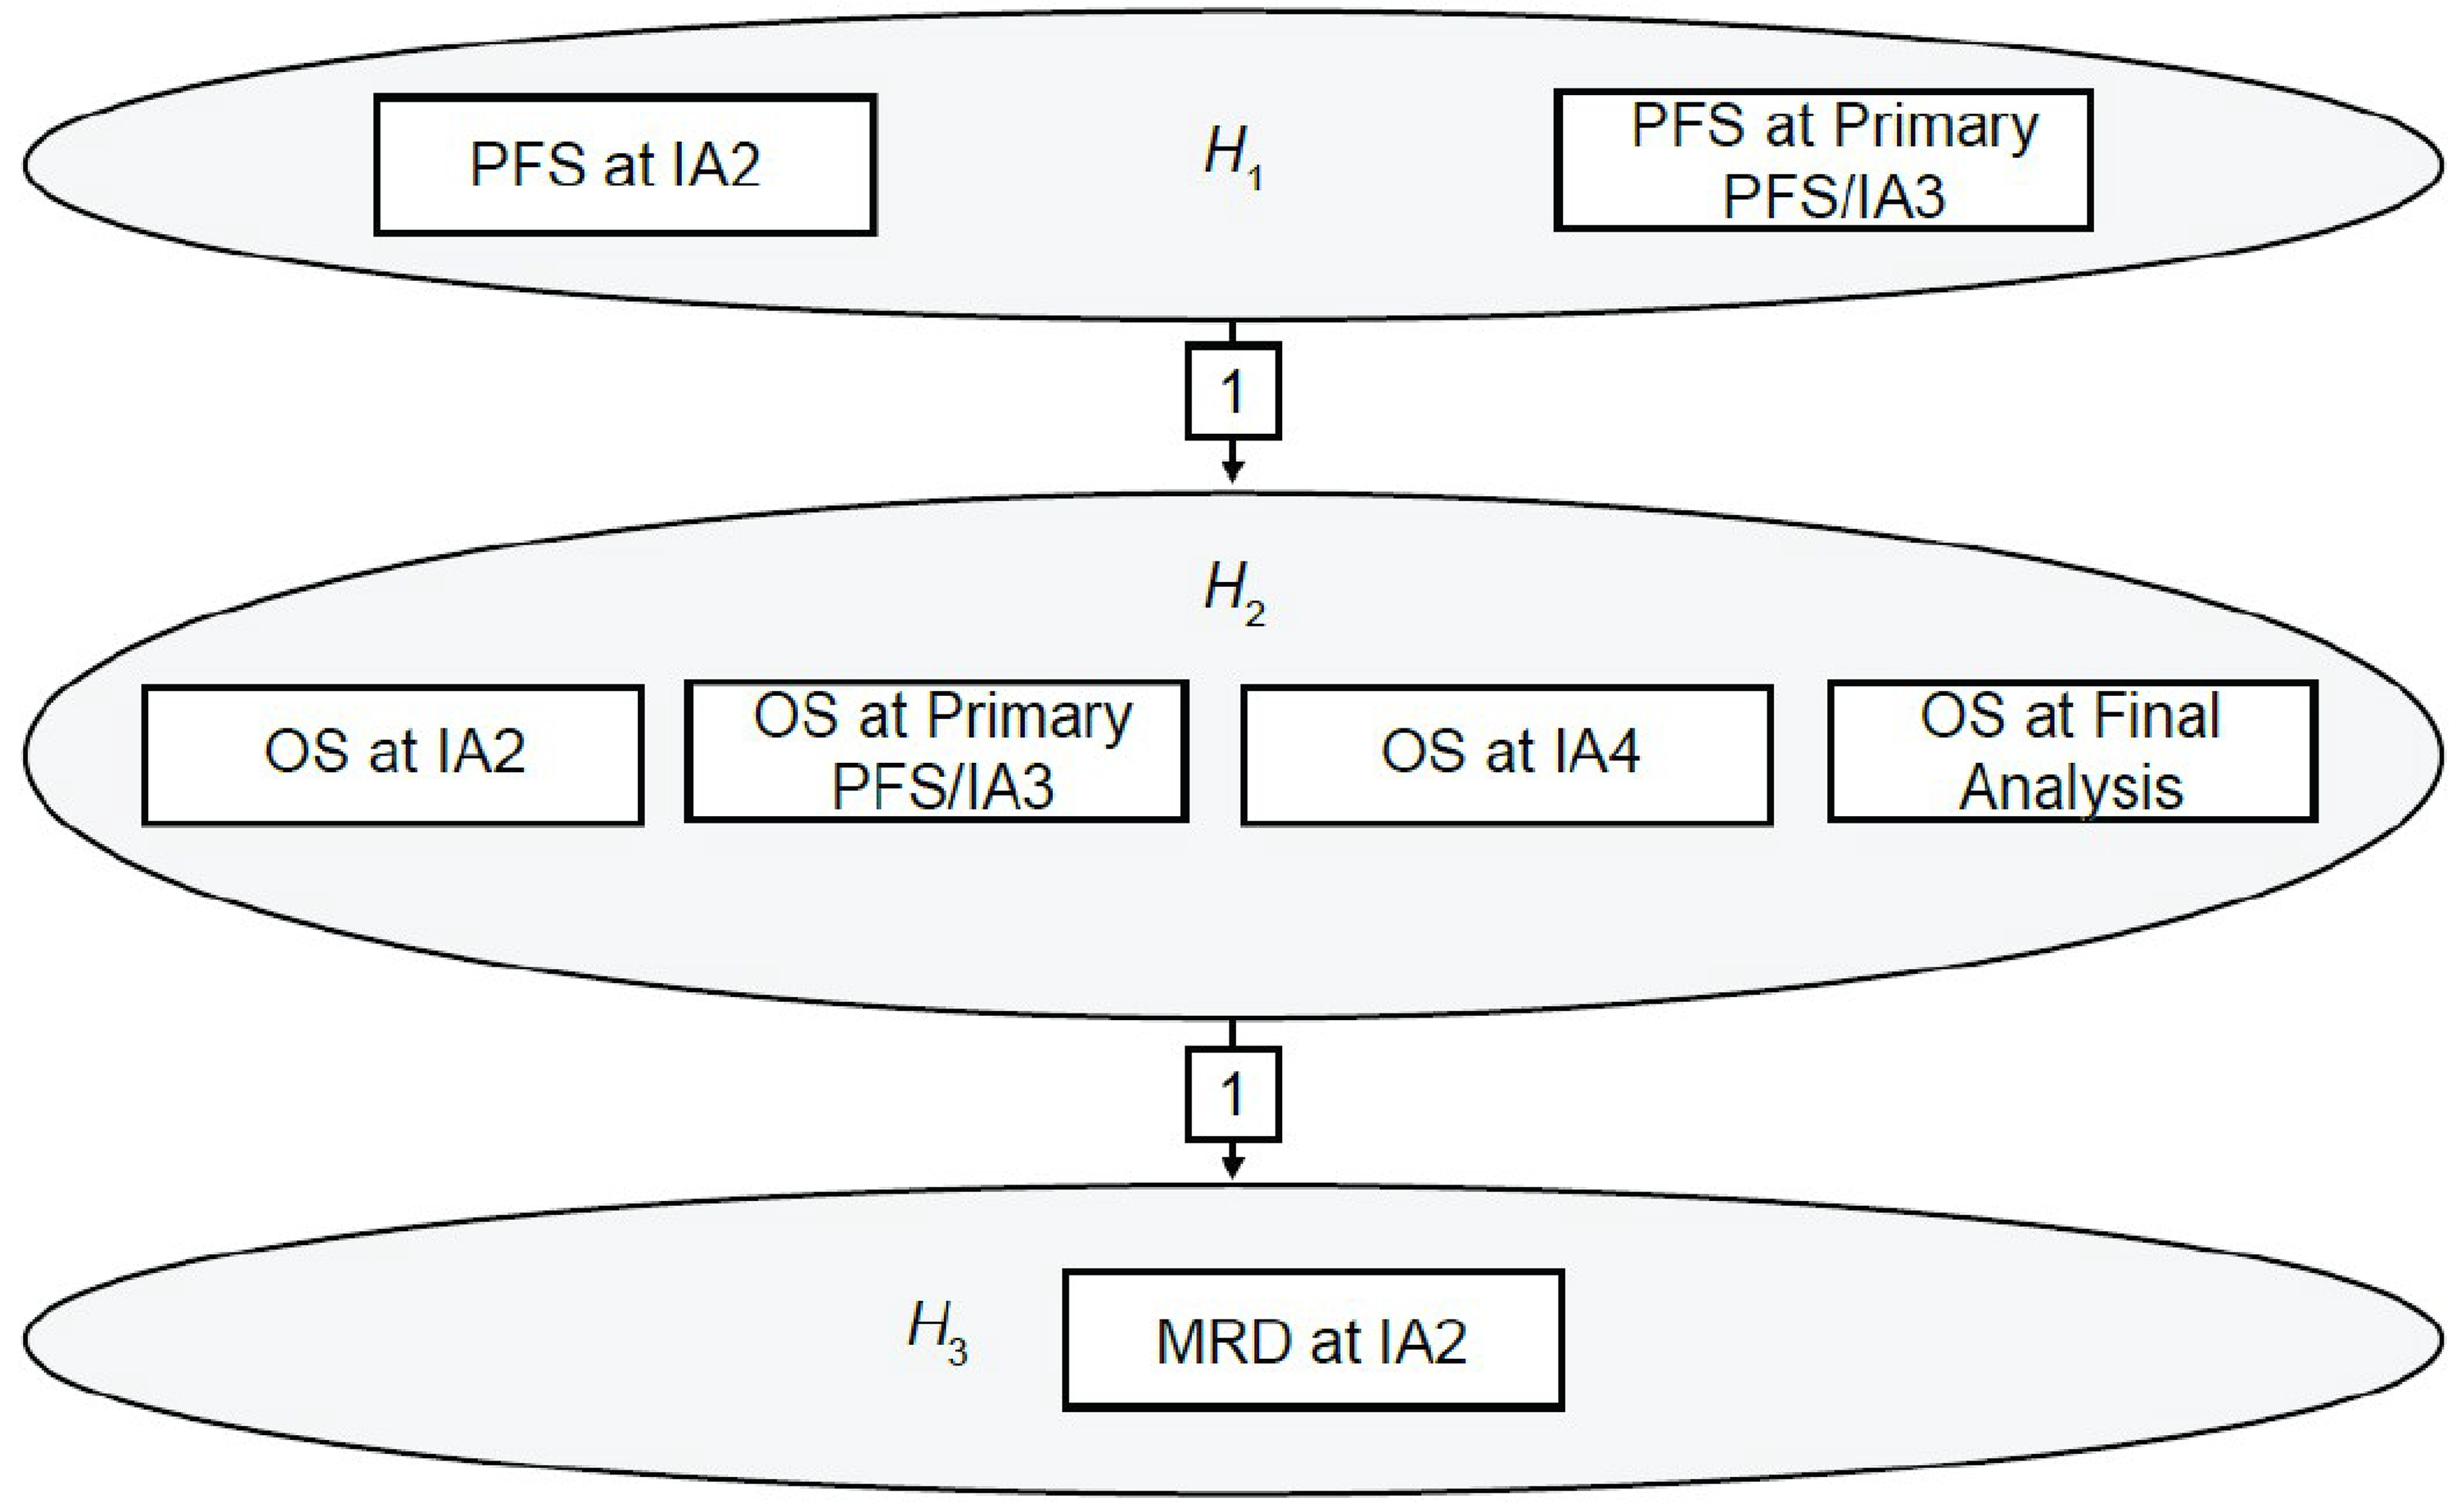
IA = interim analysis; H =hypothesis; MRD = minimal residual disease negativity rate; PFS = progression-free survival; OS = overall survival.
Notes: 𝑯𝒊 denotes the 1-sided null hypothesis for the primary and key secondary end points, where 𝒊 = 𝟏, 𝟐, 𝟑 denotes the index indicating PFS, OS, and MRD negativity rate, respectively.
Source: Sponsor’s Summary of Clinical Evidence.22
Subgroup Analyses
Subgroup analyses were performed similarly to the methods used for the primary PFS efficacy analysis but included only the participants within the relevant subgroup category.18 All subgroup analyses were based on the clinical database using an electronic case report form or vendor data (and not randomized strata). Randomization strata included number of prior lines of therapy (1 versus 2 or 3 versus 4 or more), prior bortezomib treatment (yes or no), and prior anti-CD38 treatment (yes or no). ISS status (I versus II or III) was a randomization factor but was replaced with prior anti-CD38 treatment (yes or no) in Protocol Amendment 1.
The following preplanned subgroup analyses were performed to compare the primary estimand of PFS between treatments, based on IRC-assessed response, as well as the primary estimand of OS between treatments, if data permitted. The sponsor reported HR with 95% CI for each subgroup for PFS with a sample of N = 20 or more but did not report P values and did not perform tests for interactions.
Table 8: Subgroup Analyses for DREAMM-8 Study
Subgroup | Categories |
|---|---|
Prior LoT | 1 vs. > 1 |
1 prior LoT with relapse | Relapse at < 18 months vs. ≥ 18 months |
High-risk cytogenetics | High risk (at least 1 high-risk abnormality [del(17p), t(4;14) or t(14;16)]) vs. other (non-high risk) |
ISS stage at screening | I vs. II or III |
Prior anti-CD38 treatment | Yes vs. no |
Prior bortezomib use | Yes vs. no |
Prior stem cell transplant | Yes vs. no |
Refractory to lenalidomide | Refractory vs. nonrefractory |
Refractory to anti-CD38 | Refractory vs. nonrefractory |
Triple-exposed (PI, immunomodulator, anti-CD38) | Yes vs. no |
ISS = International Staging System; LoT = line of treatment; PI = proteasome inhibitor; vs. = versus.
Source: Sponsor’s Summary of Clinical Evidence.22
Sensitivity Analyses
The various sensitivity analyses used are summarized in Table 9.
Secondary Outcomes of the Studies
The analyses of OS were based on the intention-to-treat (ITT) analysis set unless otherwise specified.18 OS was analyzed across treatment arms using KM analysis. The nonparametric KM method was used to estimate the survival curves for OS, with KM presented by the treatment arm.18 The OS rates at 6, 12, and 18 months with corresponding 95% CIs were also estimated from the KM analysis. The 95% CIs were estimated using the Brookmeyer-Crowley method.55
A stratified Cox proportional hazard model with Efron's method of tie handling and treatment arm as the sole explanatory variable was used to assess the magnitude of the treatment difference (i.e., the HR) in OS between the treatment arms.18
Table 9: Statistical Analysis of Efficacy End Points for DREAMM-8 Study
End point | Statistical model | Adjustment factors | Handling of missing data | Sensitivity analyses |
|---|---|---|---|---|
PFS (primary end point) |
| Stratified by randomization stratification variables | Not reported |
|
OS (key secondary) | Cox proportional hazard model | Stratified by randomization stratification variables | Not reported |
|
DOR (key secondary) | Nonparametric approach | Not reported | Nonresponders had an observed DOR of zero |
|
MRD negativity (key secondary) | Number and percentage of participants | Stratified by randomization stratification: number of prior LoT and prior bortezomib use | Participants with missing or inconclusive assessments were considered as having nonnegative MRD |
|
CRR (secondary) | Number and percentage of participants | Not reported | Participants with only assessments of Not Evaluable or missing response were treated as nonresponders (i.e., they were included in the denominator when calculating the percentage) | All supporting secondary efficacy end point analyses were repeated for the primary estimand but instead using the investigator-assessed response |
CRR = complete response rate; DOR = duration of response; IRC = independent review committee; LoT = line of treatment; mITT = modified intent to treat; MRD = minimal residual disease; OS = overall survival; PFS = progression-free survival; VGPR = very good partial response.
Source: Details included in the table are from the sponsor’s Summary of Clinical Evidence.22
Analysis Populations
Table 10: Analysis Populations of DREAMM-8 Study
Population | Definition | Application |
|---|---|---|
All screened | The “all screened” population consists of all participants who signed the ICF to participate in the clinical trial. Participants in this population were used for screen failure summary. | Study population |
Enrolled | The “enrolled” population was defined as all participants who entered the study (e.g., participants who were identified on the screen failure form as nonscreen failures). | Study population |
Safety | All randomized participants who received at least 1 dose of study treatment (any component). Participants were analyzed according to the treatment they actually received. For treatment arm A: BPd, if participants were incorrectly dosed with bortezomib at > 50% of dosing visits then they were assigned to treatment arm B: PVd as their actual treatment. Similarly, for treatment arm B: PVd, if participants were incorrectly dosed with belantamab mafodotin at > 50% of dosing visits then they were assigned to treatment arm A: BPd as their actual treatment. Data were reported according to the actual treatment. | Safety population |
COVID-19 | All participants in the safety population who had a confirmed, probable, or suspected COVID-19 case diagnosis. Data were reported according to the actual treatment. | Baseline characteristics, medical history, and laboratory data |
ITT | The ITT population consists of all randomized participants whether or not randomized treatment was administered. This population was based on the treatment to which the participant was randomized and was the primary population for the analysis of efficacy data. Any participant who received a treatment randomization number was considered to have been randomized. | Study population, efficacy |
mITT | Participants meeting the following criteria were included:
| Efficacy (sensitivity analysis of primary end point and key secondary end point) |
BPd = belantamab mafodotin, pomalidomide, and dexamethasone; FLC = free light chain; ICF = informed consent form; ITT = intention to treat; mITT = modified intention to treat; PVd = pomalidomide, bortezomib, and dexamethasone.
aMeasurable disease at baseline is defined as: participant having at least 1 of the following measurements: serum M-protein ≥ 0.5 g/dL (≥ 5 g/L), urine M-protein ≥ 200 mg/24h, or serum FLC assay: involved FLC level ≥ 10 mg/dL (≥ 100 mg/L) and an abnormal serum FLC ratio (< 0.26 or > 1.65).
Source: Details included in the table are from the sponsor’s Summary of Clinical Evidence.22
Results
Patient Disposition
There were 13 patients (8%) who withdrew from study in the BPd group and 9 patients (6%) who withdrew in the PVd group, with the most common reason being withdrawal by participant (11 patients [7%] with BPd and 8 patients [5%] with PVd (Table 11). The numbers of patients who discontinued study treatment were 99 (64%) with BPd and 116 (79%) with PVd, and the most common reason was disease progression, which was less common with BPd (44 patients [28%]) than with PVd (71 patients [48%]), and AEs, which occurred in a similar number of patients in the BPd (26 patients [16%]) and PVd (23 patients [16%]) groups.
Table 11: Summary of Patient Disposition From Studies Included in the Systematic Review
Patient disposition | DREAMM-8 study | |
|---|---|---|
BPd (n = 155) | PVd (n = 147) | |
Screened, N | 382 | |
Reason for screening failure, n | 80 | |
Did not meet inclusion or exclusion criteria | 72 | |
Withdrawal | 4 | |
Physician decision | 3 | |
Site terminated by sponsor | 1 | |
Randomized, N | 155 | 147 |
Discontinued from study, n (%) | 13 (8) | 9 (6) |
Reason for discontinuation, n (%) | ||
Withdrawal by participant | 11 (7) | 8 (5) |
Protocol deviation | 1 (< 1) | 0 |
Physician decision | 1 (< 1) | 0 |
Lost to follow-up | 0 | 1 (< 1) |
Discontinued, study treatment (monotherapy or combination), n (%) | 99 (64) | 116 (79) |
Progressive disease | 44 (28) | 71 (48) |
Adverse event | 25 (16) | 23 (16) |
Physician decision | 19 (12) | 14 (10) |
Withdrawal by participant | 10 (6) | 8 (5) |
Protocol deviation | 1 (< 1) | 0 |
Deaths, n (%) | 48 (31) | 54 (37) |
Ongoing, n (%) | 94 (61) | 84 (57) |
On study treatment | 65 (42) | 33 (22) |
In follow-up | 29 (19) | 51 (35) |
ITT, N | 155 (100) | 147 (100) |
mITT, N | 149 (96) | 144 (98) |
Safety, N | 150 (97) | 145 (99) |
BPd = belantamab mafodotin, pomalidomide, and dexamethasone; ITT = intention to treat; mITT = modified intention to treat; PVd = pomalidomide, bortezomib, and dexamethasone.
Note: Participants could only have 1 primary reason for withdrawal.
Data cut-off date: January 29, 2024.
Source: Details included in the table are from the sponsor’s Summary of Clinical Evidence.22
Baseline Characteristics
Most patients were male (60%) and had an average age of 66 years; approximately ███ were aged 65 years or older. Most patients (59%) were considered to be at ISS stage I at screening, only 10% had extramedullary disease, and 26% had lytic bone lesions. The most common myeloma immunoglobulin was IgG (62% of patients), with IgA being the next most common (22%). With respect to prior lines of therapy completed before screening, 53% of patients had 1 line, 34% had 2 or 3 lines, and 14% had 4 lines or more. Most patients (███) had a prior PI, all patients had a previous IMiD, and all patients had received lenalidomide. There were 60% of patients who had a prior stem cell transplant. With respect to cytogenetic risk profile, one-third were considered to be at high risk. Most patients (98%) had ECOG performance status scores of 0 or 1.
The baseline characteristics outlined in Table 12 are limited to those that were most relevant to this review or could affect the outcomes or interpretation of the study results.
Table 12: Summary of Baseline Characteristics From DREAMM-8 Study (ITT Population)
Characteristic | BPd (n = 155) | PVd (n = 147) |
|---|---|---|
Sex, n (%) | ||
Female | 56 (36) | 65 (44) |
Male | 99 (64) | 82 (56) |
Age, yearsa | ||
Mean (SD) | 65.5 (8.56) | 66.7 (10.03) |
19 to < 65 | 64 (41) | 53 (36) |
65 to < 75 | 72 (46) | 59 (40) |
≥ 75 | 19 (12) | 35 (24) |
Ethnicity, n (%) | ||
n | 155 | 146 |
Hispanic or Latino | 10 (6) | 7 (5) |
Not Hispanic or Latino | 145 (94) | 139 (95) |
High-level race, n (%) | ||
n | 155 | 146 |
American Indian or Alaska Native [wording from original source] | 0 | 0 |
Asian | 20 (13) | 17 (12) |
Black or African American | 0 | 0 |
Native Hawaiian or Other Pacific Islander | 1 (< 1) | 2 (1) |
White | 133 (86) | 127 (87) |
Mixed race | 1 (< 1) | 0 |
BMI (kg/m2) | ||
Mean (SD) | 27.216 (4.8351) | 27.779 (4.7658) |
ISS at screening, n (%) | ||
Stage I | 93 (60) | 85 (58) |
Stage II | 39 (25) | 40 (27) |
Stage III | 22 (14) | 22 (15) |
Unknown | 1 (< 1) | 0 |
Extramedullary disease, n (%) | ||
No | 135 (87) | 136 (93) |
Yes | 20 (13) | 11 (7) |
█████ ████ ████████ █ ███ | ||
No | ██ ████ | ██ ████ |
Yes | ███ ████ | ███ ████ |
Myeloma immunoglobulin, n (%) | ||
IgA | 42 (27) | 25 (17) |
IgD | 2 (1) | 1 (< 1) |
IgE | 0 | 0 |
IgG | 86 (55) | 102 (69) |
IgM | 2 (1) | 1 (< 1) |
None present | 23 (15) | 18 (12) |
Missing | 0 | 0 |
███████ █████ ██████ █ ███ | ||
████ █████ █████ █████ | ██ ████ | ██ ████ |
████ ██████ █████ █████ | ██ ████ | ██ ████ |
██ ███████ █████ █████ | | ███ | | ████ |
████ ██ ████████ █ ███ | ||
█████████████ | || | || |
█████████ | ███ █████ | ███ █████ |
Lines of therapy completed before screening, n (%) | ||
Mean (SD) | 1.9 (1.22) | 2.0 (1.44) |
1 line | 82 (53) | 77 (52) |
2 or 3 lines | 54 (35) | 48 (33) |
≥ 4 lines | 19 (12) | 22 (15) |
Previous PI | 140 (90) | 136 (93) |
Bortezomib | 134 (86) | 130 (88) |
Carfilzomib | 34 (22) | 37 (25) |
Ixazomib | 11 (7) | 15 (10) |
Previous iMiD drugs | 155 (100) | 147 (100) |
Lenalidomide | 155 (100) | 147 (100) |
Thalidomide | 49 (32) | 48 (33) |
Pomalidomide | 0 | 1 (1) |
Previous anti-CD38 antibodies | 38 (25) | 42 (29) |
Daratumumab | 36 (23) | 39 (27) |
Isatuximab | 2 (1) | 3 (2) |
CD38 inhibitors | 0 | 1 (1) |
Prior stem cell transplant, n (%) | ||
No | 56 (36) | 65 (44) |
Yes | 99 (64) | 82 (56) |
High-risk cytogenetic profile by FISH, n (%)c | ||
t(4;14) | 23 (15) | 20 (14) |
t(14;16) | 7 (5) | 11 (7) |
17p13del | 32 (21) | 26 (18) |
█████ ███████████ █████████████ ██ █████ █ ██████ | ||
███████ | ██ ████ | ██ ████ |
█████ | ██ ███ | ██ ███ |
█████ | ██ ███ | | ███ |
High-risk cytogenetic profile categories, n (%) | ||
High riske | 52 (34) | 47 (32) |
██████ ███ ████████ ███████ | | ███ | | ███ |
Standard riskg | 72 (46) | 75 (51) |
Missing or not evaluable | 31 (20) | 25 (17) |
Time to relapse after initiation of 1L treatment, n (%)h | ||
≤ 12 months | 22 (14) | 20 (14) |
> 12 months | 133 (86) | 127 (86) |
██████ ████ █████ ███████ █████████ ██ █████████████ ███████ | ||
██████ █████ ████ | ████ █████ █████ | ████ █████ █████ |
██ ████████ | ████ | ████ |
██ ████████ | ████ | ████ |
ECOG performance status, n (%)i | ||
n | 150 | 145 |
████████ | || | || |
0 | 79 (53) | 84 (58) |
1 | 67 (45) | 56 (39) |
2 | 4 (3) | 5 (3) |
1L = first line; BMI = body mass index; BPd = belantamab mafodotin, pomalidomide, and dexamethasone; ECOG = Eastern Cooperative Oncology Group; iMiD = immunomodulatory drug; ITT = intention to treat; ISS = International Staging System; PI = proteasome inhibitor; PVd = pomalidomide, bortezomib, and dexamethasone; SD = standard deviation.
aAge was imputed when full date of birth was not provided.
bNorth America: US; Europe: Czech Republic, France, Germany, Greece, Italy, Poland, Russian Federation, Spain, Turkey, UK; Northeast Asia: China, Japan, Republic of Korea; rest of the world: Australia, Brazil, Israel, New Zealand.
cParticipants may have been included in more than 1 category. Only positive results were summarized.
dResults may not have been collected or reported for all participants.
eIf the participant had at least 1 high-risk abnormality: t(4;14), t(14;16), or 17p13del.
fIf the participant had at least 2 high-risk abnormalities: t(4;14), t(14;16), or 17p13del.
gIf the participant had negative results for all high-risk abnormalities: t(4;14), t(14;16), or 17p13del.
hRelapse was defined as the time from the start date of the first prior line of the therapy to the date of randomization for participants with 1 prior line or to the start date of the second prior line of the therapy for participants with > 1 prior line.
iAnalyzed in the safety population.
Data cut-off date: January 29, 2024.
Source: Details included in the table are from the sponsor’s Summary of Clinical Evidence.22
Exposure to Study Treatments
Exposure to study drugs is summarized in Table 13. Exposure to each of the components of the BPd regimen was longer than exposure to components of the PVd regimen. Concomitant medications were most commonly some form of blood product (Table 15). Subsequent treatments are listed in Table 16.
Table 13: Summary of Patient Exposure From Studies Included in the Systematic Review (Safety Population)
Exposure | BPd (n = 150) | PVd (n = 145) | ||||
|---|---|---|---|---|---|---|
Belantamab | Pomalidomide | Dexamethasone | Bortezomib | Pomalidomide | Dexamethasone | |
Total duration of exposure (months)a | ||||||
Median (minimum, maximum) | 13.19 (0.9, 35.1) | 15.92 (0.6, 35.0) | 14.00 (0.5, 34.3) | 7.62 (0.1, 35.4) | 8.51 (0.3, 39.9) | 8.08 (0, 39.2) |
Number of cycles | ||||||
Median (minimum, maximum) | 6.0 (1, 23) | 15.5 (1, 37) | 14.0 (1, 37) | 11.0 (1, 50) | 11.0 (1, 56) | 11.0 (1, 56) |
Cumulative dose | ||||||
Median (minimum, maximum) | 12.21 (2.5, 44.1) | 1,078.50 (34.0, 3096.0) | 1,610.00 (80.0, 5840.0) | 42.80 (1.3, 130.0) | 588.00 (4.0, 3060.0) | 1,280.00 (10.0, 4580.0) |
Average daily dose | ||||||
Median (minimum, maximum) | 1.99 (1.6, 2.5) | 4.00 (1.3, 4.0) | 35.77 (7.2, 45.6) | 1.30 (0.7, 1.3) | 4.00 (1.4, 4.0) | 20.00 (8.3, 30.0) |
Dose intensity | ||||||
Median (minimum, maximum) | 1.04 (0.4, 2.5)b | 70.77 (18.5, 84.0)b | 110.10 (25.3, 166.6)b | 3.58 (1.4, 9.1)c | 51.37 (10.5, 56.5)c | 101.33 (20.8, 420.0)c |
Relative dose intensity, (%)d,e | ||||||
Median (minimum, maximum) | 52.50 (18.9, 100.4) | 84.25 (22.0, 100.0) | 81.70 (15.8, 104.1) | 87.50 (29.9, 175.0) | 91.73 (18.8, 100.9) | 90.34 (26.8, 262.5) |
BPd = belantamab mafodotin, pomalidomide, and dexamethasone; PVd = pomalidomide, bortezomib, and dexamethasone.
Notes: Belantamab dose measured in mg/kg; dose intensity measured in mg/kg/cycle; cumulative dose in mg/kg; average daily dose in mg/kg/day.
Bortezomib dose measured in mg/m2; dose intensity measured in mg/m2/cycle; cumulative dose in mg/m2; average daily dose in mg/m2/day.
Pomalidomide dose measured in mg; dose intensity measured in mg/cycle; cumulative dose in mg; average daily dose in mg/day.
Dexamethasone dose measured in mg; dose intensity measured in mg/cycle; cumulative dose in mg; average daily dose in mg/day.
aTreatment duration = ([last date of the study drug] – [first dose date of the study drug]) + 1.
bDose intensity was the cumulative actual dose ÷ (treatment duration ÷ 4 weeks).
cDose intensity was the cumulative actual dose ÷ (treatment duration ÷ 3 weeks).
dRelative dose intensity = (dose intensity ÷ planned dose intensity) × 100.
ePlanned dose intensity = (cumulative planned dose in actual dosing cycles) ÷ (number of actual dosing cycles) – only actual dosing cycles up to the last dose of component were considered.
Data cut-off date: January 29, 2024.
Source: Details included in the table are from the sponsor’s Summary of Clinical Evidence.22
Table 14: Dose Exposure of Belantamab Mafodotin
Dose exposure | 0 to ≤ 6 months | > 6 to ≤ 12 months | > 12 months | Total |
|---|---|---|---|---|
Number of patients | 150 | 104 | 77 | 150 |
Number of infusions per patient | ||||
Mean | 3.8 | 2.3 | 3.7 | 7.3 |
Median (IQR) | 4 (3, 5) | 2 (1, 3) | 3 (1, 5) | 6 (4, 10) |
Total number of doses | 570 | 242 | 286 | 1,098 |
Number of doses administered by dose level (%) | ||||
2.5 mg/kg | 151 (26) | — | — | 151 (14) |
1.9 mg/kg | 415 (73) | 235 (97) | 267 (93) | 917 (84) |
1.4 mg/kg | 4 (< 1) | 7 (3) | 19 (7) | 30 (3) |
Time between doses per patient (weeks)a | ||||
n | 129 | 79 | 77 | 142 |
Mean | 5.26 | 11.91 | 14.2 | 9.46 |
Median (IQR) | 4.1 (4, 5) | 11.8 (5, 16) | 14.1 (10, 18) | 8.7 (5, 13) |
IQR = interquartile range.
aIntervals for 0 to ≤ 6 months, > 6 to ≤ 12 months, and > 12 months were calculated either by using days or days converted into months.
Source: Blenrep Product Monograph, 2024.56
Table 15: Use of Concomitant Medications in DREAMM-8 Study
Received concomitant medication | BPd (N = 155), n (%) | PVd (N = 147), n (%) |
|---|---|---|
Any concomitant medication | 97% | 98% |
Blood products | 46 (30) | 37 (25) |
IVIG | 27 (17) | 13 (9) |
Blood supportive care products | 34 (14) | 32 (13) |
GCSF | 64 (41) | 44 (30) |
BPd = belantamab mafodotin, pomalidomide, and dexamethasone; IVIG = IV immunoglobulin; PVd = pomalidomide, bortezomib, and dexamethasone.
Source: Details included in the table are from the sponsor’s Summary of Clinical Evidence.22
Table 16: Summary of Subsequent Treatment From Studies Included in the Systematic Review
Exposure | Any subsequent antimyeloma therapy | |
|---|---|---|
BPd (n = 155) | PVd (n = 147) | |
Steroids | 37 (24) | 59 (40) |
mAb | 24 (15) | 51 (35) |
Daratumumab | 23 (15) | 49 (33) |
Isatuximab | 20 (13) | 38 (26) |
Modakafusp alfa | 5 (3) | 10 (7) |
Other mAb | 0 | 1 (< 1) |
Elotuzumab | 4 (3) | 2 (1) |
PI | 4 (3) | 2 (1) |
Carfilzomib | 26 (17) | 36 (24) |
Bortezomib | 15 (10) | 23 (16) |
Ixazomib | 15 (10) | 10 (7) |
IMiD | 1 (< 1) | 9 (6) |
Lenalidomide | 14 (9) | 29 (20) |
Pomalidomide | 6 (4) | 16 (11) |
Thalidomide | 5 (3) | 12 (8) |
Iberdomide | 3 (2) | 3 (2) |
Chemotherapy | 1 (< 1) | 0 |
BiTE | 16 (10) | 25 (17) |
Teclistamab | 6 (4) | 16 (11) |
Cevostamab | 1 (< 1) | 5 (3) |
Investigational antineoplastic agents | 2 (1) | 3 (2) |
Regn5458 | 0 | 4 (3) |
Emb-06 | 0 | 3 (2) |
Talquetamab | 0 | 1 (< 1) |
Elranatamab | 2 (1) | 2 (1) |
Forimtamig | 0 | 2 (1) |
Other | 1 (< 1) | 0 |
Selinexor | 5 (3) | 7 (5) |
Venetoclax | 5 (3) | 3 (2) |
Nirogacestat | 0 | 3 (2) |
ADC | 0 | 1 (< 1) |
Belantamab | 0 | 10 (7) |
Stem cell transplant | 1 (< 1) | 5 (3) |
ADC = antibody-drug conjugate; BPd = belantamab mafodotin, pomalidomide, and dexamethasone; IMiD = immunomodulatory drug; PI = proteasome inhibitor; PVd = pomalidomide, bortezomib, and dexamethasone.
Note: Multiple categories per participant were possible and totals may add up to more than 100%.
Data cut-off date: January 29, 2024.
Source: Details included in the table are from the sponsor’s Summary of Clinical Evidence.22
Efficacy
Progression-Free Survival
After a median follow-up of 21.8 months, progression or death occurred in 62 participants (40%) in the BPd arm versus 80 (54%) participants in the PVd arm for an HR of 0.52 (95% CI, 0.37 to 0.73; P < 0.001). The median PFS was not reached in the BPd arm (95% CI, 20.6 to not reached) and was 12.7 months (95% CI, 9.1 to 18.5) in the PVd arm (Table 17 and Figure 6). Landmark analyses of PFS showed a higher PFS rate in the BPd arm compared with the PVd arm at 12 months (71% versus 51%), as well as at 18 months ████ ██████ █████
█████ sensitivity or supplemental analyses were conducted, all of which yielded results consistent with the primary PFS analysis, with HRs ranging from ████ ██ ████. To account for the effect of nonproportional hazards impact on PFS, sensitivity analysis using restricted mean survival time was conducted, yielding restricted mean survival time of 22.8 months versus 16.5 months (restricted to the common truncation time of 34.1 months) with a ratio of 1.37 favouring the BPd arm.19 In the BPd and PVd arms, new antimyeloma therapy before observing a PFS event was initiated in 8 (5%) and 19 (13%) of the participants. This indicated that more participants in the PVd arm may have deteriorated, with a documented progression expected imminently had the new antimyeloma therapy not been initiated. The prespecified supplementary analysis 2 considered the initiation of new antimyeloma therapy as an event, which yielded an HR of 0.48 (95% CI, 0.35 to 0.65) in favour of BPd, reaffirming the results of the primary analysis.19
The PFS benefit observed was consistent across all subgroups, with HRs ranging from 0.26 to 0.76.19 In the protocol-specified subgroups of the DREAMM-8 trial, the HR was 0.52 (95% CI, 0.31 to 0.88) for participants with 1 prior line of therapy and 0.52 (95% CI, 0.33 to 0.80) for those with more than 1 prior line of therapy. For patients exposed to bortezomib, the HR was 0.55 (95% CI, 0.38 to 0.78). Among participants whose disease was refractory to lenalidomide, the HR was 0.45 (95% CI, 0.31 to 0.65). Regarding cytogenetic risk, the HR was 0.57 (95% CI, 0.34 to 0.96) for patients at high risk and 0.51 (95% CI, 0.30 to 0.86) for those with standard risk.19
Figure 6: KM Curves of PFS Based on IRC-Assessed Response in DREAMM-8 Study (ITT Population)
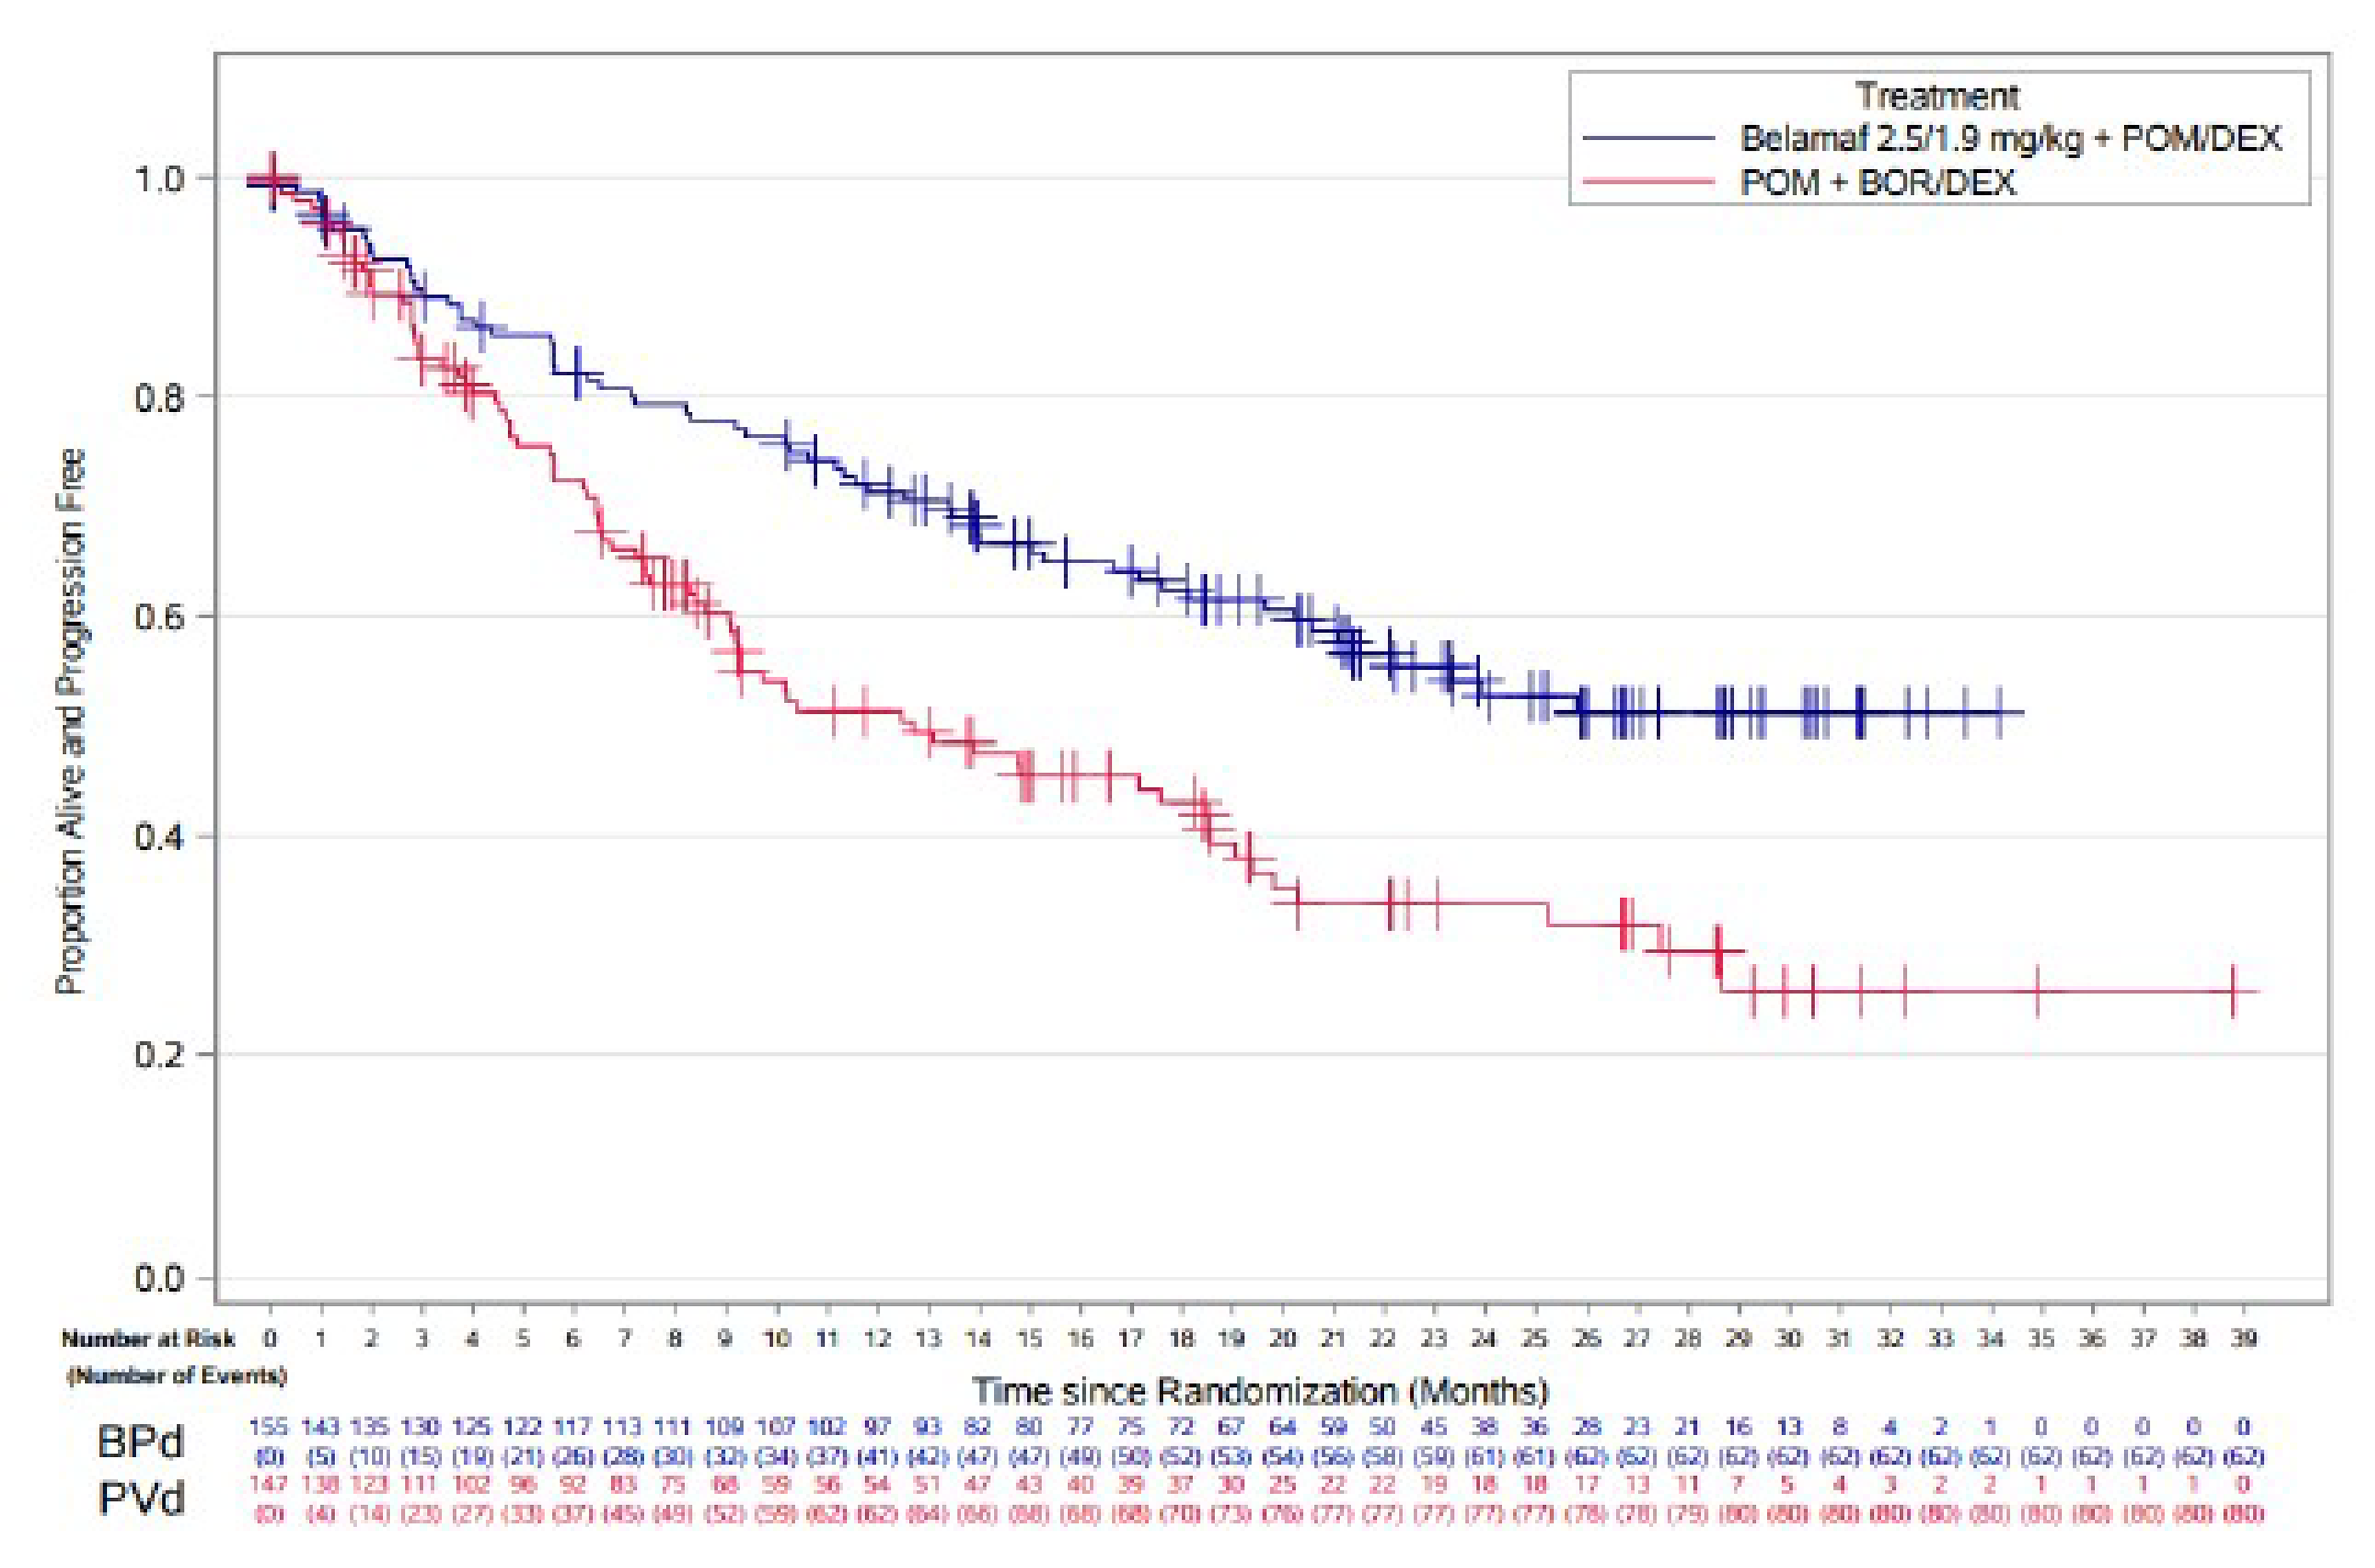
Belamaf = belantamab mafodotin; BOR = bortezomib; BPd = belantamab mafodotin, pomalidomide, and dexamethasone; DEX = dexamethasone; ITT = intent to treat; KM = Kaplan-Meier; POM = pomalidomide; PVd = pomalidomide, bortezomib, and dexamethasone.
Data cut-off date: January 29, 2024.
Source: Sponsor’s Summary of Clinical Evidence.22
OS
At the data cut-off date (January 29, 2024), median OS was not reached in either treatment group (Table 17 and Figure 7). The median duration of follow-up was not specifically reported for OS; however, it was reported as 21.8 months for PFS. The OS data had reached 34.8% (105 of 302 participants) overall maturity and an information fraction equal to 48.4% (105 of 217), where 217 deaths were anticipated for OS analysis according to the statistical analysis plan. Follow-up for OS is ongoing and will continue until the next planned interim analysis of OS (IA3) at approximately 60% information fraction. The 12-month OS survival rate was higher in the BPd arm compared with the PVd arm (83% [95% CI, 76% to 86%] versus 76% [95% CI, 68% to 82%]), for an RD of ████ ████ ███ ██████ ██████ and this was also the case at 18 months (███ ████ ███ ████ ████ versus ███ ████ ███ ████ █████ for a RD of ████ ████ ███ ██████ ██████.
Figure 7: KM Curves of OS in DREAMM-8 Study (ITT Population)
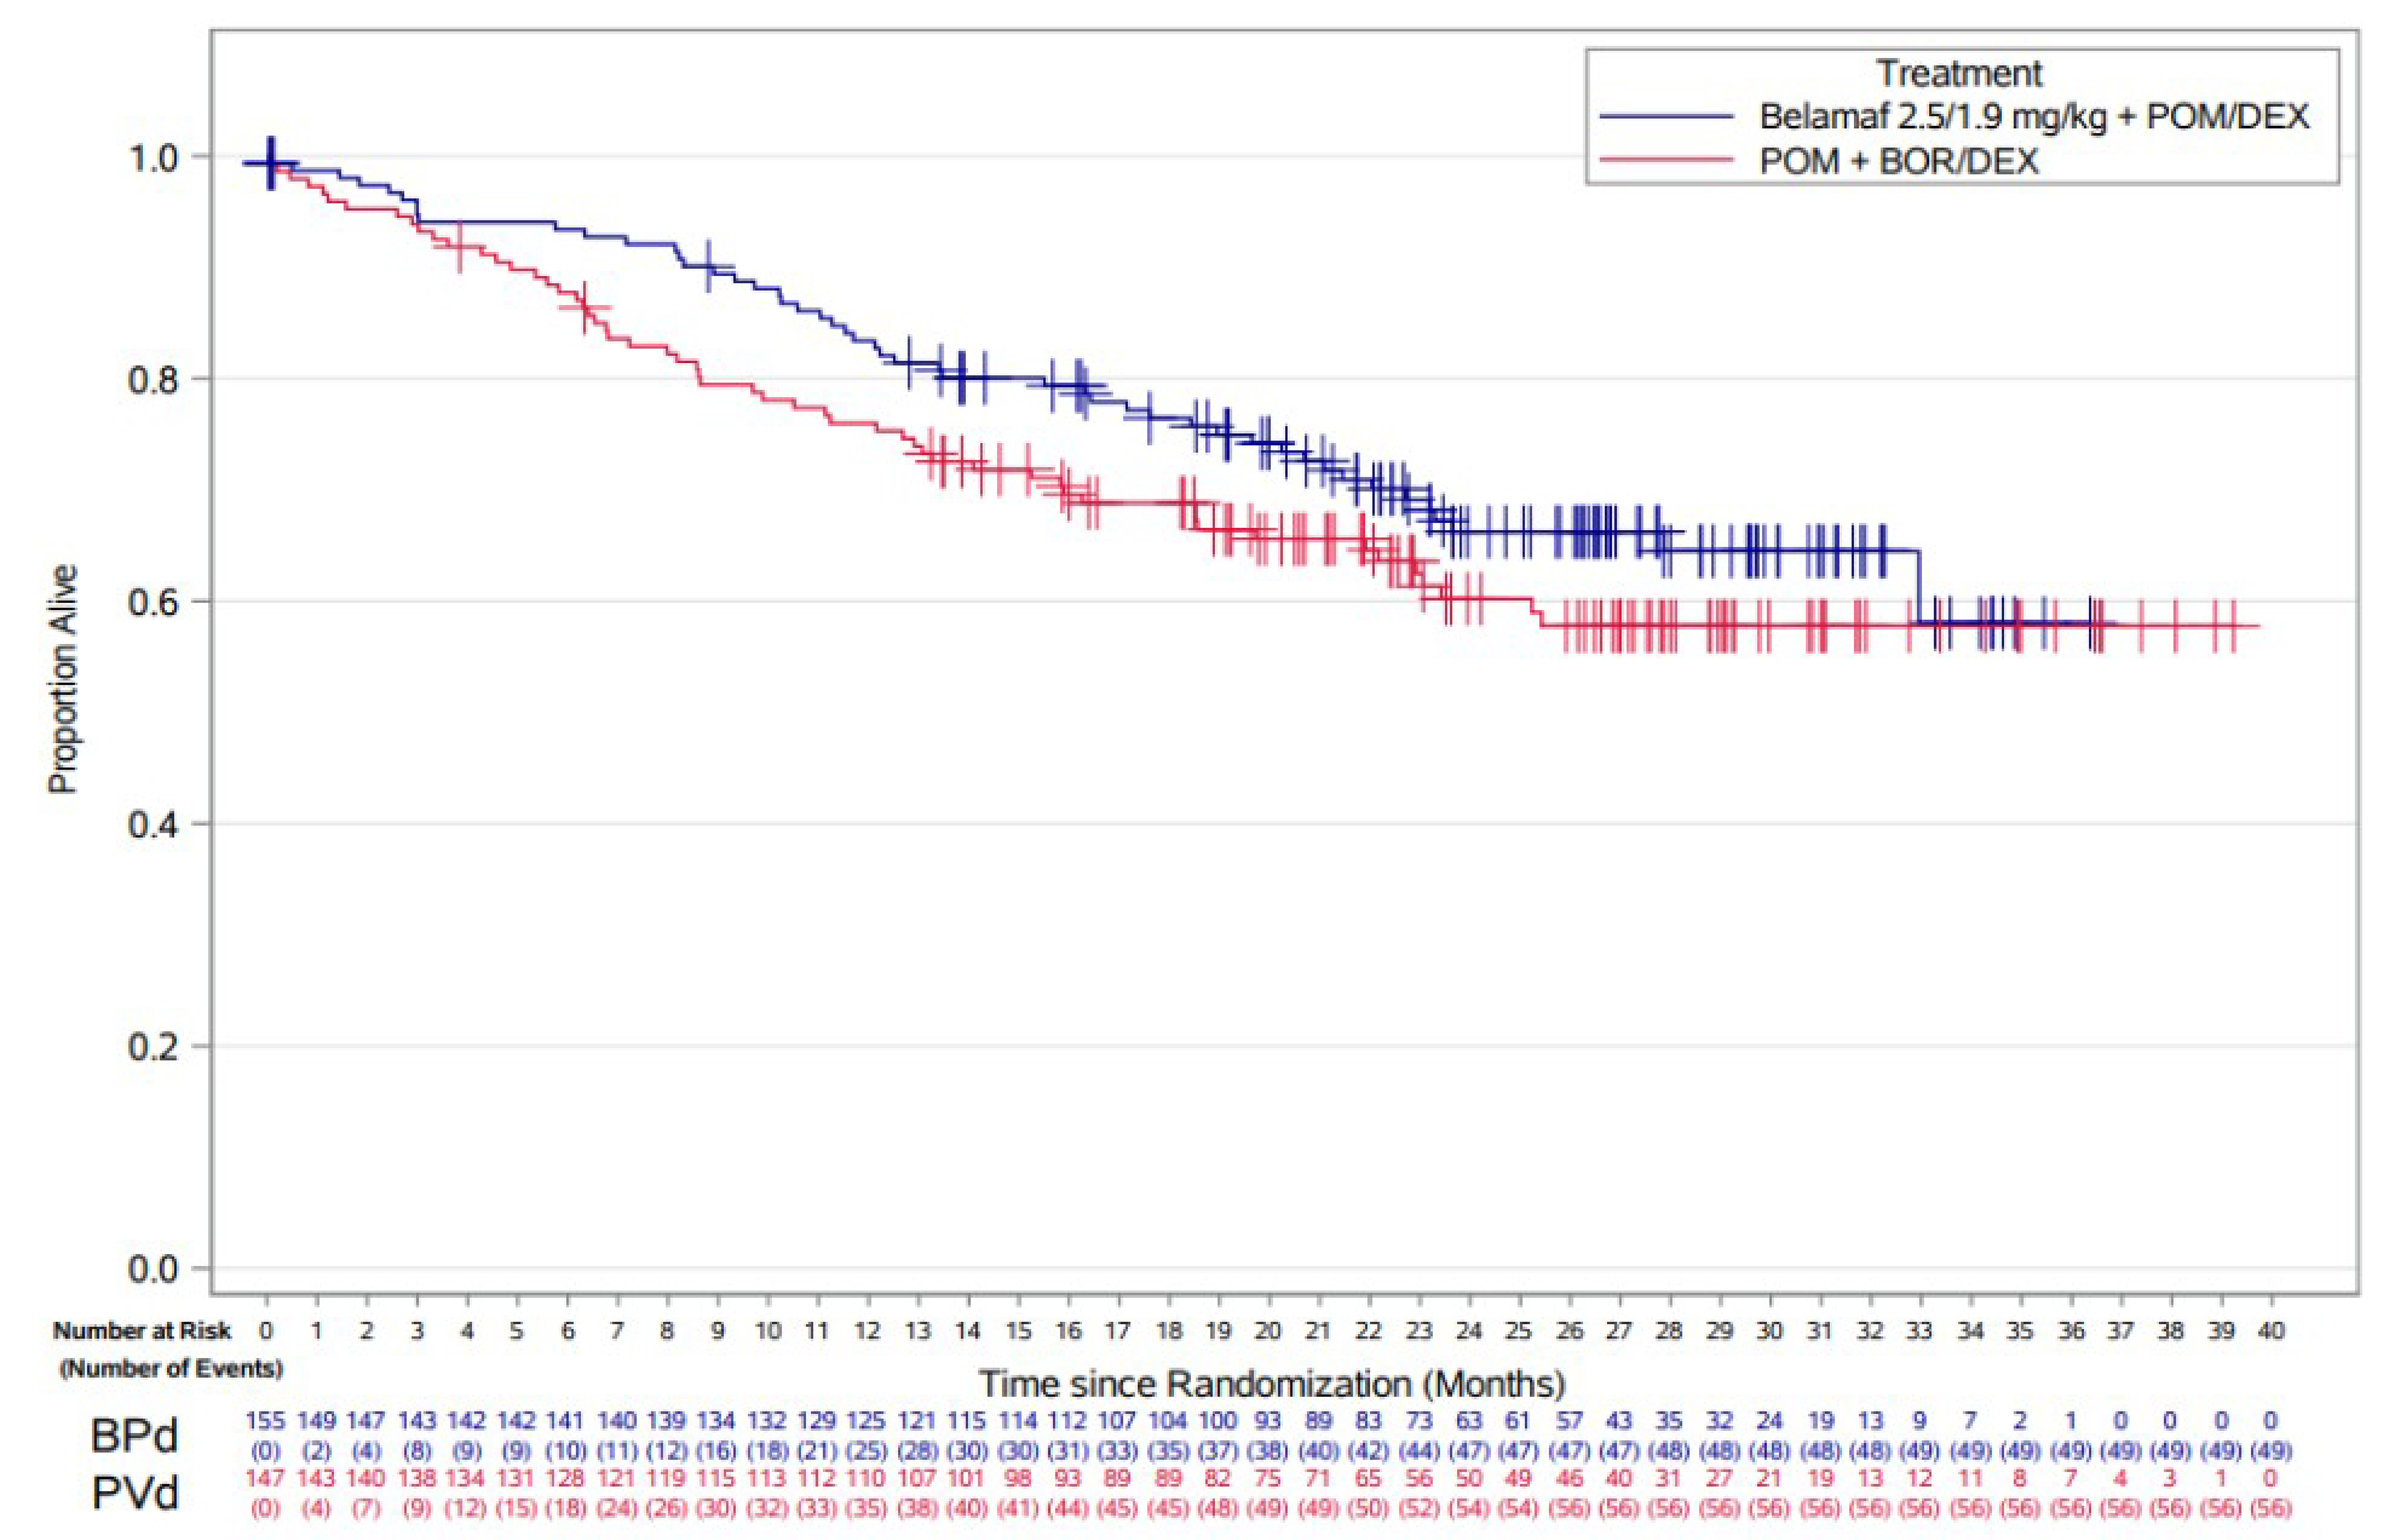
Belamaf = belantamab mafodotin; BOR = bortezomib; BPd = belantamab mafodotin, pomalidomide, and dexamethasone; DEX = dexamethasone; IRC = independent review committee; ITT = intention to treat; KM = Kaplan-Meier; OS = overall survival; POM = pomalidomide; PVd = pomalidomide, bortezomib, and dexamethasone.
Data cut-off date: January, 29, 2024.
Source: Sponsor’s Summary of Clinical Evidence.22
European Organisation for Research and Treatment of Cancer Quality of Life Questionnaire Core 30At least 50% of participants in both treatment arms were on treatment during the initial 12 months and, therefore, had regular assessments every 4 weeks; hence, the dataset is more complete during this period.19 At week 53, 28 of 82 patients with assessments (34%) in the BPd group had an improvement of at least 10 points on the EORTC QLQ C30 GHS, compared with 14 of 60 patients (23%) in the PVd group. Small sample sizes and more infrequent assessments (every 12 weeks in participants who had discontinued treatment) at later points limit the interpretation of the data.
The EORTC QLQ-C30 GHS quality of life domain, physical domain, role functioning domain, and fatigue domain remained stable across both treatment arms over time (Figure 8):19
Figure 8: Plot of LS Mean (95% CI) Change from Baseline of EORTC QLQ-C30 GHS Scores (ITT Population)
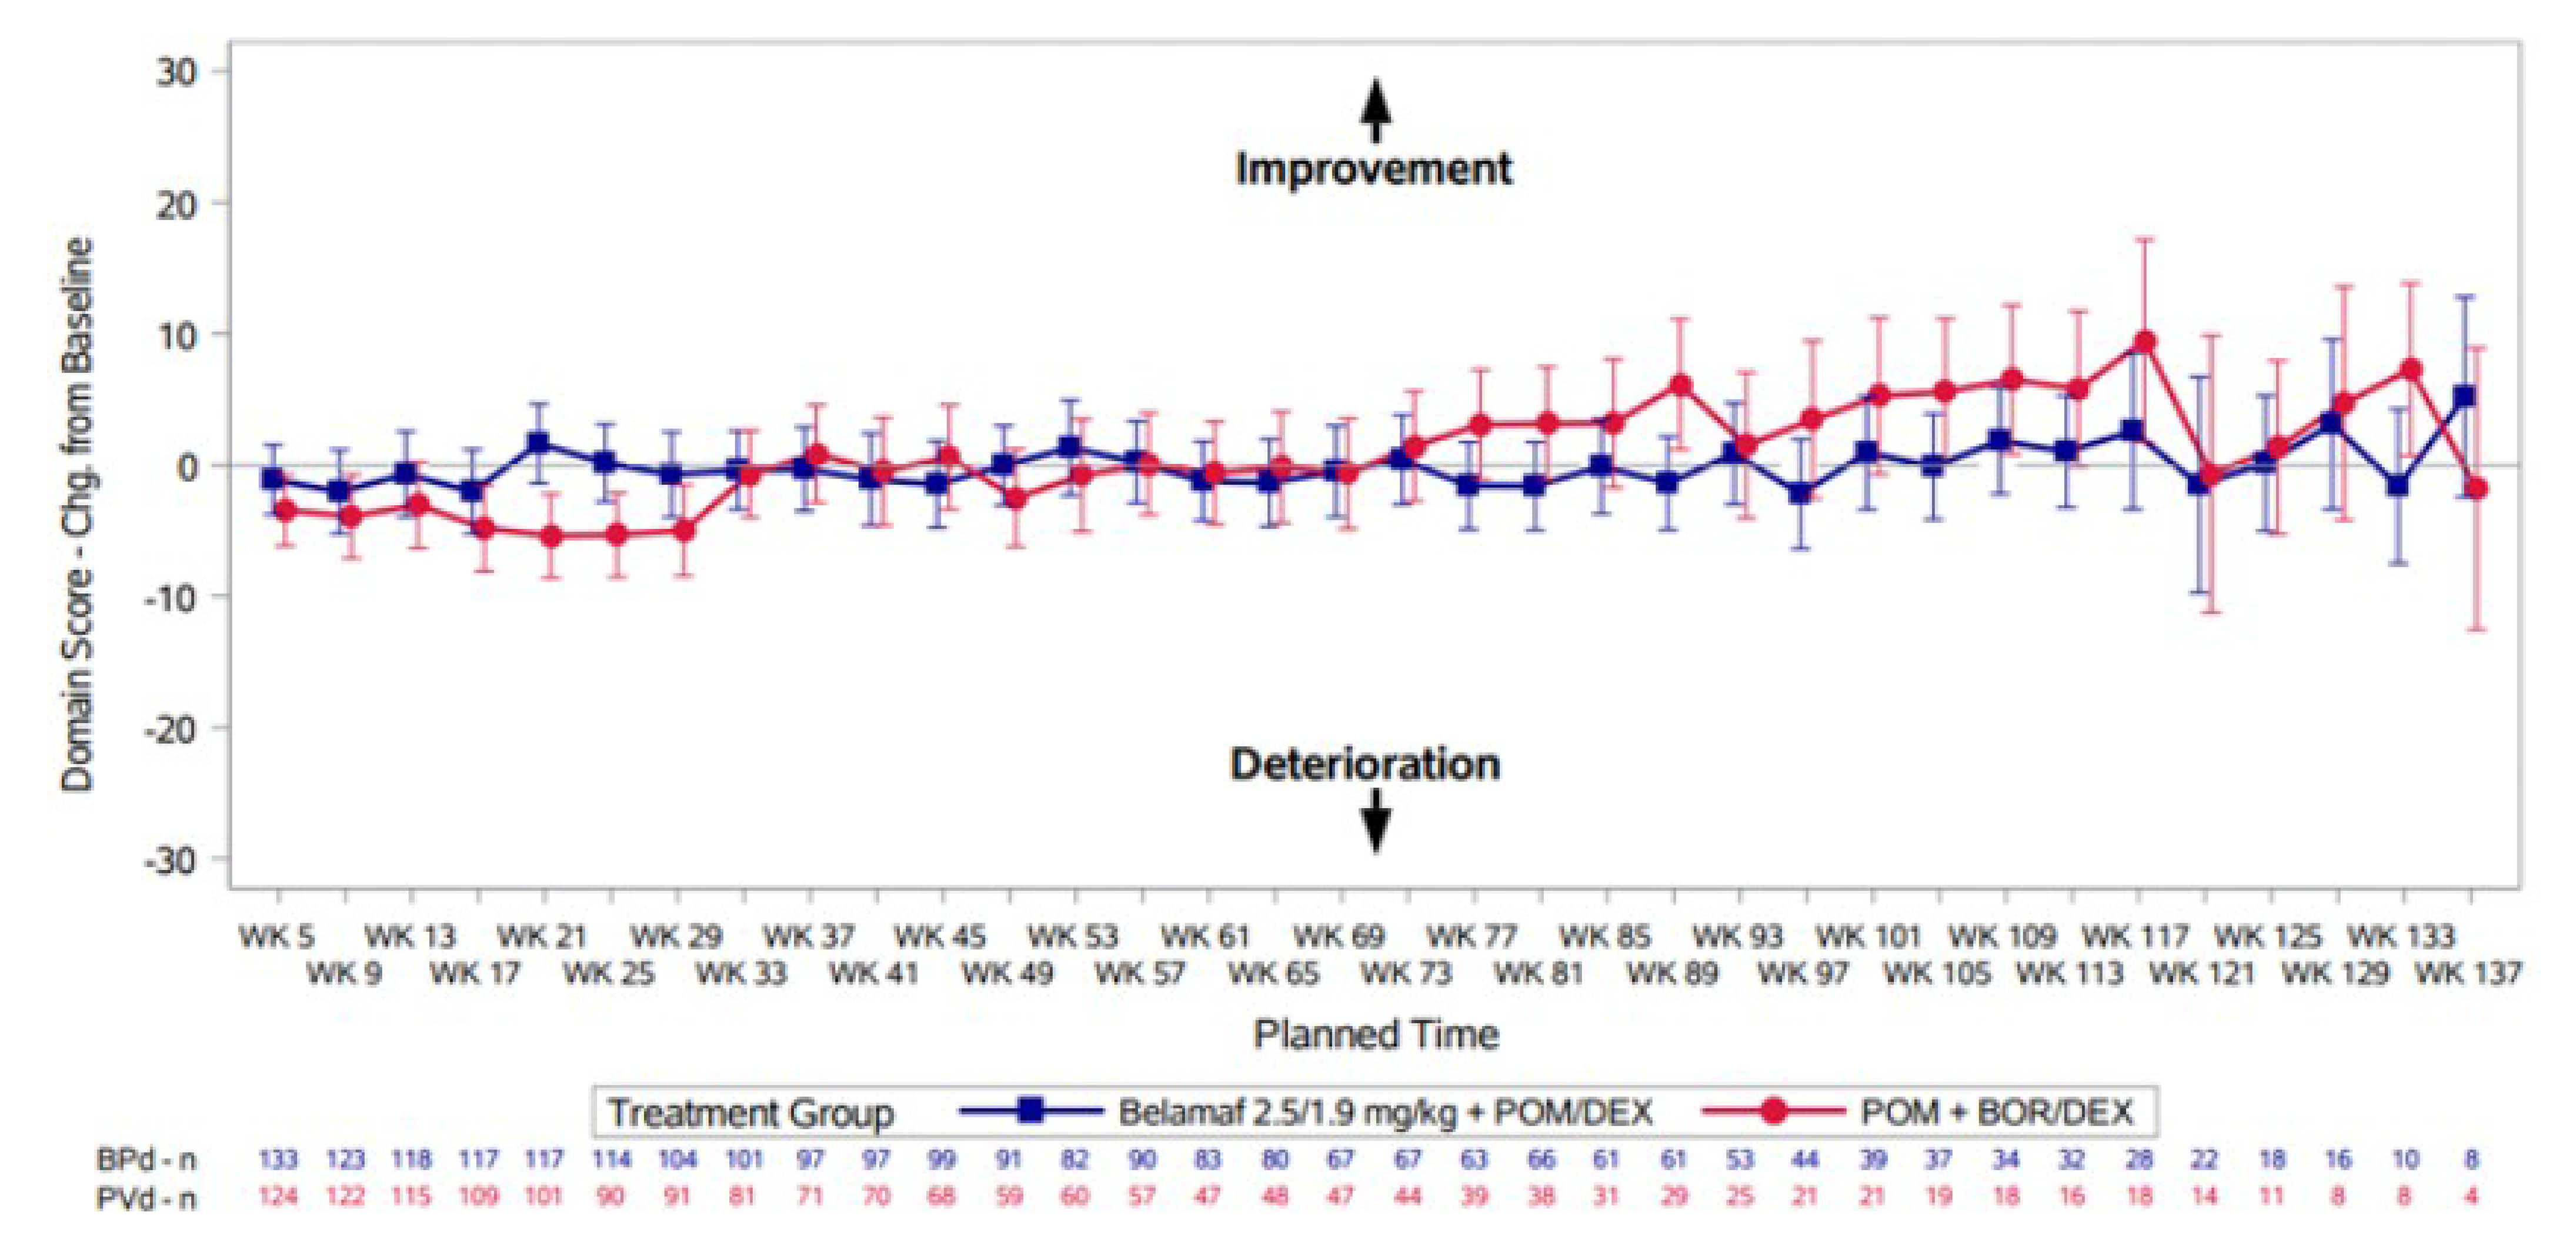
Belamaf = belantamab mafodotin; BOR = bortezomib; BPd = belantamab mafodotin, pomalidomide, and dexamethasone; CI = confidence interval; DEX = dexamethasone; EORTC QLQ-C30 = European Organisation for Research and Treatment of Cancer Quality of Life Questionnaire Core 30; GHS = global health status; ITT = intention to treat; LS =least squares; POM = pomalidomide; PVd = pomalidomide, bortezomib, and dexamethasone; WK = week.
Notes: Analysis performed using a repeated measures model with covariates of treatment group, visit, baseline value, treatment by visit interactions, baseline value by visit interactions as fixed effects, and participant as a random effect.
Time points were only included if the number of participants with analyzable data at that time point was ≥ 10 in total across both treatments.
An autoregressive with heterogeneity covariance structure was used to estimate the within participant covariance.
Conventional Assessment of DOR
DOR was defined as the time from first documented evidence of PR or better until progressive disease or death due to any cause based on IRC assessment per IMWG criteria. The median DOR was not reached in the BPd arm (95% CI, 24.9 to not reached) and was 17.5 months (95% CI, 12.1 to 26.4) in the PVd arm. In the BPd arm, 66 (55%) participants with response had not progressed or died and had follow-up for PFS ongoing at the data cut-off date compared with 33 (31%) participants in the PVd arm.
MRD Negativity Rate
At the time of the primary analysis, the proportion of participants with a complete response (CR) or greater who achieved MRD negativity was higher in the BPd arm (37 of 155 patients, 24%) compared with the PVd arm (7 of 147 patients, 5%). The length of follow-up was not specifically reported for this outcome; however, it was reported as 21.8 months for PFS. Because the OS analysis was not statistically significant at the time of the PFS analysis data cut-off date, MRD negativity could not be formally tested at that time. Results of the MRD negativity analysis using investigator-confirmed response or in participants with very good partial response (VGPR) or better were consistent with the primary MRD analysis.
Complete Response Rate
There were 62 patients (40%) in the BPd group compared to 24 patients (16%) in the PVd group who had an IRC-assessed CR or better at the time this analysis was performed. The length of follow-up was not reported; however, it was reported as 21.8 months for PFS. No formal testing of this outcome was completed.
Table 17: Summary of Key Efficacy Results From DREAMM-8 Study (ITT population)
Variable | BPd (N = 155) | PVd (N = 147) |
|---|---|---|
PFS | ||
Number of participants, n (%) | ||
Progressed or died (event) | 62 (40) | 80 (54) |
Censored, follow-up ended | 25 (16) | 34 (23) |
Event, n (%) | ||
Disease progression | 46 (30) | 66 (45) |
Death | 16 (10) | 14 (10) |
Estimates for time variable (months)a | ||
Median (95% CI) | NR (20.6, NR) | 12.7 (9.1, 18.5) |
HRb – Stratification factors and covariates | Estimate (95% CI); P value | |
Stratification factors: A and B assessed per IVRS strata | 0.52 (0.37, 0.73); P < 0.001 | |
OS | ||
Number of participants, n (%) | ||
Died (event) | 49 (32) | 56 (38) |
Censored, follow-up ended | 12 (8) | 7 (5) |
Censored, follow-up ongoing | 94 (61) | 84 (57) |
Event, n (%) | ||
Death | 49 (32) | 56 (38) |
Estimates for time variable (months)a | ||
Median (95% CI) | NR (33.0, NR) | NR (25.2, NR) |
HRb – Stratification factors and covariates | Estimate (95% CI); P value | |
Number of lines of prior therapy (1 vs. 2 or 3 vs. ≥ 4) and prior bortezomib use (yes or no) assessed according to IVRS strata | 0.77 (0.53, 1.14); P = 0.095 | |
Number of lines of prior therapy (1 vs. 2 or 3 vs. ≥ 4) and prior bortezomib use (yes or no) assessed according to electronic case report form strata | 0.78 (0.53, 1.15); P = 0.102 | |
BPd = belantamab mafodotin, pomalidomide, and dexamethasone; CI = confidence interval; CR = complete response; DOR = duration of response; HR = hazard ratio; MRD = minimal residual disease; NR = not reached; OS = overall survival; PFS = progression-free survival; PVd = pomalidomide, bortezomib, and dexamethasone; SAP = statistical analysis plan; vs. = versus.
aCIs for time variables estimated using the Brookmeyer Crowley method.
bHRs were estimated using a Cox proportional hazards model with stratification factors and covariates according to the corresponding footnote.
Source: Details included in the table are from the sponsor’s Summary of Clinical Evidence.22
Figure 9: Subgroup Analyses — PFS Based on IRC-Assessed Response in DREAMM-8 Study (ITT Population)
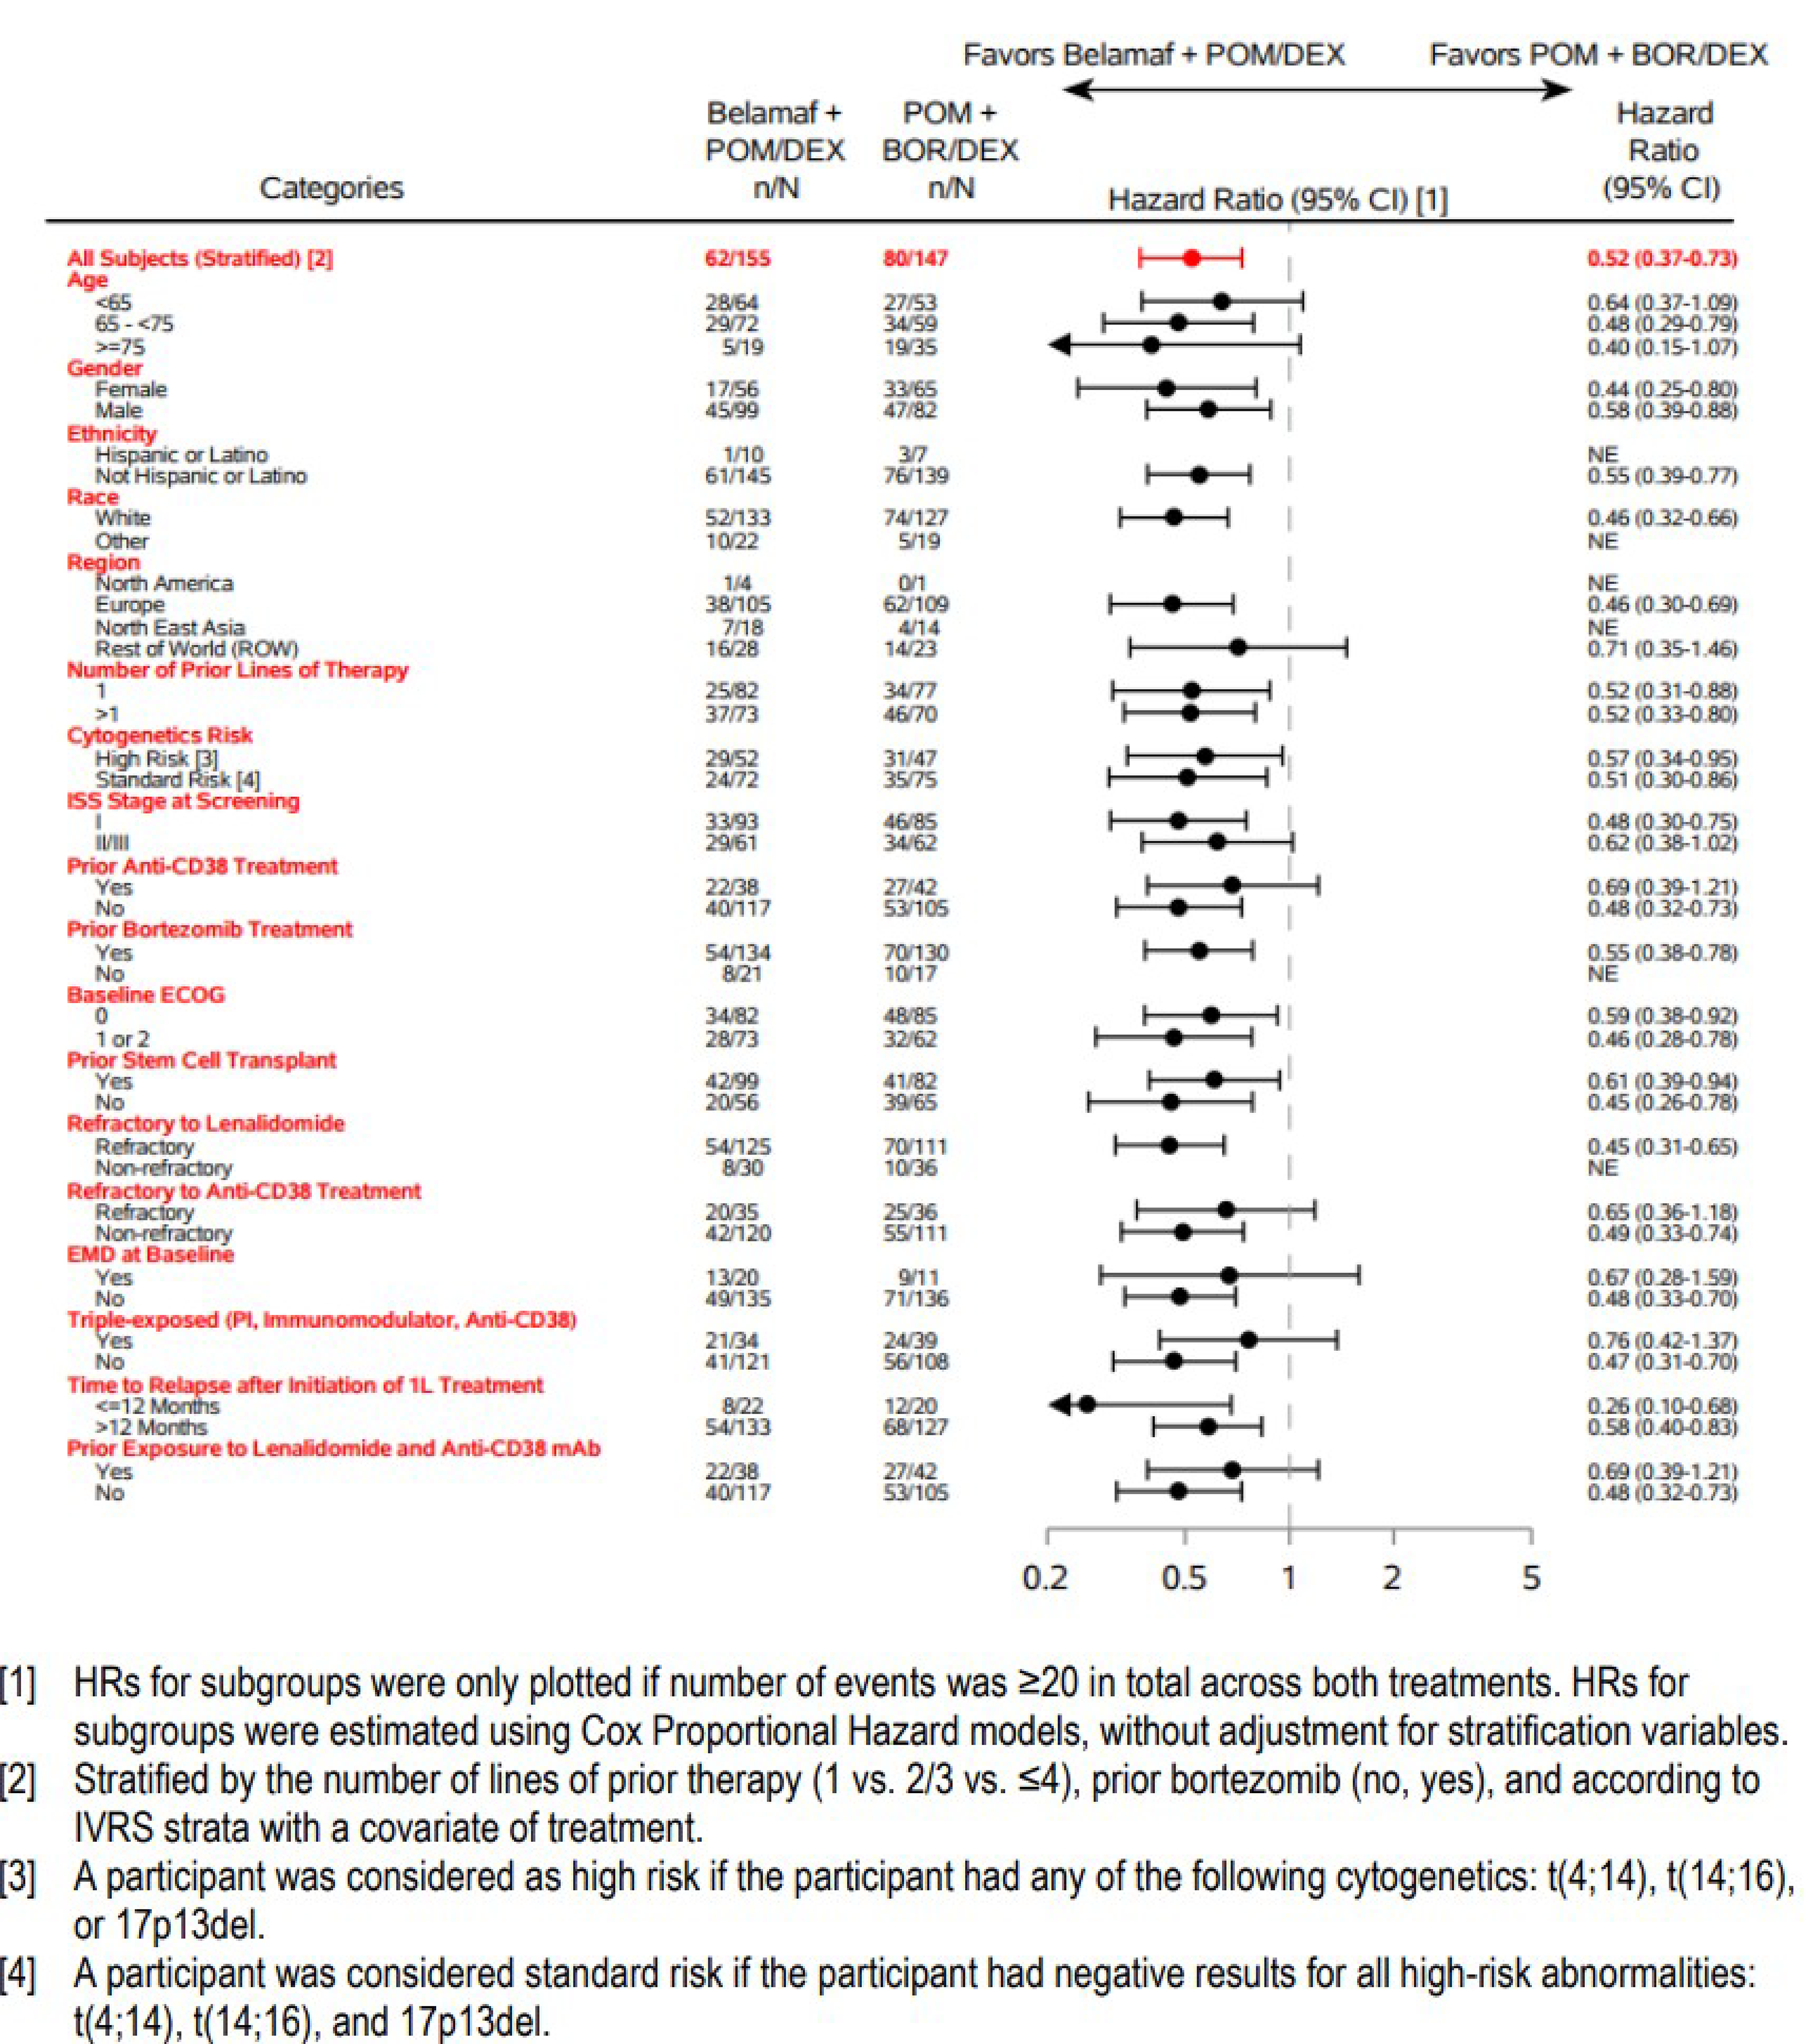
Belamaf = belantamab mafodotin; BOR = bortezomib; BPd = belantamab mafodotin, pomalidomide, and dexamethasone; CI = confidence interval; DEX = dexamethasone; ECOG = Eastern Cooperative Oncology Group; EMD = extramedullary disease; HR = hazard ratio; IRC = independent review committee; ITT = intent; PFS = progression-free survival; POM = pomalidomide; PVd = pomalidomide, bortezomib, and dexamethasone; vs. = versus.
Note: Data cut-off date: January 29, 2024.
Source: Sponsor’s Summary of Clinical Evidence.22
Harms
Refer to Table 18 for harms data.
Adverse Events
Overall, 149 patients (more than 99%) in the BPd group and 139 patients (96%) in the PVd group had at least 1 AE, and 136 patients (91%) in the BPd group and 106 patients (73%) in the PVd group had a grade 3 or 4 AEs. The 3 most frequent AEs, all more common in BPd than PVd, included vision blurred (119 patients [79%] versus 22 patients [15%]), dry eye (91 patients [61%] versus 14 patients [10%]), and foreign body sensation in eyes (91 patients [61%] versus 9 patients [6%]). Under the category of infections and infestations, the AEs driving the differences, BPd versus PVd, were COVID-19 (56 patients [37%] versus 31 patients [21%]), upper respiratory tract infection (40 patients [27%] versus 25 patients [17%]), and pneumonia (36 patients [24%] versus 17 patients [12%]). For the system organ class of investigations, the difference was due to the contribution of both hematology and chemistry tests (Table 18).19
The most common grade 3 or higher AEs, all more common with BPd versus PVd, were neutropenia (63 patients [42%] versus 41 patients [28%]), thrombocytopenia (36 patients [24%] versus 29 patients [20%]), and pneumonia (26 patients [17%] versus 11 patients [8%]).19
Serious AEs
Overall, 95 patients (63%) in the BPd arm and 65 patients (45%) in the PVd arm had an SAE (Table 18). The exposure-adjusted incidence rate for SAEs was comparable between the 2 treatment arms (45.87 per 100 person-years versus 47.87 per 100 person-years, respectively).19 The most frequently reported SAE in both treatment arms was pneumonia, which occurred in ██ patients █████ in the BPd group and ██ patients ████ in the PVd group.
Withdrawals Due to AEs
The incidence of AEs leading to discontinuation of study treatment (any component of study treatment) was 15% (22 patients) with BPd and 12% (18 patients) with PVd (Table 18). There were no specific AEs leading to treatment discontinuation that occurred in more than 1% of patients.19 Keratopathy was a reason for treatment discontinuation in 2 patients (1%) in the BPd group and no patients in the PVd group.
Mortality
The incidence of fatal SAEs (related and not related to study treatment) was the same in the 2 treatment arms (11% in both BPd and PVd arms) (Table 18).19 The most common fatal SAE was COVID-19 pneumonia (3% [n = 5] in the BPd arm versus 1% [n = 2] in the PVd arm) and death due to unknown cause (0 in the BPd arm versus 2% [n = 3] in the PVd arm). All other fatal SAEs were reported in ≤ 1% of participants.19
Notable Harms
Ocular exams were performed regularly for all participants in both treatment arms throughout the study. They were performed more frequently in the BPd arm (every 4 weeks, then decreased to every 3 months if there were no significant ocular findings after the sixth dose) than in the PVd arm (every 6 months).19 Under the original trial protocol, all ocular symptoms and examination findings were to be reported as AEs and graded by the CTCAE criteria. Belantamab mafodotin dose modification was based on these assessments.
Ocular AEs (CTCAE grade) occurred in 89% of participants in the BPd arm. Vision blurred, dry eye, foreign body sensation in eyes, and eye irritation were each reported in50% or more of the participants in this treatment arm.19 The incidence of ocular AEs (CTCAE grade) in the PVd arm was lower (30%). The most frequently reported ocular AE in this treatment arm was vision blurred (15%). Grade 3 or 4 ocular AEs (CTCAE grade) were reported in more participants in the BPd arm (43%) than in the PVd arm (2%).19 The most common grade 3 or greater ocular AE, occurring more in the patients taking BPd than PVd, were blurred vision (26 patients [17%] versus none), reduced visual acuity (20 patients [13%] versus 1 patient [< 1%]), impaired vision ███ ████████ █████ ██ █ ███████ ██████, corneal epithelial microcysts and dry eye (12 patients each [8%] versus none), cataract (9 patients [6%] versus 6 patients [4%]), foreign body sensation (9 patients [6%] versus none) and punctate keratitis (9 patients [6%] versus 1 patient [< 1%]).
Table 18: Summary of Harms Results From DREAMM-8 Study (Safety Population)
AEs | BPd (n = 150) | PVd (n = 145) |
|---|---|---|
AEs | ||
≥ 1 AE | 149 (> 99) | 139 (96) |
Grade 3 or 4 AEs | 136 (91) | 106 (73) |
Specific AEs, occurring in at least 20% of patients, either group | ||
Vision blurred | 119 (79) | 22 (15) |
Dry eye | 91 (61) | 14 (10) |
Foreign body sensation in eyes | 91 (61) | 9 (6) |
Eye irritation | 75 (50) | 13 (9) |
Neutropenia | 72 (48) | 50 (34) |
Photophobia | 66 (44) | 6 (4) |
COVID-19 | 56 (37) | 31 (21) |
Thrombocytopenia | 54 (36) | 44 (30) |
Eye pain | 49 (33) | 7 (5) |
Cataract | 40 (27) | 15 (10) |
Fatigue | 40 (27) | 32 (22) |
Upper respiratory tract infection | 40 (27) | 25 (17) |
Pneumonia | 36 (24) | 17 (12) |
Anemia | 35 (23) | 38 (26) |
Diarrhea | 35 (23) | 33 (23) |
Corneal epithelial microcystsa | 34 (23) | 0 |
Punctate keratitisa | 34 (23) | 1 (< 1) |
Visual acuity reduceda | 34 (23) | 8 (6) |
Neutrophil count decreased | 31 (21) | 19 (13) |
Platelet count decreased | 30 (20) | 22 (15) |
Constipation | 23 (15) | 33 (23) |
Neuropathy peripheral | 11 (7) | 34 (23) |
Specific grade 3 or greater AEs, 5% or more of patients | ||
Blood and lymphatic system disorders | 77 (51) | 61 (42) |
Neutropenia | 63 (42) | 41 (28) |
Thrombocytopenia | 36 (24) | 29 (20) |
Anemia | 15 (10) | 19 (13) |
Infections and infestations | 73 (49) | 38 (26) |
Pneumonia | 26 (17) | 11 (8) |
COVID-19 pneumonia | 16 (11) | 6 (4) |
COVID-19 | 10 (7) | 3 (2) |
Investigations | 52 (35) | 37 (26) |
Neutrophil count decreased | 31 (21) | 18 (12) |
Platelet count decreased | 22 (15) | 18 (12) |
General disorders and administration site conditions | 19 (13) | 23 (16) |
Fatigue | 9 (6) | 7 (5) |
Asthenia | 3 (2) | 7 (5) |
SAEs | ||
Patients with ≥ 1 SAE, n (%) | 95 (63) | 65 (45) |
Specific SAEs occurring in 5% of patients, either group | ||
Pneumonia | ██ ████ | ██ ███ |
COVID-19 pneumonia | 17 (11) | 6 (4) |
COVID-19 | 10 (7) | 4 (3) |
Neutropenia | 9 (6) | 4 (3) |
Withdrawals due to AEs | ||
Patients who stopped | 22 (15) | 18 (12) |
Specific AEs that occurred in more than 1 patient, either group | ||
Fatigue | 2 (1) | 1 (< 1) |
Keratopathya | 2 (1) | 0 |
Muscular weakness | 2 (1) | 1 (< 1) |
Neuralgia | | ███ | || |
AEs leading to dose reduction | 92 (61) | 88 (61) |
AEs leading to dose interruption or delay | 136 (91) | 109 (75) |
Mortality | ||
Patients who died | 17 (11) | 16 (11) |
Common causes, more than 1 patient in any group | ||
COVID-19 pneumonia | 5 (3) | 2 (1) |
COVID-19 | 2 (1) | 2 (1) |
Pneumonia | 2 (1) | 1 (< 1) |
Death | 0 | 3 (2) |
Sepsis | 0 | 2 (1) |
Notable harms | ||
Ocular disorders reported as grade 3 or greater AEs, n (%) | ||
Vision blurred | 26 (17) | 0 |
Visual acuity reduceda | 20 (13) | 1 (< 1) |
Visual impairmenta | ██ ████ | | ████ |
Corneal epithelial microcystsa | 12 (8) | 0 |
Dry eye | 12 (8) | 0 |
Cataract | 9 (6) | 6 (4) |
Foreign body sensation in eyes | 9 (6) | 0 |
Punctate keratitisa | 9 (6) | 1 (< 1) |
Corneal events (overall KVA grade) | 131 (87) | NA |
Grade 1 | 8 of 150 (5) | NA |
Grade 2 | 18 of 150 (12) | NA |
Grade 3 | 94 of 150 (63) | NA |
Grade 4 | 11 of 150 (7) | NA |
Corneal exam findingsb (individual KVA component) | 125 (83) | NA |
Grade 1 | 11 of 150 (7) | NA |
Grade 2 | 30 of 150 (20) | NA |
Grade 3 | 75 of 150 (50) | NA |
Grade 4 | 9 of 150 (6) | NA |
BCVA eventsb (individual KVA component) | 127 (85) | NA |
Grade 1 | 13 of 150 (9) | NA |
Grade 2 | 35 of 150 (23) | NA |
Grade 3 | 76 of 150 (51) | NA |
Grade 4 | 3 of 150 (2) | NA |
Any thrombocytopenia | 54 (36) | 44 (30) |
Grade 3 and 4 thrombocytopenia | 36 (24) | 29 (20) |
Any platelet count decreased | 30 (20) | 22 (15) |
Grade 3 and 4 platelet count decreased | 22 (15) | 18 (12) |
IRR AESIs | 11 (7) | NA |
Asthenia | 1 (< 1) | NA |
Dermatitis allergic | 1 (< 1) | NA |
Diarrhea | 1 (< 1) | NA |
Dyspnea | 1 (< 1) | NA |
Fatigue | 1 (< 1) | NA |
Headache | 1 (< 1) | NA |
IRR | 1 (< 1) | NA |
Nausea | 1 (< 1) | NA |
Pyrexia | 1 (< 1) | NA |
Tremor | 1 (< 1) | NA |
Urticaria | 1 (< 1) | NA |
AE = adverse event; AESI = adverse event of special interest; BCVA = best corrected visual acuity; BPd = belantamab mafodotin, pomalidomide, and dexamethasone; KVA = Keratopathy and Visual Acuity; IRR = infusion-related reaction; NA = not applicable; PVd = pomalidomide, bortezomib, and dexamethasone; SAE = serious adverse event.
Notes: System organ classes are presented by descending order by the number of participants in the BPd arm.
Treatment-related corneal events (corneal exam findings and changes in BCVA) were graded according to the guidelines of the KVA scale to inform dose modifications, including during and after treatment. An event is any KVA grade ≥ 1.
Investigator-reported KVA scale events are reported for assessments performed under Protocol Amendment 1 or later.
aThe percentage of these AEs may not reflect the true incidence of these events, as the reporting guidance of ocular events was changed after Protocol Amendment 1.
bIndividual corneal exam findings and BCVA events displayed by maximum grade may not have a temporal correlation.
Source: Details included in the table are from the sponsor’s Summary of Clinical Evidence.22
Critical Appraisal
Internal Validity
Randomization in the DREAMM-8 study appears to have been performed centrally using appropriate methodology. Stratification was performed using 3 different factors (i.e., number of prior lines of therapy, prior bortezomib use, and prior anti-CD38 use), although Protocol Amendment 1 changed the third stratification factor from ISS status to prior anti-CD38 use. Although there were some imbalances between groups in baseline characteristics (e.g., extramedullary disease, IgA, and previous stem cell transplants), the clinical expert believed that, in general, these imbalances would be more likely to bias against BPd than in favour of BPd, if they were to have any effect at all. Patients in the BPd group were offered prophylactic measures, including cooling masks, artificial tears, and corticosteroid eye drops (as needed, ordered by an eye care specialist) to reduce the risk of ocular AEs. This may have biased results, understating the risk of ocular AEs for BPd relative to PVd.
A hierarchical testing procedure was performed for multiplicity control, with PFS to be tested first, then OS, then MRD negativity. In the original protocol, DOR was to be tested after MRD negativity; however, after Protocol Amendment 3, DOR was dropped from the hierarchy. The sponsor also planned for testing of PFS at IA2, and if PFS was deemed statistically significant, no further testing of PFS was to be performed at IA3. Given the immaturity of the data, it is too early to determine whether this multiple testing procedure was adhered to; however, the plan for testing at various interim analyses does appear to have been followed.
The DREAMM-8 study was an open-label study. Although knowledge of treatment assignment could potentially bias assessment of outcomes such as PFS and ORR, the risk of this occurring was mitigated by the use of a blinded IRC to assess disease progression and response. Although a lack of blinding is less likely to have directly impacted patient response to treatment for hard clinical outcomes such as OS, PFS, and ORR, it is possible that patient-reported outcomes such as HRQoL may have been biased by patients knowing the treatment to which they were assigned. Reporting of AEs may also have been biased by patients knowing their assigned treatment. Even with blinding, the high incidence of ocular AEs and the obvious nature of these symptoms would have made it easy for patients to determine their assigned group.
HRQoL was assessed using the EORTC QLQ-C30, among other instruments. The EORTC QLQ-C30 is a validated, well-established instrument used to assess HRQoL in patients living with cancer. There are several estimates of the MID for the EORTC QLQ-C30, ranging between 6.2 and 17.3, depending on the scale used. The sponsor arrived at an MID of 10 or more for all EORTC QLQ-C30 domains. This seemed to be a reasonable estimate according to the clinical expert. In addition to the lack of blinding, which may have biased results in the DREAMM-8 study, interpretation of HRQoL scores was also impacted by the significant amount of missing data. There were missing data from the very beginning, at baseline, as only 141 of 155 patients in the BPd group and 139 of 147 patients in the PVd group reported scores on the EORTC QLQ-C30 GHS domain, for example. Missing data were not solely due to patient attrition. The loss of data continued, as at week 25 only 114 of 155 patients (74%) in the BPd group reported scores, and 90 of 147 patients (61%) in the PVd group. By week 53, this dropped further to 82 of 155 patients (53%) in the BPd group and 60 of 147 patients (41%) in the PVd group. Although study attrition is likely the major contributor to this large amount of missing data, this likely means that those patients who were healthiest are the ones being sampled for their HRQoL, potentially leading to inflated scores and response bias.
Although the number of patients who discontinued study was relatively low (less than 10%) and did not differ notably between BPd and PVd groups, there was a large proportion of patients who discontinued study treatment, with fewer patients discontinuing in the BPd group than in the PVd group (64% versus 79%). This difference between groups in patients discontinuing the study drug was accounted for by the difference in patients discontinuing due to progressive disease (28% versus 48%). This is consistent with the efficacy results of the trial, where there was a large difference in PFS between the 2 groups. The proportion of patients who discontinued the study drug due to AEs was identical between groups (16% in each), despite the large difference between groups in the number of ocular AEs. Patients who discontinued treatment were allowed to switch to a next line of therapy and remain in the study. Follow-up antimyeloma therapy was initiated in 27% of patients in the BPd group and 52% of patients in the PVd group. Although this is a common and accepted practice in oncology trials, this is a confounder when trying to assess OS data, as it is difficult to determine to what extent a patient’s extended survival is attributable to the study drug and how much is due to their subsequent therapy. It is unclear whether this difference between groups in the number of patients who went on to subsequent treatment biases results for or against the study drug or has any clear impact. The use of subsequent therapies is less likely to have impacted assessment of PFS, as most patients who went on to subsequent therapies did so because of a progression event. Therefore, they were perhaps already counted in the PFS analysis and, therefore, would not have influenced the PFS estimates. The difference in treatment discontinuations also complicates assessment of harms, as exposure to BPd was much longer than exposure to PVd. For example, total median duration of exposure to belantamab mafodotin was 13.2 months and pomalidomide was 15.9 months in the BPd group, while median exposure to bortezomib was 7.6 months and pomalidomide was 8.5 months in the PVd group. Although there were more patients who experienced an SAE in the BPd group than in PVd group (63% versus 45%, respectively), the exposure-adjusted incidence rate was 45.87 per 100 person-years in the BPd group and 47.87 per 100 person-years in the PVd group.
The DREAMM-8 study appears to have been adequately powered based on the targeted enrolment of 300 patients. The rationale for the estimates used for their power calculations were provided and seemed reasonable. The ITT population (all randomized patients, regardless of whether they received treatment) was used for the primary analysis. This is considered to be the most appropriate way to carry out analysis of efficacy outcomes. A modified ITT population was used to carry out various sensitivity analyses of efficacy outcomes, which were all supportive of the overall findings. The main differences between the modified ITT population and ITT were that the modified ITT excluded patients who were never treated as well as excluding patients who received the wrong drug (i.e., received bortezomib instead of belantamab mafodotin), representing less than 3% of the study population. Data were reported for a variety of prespecified subgroups of interest for this review, for the primary outcome of PFS. Although HR with 95% CIs were reported for each subgroup with 20 or more patients, imbalances between groups may exist, apart from those used the stratified randomization. No formal hypothesis testing and no tests for interaction were performed. Therefore, subgroup analyses should be viewed as supportive evidence for the overall primary efficacy of BPd versus PVd on PFS.
External Validity
The clinical expert believed that the patients included in the DREAMM-8 study were representative of patients who would be expected to receive this drug in Canada. The clinical expert did note that patients with plasma cell leukemia or symptomatic amyloidosis would likely be treated for MM with these types of therapies, despite being excluded from the DREAMM-8 study. There were very few patients (3%) who had an ECOG performance status score of 2 in the DREAMM-8 study, and the clinical expert indicated that they would likely treat these patients with belantamab mafodotin. Most patients in the DREAMM-8 study had only 1 prior line of therapy (53%), and only 14% had 4 or more prior lines; however, the clinical experts believe that BPd is more likely to be used in early relapse rather than in these later lines.
The clinical expert noted that the dosing of bortezomib is slightly different in the DREAMM-8 study (twice weekly) than it is in some parts of Canada (once weekly). The clinical expert did not consider this as an important generalizability issue. This is done in some jurisdictions in Canada because the 2 regimens, a higher dose weekly or a lower dose twice weekly, are seen as equivalent, and once weekly dosing is used for convenience. Patients in the BPd group were offered various measures to reduce the risk of ocular (corneal) AEs, including the use of a cooling mask, artificial tears, and potentially corticosteroid eyedrops. It is unclear whether these measures will become part of common practice when BPd is used in the community. If this is not the case, then this is a generalizability issue.
HRQoL was identified by patients and the clinical experts as an important outcome in patients with MM; however, this outcome was not formally assessed for between-group differences in the DREAMM-8 study, which should be considered a limitation of this trial. Data for OS are not yet mature; therefore, no conclusions can be drawn about the impact of BPd on OS compared with PVd, which should also be considered a limitation of this trial. PFS, which was the primary outcome of the DREAMM-8 study, is a widely used surrogate for OS, and is frequently used as a primary outcome in pivotal trials, consistent with FDA guidance.
GRADE Summary of Findings and Certainty of the Evidence
Methods for Assessing the Certainty of the Evidence
For pivotal studies and RCTs identified in the sponsor’s systematic review, GRADE was used to assess the certainty of the evidence for outcomes considered most relevant to inform expert committee deliberations. A final certainty rating was determined as outlined by the GRADE Working Group:20,21
High certainty: We are very confident that the true effect lies close to that of the estimate of the effect.
Moderate certainty: We are moderately confident in the effect estimate. The true effect is likely to be close to the estimate of the effect, but there is a possibility that it is substantially different. We use the word “likely” for evidence of moderate certainty (e.g., “X intervention likely results in Y outcome”).
Low certainty: Our confidence in the effect estimate is limited. The true effect may be substantially different from the estimate of the effect. We use the word “may” for evidence of low certainty (e.g., “X intervention may result in Y outcome”).
Very low certainty: We have very little confidence in the effect estimate. The true effect is likely to be substantially different from the estimate of effect. We describe evidence of very low certainty as “very uncertain.”
For RCTs: Following the GRADE approach, evidence from RCTs started as high-certainty evidence and could be rated down for concerns related to study limitations (which refers to internal validity or risk of bias), inconsistency across studies, indirectness, imprecision of effects, and publication bias.
When possible, certainty was rated in the context of the presence of an important (nontrivial) treatment effect. If that was not possible, certainty was rated in the context of the presence of any treatment effect (i.e., the clinical importance is unclear). In all cases, the target of the certainty of evidence assessment was based on the point estimate and where it was located relative to the threshold for a clinically important effect (when a threshold was available) or to the null. The MID for PFS and OS were obtained by asking the clinical experts for their impression of what it should be. For PFS, the clinical experts suggest that a 10% difference between groups would be considered clinically significant, while for OS they suggested it should be 5% because any gain in survival would be considered clinically meaningful to patients. For HRQoL, an MID of 10 points was identified by the sponsor as clinically significant, and the clinical experts agreed that this seemed reasonable. However, given the challenges in trying to identify 1 specific time point in which to assess response to the EORTC QLQ-C30 given the constant attrition over the course of the study, it was decided that instead of seeking 1 specific target of certainty, an overall impression of the direction of effect over time would be ascertained.
Results of GRADE Assessments
Table 2 presents the GRADE summary of findings for BPd versus PVd.
Indirect Evidence
Contents within this section have been informed by materials submitted by the sponsor. The following has been summarized and validated by the review team.
Objectives for the Summary of Indirect Evidence
In the absence of direct comparative data for BPd compared with other relevant comparators used in clinical practice (DVd, IsaKd, IsaPd, Kd, Pd, SVd, bortezomib plus dexamethasone (Vd), and cyc-doublets (i.e., cyclophosphamide in combination with another medication) in the treatment of patients with r/r MM, the sponsor conducted an ITC using a network meta-analysis (NMA) to assess the comparative efficacy of BPd in a population of patients with prior lenalidomide exposure compared with the previously mentioned relevant comparators. The objective of this section is to summarize and critically appraise the sponsor-submitted ITC evidence comparing BPd with other relevant comparators in Canadian settings.
Description of Indirect Comparisons
ITC Design
Objectives
The primary objective of the sponsor-submitted NMA was to assess the comparative efficacy of BPd in a population of patients with prior lenalidomide exposure versus relevant comparators with respect to PFS and OS. The secondary objective of the NMA was to assess the comparative efficacy of BPd in a subpopulation of patients whose disease was lenalidomide-refractory relative to comparators for the same outcomes (i.e., PFS and OS).
Study Selection Methods
A systematic literature review (SLR) was conducted in December 2021 and subsequently updated in January 2024 to identify all relevant efficacy and safety data for therapies used in the second-line or later for r/r MM. A summary of parameters applied to conduct the SLR is provided in Table 19.
Table 19: Study Selection Criteria and Methods of SLR
Characteristics | SLR selection criteria |
|---|---|
Population | Adults (aged ≥ 18 years) with documented r/r MM, previously treated with lenalidomide, at least one prior LoT, and with documented disease progression during or after most recent therapy |
Intervention | Any treatment or combination of treatments, including but not restricted to:
|
Comparators |
|
Outcome | Efficacy outcomes, including but not restricted to:
Safety outcomes, including but not restricted to:
|
Study designs | Primary and post hoc analyses of RCTs |
Publication characteristics |
|
Exclusion criteria | |
Population |
|
Intervention |
|
Comparators |
|
Outcomes |
|
Study design |
|
Publication type |
|
Language |
|
Time frame |
|
Databases searched |
|
Selection process | Titles and abstracts identified by the search strategy were independently assessed for possible eligibility by 2 reviewers. Those studies that did not meet eligibility criteria were excluded. For those citations that were deemed potentially relevant, full texts were retrieved, and eligibility criteria applied. Any discrepancies between the 2 reviewers were resolved by a third reviewer. |
Data extraction process | Data from included studies were extracted into a comprehensive data extraction grid in Microsoft Excel. Initial data extraction was performed by a single reviewer, and quality checked for accuracy by a second reviewer. If any discrepancies existed, these were resolved by a third reviewer. |
Quality assessment | Risk of bias assessment was conducted using the Revised Cochrane Risk of Bias tool for individually randomized parallel group trials (RoB 2).57 |
2L+ = second line or more; AE = adverse event; ADC = antidrug conjugate; ASCT = autologous stem cell transplant; CR = complete response; CRS = cytokine release syndrome; DOR = duration of response; HDAC = histone deacetylase; HLH/MAS = hemophagocytic lymphohistiocytosis/macrophage activation syndrome; ICANS = immune cell-associated neurotoxicity syndrome; LoT = line of treatment; MR = minimal response; MRD = minimal residual disease; ORR = overall response rate; OS = overall survival; PFS = progression-free survival; PFS2 = progression-free survival on subsequent line of treatment; PI = proteasome inhibitor; PPS = postprogression survival; PR = partial response; RCT = randomized controlled trial; r/r MM = relapsed or refractory multiple myeloma; SAE = serious adverse event; sCR = stringent complete response;; SLR = systematic literature review; TRAE = treatment-related adverse event; TTBR = time to best response; TTNT = time to next therapy; TTP = time to progression; TTR = time to systemic response; TTTF = time to treatment failure; URTI = upper respiratory tract infection; VGPR = very good partial response.
Source: GlaxoSmithKline Inc.18
Based on the SLR, the final network included a total of 12 studies investigating 12 treatments, anchored through 3 common treatments: Vd, high-dose carfilzomib and dexamethasone (hKd), and PVd. Three studies (the PANORAMA 1, NCT00813150, and NCT01478048 studies) did not report data for patients who were lenalidomide-exposed or whose disease was lenalidomide-refractory, and 1 reported data for patients whose disease was lenalidomide-refractory but not for those who were lenalidomide-exposed (the GEM-KyCyDex study). Therefore, 9 studies were included in the ITC (Table 23).
NMA Feasibility Assessment
The investigators’ feasibility assessment evaluating the level of homogeneity among included studies indicated it was feasible to conduct a network analysis.
Quality Assessment
A risk of bias assessment was conducted using the Revised Cochrane risk of bias tool for individually randomized parallel group trials (RoB 2.0).57 The overall risk of bias was heterogeneous among included studies, but no studies were regarded as outliers, and no studies were excluded based on the risk of bias assessment.
Study and Population Characteristics
An assessment of heterogeneity in the study characteristics and the patient populations of the included studies was conducted. Table 20 presents a comparison of the characteristics of the populations included in studies comprising the network. Median age, sex (percentage female or male), race, and time since diagnosis were not available or were partially reported in the lenalidomide-exposure population. Table 21 presents the assessment of the heterogeneity in r/r MM–specific characteristics.
Table 20: Similarity of Patient Population Characteristics
Characteristics | Studies reporting characteristic: ITT | Comment on similarities and differences |
|---|---|---|
Age in years (median) | 10 of 11 (Missing: NCT014780487) | |
Sex | 11 of 11 |
|
Race | 5 of 11 (Missing: ARROW,59 BOSTON,60 CASTOR,61 CANDOR,58 NCT00813150,62 OPTIMISMM54) |
|
Time since diagnosis, months | 7 of 11 (Missing: ARROW,59 ENDEAVOUR,63 PANORAMA 1,64 NCT0081315062) |
|
ITT = intention-to-treat.
Source: GlaxoSmithKline Inc.18
Table 21: Assessment of Heterogeneity in r/r MM-Specific Characteristics
Studies | Prior LoT (%) | ISS stage (%) | ECOG PS (%) | Prior lenalidomide (%) | Prior IMiD (%) | Cytogenetic profile – high risk (%) |
|---|---|---|---|---|---|---|
BOSTON60 | NR | NR | NR | 100.0 | NR | 35.7 |
1: 27.6 ≥ 2: 72.4 | NR | NR | 100.0 | NR | 26.9 | |
OPTIMISMM54 | 1: 40.5 2: 39.5 3: 20.0 ≥ 4: NR Unknown: NR | I: 51.5 II: 31.0 III: 17.5 | 0: 51.0 1: 43.0 2: 6.0 | 100.0 | 100.0 | 20.0 |
NR | NR | NR | 100.0 | NR | 13.7 | |
NR | NR | 1: 23.0 > = 2: 77.0 | NR | NR | 15.3 | |
DREAMM-819 | 1: 52.5 2 or 3: 34.0 ≥ 4: 13.5 | I: 59.0 II: 26.0 III: 14.5 Unknown: 0.5 | 0: 55.5 1: 42.0 2: 3.0 | 100 | 100 | 33 |
ECOG PS = Eastern Cooperative Oncology Group; ISS = International Staging System; IMiD = immunomodulatory drugs; LoT = line of treatment; NR = not reported; PS = performance status; r/r MM = relapsed or refractory multiple myeloma.
Source: GlaxoSmithKline Inc.18
ITC Analysis Methods
A summary of the analytical approaches used to conduct the NMAs is provided in Table 22.
Table 22: Indirect Comparison Analysis Methods
Methods | Description |
|---|---|
Analysis methods | NMAs were performed within a Bayesian framework using the multiNMA package version 0.7.0 and R version 4.2.1 or later via Rstudio. A suitable burn-in and number of iterations of the Markov chain to estimate parameters were selected, allowing for thinning if required. |
Statistical model — time-to-event end points | For TTE end points (PFS and OS), a normal distribution was assumed for the treatment effect (log-HRs) reported within each study. The output was HRs and 95% CrI. |
Statistical model — binary end points | For binary outcomes (ORR), a binomial distribution was assumed for the treatment effect reported within each study. The output was the OR of the binomial outcome occurring with BPd relative to the alternative treatments with 95% CrI. |
Priors — time-to-event end points | Due to the sparsity of the networks (with only 1 study informing most treatment comparisons), there were no sufficient sample data to inform the between-study standard deviation in treatment effects, where random-effect analysis was used. Instead, the prior distribution for the between-study heterogeneity were elicited from clinical opinion as per the work of Ren et al. 2018,68 and this was used as an informative before directly inform a random-effect NMA. |
Priors — binary end points | For the feasible outcomes relating to number of participants (ORR), the generic prior in a general health care setting from Turner et al.69 was used. For all outcomes, the priors were truncated using a method proposed by Ren et al. 2018;68 the priors were truncated using the conservative assumption that the ratio of ORs between studies cannot exceed 10. |
NMA model selection | The feasibility assessment for this NMA demonstrated that there is considerable heterogeneity between the studies included in the analyses, though there is only 1 study per link, which is not sufficient to reliably estimate between-study variances. Therefore, the primary analysis for this NMA will consider a fixed-effect model. The random-effects model will be considered as a secondary analysis. |
Assessment of model fit | For each analysis, the goodness-of-fit to the model was assessed by using the DIC and residual deviance. The DIC provides a relative measure of goodness-of-fit that penalizes complexity and was used to compare alternative models.70 A lower DIC value indicates that the model fits the data well. When the residual deviance is close to the number of data points, it indicates that the model fits the data well. |
Assessment of heterogeneity | The presence of clinical and methodological heterogeneity was assessed through a feasibility assessment, in which the population and study characteristics were compared. |
Assessment of consistency | The inconsistency assessment for the NMA evaluated the consistency between estimates from direct and indirect evidence. The analysis demonstrated that the direct and indirect estimates aligned well in overlapping areas, confirming the assumption of consistency, which is essential for the validity of the NMA results. A consistency was only available for BPd vs. PVd, and no closed loops were available for other assessments. |
Assessment of convergence | Convergence to the target posterior distributions was assessed using the Gelman-Rubin statistic.71 In the case that this statistic was larger than 1.1, the simulation was deemed to have not converged. To assist convergence, prior distributions were adjusted dependent on the end point and prior in question, based on trial and error, judging the best compromise between convergence and realistic priors, which reflect the parameter they were based on. |
Outcomes | PFS, OS, and ORR. |
Follow-up time points | Longest follow-up available. |
Construction of nodes | Treatment nodes distinguished between different combination therapies. |
Sensitivity analyses | No sensitivity analyses were undertaken but secondary analyses were performed (refer to later). |
Secondary analyses | Lenalidomide-refractory population |
Subgroup analysis | No subgroup analyses were undertaken. |
BPd = belantamab mafodotin, pomalidomide, and dexamethasone; CrI = credible interval; DIC = deviance information criterion; HR = hazard ratio; NMA = network meta-analysis OR = odds ratio; ORR = overall response rate; PVd = pomalidomide, bortezomib, and dexamethasone; OS = overall survival; PFS = progression-free survival; TTE = time to event; VGPR = very good partial response; vs. = versus.
Source: GlaxoSmithKline Inc.18
Results of ITC
Summary of Included Studies
A total of 9 studies were included in the ITC. The characteristics of the included studies are presented in Table 23.
Table 23: Studies and Comparators Included in the ITC Analyses
Trial | Population reported | Intervention | Comparator | N | Year | Phase | Dosing and schedule |
|---|---|---|---|---|---|---|---|
Included in the primary and secondary analyses | |||||||
ARROW59 | Lenalidomide exposed | Kd | hKd | 401 | 2018 | 3 | Kd: Carfilzomib 20 mg/m2 on days 1 and 2 during cycle 1; 27 mg/m2 thereafter on days 1, 2, 8, 9, 15, and 16 (10-minute infusion); dexamethasone 40 mg weekly hKd: Carfilzomib 20 mg/m2 day 1 cycle 1, followed by 70 mg/m2 thereafter on days 1, 8, and 15 (30-minute infusion); dexamethasone 40 mg weekly |
Lenalidomide refractory | Kd | hKd | 356 | ||||
BOSTON60 | Lenalidomide exposed | SVd | Vd | 154 | 2020 | 3 | SVd: Selinexor 100 mg, bortezomib 1.3 mg/m2, dexamethasone 20 mg once weekly Vd: Bortezomib 1.3 mg/m2 and dexamethasone 20 mg twice weekly for the first 24 weeks, once weekly thereafter |
Lenalidomide refractory | SVd | Vd | 106 | ||||
Lenalidomide exposed | hKDd | hKd | 197 | 2023 | 3 | hKDd: Carfilzomib on days 1, 2, 8, 9, 15, and 16 (56 mg/m2 after first cycle); daratumumab 16 mg/kg every week for first 2 cycles, then every 2 weeks for 4 cycles, and every 4 weeks thereafter; dexamethasone 40 mg weekly hKd: Carfilzomib (same schedule); dexamethasone 40 mg weekly | |
Lenalidomide refractory | hKDd | hKd | 154 | ||||
Lenalidomide exposed | DVd | Vd | 209 | 2016 | 3 | DVd: Daratumumab 16 mg/kg on days 1, 8, and 15 of cycles 1 to 3, every 3 weeks for cycles 4 to 8, and every 4 weeks thereafter; bortezomib 1.3 mg/m2 on days 1, 4, 8, and 11 of a 21-day cycle; dexamethasone 20 mg on days 1, 2, 4, 5, 8, 9, 11, and 12 Vd: Bortezomib and dexamethasone on the same schedule as DVd arm | |
Lenalidomide refractory | DVd | Vd | 105 | ||||
Lenalidomide exposed | hKd | Vd | 354 | 2016 | 3 | hKd: Carfilzomib 20 mg/m2 on days 1 and 2 of cycle 1, 56 mg/m2 thereafter on days 1, 2, 8, 9, 15, and 16; dexamethasone 20 mg on days 1, 2, 8, 9, 15, 16, 22, and 23 of a 28-day cycle Vd: Bortezomib 1.3 mg/m2 on days 1, 4, 8, and 11 of a 21-day cycle; dexamethasone 20 mg on days 1, 2, 4, 5, 8, 9, 11, and 12 | |
Lenalidomide refractory | hKd | Vd | 235 | ||||
IKEMA14 | Lenalidomide exposed | IhKd | hKd | 131 | 2021 | 3 | IhKd: Isatuximab 10 mg/kg intravenously weekly for the first 4 weeks, then every 2 weeks; carfilzomib 20 mg/m2 on days 1 and 2, then 56 mg/m2 on days 8, 9, 15, and 16 of the first cycle, and 56 mg/m2 on days 1, 2, 8, 9, 15, and 16 of subsequent cycles; dexamethasone 20 mg on days 1, 2, 8, 9, 15, 16, 22, and 23 hKd: Carfilzomib and dexamethasone have same schedule as IhKd |
Lenalidomide refractory | IhKd | hKd | 99 | ||||
OPTIMISMM54 | Lenalidomide exposed, | PVd | Vd | 559 | 2019 | 3 | PVd: Pomalidomide 4 mg orally on days 1 to 14; bortezomib 1.3 mg/m2 on days 1, 4, 8, and 11 (first 8 cycles); dexamethasone 20 mg on days 1, 2, 4, 5, 8, 9, 11, and 12 for cycles 1 to 8, days 1, 2, 8, and 9 from cycle 9 onwards Vd: Bortezomib and dexamethasone on the same schedule as PVD arm |
Lenalidomide refractory | PVd | Vd | 391 | ||||
GEM_KyCyDex17 | Lenalidomide refractory | CyKd | hKd | — | 2020 | 2 | CyKd: Carfilzomib 70 mg/m2 on days 1, 8, and 15; cyclophosphamide 300 mg/m2 on days 1, 8, and 15; dexamethasone 20 mg weekly hKd: Carfilzomib 70 mg/m2 on days 1, 8, and 15; dexamethasone 20 mg weekly |
DREAMM-819 | Lenalidomide exposed | BPd | PVd | 302 | 2018 | 3 | BPd: Belantamab mafodotin 2.5 mg/kg on day 1, cycle 1 followed by 1.9 mg/kg every 4 weeks on day 1 for cycle 2 onwards; pomalidomide 4 mg on days 1 to 21; dexamethasone 40 mg on days 1, 8, 15, and 22 of 28-day cycle PVd: Pomalidomide 4 mg on days 1 to 14 of 21-day cycle. For cycle 1 to 8: bortezomib 1.3 mg/m2 on days 1, 4, 8, and 11 of 21-day cycle for cycles 1 to 8; dexamethasone 20 mg on the day of and day after bortezomib. For cycle 9 onwards: bortezomib 1.3 mg/m2 on days 1 and 8 of 21-day cycle, dexamethasone 20 mg on the day of and day after bortezomib |
Lenalidomide refractory | BPd | PVd | 236 | ||||
BPd = belantamab mafodotin, pomalidomide, and dexamethasone; CyKd = cyclophosphamide, carfilzomib, and dexamethasone; CyVd = cyclophosphamide, bortezomib, and dexamethasone; DVd = daratumumab, bortezomib, and dexamethasone; hKd = high-dose carfilzomib and dexamethasone; IhKd = isatuximab, high-dose carfilzomib, and dexamethasone; Kd = carfilzomib and dexamethasone; PVd = pomalidomide, bortezomib, and dexamethasone; SVd = selinexor, bortezomib, and dexamethasone; Vd = bortezomib and dexamethasone.
Source: GlaxoSmithKline Inc.18
Efficacy
The ITC was conducted in an overall lenalidomide-exposed population including patients who received prior lenalidomide but had r/r disease, with a separate analysis for a subgroup of patients whose disease was lenalidomide-refractory.
Lenalidomide-Exposed Population
The overall efficacy results of the ITC are presented in Table 24 for the lenalidomide-exposed population.
Table 24: Results of Lenalidomide-Exposed Population
BPd vs. comparators, outcomes | Random effect model | Fixed-effects model |
|---|---|---|
BPd vs. DVd | ||
PFS, (HR, 95% Crl) | ████ ██████ █████ | 0.73 (0.43 to 1.25) |
OS, (HR, 95% Crl) | ██ | ██ |
ORR (OR, 95% Crl) | ████ ██████ ██████ | ████ ██████ █████ |
BPd vs. hKd | ||
PFS, (HR, 95% Crl) | ████ ██████ █████ | 0.42 (0.26 to 0.69) |
OS, (HR, 95% Crl) | ████ ██████ █████ | ████ █████ █████ |
ORR (OR, 95% Crl) | ████ ██████ ██████ | ████ ██████ █████ |
BPd vs. hKDd | ||
PFS, (HR, 95% Crl) | ████ ██████ █████ | 0.86 (0.46 to 1.62) |
OS, (HR, 95% Crl) | ████ ██████ █████ | ████ ██████ █████ |
ORR (OR, 95% Crl) | ████ ██████ ██████ | ████ ██████ █████ |
BPd vs. IhKd | ||
PFS, (HR, 95% Crl) | ████ ██████ █████ | 0.73 (0.36 to 1.47) |
OS, (HR, 95% Crl) | ██ | ██ |
ORR (OR, 95% Crl) | ██ | ██ |
BPd vs. Kd | ||
PFS, (HR, 95% Crl) | ████ ██████ █████ | 0.58 (0.34 to 1.01) |
OS, (HR, 95% Crl) | ██ | ██ |
ORR (OR, 95% Crl) | ██ | ██ |
BPd vs. PVd | ||
PFS, (HR, 95% Crl) | ████ ██████ █████ | 0.52 (0.37 to 0.73) |
OS, (HR, 95% Crl) | ████ ██████ █████ | ████ ██████ █████ |
ORR (OR, 95% Crl) | ████ ██████ █████ | ████ ██████ █████ |
BPd vs. SVd | ||
PFS, (HR, 95% Crl) | ████ ██████ █████ | 0.46 (0.26 to 0.83) |
OS, (HR, 95% Crl) | ██ | ██ |
ORR (OR, 95% Crl) | ████ ██████ ██████ | ████ ██████ █████ |
BPd vs. Vd | ||
PFS, (HR, 95% Crl) | ████ ██████ █████ | 0.29 (0.20 to 0.43) |
OS, (HR, 95% Crl) | ████ ██████ █████ | ████ ██████ █████ |
ORR (OR, 95% Crl) | ███ ██████ ██████ | ████ ██████ ██████ |
BPd = belantamab mafodotin, pomalidomide, and dexamethasone; CrI = credible interval; DVd = daratumumab, bortezomib, and dexamethasone; hKd = high-dose carfilzomib and dexamethasone; hKDd = high-dose carfilzomib, daratumumab, and dexamethasone; HR = hazard ratio; IhKd = isatuximab, high-dose carfilzomib, and dexamethasone; Kd = carfilzomib and dexamethasone; OR = odds ratio; ORR = overall response rate; OS = overall survival; PFS = progression-free survival; PVd = pomalidomide, bortezomib, and dexamethasone; SVd = selinexor, bortezomib, and dexamethasone; Vd = bortezomib and dexamethasone; vs. = versus.
Notes: For PFS and OS, HR < 1 indicates in favour of BPd; HR > 1 indicates in favour of comparators. For ORR HR > 1 indicates in favour of BPd; HR < 1 indicates in favour of comparators
Source: Summarized based the sponsor’s evidence summary and ITC report.72
PFS Primary Analysis: Lenalidomide-Exposed Population
The PFS analysis included 8 studies (Figure 10).14,19,54,58-61,63 Based on the fixed-effect model, BPd demonstrated a more favourable improvement in PFS (i.e., 95%Crl does not cross 1) compared with hKd, SVd, and Vd. However, the results did not demonstrate a more favourable PFS for BPd compared with remaining comparators (i.e., DVd; high-dose carfilzomib, daratumumab, and dexamethasone [hKDd]; isatuximab, high-dose carfilzomib, and dexamethasone; and Kd). The HRs for these comparisons varied from 0.29 to 0.86 for the various comparisons, but they all had wide 95% Crls extending across 1 (Table 24) Using the random-effect model, the results suggested that BPd ███ ███ ███████████ █ ████ █████████ ███ ██████ ███ ██ ███ █████████ ██████████ ███████████
Figure 10: PFS Network — Lenalidomide-Exposed Population [Redacted]

███ █████ ██ ████ ███ ███████ ███ ████████████████████ ███████████ █████ ████ ███ ████ ████ ████ ███ ████ ███ ████ ████ ████████ ██ ███ ████████ ███████ █ ██████████ █ ████████████ █ ██████████████ ███ █ ███████████ █ ██████████ █ ██████████████ ███ █ ████ ████ ███████████ █ ██████████████ ████ █ ████ ████ ███████████ █ ███████████ █ ██████████████ ██ █ ██████ ██████ ████ █ ██████████ █ ████ ████ ███████████ █ ████████████ ███ █ ████████████████ █████████ ██ █ ███████████ █ ██████████████ ███ █ ████████████ █ ██████████ █ ██████████████ ███ █ █████████ █ ██████████ █ ██████████████ ██ █ ██████████ █ █████████████
OS Primary Analysis — Lenalidomide-Exposed Population
The OS analysis included || studies███████████ (Figure 11). Based on the fixed-effect model, BPd demonstrated a more favourable improvement in OS compared with Vd (HR, ████; 95% CrI █████ ████). However, BPd did not demonstrate a more favourable OS when compared with hKd, or hKDd, █████ ████ ████ █████████ ██████ █ ███ ████ ███████████. Using the random-effect model, the results suggested that BPd ███ ███ ███████████ █ ████ █████████ ██ ██████ ██████ ███ ██ ███ █████████ ██████████ ██████████ (Table 25).
Figure 11: OS Network — Lenalidomide-Exposed Population [Redacted]

███ █████ ██ ████ ██ ███████ ███ ████████████████████ ███████████ █████ ████ ███ ████ ███ ████ ████ ████████ ██ ███ ████████
████ █ ██████████ █ ████████████ █ ██████████████ ██ █ ██████ ██████ ███ █ ████ ████ ███████████ █ ██████████████ ████ █ ████ ████ ███████████ █ ███████████ █ ██████████████ ███ █ ███████ ██████████████ ██ █ ███████ █████████ ███ █ ████████████ █ ██████████ █ ██████████████ ██ █ ██████████ █ ██████████████
ORR Primary Analysis — Lenalidomide-Exposed Population
The ORR analysis included || studies███████████ (Figure 12). Results from the fixed-effect model suggest a more favourable ORR with BPd compared with hKd (OR ████; 95% CrI ████ ██ ████), SVd (OR ████; 95% CrI ████ ██ ████), and Vd (OR ████; 95% CrI ████ ██ █████). ████████ ███████████ ███ █████████ ███████████ ██████ ████ █████ ███ ████ ███ ███ ███████████ █ ████ █████████ ███ ███████ ████ ███ ██ █████████ ██ ████ ████ ███ ████ █████████ ██████ █ ███ ████ ██████████. Using the random-effect model, the results suggested that BPd ███ ███ ███████████ █ ████ █████████ ███ ██████ ███ ██ ███ █████████ ██████████ ██████████ ███████ ███ ██ ████ (Table 25)
Figure 12: Overall Response Rate Network — Lenalidomide-Exposed Population [Redacted]

███ █████ ██ ████ ███ ███████ ███ ████████████████████ ███████████ █████ ████ ███ ████ ████ ████ ███ ████ ████ ████████ ██ ███ ████████
████ █ ██████████ █ ████████████ █ ██████████████ ███ █ ███████████ █ ██████████ █ ██████████████ ███ █ ████ ████ ███████████ █ ██████████████ ████ █ ████ ████ ███████████ █ ███████████ █ ██████████████ ███ █ ███████ ████████ █████ ███ █ ████████████ █ ██████████ █ ██████████████ ███ █ █████████ █ ██████████ █ ██████████████ ██ █ ██████████ █ █████████████
Lenalidomide-Refractory Population
The overall efficacy results of the ITC are presented in Table 25 for the lenalidomide-refractory population.
Table 25: PFS Results in Lenalidomide-Refractory Population
BPd vs. comparators, outcomes | Random effect model | Fixed-effects model |
|---|---|---|
BPd vs. CyKd | ||
PFS, HR (95% Crl) | ████ ██████ █████ | ████ ██████ █████ |
BPd vs. DVd | ||
PFS, (HR, 95% Crl) | ████ ██████ █████ | ████ ██████ █████ |
BPd vs. hKd | ||
PFS | ████ ██████ ████ | ████ ██████ █████ |
BPd vs. hKDd | ||
PFS (HR, 95% Crl) | ████ ██████ █████ | ████ ██████ █████ |
BPd vs. IhKd | ||
PFS (HR, 95% Crl) | ████ ██████ █████ | ████ ██████ █████ |
BPd vs. Kd | ||
PFS (HR, 95% Crl) | ████ ██████ █████ | ████ ██████ █████ |
BPd vs. PVd | ||
PFS (HR, 95% Crl) | ████ ██████ █████ | ████ ██████ █████ |
BPd vs. SVd | ||
PFS (HR, 95% Crl) | ██ | ██ |
BPd vs. Vd | ||
PFS (HR, 95% Crl) | ████ ██████ █████ | ████ ██████ █████ |
BPd = belantamab mafodotin, pomalidomide, and dexamethasone; CI = confidence interval; CrI = credible interval; CyKd = cyclophosphamide, high-dose carfilzomib, and dexamethasone; CrI = credible interval; DVd = daratumumab, bortezomib, and dexamethasone; hKd = high-dose carfilzomib and dexamethasone; hKDd = high-dose carfilzomib, daratumumab, and dexamethasone; HR = hazard ratio; IhKd = isatuximab, high-dose carfilzomib, and dexamethasone; ITC = indirect treatment comparison; Kd = carfilzomib and dexamethasone; PFS = progression-free survival; PVd = pomalidomide, bortezomib, and dexamethasone; SVd = selinexor, bortezomib, and dexamethasone; Vd = bortezomib and dexamethasone; vs. = versus.
Notes: For PFS, HR < 1 indicates in favour of BPd; HR > 1 indicates in favour of comparators.
For the purpose of this analysis, inverted values have been used for the GEM_KyCyDex study’s HRs and CIs due to the publication reporting Kd vs. CyKd, rather than CyKd vs. Kd.
Source: Summarized based on the sponsor’s evidence summary and ITC report.72
PFS Secondary Analysis: Lenalidomide-Refractory Population
The analysis of PFS in the lenalidomide-refractory population included studies████████████████████ (Figure 13). Based on the fixed-effect model, the BPd demonstrated a more favourable improvement in PFS compared with either hKd, Kd, or Vd. ████████ ███ ███████ ███ ███ ███████████ █ ████ █████████ ███ ███ ███ ████████ ████ █████████ ███████████ ██████ ████ █████ ███ ██████ ███ ███ ███ █████ ███████████ ██████ ████ ████ ██ ████ ███ █████ ███████ ███████████ ███ ████ ███ ███ ████ ███ ████ █████████ ██████ (Table 25). Using the random-effect model, the results suggested that BPd ███ ███ ███████████ █ ████ █████████ ███ ██████ ███ ██ ███ █████████ ██████████ ██████████ (Table 25).
Figure 13: PFS Network — Lenalidomide-Refractory Population [Redacted]

████ █ ██████████ █ ████████████ █ ██████████████ ████ █ ████████████████ █ ████ ████ ███████████ █ ███████████ █ ██████████████ ███ █ ███████████ █ ██████████ █ ██████████████ ███ █ ████ ████ ███████████ █ ██████████████ ████ █ ████ ████ ███████████ █ ███████████ █ ██████████████ ██ █ ██████ ██████ ████ █ ██████████ █ ████ ████ ███████████ █ ████████████ ███ █ ████████████████ █████████ ██ █ ███████████ █ ██████████████ ███ █ ████████████ █ ██████████ █ ██████████████ ██ █ ██████████ █ █████████████
Harms
The NMA did not include any harms data.
Critical Appraisal of ITC
Overall, the ITCs were conducted according to accepted methodological guidance. An SLR was used as the basis for selecting relevant studies. The SLR searched multiple databases and grey literature sources, conducted study selection and data extraction using accepted methods, and provided a Preferred Reporting Items for Systematic reviews and Meta-Analyses (PRISMA) diagram of the study selection. The risk of bias of included studies was assessed using the Revised Cochrane risk of bias tool for individually randomized, parallel group trials (RoB 2). Feasibility assessment was performed to inform whether an NMA between the RCTs identified in the SLR would be feasible. Geometry of the evidence networks were provided for each outcome analysis. For each analysis, the goodness-of-fit to the model was assessed by using the deviance information criterion and residual deviance. The potential limitations of the NMA are discussed next.
One of the key limitations of the ITC was the significant potential heterogeneity in study-level patient demographic and disease characteristics, as well as the study characteristics across the included studies. In the sponsor’s ITC report, it was indicated that, in the studies included in the ITC, median age, gender (percentage male or female), race, and time since diagnosis were not available or rarely reported in the lenalidomide exposure population. Therefore, it was not possible to fully assess the similarities and differences of the studies. Regarding the r/r MM-specific characteristics, of the 9 included studies, 5 studies reported the prior lenalidomide exposure; 3 studies reported the number of the prior line of treatment; 2 studies reported the ISS stage; 3 studies reported ECOG performance status; 2 studies reported the prior IMiD exposure; and 6 studies reported cytogenic risk profile. Based the available information, the prior line of treatment and ECOG performance status varied across the studies, and the percentage with a high cytogenic risk profile varied from 13.7% to 35.7%. In addition, the clinical experts consulted by CDA-AMC for this review indicated that lenalidomide refractory status and anti-CD38 refractory status are 2 very important factors, as most patients starting on these regimens of BPd will not just be lenalidomide- or anti-CD38–exposed but also will have disease that is lenalidomide- /or anti-CD38–refractory. Furthermore, substantial variation was observed in the follow-up time at which outcomes were assessed across the studies, with follow-up time for reporting PFS ranging from 5.6 months to 47 months. Considering that HRs could change with duration of follow-up, these differences may significantly impact outcomes. No meta-regression analyses to adjust for factors that may bias comparisons were conducted. Therefore, the heterogeneity of treatment and prognostic modifiers discussed previously may threaten the transitivity assumption for the NMA analysis. The assumption of similarities across the included studies may not hold true for the NMA, increasing the likelihood of potential bias and uncertainty about the validity of the results estimating the comparative effectiveness of BPd compared with other existing therapies.
All evidence networks were sparsely connected and the connections between treatment nodes were informed by only 1 trial for each comparison, which was not sufficient to reliably estimate between-study variances. Therefore, the investigators chose the fixed-effect model for the primary analysis and the random-effects model for secondary analysis. However, although the model fit statistics (i.e., deviance information criterion) suggested similarity between random and fixed-effect models, the results of the analyses were sensitive to the model used and many had wide credible intervals indicating uncertainty in the results.
Furthermore, the NMA had no closed network to allow assessing the comparative effect of BPd versus IsaPd or carfilzomib and dexamethasone, which are considered relevant comparators in clinical settings in Canada.
For the lenalidomide-refractory population, the NMA assessed only PFS without OS, ORR, and HRQoL, which could not be evaluated due to lack of relevant data. Finally, the NMA did not assess harms outcomes.
Summary of ITC
Assessments based on the fixed-effect model suggest BPd may demonstrate more favourable effect than some evaluated comparators with regards to PFS, OS, and ORR in the lenalidomide-exposed population. However, the results were sensitive to model changes as using the random-effect model ███ ███ ███████████ ███████ █████████ ███ ██ ████ ██ ███ ███████████. Similarly, inconsistent results were reported from the analyses of PFS involving the lenalidomide-refractory population, with the fixed effect model suggesting a more favourable effect with BPd than comparators, whereas the random-effect model ███ ███ ████ ███ ██████████ ██ ██████ ████ ████ OS and ORR were not assessed in the lenalidomide-refractory population due to lack of data to form a network.
A potential key limitation of the NMA includes considerable heterogeneity in effect modifiers and prognostic modifiers across the included studies and sparse network. The findings reported in the NMA should be interpreted with the consideration of all its associated limitations.
The NMA did not assess HRQoL and harms outcomes. Therefore, the comparative effects of BPd versus the relevant comparators with regards to HRQoL and harms is unknown.
Studies Addressing Gaps in the Systematic Review Evidence
Contents within this section have been informed by materials submitted by the sponsor. The following has been summarized and validated by the review team.
Table 26: Summary of Gaps in the Systematic Review Evidence
Evidence gap | Studies that address gaps | |
|---|---|---|
Study description | Summary of key results | |
| The ALGONQUIN trial is a multicentre, single-arm, open-label, phase I/II study designed to evaluate the safety and efficacy of BPd in participants with refractory multiple myeloma (NCT03715478) | Efficacy results:
Safety results:
|
AE = adverse event; BCVA = best corrected visual acuity; BPd = belantamab mafodotin, pomalidomide, and dexamethasone; CI = confidence interval; CR = complete response; ORR = overall response rate; OS = overall survival; Pd = pomalidomide and dexamethasone; PFS = progression-free survival; PR = partial response; q.8.w. = every 8 weeks; RP2D = recommended phase 2 dose; sCR = stringent complete response; TEAE = treatment-emergent adverse event; VGPR = very good partial response.
Sources: Trudel et al. (2024).73 Details included in the table are from the sponsor’s Summary of Clinical Evidence.22
Description of Studies
One phase I/II, single-arm, open-label, multicentre study (the ALGONQUIN study) has been summarized in this section (Table 27). The ALGONQUIN study evaluated various doses and schedules of BPd for patients with MM whose disease was lenalidomide-refractory and who had been exposed to a PI.
The ALGONQUIN study comprised a dose-escalation phase (part 1) and a dose-expansion phase (part 2). A total of 87 patients with r/r MM were enrolled, with 61 patients in part 1 and 26 in part 2. The primary objectives of the ALGONQUIN study were to determine the RP2D and the schedule of belantamab mafodotin in part 1, as well as to establish the efficacy, as determined by ORR, for participants treated at the RP2D in part 2. The secondary objectives were to assess the safety and tolerability of the BPd in part 1 and to assess additional efficacy outcomes including PFS, DOR, and OS at the RP2D in part 2.
Of note, the sponsor also submitted evidence regarding the use of bandage contact lenses for the management of ocular AEs associated with BPd. As of the time of this review, the bandage contact lenses were not an intervention relevant to the Health Canada indication; therefore, the evidence on the use of bandage contact lenses was considered out of scope by the CDA-AMC review team, and it was not appraised.
Table 27: Details of the ALGONQUIN Study
Detail | ALGONQUIN study |
|---|---|
Designs and populations | |
Study design | phase I/II, single-arm, open-label study |
Locations | 9 sites in Canada |
Patient enrolment dates | NR |
Number of participants | Total N = 87
|
Inclusion criteria |
|
Exclusion criteria |
|
Drugs | |
Intervention | In part 1 (various doses and schedules)
In part 2
Treatment continued until disease progression or toxicity
|
Comparator(s) | NA |
Outcomes | |
Primary end point | In part 1
In part 2, in all response-evaluable patients treated at RP2D
|
Secondary and exploratory end points | Secondary, in all patients receiving treatment
Exploratory
|
Publication status | |
Publications | Publications 1. Trudel et al. (2024)73 ClinicalTrials.gov entry 1. NCT03715478 |
ALT = alanine transferase; ANC = absolute neutrophil count; BPd = belantamab mafodotin, pomalidomide, and dexamethasone; DOR = duration of response; ECOG = Eastern Cooperative Oncology Group; eGFR = estimated glomerular filtration rate; FLC = free light chains; MM = multiple myeloma; NA = not applicable; NR = not reported; NYHA = New York Heart Association; ORR = overall response rate; OS = overall survival; PFS = progression-free survival; PFS2 = progression-free survival on subsequent line of treatment; QTcF = corrected QT interval using Fridericia’s formula; RP2D = recommended phase 2 dose; r/r MM = relapsed or refractory multiple myeloma; ULN = upper limit of normal.
Sources: Trudel et al. (2024)73 Details included in the table are from the sponsor’s Summary of Clinical Evidence.22
Populations
Participants were eligible for the ALGONQUIN study if they were 18 years or older with a confirmed diagnosis of MM and were previously treated with at least 1 prior line of MM therapy, including a lenalidomide-containing regimen with documented disease progression during or after their most recent therapy.
Interventions
In part 1 of the ALGONQUIN study, belantamab mafodotin was administered in 61 patients at various doses (1.92 mg/kg, 2.5 mg/kg, and 3.4 mg/kg) and schedules (every 4 weeks, every 8 weeks, and every 12 weeks). Pomalidomide and dexamethasone were used in combination with belantamab mafodotin. Pomalidomide was administered at a fixed dose of 4 mg orally every day on days 1 to 21 of each 28-day cycle. Dexamethasone was administered at a starting dose of 40 mg orally daily on days 1, 8, 15, and 22 for participants aged 75 years or younger, and at 20 mg orally every day on the same schedule for those older than 75 years. Patients continued on the treatment until disease progression, unacceptable toxicity, or consent withdrawal.
The dose (i.e., RP2D) for part 2 was determined on the basis of the totality of the safety, tolerability, and activity data during part 1. A total of 38 patients (12 patients from part 1 and 26 from part 2) were treated at the RP2D (i.e., 2.5 mg/kg every 8 weeks).
Outcomes
The primary end points part 1 of the ALGONQUIN study were to determine the maximum tolerated dose, RP2D, and schedule of BPd.
The primary efficacy end point of the ALGONQUIN study for all patients whose responses were evaluable and were treated at the RP2D (response evaluable was defined as those with 2 consecutive assessments) was to determine the objective response rate which was defined as a sCR, CR, VGPR, or PR. Main secondary end points included PFS, OS, and safety assessments in all patients who were treated.
Statistical Analysis
The statistical analysis for the ALGONQUIN study included both descriptive and inferential components. A two-sided 95% Clopper-Pearson CI was calculated for ORR in part 2 and all patients treated at the RP2D. The analysis included all patients who received at least 1 dose of the study drug. Results were summarized for all patients who were treated, by dose group, and patients treated in part 2 at RP2D. PFS and OS were analyzed using the KM method. Survival curves showed the number of participants at risk and event-free rates, along with corresponding 95% CIs, at specific time points. Descriptive statistics were used to summarize safety data.
The sample size for part 1 of the ALGONQUIN study was not driven by statistical considerations but aimed to characterize dose cohorts and determine the maximum tolerated dose and RP2D. Approximately 30 evaluable participants were planned for dose-limiting toxicity assessment, with up to 74 additional participants anticipated to determine the RP2D.
For part 2, 35 patients were required for the ORR analysis, including 12 patients carried over from part 1 at the RP2D. The remaining 23 patients were planned for r/r MM cohorts, with additional cohorts targeting dose modifications for corneal events and toxicity reduction. Up to 140 patients total, accounting for a 10% dropout rate, were projected to complete the study, with a type I error rate of 0.05, a power of 97%.
Results
Patient Disposition
Patient disposition in the ALGONQUIN study is shown in Figure 14. In part 1, participants (n = 61) had a median duration of follow-up of 17.1 months (range, 0.9 to 42.5). At the data cut-off date of February 14, 2023, 21.3% (13 of 61) of the participants were still on study treatment, while 78.7% (48 of 61) had discontinued. The primary reason for treatment discontinuation was progressive disease (50.8%, 31 of 61), followed by death (% NR, 6 patients), consent withdrawal (% NR, 6 patients), and AEs (% NR, 5 patients). In total, 12 of 61 (19.7%) deaths occurred part 1 and discontinued the study, with 6 attributable to disease progression, 3 to COVID-19, 1 to pneumocystis pneumonia, 1 to influenza, and 1 to myocardial infarction.
In part 2, participants (n = 38) had a median follow-up of 13.9 months (range, 1.1 to 28.2). At the data cut-off date of February 14, 2023, 57.9% (22 of 38) of participants remained on treatment, while 42.1% (16 of 38) had discontinued. The main reason for treatment discontinuation was progressive disease (23.7%, 9 of 38), followed by death (% NR, 4 patients), AEs (5.3%, 2 of 38), and consent withdrawal (% NR, 1 patient).
Baseline Characteristics
The summary of the baseline characteristics of the patients in the ALGONQUIN study is shown in Table 28. The study population (N = 87) had a median age of 67 years (range, 36 to 85 years) with 47.1% being female, a median time from diagnosis of 5 years (range, 1 to 21), and a median number of previous lines of therapy of 3 (range, 1 to 6). At baseline, 25%, 34.4%, and 21.8% of the study participants had ISS disease stage i, ii, and iii, respectively, while the stage information was missing in 18.4% of the study participants.
Exposure to Study Treatments
The summary of exposure to study treatments is presented in Table 29.
Figure 14: Patient Disposition in the ALGONQUIN Study
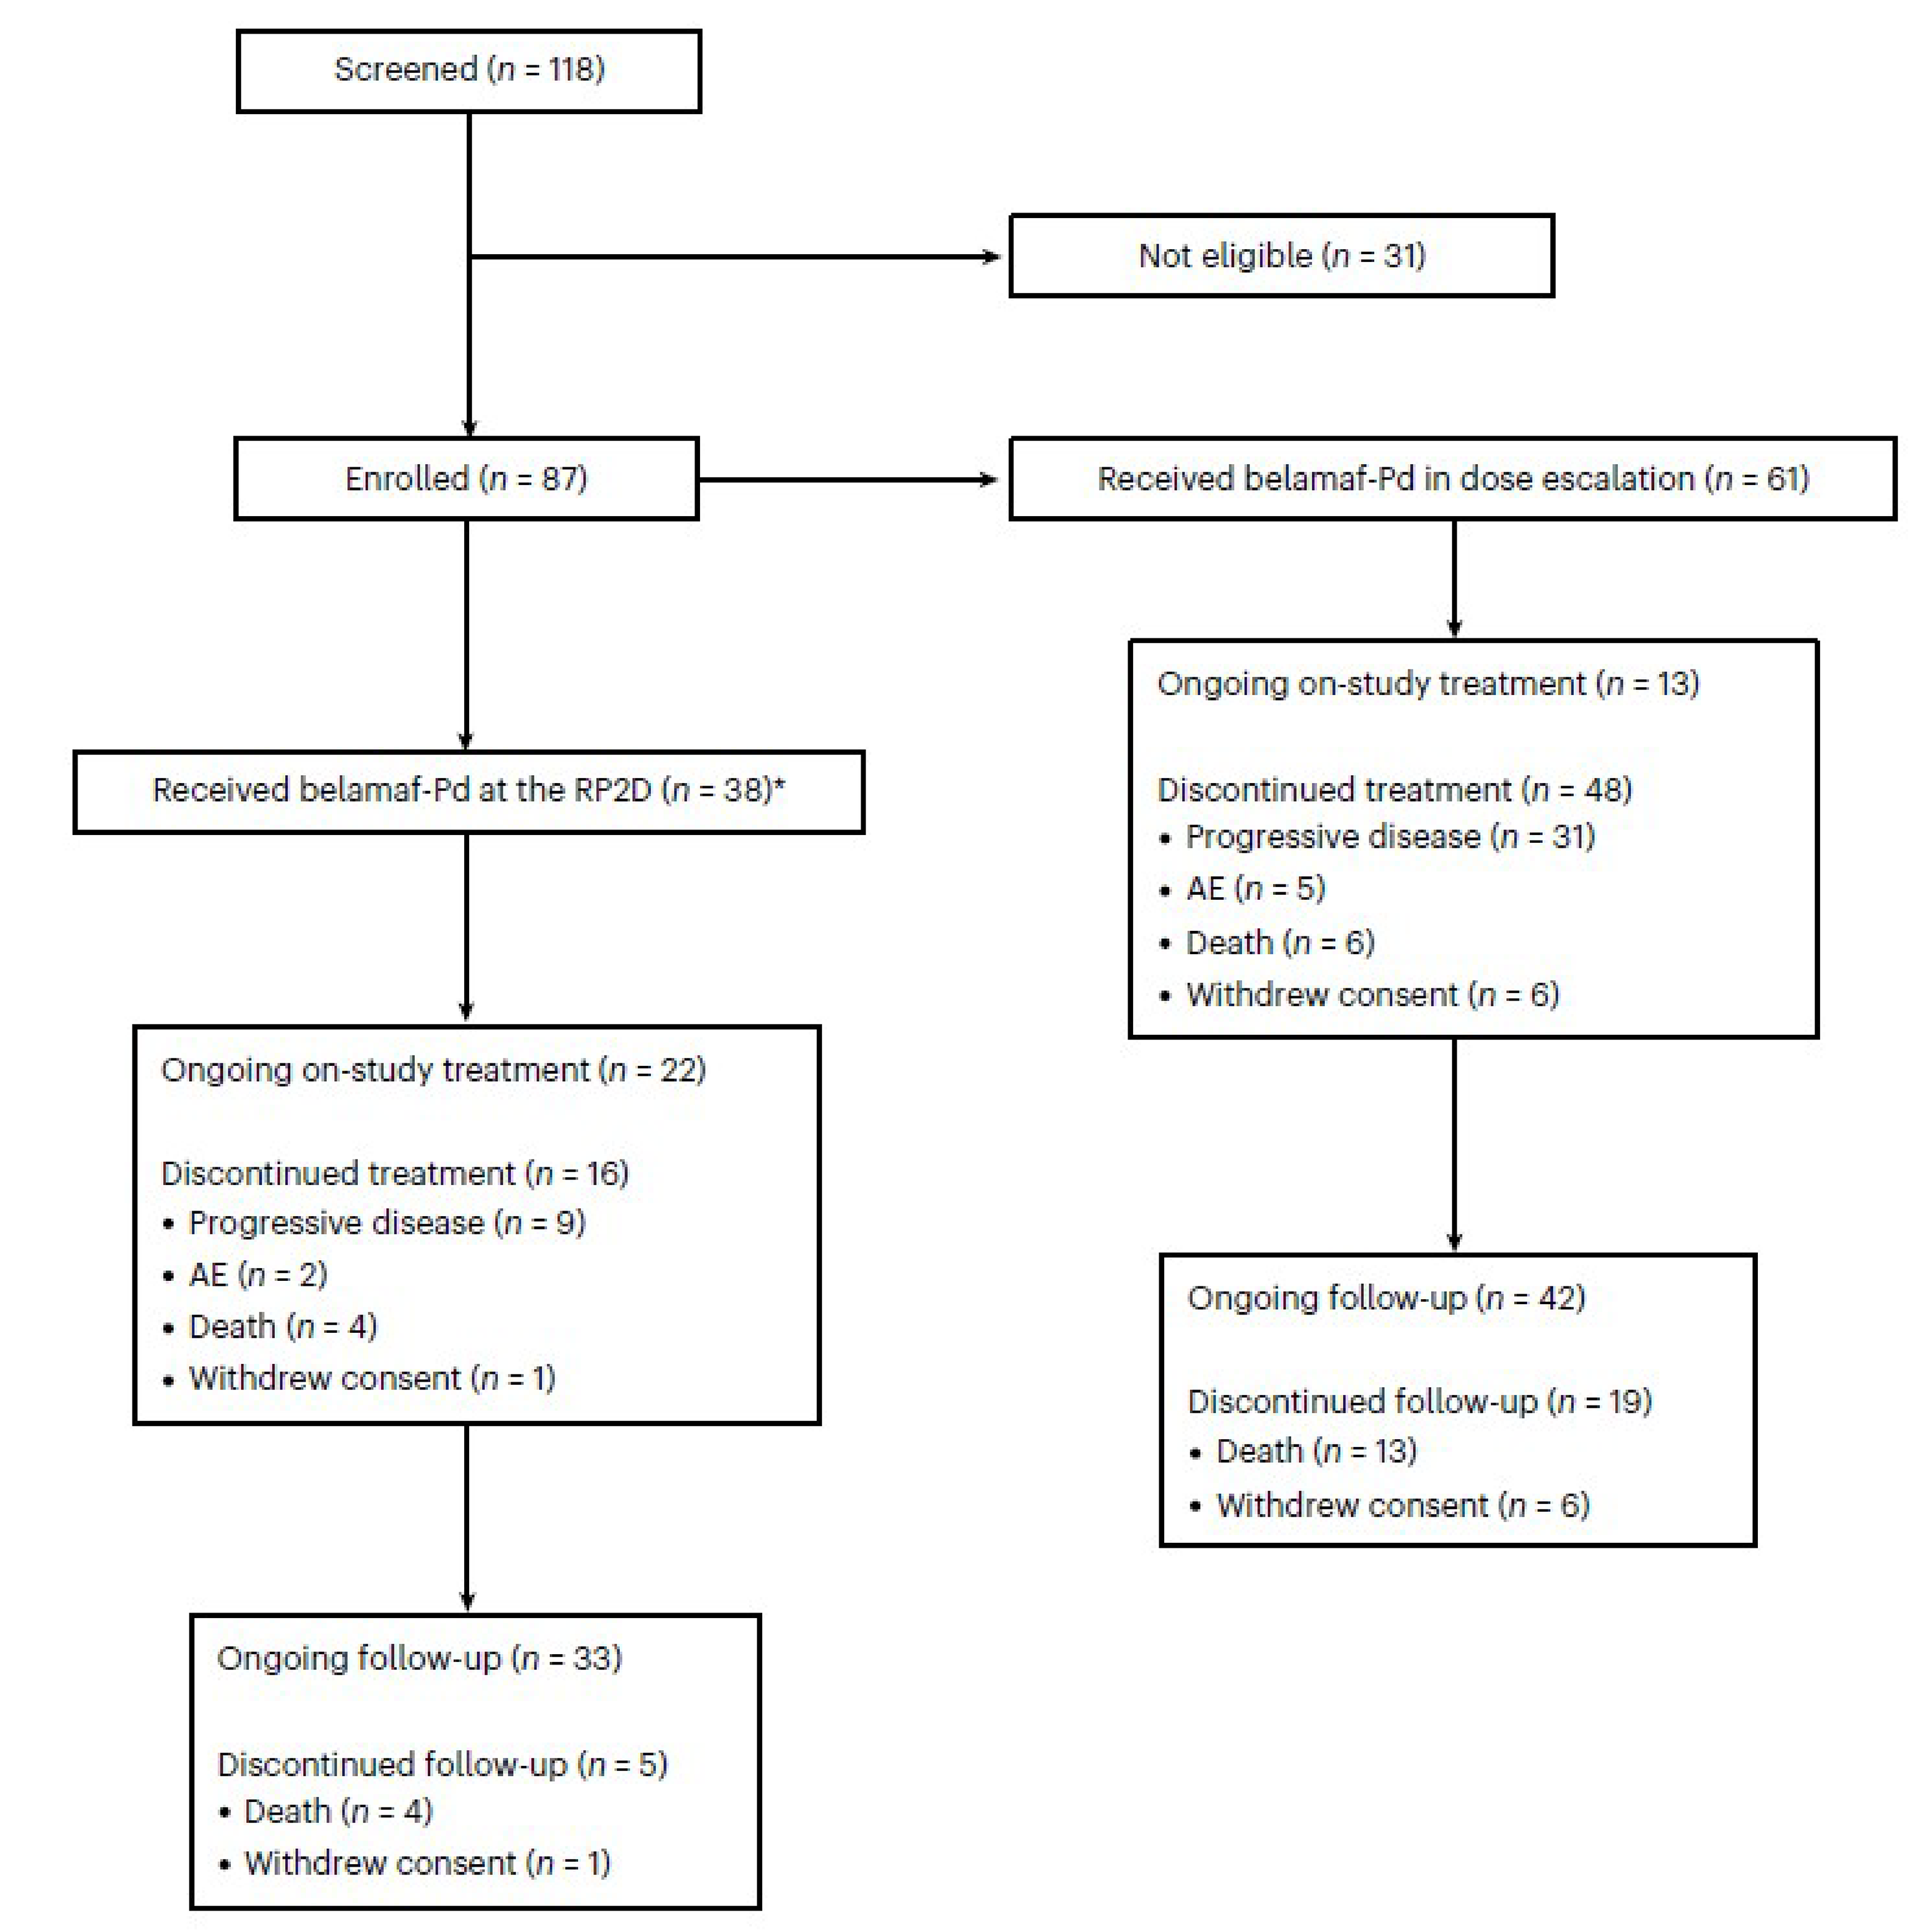
AE = adverse event; Belanmaf-Pd = belantamab mafodotin, pomalidomide, and dexamethasone; RP2D = recommended phase 2 dose.
Note: Out of the 38 patients who received belantamab mafodotin, pomalidomide, and dexamethasone, 12 participants from part 1 and 26 participants from part 2.
Source: Trudel et al. (2024).73
Table 28: Baseline Characteristics of Participants in the ALGONQUIN Study
Characteristic | Patients in dose-escalation phase (part 1) (n = 61) | Patients treated at RP2D in dose-expansion phase (part 2) (n = 38) | All patients receiving treatment (N = 87)a |
|---|---|---|---|
Median age, years (range) | 64 (36 to 81) | 71 (38 to 85) | 67 (36 to 85) |
Female, n (%) | 31 (50.8) | 15 (39.5) | 41 (47.1) |
Median time since initial diagnosis, years (range) | 5 (1 to 15) | 4 (1 to 21) | 5 (1 to 21) |
ECOG performance status, n (%) | |||
0 | 20 (32.8) | 10 (26.3) | 25 (28.7) |
1 | 35 (57.4) | 16 (68.3) | 55 (63.2) |
2 | 6 (9.8) | 1 (2.7) | 6 (6.9) |
Derived International Staging System stage at baseline, n (%) | |||
1 | 20 (16.3) | 7 (18.4) | 22 (25) |
2 | 22 (36.1) | 10 (26.3) | 30 (34.4) |
3 | 10 (16.4) | 12 (31.6) | 19 (21.8) |
Missing | 9 (14.8) | 9 (23.7) | 16 (18.4) |
Baseline cytogenetics, n (%) | |||
High riskb | 14 (23.0) | 7 (18.5) | 16 (18.4) |
Standard riskc | 18 (29.5) | 14 (36.8) | 29 (33.3) |
Missing | 29 (47.5) | 17 (44.7) | 42 (48.3) |
Median number of previous therapies | 3 (1 to 5) | 3 (1 to 6) | 3 (1 to 6) |
Previous therapies, n (%) | |||
ASCT | 49 (80.3) | 18 (47.4) | 60 (69.0) |
Lenalidomide | 61 (100) | 38 (100) | 87 (100) |
PI | 61 (100) | 38 (100) | 87 (100) |
Anti-CD38 | 36 (59) | 30 (78.9) | 58 (66.7) |
Triple-class exposure | 36 (59) | 30 (78.9) | 58 (66.7) |
Refractory, n (%) | |||
Lenalidomide | 58 (95.1) | 36 (94.7) | 84 (96.6) |
PI | 53 (86.9) | 32 (84.2) | 75 (86.2) |
Anti-CD38 | 36 (59) | 30 (78.9) | 58 (66.7) |
Triple-class exposure | 30 (49.2) | 24 (63.2) | 48 (55.2) |
ASCT = autologous stem cell transplant; BCVA = best corrected visual acuity; ECOG = Eastern Cooperative Oncology Group; PI = proteasome inhibitor; RP2D = recommended phase 2 dose.
aThe total of 87 participants excluded 12 patients who were enrolled in both part 1 and part 2.
bHigh risk is defined as participants presenting with abnormality for del(17p) and/or translocations t(4;14) and/or t(14;16). Fluorescence in situ hybridization was performed locally using the individual laboratory’s cut-off values.
cStandard risk is defined as participants with the absence of abnormality for all the following: del(17p), translocations t(4;14), and t(14;16).
Source: Trudel et al. (2024)73 Details included in the table are from the sponsor’s Summary of Clinical Evidence.22
Table 29: Summary of Treatment Exposure in the ALGONQUIN Study
Exposure | Cohorts of the ALGONQUIN studya | |||||||
|---|---|---|---|---|---|---|---|---|
1.92 mg/kg q.4.w. (n = 12) | 2.5 mg/kg q.4.w. (n = 7) | 2.5 mg/kg q.8.w. (n = 12) | 2.5 mg/kg q.12.w. (n = 12) | 2.5 mg/kg loading (n = 5) | 2.5 mg/kg split (n = 8) | 3.4 mg/kg split (n = 5) | RP2D (n = 5) | |
Belantamab mafodotin | ||||||||
Number of cycles administered, median (range) | 14 (2 to 32) | 27 (13 to 36) | 19 (7 to 30) | 13 (1 to 30) | 9 (6 to 37) | 23 (3 to 45) | 8 (1 to 24) | 15 (1 to 30) |
Number of expected doses, median (range) | 14 (2 to 32) | 27 (13 to 36) | 10 (4 to 15) | 5 (1 to 10) | 9 (6 to 37) | 23 (3 to 45) | 8 (1 to 24) | 8 (1 to 15) |
Number of doses administered, median (range) | 7 (2 to 20) | 8 (5 to 14) | 6 (2 to 11) | 3 (1 to 7) | 7 (2 to 25) | 9 (2 to 19) | 8 (1 to 22) | 4 (1 to 11) |
Number of doses missed, median (range) | 3 (0 to 22) | 14 (7 to 28) | 4 (0 to 9) | 2 (0 to 4) | 5 (2 to 27) | 15 (1 to 26) | 0 (0 to 8) | 3 (0 to 9) |
Intended dose intensity (mg/kg q.4.w.) | 1.92 | 2.5 | 1.25 | 0.83 | 2.5 | 2.5 | 3.4 | 1.25 |
Actual dose intensity (mg/kg q.4.w.), median (range) | 1.7 (0.5 to 1.9) | 0.5 (0.5 to 1.1) | 0.5 (0.2 to 0.9) | 0.3 (0.1 to 0.8) | 0.7 (0.5 to 1.6) | 0.6 (0.2 to 1.7) | 1.7 (0.7 to 3.2) | 0.5 (0.1 to 1.3) |
Relative dose intensity, median % (range) | 88 (29 to 100) | 22 (19 to 43) | 41 (16 to 75) | 36 (15 to 100) | 29 (20 to 62) | 50 (14 to 100) | 50 (20 to 95) | 37 (11 to 100) |
Pomalidomide | ||||||||
Patients with ≥ 1 dose reduction, n (%) | 7 (58.3) | 5 (71.4) | 6 (50.0) | 6 (50.0) | 3 (60.0) | 5 (62.5) | 1 (20.0) | 12 (31.6) |
Number of doses missed, median (range) | 0 (0 to 1) | 0 (0 to 3) | 0 (0 to 1) | 0 (0 to 0) | 0 (0 to 1) | 0 (0 to 1) | 0 (0 to 0) | 0 (0 to 1) |
Intended dose intensity (mg/kg q.4.w.) | 84 | 84 | 84 | 84 | 84 | 84 | 84 | 84 |
Actual dose intensity (mg/kg q.4.w.), median (range) | 84.0 (57.0 to 86.0) | 83.3 (52.6 to 84.7) | 84.0 (54.7 to 84.0) | 81.8 (58.4 to 84.2) | 83.4 (75.8 to 84.0) | 83.4 (50.1 to 84.0) | 84.0 (61.3 to 84.0) | 84.0 (54.7 to 86.0) |
Relative dose intensity, median % (range) | 100 (70 to 100) | 100 (60 to 100) | 100 (70 to 100) | 100 (70 to 100) | 100 (90 to 100) | 100 (60 to 100) | 100 (70 to 100) | 100 (70 to 100) |
q.4.w. = every 4 weeks; q.8.w. = every 8 weeks; q.12.w. = every 12 weeks; RP2D = recommended phase 2 dose.
a1.92 mg/kg q.4.w.: belantamab mafodotin 1.92 mg/kg, single dose, every 4 weeks; 2.5 mg/kg q.4.w., q.8.w., or q.12.w.: belantamab mafodotin 2.5 mg/kg, single dose, every 4 weeks, every 8 weeks, or every 12 weeks; 2.5 mg/kg loading: belantamab mafodotin 2.5 mg/kg loading dose followed by 1.92 mg/kg every 4 weeks; 2.5 mg/kg split: belantamab mafodotin 2.5mg/kg, split evenly with 50% of the dose administered on days 1 and 8 of every cycle; 3.4 mg/kg split: belantamab mafodotin 3.4 mg/kg, split evenly with 50% of the dose administered on days 1 and 8 of every cycle; RP2D: belantamab mafodotin 2.5 mg/kg, every 8 weeks.
Sources: Trudel et al. (2024).73 Details included in the table are from the sponsor’s Summary of Clinical Evidence.22
Efficacy
Maximum Tolerated Dose and RP2D
The maximum tolerated dose based on the first cycle (28 days) of treatment was determined to be 2.5 mg/kg belantamab mafodotin. The regimen of 2.5 mg/kg every 8 weeks combined with 4 mg of pomalidomide and 40 mg of dexamethasone was selected as the RP2D.
ORR, OS, and PFS in Patients Treated at RP2D
In part 2, the median duration of follow-up for patients treated at RP2D (n = 38) was 13.9 months (range, 1.1 to 28.2). Out of these 38 patients treated at RP2D, 34 had 2 consecutive assessments and were considered response evaluable. The ORR for the patients with evaluable responses was 85.3% (29 of 34), with 32.4% (11 of 34) reaching CR or sCR, 41.2% (14 of 34) achieving VGPR, and 11.8% (4 of 34) having PR. In the 38 patients treated at RP2D, the median OS (months) was not reached (95% CI, not reached to not reached); the median PFS (months) was not reached (95% CI, 13.7 to not reached).
In the 38 patients treated at RP2D during part 2, 12 were from part 1. The median duration of follow-up for the 12 patients was 17.2 months (range, 6.0 to 28.2). The ORR was 91.7% (11 of 12), with 33.3% (4 of 12) reaching CR or sCR, 50.0% (6 of 12) achieving VGPR, and 8.3% (1 of 12) having PR. The median OS was not reached (95% CI, not reached to not reached); the median PFS was 18.3 months (95% CI, 10.8 to not reached).
ORR, OS, and PFS in All Patients Receiving Treatment
The median duration of follow-up for all patients receiving treatment was 14.5 months (range, 0.9 to 42.5). Out of the 87 patients, 81 had 2 consecutive assessments and were considered response evaluable. The ORR for the patients whose response was evaluable was 87.7% (71 of 81), with 33.3% (27 of 81) reaching CR or sCR, 39.5% (32 of 81) achieving VGPR, and 14.8% (12 of 81) having PR. The median OS was 34.0 months (95% CI, 24.4 to not reached), and the median PFS was 21.8 months (95% CI, 17.8 to 32.5).
ORR, OS, and PFS in Patients Treated at Doses Other Than RP2D
In patients treated with belantamab mafodotin at 1.92 mg/kg, single dose, every 4 weeks (n = 12), the median duration of follow-up was 14.1 months (range, 2.3 to 30.4). Out of the 12 patients, 11 had 2 consecutive assessments and were considered response evaluable. The ORR for the patients whose responses were evaluable was 72.7% (8 of 11), with 27.3% (3 of 11) reaching CR or sCR, 36.4% (4 of 11) achieving VGPR, and 9.1% (1 of 11) having PR. The median OS for all 12 patients was 21.4 months (95% CI, 15.7 to not reached); the median PFS was 16.9 months (95% CI, 5.3 to 19.7).
In patients treated with belantamab mafodotin at 2.5 mg/kg, single dose, every 4 weeks (n = 7), the median duration of follow-up was 24.4 months (range, 12.2 to 33.1). The ORR was 100.0% (7 of 7), with 42.9% (3 of 7) reaching CR or sCR, 57.1% (4 of 7) achieving VGPR, and 0.0% (0 of 7) having PR. The median OS was 32.0 months (95% CI, 30.0 to not reached); the median PFS was 25.3 months (95% CI, 11.8 to not reached).
In patients treated with belantamab mafodotin at 2.5 mg/kg, every 12 weeks (n = 12), the median duration of follow-up was 13.7 months (range, 0.9 to 27.3). Out of the 12 patients, 11 had 2 consecutive assessments and were considered response evaluable. The ORR for the patients whose response was evaluable was 100% (11 of 11), with 27.3% (3 of 11) reaching CR or sCR, 36.4% (4 of 11) achieving VGPR, and 36.4% (4 of 11) having PR. The median OS for all 12 patients was not reached (95% CI, 22.5 to not reached); the median PFS was 22.5 months (95% CI, 10.7 to not reached).
In patients treated with belantamab mafodotin at 2.5 mg/kg loading dose followed by 1.92 mg/kg every 4 weeks (n = 5), the median duration of follow-up was 8.7 months (range, 4.8 to 35.2). The ORR was 100.0% (5 of 5), with 40.0% (2 of 5) reaching CR or sCR, 40.0% (2 of 5) achieving VGPR, and 20.0% (1 of 5) having PR. The median OS was 34.4 months (95% CI, 24.4 to not reached); the median PFS was 9.0 months (95% CI, 5.3 to not reached).
In patients treated with belantamab mafodotin at 2.5 mg/kg, single dose, split evenly with 50% of the dose administered on days 1 and 8 of every cycle (n = 8), the median duration of follow-up was 20.1 months (range, 3.0 to 42.5). The ORR was 87.5% (7 of 8), with 62.5% (5 of 8) reaching CR or sCR, 12.5% (1 of 8) achieving VGPR, and 12.5% (1 of 8) having PR. The median OS was not reached (95% CI, 21.8 to not reached); the median PFS was not reached (95% CI, 21.8 to not reached).
In patients treated with belantamab mafodotin at 3.4 mg/kg, split evenly with 50% of the dose administered on days 1 and 8 of every cycle (n = 5), the median duration of follow-up was 7.1 months (range, 1.0 to 22.8). The ORR was 80.0% (4 of 5), with 0.0% (0 of 5) reaching CR or sCR, 60.0% (3 of 5) achieving VGPR, and 20.0% (1 of 5) having PR. The median OS was 20.0 months (95% CI, 7.3 to not reached); the median PFS was 19.6 months (95% CI, 3.7 to not reached).
Harms
The summary of TEAEs by dosing cohorts in part 1 of the ALGONQUIN study is shown in Table 30. One out of 7 (14%) participants in the 2.5 mg/kg every 4 weeks cohort and 2 out of 5 (40%) participants in the 3.4 mg/kg (split) cohort and reported dose-limiting toxicities.
The summary of TEAEs occurred in patients treated at RP2D in part 2 of the ALGONQUIN study is presented in Table 31. In patients treated at RP2D, the most common TEAE of any grade was decreased visual acuity (71.1%, 27 of 38), followed by keratopathy (65.8%, 25 of 38), fatigue (57.9%, 22 of 38), infection (47.4, 18 of 38), neutropenia (39.5%, 15 of 38), and thrombocytopenia (39.5%, 15 of 38). The most common grade 3 to 4 TEAEs included keratopathy (52.6%, 20 of 38), decreased visual acuity (39.5%, 15 of 38), neutropenia (36.8%, 14 of 38), and thrombocytopenia (34.2%, 13 of 38). Of patients treated at RP2D, 55.3% (21 of 38) had an objective decrease in BCVA of grade 3 to 4, 13.2% (5 of 38) had blurred vision of grade 3 to 4, and 10.5% (4 of 38) had other ocular AEs, including dry eyes, photophobia, and eye pain.
Table 30: TEAEs by Dosing Cohorts in the Dose-Escalation Phase (Part 1) of the ALGONQUIN Study
Harms | 1.92 mg/kg q.4.w. (n = 12) | 2.5 mg/kg q.4.w. (n = 7) | 2.5 mg/kg q.8.w. (n = 12) | 2.5 mg/kg q.12.w. (n = 12) | 2.5 mg/kg loading (n = 5) | 2.5 mg/kg split (n = 8) | 3.4 mg/kg split (n = 5) |
|---|---|---|---|---|---|---|---|
TEAEs of any grade (in ≥ 20% of patients), n (%) | |||||||
Keratopathy | 8 (66.7) | 7 (100.0) | 11 (91.7) | 8 (66.7) | 3 (60.0) | 7 (87.5) | 4 (80.0) |
Decreased visual acuity | 8 (66.7) | 7 (100.0) | 11 (91.7) | 8 (66.7) | 3 (60.0) | 7 (87.5) | 4 (80.0) |
Fatigue | 7 (58.3) | 7 (100.0) | 8 (66.7) | 7 (58.3) | 2 (40.0) | 4 (50.0) | 3 (60.0) |
Infection | 7 (58.3) | 2 (28.6) | 5 (41.7) | 9 (75.0) | 3 (60.0) | 4 (50.0) | 1 (20.0) |
Neutropenia | 7 (58.3) | 6 (85.7) | 7 (58.3) | 6 (50.0) | 1 (20.0) | 6 (75.0) | 2 (40.0) |
Thrombocytopenia | 7 (58.3) | 6 (85.7) | 9 (75.0) | 5 (41.7) | 1 (20.0) | 2 (25.0) | 2 (40.0) |
Diarrhea | 6 (50.0) | 2 (28.6) | 5 (41.7) | 5 (41.7) | 0 (0.0) | 3 (37.5) | 3 (60.0) |
Fever | 6 (50.0) | 4 (57.1) | 2 (16.7) | 3 (25.0) | 1 (20.0) | 5 (62.5) | 1 (20.0) |
Peripheral edema | 3 (25.0) | 2 (28.6) | 6 (50.0) | 4 (33.3) | 2 (40.0) | 5 (62.5) | 2 (40.0) |
Constipation | 6 (50.0) | 2 (28.6) | 6 (50.0) | 2 (16.7) | 2 (40.0) | 1 (12.5) | 2 (40.0) |
TEAEs of grade 3 to 4 (in ≥ 5% of patients), n (%) | |||||||
Keratopathy | 4 (33.3) | 7 (100.0) | 7 (58.3) | 7 (58.3) | 2 (40.0) | 5 (62.5) | 3 (60.0) |
Decreased visual acuity | 5 (41.7) | 4 (57.1) | 7 (58.3) | 6 (50.0) | 1 (20.0) | 6 (75.0) | 1 (20.0) |
Fatigue | 1 (8.3) | 3 (42.9) | 1 (8.3) | 2 (16.7) | 0 (0.0) | 2 (25.0) | 0 (0.0) |
Neutropenia | 5 (41.7) | 3 (42.9) | 6 (50.0) | 5 (41.7) | 1 (20.0) | 6 (75.0) | 2 (40.0) |
Infection | 4 (33.3) | 0 (0.0) | 0 (0.0) | 6 (50.0) | 2 (40.0) | 2 (25.0) | 1 (20.0) |
Thrombocytopenia | 5 (41.7) | 3 (42.9) | 8 (66.7) | 3 (25.0) | 1 (20.0) | 2 (25.0) | 2 (40.0) |
Diarrhea | 0 (0.0) | 0 (0.0) | 2 (16.7) | 1 (8.3) | 0 (0.0) | 0 (0.0) | 0 (0.0) |
Ocular events | |||||||
Keratopathy, grade 2, n (%) | 2 (16.7) | 0 (0.0) | 3 (25.0) | 1 (8.3) | 1 (20.0) | 1 (12.5) | 1 (20.0) |
Keratopathy, grade 3 to 4, n (%) | 4 (33.3) | 7 (100.0) | 7 (58.3) | 7 (58.3) | 2 (40.0) | 5 (62.5) | 3 (60.0) |
Keratopathy recovery from grade ≥ 2 to grade 1, n of N (%) | 5 of 6 (83.3) | 5 of 7 (71.4) | 6 of 10 (60.0) | 7 of 8 (87.5) | 1 of 3 (33.3) | 5 of 6 (83.3) | 2 of 4 (50.0) |
Decrease in BCVA, grade 2, n (%) | 4 (33.3) | 2 (28.6) | 1 (8.3) | 3 (25.0) | 1 (20.0) | 1 (12.5) | 2 (40.0) |
Decrease in BCVA, grade 3 to 4, n (%) | 5 (41.7) | 5 (71.4) | 11 (91.7) | 7 (58.3) | 4 (80.0) | 4 (50.0) | 3 (60.0) |
BCVA recovery from grade ≥ 2 to grade 1, n of N (%) | 7 of 9 (77.8) | 7 of 7 (100.0) | 4 of 12 (33.3) | 7 of 10 (70.0) | 3 of 5 (60.0) | 5 of 5 (100.0) | 0 of 5 (0.0) |
Blurred vision (participant-reported), grade 2, n (%) | 2 (16.7) | 3 (42.9) | 0 (0.0) | 1 (8.3) | 0 (0.0) | 1 (12.5) | 0 (0.0) |
Blurred vision (participant-reported), grade 3 to 4, n (%) | 1 (8.3) | 1 (14.3) | 2 (16.7) | 1 (8.3) | 0 (0.0) | 1 (12.5) | 0 (0.0) |
Other ocular toxicity, grade 2, n (%) | 1 (8.3) | 1 (14.3) | 0 (0.0) | 1 (8.3) | 1 (20.0) | 2 (25.0) | 0 (0.0) |
Other ocular toxicity, grade 3 to 4, n (%) | 0 (0.0) | 1 (14.3) | 0 (0.0) | 1 (8.3) | 0 (0.0) | 0 (0.0) | 0 (0.0) |
BCVA = best corrected visual acuity; q.4.w. = every 4 weeks; q.8.w. = every 8 weeks; q.12.w. = every 12 weeks; TEAE = treatment-emergent adverse event.
Source: Trudel et al. (2024).73
Table 31: TEAEs in Patients Treated at RP2D in the Dose-Expansion Phase (Part 2) of the ALGONQUIN Study
Harms | Patients treated at RP2D in the dose-expansion phase (part 2) (n = 38) |
|---|---|
TEAEs of any grade (in ≥ 20% of patients), n (%) | |
Keratopathy | 25 (65.8) |
Decreased visual acuity | 27 (71.1) |
Fatigue | 22 (57.9) |
Infection | 18 (47.4) |
Neutropenia | 15 (39.5) |
Thrombocytopenia | 15 (39.5) |
Diarrhea | 11 (28.9) |
Fever | 6 (15.8) |
Peripheral edema | 13 (34.2) |
Constipation | 11 (28.9) |
TEAEs of grade 3 to 4 (in ≥ 5% of patients), n (%) | |
Keratopathy | 20 (52.6) |
Decreased visual acuity | 15 (39.5) |
Fatigue | 2 (5.3) |
Neutropenia | 14 (36.8) |
Infection | 3 (7.9) |
Thrombocytopenia | 13 (34.2) |
Diarrhea | 3 (7.9) |
Ocular events | |
Keratopathy, grade 2, n (%) | 4 (10.5) |
Keratopathy, grade 3 to 4, n (%) | 20 (52.6) |
Keratopathy recovery from grade ≥ 2 to grade 1, n of N (%) | 13 of 24 (54.2) |
Decreased in BCVA, grade 2, n (%) | 9 (23.7) |
Decrease in BCVA, grade 3 to 4, n (%) | 21 (55.3) |
BCVA recovery from grade ≥ 2 to grade 1, n of N (%) | 15 of 30 (50.0) |
Blurred vision (participant-reported), grade 2, n (%) | 2 (5.3) |
Blurred vision (participant-reported), grade 3 to 4, n (%) | 5 (13.2) |
Other ocular toxicity, grade 2, n (%) | 4 (10.5) |
BCVA = best corrected visual acuity; RP2D = recommended phase 2 dose; TEAE = treatment-emergent adverse event.
Source: Trudel et al. (2024).73
Critical Appraisal
Internal Validity
The ALGONQUIN study provided insights into the use of belantamab mafodotin of various doses (1.92 mg/kg, 2.5 mg/kg, and 3.4 mg/kg) and schedules (every 4 weeks, every 8 weeks, and every 12 weeks). However, it did not address major gaps or limitations existing in the pivotal DREAMM-8 study (e.g., immaturity of OS data, high uncertainty in HRQoL outcomes due to the open-label design).
Overall, the certainty of the evidence generated from the ALGONQUIN study is very low due to the single-arm design. Lacking comparative data made the inferences on the efficacy and safety of BPd over available therapies challenging and unreliable. For instance, when there were no comparison groups, the interpretation of the OS results could be prone to bias because OS can be sensitive to natural history and progression of the disease as well as heterogeneity of patient characteristics.24-26
The ALGONQUIN study was open label, in which investigators and patients were aware of the treatment received. The assessment for response and progression end points, such as ORR and PFS, which relies on investigators’ knowledge and experience, was prone to the impact of detection bias due to the open-label design. Additionally, the risk of reporting bias due to the open-label study design could not be ruled out for subjective harms outcomes.
External Validity
All patients in the ALGONQUIN study were recruited from study sites in Canada. The eligibility criteria of the ALGONQUIN study were in general aligned with the criteria of the pivotal DREAMM-8 study. Therefore, results from the ALGONQUIN study were likely subject to similar external validity issues the DREAMM-8 study had.
Discussion
Summary of Available Evidence
One pivotal, multinational (including 3 sites in Canada) phase III open-label RCT was included in the systematic review. The DREAMM-8 study randomized 302 patients with r/r MM, in a 1:1 manner, to either BPd or PVd. Patients continued treatment until disease progression, death, unacceptable toxicity, start of a new antimyeloma therapy, withdrawal of consent, or end of study, whichever came first. The primary outcome of the DREAMM-8 study was PFS, and key secondary outcomes included OS, DOR, and MRD negativity rate.
The sponsor submitted an NMA, which compared BPd with the other comparator therapies in Canada for the treatment of MM including DVd; hKd; hKDd; isatuximab, high-dose carfilzomib, and daratumumab; Kd; PVd; SVd; Vd; and cyc-doublets (i.e., cyclophosphamide in combination with another medication).
The sponsor submitted 1 phase I/II, single-arm, open-label, multicentre study (the ALGONQUIN study) to address gaps in the evidence. The ALGONQUIN study evaluated various doses and schedules of BPd for patients with MM whose disease was lenalidomide-refractory and who had been exposed to a PI. The ALGONQUIN study comprised a dose-escalation phase (part 1) and a dose-expansion phase (part 2). A total of 87 patients with r/r MM, from 9 sites in Canada, were enrolled, with 61 patients in part 1 and 26 in part 2. The primary objectives of the ALGONQUIN study were to determine the RP2D and the schedule of belantamab mafodotin in part 1 as well as to establish the efficacy, as determined by ORR, for participants treated at the RP2D in part 2.
Interpretation of Results
Efficacy
PFS was the primary outcome of the DREAMM-8 study, and the results suggest that BPd likely provides a clinically significant benefit compared with PVd, with a median PFS that had not yet been reached in the BPd group (95% CI, 20.6 months to not reached) and was 12.7 months (95% CI, 9.1 to 18.5 months) in the PVd group. The OS data from the DREAMM-8 study were not mature (information fraction of 48%) at the time of IA2; therefore, this limits any conclusions that can be drawn about the impact of BPd compared with PVd when it comes to survival. The analysis of OS is further confounded by the large number of patients in each group who continued on to subsequent therapy after progression. However, PFS is generally considered to be a valid surrogate for OS. A recent review by Pawlyn et al. looked at the reliability of PFS as a surrogate for OS in MM, citing a number of studies where a PFS benefit ultimately resulted in a benefit for OS.74 The authors did note, however, that there were some studies where a PFS benefit did not translate into an OS benefit, and these were typically studies where there were heterogeneity in PFS responses between subgroups. The fact that PFS responses in the DREAMM-8 study appeared consistent across subgroups, and the fact that OS results appeared to be favouring BPd at IA2 suggest that the results at this interim analysis may translate into a clinically significant survival benefit at a subsequent interim analysis. Although MRD negativity, CRR, and DOR were not formally assessed, there appeared to be improvements for BPd compared with PVd for each of these outcomes, and DOR appeared to be longer with BPd than with PVd. Pawlyn et al. also noted that the success of new therapies that have or are emerging for MM means that patients are surviving longer, which means that longer follow-up is needed to arrive at a median OS. These delays tend to slow progress in a very dynamic therapeutic space, according to Pawlyn et al.
HRQoL is an important outcome for patients with MM, perhaps more than typical cancers, because patients tend to survive for a relatively long time, according to the clinical experts consulted on this review. Furthermore, the frequency of ocular AEs with belantamab mafodotin and the nature of those AEs, from reductions in visual acuity to irritation, suggest that harms may have an important impact on quality of life. Based on GRADE results from the DREAMM-8 study, there is very low confidence that BPd improves HRQoL assessed by the GHS domain of the EORTC QLQ-C30. One of the key reasons for this lack of confidence is the open-label design, which introduces considerable potential for bias into the analysis. For example, a 2023 survey of meta-epidemiologic studies by Wang et al. found that the lack of blinding likely results in an overestimation of the effect size for patient-reported outcomes.75 Coupled with the large amount of missing data for patient-reported outcomes, the lack of blinding means that no definitive conclusions can be drawn about whether BPd improves HRQoL compared with PVd, and this should be considered a limitation of the DREAMM-8 study.
Overall, results from the sponsor-submitted NMA using the fixed-effect model demonstrated a benefit for BPd compared with some comparator therapies in Canada for the treatment of MM. However, the results were sensitive to the model of analysis as findings from analysis using the random-effect model did not suggest any advantages with BPd over other relevant therapies regarding PFS, OS, and ORR. Key sources of uncertainty in the NMA results were the significant heterogeneity across its included studies and the sparsity of the networks, with only 1 study informing most treatment comparisons.
Lastly, the single-arm design of the ALGONQUIN study, which was submitted by the sponsor to address gaps in evidence, precluded any conclusion on the relative efficacy of BPd to relevant comparators. The study did not address major gaps or limitations of the pivotal DREAMM-8 study (e.g., immaturity of OS data, high uncertainty in HRQoL outcomes due to the open-label design).
Harms
Ocular AEs are the main harm associated with belantamab mafodotin. The ocular toxicity associated with this drug is well-described in the literature and appears to due to epithelial changes in the cornea.76 These changes to the cornea result in changes to visual acuity, as well as several other ocular AEs reported in the DREAMM-8 study, such as dry eye, foreign body sensation, and punctate keratitis. Most concerning are the changes in vision, reported in the DREAMM-8 study as grade 3 to 4 AEs, such as blurred vision, impaired vision, and reduced visual acuity. The product monograph for belantamab mafodotin has specific recommendations for how to manage dose adjustments in patients experiencing ocular toxicity, and the recommended dose modifications are based on findings from ophthalmic exams. The product monograph also recommends that the dose not be re-escalated after a dose reduction has been made due to ocular adverse reactions. The sponsor also took measures to reduce the risk of ocular AEs during the DREAMM-8 study, including using a cooling mask on the eyes during and for a few hours after infusions, as well as corticosteroid eye drops and artificial tears on an as-needed basis. If these measures are not implemented in the real world, there is a possibility that ocular events might be higher than observed in the trial. The sponsor also permitted dose reductions and delays during the study, largely based on screening for ocular toxicities. Although the proportions of patients requiring dose reductions were the same between groups (61% in each), there were more patients in the BPd group who had AEs leading to dose interruption or delay than in the PVd group (91% versus 75%). Most ocular toxicities were reversible and improved with dose reductions or delays. The mean number of weeks between doses of belantamab mafodotin increased over the course of the trial: 5.26 during the first 6 months; 11.91 during months 6 to 12; and 14.2 beyond 12 months of therapy.
The other AEs noted by the clinical experts were cytopenias, such as thrombocytopenia and neutropenia. There were more patients in the BPd group compared with the PVd group who experienced at least 1 thrombocytopenia event (36% versus 30%) or an event of any platelet count decreased (20% versus 15%) and more with events of grade 3 and 4 thrombocytopenia (24% versus 20%) or any platelet count decreased (15% versus 12%). Neutropenia occurred in more patients treated with BPd than PVd (48% versus 34%), and there were numerous infections that were more common with BPd than with PVd, and pneumonia as an SAE was more common with BPd than with PVd (18% versus 8% of patients). However, that assessment of harms is complicated by the fact that exposure to belantamab mafodotin was longer than it was with any of the components of PVd, as more patients switched to subsequent therapy in the PVd group.
The ALGONQUIN study provided harms data in patients who had received various doses of belantamab mafodotin (1.92 mg/kg, 2.5 mg/kg, and 3.4 mg/kg) at various intervals (every 4 weeks, every 8 weeks, and every 12 weeks). However, a comparative harm assessment was not possible with the study because of its single-arm design.
Conclusion
One open-label RCT was included in this systematic review. The DREAMM-8 study was a multinational (140 centres in 18 countries with 3 sites in Canada), sponsor-funded study that randomized 302 patients with r/r MM, 1:1, to either BPd or PVd, until disease progression, unacceptable toxicity, death, start of new antimyeloma therapy, withdrawn consent, or end of study. The findings suggest that BPd likely results in a clinically important improvement in PFS compared with treatment with PVd, after a median follow-up of 21.8 months. BPd may improve OS compared with PVd; however, the OS is still not mature at the time of this interim analysis, with an information fraction of only 48%. The evidence is less clear regarding whether BPd improves HRQoL compared with PVd, after 53 weeks of treatment, and assessment of patient-reported outcomes may have been biased by the lack of blinding in this study. The main harms associated with belantamab mafodotin are ocular AEs, such as blurred vision and changes in visual acuity. Belantamab mafodotin also appears to increase the risk of SAEs, including pneumonia; however, assessment of harms outcomes is complicated by the fact that patients in the BPd group were exposed to study drug longer than patients in the PVd group. Based on the fixed-effect model analysis, the sponsor-provided NMA suggested the benefit of BPd was not consistent and was influenced by the end points assessed (PFS, OS, or ORR), as well as the choice of comparator drug, in the treatment of MM in adult patients who have received at least 1 prior therapy including lenalidomide. However, the results of the NMA should be interpreted with consideration of its associated limitations, as described elsewhere in the report.
References
1.Blenrep (belantamab mafodotin): Cycle 1 – 2.5 mg/kg administered once; Cycle 2 onwards – 1.9 mg/kg administered once every 4 weeks until disease progression or unacceptable toxicity; intravenous infusion [product monograph]. GlaxoSmithKline Ltd.; July 21, 2025.
2.Kyle RA, Rajkumar SV. Criteria for diagnosis, staging, risk stratification and response assessment of multiple myeloma. Leukemia. 2009;23(1):3-9. doi: 10.1038/leu.2008.291 PubMed
3.Rajkumar SV, Dimopoulos MA, Palumbo A, et al. International Myeloma Working Group updated criteria for the diagnosis of multiple myeloma. Lancet Oncol. 2014;15(12):e538-48. doi: 10.1016/s1470-2045(14)70442-5 PubMed
4.Rajkumar SV. Multiple myeloma: 2024 update on diagnosis, risk-stratification, and management. Am J Hematol. 2024;99(9):1802-1824. doi: 10.1002/ajh.27422 PubMed
5.Bird SA, Boyd K. Multiple myeloma: an overview of management. Palliat Care Soc Pract. 2019;13:1178224219868235. doi: 10.1177/1178224219868235 PubMed
6.Landgren O, Weiss BM. Patterns of monoclonal gammopathy of undetermined significance and multiple myeloma in various ethnic/racial groups: support for genetic factors in pathogenesis. Leukemia. 2009;23(10):1691-7. doi: 10.1038/leu.2009.134 PubMed
7.Tsang M, Le M, Ghazawi FM, et al. Multiple myeloma epidemiology and patient geographic distribution in Canada: A population study. Cancer. 2019;125(14):2435-2444. doi: 10.1002/cncr.32128 PubMed
8.Canadian Cancer Society. Canadian Cancer Statistics 2024. Accessed January 14, 2025. https://cdn.cancer.ca/-/media/files/research/cancer-statistics/2024-statistics/2024-cmaj/2024_source_file.xlsx
9.Canadian Cancer Society. Survival statistics for multiple myeloma. Accessed January 14, 2025. https://cancer.ca/en/cancer-information/cancer-types/multiple-myeloma/prognosis-and-survival/survival-statistics
10.Kumar SK, Therneau TM, Gertz MA, et al. Clinical course of patients with relapsed multiple myeloma. Mayo Clin Proc. 2004;79(7):867-74. doi: 10.4065/79.7.867 PubMed
11.Kurtin S, Faiman B. The changing landscape of multiple myeloma: implications for oncology nurses. Clin J Oncol Nurs. 2013;17 Suppl:7-11. doi: 10.1188/13.Cjon.S2.7-11 PubMed
12.Nijhof IS, van de Donk N, Zweegman S, Lokhorst HM. Current and New Therapeutic Strategies for Relapsed and Refractory Multiple Myeloma: An Update. Drugs. 2018;78(1):19-37. doi: 10.1007/s40265-017-0841-y PubMed
13.Rajkumar SV, Harousseau JL, Durie B, et al. Consensus recommendations for the uniform reporting of clinical trials: report of the International Myeloma Workshop Consensus Panel 1. Blood. 2011;117(18):4691-5. doi: 10.1182/blood-2010-10-299487 PubMed
14.Moreau P, Kumar SK, San Miguel J, et al. Treatment of relapsed and refractory multiple myeloma: recommendations from the International Myeloma Working Group. Lancet Oncol. 2021;22(3):e105-e118. doi: 10.1016/s1470-2045(20)30756-7 PubMed
15.CDA-AMC. CDA Reimbursement Review Provisional Funding Algorithm: Multiple myeloma [sponsor submitted reference]. https://www.cadth.ca/sites/default/files/DRR/2023/PH0031%20Multiple%20Myeloma_Algorithm-Secured.pdf
16.Rajkumar SV. Multiple myeloma: 2022 update on diagnosis, risk stratification, and management. Am J Hematol. 2022;97(8):1086-1107. doi: 10.1002/ajh.26590 PubMed
17.Moreau P, Dimopoulos MA, Mikhael J, et al. Isatuximab, carfilzomib, and dexamethasone in relapsed multiple myeloma (IKEMA): a multicentre, open-label, randomised phase 3 trial. Lancet. 2021;397(10292):2361-2371. doi: 10.1016/S0140-6736(21)00592-4 PubMed
18.GlaxoSmithKline Inc. Systematic literature review (SLR) and Network meta-analysis (NMA) of B-Pd versus comparative treatments for patients with 2L+ relapsed/refractory multiple myeloma (RRMM). September 15, 2023.
19.GlaxoSmithKline Inc. Clinical Study Report: A Phase III, Multicenter, Open-Label, Randomized Study to Evaluate the Efficacy and Safety of Belantamab Mafodotin in Combination with Pomalidomide and Dexamethasone (B-Pd) versus Pomalidomide plus Bortezomib and Dexamethasone (PVd) in Participants with Relapsed/Refractory Multiple Myeloma (DREAMM 8); Study 207499. May 8, 2024.
20.Balshem H, Helfand M, Schünemann HJ, et al. GRADE guidelines: 3. Rating the quality of evidence. J Clin Epidemiol. 2011;64(4):401-6. doi: 10.1016/j.jclinepi.2010.07.015 PubMed
21.Santesso N, Glenton C, Dahm P, et al. GRADE guidelines 26: informative statements to communicate the findings of systematic reviews of interventions. J Clin Epidemiol. 2020;119:126-135. doi: 10.1016/j.jclinepi.2019.10.014 PubMed
22.Sponsor Summary of Clinical Evidence for BLENREP (belantamab mafodotin) in Combination with Pomalidomide and Dexamethasone (BPd) for the Treatment of Relapsing and/or Refractory Multiple Myeloma [internal sponsor's report]. In: Drug Reimbursement Review sponsor submission: Belantamab mafodotin (Blenrep®) in combination with pomalidomide and dexamethasone (BPd), 70 mg and 100 mg vials, IV infusion. GlaxoSmithKline Inc.; December 2024.
23.Sponsor response to Feb 27, 2025 CDA-AMC request for additional information regarding Blenrep + BPd CDA-AMC Review [internal additional sponsor's information]. GlaxoSmithKline Ltd. ; March 6, 2025.
24.European Medicines Agency. Guideline on the evaluation of anticancer medicinal products in man. 2017. Accessed November 6, 2024. https://www.ema.europa.eu/en/documents/scientific-guideline/guideline-evaluation-anticancer-medicinal-products-man-revision-5_en.pdf.
25.U.S. Food & Drug Administration. Clinical trial endpoints for the approval of cancer drugs and biologics - guidance for industry. 2018. Accessed November 5, 2024. https://www.fda.gov/media/71195/download
26.Zhou H, Sun L, Wang M. Statistical considerations of designs for single-arm proof-of-concept oncology trial with time-to-event endpoint. Contemp Clin Trials. 2023;129:107200. doi: 10.1016/j.cct.2023.107200 PubMed
27.Gerecke C, Fuhrmann S, Strifler S, Schmidt-Hieber M, Einsele H, Knop S. The Diagnosis and Treatment of Multiple Myeloma. Dtsch Arztebl Int. 2016;113(27-28):470-6. doi: 10.3238/arztebl.2016.0470 PubMed
28.Rajkumar SV. Multiple myeloma: 2016 update on diagnosis, risk-stratification, and management. Am J Hematol. 2016;91(7):719-34. doi: 10.1002/ajh.24402 PubMed
29.Talamo G, Farooq U, Zangari M, et al. Beyond the CRAB symptoms: a study of presenting clinical manifestations of multiple myeloma. Clin Lymphoma Myeloma Leuk. 2010;10(6):464-8. doi: 10.3816/CLML.2010.n.080 PubMed
30.Canadian Cancer Society. Stages of multiple myeloma. Accessed January 14, 2025. https://cancer.ca/en/cancer-information/cancer-types/multiple-myeloma/staging
31.Greipp PR, San Miguel J, Durie BG, et al. International staging system for multiple myeloma. J Clin Oncol. 2005;23(15):3412-20. doi: 10.1200/jco.2005.04.242 PubMed
32.CDA-AMC. CDA Reimbursement Review Selinexor (Xpovio) [sponsor submitted reference]. https://www.cadth.ca/selinexor
33.CDA-AMC. CDA Reimbursement Review for Ciltacabtagene Autoleucel (Carvykti) [for adult patients with MM who have received 1 to 3 prior lines of therapy] [sponsor submitted reference].
34.Health Canada. Bortezomib [product monograph] [sponsor submitted reference]. https://pdf.hres.ca/dpd_pm/00035071.PDF
35.Health Canada. Pomalidomide [product monograph] [sponsor submitted reference]. https://pdf.hres.ca/dpd_pm/00043809.PDF
36.Health Canada. Isatuximab [product monograph] [sponsor submitted reference]. https://pdf.hres.ca/dpd_pm/00062897.PDF
37.Health Canada. Daratumumab [product monograph] [sponsor submitted reference]. https://pdf.hres.ca/dpd_pm/00053751.PDF
38.Health Canada. Carfilzomib [product monograph] [sponsor submitted reference]. https://pdf.hres.ca/dpd_pm/00071782.PDF
39.Health Canada. Selinexor [product monograph] [sponsor submitted reference]. https://pdf.hres.ca/dpd_pm/00066090.PDF
40.Health Canada. Cyclophosphamide [product monograph] [sponsor submitted reference]. https://pdf.hres.ca/dpd_pm/00067461.PDF
41.Pazdur R. Endpoints for assessing drug activity in clinical trials. Oncologist. 2008;13 Suppl 2:19-21. doi: 10.1634/theoncologist.13-S2-19 PubMed
42.U.S. Food & Drug Administration. Clinical Trial Endpoints for the Approval of Cancer Drugs and Biologics: Guidance for Industry [sponsor submitted reference]. 2018. Accessed 15 April, 2024. https://www.fda.gov/media/71195/download
43.U.S. Food & Drug Administration. Hematologic Malignancies: Regulatory Considerations for Use of Minimal Residual Disease in Development of Drug and Biological Products for Treatment: Guidance for Industry [sponsor submitted reference]. 2020. https://www.fda.gov/media/134605/download
44.Aaronson NK, Ahmedzai S, Bergman B, et al. The European Organization for Research and Treatment of Cancer QLQ-C30: a quality-of-life instrument for use in international clinical trials in oncology. J Natl Cancer Inst. 1993;85(5):365-76. doi: 10.1093/jnci/85.5.365 PubMed
45.Fayers PM, Aaronson NK, Bjordal K, Groenvold M, Curran D, Bottomley A. The EORTC QLQ-C30 scoring manual (3rd Edition). European Organisation for Research and Treatment of Cancer; 2001. Accessed November 6, 2023. https://www.eortc.org/app/uploads/sites/2/2018/02/SCmanual.pdf
46.Osborne TR, Ramsenthaler C, Siegert RJ, Edmonds PM, Schey SA, Higginson IJ. What issues matter most to people with multiple myeloma and how well are we measuring them? A systematic review of quality of life tools. Eur J Haematol. 2012;89(6):437-57. doi: 10.1111/ejh.12012 PubMed
47.Kvam AK, Wisloff F, Fayers PM. Minimal important differences and response shift in health-related quality of life: A longitudinal study in patients with multiple myeloma. Health Qual Life Outcomes. 2010;8(1):79. doi: 10.1186/1477-7525-8-79 PubMed
48.Wisloff F, Eika S, Hippe E, et al. Measurement of health-related quality of life in multiple myeloma. Nordic Myeloma Study Group. Br J Haematol. 1996;92(3):604-13. doi: 10.1046/j.1365-2141.1996.352889.x PubMed
49.Danaher EH, Ferrans C, Verlen E, et al. Fatigue and physical activity in patients undergoing hematopoietic stem cell transplant. Oncol Nurs Forum. 2006;33(3):614-24. doi: 10.1188/06.ONF.614-624 PubMed
50.Molassiotis A, Wilson B, Blair S, Howe T, Cavet J. Unmet supportive care needs, psychological well-being and quality of life in patients living with multiple myeloma and their partners. Psychooncology. 2011;20(1):88-97. doi: 10.1002/pon.1710 PubMed
51.Ringdal K, Ringdal GI, Kaasa S, et al. Assessing the consistency of psychometric properties of the HRQoL scales within the EORTC QLQ-C30 across populations by means of the Mokken Scaling Model. Qual Life Res. 1999;8(1-2):25-43. doi: 10.1023/a:1026419414249 PubMed
52.Kvam AK, Fayers PM, Wisloff F. Responsiveness and minimal important score differences in quality-of-life questionnaires: A comparison of the EORTC QLQ-C30 cancer-specific questionnaire to the generic utility questionnaires EQ-5D and 15D in patients with multiple myeloma. Eur J Haematol. 2011;87(4):330-7. doi: 10.1111/j.1600-0609.2011.01665.x PubMed
53.Kvam AK, Fayers P, Wisloff F. What changes in health-related quality of life matter to multiple myeloma patients? A prospective study. Eur J Haematol. 2010;84(4):345-53. doi: 10.1111/j.1600-0609.2009.01404.x PubMed
54.Richardson PG, Oriol A, Beksac M, et al. Pomalidomide, bortezomib, and dexamethasone for patients with relapsed or refractory multiple myeloma previously treated with lenalidomide (OPTIMISMM): a randomised, open-label, phase 3 trial. Lancet Oncol. 2019;20(6):781-794. doi: 10.1016/S1470-2045(19)30152-4 PubMed
55.Brookmeyer R, Crowley J. A Confidence Interval for the Median Survival Time. Biometrics. 1982;38(1):29-41. doi: 10.2307/2530286
56.GlaxoSmithKline Inc. Product Monograph: Blenrep (belantamab in combination with pomalidomide and dexamethasone). 2024.
57.Yang ZR, Sun F, Zhan SY. [Risk on bias assessment: (2) Revised Cochrane risk of bias tool for individually randomized, parallel group trials (RoB2.0)]. Zhonghua Liu Xing Bing Xue Za Zhi. 2017;38(9):1285-1291. doi: 10.3760/cma.j.issn.0254-6450.2017.09.028 PubMed
58.Dimopoulos M, Quach H, Mateos MV, et al. Carfilzomib, dexamethasone, and daratumumab versus carfilzomib and dexamethasone for patients with relapsed or refractory multiple myeloma (CANDOR): results from a randomised, multicentre, open-label, phase 3 study. Lancet. 2020;396(10245):186-197. doi: 10.1016/S0140-6736(20)30734-0 PubMed
59.Moreau P, Mateos MV, Berenson JR, et al. Once weekly versus twice weekly carfilzomib dosing in patients with relapsed and refractory multiple myeloma (A.R.R.O.W.): interim analysis results of a randomised, phase 3 study. Lancet Oncol. 2018;19(7):953-964. doi: 10.1016/S1470-2045(18)30354-1 PubMed
60.Grosicki S, Simonova M, Spicka I, et al. Once-per-week selinexor, bortezomib, and dexamethasone versus twice-per-week bortezomib and dexamethasone in patients with multiple myeloma (BOSTON): a randomised, open-label, phase 3 trial. Lancet. 2020;396(10262):1563-1573. doi: 10.1016/S0140-6736(20)32292-3 PubMed
61.Palumbo A, Chanan-Khan A, Weisel K, et al. Daratumumab, Bortezomib, and Dexamethasone for Multiple Myeloma. N Engl J Med. 2016;375(8):754-66. doi: 10.1056/NEJMoa1606038 PubMed
62.Kropff M, Vogel M, Bisping G, et al. Bortezomib and low-dose dexamethasone with or without continuous low-dose oral cyclophosphamide for primary refractory or relapsed multiple myeloma: a randomized phase III study. Ann Hematol. 2017;96(11):1857-1866. doi: 10.1007/s00277-017-3065-z PubMed
63.Dimopoulos MA, Moreau P, Palumbo A, et al. Carfilzomib and dexamethasone versus bortezomib and dexamethasone for patients with relapsed or refractory multiple myeloma (ENDEAVOR): a randomised, phase 3, open-label, multicentre study. Lancet Oncol. 2016;17(1):27-38. doi: 10.1016/S1470-2045(15)00464-7 PubMed
64.San-Miguel JF, Hungria VT, Yoon SS, et al. Panobinostat plus bortezomib and dexamethasone versus placebo plus bortezomib and dexamethasone in patients with relapsed or relapsed and refractory multiple myeloma: a multicentre, randomised, double-blind phase 3 trial. Lancet Oncol. 2014;15(11):1195-206. doi: 10.1016/S1470-2045(14)70440-1 PubMed
65.Orlowski RZ, Moreau P, Niesvizky R, et al. Carfilzomib-Dexamethasone Versus Bortezomib-Dexamethasone in Relapsed or Refractory Multiple Myeloma: Updated Overall Survival, Safety, and Subgroups. Clin Lymphoma Myeloma Leuk. 2019;19(8):522-530 e1. doi: 10.1016/j.clml.2019.04.018 PubMed
66.Usmani SZ, Quach H, Mateos MV, et al. Final analysis of carfilzomib, dexamethasone, and daratumumab vs carfilzomib and dexamethasone in the CANDOR study. Blood Adv. 2023;7(14):3739-3748. doi: 10.1182/bloodadvances.2023010026 PubMed
67.Mateos MV, Sonneveld P, Hungria V, et al. Daratumumab, Bortezomib, and Dexamethasone Versus Bortezomib and Dexamethasone in Patients With Previously Treated Multiple Myeloma: Three-year Follow-up of CASTOR. Clin Lymphoma Myeloma Leuk. 2020;20(8):509-518. doi: 10.1016/j.clml.2019.09.623 PubMed
68.Ren S, Oakley JE, Stevens JW. Incorporating Genuine Prior Information about Between-Study Heterogeneity in Random Effects Pairwise and Network Meta-analyses. Med Decis Making. 2018;38(4):531-542. doi: 10.1177/0272989X18759488 PubMed
69.Turner RM, Jackson D, Wei Y, Thompson SG, Higgins JP. Predictive distributions for between-study heterogeneity and simple methods for their application in Bayesian meta-analysis. Stat Med. 2015;34(6):984-98. doi: 10.1002/sim.6381 PubMed
70.Spiegelhalter DJ, Best NG, Carlin BP, Van Der Linde A. Bayesian Measures of Model Complexity and Fit. J R Stat Soc Series B Stat Methodol. 2002;64(4):583-639. doi: 10.1111/1467-9868.00353
71.Brooks SP, Gelman A. General Methods for Monitoring Convergence of Iterative Simulations. J Comput Graph Stat. 1998;7(4):434-455. doi: 10.1080/10618600.1998.10474787
72.GlaxoSmithKline Inc. Systematic literature review (SLR) and Network meta-analysis (NMA) of B-Pd versus comparative treatments for patients with 2L+ relapsed/refractory multiple myeloma (RRMM). September 15, 2023.
73.Trudel S, McCurdy A, Louzada ML, et al. Belantamab mafodotin, pomalidomide and dexamethasone in refractory multiple myeloma: A phase 1/2 trial. Nat Med. 2024;30(2):543-551. doi: 10.1038/s41591-023-02703-y PubMed
74.Pawlyn C, Schjesvold FH, Cairns DA, et al. Progression-free survival as a surrogate endpoint in myeloma clinical trials: an evolving paradigm. Blood Cancer J. 2024;14(1):134. doi: 10.1038/s41408-024-01109-4 PubMed
75.Wang Y, Parpia S, Couban R, et al. Compelling evidence from meta-epidemiological studies demonstrates overestimation of effects in randomized trials that fail to optimize randomization and blind patients and outcome assessors. J Clin Epidemiol. 2024;165:111211. doi: 10.1016/j.jclinepi.2023.11.001 PubMed
76.Wahab A, Rafae A, Mushtaq K, et al. Ocular Toxicity of Belantamab Mafodotin, an Oncological Perspective of Management in Relapsed and Refractory Multiple Myeloma. Front Oncol. 2021;11:678634. doi: 10.3389/fonc.2021.678634 PubMed
Pharmacoeconomic Review
Abbreviations
AE
adverse event
BIA
budget impact analysis
BPd
belantamab mafodotin, pomalidomide, and dexamethasone
CDA-AMC
Canada’s Drug Agency
cilta-cel
ciltacabtagene autoleucel
CUA
cost-utility analysis
CyKd
cyclophosphamide, carfilzomib, and dexamethasone
CyPd
cyclophosphamide, pomalidomide, and dexamethasone
CyBorD
cyclophosphamide, bortezomib, and dexamethasone
DVd
daratumumab, bortezomib, and dexamethasone
ICER
incremental cost-effectiveness ratio
IPD
individual participant data
IsaKd
isatuximab, carfilzomib, and dexamethasone
IsaPd
isatuximab, pomalidomide, and dexamethasone
ITC
indirect treatment comparison
Kd
carfilzomib and dexamethasone
MM
multiple myeloma
NMA
network meta-analysis
OS
overall survival
Pd
pomalidomide and dexamethasone
PFS
progression-free survival
PVd
pomalidomide, bortezomib, and dexamethasone
QALY
quality-adjusted life-year
RDI
relative dose intensity
r/r
relapsed or refractory
SVd
selinexor, bortezomib, and dexamethasone
Vd
bortezomib and dexamethasone
Economic Review
The objective of the economic review undertaken by Canada’s Drug Agency (CDA-AMC) is to review and critically appraise the pharmacoeconomic evidence submitted by the sponsor on the cost-effectiveness and budget impact of belantamab mafodotin, pomalidomide, and dexamethasone (BPd) versus comparators for the treatment of adults with relapsed or refractory (r/r) multiple myeloma (MM) who have received at least 1 prior line of therapy, including lenalidomide.
Item | Description |
|---|---|
Drug product | Belantamab mafodotin (Blenrep), powder for solution for injection (50 mg/mL), 70 mg and 100 mg single-use vials |
Indication | Belantamab mafodotin in combination with pomalidomide and dexamethasone is indicated for the treatment of adults with relapsed or refractory multiple myeloma who have received at least 1 prior line of therapy, including lenalidomide. |
Submitted price | Belantamab mafodotin: $19,460.00 per 70 mg vial Belantamab mafodotin: $27,800.00 per 100 mg vial |
Health Canada approval status | NOC |
Health Canada review pathway | Standard review |
NOC date | July 21, 2025 |
Reimbursement request | Per indication |
Sponsor | GlaxoSmithKline Inc. |
Submission history | Previously reviewed: No |
NOC = Notice of Compliance.
Key Messages
Belantamab mafodotin is available as a powder for solution for injection (50 mg/mL). At the submitted price of $278.00 per mg (available as 70 mg or 100 mg single-use vials), the 28-day cycle cost of belantamab mafodotin is expected to be $55,600 per patient in the first cycle of treatment and $47,260 in subsequent cycles, based on the Health Canada–recommended dosage.
Clinical efficacy in the economic analysis was derived from the DREAMM-8 trial, which compared BPd with pomalidomide, bortezomib, and dexamethasone (PVd). Evidence from the DREAMM-8 trial suggests that BPd likely results in a clinically important improvement in progression-free survival (PFS) and may improve overall survival (OS) compared with PVd for patients with MM. However, OS data remain immature, with only 48% of events observed at the time of the interim analysis. For comparisons with other regimens, the sponsor submitted an indirect treatment comparison (ITC). Results from the fixed-effects model suggest a numerically favourable PFS and OS benefit for BPd, when compared with relevant comparators. Results from the random-effect model, however, did not demonstrate a clear PFS or OS advantage for BPd over these comparators. These findings should be interpreted with consideration of the limitations associated with the ITC, including significant heterogeneity across the included studies.
The results of the CDA-AMC base case suggest:
the following treatments are on the cost-effectiveness frontier: bortezomib and dexamethasone (Vd), PVd, carfilzomib and dexamethasone (Kd), and BPd
BPd will be associated with higher costs to the health care system than Kd (incremental costs = $1,113,326), primarily driven by increased drug acquisition costs associated with BPd
BPd will be associated with a gain of 0.63 life-years (LYs) compared with Kd and is anticipated to improve health-related quality of life based on time in health states where BPd may result in a gain of 0.42 quality-adjusted life-years (QALYs) compared with Kd
the incremental cost-effectiveness ratio (ICER) of BPd compared with Kd is $2,661,253 per QALY gained in the CDA-AMC base case. The estimated ICER was highly sensitive to the predicted OS benefit and drug acquisition costs of BPd, and more than 55% of the incremental benefit was gained in the extrapolated period (i.e., after 36 months). In the absence of comparative evidence beyond this time point and uncertainty in the comparative clinical evidence, the QALYs gained for patients receiving BPd predicted in the CDA-AMC base case are highly uncertain and may be overestimated. Additional price reductions may therefore be required.
CDA-AMC estimates that the budget impact of reimbursing BPd for the treatment of r/r MM who have received at least 1 prior therapy, including lenalidomide, will be approximately $485 million over the first 3 years of reimbursement compared with the amount currently spent on comparators, with an estimated expenditure of $680 million on BPd over this period. The actual budget impact of reimbursing BPd will depend on BPd dosing assumptions, drug utilization, and distribution of subsequent therapies. At the submitted price, the incremental budget impact of BPd is expected to be greater than $40 million in years 1, 2, and 3 of reimbursement, and the economic feasibility of adoption must be addressed. Additionally, the magnitude of uncertainty in the budget impact must be addressed to ensure the feasibility of adoption, given the difference between the sponsor’s estimate and the CDA-AMC estimate.
Summary of the Submitted Economic Evaluation
The sponsor submitted a cost-utility analysis (CUA) to estimate the cost-effectiveness of BPd from the perspective of a public drug plan payer in Canada over a lifetime horizon (34 years). The modelled population comprised adult patients with r/r MM who had received at least 1 prior line of therapy, including lenalidomide, and who had progressive disease during or after the most recent therapy. This is aligned with the Health Canada indication and reimbursement request and was based on the participants in the DREAMM-8 trial. The sponsor’s base-case analysis included costs related to drug acquisition (i.e., submitted price for belantamab mafodotin as part of the BPd regimen and public list prices for comparators), administration, subsequent treatment, health care resource use, adverse events (AEs), and end-of-life costs.
In the sponsor’s base case, BPd was associated with incremental costs of $349,075 and 0.89 incremental QALYs relative to PVd. This resulted in an ICER of $393,451 per QALY gained. Of the incremental benefit compared with PVd (0.89 incremental QALYs), approximately 55% of benefit was predicted to be accrued after the treatment duration of the DREAMM-8 trial (trial period = 36 months). Additional information about the sponsor’s submission is summarized in Appendix 3.
CDA-AMC identified several key issues with the sponsor’s analysis (refer to Table 2; full details are provided in Appendix 4). A revised base case was therefore developed.
Table 2: Key Issues With the Sponsor’s Economic Submission
Issue | What evidence is there to inform this issue? | How was this issue addressed by CDA-AMC? | Did CDA-AMC explore uncertainty in a scenario analysis? |
|---|---|---|---|
The magnitude of comparative effectiveness of BPd is highly uncertain based on the indirect evidence submitted by the sponsor. | CDA-AMC’s clinical review could not draw definitive conclusions on relative effectiveness of BPd vs. comparators. | CDA-AMC could not address this issue in the base case due to the lack of clinical data. | No scenario analysis; best available evidence was used in the CDA-AMC base case. |
The long-term OS benefit predicted for BPd relative to other comparators is highly uncertain. | The sponsor predicted an OS benefit for BPd over PVd based on immature DREAMM-8 data. Clinical experts noted that long-term survival remains highly uncertain. | CDA-AMC could not address this issue in the base case due to the lack of clinical data. | To explore uncertainty, CDA-AMC conducted a scenario analysis based on an alternative distribution to extrapolate long-term OS for BPd. |
The modelling of TTD led to projections that did not meet face validity and underestimated the drug acquisition cost associated with BPd. | The sponsor assumed patients on BPd would discontinue treatment even if progression free, but this was not supported by trial data, where progression was the primary reason for stopping treatment. | CDA-AMC assumed alternative parametric distributions to extrapolate TTD for BPd and PVd, resulting in fewer patients being assumed to discontinue treatment while progression free. | No scenario analysis was conducted because selected distributions provided best statistical fit for extrapolating TTD. |
The IPD-based approach used to calculate BPd costs underestimated drug acquisition costs. | The sponsor applied dose categorizations and assumptions in the IPD approach that led to an underestimation of BPd drug acquisition costs. | CDA-AMC adopted dosing based on the product monograph, applying RDI consistent with the approach used for PVd and all nontrial comparators. | A scenario analysis was conducted to explore the impact of adopting an IPD costing approach for BPd, as well as the cost of ophthalmologic examinations before infusions, reflecting the Health Canada product monograph. |
The exclusion of ocular toxicity due to BPd from the analysis is inappropriate. Ocular AEs included severe keratopathy, blurred vision, and dry eyes. | The sponsor did not account for disutility associated with ocular toxicity from BPd, despite its occurrence in DREAMM-8 and its identification by clinical experts as an important consideration in clinical decision-making. | CDA-AMC included disutility associated with grade 3 and greater ocular toxicity events from BPd. | No scenario analysis; best available evidence was used in the CDA-AMC base case. |
The modelling of subsequent therapy is highly uncertain. | The sponsor modelled subsequent therapies as a single 1 time cost, which is methodologically inappropriate. Additionally, the distribution of subsequent treatments lacked face validity. | CDA-AMC excluded subsequent therapy from the base-case analysis. As a result, the impact of these costs on the cost-effectiveness of BPd remains unknown. | CDA-AMC conducted a scenario analysis incorporating subsequent therapy and adjusted fourth-line treatment shares to reflect clinical practice. |
The treatment schedule for carfilzomib and dexamethasone is not reflective of practice in Canada. | The sponsor assumed twice-weekly dosing for Kd, but evidence supports the more effective and commonly used once-weekly regimen. | CDA-AMC adopted the once-weekly dosing schedule in the base-case analysis. | No scenario analysis; best available evidence was used in CDA-AMC base case. |
AE = adverse event; BPd = belantamab mafodotin, pomalidomide, and dexamethasone; CDA-AMC = Canada’s Drug Agency; IPD = individual participant data; Kd = carfilzomib and dexamethasone; OS = overall survival; PVd = pomalidomide, bortezomib, and dexamethasone; RDI = relative dose intensity; TTD = time to treatment discontinuation.
CDA-AMC Assessment of Cost-Effectiveness
The CDA-AMC base case was derived by making changes to model parameter values and assumptions (refer to Table 8), in consultation with clinical experts. Detailed information about the base case is provided in Appendix 4.
Impact on Health Care Costs
BPd is expected to be associated with additional health care costs compared with Kd (incremental costs = $1,113,326). This increase in health care spending results from drug acquisition costs associated with belantamab mafodotin (refer to Figure 1).
Impact on Health
Relative to Kd, BPd is expected to increase the amount of time a patient remains in the PFS health state by approximately 1.65 years and extend OS by 0.63 years (refer to Figure 2). Considering the impact of treatment on both quality and length of life, BPd is expected to result in 0.46 additional QALYs per patient compared with Kd.
Figure 1: Impact of BPd vs. Kd on Health Care Costs
BPd = belantamab mafodotin, pomalidomide, and dexamethasone; Kd = carfilzomib and dexamethasone; PVd = pomalidomide, bortezomib, and dexamethasone; Vd = bortezomib and dexamethasone; vs. = versus.
Note: Results for Vd and PVd are not presented in this figure. Refer to Appendix 4 for full results.
Figure 2: Impact of BPd vs. Kd on Patient Health
BPd = belantamab mafodotin, pomalidomide, and dexamethasone; Kd = carfilzomib and dexamethasone; PFS = progression-free survival; PD = progressed disease; PVd = pomalidomide, bortezomib, and dexamethasone; QALY = quality-adjusted life-year; vs. = versus.
Note: Results for Vd and PVd are not presented in this figure. Refer to Appendix 4 for full results.
Overall Results
The results of the CDA-AMC base case suggest an ICER of $2,661,253 per QALY gained for BPd compared to Kd (refer to Table 3). Additional details on the CDA-AMC base case are available in Appendix 4.
Table 3: Summary of CDA-AMC Economic Evaluation Results
Drug | Total costs ($) | Total QALYs | Sequential ICER ($/QALY) |
|---|---|---|---|
Vd | 95,522 | 2.45 | Reference |
PVd | 155,923 | 3.11 | 92,650 vs. Vd |
Kd | 291,315 | 3.47 | 372,978 vs. PVd |
BPd | 1,404,641 | 3.89 | 2,661,253 vs. Kd |
BPd = belantamab mafodotin, pomalidomide, and dexamethasone; CDA-AMC = Canada’s Drug Agency; ICER = incremental cost-effectiveness ratio; Kd = carfilzomib and dexamethasone; PVd = pomalidomide, bortezomib, and dexamethasone; QALY = quality-adjusted life-year; Vd = bortezomib and dexamethasone; vs. = versus.
Note: Publicly available list prices were used for all comparators.
Uncertainty and Sensitivity
Due to immature data and the lack of long-term evidence, extrapolation of OS was uncertain. The impact of uncertainty on long-term OS for patients receiving BPd was explored in a scenario analysis (refer to Table 2). Based on the results of this analysis, BPd may be dominated (i.e., higher cost and lower benefit relative to comparators).
An additional scenario analysis was conducted to explore the impact of including subsequent therapies with fourth-line distribution adjusted to meet face validity according to clinical experts consulted for this review. Based on the results of this analysis, the ICER for BPd may be decreased to $1,950,441 per QALY gained compared with Kd.
An additional scenario analysis was conducted to explore the impact of adopting an individual participant data (IPD) costing approach for BPd, as well as the cost of ophthalmologic examinations before infusions, reflecting the Health Canada product monograph. Based on the results of this analysis, the ICER for BPd may be decreased to $851,612 per QALY gained compared to Kd.
Summary of the Budget Impact
The sponsor submitted a budget impact analysis (BIA) to estimate the 3-year (2025 to 2027) budget impact of reimbursing BPd for use in patients with r/r MM who have received at least 1 prior line of therapy, including lenalidomide.1 The sponsor assumed that the payer would be CDA-AMC–participating public drug plans and derived the size of the eligible population using an epidemiologic approach.2 The price of belantamab mafodotin was aligned with the price included in the sponsor’s economic evaluation, while the prices of comparators were based on the publicly available list prices.3,4 Additional information pertaining to the sponsor’s submission is provided in Appendix 5.
CDA-AMC identified numerous issues with the sponsor’s estimated budget impact and made changes to model parameters and assumptions in consultation with clinical experts to derive the CDA-AMC base case (Appendix 5). CDA-AMC estimated that 8,658 patients would be eligible for treatment with BPd over a 3-year period (year 1 = 2,811; year 2 = 2,887; year 3 = 2,961), of whom 1,177 are expected to receive BPd (year 1 = 142; year 2 = 370; year 3 = 665). The estimated incremental budget impact of reimbursing BPd is expected to be approximately $485 million over the first 3 years, with an expected expenditure of $680 million on BPd. The actual budget impact will depend on real-world dosing and drug utilization in clinical practice in Canada as well as the proportion and types of subsequent therapies.
Conclusions
Based on the CDA-AMC base case, BPd would be considered cost-effective at the submitted price if the public health care system was willing to pay at least $2,661,253 for each additional QALY gained. If the public health care system is not willing to pay that amount, a price reduction should be considered (refer to Figure 3; full details in Table 12). The estimated cost-effectiveness of BPd compared with Kd is uncertain due to immaturity of the available OS data and uncertainty in the long-term comparative clinical efficacy of treatment.
The budget impact of reimbursing BPd to the public drug plans in the first 3 years is estimated to be approximately $485 million. The 3-year expenditure on BPd (i.e., not accounting for current expenditure on comparators) is estimated to be $680 million. The estimated budget impact is highly uncertain due to dosing assumptions, drug utilization, subsequent therapy, and market share assumptions.
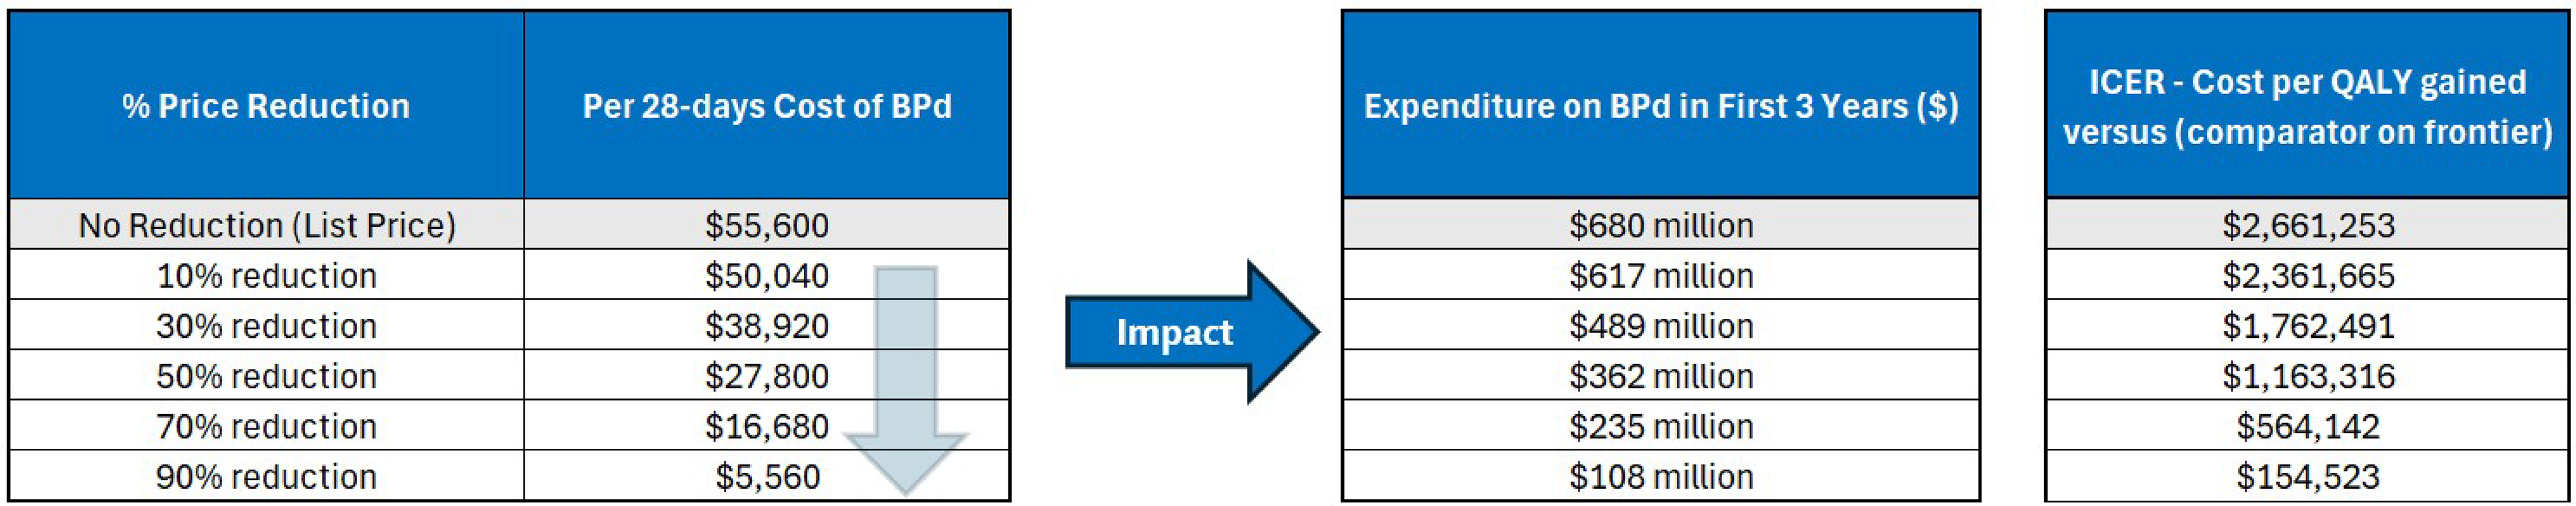
References
1.In: Drug Reimbursement Review sponsor submission: Blenrep (belantamab mafodotin for injection), Powder for solution for infusion, 70 mg/vial, 100 mg/vial, 50 mg/mL [product monograph]. GlaxoSmithKline; 2024 [draft].
2.Budget Impact Analysis [internal sponsor's report]. In: Drug Reimbursement Review sponsor submission: Blenrep (belantamab mafodotin for injection), Powder for solution for infusion, 70 mg/vial, 100 mg/vial, 50 mg/mL. Mississauga (ON): GlaxoSmithKline; 2024 Dec 19.
3.GSK. Data on File. Multiple Myeloma Internal Market Research. 2024.
4.DeltaPA. IQVIA; 2023. Accessed 2025 Feb 12. https://www.iqvia.com/
5.Pharmacoeconomic evaluation [internal sponsor's report]. In: Drug Reimbursement Review sponsor submission: Blenrep (belantamab mafodotin for injection), Powder for solution for infusion, 70 mg/vial, 100 mg/vial, 50 mg/mL. Mississauga (ON): GlaxoSmithKline; 2024 Dec 19.
6.GSK. Data on File. DREAMM-8 - Clinical Study Report. 2024.
7.GSK. Data on File. Parametric Survival Analyses for DREAMM-8 2024. Updated March 2024. Accessed May.
8.Sponsor's NMA report title [internal sponsor's report]. In: Drug Reimbursement Review sponsor submission: Blenrep (belantamab mafodotin for injection), Powder for solution for infusion, 70 mg/vial, 100 mg/vial, 50 mg/mL. Mississauga (ON): GlaxoSmithKline; 2024 Dec 19.
9.IQVIA. Data on File. Delta PA Price List. May 2024.
10.Ontario Ministry of Health and Long-Term Care. Schedule of Benefits. Physician Services Under the Health Insurance Act. 2024. https://www.ontario.ca/files/2024-04/moh-schedule-benefit-2024-02-20.pdf
11.CIHI. CIHI patient cost estimator. 2023. Accessed July 1 2024. https://www.cihi.ca/en/patient-cost-estimator
12.Ontario Ministry of Health. Schedule of Benefits for Optometry Services. 2023. https://www.ontario.ca/files/2024-01/moh-ohip-schedule-of-benefits-optometry-services-2024-01-24.pdf
13.Ontario Ministry of Health and Long-Term Care. Schedule of Benefits for Laboratory Services. 2024. https://www.ontario.ca/files/2024-01/moh-ohip-schedule-of-benefits-laboratory-services-2024-01-24.pdf
14.de Oliveira C, Pataky R, Bremner KE, et al. Phase-specific and lifetime costs of cancer care in Ontario, Canada. BMC Cancer. 2016;16(1):809. doi: 10.1186/s12885-016-2835-7 PubMed
15.GSK. Data on File. 207503 - EQ-5D-3L Utility Model - Canada Value Set. 2024.
16.Everest L, Blommaert S, Chu RW, Chan KKW, Parmar A. Parametric Survival Extrapolation of Early Survival Data in Economic Analyses: A Comparison of Projected Versus Observed Updated Survival. Value Health. 2022;25(4):622-629. doi: 10.1016/j.jval.2021.10.004 PubMed
17.Mian H, Reece D, Masih-Khan E, et al. Survival and outcomes of newly diagnosed multiple myeloma patients stratified by transplant status 2007-2018: retrospective analysis from the Canadian Myeloma Research Group Database. Clinical Lymphoma Myeloma and Leukemia. 2022;22(8):608-617. PubMed
18.pan-Canadian Pharmaceutical Alliance. Carvykti (ciltacabtagene autoleucel). 2024.
19.pan-Canadian Pharmaceutical Alliance. Elrexfio (elranatamab). 2024.
20.pan-Canadian Pharmaceutical Alliance. Tecvayli (teclistamab). 2024.
21.Moreau P, Mateos MV, Berenson JR, et al. Once weekly versus twice weekly carfilzomib dosing in patients with relapsed and refractory multiple myeloma (A.R.R.O.W.): interim analysis results of a randomised, phase 3 study. Lancet Oncol. 2018;19(7):953-964. doi: 10.1016/S1470-2045(18)30354-1 PubMed
22.pan-Canadian Oncology Drug Review Committee (pERC) final recommendation: Ciltacabtagene Autoleucel (Carvykti). CADTH; 2024. Accessed 2025 March 27. https://www.cda-amc.ca/sites/default/files/DRR/2024/PG0361REC_Carvykti_Final.pdf
23.Alliance p-CP. Carvykti Drug Negotiations Status. pan-Canadian Pharmaceutical Alliance; 2025. Accessed 2025 Mar 27. https://www.pcpacanada.ca/negotiation/22916
24.Drug Reimbursement Review: Belantamab mafodotin, bortezomib, dexamethasone for previously treated multiple myeloma. CADTH. 2025. Updated 2025 March 27. https://www.cda-amc.ca/belantamab-mafodotin-bortezomib-dexamethasone
25.Statistics Canada. Population estimates on July 1, by age and gender. 2024. Accessed May 24 2024. https://www150.statcan.gc.ca/t1/tbl1/en/tv.action?pid=1710000501
26.Canadian Cancer Statistics Advisory Committee in collaboration with the Canadian Cancer S, Statistics C, and the Public Health Agency of C. Canadian cancer statistics 2023. Canadian Cancer Society; 2023. Accessed 2025 Mar 21. https://cancer.ca/en/cancer-information/resources/publications/canadian-cancer-statistics-2023
27.CDA-AMC. CADTH Reimbursement Review: Isatuximab (SARCLISA). 2022. https://www.cda-amc.ca/sites/default/files/DRR/2022/PC0256-Sarclisa-CombinedReport.pdf
28.GSK. Data on file. Canadian KOL opinion from health care professional survey. 2024.
29.Dimopoulos MA, Beksac M, Pour L, et al. Belantamab Mafodotin, Pomalidomide, and Dexamethasone in Multiple Myeloma. N Engl J Med. 2024. PubMed
30.Dimopoulos MA, Palumbo A, Corradini P, et al. Safety and efficacy of pomalidomide plus low-dose dexamethasone in STRATUS (MM-010): a phase 3b study in refractory multiple myeloma. Blood, The Journal of the American Society of Hematology. 2016;128(4):497-503. PubMed
31.San-Miguel J, Dhakal B, Yong K, et al. Cilta-cel or Standard Care in Lenalidomide-Refractory Multiple Myeloma. N Engl J Med. 2023;389(4):335-347. doi: 10.1056/NEJMoa2303379 PubMed
32.NATIONAL INSTITUTE FOR HEALTH AND CARE EXCELLENCE. Teclistamab for treating relapsed and refractory multiple myeloma after 3 or more treatments- Draft Guidance consultation 2024.
33.EXCELLENCE NIFHAC. Elranatamab for treating relapsed or refractory multiple myeloma after 3 therapies. 2024.
34.Cancer Care Ontario. CARFDEXA Regimen. 2024. Available at https://www.cancercareontario.ca/sites/ccocancercare/files/CARFDEXA_HEM_MY.pdf
35.Alliance p-CP. Brand Name Drug Negotiations Status. pan-Canadian Pharmaceutical Alliance; 2025. Accessed 2025 Mar 21. https://www.pcpacanada.ca/negotiations
Appendix 1: Cost Comparison Table
Please note that this appendix has not been copy-edited.
The comparators presented in the following table have been deemed to be appropriate based on feedback from clinical experts and CDA-AMC–participating public drug plans. Comparators may be recommended (appropriate) practice or actual practice. Existing Product Listing Agreements are not reflected in the table and as such, the table may not represent the actual costs to public drug plans
Table 4: Cost Comparison for r/r MM
Treatment | Strength and/or concentration | Form | Price ($) | Recommended dosage | Daily cost ($) | 28-day cost ($)a |
|---|---|---|---|---|---|---|
Belantamab mafodotin plus pomalidomide plus dexamethasone (BPd) | ||||||
Belantamab | 70 mg 100 mg | Solution for infusion | 19,460.0000 27,800.0000 | Cycle 1: 2.5 mg/kg on day 1 for cycle of 28 days; Cycle 2+: 1.9 mg/kg on day 1 of each 28-day cycle thereafter | Cycle 1: 1,986 Cycle 2+: 1,688 | Cycle 1: 55,600 Cycle 2+: 47,260 |
Pomalidomide | 4 mg | Capsule | 125.0000 | 4 mg on days 1 to 21 of each 28-day cycle | 93.75 | 2,625 |
Dexamethasone | 4 mg | Tablet | 0.6112 | 40 mg on days 1, 8, 15, and 22 of each 28-day cycle | 0.87 | 24.45 |
BPd | Cycle 1: 2,080 Cyle 2+: 1,782 | Cycle 1: 58,249 Cycle 2+: 49,909 | ||||
Daratumumab plus bortezomib plus dexamethasone (DVd) IV | ||||||
Daratumumab | 100 mg 400 mg | Solution for infusion | 630.9100a 2,523.6400a | Cycle 1 to 3: 16 mg/kg on days 1, 8, and 15 of cycle 1 to 3 for a 21-day cycle Cycle 4 to 8: 16 mg/kg on day 1 of cycle 4 to 8 for a 21-day cycle Cycle 9+: 16 mg/kg on day 1 of cycle 9 onwards every 28 days | Cycle 1 to 3: 1,082 Cycle 4 to 8: 360.52 Cycle 9+: 270.39 | Cycle 1 to 3: 30,284 Cycle 4 to 8: 10,095 Cycle 9+: 7,571 |
Bortezomib | 3.5 mg | Powder in vial | 654.3100a | 1.3 mg/m2 on days 1, 4, 8, and 11 of cycle 1 to 8 for a 21-day cycle | Cycle 1 to 8: 124.63 | Cycle 1 to 8: 3,490 |
Dexamethasone | 4 mg | Tablet | 0.6112 | 20 mg on days 1, 2, 4, 5, 8, 9, 11, and 12 of cycle 1 to 8 for a 21-day cycle | Cycle 1 to 8: 1.16 | Cycle 1 to 8: 32.60 |
DVd IV | Cycle 1 to 3: 1,207 Cycle 4 to 8: 486.31 Cycle 9+: 270.39 | Cycle 1 to 3: 33,806 Cycle 4 to 8: 13,617 Cycle 9+: 7,571 | ||||
Daratumumab plus bortezomib plus dexamethasone (DVd) SC | ||||||
Daratumumab | 1,800 mg | Solution for subcutaneous injection | 7,712.0510a | Cycle 1 to 3: 1,800 mg on days 1, 8, and 15 of cycle 1 to 3 for a 21-day cycle Cycle 4 to 8: 1,800 mg on day 1 of cycle 4 to 8 for a 21-day cycle Cycle 9+: 1,800 mg on day 1 of cycle 9 onwards every 28 days | Cycle 1 to 3: 1,102 Cycle 4 to 8: 367.24 Cyle 9+: 275.43 | Cycle 1 to 3: 30,848 Cycle 4 to 8: 10,283 Cyle 9+: 7,712 |
Bortezomib | 3.5 mg | Powder in vial | 654.3100a | Cycle 1 to 8: 1.3 mg/m2 on days 1, 4, 8, and 11 of cycle 1 to 8 for a 21-day cycle | Cycle 1 to 8: 124.63 | Cycle 1 to 8: 3,490 |
Dexamethasone | 4 mg | Tablet | 0.6112 | Cycle 1 to 8: 20 mg on days 1, 2, 4, 5, 8, 9, 11, and 12 of cycle 1 to 8 for a 21-day cycle | Cycle 1 to 8: 1.16 | Cycle 1 to 8: 32.60 |
DVd SC | Cycle 1 to 3: 1,228 Cycle 4 to 8: 493.04 Cyle 9+: 275.43 | Cycle 1 to 3: 34,370 Cycle 4 to 8: 13,805 Cyle 9+: 7,712 | ||||
Selinexor plus bortezomib plus dexamethasone (SVd) | ||||||
Selinexor | 20 mg | Tablet | 550.0000a | 100 mg on days 1, 8, 15, 22, and 29 every 35 days | 392.86 | 11,000 |
Bortezomib | 3.5 mg | Powder in vial | 654.3100a | 1.3 mg/m2 on days 1, 8, 15, and 22 every 35 days | 74.78 | 2,094 |
Dexamethasone | 4 mg | Tablet | 0.6112 | 20 mg on days 1, 2, 8, 9, 15, 16, 22, 23, 29, and 30 every 35 days | 0.87 | 24.45 |
SVd | 468.51 | 13,118 | ||||
Pomalidomide plus bortezomib plus dexamethasone (PVd) | ||||||
Pomalidomide | 4 mg | Capsule | 125.0000 | 4 mg on days 1 to 14 every 21 days | 83.33 | 2,333 |
Bortezomib | 3.5 mg | Powder in vial | 654.3100a | Cycle 1 to 8: 1.3 mg/m2 on days 1, 4, 8, and 11 of cycle 1 to 8 for a 21-day cycle Cycle 9+: 1.3 mg/m2 on day 1 and 8 of cycle 9 every 21 days thereafter | Cycle 1 to 8: 124.63 Cyle 9+: 62.32 | Cycle 1 to 8: 3,490 Cyle 9+: 1,745 |
Dexamethasone | 4 mg | Tablet | 0.6112 | Cycle 1 to 8: 20 mg on days 1,2, 4, 5, 8, 9, 11, and 12 of cycle 1 to 8 for a 21-day cycle Cycle 9+: 20 mg on days 1, 2, 8, and 9 of cycle 9 every 21 days thereafter | Cycle 1 to 8: 1.16 Cyle 9+: 0.58 | Cycle 1 to 8: 32.60 Cyle 9+: 16.30 |
PVd | Cycle 1 to 8: 209.13 Cycle 9+: 146.23 | Cycle 1 to 8: 5,856 Cyle 9+: 4,094 | ||||
Isatuximab plus carfilzomib plus dexamethasone (IsaKd) | ||||||
Isatuximab | 100 mg | Solution for infusion | 757.9000a | Cycle 1: 10 mg/kg on days 1, 8, 15, and 22 of cycle 1 for a 28-day cycle Cycle 2+: 10 mg/kg on days 1 and 15 of cycle 2 every 28 days thereafter | Cycle 1: 866.17 Cycle 2+: 433.09 | Cycle 1: 24,253 Cycle 2+: 12,126 |
Carfilzomib | 10 mg | Powder in vial | 255.5500a | Cycle 1: 20 mg/m2 on days 1 and 2, followed by 56 mg/m2 on days 8, 9, 15, and 16 of cycle 1 for a 28-day cycle Cycle 2+: 56 mg/m2 on day 1, 2, 8, 9, 15, and 16 of cycle 2 every 28 days thereafter | Cycle 1: 511.11 Cycle 2+: 657.14 | Cycle 1: 14,311 Cycle 2+: 18,400 |
Dexamethasone | 4 mg | Tablet | 0.6112 | 20 mg on days 1,2, 4, 5, 8, 9, 11, and 12 every 28 days | 0.87 | 24.45 |
IsaKd | Cycle 1: 1,378 Cycle 2+: 1,091 | Cycle 1: 38,588 Cycle 2+: 30,551 | ||||
Carfilzomib plus dexamethasone (Kd) (once weekly) | ||||||
Carfilzomib | 10 mg | Powder in vial | 255.5500a | Cycle 1: 20 mg/m2 on day 1 followed by 70 mg/m2 on days 8 and 15 of cycle 1 for a 28-day cycle Cycle 2+: 70 mg/m2 on days 1, 8, and 15 of cycle 2 every 28 days thereafter | Cycle 1: 255.55 Cycle 2+: 328.57 | Cycle 1: 7,156 Cycle 2+: 9,200 |
Dexamethasone | 4 mg | Tablet | 0.6112 | 40 mg on days 1, 8, 15, and 22 every 28 days | 0.87 | 24.45 |
Kd (once weekly) | Cycle 1: 256.43 Cycle 2+: 658.01 | Cycle 1: 7,180 Cycle 2+: 18,424 | ||||
Carfilzomib plus dexamethasone (Kd) (twice weekly) | ||||||
Carfilzomib | 10 mg | Powder in vial | 255.5500a | Cycle 1: 20 mg/m2 on days 1 and 2, followed by 56 mg/m2 on days 8, 9, 15, and 16 of cycle 1 for a 28-day cycle Cycle 2+: 56 mg/m2 on days 1, 2, 8, 9, 15, and 16 of cycle 2 every 28 days thereafter | Cycle 1: 511.11 Cycle 2+: 657.14 | Cycle 1: 7,156 Cycle 2+: 18,400 |
Dexamethasone | 4 mg | Tablet | 0.6112 | 20 mg on days 1,2, 8, 9, 15, 16, 22, and 23 every 28 days | 0.87 | 24.45 |
Kd (twice weekly) | Cycle 1: 511.98 Cycle 2+: 658.01 | Cycle 1: 14,336 Cycle 2+: 18,424 | ||||
Pomalidomide plus dexamethasone (Pd) | ||||||
Pomalidomide | 4 mg | Capsule | 125.0000 | 4 mg on days 1 to 21 every 28 days | 93.75 | 2,625 |
Dexamethasone | 4 mg | Tablet | 0.6112 | 40 mg on days 1, 8, 15, and 22 every 28 days | 0.87 | 24.45 |
Pd | 94.62 | 2,650 | ||||
Bortezomib plus dexamethasone (Vd) | ||||||
Bortezomib | 3.5 mg | Powder in vial | 654.3100a | 1.3 mg/m2 on days 1, 8, 15, and 22 every 35 days | 74.78 | 2,094 |
Dexamethasone | 4 mg | Tablet | 0.6112 | 40 mg once weekly every 35 days | 0.87 | 24.45 |
Vd | 75.65 | 2,118 | ||||
Isatuximab plus pomalidomide plus dexamethasone (IsaPd) | ||||||
Isatuximab | 120 mg | Solution for infusion | 757.9000a | Cycle 1: 10 mg/kg on days 1, 8, 15, and 22 of cycle 1 for a 28-day cycle Cycle 2+: 10 mg/kg on days 1 and 15 of cycle 2 every 28 days thereafter | Cycle 1: 866.17 Cycle 2+: 433.09 | Cycle 1: 24,253 Cycle 2+: 12,126 |
Pomalidomide | 4 mg | Capsule | 125.0000 | 4 mg on days 1 to 21 every 28 days | 93.75 | 2,625 |
Dexamethasone | 4 mg | Tablet | 0.6112 | 40 mg on days 1, 8, 15, and 22 every 28 days | 0.87 | 24.45 |
IsaPd | Cycle 1: 960.79 Cycle 2+: 527.71 | Cycle 1: 26,902 Cycle 2+: 14,776 | ||||
Cyclophosphamide plus carfilzomib plus dexamethasone (CyKd) | ||||||
Cyclophosphamide | 25 mg 50 mg | Tablet | 0.3545 0.4773 | Cycle 1 to 12: 300 mg/m2 on days 1, 8, 15, and 22 of cycle 1 to 12 for a 28-day cycle | Cycle 1 to 12: 0.75 | Cycle 1 to 12: 21.00 |
Carfilzomib | 10 mg | Powder in vial | 255.5500a | Cycle 1: 20 mg/m2 on day 1 followed by 70 mg/m2 on days 8 and 15 of cycle 1 for a 28-day cycle Cycle 2+: 70 mg/m2 on days 1, 8, and 15 of cycle 2 every 28 days thereafter | Cycle 1: 255.55 Cycle 2+: 328.57 | Cycle 1: 7,156 Cycle 2+: 9,200 |
Dexamethasone | 4 mg | Tablet | 0.6112 | 40 mg on days 1, 8, 15, and 22 every 28 days | 0.87 | 24.45 |
CyKd | Cycle 1: 275.43 Cycle 1 to 12: 877.81 Cycle 13+: 330.19 | Cycle 1: 7,712 Cycle 1 to 12: 24,579 Cycle 13+: 9,245 | ||||
Cyclophosphamide plus bortezomib plus dexamethasone (CyBorD) | ||||||
Cyclophosphamide | 25 mg 50 mg | Tablet | 0.3545 0.4773 | 300 mg/m2 on days 1, 8, 15, and 22 every 28 days | 0.75 | 21.00 |
Bortezomib | 3.5 mg | Powder in vial | 654.3100a | 1.5 mg/m2 on days 1, 8, 15, and 22 every 28 days | 93.47 | 2,617 |
Dexamethasone | 4 mg | Tablet | 0.6112 | Cycle 1 to 2: 40 mg on days 1 to 4, 9 to 12, and 17 to 20 of cycle 1 to 2 for a 28-day cycle Cycle 3+: 40 mg on days 1, 8, 15, and 22 of cycle 3 every 28 days thereafter | Cycle 1 to 2: 2.62 Cycle 3+: 0.87 | Cycle 1 to 2: 73.34 Cycle 3+: 24.45 |
CyBorD | Cycle 1 to 2: 96.84 Cycle 3+: 95.10 | Cycle 1 to 2: 2,712 Cycle 3+: 2,663 | ||||
Cyclophosphamide plus pomalidomide plus dexamethasone (CyPd) | ||||||
Cyclophosphamide | 25 mg 50 mg | Tablet | 0.3545 0.4773 | 400 mg/m2 on days 1, 8, and 15 every 28 days | 1.14 | 31.91 |
Pomalidomide | 4 mg | Capsule | 125.0000 | 4 mg on days 1 to 21 every 28 days | 93.75 | 2,625 |
Dexamethasone | 4 mg | Tablet | 0.6112 | 40 mg on days 1, 8, 15, and 22 every 28 days | 0.87 | 24.45 |
CyPd | 95.76 | 2,681 | ||||
CAR T-cell therapy | ||||||
Ciltacabtagene autoleucel | 0.5 to 1.0x10⁶ CAR-positive viable T-cells per kg body weight with a maximum of 1x10⁸ CAR-positive viable T-cells | Cell suspension inpatient-specific single infusion bag | 632,455.0000 | One-time dose | NA | NA |
Monoclonal antibody monotherapies | ||||||
Elranatamab | 44 mg 75 mg | Solution for subcutaneous injection | 4,053.0000a 7,000.0000a | Cycle 1: 12 mg on day 1; 32 mg on day 4; 76 mg on days 8, 15, and 22 for a cycle of 28 days Cycle 2 to 6: 76 mg on days 1, 8, 15, and 22 for a cycle of 28 days Cycle 7+: 76 mg on days 1 and 15 every 28 days thereafter | Cycle 1: 1,040 Cycle 2 to 6: 1,000 Cycle 7+: 500 | Cycle 1: 29,106 Cycle 2 to 6: 28,000 Cycle 7+: 14,000 |
Teclistamab | 30 mg 153 mg | Solution for subcutaneous injection | 1,322.0000 6,741.0000 | Step-up dosing schedule: Cycle 1: 0.1 mg/kg on day 1; 0.3 mg/kg on day 3; and 1.5 mg/kg on day 5 for 1 7-day cycle Cycle 2: Dosing schedule from week 2 onward: 1.5 mg/kg once weekly | Cycle 1: 1,341 Cycle 2+: 963.00 | Cycle 1: 37,540 Cycle 2+: 26,964 |
BPd = belantamab mafodotin, pomalidomide, and dexamethasone; BSA = body surface area; cilta-cel = ciltacabtagene autoleucel; CyVd = cyclophosphamide, bortezomib, and dexamethasone; CyKd = cyclophosphamide, carfilzomib, and dexamethasone; CyPd = cyclophosphamide, pomalidomide, and dexamethasone; DVd = daratumumab, bortezomib, and dexamethasone; IsaKd = isatuximab, carfilzomib, and dexamethasone; IsaPd = isatuximab, pomalidomide, and dexamethasone; Kd = carfilzomib and dexamethasone; Pd = pomalidomide and dexamethasone; PVd = pomalidomide, bortezomib, and dexamethasone; r/r MM = relapsed or refractory multiple myeloma; SC = subcutaneous; SVd = selinexor, bortezomib, and dexamethasone; Vd = bortezomib and dexamethasone.
Notes: All prices are from the Ontario Drug Benefit Formulary (accessed February 2025), unless otherwise indicated, and do not include dispensing fees.
All patient doses are calculated based on an average body weight of 76.97 kg and a BSA of 1.9m2.
aPrices reflect IQVIA Delta PA wholesale list prices (accessed February 2025).
Appendix 2: Input Relevant to the Economic Review
Please note that this appendix has not been copy-edited.
This section is a summary of the input received from the patient groups, clinician groups, and drug plans that participated in the CDA-AMC review process.
Patient input was received from Myeloma Canada through a survey conducted of patients (n = 78) and caregivers (n = 12). Most respondents were living in Canada (n = 89) and 7 among them had experience with BPd. The most important outcomes for patients included delaying disease progression and achieving durable remission, with the ultimate objective of improving survival; reducing side effects from treatments; preserving independence to minimize the burden on caregivers; and maintaining quality of life. Overall, patients’ disease experience was influenced by the physical symptoms associated with MM and the psychosocial effects associated with the disease (i.e., anxiety associated with disease progression and the interruption of life goals due to absence from work and/or early retirement). Regarding prior treatment exposure, 27 respondents indicated that they had received 2 prior lines of therapy, 23 respondents indicated having received 3 prior lines of therapy, 21 received 4 prior lines of therapy, and 9 respondents received 5 prior lines of therapy. Patients emphasized the need for therapies to control various aspects of the disease, including pain, fatigue, kidney complications, decreased mobility, gastrointestinal issues, and secondary cancers. Among the 7 individuals with experience using BPd, patients reported a range of side effects, including infections, neutropenia, thrombocytopenia, anemia, blurry vision, eye pain, fever, and decreased appetite. Input from patients currently receiving BPd was positive, with several patients indicating that BPd was effective in controlling the disease.
Clinician group input was received from the Ontario Health (Cancer Care Ontario) (OH [CCO]) Hematology Cancer Drug Advisory Committee. Clinicians noted that the current pathway of care in the second-line setting consists of isatuximab plus pomalidomide plus dexamethasone (IsaPd), pomalidomide plus dexamethasone (Pd), isatuximab plus carfilzomib plus dexamethasone (IsaKd), and Kd. Treatment goals include disease control, improvement in symptoms, prolonged survival, and prevention of end-organ damage. Clinician input indicated that not all treatments work effectively in relapsed MM, highlighting the unmet need for second-line BCMA-targeted therapy. BPd is expected to be an additional second-line treatment option for patients who are resistant to R and V in the current provisional funding algorithm for MM. Clinician input noted that BPd use may preclude future access to BCMA-targeted CAR T-cell therapy, making it a more suitable therapeutic option for patients unlikely to receive CAR T-cell therapy. Input further highlighted the potential ocular toxicity associated with the use of belantamab mafodotin, which may be a concern to some patients.
Input from CDA-AMC–participating drug plans noted concerns with the in-trial comparator PVd which is infrequently used in clinical practice in Canada. Drug plans commented that out-of-pocket eye care costs due to AEs associated with BPd may not be affordable for some patients and will require ophthalmologist visits. Drug plans also noted that the trial excluded patients with prior BCMA-targeted therapies and questioned whether there was sufficient evidence to support the sequencing of BPd with other BCMA-targeted therapies. Drug plans noted that belantamab mafodotin has relatively short stability and dose reductions were needed in the trial, which can result in drug wastage. Lastly, it was noted that cilta-cel for 1 to 3 prior lines and fourth line, and elranatamab and teclistamab are in active negotiations at the pan-Canadian Pharmaceutical Alliance (pCPA). There are confidential prices for carfilzomib, isatuximab, pomalidomide, and selinexor.
Several of these concerns were addressed in the sponsor’s model:
The impact of disease and treatment on patient’s quality of life was captured with utility values.
AEs, including neutropenia, thrombocytopenia, and anemia, were incorporated as disutilities.
CDA-AMC addressed some of these concerns as follows:
AEs such as ocular toxicity with belantamab mafodotin were incorporated as disutilities within the analysis.
Dosing based on the product monograph with relative dose intensity (RDI) was used to reflect dose reductions and delays observed in DREAMM-8.
Subsequent therapy costs were included in a scenario analysis.
CDA-AMC was unable to address the following concerns:
Lack of head-to-head trial data for BPd versus comparators other than PVd.
Appendix 3: Summary of the Sponsor’s Submission
Please note that this appendix has not been copy-edited.
Summary of the Sponsor’s Economic Evaluation
For the pharmaceutical reviews program, clinical and economic information is submitted to CDA-AMC by the sponsor. The CDA-AMC health economics team reviews the submitted economic information and appraises the information in collaboration with clinical experts and the clinical review team to evaluate key assumptions, influential parameters, and the overall rigour of the economic submission. Based on what the team learns through this process, adjustments may be made to the sponsor’s model to produce the CDA-AMC base case. The CDA-AMC base case represents the team’s current understanding of the clinical condition, clinical evidence currently available, and best interpretation of the economic evidence based on the information provided.
For the review of BPd, the sponsor provided a CUA and a BIA. The sponsor’s economic submission is summarized in Table 5.
Table 5: Key Components of the Sponsor’s Economic Evaluation
Component | Description |
|---|---|
Treatment information | |
Drug under review | Belantamab mafodotin (Blenrep), powder for solution for injection (50 mg/mL), 70 mg and 100 mg vials |
Submitted price of drug under review | Belantamab mafodotin: $19,460.0000 per 70 mg vial Belantamab mafodotin: $27,800.0000 per 100 mg vial Pomalidomide: $125.0000 per 4 mg capsule Dexamethasone: $0.6112 per 4 mg tablet |
Regimen | 2.5 mg/kg administered on day 1 of the first 28-day cycle followed by 1.9 mg/kg on day 1 of each subsequent 28-day cycle, in combination with pomalidomide (4 mg on days 1 to 21) and dexamethasone (40 mg on days 1, 8, 15, and 22) in every cycle until completion of treatment1 |
Per-course cost of drug under review | Belantamab mafodotin: from $32,650 to $59,879 per patient for the initial 28-day cycle and from $8,170 to $23,280 per patient for each subsequent 28-day cyclea5 |
Model information | |
Type of economic evaluation | CUA PSM |
Treatment | BPd |
Included comparators |
|
Perspective | Publicly funded health care payer perspective |
Time horizon | Lifetime (34 years) |
Cycle length | 1 week |
Modelled population | Adult patients with r/r MM who have received at least 1 prior line of therapy that included lenalidomide and who had progressive disease during or after the most recent therapy |
Characteristics of modelled population | Derived from the DREAMM-8 trial (mean age = 66 years; baseline weight = ██ kg; baseline BSA = ████ m2; sex = 60% male, 40% female)5 |
Model health states |
For additional information, refer to Model Structure |
Data sources | |
Comparative efficacy |
|
Natural history and/or clinical pathway | |
Costs included in the model |
|
Health-related utilities and disutilities |
|
Summary of the submitted results | |
Base-case results | BPd was associated with an ICER of $393,451 per QALY gained compared to PVd (incremental costs = $349,075; incremental QALYs = 0.89) |
Scenario analysis resultsb |
|
AE = adverse event; BSA = body surface area; cilta-cel = ciltacabtagene autoleucel; CUA = cost-utility analysis; CyKd = cyclophosphamide, carfilzomib, and dexamethasone; CyPd = cyclophosphamide, pomalidomide, and dexamethasone; DVd = daratumumab, bortezomib, and dexamethasone; ICER = incremental cost-effectiveness ratio; HR = hazard ratio; IPD = individual participant data; IsaKd = isatuximab, carfilzomib, and dexamethasone; IsaPd = isatuximab, pomalidomide, and dexamethasone; Kd = carfilzomib and dexamethasone; OS = overall survival; PFS = progression-free survival; PVd = pomalidomide, bortezomib, and dexamethasone; PSM = partitioned survival model; QALY = quality-adjusted life-year; RDI = relative dose intensity; r/r MM = relapsed or refractory multiple myeloma; SVd = selinexor, bortezomib, and dexamethasone; TTD = time to treatment discontinuation; vs. = versus.
aBPd = from $34,668 to $61,855 per patient for the initial 28-day cycle, and from $10,255 to $25,324 per patient for each subsequent 28-day cycle. Weight-based dosing used a distribution of patients’ weight and BSA from the DREAMM-8 trial IPD to obtain a weighted cost per administration for the initial 28-day cost and for 28-day courses thereafter.
bResults of scenario analyses that had a meaningful impact on the estimated ICER compared to the sponsor’s base case.
Model Structure
The sponsor submitted a partitioned survival model consisting of 4 mutually exclusive health states: progression free on treatment, progression free off treatment, progressed disease, and death.5 The allocation of patients into health states is based on treatment-specific TTD, PFS, and OS functions. Patients enter the model in the progression-free on-treatment state and receive BPd or a comparator treatment. Patients can either remain in the on-treatment state, transition to the off-treatment state after discontinuing therapy (based on TTD), transition to the progressed disease state (based on PFS), or die (based on OS). Once patients stop treatment but remain progression free, they enter the progression-free off-treatment state, from which they can either progress or die. Upon disease progression, patients transition to the progressed disease state, with the duration defined by the difference between OS and PFS. While in the progressed disease state, patients can receive up to 2 subsequent lines of therapy. Death is modelled as an absorbing state, representing the final outcome for all patients, with transitions possible from any health state during any model cycle. A figure of the sponsor’s model structure is available in Appendix 3 (Figure 4).5
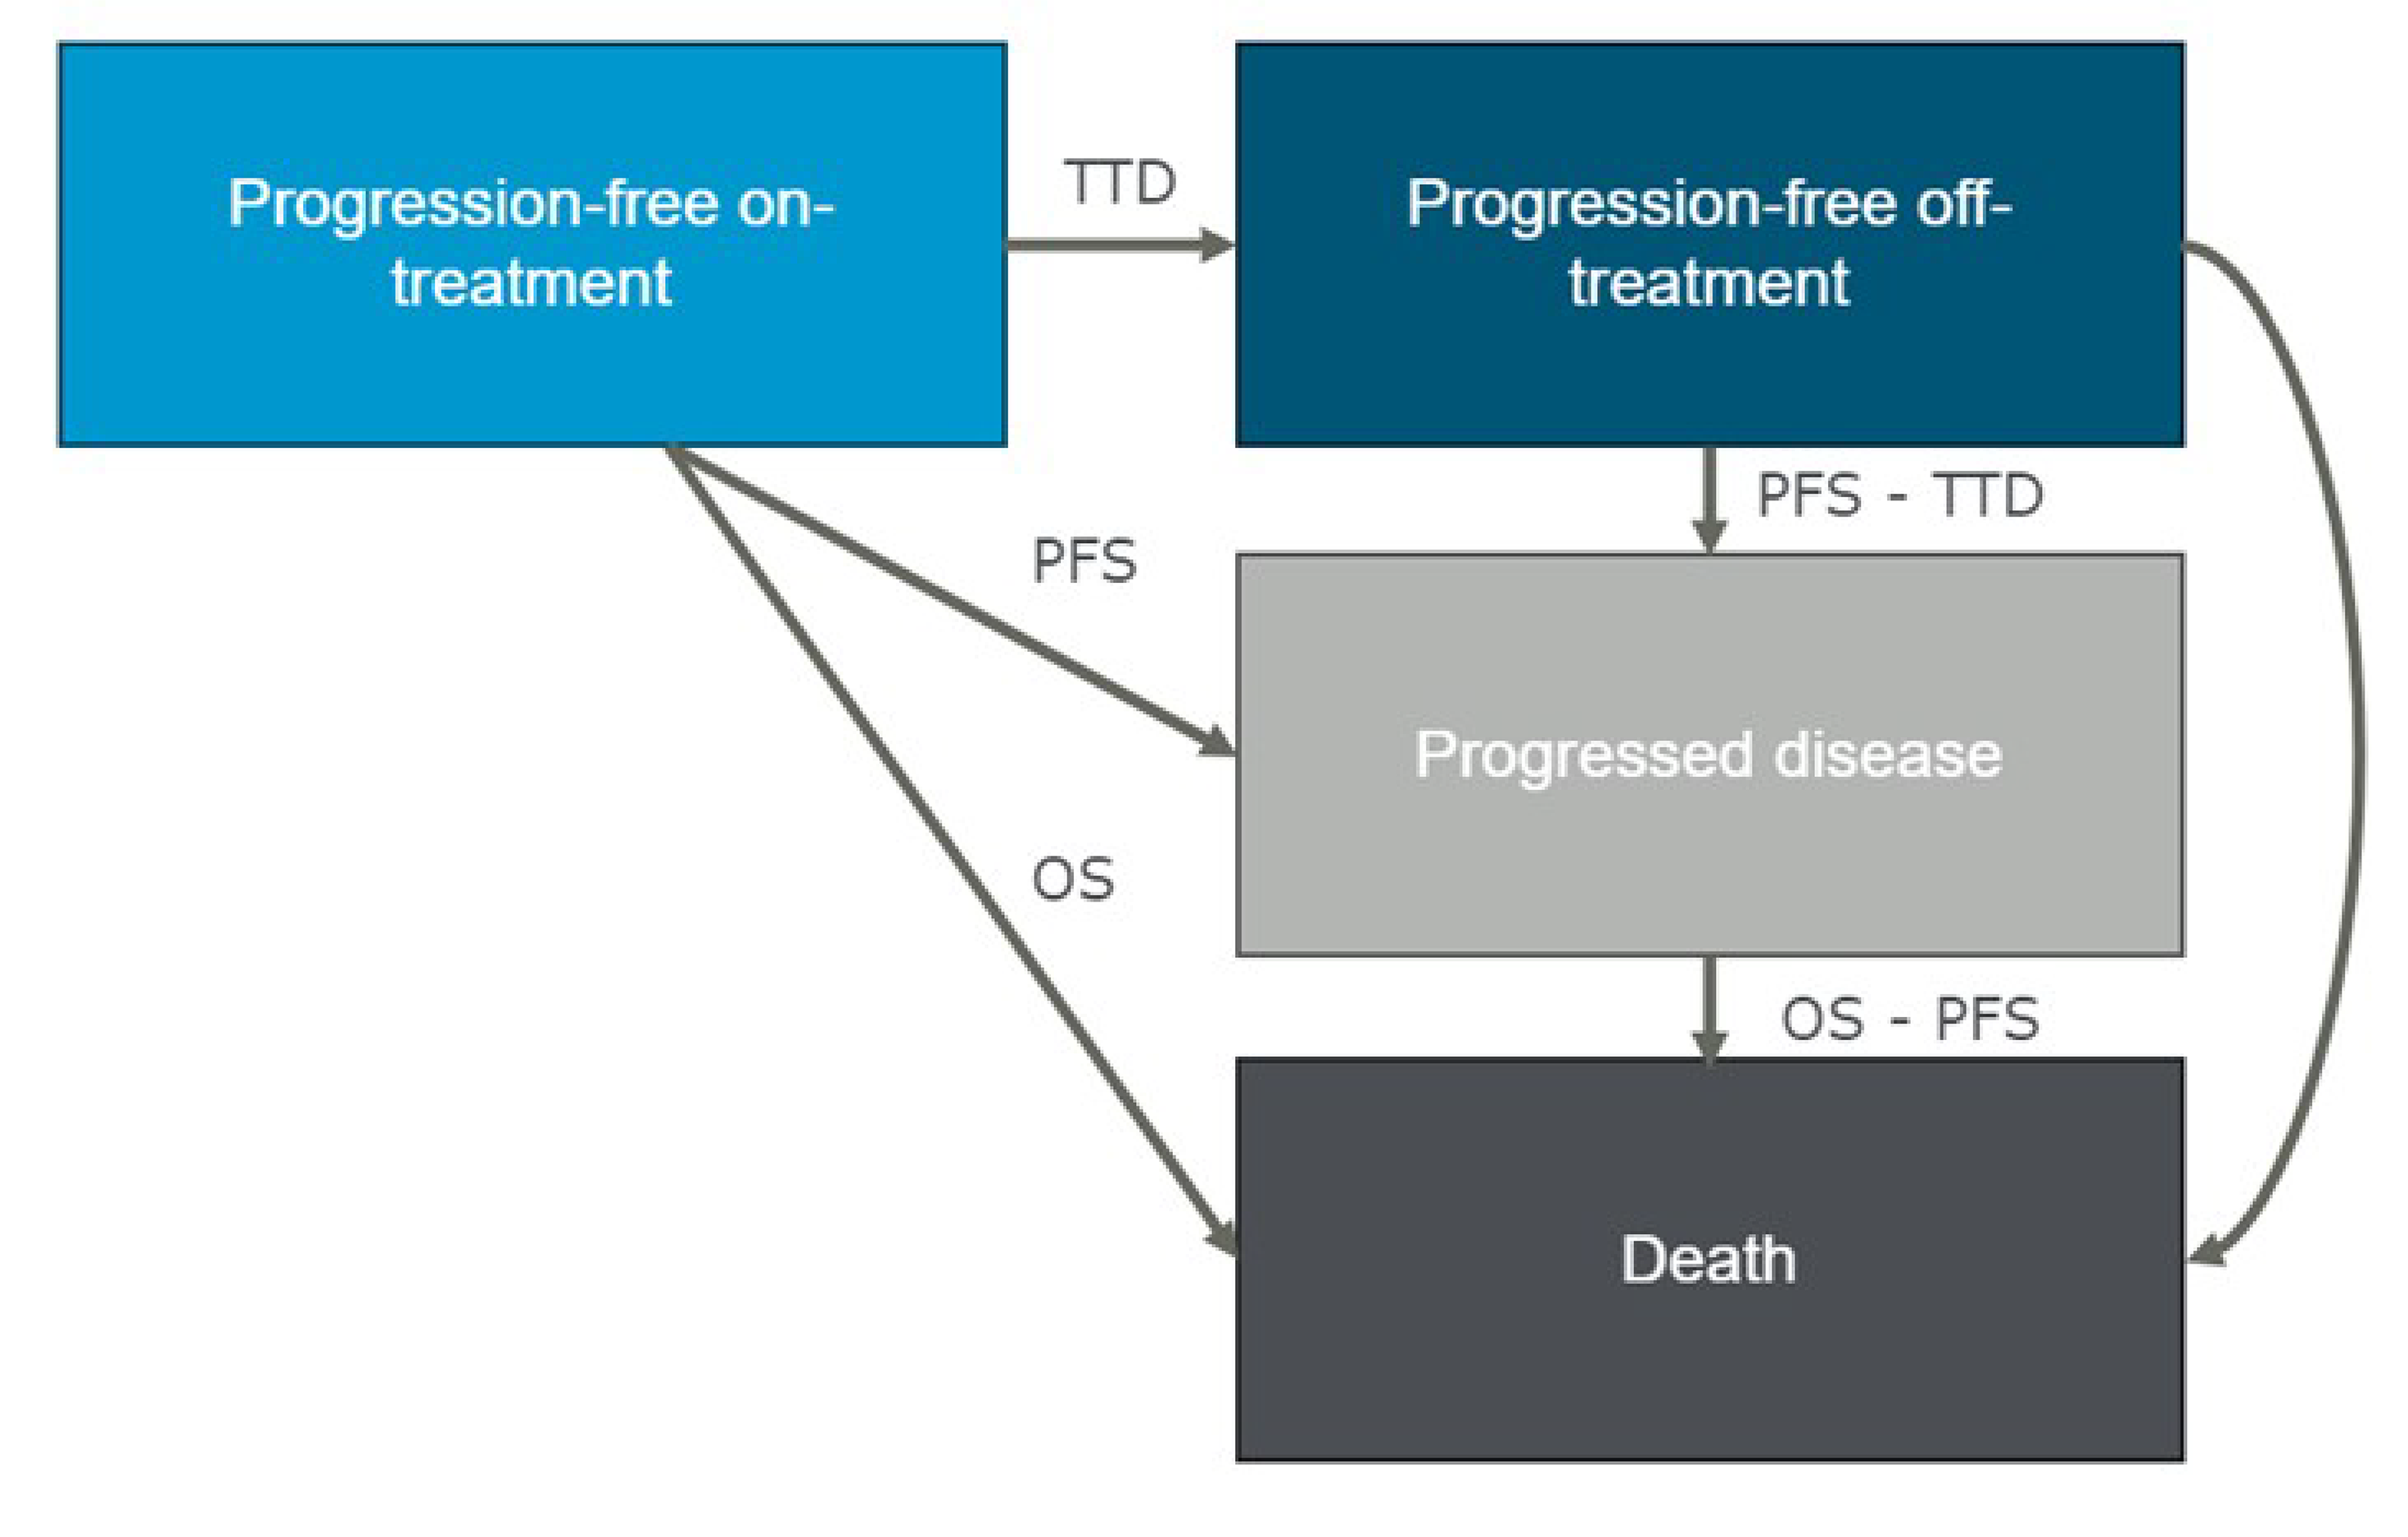
OS = overall survival; PFS = progression-free survival; TTD = time to treatment discontinuation.
Source: Sponsor’s pharmacoeconomic submission.5
Appendix 4: Additional Details of CDA-AMC Reanalyses
Please note that this appendix has not been copy-edited.
Clinical Data in the Economic Model
The CDA-AMC clinical review found that BPd likely improves PFS compared to PVd in patients with r/r MM, based on findings from the DREAMM-8 trial. Evidence from this open-label, randomized controlled trial suggests a clinically meaningful improvement in PFS with BPd, although OS data remain immature at the time of interim analysis, with only 48% of the planned information available. The impact of BPd on health-related quality of life is uncertain, as the assessment of patient-reported outcomes may have been influenced by the lack of blinding and differential exposure between study groups. The CDA-AMC clinical review also found that belantamab mafodotin is associated with an increased risk of ocular AEs and serious AEs, including pneumonia, although interpretation of harms is complicated by longer treatment exposure in the BPd group. Results from the fixed-effects network meta-analysis (NMA) model suggest a numerically favourable PFS and OS benefit for BPd, when compared to relevant comparators. Results from the random-effects model, however, did not demonstrate a clear PFS or OS advantage for BPd over these comparators. These findings should be interpreted with consideration of the limitations associated with the ITC, including significant heterogeneity across the included studies. In the economic model submitted by the sponsor, OS for BPd and PVd was extrapolated beyond the DREAMM-8 trial period using survival models that assumed no waning of treatment effect over the 34-year lifetime time horizon. Clinical experts consulted by CDA-AMC indicated that there is no evidence to support this assumption and considered it plausible that treatment effectiveness may diminish earlier than modelled. Notably, 55% of the survival benefit associated with BPd in the sponsor’s model was accrued beyond the observed trial follow-up, contributing to additional uncertainty in the projected LYs and QALYs gained. Furthermore, the absence of comparative clinical data for relevant nontrial comparators limited the ability of CDA-AMC to validate the sponsor’s results. Consequently, the CDA-AMC reanalysis is subject to a high degree of uncertainty due to the lack of comparative efficacy data for nontrial comparators and the assumptions underpinning long-term survival benefit for BPd. Taken together, these limitations contribute to considerable uncertainty in the estimated cost-effectiveness of BPd relative to other treatment options for r/r MM.
Key Issues of the Submitted Economic Evaluation
CDA-AMC identified the following key issues with the sponsor’s analysis:
Comparative efficacy of BPd is highly uncertain. In the sponsor’s pharmacoeconomic submission, the clinical efficacy of BPd, PVd, and nontrial comparators were characterized using PFS and OS. However, head-to-head trial data are only available for BPd versus PVd; no direct evidence exists for comparisons between BPd and other relevant treatment options. To address this gap, the sponsor applied hazard ratios derived from a sponsor-conducted NMA to the PVd survival curves to estimate PFS and OS for nontrial comparators. While the CDA-AMC clinical review concluded that BPd likely improves PFS and may improve OS compared to PVd, OS data remain immature, with only 48% of planned events observed at interim analysis. Results from the sponsor-submitted NMA suggested that BPd may demonstrate favourable efficacy in certain outcomes when compared with some comparators under a fixed-effect model. However, none of the comparisons — aside from BPd versus Vd for ORR — favoured BPd in the more appropriate random-effects model. The NMA results should be interpreted with caution due to considerable heterogeneity in effect and prognostic modifiers across included studies. Consequently, the CDA-AMC reanalysis is subject to a high degree of uncertainty due to the absence of robust comparative efficacy data for nontrial comparators. This uncertainty is further compounded by the sponsor’s modelling assumptions, which attribute approximately 55% of the survival benefit to the period beyond the observed 36-month trial duration.
CDA-AMC could not address this limitation in reanalysis owing to lack of clinical data.
Impact of BPd on long-term OS is highly uncertain. The sponsor estimated that BPd would provide approximately 0.73 additional LYs compared to PVd, based on interim data from the DREAMM-8 trial (data cut-off: January 29, 2024; ITT population, n = 302). In this analysis, BPd was associated with an OS HR of 0.77 (95% CI, 0.53 to 1.14) compared to PVd. However, the certainty of the OS evidence is low due to imprecision, the interim nature of the data, and risk of bias related to postprogression treatment crossover. Median OS had not been reached in either treatment group at the time of analysis (BPd maturity = 32%; PVd maturity = 38%), limiting the ability to draw definitive conclusions. Evidence suggests that early OS results in oncology trials often differ from later mature data, and as such, the true magnitude of BPd’s survival benefit remains highly uncertain.16 CDA-AMC notes that approximately 55% of the modelled incremental survival benefit with BPd occurs beyond the observed trial period, increasing uncertainty around the sponsor’s projections. The sponsor also assumed no treatment waning effect, implying indefinite benefit for patients receiving BPd. Clinical experts consulted by CDA-AMC indicated that this assumption lacks supporting evidence and does not reflect real-world treatment patterns in r/r MM, where most patients require multiple subsequent lines of therapy due to disease progression. As a result, the assumption of indefinitely sustained treatment benefit was considered to lack face validity.
CDA-AMC conducted a scenario analysis using an alternative parametric distribution to extrapolate OS for BPd, which clinical experts consulted for this review considered to be equally clinically plausible.
TTD for patients receiving BPd and comparators is uncertain. The sponsor’s approach to modelling treatment discontinuation did not align with clinical expectations and resulted in estimates that lacked face validity. In the model, TTD was used to estimate drug acquisition costs. For BPd and PVd, TTD curves were derived from DREAMM-8 KM data and fitted using a Weibull distribution. However, the model assumed no correlation between TTD and PFS for these trial arms, meaning patients were assumed to discontinue treatment while remaining progression free. This implies that toxicity was the primary reason for discontinuation, which contradicts both clinical data from DREAMM-8 and expert feedback indicating that disease progression is the most common reason for treatment discontinuation. For nontrial comparators, the sponsor estimated TTD by applying PFS HRs from the NMA to the PVd TTD curve, thereby assuming a proportional relationship between PFS and TTD. Overall, the sponsor’s modelling approach may underestimate treatment duration and associated drug acquisition costs for BPd.
CDA-AMC conducted a reanalysis using the log-normal parametric distribution to extrapolate TTD for BPd and the log-logistic distribution to extrapolate TTD for PVd, which, together with meeting clinical face validity, were assessed to represent the best statistical fit among all standard parametric curves considered.
Calculation of drug acquisition costs for BPd is inappropriate. The sponsor used IPD from the DREAMM-8 trial to estimate drug acquisition costs for belantamab mafodotin, calculating dosing based on the draft Health Canada product monograph. However, weekly dosing in the IPD was recorded in broad categories (< 1.7 mg/kg, 1.7 to 2.7 mg/kg, and > 2.7 mg/kg). The sponsor calculated the proportion of patients receiving each dose category among those on treatment and used this to estimate average drug costs. Beyond the point where fewer than 50 patients remained on treatment, dosing was extrapolated by aggregating dose and exposure data from the remaining IPD weeks. While dosing within the 1.7 to 2.7 mg/kg broad categories were delineated by 0.1 mg/kg, intervals, several assumptions were applied to the less than 1.7 mg/kg and greater than 2.7 mg/kg broad categories. Due to a lack of data to inform costs for doses less than 1.7 mg/kg and greater than 2.7 mg/kg, the sponsor assumed acquisition costs equivalent to 1.4 mg/kg and 2.7 mg/kg, respectively — likely underestimating true drug costs. In the base case, doses of 1.7 to 2.1 mg/kg and 2.2 to 2.7 mg/kg were costed as 1.9 mg/kg and 2.5 mg/kg, respectively, based on labelled dosing in the draft monograph. Additionally, it was inconsistent to use this IPD-based costing approach for BPd while applying RDI-adjusted costing for all comparator treatments, which incorporated dose reductions and delays where data were available.
CDA-AMC adopted dosing based on the product monograph using RDI to account for dose reductions or delays as per the DREAMM-8 trial, aligned with PVd and the approach used for nontrial comparators.
CDA-AMC conducted a scenario analysis that adopted the IPD costing approach for BPd. In this scenario, patients were assumed to receive 1 ophthalmologic examination before each of the first 6 infusions of BPd, and 1 ophthalmologic examination every 3 infusions of BPd thereafter, in accordance with the Health Canada product monograph.
Exclusion of ocular toxicity due to BPd is inappropriate. According to the product monograph for belantamab mafodotin, dosage modifications for ocular adverse reactions are suggested based on ophthalmic examination findings (including corneal examination findings and changes in best-corrected visual acuity as assessed by an eye care professional). Based on the worst finding in the worse affected eye, dose reductions to 1.9 mg/kg every 8 weeks or 1.4 mg/kg every 8 weeks are suggested based on severity of ocular AEs. The sponsor did not model ocular toxicity and instead assumed that they would be resolved with ophthalmologist visit and artificial tears. However, ocular toxicity with BPd was observed in the DREAMM-8 trial and was noted by clinical experts consulted by CDA-AMC as important treatment considerations. These AEs included severe keratopathy, blurred vision, and dry eye. As such, the exclusion of AEs due to ocular toxicity in the sponsor’s analysis likely biased cost-effectiveness results in favour of BPd.
CDA-AMC included disutilities related to grade 3 or higher ocular toxicity with BPd in reanalysis.
Modelling of subsequent therapy is highly uncertain. The submitted model did not define explicit health states for subsequent lines of treatment. Instead, medication and administration costs for up to 2 lines of therapy after disease progression were applied as a single, one‐off cost. Based on published literature and internal market research, the proportion of patients receiving third- and fourth-line treatment was estimated to be 52% and 55%, respectively.17 In the third-line setting, subsequent treatment options included IsaKd, DVd, IsaPd, Kd, SVd, CyPd, and CyKd, while in the fourth-line setting, available options comprised SVd, CyPd, CyKd, ciltacabtagene autoleucel (cilta-cel), elranatamab, and teclistamab (Table 6). The distribution of subsequent therapies across treatment groups was based on sponsor internal market research and did not meet face validity. Clinical experts consulted by CDA-AMC indicated that subsequent treatment pathways are expected to be generally similar between BPd and comparators. However, the sponsor’s assumptions led to cost savings in subsequent therapy for BPd of $116,347 versus PVd and $91,310 versus Vd — estimates that are highly uncertain.
Particularly, CDA-AMC notes that there is uncertainty in the availability of subsequent therapies in fourth line as cilta-cel, teclistamab, and elranatamab have recently underwent active negotiation at pCPA. Negotiations for cilta-cel are ongoing, while teclistamab recently received a LOI on April 10th, 2025, and elranatamab negotiations concluded without agreement on March 27th, 2025.18-20 Therefore, while teclistamab is now available for public reimbursement in the fourth-line setting, elranatamab and cilta-cel remain unavailable for public reimbursement in this treatment setting. As subsequent treatments in the model only affect costs and not OS, any potential survival benefit associated with these therapies has not been captured.
Due to limitations in the partitioned survival model structure and uncertainties surrounding the distribution of subsequent therapies, CDA-AMC excluded subsequent therapy costs from the base-case analysis. Consequently, the impact of these costs on the cost-effectiveness of BPd remains unknown.
CDA-AMC conducted a scenario analysis that adjusted the market share of fourth-line subsequent therapies to better align with expectations of clinical practice in Canada (Table 7). Due to the submitted model structure any subsequent therapy costs estimated in the model are uncertain.
Table 6: Distribution of Subsequent Therapies Across Treatment Arms in the Sponsor’s Analysis (Second Subsequent Treatment)
Subsequent treatment | Initial treatment | |||||||
|---|---|---|---|---|---|---|---|---|
BPd | Kd | IsaKd | SVd | Vd | PVd | DVd | Cyc-doublets | |
IsaKd | || | || | || | || | || | || | || | || |
DVd (IV) | || | || | || | || | || | || | || | || |
DVd (SC) | || | || | || | || | || | || | || | || |
Pd | || | || | || | || | || | || | || | || |
IsaPd | || | || | || | || | || | || | || | || |
Vd | || | || | || | || | || | || | || | || |
BPd | || | || | || | || | || | || | || | || |
Kd (twice weekly) | || | || | || | || | || | || | || | || |
Kd (once weekly) | || | || | || | || | || | || | || | || |
SVd | ███ | ███ | ███ | || | || | || | || | ███ |
PVd | || | || | || | || | || | || | || | || |
CyPd | || | ███ | ███ | || | || | || | || | || |
CyKd | ███ | || | || | ███ | ███ | ███ | ███ | ███ |
CyBorD | || | || | || | || | || | || | || | || |
Cilta-cel | || | ███ | ███ | ███ | ███ | ███ | ███ | ███ |
Elranatamab | || | ███ | ███ | ███ | ███ | ███ | ███ | ███ |
Teclistamab | || | ███ | ███ | ███ | ███ | ███ | ███ | ███ |
BPd = belantamab mafodotin, pomalidomide, and dexamethasone; CDA-AMC = Canada’s Drug Agency; cilta-cel = ciltacabtagene autoleucel; CyBorD = cyclophosphamide, bortezomib, and dexamethasone; CyKd = cyclophosphamide, carfilzomib, and dexamethasone; CyPd = cyclophosphamide, pomalidomide, and dexamethasone; DVd = daratumumab, bortezomib, and dexamethasone; IsaKd = isatuximab, carfilzomib, and dexamethasone; IsaPd = isatuximab, pomalidomide, and dexamethasone; Kd = carfilzomib and dexamethasone; IsaKd = isatuximab, carfilzomib, and dexamethasone; Kd = carfilzomib and dexamethasone; Pd = pomalidomide and dexamethasone; PVd = pomalidomide, bortezomib, and dexamethasone; SC = subcutaneous; SVd = selinexor, bortezomib, and dexamethasone; Vd = bortezomib and dexamethasone.
Table 7: Distribution of Subsequent Therapies Across Treatment Arms in the CDA-AMC Scenario Analysis (Second Subsequent Treatment)
Subsequent treatment | Initial treatment | |||||||
|---|---|---|---|---|---|---|---|---|
BPd | Kd | IsaKd | SVd | Vd | PVd | DVd | Cyc-doublets | |
IsaKd | || | || | || | || | || | || | || | || |
DVd (IV) | || | || | || | || | || | || | || | || |
DVd (SC) | || | || | || | || | || | || | || | || |
Pd | || | || | || | || | || | || | || | || |
IsaPd | || | || | || | || | || | || | || | || |
Vd | || | || | || | || | || | || | || | || |
BPd | || | || | || | || | || | || | || | || |
Kd (twice weekly) | || | || | || | || | || | || | || | || |
Kd (once weekly) | || | || | || | || | || | || | || | || |
SVd | ███ | ███ | ███ | || | || | || | || | ███ |
PVd | || | || | || | || | || | || | || | || |
CyPd | || | ███ | ███ | || | || | || | || | || |
CyKd | ███ | || | || | ███ | ███ | ███ | ███ | ███ |
CyBorD | || | || | || | || | || | || | || | || |
Cilta-cel | || | ███ | ███ | ███ | ███ | ███ | ███ | ███ |
Elranatamab | || | ███ | ███ | ███ | ███ | ███ | ███ | ███ |
Teclistamab | ███ | ███ | ███ | ███ | ███ | ███ | ███ | ███ |
BPd = belantamab mafodotin, pomalidomide, and dexamethasone; CDA-AMC = Canada’s Drug Agency; cilta-cel = ciltacabtagene autoleucel; CyBorD = cyclophosphamide, bortezomib, and dexamethasone; CyKd = cyclophosphamide, carfilzomib, and dexamethasone; CyPd = cyclophosphamide, pomalidomide, and dexamethasone; DVd = daratumumab, bortezomib, and dexamethasone; IsaKd = isatuximab, carfilzomib, and dexamethasone; IsaPd = isatuximab, pomalidomide, and dexamethasone; Kd = carfilzomib and dexamethasone; Pd = pomalidomide and dexamethasone; PVd = pomalidomide, bortezomib, and dexamethasone; SC = subcutaneous; SVd = selinexor, bortezomib, and dexamethasone; Vd = bortezomib and dexamethasone.
Treatment schedule for carfilzomib and dexamethasone is not reflective of practice in Canada. The sponsor assumes patients receiving carfilzomib and dexamethasone will receive the treatment on a twice-weekly schedule in the economic model. It was noted that most centres in Canada use the once-weekly schedule in practice. The once-weekly schedule was found to have a potentially improved efficacy profile compared to the twice-weekly schedule, in addition to having a more convenient dosing schedule for patients because it requires less frequent administrations.21
CDA-AMC updated the dosing schedule for carfilzomib and dexamethasone to align with the following once-weekly dosing: 28-day cycle; Cycle 1: 20mg/m2 on Day 1 then 70 mg/m2 on days 8 and 15; Cycle 2: 70 mg/m2 on days 1, 8, and 15. CDA-AMC also updated the data source to align with the available once-weekly dosing efficacy data for Kd available in the sponsor’s submitted model.
CDA-AMC Reanalysis of the Economic Evaluation
The CDA-AMC base case was derived by making changes in model parameter values and assumptions, in consultation with clinical experts (refer to Table 8). The impact of these changes, individually and collectively, is presented in Table 9.
Table 8: Revisions to the Submitted Economic Evaluation
Stepped analysis | Sponsor’s value or assumption | CDA-AMC value or assumption |
|---|---|---|
1. TTD for patients receiving BPd and comparators |
|
|
2. Calculation of drug acquisition costs for BPd | IPD approach | RDI approach |
3. Disutility due to ocular toxicity | Excluded | Included |
4. Subsequent therapy | Included | Excluded |
5. Dosing for carfilzomib and dexamethasone | Twice weekly | Once weekly |
CDA-AMC base case (health care payer perspective) | ― | Reanalysis 1 + 2 + 3 + 4 + 5 |
BPd = belantamab mafodotin, pomalidomide, and dexamethasone; CDA-AMC = Canada’s Drug Agency; IPD = individual participant data; PVd = pomalidomide, bortezomib, and dexamethasone; RDI = relative dose intensity; TTD = time to treatment discontinuation.
Note: CDA-AMC was unable to resolve the issues with the lack of long-term clinical evidence and immaturity of the available OS data.
Table 9: Summary of the Stepped Analysis
Stepped analysis | Drug | Total costs ($) | Total QALYs | ICER ($/QALY) |
|---|---|---|---|---|
Sponsor base case | Vd | 312,206 | 2.33 | Reference |
PVd | 388,705 | 3.05 | 105,994 | |
BPd | 740,940 | 3.96 | 389,442 | |
Dominated treatments | ||||
Pd | 341,550 | 2.32 | Dominated | |
Cyc-doublets | 480,695 | 2.49 | Dominated | |
IsaPd | 489,077 | 2.65 | Dominated | |
SVd | 491,609 | 2.77 | Dominated | |
Kd | 500,304 | 2.65 | Dominated | |
DVd | 531,806 | 3.16 | Extendedly dominated | |
IsaKd | 927,464 | 3.38 | Dominated | |
CDA-AMC reanalysis 1 — TTD | Vd | 312,751 | 2.33 | Reference |
PVd | 397,178 | 3.05 | 116,979 | |
BPd | 879,692 | 3.96 | 533,482 | |
Dominated treatments | ||||
Pd | 342,047 | 2.32 | Dominated | |
IsaPd | 504,148 | 2.65 | Dominated | |
SVd | 513,072 | 2.77 | Dominated | |
Cyc-doublets | 516,704 | 2.49 | Dominated | |
Kd | 520,375 | 2.65 | Dominated | |
DVd | 566,979 | 3.16 | Extendedly dominated | |
IsaKd | 1,046,311 | 3.38 | Dominated | |
CDA-AMC reanalysis 2 — RDI | Vd | 312,206 | 2.33 | Reference |
PVd | 388,705 | 3.05 | 105,994 | |
BPd | 1,194,123 | 3.96 | 890,494 | |
Dominated treatments | ||||
Pd | 341,550 | 2.32 | Dominated | |
Cyc-doublets | 480,695 | 2.49 | Dominated | |
IsaPd | 489,077 | 2.65 | Dominated | |
SVd | 491,609 | 2.77 | Dominated | |
Kd | 500,304 | 2.65 | Dominated | |
DVd | 531,806 | 3.16 | Extendedly dominated | |
IsaKd | 927,464 | 3.38 | Extendedly dominated | |
CDA-AMC reanalysis 3 — ocular disutilities | Vd | 312,206 | 2.33 | Reference |
PVd | 388,705 | 3.05 | 105,994 | |
BPd | 740,940 | 3.85 | 440,608 | |
Dominated treatments | ||||
Pd | 341,550 | 2.32 | Dominated | |
Cyc-doublets | 480,695 | 2.49 | Dominated | |
IsaPd | 489,077 | 2.65 | Dominated | |
SVd | 491,609 | 2.77 | Dominated | |
Kd | 500,304 | 2.65 | Dominated | |
DVd | 531,806 | 3.16 | Extendedly dominated | |
IsaKd | 927,464 | 3.38 | Dominated | |
CDA-AMC reanalysis 4 — subsequent treatments | Vd | 94,370 | 2.33 | Reference |
PVd | 146,798 | 3.05 | 72,642 | |
BPd | 611,563 | 3.96 | 513,858 | |
Dominated treatments | ||||
Pd | 95,714 | 2.32 | Dominated | |
IsaPd | 257,323 | 2.65 | Dominated | |
Cyc-doublets | 262,062 | 2.49 | Dominated | |
SVd | 275,550 | 2.77 | Dominated | |
Kd | 289,673 | 2.65 | Dominated | |
DVd | 338,080 | 3.16 | Extendedly dominated | |
IsaKd | 728,809 | 3.38 | Dominated | |
CDA-AMC reanalysis 5 — Kd dosing schedule | Vd | 312,206 | 2.33 | Reference |
PVd | 388,705 | 3.05 | 105,994 | |
BPd | 740,940 | 3.96 | 396,075 | |
Dominated treatments | ||||
Pd | 341,550 | 2.32 | Dominated | |
Kd | 469,603 | 3.27 | Extendedly dominated | |
Cyc-doublets | 480,695 | 2.49 | Dominated | |
IsaPd | 489,077 | 2.65 | Dominated | |
SVd | 491,609 | 2.77 | Dominated | |
DVd | 531,806 | 3.16 | Dominated | |
IsaKd | 927,464 | 3.38 | Dominated | |
CDA-AMC base case (Reanalysis 1 + 2 + 3 + 4 + 5) (deterministic) | Vd | 94,915 | 2.33 | Reference |
PVd | 155,271 | 3.05 | 83,626 | |
Kd | 289,386 | 3.27 | 611,290 | |
BPd | 1,424,614 | 3.81 | 2,097,448 | |
Dominated treatments | ||||
Pd | 96,211 | 2.32 | Dominated | |
IsaPd | 272,394 | 2.65 | Dominated | |
SVd | 297,013 | 2.77 | Dominated | |
Cyc-doublets | 298,071 | 2.49 | Dominated | |
DVd | 373,252 | 3.16 | Dominated | |
IsaKd | 847,656 | 3.38 | Extendedly dominated | |
CDA-AMC base case (Reanalysis 1 + 2 + 3 + 4 + 5) (probabilistic) | Vd | 95,522 | 2.45 | Reference |
PVd | 155,923 | 3.11 | 92,650 | |
Kd | 291,315 | 3.47 | 372,978 | |
BPd | 1,404,641 | 3.89 | 2,661,253 | |
Dominated treatments | ||||
Pd | 96,858 | 2.46 | Dominated | |
IsaPd | 273,123 | 2.79 | Dominated | |
Cyc-doublets | 282,186 | 2.58 | Dominated | |
SVd | 299,241 | 2.95 | Dominated | |
DVd | 372,540 | 3.35 | Dominated | |
IsaKd | 852,800 | 3.54 | Extendedly dominated | |
BPd = belantamab mafodotin, pomalidomide, and dexamethasone; CDA-AMC = Canada’s Drug Agency; DVd = daratumumab, bortezomib, and dexamethasone; ICER = incremental cost-effectiveness ratio; IsaKd = isatuximab, carfilzomib, and dexamethasone; IsaPd = isatuximab, pomalidomide, and dexamethasone; Kd = carfilzomib and dexamethasone; Pd = pomalidomide and dexamethasone; PVd = pomalidomide, dexamethasone, and bortezomib; QALY = quality-adjusted life-year; RDI = relative dose intensity; SVd = selinexor, bortezomib, and dexamethasone; TTD = time to treatment discontinuation; Vd = bortezomib and dexamethasone; vs. = versus.
Note: The CDA-AMC reanalysis is based on the publicly available prices of the comparator treatments.
Table 10: Summary of CDA-AMC Economic Evaluation Results
Drug | Total costs ($) | Total QALYs | Sequential ICER ($/QALY) |
|---|---|---|---|
Vd | 95,522 | 2.45 | Reference |
PVd | 155,923 | 3.11 | 92,650 vs. Vd |
Kd | 291,315 | 3.47 | 372,978 vs. PVd |
BPd | 1,404,641 | 3.89 | 2,661,253 vs. Kd |
Dominated treatments | |||
Pd | 96,858 | 2.46 | Dominated |
IsaPd | 273,123 | 2.79 | Dominated |
Cyc-doublets | 282,186 | 2.58 | Dominated |
SVd | 299,241 | 2.95 | Dominated |
DVd | 372,540 | 3.35 | Dominated |
IsaKd | 852,800 | 3.54 | Extendedly dominated |
BPd = belantamab mafodotin, pomalidomide, and dexamethasone; CDA-AMC = Canada’s Drug Agency; DVd = daratumumab, bortezomib, and dexamethasone; ICER = incremental cost-effectiveness ratio; IsaKd = isatuximab, carfilzomib, and dexamethasone; IsaPd = isatuximab, pomalidomide, and dexamethasone; Kd = carfilzomib and dexamethasone; Pd = pomalidomide and dexamethasone; PVd = pomalidomide, dexamethasone, and bortezomib; QALY = quality-adjusted life-year; SVd = selinexor, bortezomib, and dexamethasone; Vd = bortezomib and dexamethasone; vs. = versus.
Note: Publicly available list prices were used for all comparators.
Table 11: Disaggregated Results of the CDA-AMC Base Case
Parameter | BPd | Kd | PVd | Vd |
|---|---|---|---|---|
Discounted LYs | ||||
Total | 5.18 | 4.55 | 4.08 | 3.25 |
PFS (on treatment) | 3.17 | 1.66 | 1.44 | 0.71 |
PFS (off treatment) | 0.52 | 0.38 | 0.29 | 0.28 |
PD | 1.49 | 2.51 | 2.35 | 2.27 |
Discounted QALYs | ||||
Total | 3.89 | 3.47 | 3.11 | 2.45 |
PFS (on treatment) | 2.38 | 1.33 | 1.15 | 0.57 |
PFS (off treatment) | 0.42 | 0.30 | 0.23 | 0.22 |
PD | 1.09 | 1.85 | 1.73 | 1.67 |
Discounted costs ($) | ||||
Total | 1,404,641 | 291,315 | 155,923 | 95,522 |
Drug acquisition | 1,322,401 | 210,989 | 77,952 | 20,735 |
Administration | 5,208 | 8,280 | 4,809 | 2,351 |
Health state costs | 12,133 | 10,655 | 9,579 | 7,622 |
Terminal care costs | 53,709 | 54,270 | 54,696 | 55,417 |
Subsequent treatment costs | 0 | 0 | 0 | 0 |
Adverse event costs | 11,190 | 7,121 | 8,887 | 9,396 |
BPd = belantamab mafodotin, pomalidomide, and dexamethasone; CDA-AMC = Canada’s Drug Agency; Kd = carfilzomib and dexamethasone; LY = life-year; PD = progressed disease; PFS = progression-free survival; PVd = pomalidomide, bortezomib, and dexamethasone; QALY = quality-adjusted life-year; Vd = bortezomib and dexamethasone.
Price Reduction Analysis
CDA-AMC conducted price reduction analyses using the sponsor’s base case and the CDA-AMC base case (refer to Table 12).
Table 12: Results of the Price Reduction Analysis
Price reduction | Unit drug cost ($)a | Cost per 28 days ($) | ICERs for BPd vs. comparators ($/QALY) | |
|---|---|---|---|---|
Sponsor base case | CDA-AMC base case | |||
No price reduction | 27,800b | 55,600c | 393,451 (vs. PVd) | 2,661,253 (vs. Kd) |
10% | 25,020 | 50,040 | 340,579 (vs. PVd) | 2,361,665 (vs. Kd) |
20% | 22,240 | 44,480 | 287,707 (vs. PVd) | 2,062,078 (vs. Kd) |
30% | 19,460 | 38,920 | 234,835 (vs. PVd) | 1,762,491 (vs. Kd) |
40% | 16,680 | 33,360 | 181,963 (vs. PVd) | 1,462,904 (vs. Kd) |
50% | 13,900 | 27,800 | 129,091 (vs. Vd) | 1,163,316 (vs. Kd) |
60% | 11,120 | 22,240 | 95,027 (vs. Vd) | 863,729 (vs. Kd) |
70% | 8,340 | 16,680 | 64,206 (vs. Vd) | 564,142 (vs. PVd) |
80% | 5,560 | 11,120 | 33,386 (vs. Vd) | 314,926 (vs. PVd) |
90% | 2,780 | 5,560 | 2,565 (vs. Vd) | 154,523 (vs. PVd) |
BPd = belantamab mafodotin, pomalidomide, and dexamethasone; CDA-AMC = Canada’s Drug Agency; ICER = incremental cost-effectiveness ratio; Kd = carfilzomib and dexamethasone; PVd = pomalidomide, bortezomib, and dexamethasone; QALY = quality-adjusted life-year; Vd = bortezomib and dexamethasone; vs. = versus.
aThe unit drug cost presented in this table reflects the submitted price of the belantamab mafodotin 100 mg vial. The submitted price for the 70 mg vial is $19,460.00.
bSponsor’s submitted price for BPd.5
cThe cost per 28-day cycle represents cycle 1 costs only for belantamab mafodotin. The cost per 28-day cycle without price reduction is $47,260 from cycle 2 onwards.
Assessment of Uncertainty
CDA-AMC used the CDA-AMC base case to conduct scenario analyses to address uncertainty within the economic evaluation. The results are provided in Table 13.
Scenario 1: Applied the Gompertz distribution to extrapolate OS for BPd, reflecting clinical expert feedback that long-term survival is highly uncertain and that multiple extrapolations were considered equally clinically plausible.
Scenario 2: Included subsequent therapies with adjusted market shares for fourth-line treatments to better reflect expected clinical practice in Canada (Table 7).
Scenario 3: Assumed IPD-based costing approach for BPd, as well as the cost of ophthalmologic examinations before infusions, reflecting the Health Canada product monograph.
Table 13: Results of CDA-AMC Scenario Analyses
Analysisa | Drug | Total costs ($) | Total QALYs | ICER ($/QALYs) |
|---|---|---|---|---|
CDA-AMC base case | Vd | 95,522 | 2.45 | Reference |
PVd | 155,923 | 3.11 | 92,650 | |
Kd | 291,315 | 3.47 | 372,978 | |
BPd | 1,404,641 | 3.89 | 2,661,253 | |
CDA-AMC scenario 1b: Gompertz distribution to extrapolate OS for BPd | Vd | 94,915 | 2.33 | Reference |
PVd | 155,271 | 3.05 | 83,626 | |
Kd | 289,386 | 3.27 | 611,290 | |
IsaKd | 847,656 | 3.38 | 4,978,512 | |
CDA-AMC scenario 2: Subsequent therapies included, with adjusted fourth-line distribution | Vd | 312,751 | 2.33 | Reference |
PVd | 397,178 | 3.05 | 116,979 | |
Kd | 498,329 | 3.27 | 461,041 | |
BPd | 1,553,991 | 3.81 | 1,950,441 | |
CDA-AMC scenario 3: IPD-based costing for BPd and ophthalmologic exams before infusions | Vd | 94,915 | 2.33 | Reference |
PVd | 155,271 | 3.05 | 83,626 | |
Kd | 289,386 | 3.27 | 611,290 | |
BPd | 750,315 | 3.81 | 851,612 |
CDA-AMC = Canada’s Drug Agency; ICER = incremental cost-effectiveness ratio; IPD = individual participant data; IsaKd = isatuximab, carfilzomib, and dexamethasone; Kd = carfilzomib and dexamethasone; PVd = pomalidomide, bortezomib, and dexamethasone; OS = overall survival; QALY = quality-adjusted life-year.
aDeterministic analyses presented.
bIn this scenario, BPd resulted in 3.19 total QALYs at a total cost of $1,348,799 and was therefore dominated by both Kd and IsaKd — that is, BPd was more costly and less effective, offering fewer QALYs at a higher cost.
Issues for Consideration
Ciltacabtagene autoleucel received a positive recommendation from CDA-AMC on November 1, 2024, for the treatment of adult patients with MM who have received 1 to 3 prior lines of therapy, including a proteasome inhibitor and an immunomodulatory drug, and whose disease is refractory to lenalidomide.22 Ciltacabtagene autoleucel is currently undergoing active negotiation at pCPA to achieve a negotiated price for public payers.23 The availability of ciltacabtagene autoleucel in earlier lines of therapy (i.e., second line) was not modelled in the current submission. The cost-effectiveness of ciltacabtagene autoleucel versus BPd is unknown.
Belantamab mafodotin is currently under review at CDA-AMC as an alternate regimen in combination with bortezomib and dexamethasone (BVd) for the treatment of r/r MM in adult patients who have received at least 1 prior therapy.24 The cost-effectiveness of BPd versus BVd is unknown.
Appendix 5: Budget Impact Analysis
Please note that this appendix has not been copy-edited.
Summary of the Sponsor’s BIA
The sponsor submitted a BIA that estimated the expected incremental budgetary impact of reimbursing BPd for the treatment of patients with r/r MM who have received at least 1 prior therapy, including lenalidomide.1
The BIA was conducted from the perspective of public drug plan payers over a 3-year time horizon (2025 to 2027), with 2024 as the base year. The sponsor’s estimate reflects the aggregated results from the jurisdictional provincial budgets (excluding Quebec), as well as the Non-Insured Health Benefits (NIHB) program. The sponsor estimated the eligible population using an epidemiologic approach.2 The sponsor’s base case included primary drug acquisition costs and cost of subsequent treatments.2 The market uptake for BPd was estimated using the sponsor’s internal market share estimates.3 The key inputs to the BIA are documented in Table 14.
The sponsor estimated the 3-year incremental budget impact associated with reimbursing BPd for the treatment of adult patients with r/r MM who have received at least 1 prior therapy, including lenalidomide, would be $112,426,107 (year 1 = $12,932,746; year 2 = $35,107,565; year 3 = $64,385,797).
Table 14: Key Model Parameters
Parameter | Sponsor’s estimate (reported as year 1 / year 2 / year 3) | |
|---|---|---|
Target population | ||
Starting number of people25 | 32,170,244 / 32,723,421 / 33,286,346 | |
Annual population growth rate in Canada25 | 0.9% | |
Incidence of disease26 | 9.64 per 100,000 | |
Percentage of MM patients receiving 1L treatment27 | 95% | |
ASCT status | ASCT | No ASCT |
Percentage of total 1L patients17a | 58.8% | 41.2% |
Percentage of 1L receiving 2L17 | 56.3% | 59.9% |
1L progressing to 2L – year 117 | ██████ | ██████ |
1L progressing to 2L – year 217 | ██████ | ██████ |
1L progressing to 2L – year 317 | ██████ | ██████ |
1L progressing to 2L – year 417 | ██████ | █████ |
1L progressing to 2L – year 517 | █████ | █████ |
1L progressing to 2L – year 617 | █████ | █████ |
Percentage of 2L patients receiving 3L17 | 60.90% | 54.10% |
2L progressing to 3L – year 117 | ██████ | ██████ |
2L progressing to 3L – year 217 | ██████ | ██████ |
2L progressing to 3L – year 317 | ██████ | ██████ |
2L progressing to 3L – year 417 | █████ | █████ |
2L progressing to 3L – year 517 | █████ | █████ |
2L progressing to 3L – year 617 | █████ | █████ |
Percentage of 3L patients receiving 4L17 | 61.50% | 44.60% |
3L progressing to 4L – year 117 | ██████ | ██████ |
3L progressing to 4L – year 217 | ██████ | ██████ |
3L progressing to 4L – year 317 | █████ | █████ |
3L progressing to 4L – year 417 | █████ | █████ |
3L progressing to 4L – year 517 | █████ | █████ |
3L progressing to 4L – year 617 | █████ | █████ |
Percentage of 2L patients receiving lenalidomide in prior lines (1L)3,28 | █████ | █████ |
Percentage of 3L patients receiving lenalidomide in prior lines (1L/2L)3,28 | █████ | █████ |
Percentage of 4L patients receiving lenalidomide in prior lines (1L/2L/3L)3,28 | █████ | █████ |
Percentage aged less than 65 years29 | 50% | |
Percentage aged less than 65 years with public health coverage3 | 100% | |
Percentage older than 64 years29 | 50% | |
Percentage older than 64 years with public health coverage3 | 100% | |
Number of patients eligible for drug under review | 2,811 / 2,887 / 2,961 | |
Cost of treatment (per patient in year 1) | ||
BPd | $311,004 | |
DVd | $168,003 | |
PVd | $57,760 | |
SVd | $171,103 | |
IsaKd | $336,877 | |
IsaPd | $164,170 | |
Pd | $27,496 | |
Kd | $200,203 | |
Vd | $27,612 | |
Cyclophosphamide doubletsb | $156.54 | |
Cita-celc | $632,455 | |
Elranatamab | $253,731 | |
Teclistamab | $354,380 | |
1L = first line; 2L = second line; 3L = third line; 4L = fourth line; ASCT = autologous stem cell transplant; BPd = belantamab, pomalidomide, and dexamethasone; DVd = daratumumab, bortezomib, and dexamethasone; IsaKd = isatuximab, carfilzomib, and dexamethasone; IsaPd = isatuximab, pomalidomide, and dexamethasone; Kd = carfilzomib and dexamethasone; MM = multiple myeloma; Pd = pomalidomide and dexamethasone; PVd = pomalidomide, bortezomib, and dexamethasone; SVd = selinexor, bortezomib, and dexamethasone; Vd = bortezomib and dexamethasone.
aReference for these estimates were derived using digitizer software from the figures from Mian et al. but are not reported values within the publication.
bIncludes cost of cyclophosphamide only; respective background therapies excluded.
cOne-time dose.
Table 15: Key Model Parameters — Market Share
Market share by line of therapy | Second-line3 | Third line3 | Fourth line3 |
|---|---|---|---|
Market shares (reference scenario) | |||
BPd | — | — | — |
DVd | ██ █ ██ █ ██ | ██ █ ██ █ ██ | — |
PVd | — | — | — |
SVd | ███ █ ███ █ ███ | ███ █ ███ █ ███ | ███ █ ███ █ ███ |
IsaKd | ███ █ ███ █ ███ | ██ █ ██ █ ██ | — |
IsaPd | ██ █ ██ █ ██ | ███ █ ███ █ ███ | — |
Pd | — | — | — |
Kd | ██ █ ██ █ ██ | ██ █ ██ █ ██ | — |
Vd | — | — | — |
Cyclophosphamide doublets | ███ █ ███ █ ███ | ███ █ ███ █ ███ | ███ █ ███ █ ███ |
Cilta-cel | — | — | ███ █ ███ █ ███ |
Elranatamab | — | — | ███ █ ███ █ ███ |
Teclistamab | — | — | ███ █ ███ █ ███ |
Market shares (new drug scenario) | |||
BPd | 5% / 10% / 15% | 15% / 30% / 45% | 5% / 10% / 20% |
DVd | ██ █ ██ █ ██ | ██ █ ██ █ ██ | — |
PVd | — | — | — |
SVd | ███ █ ███ █ ███ | ███ █ ███ █ ██ | ██ █ ██ █ ██ |
IsaKd | ███ █ ███ █ ███ | ██ █ ██ █ ██ | — |
IsaPd | ██ █ ██ █ ██ | ███ █ ███ █ ██ | — |
Pd | — | — | — |
Kd | ██ █ ██ █ ██ | ██ █ ██ █ ██ | — |
Vd | — | — | — |
Cyclophosphamide doublets | ██ █ ██ █ ██ | ██ █ ██ █ ██ | ██ █ ██ █ ██ |
Cilta-cel | — | — | ██ █ ██ █ ██ |
Elranatamab | — | — | ██ █ ██ █ ██ |
Teclistamab | — | — | ██ █ ██ █ ██ |
BPd = belantamab, pomalidomide, and dexamethasone; DVd = daratumumab, bortezomib, and dexamethasone; IsaKd = isatuximab, carfilzomib, and dexamethasone; IsaPd = isatuximab, pomalidomide, and dexamethasone; Kd = carfilzomib and dexamethasone; MM = multiple myeloma; Pd = pomalidomide and dexamethasone; PVd = pomalidomide, bortezomib, and dexamethasone; SVd = selinexor, bortezomib, and dexamethasone; Vd = bortezomib and dexamethasone.
Key Issues of the Submitted BIA
CDA-AMC identified several key issues to the sponsor’s analysis that have notable implications on the results of the BIA:
Inappropriate use of IPD and RDI for drug acquisition cost calculation. Consistent with the limitation identified in the submitted pharmacoeconomic model (refer to Appendix 4), the sponsor used IPD from the DREAMM-8 trial to estimate drug acquisition costs for belantamab mafodotin, calculating dosing based on the draft Health Canada product monograph.30 Weekly doses of belantamab mafodotin were categorized as less than 1.7 mg/kg, 1.7 to 2.7 mg/kg, and greater than 2.7 mg/kg, with drug acquisition costs extrapolated when fewer than 50 patients remained on treatment.2 Due to limited data, the model assumed that doses less than 1.7 mg/kg and greater than 2.7 mg/kg incurred the same costs as 1.4 mg/kg and 2.7 mg/kg, which may have underestimated drug costs.2 Costs were also based on the closest labelled doses (1.9 mg/kg and 2.5 mg/kg), even when actual doses fell between these ranges.2 Unlike comparators, which applied RDI to account for dose reductions or delays, the sponsor’s approach for BPd may have introduced bias in favour of BPd. Moreover, the sponsor estimated drug costs by multiplying the base dose from product monographs with RDI estimates from the DREAMM-8 trial, assuming 100% RDI where data were unavailable.2 This approach introduces uncertainty, as real-world dosing may vary due to dose delays, missed doses, reductions to manage toxicity, or re-escalation, all of which impact drug costs. For IV medications, applying RDI alongside wastage assumptions further reduced estimated drug utilization, while prescription pills and oral treatments could be reimbursed regardless of adherence, creating inconsistencies in cost estimates.
CDA-AMC conducted a base-case reanalysis in which drug acquisition costs for BPd were calculated using RDI.
CDA-AMC conducted a scenario analysis in which all treatments were assumed to have 100% RDI.
CDA-AMC conducted a scenario analysis that adopted the IPD costing approach for BPd.
TTD estimates for patients receiving BPd and comparators is uncertain. The sponsor’s model estimated first-line treatment costs using TTD and PFS data from the DREAMM-8 trial, applying a Weibull distribution for both PVd and BPd groups.8 In the absence of published TTD data for external comparators, PFS from the sponsor-submitted NMA was used as a proxy.8 In the BIA base case, TTD was estimated using the area under the extrapolated parametric curves.8 For cilta-cel, the sponsor applied a PFS HR relative to PVd.31 For teclistamab and elranatamab, time to next treatment (TTNT) HRs versus Pd and PFS HRs versus Pd were utilized to calculate TTD.32,33 Using PFS and TTNT as proxies for TTD may introduce bias, as they do not directly reflect treatment duration, given that patients may experience progression-free survival even after treatment has been discontinued. Furthermore, cilta-cel efficacy estimates were based on the CARTITUDE-4 trial, in which only 25.8% of patients were triple-exposed, limiting the generalizability of the results to the fourth-line triple-exposed population.31 These assumptions are subject to the same limitations outlined in the critical appraisal of the pharmacoeconomic submission (refer to Appendix 4).
CDA-AMC conducted a base-case reanalysis using the log-normal parametric distribution to extrapolate TTD for BPd and the log-logistic distribution to extrapolate TTD for PVd.
Assumptions regarding subsequent therapies are highly uncertain. The sponsor assumed that the proportion of patients receiving subsequent therapy was the same across all treatment arms, based on available literature.17 Additionally, the sponsor used internal market estimates to derive the distribution of third- and fourth-line treatments.3 Consistent with the limitation identified in the pharmacoeconomic submission (refer to Appendix 4), clinical experts consulted by CDA-AMC agreed that treatment pathways for BPd and comparators are expected to be similar. However, substantial uncertainty remains regarding the distribution of subsequent therapies in the fourth-line setting, as cilta-cel, teclistamab, and elranatamab were under active negotiation with the pCPA at the time of the current review.
CDA-AMC conducted a base-case reanalysis that adjusted the proportion of subsequent therapies in the fourth-line setting to better align with expectations of clinical practice in Canada (refer to Table 7).
CDA-AMC conducted a scenario analysis that excluded subsequent therapies in the third- and fourth-line setting.
Treatment schedule of carfilzomib and dexamethasone is not reflective of clinical practice in Canada: The sponsor assumed that patients receiving carfilzomib and dexamethasone would follow a twice-weekly dosing schedule.34 In consultation with clinical experts, it was noted that most centres in Canada use the once-weekly schedule. This choice is attributed to the greater convenience for patients and a potentially improved efficacy profile.
CDA-AMC conducted a base-case reanalysis that adjusted the dosing schedule for carfilzomib and dexamethasone to align with the following once-weekly dosing: (28-day cycle) Cycle 1: 20 mg/m2 on day 1 then 70 mg/m2 on day 8 and day 15; Cycle 2: 70 mg/m2 on day 1, day 8, and day 15.
Market share estimates are highly uncertain. In the sponsor’s submitted BIA, the market share distributions in both the reference and new drug scenarios were based on internal market estimates.3 Given the rapidly evolving r/r MM treatment landscape, clinical experts consulted by CDA-AMC indicated that the market share distribution of SVd, Pd, Kd, and CyKd was likely underestimated, with greater uncertainty in third- and fourth-line settings. As previously noted, cilta-cel, elranatamab, and teclistamab were undergoing active negotiations with pCPA at the time of the current review, further contributing to uncertainty in the sponsor’s market share assumptions.35
CDA-AMC was unable to address this limitation due to the high degree of uncertainty surrounding the market share assumptions.
Impact of OS on the budget impact is uncertain. The sponsor’s model estimated OS for the PVd and BPd treatment groups using an exponential distribution, with survival calculated as the area under the extrapolated parametric curves. OS for other comparators was based on estimated relative treatment effects versus PVd from the sponsor-submitted NMA.8 Because BCMA-targeted therapies (cilta-cel, teclistamab, and elranatamab) were not included in the NMA, the sponsor used naive comparisons using HRs. For cilta-cel, the sponsor used an HR versus PVd.31 However, cilta-cel estimates were based on the CARTITUDE-4 trial, in which only 25.8% of patients were triple-exposed, limiting the generalizability of the results to the fourth-line triple-exposed population.31 For teclistamab and elranatamab, the sponsor used HRs versus Pd to estimate OS.32,33 This approach is subject to the same limitations identified in the CUA, as naive comparisons are less reliable than adjusted indirect comparisons.
CDA-AMC was unable to address this limitation owing to lack of clinical data.
CDA-AMC Reanalyses of the BIA
CDA-AMC revised the sponsor’s submitted analyses by making changes in model parameter values and assumptions, in consultation with clinical experts, as outlined in Table 16.
The results of the CDA-AMC stepwise reanalysis are presented in summary format in Table 17, and a more detailed breakdown is presented in Table 18. In the CDA-AMC base case, the 3-year budget impact of reimbursing BPd for the treatment of adult patients with r/r MM who have received at least 1 prior therapy was $484,818,738 (year 1 = $54,704,789; year 2 = $149,523,201; year 3 = $280,590,748).
Table 16: Revisions to the Submitted BIA
Stepped analysis | Sponsor’s value or assumption | CDA-AMC value or assumption |
|---|---|---|
1. BPd dosing assumption | IPD | RDI |
2. TTD extrapolation function |
|
|
3. Subsequent therapy | ||
4. Kd dosing schedule | Twice weekly | Once weekly |
CDA-AMC base case | ― | Reanalysis 1 + 2 + 3 + 4 |
BIA = budget impact analysis; BPd = belantamab mafodotin, pomalidomide, and dexamethasone; CDA-AMC = Canada’s Drug Agency; IPD = individual patient data; Kd = carfilzomib and dexamethasone; PVd = pomalidomide, bortezomib, and dexamethasone; RDI = relative dose intensity.
Table 17: Summary of the Stepped Analysis of the CDA-AMC Base Case
Stepped analysis | Three-year total ($) |
|---|---|
Submitted base case | 112,426,107 |
CDA-AMC reanalysis 1 | 356,094,400 |
CDA-AMC reanalysis 2 | 107,381,418 |
CDA-AMC reanalysis 3 | 237,137,729 |
CDA-AMC reanalysis 4 | 124,622,087 |
CDA-AMC base case: (Reanalysis 1 + 2 + 3 + 4) | 484,818,738 |
CDA-AMC = Canada’s Drug Agency.
Note: The CDA-AMC reanalysis is based on publicly available prices of the comparator treatments.
CDA-AMC used the CDA-AMC base case to conduct scenario analyses to explore uncertainty in the estimated budget impact of reimbursing BPd. The results are provided in Table 18.
Scenario 1: Subsequent therapy in the third and fourth-line settings were excluded from the CDA-AMC base case due to high degree of uncertainty surrounding their market shares.
Scenario 2: Assumed 100% RDI across all therapies.
Scenario 3: Assumed IPD costing approach for BPd.
Table 18: Disaggregated Summary of the BIA
Stepped analysis | Scenario | Year 0 (current situation) ($) | Year 1 ($) | Year 2 ($) | Year 3 ($) | Three-year total ($) |
|---|---|---|---|---|---|---|
Submitted base case | Reference total | 952,763,599 | 979,318,707 | 1,166,471,537 | 1,286,985,034 | 3,432,775,278 |
BPd | 0 | 0 | 0 | 0 | 0 | |
All other comparators | — | — | — | — | — | |
New drug total | 952,763,599 | 992,251,453 | 1,201,579,101 | 1,351,370,831 | 3,545,201,385 | |
BPd | 0 | 58,482,702 | 141,049,436 | 247,069,258 | 446,601,397 | |
All other comparators | 952,763,599 | 933,768,750 | 1,060,529,665 | 1,104,301,573 | 3,098,599,989 | |
Budget Impact | 0 | 12,932,746 | 35,107,565 | 64,385,797 | 112,426,107 | |
CDA-AMC base case | Reference total | 906,020,574 | 931,256,521 | 1,102,046,792 | 1,227,869,800 | 3,261,173,113 |
BPd | 0 | 0 | 0 | 0 | 0 | |
All other comparators | — | — | — | — | — | |
New drug total | 906,020,574 | 985,961,310 | 1,251,569,993 | 1,508,460,548 | 3,745,991,851 | |
BPd | 0 | 77,643,875 | 209,481,229 | 392,898,400 | 680,023,505 | |
All other comparators | 906,020,574 | 864,267,865 | 951,613,006 | 971,376,973 | 2,787,257,844 | |
Budget Impact | 0 | 54,704,789 | 149,523,201 | 280,590,748 | 484,818,738 | |
CDA-AMC scenario analyses | ||||||
Scenario 1: Excluding 3L and 4L subsequent therapies | Reference total | 356,492,192 | 366,383,960 | 521,910,400 | 632,909,351 | 1,521,203,711 |
New drug total | 356,492,192 | 420,780,127 | 672,794,852 | 916,967,248 | 2,010,542,228 | |
Budget Impact | 0 | 54,396,168 | 150,884,452 | 284,057,897 | 489,338,517 | |
Scenario 2: 100% RDI applied across therapies | Reference total | 934,564,543 | 960,598,679 | 1,141,674,236 | 1,275,239,597 | 3,377,512,512 |
New drug total | 934,564,543 | 1,053,613,555 | 1,394,690,031 | 1,750,279,719 | 4,198,583,305 | |
Budget Impact | 0 | 93,014,876 | 253,015,795 | 475,040,122 | 821,070,793 | |
Scenario 3: IPD-based costing approach | Reference total | 906,020,574 | 931,256,521 | 1,102,046,792 | 1,227,869,800 | 3,261,173,113 |
New drug total | 906,020,574 | 965,859,292 | 1,180,617,620 | 1,359,167,111 | 3,505,644,024 | |
Budget Impact | 0 | 34,602,771 | 78,570,828 | 131,297,311 | 244,470,911 | |
3L = third line; 4L = fourth line; BIA = budget impact analysis; CDA-AMC = Canada’s Drug Agency; BPd = belantamab mafodotin, pomalidomide, and dexamethasone; IPD = individual patient data; RDI = relative dose intensity.
Note: The CDA-AMC reanalysis is based on the publicly available prices of the comparator treatments.
ISSN: 2563-6596
Canada’s Drug Agency (CDA-AMC) is a pan-Canadian health organization. Created and funded by Canada’s federal, provincial, and territorial governments, we’re responsible for driving better coordination, alignment, and public value within Canada’s drug and health technology landscape. We provide Canada’s health system leaders with independent evidence and advice so they can make informed drug, health technology, and health system decisions, and we collaborate with national and international partners to enhance our collective impact.
Disclaimer: CDA-AMC has taken care to ensure that the information in this document was accurate, complete, and up to date when it was published, but does not make any guarantee to that effect. Your use of this information is subject to this disclaimer and the Terms of Use at cda-amc.ca.
The information in this document is made available for informational and educational purposes only and should not be used as a substitute for professional medical advice, the application of clinical judgment in respect of the care of a particular patient, or other professional judgments in any decision-making process. You assume full responsibility for the use of the information and rely on it at your own risk.
CDA-AMC does not endorse any information, drugs, therapies, treatments, products, processes, or services. The views and opinions of third parties published in this document do not necessarily reflect those of CDA-AMC. The copyright and other intellectual property rights in this document are owned by the CADTH (operating as CDA-AMC) and its licensors.
Questions or requests for information about this report can be directed to Requests@CDA-AMC.ca.