Drugs, Health Technologies, Health Systems
Reimbursement Review
Belantamab Mafodotin (Blenrep), Bortezomib, Dexamethasone
Sponsor: GlaxoSmithKline Inc.
Therapeutic area: Previously treated multiple myeloma
This multi-part report includes:
Clinical Review
Pharmacoeconomic Review
Clinical Review
Abbreviations
AE
adverse event
anti-CD38
anti–Cluster of Differentiation 38
B2M
beta2-microglobulin
BCMA
B-cell maturation antigen
BCVA
best corrected visual acuity
BVd
belantamab mafodotin plus bortezomib and dexamethasone
CAR T cell
chimeric antigen receptor T cell
CDA-AMC
Canada’s Drug Agency
CI
confidence interval
CMRG
Canadian Myeloma Research Group
CR
complete response
CrI
credible interval
CRR
complete response rate
CTCAE v5.0
Common Terminology Criteria for Adverse Events version 5
CyhKd
cyclophosphamide plus high-dose carfilzomib and dexamethasone
CyVd
cyclophosphamide plus bortezomib and dexamethasone
DoR
duration of response
DVd
daratumumab plus bortezomib and dexamethasone
ECOG PS
Eastern Cooperative Oncology Group Performance Status
EORTC QLQ-C30
European Organisation for Research and Treatment of Cancer Quality of Life Questionnaire Core 30
EVd
elotuzumab plus bortezomib and dexamethasone
FLC
free light chain
GHS
global health status
GRADE
Grading of Recommendations Assessment, Development and Evaluation
hKd
high-dose carfilzomib plus dexamethasone
hkDd
high-dose carfilzomib plus daratumumab and dexamethasone
HR
hazard ratio
HRQoL
health-related quality of life
IA1
interim analysis 1
IA2
interim analysis 2
IA3
interim analysis 3
IhKd
isatuximab plus high-dose carfilzomib plus dexamethasone
IMiD
immunomodulatory drug
IMWG
International Myeloma Working Group
IRC
independent review committee
ISS
International Staging System
ITC
indirect treatment comparison
ITT
intention to treat
Kd
carfilzomib plus dexamethasone
KM
Kaplan-Meier
KVA
Keratopathy and Visual Acuity
MM
multiple myeloma
MRD
minimal residual disease
NMA
network meta-analysis
OH (CCO)
Ontario Health (Cancer Care Ontario)
ORR
overall response rate
OS
overall survival
PanoVd
panobinostat plus bortezomib and dexamethasone
PFS
progression-free survival
PR
partial response
PVd
pomalidomide plus bortezomib plus dexamethasone
QoL
quality of life
R-ISS
Revised International Staging System
RCT
randomized controlled trial
RMDoR
restricted mean duration of response
RMST
restricted mean survival time
RRMM
relapsed or refractory multiple myeloma
SAE
serious adverse event
sCR
stringent complete response
SD
standard deviation
SLR
systematic literature review
SVd
selinexor plus bortezomib plus dexamethasone
TEM
treatment effect modifier
Vd
bortezomib plus dexamethasone
VGPR
very good partial response
Executive Summary
An overview of the submission details for the drug under review is provided in Table 1.
Table 1: Background Information on the Application Submitted for Review
Item | Description |
|---|---|
Drug product | Belantamab mafodotin (Blenrep) in combination with bortezomib and dexamethasone, 70 mg and 100 mg per single-use vials |
Sponsor | GlaxoSmithKline Inc. |
Indication | Belantamab mafodotin in combination with bortezomib and dexamethasone for the treatment of adults with relapsed or refractory multiple myeloma who have received at least 1 prior line of therapy |
Reimbursement request | As per indication |
Health Canada approval status | NOC |
Health Canada review pathway | Standard review |
NOC date | July 18, 2025 |
Recommended dosage | 2.5 mg/kg, administered intravenously once every 3 weeks |
NOC = Notice of Compliance.
Introduction
Multiple myeloma (MM) is a progressive and incurable malignancy characterized by the clonal expansion of malignant plasma cells and the overproduction of M proteins.1 Older individuals are more likely to develop MM, with a higher incidence in men compared to women; and in the US, it is more prevalent in African-American populations relative to people who are white and people of Asian ethnicity.2,3 The incidence rate of MM increased in Canada from 2003 to 2019 by about 1.3% per year for females and 1.7% per year for males.4 In Canada, approximately 3,900 new MM cases were diagnosed in 2023 and there were an estimated 1,700 MM-related deaths.5 In 2024, around 4,100 new cases were projected, with 1,750 cases in females and 2,400 in males.6 The 5-year survival rate for patients with MM is approximately 50%,4 though recent therapeutic advancements have improved survival outcomes, despite the lack of a cure.7,8
MM is most commonly diagnosed when patients present with symptoms such as bone pain, fatigue, anemia, kidney dysfunction, and recurrent infections.9 MM diagnosis requires the presence of 1 or more myeloma-defining events, along with either 10% or more clonal plasma cells in the bone marrow or a biopsy-proven plasmacytoma.3 Myeloma-defining events include end-organ damage (the CRAB criteria of hypercalcemia, renal insufficiency, anemia, and bone lesions) and 3 biomarkers: a clonal bone marrow plasma cell percentage of at least 60%, a free light chain (FLC) ratio of at least 100, and at least 1 focal lesion on an MRI.3 Prognosis is heavily influenced by staging, with the International Staging System (ISS) and its revised version, the Revised International Staging System (R-ISS), widely used to assess disease progression.10,11 ISS evaluates albumin and B2M levels, where advanced stages correlate with low albumin and high B2M. The R-ISS further incorporates tumour burden and high-risk genetic abnormalities to refine prognostication.10,11 Other factors, such as age, kidney function, and overall performance status, also impact prognosis.12 The build-up of resistance to different classes of therapies represents a significant challenge in the clinical management of MM because the disease typically becomes more resistant to treatment with each subsequent line of therapy.13-15 In Canada, studies show that remission rates decrease with each line of therapy, and attrition rates increase.16 These findings underscore the progressive nature of the disease and the growing need for diverse therapeutic options that can effectively manage relapsed or refractory multiple myeloma (RRMM). Patients with RRMM often experience a persistent symptom burden, including fatigue, bone pain, and depression, which can severely affect their quality of life (QoL).17,18 The objective of this Clinical Review Report is to review and critically appraise the clinical evidence submitted by the sponsor on the beneficial and harmful effects of belantamab mafodotin (hereafter referred to as belantamab) in combination with bortezomib and dexamethasone (BVd), administered intravenously once every 3 weeks, at a dose of 2.5 mg/kg, in the treatment of RRMM in adults who have received at least 1 prior therapy.
Perspectives of Patient, Clinicians, and Drug Programs
The information in this section is a summary of input provided by the patient and clinician groups that responded to the CDA-AMC call for input and from clinical experts consulted by CDA-AMC for the purpose of this review.
Patient Input
Patient input was submitted by 1 patient group: Myeloma Canada. Information was gathered from patients and caregivers through an online survey (N = 292). The most important symptoms related to myeloma that respondents want to control, in order of importance, include infections, mobility, renal problems, and pain. About 41% of patient respondents indicated that they required the help of a caregiver to manage their disease or treatment-related symptoms. The input noted that patients’ disease symptoms impacted their ability to travel, work, exercise, and conduct volunteer activities. Respondents noted that the most significant financial implications due to myeloma treatment was the loss of income and/or pension funds due to absence from work, disability, or early retirement, followed by the costs of travel, parking, drugs, and accommodation. Respondents felt that the interruption of life goals or accomplishments had the greatest impact on their QoL, followed by the loss of sexual desire, and anxiety or worry. Respondents reported a desire for a treatment that extends their life expectancy without disease progression (67% of respondents rated this “extremely important”) and improves their QoL (58% rated this “extremely important”).
No survey respondents had experience with BVd and 10 respondents indicated they had experience with belantamab (7 respondents with belantamab plus pomalidomide and dexamethasone and 3 respondents either with belantamab as monotherapy or combined with dexamethasone). Among these respondents, the least bearable side effects reported included blurry vision, dry eyes, eye irritation, sensitivity to light, and infections. Eight of the respondents indicated that the overall side effects of belantamab treatment were “somewhat or mostly” manageable. When asked if the treatment was effective in controlling myeloma, 6 respondents reported “mostly or completely,” 3 respondents stated “somewhat,” and 1 respondent stated “slightly.” The input emphasized the importance of patient preference in weighing the potential costs and benefits of any new treatment.
Clinician Input
Input From Clinical Experts Consulted for This Review
The clinical experts consulted by Canada’s Drug Agency (CDA-AMC) highlighted several challenges associated with the currently available therapies for MM in Canada. First, while various classes of drugs are available to manage MM at different stages, no single treatment can offer a definitive cure for the disease. Second, a critical treatment gap exists for patients who become refractory to lenalidomide or anti-CD38 therapies. This is especially problematic for older adults who have previously received daratumumab plus lenalidomide and dexamethasone because limited therapeutic options are available upon relapse. Third, treatment regimens such as carfilzomib plus dexamethasone (Kd) or selinexor plus bortezomib plus dexamethasone (SVd) demonstrate suboptimal outcomes, and many patients may not be candidates for more aggressive therapies like chimeric antigen receptor T-cell (CAR T-cell) therapy or bispecific antibodies. Additionally, there is a need for therapies with improved toxicity profiles. Because patients with MM often require treatment regimens with manageable side effects to preserve their QoL, there is an increasing demand for therapies that involve fewer clinic visits and less intensive monitoring.
According to the clinical experts consulted, belantamab would primarily be used in second-line treatment and beyond for MM, specifically for patients who have relapsed or are refractory to prior therapies. The clinical experts indicated that older patients, particularly those who have previously received lenalidomide plus bortezomib and dexamethasone, or daratumumab in combination with lenalidomide and dexamethasone, and are not refractory to bortezomib, are ideal candidates for belantamab. They also emphasized that, aside from ocular toxicities, the toxicity profile of belantamab is relatively favourable, particularly in older patients. Unlike other therapies, belantamab does not exhibit significant myelosuppressive toxicities, making it a good option for older patients who are more vulnerable to the adverse effects of other treatments. However, the clinical experts indicated that ocular toxicities remain a concern, and patients with pre-existing ocular conditions would be least suitable for belantamab.
The clinical experts indicated that assessing response to treatment for MM is generally straightforward, with routine blood tests being the primary method of monitoring. According to clinical experts, ocular toxicity with belantamab therapy can negatively impact QoL and requires more intensive monitoring than is standard in care for MM. Specifically, regular ophthalmologic assessments and slit lamp examinations are necessary to guide dose adjustments and prevent more severe ocular toxicity because they are not typically part of standard clinical practice in MM. The clinical experts consulted indicated that treatment with BVd would be discontinued for 2 primary reasons: disease progression and intolerable toxicity, with ocular toxicity being the most significant. Furthermore, the clinical experts also noted that ocular toxicity may require extending dosing intervals to every 8 weeks to 12 weeks, and in severe or intolerable cases, treatment may be discontinued. According to the clinical experts, treatment of MM with belantamab should be managed by trained hematologist-oncologists, with eye specialists involved in monitoring and managing ocular toxicity.
Clinician Group Input
Two clinician groups consisting of a total of 27 clinicians provided input for this review: the Ontario Health (Cancer Care Ontario) (OH [CCO]) Hematology Cancer Drug Advisory Committee and the Canadian Myeloma Research Group (CMRG). Both submissions noted that myeloma remains incurable despite the introduction of new drugs over the last 2 decades. Patients eventually become refractory to all available funded antimyeloma drugs. The input stated that symptom burden for patients with MM is high, with patients experiencing bone pain and destruction, anemia and other cytopenias, renal damage, hypercalcemia, and a high risk of infection. The CMRG stated that despite the clear benefits of lenalidomide as part of first-line therapy, progression on this potent drug even as single-drug maintenance leads to shorter progression-free survival (PFS) outcomes with nearly all traditional and reimbursed second-line regimens (including those containing an anti-CD38 monoclonal antibody) compared to the results without such exposure. Therefore, the input noted that drug exposure, rather than lines of therapy, more accurately defines the need for access to innovative treatments to forestall the development of refractory myeloma. The CMRG also noted that with the movement of combinations of 3 major drug classes (i.e., an immunomodulatory drug [IMiD], a proteasome inhibitor, and an anti-CD38 monoclonal antibody) to the first-line and second-line treatment setting, exposure and resistance to multiple drug classes now occur much earlier in the disease course than in the past. Therefore, the highest unmet need in myeloma continues to be effective treatment for patients who have progressed despite exposure to effective drugs.
OH (CCO) noted that the regimen would be another second-line treatment option for patients who are sensitive to bortezomib. The input noted that the treatment under review would be most suitable for patients who are unlikely to receive CAR T-cell therapy because BVd may preclude the future use of B-cell maturation antigen (BCMA)–targeted CAR T-cell therapy. Standard myeloma response outcomes used in clinical practice would be appropriate to determine if a patient is responding to the treatment under review, based on the M protein markers in the serum and/or urine, a bone marrow biopsy and, in some instances, imaging studies. Clinically meaningful responses usually correlate with at least a partial remission as defined by the International Myeloma Working Group (IMWG) consensus criteria. These include improvement in symptoms (the cessation of bone destruction with less pain, fewer fractures, and less need for radiotherapy), improvement in energy, and a better ability to perform activities of daily living. Responses are generally assessed every 1 month to 3 months depending on clinical stability and the regimen used for therapy. Factors to consider when deciding to discontinue the treatment under review include significant toxicities, particularly ocular adverse events (AEs), as well as disease progression. The input stated that the appropriate setting for BVd treatment is an outpatient setting and there is also a need for ophthalmological assessments.
Drug Program Input
Input was obtained from the drug programs that participate in the CDA-AMC reimbursement review process. The following were identified as key factors that could potentially affect the implementation of a CDA-AMC recommendation for BVd:
relevant comparators
considerations for the prescribing of therapy
generalizability
care provision issues
system and economic issues.
The clinical experts consulted by CDA-AMC provided advice on the potential implementation issues raised by the drug programs. Refer to Table 4 for more details.
Clinical Evidence
Systematic Review
Description of Studies
The sponsor-conducted systematic literature review (SLR) identified 1 pivotal, open-label, randomized trial (the DREAMM-7 study, N = 494) that assessed the efficacy and safety of BVd relative to daratumumab in combination with bortezomib and dexamethasone (DVd) in adult patients with RRMM. The primary objective of the DREAMM-7 study was to demonstrate the superiority of BVd compared to DVd in PFS. Key secondary objectives were to demonstrate superiority in overall survival (OS), duration of response (DoR), and minimal residual disease (MRD) negativity. The trial enrolled patients who had received at least 1 prior line of MM therapy and had documented disease progression during or after their most recent treatment. Patients were enrolled in the trial across 142 centres in 20 countries, including 5 sites in Canada. In the DREAMM-7 trial, patients were randomized in a 1:1 ratio to receive BVd at the dose of 2.5 mg/kg on day 1 of every 21-day cycle intravenously, or DVd. The DREAMM-7 study included a screening period, a treatment period, and a follow-up period. Efficacy end points of interest to this review included PFS, OS, health-related quality of life (HRQoL) measured by the European Organisation for Research and Treatment of Cancer Quality of Life Questionnaire Core 30 (EORTC QLQ-C30) global health status (GHS), DoR, MRD negativity, overall response rate (ORR), complete response rate (CRR), and safety outcomes, including ocular AEs and serious adverse events (SAEs). The trial end points were analyzed using data from the cut-off date of October 2, 2023, and the database lock date of November 6, 2023, for the first interim analysis or interim analysis 1 (IA1), and from the cut-off date of October 7, 2024, for the second interim analysis or interim analysis 2 (IA2) or a prespecified primary PFS analysis.
In general, patient demographic and disease characteristics were well balanced between the BVd and DVd treatment groups. The mean age of patients was 64.5 (standard deviation [SD] = 9.5) years in the BVd group and 63.6 (SD = 10.1) years in the DVd group. Most patients had an Eastern Cooperative Oncology Group Performance Status (ECOG PS) score of 0 or 1 (96% in both groups), and an R-ISS score of stage I or stage II (95% and 94% in the BVd and DVd groups, respectively), with immunoglobulin G being the most common myeloma immunoglobulin. Of the 494 patients, 250 (51%) patients had received 1 prior line of therapy, 117 (24%) patients had received 2 prior lines of therapy, and 70 (14%) patients had received 3 prior lines of therapy. Additionally, 257 (52%) patients had prior exposure to lenalidomide, and 166 (34%) patients had disease refractory to lenalidomide. High-risk cytogenetic abnormalities were present in 67 (28%) patients in the BVd group and 69 (27%) patients in the DVd group, with t(4;14) and 17p13del being the most common high-risk cytogenetic abnormalities in both groups.
Efficacy Results
PFS per Independent Review Committee Assessment
At the time of IA1, using the October 2, 2023, data cut-off, the median duration of follow-up was 28.2 months. In the intention-to-treat (ITT) population, PFS events were reported for 91 (37%) patients in the BVd group and 158 (63%) patients in the DVd group. The median PFS was 36.6 months (95% confidence interval [CI], 28.4 months to not estimable) in the BVd group and 13.4 months (95% CI, 11.1 months to 17.5 months) in the DVd group, with a between-group hazard ratio (HR) of 0.41 (95% CI, 0.31 to 0.53; P < 0.00001) in favour of the BVd group. The Kaplan-Meier (KM)–estimated probabilities of being alive or progression-free at 12 months and 18 months were 78.3% (95% CI, 72.2% to 83.2%) versus 53.3% (95% CI, 46.5% to 59.5%), and 68.8% (95% CI, 62.0% to 74.7%) versus 42.8% (95% CI, 36.2% to 49.2%), in the BVd and DVd groups, respectively.
PFS reached the predefined boundary for statistical significance at IA1 and, in accordance with the study protocol, was evaluated as an exploratory end point at the time of IA2. At the time of IA2, using the October 7, 2024, data cut-off, the median PFS was ████ ██████ ████ ███ ████ ██████ ██ ████ ███████ in the BVd group and ████ ██████ ████ ███ ████ ██████ ██ ████ ███████ in the DVd group. The KM-estimated probabilities of being alive and progression-free at 24 months and 36 months were █████ ████ ███ █████ ██ ██████ versus █████ ████ ███ █████ ██ █████), and █████ ████ ███ █████ ██ ██████ versus █████ ████ ███ █████ ██ ██████, in the BVd and DVd groups, respectively.
The results of predefined exploratory subgroup analyses were consistent with the results of the primary PFS analyses, including for those exposed or refractory to lenalidomide (HR = 0.33 [95% CI, 0.23 to 0.48] and HR = 0.37 [95% CI, 0.24 to 0.56], respectively), those with more than 1 prior line of therapy (HR = 0.33 [95% CI, 0.23 to 0.48]), those with high cytogenetic risk (HR = 0.36 [95% CI, 0.22 to 0.58]) and those with R-ISS stage II or stage III (HR = 0.45 [95% CI, 0.32 to 0.64]). The results of all sensitivity analyses were consistent with the primary PFS analyses. The results of the PFS analyses per an independent review committee (IRC) assessment were consistent with those from the investigator assessment.
OS per IRC Assessment
At the time of IA1, using the October 2, 2023, data cut-off, the median OS was not reached in either treatment group. OS data had reached 29% (141 of 494) of patients for overall maturity. Death was reported in 54 (22%) patients in the BVd group and 87 (35%) patients in the DVd group, with a between-group HR of 0.57 (95% CI, 0.40 to 0.80; P value = 0.00049). At the time of IA1, the results for OS did not meet the significance criterion.
At the time of IA2, using the October 7, 2024, data cut-off, the median OS had not been reached in either treatment group. Death was reported in 68 (28%) patients in the BVd group and 103 (41%) patients in the DVd group, with a between-group HR of 0.58 (95% CI, 0.43 to 0.79; P value = 0.00023) in favour of the BVd group. At the time of IA2, OS data had reached 34.6% (171 of 494) of patients for overall maturity, and the significance criterion had been met (P < 0.00112). The KM-estimated probabilities of being alive at 24 months and 36 months were 79.0% (95% CI, 73.2% to 83.7%) versus 67.4% (95% CI, 61.0% to 73.0%), and 71.4% (95% CI, 67.9% to 79.2%) versus 60.2% (95% CI, 53.6% to 66.2%), in the BVd and DVd groups, respectively.
Duration of Response
DoR was analyzed based on the restricted mean duration of response (RMDoR), using a nonparametric approach. The RMDoR is a composite end point that integrates overall response data and PFS data, allowing cross-group comparison, and efficiently assesses the treatment effect related to tumour reductions. At the time of IA1, using the October 2, 2023, data cut-off, the RMDoR was 19.0 months (95% CI, 17.7 months to 20.4 months) in the BVd group and 13.2 months (95% CI, 11.8 months to 14.6 months) in the DVd group, with a ratio of RMDoR of ████ ████ ███ ████ ██ █████ P value < 0.00001) in favour of the BVd group.
At the time of IA1, using the October 2, 2023, data cut-off, the median DoR was 35.6 months (95% CI, 30.5 months to not estimable) in the BVD group and 17.8 months (95% CI, 13.8 months to 23.6 months) in the DVd group. At the time of IA2, using the October 7, 2024, data cut-off, the median DoR was 40.8 months (95% CI, 30.5 months to not estimable) in the BVd group and 17.8 months (95% CI, 13.8 months to 23.6 months) in the DVd group. The KM-estimated probabilities of maintaining response at 12 months and 36 months were 83.3% (95% CI, 77.1% to 87.9%) versus 61.2% (95% CI, 53.4% to 68.0%), and █████ ████ ███ █████ ██ ██████ versus █████ ████ ███ █████ ██ ██████, in the BVd and DVd groups, respectively.
Minimal Residual Disease
MRD is considered to be a biomarker that provides a reliable quantification of tumour burden, independent of the assay used.19 At the time of IA1, using the October 2, 2023, data cut-off, the MRD negativity analysis was considered exploratory because the OS results were not significant at the time of IA1. The proportion of patients who had achieved MRD negativity by best response (complete response [CR] or stringent complete response [sCR]) was higher in the BVd group compared with the DVd group at 24.7% versus 9.6%, respectively (P < 0.00001). Because the IA2 analysis of OS reached statistical significance, the MRD negativity results from the IA1 primary analysis can be considered statistically significant due to the prespecified hierarchical testing of outcomes. At the time of IA2, using the October 7, 2024, data cut-off, MRD negativity rates by CR or sCR remained consistent with the IA1 results. The BVd group showed higher MRD negativity rates (25.1%) compared with the DVd group (10.4%).
Complete Response Rate
At the time of IA1, using the October 2, 2023, data cut-off, a greater proportion of patients in the BVd group (34.6%) compared with the DVd group (17.1%) had achieved CR or sCR, with a between-group difference of █████ ████ ███ ████ ██ ███████
Overall Response Rate
At the time of IA1, using the October 2, 2023, data cut-off, a greater proportion of patients in the BVd group (82.7%) compared with the DVd group (71.3%) had achieved a confirmed partial response (PR) or better, with a between-group difference of █████ ████ ███ ████ ██ ███████
European Organisation for Research and Treatment of Cancer Quality of Life Questionnaire Core 30
GHS Domain
In the DREAMM-7 study, HRQoL was assessed using the EORTC QLQ-C30 tool. EORTC QLQ-C30 data reported in this section are from IA1, with the data cut-off date of October 2, 2023. The EORTC QLQ-C30 GHS domain remained stable across both treatment groups over time. Both groups showed a slight mean deterioration in GHS scores between week 4 and week 43, after which scores stabilized and remained consistent throughout the treatment period. Between week 43 and week 100, 24% to 35% of patients in the BVd group experienced an improvement in GHS or QoL scores (a 10-point increase or higher). Small sample sizes at later time points limited the ability to interpret the results.
At week 43, in the GHS score, patients in the BVd group experienced a mean change of ███ ██████ from baseline compared with a change of ███ ██████ in the DVd group, with a least squares mean difference between groups of ███ ████ ███ ████ ██ ████. At week 121, in the GHS score, patients in the BVd group experienced a mean change of ███ ██████ from baseline compared with a change of ████ ██████ in the DVd group, with a least squares mean difference between groups ███ ████ ███ ████ ██ █████
Harms Results
In the DREAMM-7 trial, all patients in both groups experienced at least 1 AE. At the time of IA1, a higher proportion of patients in the BVd group had experienced at least 1 SAE compared to those in the DVd group (50% versus 37%, respectively). The most common SAEs in the BVd and DVd groups were pneumonia (11% versus 4%, respectively), COVID-19 (5% versus 4%, respectively), pyrexia (5% versus 4%, respectively), and COVID-19 pneumonia (93% in both groups). The IA2 data on SAEs were not available at the time of submission to CDA-AMC. At the time of IA1 and IA2, a higher proportion of patients in the BVd group had discontinued treatment due to AEs compared to the DVd group (31% versus 19%, and 32% versus 19%, respectively). At the time of IA1 and IA2, a higher proportion of patients in the BVd group had experienced a dose interruption or delay of study treatment compared to the DVd group (94% versus 75%, and 95% versus 76%, respectively). At the time of IA2, deaths were reported in 29% of patients in the BVd group and in 41% of patients in the DVd group. The causes of death were similar between groups, with the exception of those attributed to cancer. The majority of deaths in both groups were attributed to cancer, with 10% in the BVd group and 22% in the DVd group —primarily due to MM.
Notable Harms
At the time of IA1 and IA2, a higher proportion of patients in the BVd group had experienced at least 1 ocular AE of any grade compared to the DVd group (79% versus 29%, and ███ ██████ ████ ████████████). Blurred vision and dry eye were reported in more than half of the patients in the BVD treatment group. Ocular AEs in the BVd group were more severe, with ███ classified as grade 3 or grade 4, while the majority in the DVd group were classified as grade 1 █████. At the time of IA2, treatment discontinuations due to ocular AEs were reported in ██ of patients in the BVd group compared to none in the DVd group. Treatment modifications due to ocular AEs were more common in the BVd group, with 52% of patients experiencing ocular AEs having doses interrupted, delayed, or reduced compared to only 2% in the DVd group. At the time of IA1, investigator-assessed corneal events and best corrected visual acuity (BCVA) events, as evaluated by the Keratopathy and Visual Acuity (KVA) scale, were reported exclusively in patients in the BVd group. A total of 201 (83%) patients in the BVd group had an incidence of corneal events (overall KVA grade). The severity of the corneal events was high, with ███ of the 201 patients classified as grade 3 and ███ as grade 4. Most corneal events were managed through dose modifications, with 89% of affected patients having doses interrupted or delayed, and 31% experiencing dose reductions. In the BVd group, 81% of patients had BCVA events, mostly classified as grade 2 or higher. The incidence of investigator-assessed BCVA events, as evaluated by the KVA scale, was ███ in the BVd group, with the majority of events classified as grade 2.
At the time of IA1 and IA2, a higher proportion of patients in the BVd group had experienced thrombocytopenia compared to those in the DVd group (87% versus 65%, and 88% versus 65%, respectively). At the time of IA2, of the 212 patients in the BVd group and 160 patients in the DVd group who had experienced thrombocytopenia, grade 3 and grade 4 thrombocytopenia were more frequent in the BVd group (83%) compared to the DVd group (71%). Thrombocytopenia events of grade 4 were reported in 53% of patients receiving BVd versus 33% of patients receiving DVd. In the DREAMM-7 trial, ███ of patients in the BVd group and ██ in the DVd group had received platelet transfusions. At the time of IA2, despite the high incidence, few patients (5% or less) in either group had experienced SAEs related to thrombocytopenia, and treatment discontinuation rates due to thrombocytopenia were low (██ in the BVd group and ██ in the DVD group). Dose reductions and interruptions or delays were more common in the BVd group compared to the DVd group (43% versus 20%, and 53% versus 39%, respectively). At the time of IA1, neutropenia was reported in ███ of patients in the BVd group and ███ of patients in the DVd group. Neutropenia events of grade 4 were more common in the BVd group (███) compared to the DVd group (███). A higher proportion of patients in the DVd group had experienced infusion-related reactions (███) compared to the BVd group (██), with more than ███ of patients in both treatment groups having grade 2 events.
Critical Appraisal
Randomization was performed using an appropriate methodology with adequate allocation concealment; randomization stratification was prespecified. Knowledge of the assigned treatment due to open-label design of the trial could have led to bias in the reporting and measurement of subjective outcomes, including patient-reported outcomes (e.g., HRQoL) and subjective AEs. However, the extent and direction of bias due to treatment knowledge is uncertain. Based on the enrolled sample size, the study was powered to test its primary and key secondary end points. The statistical analysis methods appear to be acceptable. Results for the primary outcome were based on a prespecified interim analysis (249 PFS events), which occurred at an 89% information fraction, relative to the planned final PFS analysis (280 PFS events). The OS data were immature at both interim analyses and the median OS was not reached in either treatment group. Because the study outcomes were based on interim analyses, there is a risk that the effect of BVd compared with DVd was overestimated; however, the existence and extent of any overestimation remains uncertain.20-22 Patients were allowed to receive posttreatment anticancer medications after discontinuing study treatment, which could have influenced the assessment of OS. Subgroup analyses were prespecified and conducted only for PFS; however, there was no multiplicity control for the subgroup analyses. A large number of patients in the DREAMM-7 trial discontinued treatment, with fewer discontinuations (both from monotherapy and combination therapy) in the BVd group (66%) compared to the DVd group (78%), which may influence the interpretation of harms outcomes. The clinical experts consulted indicated that the main reasons for treatment discontinuation were as expected, and included disease progression and AEs, with ocular toxicity being the main concern associated with belantamab treatment. They also noted that several strategies have been developed to manage the ocular toxicity of belantamab and prevent permanent drug discontinuation. No strong conclusions could be drawn about the effect of BVd compared with DVd on HRQoL due to an increased risk of type I error and a high risk of attrition bias, particularly at longer follow-up.
According to the clinical experts consulted by CDA-AMC for this review, the patient population in the DREAMM-7 trial generally reflects patients in clinical practice in this setting. Patients were eligible for inclusion in the DREAMM-7 trial if they met 1 of the measurability parameters, including having a serum M protein concentration of 0.5 g/dL or higher. The clinical experts noted that some patients with serum M protein concentration below 0.5 g/dL would still be eligible for treatment with BVd in clinical practice. The clinical experts indicated that, aside from refractoriness to daratumumab as a comparator in this trial, all other exclusion criteria were consistent with clinical practice. According to the clinical experts consulted, the demographic and disease characteristics of the DREAMM-7 trial population were reflective of patients living in Canada with RRMM. The mean age of patients in the DREAMM-7 study was 64 years, with clinical experts noting that in the real-world setting, transplant-eligible patients would likely be younger, whereas patients with relapsed or refractory disease would typically be older. Most patients in the DREAMM-7 trial had an ECOG PS score of 0 or 1, and an R-ISS score of stage I or stage II. The clinical experts consulted indicated that this would be reflective of clinical practice in the second-line setting, but not in later relapse. Only 34% of patients in the trial were refractory to lenalidomide. The clinical experts indicated that, in the real-world setting, the proportion of patients who are refractory to lenalidomide in second-line therapy and beyond would be higher because it is commonly used as maintenance therapy after achieving a response to initial treatment. They also noted that these patients may have a poorer response to second-line or third-line treatments compared to those who are not refractory to lenalidomide.
GRADE Summary of Findings and Certainty of the Evidence
For pivotal studies and randomized controlled trials (RCTs) identified in the sponsor’s systematic review, the Grading of Recommendations Assessment, Development and Evaluation (GRADE) tool was used to assess the certainty of the evidence for outcomes considered most relevant to inform expert committee deliberations, and a final certainty rating was determined as outlined by the GRADE Working Group23,24
When possible, certainty was rated in the context of the presence of an important (nontrivial) treatment effect; if this was not possible, certainty was rated in the context of the presence of any treatment effect (i.e., the clinical importance is unclear). In all cases, the target of the certainty of evidence assessment was based on the point estimate and where it was located relative to the threshold for a clinically important effect (when a threshold was available) or to the null. The selection of outcomes for GRADE assessment was based on the sponsor’s Summary of Clinical Evidence, consultation with clinical experts, and input received from patient and clinician groups and public drug plans. The following list of outcomes was finalized in consultation with expert committee members:
PFS (the time from the date of randomization until the earliest date of documented disease progression determined by an IRC, according to IMWG criteria,25 or death due to any cause)
OS (the time from the date of randomization until the date of death due to any cause)
HRQoL (the change from baseline in GHS or QoL scale scores)
harms (severe AEs and ocular AEs).
Results of GRADE Assessments
Table 2 presents the GRADE summary of findings for BVd.
Table 2: Summary of Findings for BVd Versus DVd for Patients With RRMM
Outcome and follow-up | Patients (DREAMM-7 study), N | Relative effect (95% CI) | Absolute effects (95% CI) | Certainty | What happens | ||
|---|---|---|---|---|---|---|---|
DVd | BVd | Difference | |||||
PFS | |||||||
Probability of being alive and progression-free at 12 months Median follow-up: 40.2 monthsa, b | 494 (1 RCT) | NA | ███ ███ █████ | ███ ███ █████ ████ ██ ███ ███ ██████ | ███ ████ ███ █████ ████ ██ ███ ████ ███ ██████ | Highc | BVd results in a clinically important higher probability of being alive and progression-free at 12 months when compared with DVd. |
Probability of being alive and progression-free at 36 months Median follow-up: 40.2 monthsa, b | 494 (1 RCT) | NA | ███ ███ █████ | ███ ███ █████ ████ ██ ███ ███ ██████ | ███ ████ ███ █████ ████ ██ ███ ████ ███ ██████ | Highc | BVd results in a clinically important higher probability of being alive and progression-free at 36 months when compared with DVd. |
███████ ████████ | |||||||
Probability of being alive at 12 months Median follow-up: 40.2 monthsa, d | 494 (1 RCT) | NA | ███ ███ █████ | ███ ███ █████ ████ ██ ███ ███ ██████ | ██ ████ ███ █████ ██ ████ ██ ███ ████ ███ ██████ | Lowe | BVd may result in a clinically important higher probability of being alive at 12 months when compared with DVd. |
Probability of being alive at 36 months Median follow-up: 40.2 monthsa, d | 494 (1 RCT) | NA | ███ ███ █████ | ███ ████ ██ ███ ███ ██████ | ███ ████ ███ █████ ███ ██ ███ ████ ███ ██████ | Moderatee | BVd likely results in a clinically important higher probability of being alive at 36 months when compared with DVd. |
HRQoL (EORTC QLQ-C30 GHS or QoL score) | |||||||
GHS or QoL score, change from baseline (95% CI) Median follow-up: 148 weeksf | 494 (1 RCT) | NA | The EORTC QLQ-C30 GHS domainj remained stable across both treatment groups over time. Both groups showed a slight mean deterioration in GHS scores between week 4 and week 43, after which scores stabilized and remained consistent throughout the treatment period. | Very lowg, h | The evidence is very uncertain about the effect of BVd on GHS or QoL when compared with DVd. | ||
Harms | |||||||
Proportion of patients with ocular adverse events Median follow-up: 40.2 monthsa | 488 (1 RCT) | NR | ███ ███ █████ | ███ ███ █████ ████ | ███ ████ ███ ██████████ ██ ███ ████ ███ ███████ | Highi | BVd results in an increase in ocular adverse events when compared with DVd. |
Proportion of patients with serious adverse events Median follow-up: 28.2 monthsf | 488 (1 RCT) | NR | ███ ███ █████ | ███ ███ █████ ████ | ███ ████ ███ █████████ ██ ███ ████ ███ ███████ | Moderatej | BVd likely results in a clinically important increase in serious adverse events when compared with DVd. |
BVd = belantamab mafodotin plus bortezomib and dexamethasone; CDA-AMC = Canada’s Drug Agency; CI = confidence interval; DVd = daratumumab plus bortezomib and dexamethasone; EORTC QLQ-C30 = European Organisation for Research and Treatment of Cancer Quality of Life Questionnaire Core 30; GHS = global health status; HRQoL = health-related quality of life; IA1 = interim analysis 1; IA2 = interim analysis 2; KM = Kaplan-Meier; QoL = quality of life; MID = minimal important difference; NA = not applicable; NR = not reported; OS = overall survival; PFS = progression-free survival; RCT = randomized controlled trial; RRMM = relapsed or refractory multiple myeloma.
Notes: Study limitations (which refer to internal validity or risk of bias), inconsistency across studies, indirectness, the imprecision of effects, and publication bias were considered when assessing the certainty of the evidence. All serious concerns in these domains that led to the rating down of the level of certainty are documented in the Table 2 footnotes.
Estimates of the absolute between-group differences were calculated using the KM method at the request of CDA-AMC.
aIA2, using the October 7, 2024, data cut-off.
bPFS reached the predefined boundary for statistical significance at IA1 and, in accordance with the study protocol, was evaluated as an exploratory end point at the time of IA2.
cAn empirically derived MID was not identified for the between-group difference for this outcome. A difference of 10% (100 per 1,000 patients) between the groups was identified by the clinical expert consulted by CDA-AMC as a threshold of clinical importance for this outcome.
dAt the time of IA2, using the October 7, 2024, data cut-off, OS met the significance criterion of P being less than 0.00112.
eRated down 2 levels for serious study limitations. Results were based on an interim analysis, so there was the potential for effect to be overestimated, and the OS data were immature. The median OS was not reached in either treatment group. There was a risk of bias due to confounding as a result of the transition of patients to subsequent treatment postprogression. There was no established between-group MID for OS and the clinical experts considered that a 5% difference (50 per 1,000 patients) between groups in the probability of patients being alive could be considered a threshold of clinical importance. The point estimate suggests a clinically important benefit while the lower boundary of the 95% CI suggests little to no difference.
fIA1, using the October 3, 2023, data cut-off.
gRated down 2 levels for very serious risk of bias due to a relatively high amount of missing data (direction unclear) over time and due to assessor knowledge of treatment assignment. Also rated down 1 level for serious imprecision; CIs were wide, especially at later time points, and included the potential for benefit and harm. Because no single time point was of highest importance, the trend over time was appraised.
hThe statistical testing for HRQoL was not adjusted for multiplicity in the DREAMM-7 trial and should be considered as supportive evidence.
iThere was no established MID for this outcome and clinical experts consulted by CDA-AMC could not provide a threshold of important difference. In the absence of a known threshold, the null was used.
jA large number of patients in the DREAMM-7 trial discontinued treatment, with fewer discontinuations (both from monotherapy and combination therapy) in the BVd group (66%) compared to the DVd group (78%); patients in the BVd group had longer exposure to the study drug than those in the DVd group. Rated down 1 level for imprecision; an empirically derived MID was not identified for the between-group difference for this outcome. Based on the MID identified by clinical experts (a difference of 10% between the groups), the 95% CI for the between-group difference crossed the MID threshold.
Sources: Clinical Study Report for the DREAMM-7 study (2024)26 and Clinical Study Report Addendum (Interim Analysis 2) for the DREAMM-7 study (2025).27
Long-Term Extension Studies
No long-term extension studies were identified by the sponsor.
Indirect Comparisons
Description of Studies
In the absence of direct comparative data for belantamab versus comparators used in clinical practice aside from daratumumab, the sponsor supplied 1 report that included indirect treatment comparisons (ITCs). The primary objective of the ITC was to assess the comparative efficacy of BVd in a population matching the ITT population of the DREAMM-7 trial, relative to other comparators for which PFS data were available. The secondary objectives of the NMA were to assess the comparative efficacy of BVd in a population of prior lenalidomide-exposed patients, based on available data for OS and ORR, and in a population of lenalidomide-refractory patients, relative to comparators for which data were available for PFS and ORR. The following outcomes were reported to address the objectives of the network meta-analysis (NMA): PFS, OS, and ORR for the ITT population, and PFS and ORR for the lenalidomide-exposed and lenalidomide-refractory populations.
Efficacy Results
The NMA results presented in this report were limited to comparisons between BVd and regimens relevant to Canada for this submission:
isatuximab plus high-dose carfilzomib and dexamethasone (IhKd)
high-dose carfilzomib plus dexamethasone (hKd)
pomalidomide plus bortezomib and dexamethasone (PVd)
SVd
DVd
bortezomib plus dexamethasone (Vd)
Kd.
Progression-Free Survival
In the ITT population, results from the fixed-effects models indicated that BVd demonstrated a favourable improvement in PFS compared with all 7 comparators, with HRs ranging from 0.13 (95% credible interval [CrI], 0.09 to 0.18) versus Vd to 0.42 (95% CrI, 0.26 to 0.69) versus IhKd. The results from the corresponding random-effects model showed a favourable improvement in PFS for BVd compared with DVd, hKd, PVd, SVd, and Vd, with HRs ranging from 0.13 (95% CrI, 0.06 to 0.28) versus Vd to 0.41 (95% CrI, 0.22 to 0.75) versus DVd. However, the evidence regarding PFS between BVd and IhKd, as well as Kd, was insufficient to show a difference between groups. The point estimates were comparable across both the fixed-effects and random-effects models.
Among lenalidomide-exposed patients, results from the fixed-effects models found that BVd demonstrated a favourable improvement in PFS compared with all comparators. The results from the corresponding random-effects model showed a favourable improvement in PFS for BVd versus DVd, hKd, and Vd; evidence versus other comparators (IhKd, Kd, PVd, and SVd) were insufficient to show a difference between groups. Among lenalidomide-refractory patients, results from the fixed-effects models found that BVd demonstrated a favourable improvement in PFS compared with all comparators. The results from the corresponding random-effects model showed a favourable improvement in PFS of BVd versus DVd, hKd, and Vd; evidence versus other comparators (IhKd, Kd, and PVd) was insufficient to show a difference between groups.
Overall Survival
In the ITT population, results from the fixed-effects models indicated that BVd demonstrated a favourable improvement in OS compared with DVd, hKd, PVd, SVd, and Vd, with HRs ranging from 0.39 (95% CrI, 0.26 to 0.59) compared to Vd to 0.57 (95% CrI, 0.40 to 0.80) compared to DVd. However, results from the corresponding random-effects model for OS revealed that the evidence for a difference between BVd and other comparators was insufficient to show a difference between groups. No secondary or subgroup analyses for OS were conducted or reported in the sponsor-submitted NMA.
Overall Response Rate
In the ITT population, results from fixed-effects models found that BVd demonstrated a favourable improvement in ORR compared with DVd, hKd, PVd, SVd, and Vd, with ORs ranging from 1.94 (95% CrI, 1.27 to 2.99) compared to DVd to 5.99 (95% CrI, 3.41 to 10.64) compared to Vd. The results from the corresponding random-effects model for PFS showed that BVd demonstrated a favourable improvement in ORR compared with Vd alone; evidence for other comparisons was insufficient to show a difference between groups. The point estimates were comparable across the fixed-effects and random-effects models. Among lenalidomide-exposed patients, results from fixed-effects models found that BVd demonstrated a favourable improvement in ORR compared with DVd, hKd, high-dose carfilzomib plus daratumumab and dexamethasone (hkDd), PVd, SVd, and Vd. The results from the corresponding random-effects model showed a favourable improvement in ORR versus only Vd; evidence for the other comparisons was insufficient to show a difference between groups. Among lenalidomide-refractory patients, results from fixed-effects models found that BVd demonstrated a favourable improvement in ORR compared with SVd and Vd. The results from the corresponding random-effects model showed a favourable improvement in ORR versus Vd alone; evidence for the other comparisons was insufficient to show a difference between groups. No subgroup analyses for ORR were conducted or reported in the sponsor-submitted NMA.
Harms Results
No comparative effect estimates for harms were provided.
Critical Appraisal
Overall, the SLR conducted to identify potentially relevant studies for the ITC was methodologically robust. The clinical experts indicated that the most relevant comparators included in the NMA are IhKd for transplant-eligible patients with MM and SVd for transplant-ineligible patients. The clinical experts also noted that clinicians would prefer prescribing IhKd over hKd, as well as Kd, in transplant-ineligible patients in these settings. Additionally, the clinical experts noted that cyclophosphamide plus bortezomib and dexamethasone (CyVd), cyclophosphamide plus high-dose carfilzomib and dexamethasone (CyhKd), panobinostat plus bortezomib and dexamethasone (PanoVd), hkDd, and elotuzumab plus bortezomib and dexamethasone (EVd), which are included in this NMA, are not relevant to clinical practice in Canada for RRMM. The clinical experts indicated that cyclophosphamide in combination with doublet therapies (Kd and Vd) is a relevant comparator for BVd in the second-line setting and beyond; however, it was not included in the sponsor-submitted NMA. Therefore, the relative effect of BVd versus this comparator of interest is unknown.
Several important sources of heterogeneity were noted across the included trials in terms of study design (e.g., crossover, placebo as a comparator, the inclusion of phase II trials, the time during which trials were undertaken, dosing regimens). Notably, there was considerable variation across studies in the number of prior lines of therapy, prior lenalidomide and IMiD exposures, and high cytogenic risk profile. The observed heterogeneity could have introduced bias that was not adequately accounted for, leading to uncertainty in the analysis. This uncertainty is reflected in the wide CrIs of the comparisons of treatment effects, particularly for ORR and OS. Several important disease-specific characteristics were not reported in some studies within the network, which limits the ability to assess heterogeneity between the studies. While the definitions of end points were similar across the trials, there was considerable variation in the duration of follow-up, and the censoring rules across the PFS analyses were not specified, which may represent a potential source of heterogeneity. The magnitude of the treatment effects appeared consistent across both subgroups (lenalidomide-exposed and lenalidomide-refractory); however, the 95% CrIs were wide given the smaller sample sizes, leading to greater uncertainty in the resulting treatment effects. The studies included in the secondary and subgroup analyses for PFS differ from those in the full network, meaning the subgroup analyses do not directly compare the same network as the full population analyses. Narrowing the network could potentially impact the results. The studies within networks included a mix of patients in multiple lines of therapy, which may have introduced bias because patients in earlier or later lines of therapies can influence each network differently. According to the clinical experts consulted by CDA-AMC, patients in earlier lines of therapy are likely to have better outcomes compared with patients in later lines of therapy. There were no closed loops in the network to allow for consistency to be assessed.
Bayesian fixed methods were used as a base-case analysis, with a random-effects model for the exploratory analysis. However, if heterogeneity is present, the CrIs of the fixed-effects model may be narrower and less conservative, potentially underestimating the uncertainty from between-study variation. The assumptions of the fixed-effects model (e.g., a single true effect size, no between-study heterogeneity) are likely less realistic than those of the random-effects model (e.g., assumes variation in effect sizes across studies). Secondary analyses were performed for lenalidomide-exposed and lenalidomide-refractory patient populations because it is expected that most patients living in Canada will receive a regimen based on lenalidomide in the first line of therapy, with subsequent therapies tailored to the patient’s initial response. Some trials had concerns for risk of bias; this assessment was undertaken at the study level, which ignores that risks of bias may vary by effect estimates. It may not be assured that randomization was maintained within subgroups (unless these were stratification factors in contributing trials). Additionally, no patient-reported QoL data, which was considered an important end point for this review, were evaluated. Furthermore, no comparative effect estimates for harms were provided. These limitations preclude a comprehensive assessment of the balance of benefits and harms and must be considered when drawing conclusions from the NMA results.
Studies Addressing Gaps in the Evidence From the Systematic Review
No studies addressing gaps in the pivotal and RCT evidence were identified by the sponsor.
Conclusions
The available evidence from the pivotal, open-label, multicentre RCT (the DREAMM-7 study) provides important insights into the efficacy and safety of BVd compared with DVd in adults with RRMM who have received at least 1 prior therapy. Compared with DVd, BVd results in a clinically important increase in the probability of being alive and progression-free at 12 months and 36 months. At 36 months, BVd likely results in a clinically important increase in the probability of being alive when compared with DVd. At the time of both interim analyses, median OS had not been reached in either group, and the effects of BVd on OS beyond 36 months are uncertain. No definitive conclusion can be drawn regarding the effects of BVd treatment on HRQoL because of the high amount of missing data over time, the potential bias due to assessor knowledge of treatment assignment, and imprecision, making the direction of effects unclear.
Overall, the safety of BVd was consistent with the known safety profiles of the individual drugs for RRMM. However, the DREAMM-7 trial showed that treatment with BVd likely results in an increase in the proportion of patients who experience SAEs when compared with DVd. Notably, ocular AEs were more common and severe in the group receiving BVd, requiring more frequent treatment modifications. Despite these higher incidences of AEs in the BVd group, they were expected to be manageable with proper monitoring and supportive care in clinical practice. Further, unlike other therapies, belantamab does not exhibit significant myelosuppressive toxicities, making it a beneficial treatment option for older patients who are more vulnerable to the adverse effects of other treatments.
The results of the sponsor-submitted NMA suggested a favourable treatment effect of BVd on PFS compared to several other regimens, including IhKd, hKd, PVd, SVd, Kd, and Vd. Similarly, a favourable effect on OS was observed relative to hKd, PVd, SVd, and Vd. However, the magnitude of these effects remains uncertain.
Introduction
The objective of this report is to review and critically appraise the evidence submitted by the sponsor on the beneficial and harmful effects of BVd, administered intravenously once every 3 weeks, at a dose of 2.5 mg/kg, in the treatment of RRMM in adults who have received at least 1 prior therapy.
Disease Background
Content in this section has been informed by materials submitted by the sponsor and clinical expert input. The following has been summarized and validated by the review team.
MM is a progressive and incurable malignancy characterized by the clonal expansion of malignant plasma cells and the overproduction of M proteins.1 Older individuals are more likely to develop MM, with a higher incidence in men compared to women; and in the US, it is more prevalent in African-American populations relative to people who are white and people of Asian ethnicity.2,3 The incidence rate of MM increased in Canada from 2003 to 2019 by about 1.3% per year for females and 1.7% per year for males.4 In Canada, approximately 3,900 new MM cases were diagnosed in 2023 and there were an estimated 1,700 MM-related deaths.5 In 2024, around 4,100 new cases were projected, with 1,750 cases in females and 2,400 in males.6 The 5-year survival rate for patients with MM is approximately 50%,4 though recent therapeutic advancements have improved survival outcomes, despite the lack of a cure.7,8
MM is most commonly diagnosed when patients present with symptoms such as bone pain, fatigue, anemia, kidney dysfunction, and recurrent infections.9 MM diagnosis requires the presence of 1 or more myeloma-defining events, along with either 10% or more clonal plasma cells in the bone marrow or a biopsy-proven plasmacytoma.3 Myeloma-defining events include end-organ damage (the CRAB criteria of hypercalcemia, renal insufficiency, anemia, and bone lesions) and 3 biomarkers: a clonal bone marrow plasma cell percentage of at least 60%, an FLC ratio of at least 100, and at least 1 focal lesion on an MRI.3 Prognosis is heavily influenced by staging, with the ISS and its revised version, the R-ISS, widely used to assess disease progression.10,11 ISS evaluates albumin and B2M levels, where advanced stages correlate with low albumin and high B2M. The R-ISS further incorporates tumour burden and high-risk genetic abnormalities to refine prognostication.10,11 Other factors, such as age, kidney function, and overall performance status, also impact prognosis.12
The build-up of resistance to different classes of therapies represents a significant challenge in the clinical management of MM because the disease typically becomes more resistant to treatment with each subsequent line of therapy.13-15 In Canada, studies show that remission rates decrease with each line of therapy, and attrition rates increase.16 These findings underscore the progressive nature of the disease and the growing need for diverse therapeutic options that can effectively manage RRMM. Patients with RRMM often experience a persistent symptom burden, including fatigue, bone pain, and depression, which can severely affect their QoL.17,18 The objective of this Clinical Review Report is to review and critically appraise the clinical evidence submitted by the sponsor on the beneficial and harmful effects of BVd, administered intravenously once every 3 weeks, at a dose of 2.5 mg/kg, in the treatment of RRMM in adults who have received at least 1 prior therapy.
Standards of Therapy
Content in this section has been informed by materials submitted by the sponsor and clinical expert input. The following has been summarized and validated by the review team.
According to the clinician group and clinical experts consulted, the most important treatment goals for patients with MM are to prolong survival, delay disease progression, extend the DoR, improve QoL, and minimize side effects. Clinician groups and clinical experts consulted by CDA-AMC for this review indicated that initial therapy for patients with MM depends on whether patients are transplant-eligible or transplant-ineligible at diagnosis, which is aligned with the CDA-AMC Provisional Funding Algorithm.28 According to the clinical experts and clinician groups, the majority of patients who are ineligible for transplant can be given daratumumab, lenalidomide, and dexamethasone as frontline therapy. A small number of patients will receive lenalidomide in combination with dexamethasone, and some other combination of drugs that does not contain daratumumab, such as lenalidomide in combination with bortezomib and dexamethasone, with lenalidomide continued until disease progression. According to the clinical experts and clinician groups, patients who are eligible for transplant can receive induction therapy with either cyclophosphamide in combination with bortezomib and dexamethasone or lenalidomide in combination with bortezomib and dexamethasone, and then lenalidomide maintenance until disease progression.
According to the clinical experts and clinician groups, the current approach to treatment of RRMM depends on several factors, including patient factors (i.e., age, comorbidity, prior toxicity), line of therapy, and prior therapies received. The clinical group and clinical experts indicated that treatment options for patients who have relapsed while on lenalidomide maintenance include such regimens as proteosome inhibitor (bortezomib, carfilzomib)–containing combinations such as SVd, IhKd, or Kd with or without cyclophosphamide. The clinical group and clinical experts emphasized that although triplet regimens are preferred for second-line and beyond treatment, patients who have progressed on lenalidomide alone tend to have a poorer prognosis. The general strategy for the second-line treatment and beyond includes the use of a drug that the patient has either not been exposed to previously or has demonstrated sensitivity to in the treatment regimen.29
According to the Provisional Funding Algorithm for Multiple Myeloma developed by CDA-AMC,28 patients with drug resistance cannot be treated again with the same drug; however, in later lines, previously used treatments are often reused when accessible due to a lack of novel options.30 The clinical group indicated that in patients who have received anti-CD38s, IMiDs, and proteasome inhibitors, and were refractory to their last treatment, their options in fourth-line treatment and beyond include teclistamab, elranatamab, or ciltacabtagene autoleucel. The clinical experts consulted noted that the treatment landscape in Canada will undergo significant changes, with BCMA and CAR T-cell therapies being used in second-line treatment and beyond, and bispecific antibodies being used in fourth-line treatment and beyond.
Drug Under Review
BVd is indicated for the treatment of adults with RRMM who have received at least 1 prior line of therapy. The recommended starting dose schedule of BVd is 2.5 mg/kg administered intravenously once every 3 weeks for the first 8 cycles, and then continued as a single drug until disease progression or unacceptable toxicity.
Belantamab is a humanized, afucosylated, BCMA-targeted, antibody-drug conjugate that is fused to the microtubule inhibitor auristatin-F by a protease-resistant cysteine linker.31-33 BCMA is an established therapeutic target for MM due to its highly selective expression on malignant plasma cells.33-35 Belantamab binds to cell surface BCMA and is rapidly internalized into the tumour cell.36 Upon internalization, the cytotoxic drug is released, disrupting the microtubule network and leading to cell cycle arrest and the apoptosis of tumour cells. The antibody enhances the recruitment and activation of immune effector cells, killing tumour cells by antibody-dependent cellular cytotoxicity and phagocytosis. Apoptosis induced by belantamab is accompanied by markers of immunogenic cell death, which may contribute to an adaptive immune response to tumour cells.33-35,36
BVd underwent a standard review by Health Canada. The sponsor’s requested reimbursement criteria for BVd are aligned with the Health Canada indication.
Key characteristics of BVd are summarized in Table 3 with other treatments available for adult patients with MM who have received at least 1 prior therapy.
Table 3: Key Characteristics of Belantamab Mafodotin, Daratumumab, Isatuximab, Selinexor, Carfilzomib, Bortezomib, and Pomalidomide
Characteristic | Belantamab mafodotin | Monoclonal antibodies (daratumumab, isatuximab) | Selinexor | Proteasome inhibitors (carfilzomib, bortezomib) | Immunomodulatory drugs (pomalidomide) |
|---|---|---|---|---|---|
Recommended combination | BVd | DVd IhKd | SVd | Kd Vd | PVd |
Mechanism of action | An ADC that binds to the cell surface BCMA. The microtubule inhibitor (MMAF) leads to cell cycle arrest and triggers apoptosis in cancer cells; induces cell lysis via ADCC and ADCP | Daratumumab: Targets CD38 overexpressed on tumour cells in hematologic malignancies; induces cell lysis via a variety of mechanisms, including ADCC, CDC, and ADCP Isatuximab: Binds to a specific extracellular epitope of CD38, triggering mechanisms that result in the death of CD38-expressing tumour cells | A compound that blocks XPO1, a nuclear export protein that transports cargo proteins within the cell. XPO1 inhibition by selinexor leads to the reduction of cancer cells. | Proteasome inhibition leads to the accumulation of misfolded protein in endoplasmic reticulum, resulting in apoptosis and the inhibition of cell proliferation. | Immunomodulatory and antineoplastic activity; inhibits proliferation and induces apoptosis of hematopoietic tumour cells |
Indicationa | In combination with Vd for the treatment of adult patients with RRMM who have received at least 1 prior therapy | Daratumumab: In combination with Vd for the treatment of adult patients with MM who have received at least 1 prior therapy Isatuximab: In combination with Kd for the treatment of adult patients with MM who have received at least 1 prior therapy | In combination with Vd for the treatment of adult patients with MM who have received at least 1 prior therapy | Carfilzomib: In combination with dexamethasone, for adult patients with RRMM who have received 1 to 3 prior lines of therapy Bortezomib: Treatment of progressive MM in patients who have received at least 1 prior therapy and who have already undergone or are unsuitable for SCT | Pomalidomide: In combination with Vd for the treatment of adult patients with MM who have received at least 1 prior treatment regimen that included lenalidomide |
Route of administration | IV infusion | IV infusion | Orally | IV infusion | Orally |
Recommended dosage | Start with 2.5 mg/kg IV once every 3 weeks in combination for the first 8 cycles, and then continue as a single drug | DVd (3-week cycle):16 mg/kg IV weekly, week 1 to week 9; every 2 weeks, week 10 to week 24; and every 4 weeks thereafter Isatuximab: 10 mg/kg weekly (day 1, day 8, day 15, and day 22 of the 28-day cycle) for cycle 1 and every 2 weeks (day 1 and day 15) thereafter | Selinexor: 100 mg q.w. on day 1 of each week Bortezomib: 1.3 mg/m2 SC injection once weekly for 4 weeks on day 1 of each week followed by 1 week off Dexamethasone: 20 mg taken orally twice weekly on day 1 and day 2 of each week | Kd twice weekly: 20 mg/m2 to start, then increase to 56 mg/m2 (30-minute infusion) Kd every week: 20 mg/m2 to start, then increase to 70 mg/m2 (30-minute infusion) Vd: 1.3 mg/m2 on day 1, day 4, day 8, and day 11 of each 21-day cycle | Pomalidomide: 4 mg once daily, day 1 to day 21 of each 28-day cycle Bortezomib: 1.3 mg/m2 IV or SC injection on day 1, day 4, day 8, and day 11 of each 21-day cycle Dexamethasone: 40 mg taken orally on day 1, day 8, day 15, and day 22 of a 28-day cycle |
Serious adverse effects or safety issues | Ocular adverse reactions (blurred vision, dry eye, eye irritation, photophobia), infusion reactions, pneumonia, pyrexia, thrombocytopenia, anemia | Daratumumab: Infusion reactions, neutropenia, thrombocytopenia, hepatitis B reactivation Isatuximab: Neutropenia, infusion reactions, second primary malignancies | Fatigue, severe or life-threatening hyponatremia, nausea, vomiting, diarrhea, anorexia or weight loss, thrombocytopenia, neutropenia, infections, dizziness, cataracts | Infusion reactions, TLS infections, cardiac disorders, venous thrombosis, hypertension, hemorrhage, thrombocytopenia, hepatotoxicity, hepatitis B reactivation, posterior reversible encephalopathy syndrome, PML, acute renal failure, pulmonary toxicity | Neutropenia, thrombocytopenia, infections, DVT and pulmonary embolism, hepatotoxicity, anaphylaxis, hepatitis B reactivation, severe rash (SJS, TEN, DRESS), tumour lysis syndrome |
ADC = antibody-drug conjugate; ADCC = antibody-dependent cell-mediated cytotoxicity; ADCP = antibody-dependent cellular phagocytosis; BCMA = B-cell maturation antigen; BVd = belantamab mafodotin plus bortezomib and dexamethasone; CD38 = Cluster of Differentiation 38; CDC = complement-dependent cytotoxicity; DRESS = Drug Rash with Eosinophilia and Systemic Symptoms; DVd = daratumumab plus bortezomib and dexamethasone; DVT = deep vein thrombosis; IhKd = isatuximab plus high-dose carfilzomib and dexamethasone; Kd = carfilzomib plus dexamethasone; MM = multiple myeloma; MMAF = monomethyl auristatin-F; PML = progressive multifocal leukoencephalopathy; PVd = pomalidomide plus bortezomib plus dexamethasone; q.w. = every week; RRMM = relapsed or refractory multiple myeloma; SC = subcutaneous; SCT = stem cell transplant; SJS = Stevens-Johnson syndrome; SVd = selinexor plus bortezomib plus dexamethasone; TEN = toxic epidermal necrolysis; TLS = tumour lysis syndrome; Vd = bortezomib plus dexamethasone; XPO1 = exportin 1.
aHealth Canada–approved indication.
Sources: Product monographs for belantamab mafodotin,37 Darzalex,38 Sarclisa,39 Velcade,40 Xpovio,41 Pomalyst,42 and Kyprolis.43
Perspectives of Patients, Clinicians, and Drug Programs
The full patient and clinician group submissions received are available in the consolidated patient and clinician group input document for this review on the project website.
Patient Group Input
This section was prepared by the review team based on the input provided by patient groups.
Patient input was submitted by 1 patient group: Myeloma Canada. Information was gathered from patients and caregivers through an online survey (N = 292). The most important symptoms related to myeloma that respondents want to control, in order of importance, include infections, mobility, renal problems, and pain. Forty-one percent of patient respondents indicated that they required the help of a caregiver to manage their disease or treatment-related symptoms. The input noted that patients’ disease symptoms impacted their ability to travel, work, exercise, and conduct volunteer activities. Respondents noted that the most significant financial implications due to myeloma treatment were the loss of income and/or pension funds due to absence from work, disability, or early retirement followed by the costs of travel, parking, drugs, and accommodation. Respondents felt that the interruption of life goals or accomplishments had the greatest impact on their QoL, followed by the loss of sexual desire, and anxiety or worry. Respondents reported a desire for a treatment that extends their life expectancy without disease progression (67% of respondents rated this “extremely important”) and improves their QoL (58% rated this “extremely important”).
No survey respondents had experience with BVd and 10 respondents indicated they had experience with belantamab (7 respondents with belantamab, pomalidomide, and dexamethasone, and 3 respondents either with belantamab as monotherapy or combined with dexamethasone). Among these respondents, the least bearable side effects reported included blurry vision, dry eyes, eye irritation, sensitivity to light, and infections. Eight of the respondents indicated that the overall side effects of belantamab treatment were “somewhat or mostly” manageable. When asked if the treatment was effective in controlling myeloma, 6 respondents reported “mostly or completely,” 3 respondents stated “somewhat,” and 1 respondent stated “slightly.” The input emphasized the importance of patient preference in weighing the potential costs and benefits of any new treatment.
Clinician Input
Input From Clinical Experts Consulted for This Review
All CDA-AMC review teams include at least 1 clinical specialist with expertise regarding the diagnosis and management of the condition for which the drug is indicated. Clinical experts are a critical part of the review team and are involved in all phases of the review process (e.g., providing guidance on the development of the review protocol, assisting in the critical appraisal of clinical evidence, interpreting the clinical relevance of the results, providing guidance on the potential place in therapy). The following input was provided by 3 clinical specialists with expertise in the diagnosis and management of MM.
Unmet Needs
Despite significant advances in the treatment of MM, substantial unmet needs remain in its management. The clinical experts consulted by CDA-AMC highlighted several challenges associated with the currently available therapies for MM in Canada. First, while various classes of drugs are available to manage MM at different stages, no single treatment can offer a definitive cure for the disease. Second, a critical treatment gap exists for patients who become refractory to lenalidomide or anti-CD38 therapies. This is especially problematic for older adults who have previously received daratumumab in combination with lenalidomide plus dexamethasone because limited therapeutic options are available upon relapse. Third, treatment regimens such as Kd or SVd demonstrate suboptimal outcomes, and many patients may not be candidates for more aggressive therapies like CAR T-cell therapy or bispecific antibodies. Additionally, there is a need for therapies with improved toxicity profiles. Because patients with MM often require treatment regimens with manageable side effects to preserve their QoL, there is an increasing demand for therapies that involve fewer clinic visits and less intensive monitoring.
Place in Therapy
The clinical experts consulted by CDA-AMC indicated that belantamab would primarily be used in second-line treatment and beyond for MM, specifically for patients who have relapsed or are refractory to prior therapies. The clinical experts indicated that as a BCMA-targeting therapy, belantamab offers a novel mechanism of action that distinguishes it from other BCMA-targeted therapies. The clinical experts noted that for patients who are refractory to lenalidomide and proteasome inhibitors, belantamab could be considered in the early relapse phase (after 1 to 3 prior lines of therapy). The clinical experts noted that for patients who have not been exposed to anti-CD38 therapy, the current standard of care for those who can tolerate it includes isatuximab plus carfilzomib and dexamethasone, isatuximab plus pomalidomide and dexamethasone, or DVd. The clinical experts indicated that BVd could potentially be used as an alternative to SVd, Kd, and pomalidomide plus dexamethasone in older patients. However, in younger patients, if the ciltacabtagene autoleucel eligibility criteria require no prior BCMA exposure, the use of BVd will likely be minimal in these settings.
Patient Population
The clinical experts indicated that older patients, particularly those who have previously received lenalidomide plus bortezomib and dexamethasone, or daratumumab in combination with lenalidomide and dexamethasone, and are not refractory to bortezomib, are ideal candidates for belantamab. They noted that these patients are often undertreated with the current standard-of-care options, making belantamab a promising alternative. The clinical experts indicated that in younger adults, the availability of ciltacabtagene autoleucel in second-line and beyond treatment may limit the use of belantamab, especially if they have had prior exposure to BCMA therapies. However, the clinical experts noted that belantamab may still be considered for these patients in later relapse settings. The clinical experts emphasized that, aside from ocular toxicities, the toxicity profile of belantamab is relatively favourable, particularly in older adult patients. Unlike other therapies, belantamab does not exhibit significant myelosuppressive toxicities, making it a good option for older patients who are more vulnerable to the adverse effects of other treatments. However, the clinical experts indicated that ocular toxicities remain a concern and patients with pre-existing ocular conditions should be carefully assessed for eligibility and closely monitored for ocular toxicity. The clinical experts noted that belantamab has demonstrated profound and sustained responses, with clinical trials suggesting that dose reductions and extended intervals between infusions preserve efficacy while providing good tolerability, including in relation to ocular toxicity.
Assessing the Response Treatment
The clinical experts noted that assessing response to treatment for MM is generally straightforward, with routine blood tests being the primary method of monitoring. These include complete blood count, chemistry panels, FLC assays, serum protein electrophoresis, and immunofixation electrophoresis, which are typically performed every 4 weeks or before each new treatment cycle. Bone imaging is used less frequently but can be helpful for assessing response. The clinical experts indicated that improvement in MM is closely associated with an enhancement in QoL. However, ocular toxicity with belantamab therapy can negatively impact QoL and requires more intensive monitoring than is standard in care for MM. Specifically, regular ophthalmologic assessments and slit lamp examinations are necessary to guide dose adjustments and prevent more severe ocular toxicity because they are not typically part of standard clinical practice in MM.
Discontinuing Treatment
The clinical experts indicated that treatment with BVd would be discontinued for 2 primary reasons: disease progression and intolerable toxicity. Disease progression, assessed though routine clinical testing and according to IMWG criteria, is the most common reason for discontinuation. The second major reason is intolerance to toxicities, with ocular toxicity being the most significant. The clinical experts indicated that ocular toxicity may require extending dosing intervals to every 8 weeks to 12 weeks, and in severe or intolerable cases, treatment may be discontinued. The clinical experts also noted that other toxicities, such as recurrent infections (especially if hospitalization is required), cytopenia, secondary primary malignancies, or intractable diarrhea, could also lead to discontinuation. The clinical experts emphasized the importance of establishing clear criteria for dose reductions or delays to manage toxicities effectively and reduce unnecessary treatment discontinuations.
Prescribing Considerations
The clinical experts emphasized that while community sites can manage myeloma treatment, the ocular toxicity associated with belantamab therapy requires specialized support from eye specialists, such as ophthalmologists or optometrists, depending on availability. Therefore, the treatment of MM should be managed by trained hematologist-oncologists, with eye specialists involved in monitoring and managing ocular toxicity. The clinical experts also noted that protective contact lenses are being tested as a potential way to mitigate the severity of ocular toxicity. Additionally, they mentioned that cytopenias and other adverse effects from treatments like bortezomib are typically well managed in both tertiary and community care settings.
Clinician Group Input
This section was prepared by the review team based on the input provided by clinician groups.
Two clinician groups consisting of a total of 27 clinicians provided input for this review, including the OH (CCO) Hematology Cancer Drug Advisory Committee and the CMRG. Both submissions noted that myeloma remains incurable despite the introduction of new drugs over the last 2 decades. Patients eventually become refractory to all available funded antimyeloma drugs. The input stated that symptom burden for patients with MM is high, with patients experiencing bone pain and destruction, anemia and other cytopenias, renal damage, hypercalcemia, and a high risk of infection. The CMRG stated that despite the clear benefits of lenalidomide as part of first-line therapy, progression on this potent drug even as single-drug maintenance leads to shorter PFS outcomes with nearly all traditional and reimbursed second-line regimens (including those containing an anti-CD38 monoclonal antibody) compared to the results without such exposure. Consequently, the input noted that drug exposure, rather than lines of therapy, more accurately defines the need for access to innovative treatments to forestall the development of refractory myeloma. The CMRG also noted that with the movement of combinations of 3 major drug classes (i.e., an IMiD, a proteasome inhibitor, and an anti-CD38 monoclonal antibody) to the first-line and second-line treatment setting, exposure and resistance to multiple drug classes now occurs much earlier in the disease course than in the past. Therefore, the highest unmet need in myeloma continues to be effective treatment for patients who have progressed despite exposure to effective drugs.
OH (CCO) noted that the regimen would be another second-line treatment option for patients who are sensitive to bortezomib. The input noted that the treatment under review would be most suitable for patients who are unlikely to receive CAR T-cell therapy as BVd may preclude the future use of BCMA-targeted CAR T-cell therapy. Standard myeloma response outcomes used in clinical practice would be appropriate to determine if a patient is responding to the treatment under review, based on the M protein markers in the serum and/or urine, a bone marrow biopsy and, in some instances, imaging studies. Clinically meaningful responses usually correlate with at least a partial remission as defined by IMWG consensus criteria. These include improvement in symptoms (the cessation of bone destruction with less pain, fewer fractures, and less need for radiotherapy), improvement in energy, and a better ability to perform activities of daily living. Responses are generally assessed every 1 to 3 months depending on clinical stability and the regimen used for therapy. Factors to consider when deciding to discontinue the treatment under review include significant toxicities, particularly ocular AEs, as well as disease progression. The input stated that the appropriate setting for BVd treatment is an outpatient setting and there is also a need for ophthalmological assessments.
Drug Program Input
The drug programs provide input on each drug being reviewed through the reimbursement review processes by identifying issues that may impact their ability to implement a recommendation. The implementation questions and corresponding responses from the clinical experts consulted by CDA-AMC for this review are summarized in Table 4.
Table 4: Summary of Drug Plan Input and Clinical Expert Response
Drug program implementation question | Clinical expert response |
|---|---|
Relevant comparators | |
The trial compared BVd against DVd, which has become a less relevant comparator. How does BVd compare with Kd, SVd, IhKd, and PVd? | The clinical experts indicated that IhKd may have been a more appropriate comparator for BVd because it is considered more potent and associated with a longer PFS than DVd. According to clinical experts, in lenalidomide-refractory patients, the SVd, Kd, and PVd regimens show a median PFS of less than 1 year. The clinical experts indicated that BVd likely offers better efficacy than most of the listed regimens, with the possible exception of IhKd —though without direct comparisons, this is difficult to determine. Overall, BVd may be a suitable alternative to these regimens in certain clinical scenarios. |
At the time of this input, first-line quadruplet regimens (daratumumab plus bortezomib plus lenalidomide and dexamethasone for transplant-eligible patients with myeloma, and isatuximab plus bortezomib plus lenalidomide and dexamethasone for transplant-ineligible patients) are under CDA-AMC review. Ciltacabtagene autoleucel (1 to 3 prior lines; fourth line), elranatamab, and teclistamab are also in active negotiations. | This is a comment from the drug plans to inform pERC deliberations. |
Considerations for prescribing of therapy | |
Another belantamab mafodotin regimen (BPd) is also under review, with a different dosing schedule. Caution is needed to ensure that the correct dosing schedule is chosen for BVd, especially in the event of dose reductions. | This is a comment from the drug plans to inform pERC deliberations. |
Due to the ocular toxicity, eye exams are required. PAG is concerned that patients may not be able to access ophthalmologists or optometrists in a timely manner. | This is a comment from the drug plans to inform pERC deliberations. |
Can belantamab mafodotin be administered with other bortezomib dosing regimens (e.g., weekly bortezomib)? In the trial, patients who had to stop bortezomib plus dexamethasone were permitted to continue belantamab mafodotin monotherapy (or vice versa) at the discretion of the investigator. | According to clinical experts, there is substantial evidence showing that once-weekly bortezomib is likely as effective as twice-weekly dosing, with a significantly improved side effect profile. The clinical experts noted that it is anticipated that belantamab mafodotin will be used alongside once-weekly bortezomib, without significant concerns about differences in efficacy with twice-weekly bortezomib. |
Generalizability | |
Should the following patients be considered for BVd:
| The clinical experts noted that patients who are intolerant or refractory to bortezomib should not receive the BVd regimen. According to clinical experts, BVd should be considered in patients with anti-CD38 refractory disease; they were only excluded because the control group was DVd. The clinical experts also indicated that it is important to note that the true efficacy of BVd in patients who are refractory to anti-CD38 therapies remains unknown because there are no available data in this population. According to clinical experts, the BVd regimen can be used in patients with systemic light-chain amyloidosis and plasma cell leukemia, although it has not been formally tested in these conditions. |
Should patients on bortezomib plus dexamethasone or alternative treatments be switched to belantamab mafodotin? | The clinical experts indicated that if a patient was previously on selinexor, bortezomib, and dexamethasone, switching to BVd would likely not be appropriate. However, if the patient was on bortezomib and dexamethasone alone, the addition of a third drug such as belantamab mafodotin could be considered — though it is worth noting that very few patients are treated with doublets in current practice. According to clinical experts, newly diagnosed transplant-eligible patients currently receiving bortezomib are typically doing so as part of an autologous stem cell transplant approach and possibly in the frontline setting — so this regimen would not be indicated in that context. For non–transplant-eligible patients at relapse, treatment with bortezomib and dexamethasone alone is unlikely, making this a less common scenario that would need to be evaluated separately. |
Funding algorithm | |
Request an initiation of a rapid provisional funding algorithm. | This is a comment from the drug plans to inform pERC deliberations. |
The trial excluded patients with prior BCMA-targeted therapies. Is there sufficient evidence to support the sequencing of belantamab mafodotin with other BCMA-targeted therapies? | According to clinical experts, although data are currently lacking, immunotherapies targeting BCMA work through mechanisms distinct from belantamab mafodotin, so resistance to 1 should not theoretically preclude responsiveness to others. There is insufficient evidence to inform on the sequencing of belantamab mafodotin with other BCMA-targeted therapies. |
Care provision issues | |
Belantamab mafodotin is supplied as 70 mg and 100 mg vials. It has a relatively short stability. Dose reductions were also needed in the DREAMM-7 trial to manage side effects. These can result in drug wastage. | This is a comment from the drug plans to inform pERC deliberations. |
System and economic issues | |
The feasibility of adoption (budget impact) may need to be considered depending on the extent of uptake. | This is a comment from the drug plans to inform pERC deliberations. |
There may be potential out-of-pocket eye care costs (e.g., eye exams, eye drops) that are not affordable for some patients. This, in turn, may impact the management of ocular side effects. | This is a comment from the drug plans to inform pERC deliberations. |
There are confidential prices for carfilzomib, isatuximab, pomalidomide, and selinexor. Negotiations are ongoing for cilta-cel, elranatamab, and teclistamab. | This is a comment from the drug plans to inform pERC deliberations. |
Anti-CD38 = anti–Cluster of Differentiation 38; BCMA = B-cell maturation antigen; BVd = belantamab mafodotin plus bortezomib and dexamethasone; BPd = belantamab mafodotin plus pomalidomide and dexamethasone; CDA-AMC = Canada’s Drug Agency; cilta-cel = ciltacabtagene autoleucel; DVd = daratumumab plus bortezomib and dexamethasone; IhKd = isatuximab plus high-dose carfilzomib and dexamethasone; Kd = carfilzomib plus dexamethasone; PAG = Provincial Advisory Group; pERC = pan-Canadian Oncology Drug Review Expert Review Committee; PFS = progression-free survival; PVd = pomalidomide plus bortezomib plus dexamethasone; SVd = selinexor plus bortezomib plus dexamethasone.
Clinical Evidence
The objective of this Clinical Review Report is to review and critically appraise the clinical evidence submitted by the sponsor on the beneficial and harmful effects of BVd, administered intravenously once every 3 weeks, at a dose of 2.5 mg/kg, in the treatment of RRMM in adults who have received at least 1 prior therapy. The focus has been placed on comparing BVd to relevant comparators and identifying gaps in the current evidence.
A summary of the clinical evidence included by the sponsor in the review of BVd is presented in 2 sections with critical appraisal of the evidence by CDA-AMC included at the end of each section. The first section, the systematic review, includes an RCT that was selected according to the sponsor’s systematic review protocol. The CDA-AMC assessment of the certainty of the evidence in this first section using the GRADE approach follows the critical appraisal of the evidence. The second section includes indirect evidence from the sponsor. No long-term extension studies or studies considered to address important gaps in the evidence were submitted by the sponsor.
Included Studies
Clinical evidence from the following is included in the review and appraised in this document:
1 RCT identified in the systematic review
1 ITC.
Systematic Review
Content in this section has been informed by materials submitted by the sponsor. The following has been summarized and validated by the review team.
Description of Studies
Characteristics of the included studies are summarized in Table 5.
Table 5: Details of Studies Included in the Systematic Review
Detail | DREAMM-7 trial |
|---|---|
Study design | Phase III, randomized, open-label, multicentre study |
Locations | This study was conducted at 142 centres in 20 countries, including Australia, Belgium, Brazil, Canada (5 sites), China, Czechia, France, Germany, Greece, Israel, Italy, Japan, the Netherlands, New Zealand, Poland, the Republic of Korea, Russia, Spain, the UK, and the US. |
Patient enrolment dates | Start date: May 21, 2020 Cut-off date for IA1: October 2, 2023 Cut-off date for IA2: October 7, 2024 End date: Study is ongoing |
Randomized (N) | Total: N = 494
|
Inclusion criteria |
|
Exclusion criteria |
|
Intervention |
|
Comparator(s) |
|
Screening phase | During the 28-day screening phase, patients were evaluated for study eligibility according to the inclusion and exclusion criteria outlined in the protocol. |
Treatment phase | Study treatments were administered in both groups until confirmed disease progression, unacceptable toxicity, death, withdrawal of consent, or study end, whichever occurred first. |
Follow-up phase | Patients who permanently discontinued study treatment for reasons other than disease progression remained in the study and were followed for PFS. In the case of disease progression, patients were followed to ascertain subsequent antimyeloma therapy, PFS2, and survival status every 12 weeks. |
Primary end point | PFS |
Secondary and exploratory end points | Key secondary:
Secondary:
Exploratory:
|
Publications | 1. ClinicalTrials.gov. Evaluation of Efficacy and Safety of Belantamab Mafodotin, Bortezomib and Dexamethasone Versus Daratumumab, Bortezomib and Dexamethasone in Patients With Relapsed/Refractory Multiple Myeloma (DREAMM 7). 2024; https://classic.clinicaltrials.gov/ct2/show/NCT04246047. Accessed 16 May 2024. 2. Hungria V, Robak P, Hus M, et al. Belantamab Mafodotin, Bortezomib, and Dexamethasone for Multiple Myeloma. N Engl J Med. 2024; 391(5):393-407. doi: 10.1056/NEJMoa2405090. Epub 2024 Jun 1. PMID: 38828933. |
AE = adverse event; anti-BCMA = anti–B-cell maturation antigen; anti-CD38 = anti–Cluster of Differentiation 38; ASCT = autologous stem cell transplant; AUC = area under the curve; BVd = belantamab mafodotin plus bortezomib and dexamethasone; CBR = clinical benefit rate; Cmax = peak concentration; CRR = complete response rate; DoR = duration of response; DVd = daratumumab plus bortezomib and dexamethasone; ECOG PS = Eastern Cooperative Oncology Group Performance Status; EORTC IL52 = European Organisation for Research and Treatment of Cancer Item Library 52; EORTC QLQ-C30 = European Organisation for Research and Treatment of Cancer Quality of Life Questionnaire Core 30; EORTC QLQ-MY20 = European Organisation for Research and Treatment of Cancer Quality of Life Questionnaire Multiple Myeloma 20; FACT-GP5 = Functional Assessment of Cancer Therapy–Item GP5; FLC = free light chain; HRQoL = health-related quality of life; IA1 = interim analysis 1; IA2 = interim analysis 2; IMWG = International Myeloma Working Group; MM = multiple myeloma; MRD = minimal residual disease; ORR = overall response rate; OS = overall survival; OSDI = Ocular Surface Disease Index; PFS = progression-free survival; PFS2 = progression-free survival-2; PGI-C = Patient Global Impression–Change; PGI-S = Patient Global Impression–Severity of Illness; PRO-CTCAE = Patient-Reported Outcomes version of the Common Terminology Criteria for Adverse Events; SAE = serious adverse event; TTBR = time to best response; TTP = time to progression; TTR = time to response; VGPR = very good partial response; vs. = versus.
aInduction therapy followed by ASCT and maintenance constitutes 1 line of therapy.
bPatients who have undergone syngeneic transplant were allowed, only if there was no history of graft-vs.-host disease.
Sources: Clinical Study Report for the DREAMM-7 study (2024).26 Details included in the table are from the sponsor’s Summary of Clinical Evidence.
The DREAMM-7 study26 is an ongoing, phase III, randomized, open-label, multicentre trial that aims to assess the efficacy and safety of belantamab administered intravenously at the dose of 2.5 mg/kg on day 1 of every 21-day cycle, in combination with bortezomib and dexamethasone (together known as BVd), compared with DVd in adult patients with MM. The trial enrolled patients who had received at least 1 prior line of MM therapy and had documented disease progression during or after their most recent treatment. Patients were enrolled in the trial across 142 centres in 20 countries, including 5 sites in Canada.
The DREAMM-7 study included a screening period, a treatment period, and a follow-up period (Figure 1). During the screening period, patients were evaluated for study eligibility according to the protocol. Following screening, patients were centrally randomized in a 1:1 ratio through an Interactive Response Technology system to receive either BVd (N = 243) or DVd (N = 251). Randomization was stratified by the number of prior lines of therapy (1 versus 2 or 3 versus more than 4), prior bortezomib use (yes versus no), and R-ISS (stage I versus stage II or stage III). No more than 50% of patients with 2 or more prior lines of therapy were enrolled, and crossover treatment was not permitted.
During the treatment period, safety and disease assessments were performed regularly for each treatment group. Treatment continued in both groups until disease progression, death, unacceptable toxicity, a decision at the investigator’s discretion, withdrawal of consent, or the end of the study, whichever occurred first. For patients who discontinued study treatment for reasons other than disease progression or death, disease evaluations for PFS were performed every 3 weeks until documented disease progression, death, the start of a new antimyeloma treatment, the withdrawal of consent, a loss to follow-up, or the end of the study, whichever occurred first. In the event of disease progression, patients were followed to ascertain the receipt of subsequent antimyeloma therapy, PFS-2, and survival status every 12 weeks until the withdrawal of consent, a loss to follow-up, death, or the end of the study. A patient was considered to have completed the study if they were followed until death or the end of the study. The end of treatment visit occurred within 30 days of the last cycle or before the initiation of new antimyeloma therapy, whichever occurred first.
The primary objective of the DREAMM-7 trial was to compare the efficacy of BVd to DVd based on PFS. The key secondary objective was to compare the efficacy of BVd to DVd based on OS, DoR, and the MRD negativity rate. The primary and secondary end points of the DREAMM-7 trial were analyzed using data from the cut-off date of October 2, 2023, and the database lock date of November 6, 2023, for IA1, and from the cut-off date of October 7, 2024, for IA2 or prespecified primary PFS analysis.
Figure 1: Study Design of the DREAMM-7 Trial
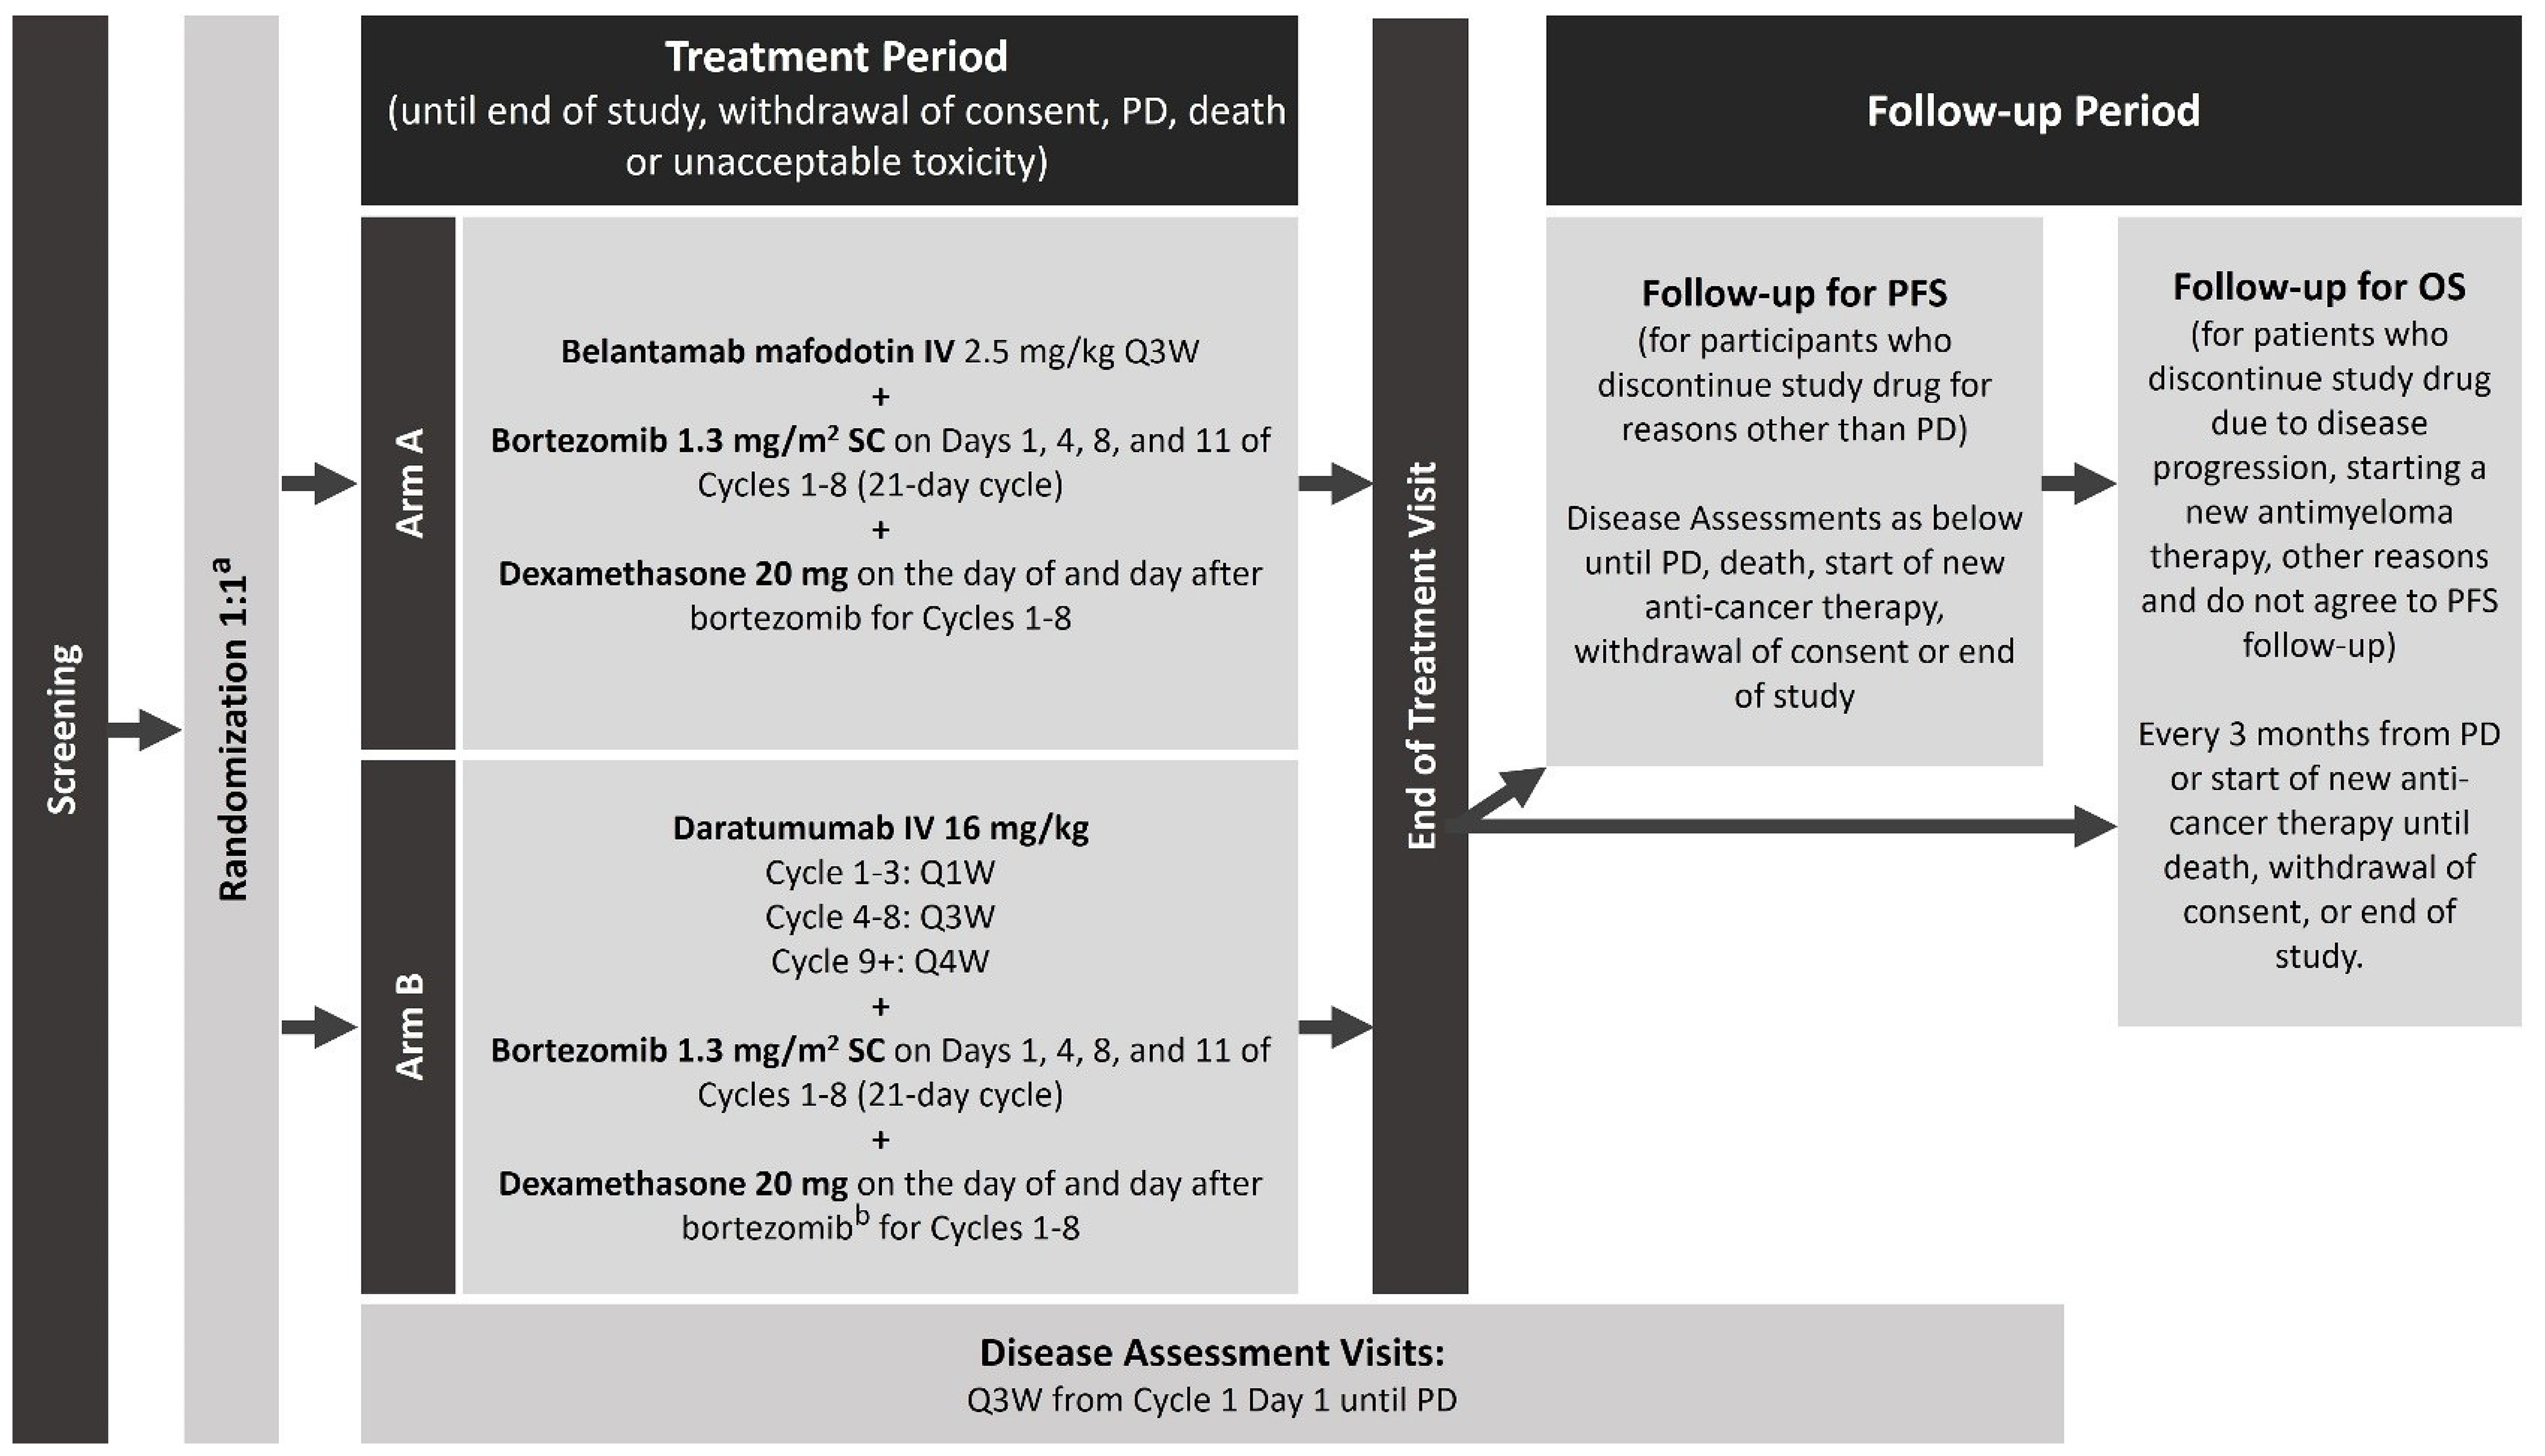
OS = overall survival; PD = progressive disease; PFS = progression-free survival; Q1W = every week; Q3W = every 3 weeks; Q4W = every 4 weeks; R-ISS = Revised International Staging System; SC = subcutaneous.
a Stratification: Prior lines of therapy (1 versus 2 or 3 versus ≥ 4), R-ISS stage I versus R-ISS stage II or stage III, and prior bortezomib use (yes versus no).
b Reduce starting dose of dexamethasone to 10 mg for patients aged older than 75 years, for those with a body mass index of less than 18.5 kg/m2, for those who had previous unacceptable side effects associated with glucocorticoid therapy, or for those who were unable to tolerate the starting dose.
Source: Clinical Study Report for the DREAMM-7 study (2024).26
Populations
Inclusion and Exclusion Criteria
Patients were eligible for enrolment in the DREAMM-7 trial if they were aged 18 years or older with a confirmed diagnosis of MM as defined by IMWG criteria.44 Patients were required to have an ECOG PS score of 0 to 2, have received at least 1 prior line of MM therapy with documented disease progression during or after their most recent therapy, and have at least 1 measurable disease parameter. Key exclusion criteria included intolerance to daratumumab and bortezomib, and refractoriness to either daratumumab or any anti-CD38 therapy or bortezomib (on a twice-weekly regimen). Patients were excluded from the trial if they had received prior treatment with an anti-BCMA therapy or a monoclonal antibody within 30 days of receiving the first dose of study drugs.
Interventions
Intervention Group (BVd)
Belantamab was administered intravenously at the dose of 2.5 mg/kg on day 1 of every 21-day cycle for the first 8 cycles and then continued as a single drug until confirmed disease progression, unacceptable toxicity, death, the withdrawal of consent, or study end, whichever occurred first (Figure 2). Belantamab was administered after dilution as an IV infusion over approximately 30 minutes. Prophylaxis to mitigate ocular events was instituted for all patients.
Bortezomib was administered subcutaneously at a dose of 1.3 mg/m2 on day 1, day 4, day 8, and day 11 of each 21-day cycle for a total of 8 cycles. The administration of bortezomib was scheduled approximately 1 hour following the completion of the belantamab infusion.
Dexamethasone 20 mg (either orally or intravenously) was administered on the day of and the day after bortezomib treatment. On days when bortezomib and dexamethasone administration coincided with the administration of belantamab, dexamethasone was administered orally or intravenously before the infusion of belantamab. The starting dose of dexamethasone was reduced to 10 mg for patients aged older than 75 years, for those with a body mass index of less than 18.5 kg/m2, for those who had previously experienced unacceptable side effects from glucocorticoid therapy, or for those unable to tolerate the standard starting dose.
Figure 2: Dosing Schedule for the Intervention Group (BVd) in the DREAMM-7 Trial
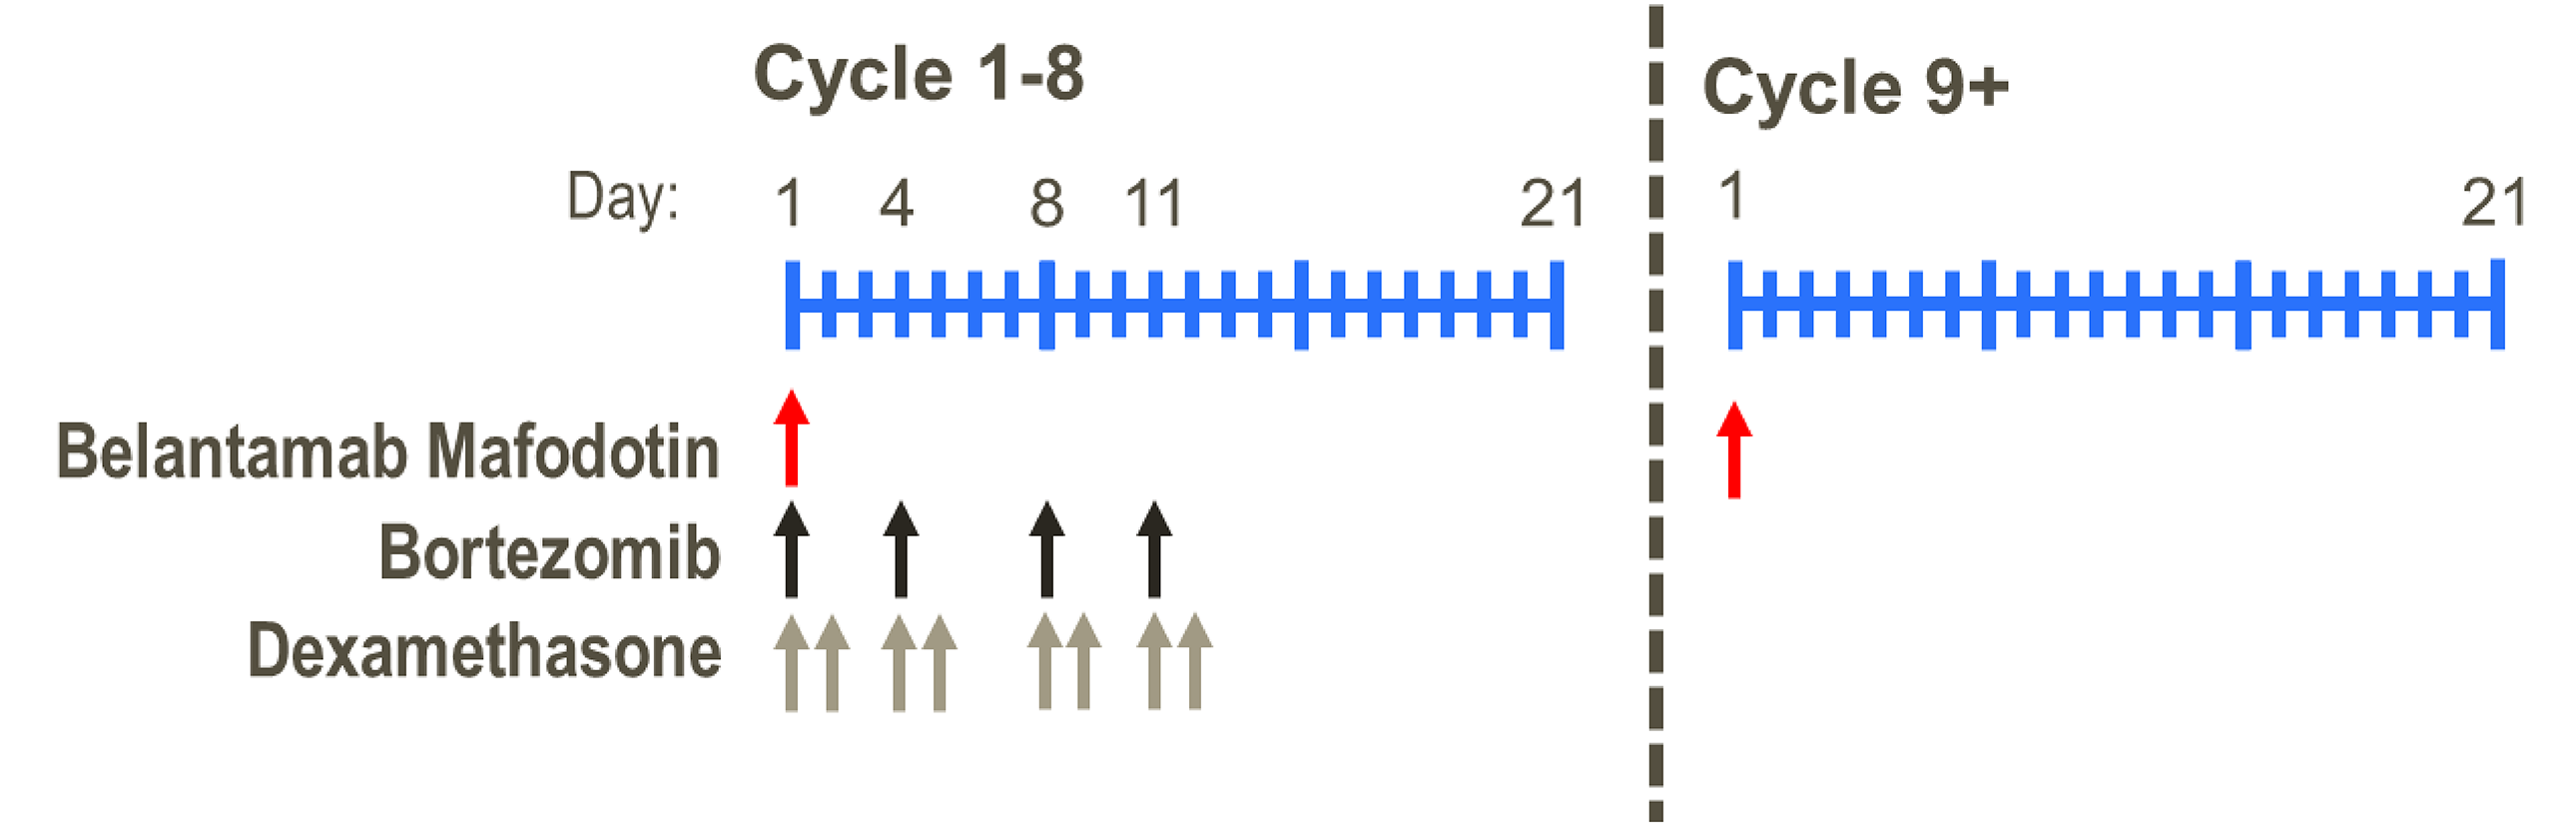
BVd = belantamab mafodotin in combination with bortezomib and dexamethasone.
Source: Clinical Study Report for the DREAMM-7 study (2024).26
Dose delays and reductions were permitted throughout the study.45 Patients were assessed by a qualified eye care specialist at screening, and then every 3 weeks before dosing up to the sixth dose of belantamab. A cooling eye mask was applied during the first few hours after belantamab administration to help reduce ocular side effects. Corticosteroid eye drops were not required but could be used if clinically indicated at the discretion of an eye care specialist. Preservative-free artificial tears were administered at least 4 times to 8 times daily in each eye beginning on cycle 1, day 1, until the end of treatment. In the event of ocular symptoms (e.g., dry eyes), the use of artificial tears could be increased up to every 2 hours, as needed.
Comparison Group (DVd)
Daratumumab was administered intravenously at a dose of 16 mg/kg according to the approved label schedule as follows: weekly for cycle 1 through cycle 3 (week 1 to week 9) in 21-day cycles for a total of 9 doses, on day 1 of cycle 4 through cycle 8 (week 10 to week 24) in 21-day cycles for total of 5 doses, and then every 4 weeks starting from cycle 9 (week 25) onward in 28-day cycles. For the first dose of daratumumab (administered only at week 1), the single infusion could be split over 2 days (Figure 3).
The dosing schedule for bortezomib and dexamethasone was identical to that of the intervention group. Belantamab and daratumumab were administered intravenously to patients at the site while bortezomib was administered subcutaneously to patients at the site.
Figure 3: Dosing Schedule for Comparator Group (DVd) in the DREAMM-7 Trial
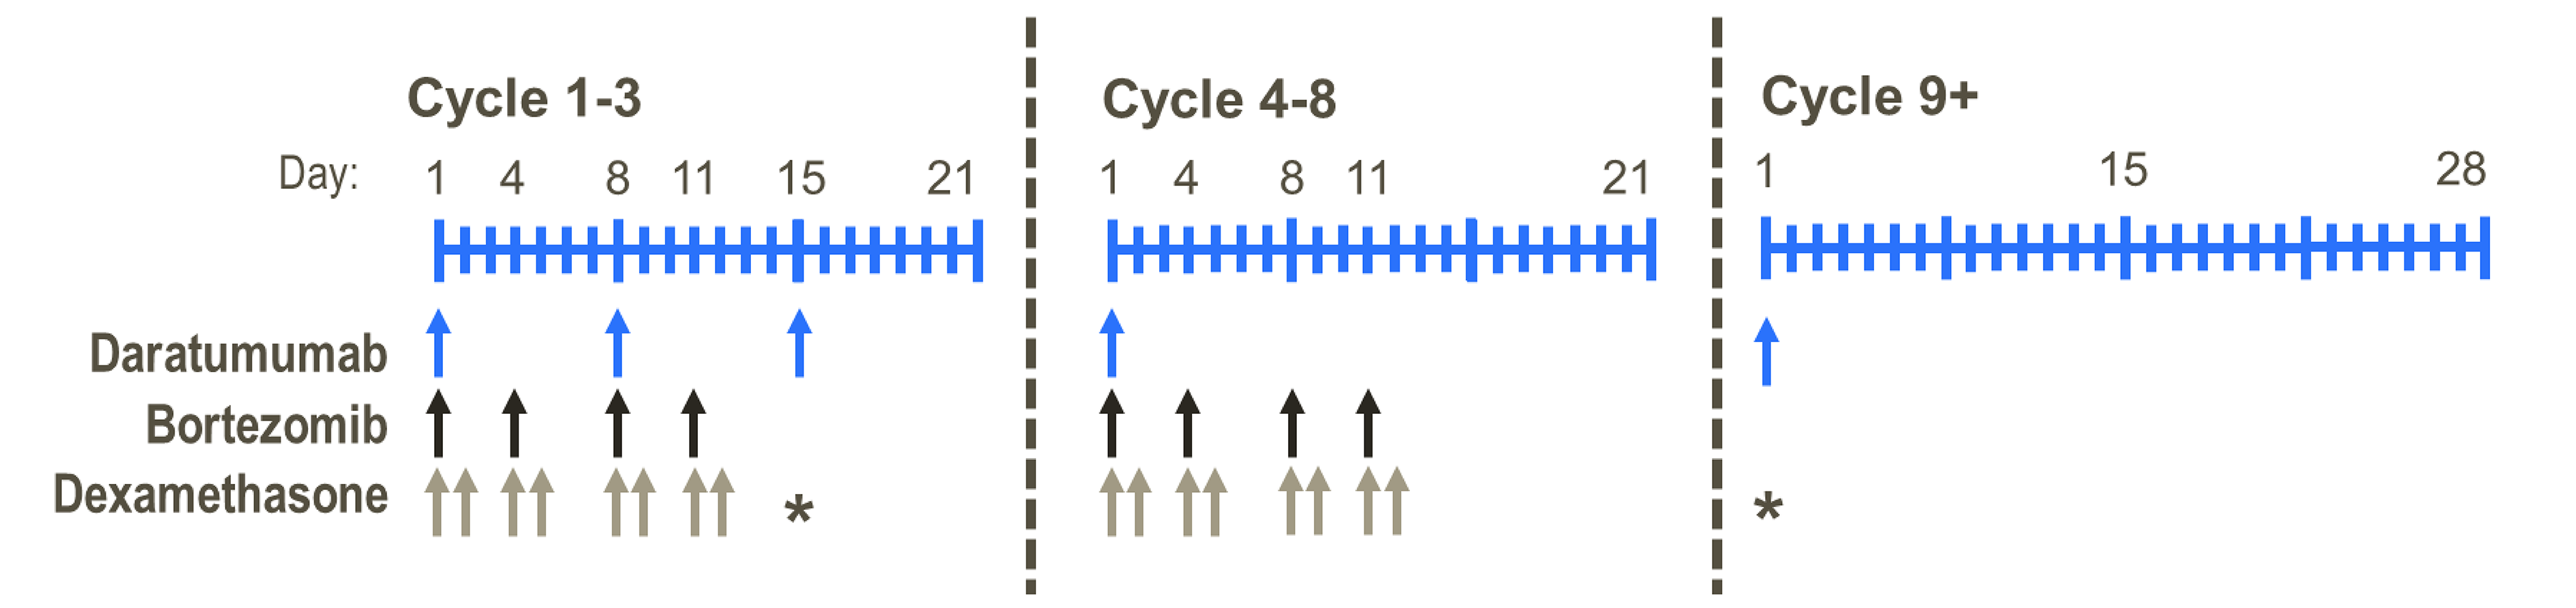
DVd = daratumumab plus bortezomib and dexamethasone.
Source: Clinical Study Report for the DREAMM-7 study (2024).26
Dose Modification, Delay, and Study Treatment Discontinuation
Dose modifications, delays, and reductions for belantamab were permitted throughout the DREAMM-7 trial as follows: the dose of belantamab could be reduced once from the starting dose (2.5 mg/kg intravenously every 21 days) to 1.9 mg/kg intravenously every 21 days (Table 6). Patients who were unable to tolerate a dose of 1.9 mg/kg were permanently discontinued from belantamab treatment due to unacceptable toxicity.
Table 6: Dose Modification of Belantamab Mafodotin for Ocular Adverse Reactions
Severitya | Recommended dose modification |
|---|---|
Mild (grade 1)
| Continue belantamab mafodotin at current dose per the judgment of the physician with close direct monitoring of the patient’s clinical status. |
Moderate (grade 2)
| Withhold belantamab until improvement in both corneal examination findings to mild severity and a change in BCVA to a decline of 1 line, or better. Resume treatment at a reduced dose level (1.9 mg/kg every 3 weeks). |
Severe (grade 3)
| Withhold belantamab until improvement in both corneal examination findings to mild severity and a change in BCVA to a decline of 1 line or better. Resume treatment at a reduced dose level (1.9 mg/kg every 3 weeks). |
A corneal epithelial defect or a change of BCVA 20/200 or worse (grade 4)
| Withhold belantamab until improvement in both corneal examination findings to mild severity and a change in BCVA to a decline of 1 line or better. Rechallenge may be considered per the judgment of the physician. For worsening symptoms that are unresponsive to appropriate management, consider the permanent discontinuation of belantamab. |
BCVA = best corrected visual acuity.
aNonocular adverse reactions were graded according to the National Cancer Institute’s Common Terminology Criteria for Adverse Events.
bA corneal defect may lead to corneal ulcers. These should be managed promptly and as clinically indicated by an eye care professional.
Sources: Product monograph for belantamab mafodotin.37 Details included in the table are from the sponsor’s Summary of Clinical Evidence.
No dose modifications for daratumumab were allowed in the DREAMM-7 trial. Bortezomib dose adjustments were based on the highest grade of toxicity attributed to bortezomib. Bortezomib therapy should be withheld upon the onset of any grade 3 nonhematological or grade 4 hematological toxicities, excluding neuropathy. Once the toxicity symptoms have resolved, bortezomib therapy could be reinitiated at a reduced dose (1.0 mg/m2 to 0.7 mg/m2). For patients with contraindications to the starting dose regimen of dexamethasone (20 mg or 10 mg) in combination with bortezomib, or who were intolerant to this regimen, the dose of dexamethasone could be reduced to 12 mg for patients aged 75 years or younger, or 10 mg for those aged older than 70 years with a body mass index less than or equal to 18.5 kg/m2. If the reduced dose was not tolerated, the dose of dexamethasone could be further reduced to 8 mg and 4 mg, respectively. If these doses are also not tolerated, dexamethasone should be discontinued.
The study drug must be permanently discontinued in the event of disease progression, unacceptable toxicity, the patient meeting any of the protocol-defined safety stopping criteria, or pregnancy. Patients who had permanently discontinued study treatment were not allowed to resume treatment. All patients who had permanently discontinued study treatment were to undergo safety assessments at the time of discontinuation, during the end of the treatment visit, and throughout the follow-up period.
Concomitant Medications
Concomitant therapy with bisphosphonates was allowed and recommended. Patients were to receive full supportive care during the study, including transfusions of blood products, growth factors, and treatment with antibiotics, antiemetics, antidiarrheals, and analgesics, as appropriate. The following concomitant medications were prohibited during the DREAMM-7 trial: live vaccines or live, attenuated vaccines, plasmapheresis, other antimyeloma therapy not specified in the protocol, inhibitors of P-glycoprotein, and organic anion transporting polypeptide. Additionally, for patients receiving bortezomib, the use of organic anion transporting polypeptide inhibitors, anti-HIV and anti–hepatitis C virus drugs, antibiotics, and antifungals was prohibited.
Outcomes
A list of efficacy end points assessed in this Clinical Review Report is provided in Table 7, followed by descriptions of the outcome measures. Summarized end points are based on outcomes included in the sponsor’s Summary of Clinical Evidence as well as any outcomes identified as important to this review, according to the clinical experts consulted for this review and input from patient and clinician groups and public drug plans. Using the same considerations, CDA-AMC selected the end points that were considered to be most relevant to inform expert committee deliberations and finalized this list of end points in consultation with members of the expert committee. The end points considered most important to the expert committee deliberations (OS, PFS, HRQoL, ocular events, and SAEs) were assessed using the GRADE tool. Other efficacy end points (ORR, CRR, DoR, and MRD negativity) are summarized in the report as supportive information.
Response evaluation was performed according to the IMWG Uniform Response Criteria for Multiple Myeloma46 (Table 8), as determined by a blinded IRC.
Table 7: Outcomes Summarized From the DREAMM-7 Trial Included in the Systematic Review
Outcome measure | Time point | DREAMM-7 study |
|---|---|---|
PFSa, b | 12 months and 36 months | Primaryc |
OSa, b | 12 months and 36 months | Key secondaryc |
DoRb | 12 months and 18 months | Key secondaryc |
MRD negativityb | As of the data cut-off date of October 2, 2023 (IA1), and October 7, 2024 (IA2) | Key secondaryc |
CRRa, b | As of the data cut-off date of October 2, 2023 (IA1) | Secondary |
ORRa, b | As of the data cut-off date of October 2, 2023 (IA1) | Secondary |
HRQoL measured by EORTC QLQ-C30 global health statusa, b | As of the data cut-off date of October 2, 2023 (IA1) | Secondary |
Ocular eventsa, b | As of the data cut-off date of October 7, 2024 (IA2) | Secondary |
Harms outcomesa, b | As of the data cut-off date of October 7, 2024 (IA2) | Secondary |
CR = complete response; CRR = complete response rate; DoR = duration of response; EORTC QLQ-C30 = European Organisation for Research and Treatment of Cancer Quality of Life Questionnaire Core 30; HRQoL = health-related quality of life; IA1 = interim analysis 1; IA2 = interim analysis 2; IMWG = International Myeloma Working Group; MR = minimal response; MRD = minimal residual disease; ORR = overall response rate; OS = overall survival; PD = progressive disease; PFS = progression-free survival; PR = partial response; sCR = stringent complete response; VGPR = very good partial response.
Note: All categories of disease response used in the calculation of study end points (sCR, CR, VGPR, MR, PR, stable disease, and PD) were determined by an independent review committee using IMWG 2016 criteria.
aAn outcome that is commonly used in clinical practice to assess patients.
bAn outcome that is considered important to patients according to patient group input and/or clinician input.
cStatistical testing for these end points was adjusted for multiple comparisons.
Sources: Clinical Study Report for the DREAMM-7 study (2024).26 Details included in the table are from the sponsor’s Summary of Clinical Evidence.
Table 8: IMWG Criteria for Response Assessment
Response category | IMWG criteria |
|---|---|
CR | Negative immunofixation on serum and urine, disappearance of any soft tissue plasmacytomas, and < 5% of plasma cells in bone marrow |
sCR | Complete response plus normal FLC ratio and an absence of clonal cells in bone marrow biopsy by immunohistochemistry |
VGPR | Serum and urine M protein detectable by immunofixation but not on electrophoresis, or 90% or greater reduction in serum M protein plus urine M protein level < 100 mg per 24 hours |
PR | At least a 50% reduction in serum M protein, a reduction in 24-hour urinary M protein by at least 90% or to < 200 mg per 24 hours If serum and urine M protein levels cannot be measured and the serum FLC assay is also not quantifiable, a reduction of at least 50% in the number of plasma cells is necessary, provided that the initial percentage of plasma cells in the bone marrow was 30% or higher. Moreover, if soft tissue plasmacytomas were noted initially, a reduction in their size by at least 50% is also required. |
MR | A 25% to 49% reduction of serum M protein and a reduction in 24-hour urine M protein by 50% to 89% |
SD | Not meeting criteria for CR, VGPR, PR, MR, or PD |
PD | An increase of 25% from the lowest confirmed response in serum M protein (absolute increase must be ≥ 0.5 g/dL) or urine M protein (absolute increase must be ≥ 200 mg per 24 hours) For patients without measurable serum and urine M protein levels, an increase of more than 10 mg/dL in the difference between involved and uninvolved FLC levels is required. If M protein and FLC levels are unmeasurable, a minimum 10% increase in bone marrow plasma cell percentage is needed. Additionally, criteria include new lesions or a rise of more than 50% from the lowest SPD of existing lesions larger than 1 cm, or a 50% increase in circulating plasma cells (a minimum of 200 cells/μL) if it is the only disease measure. |
CR = complete response; FLC = free light chain; IMWG = International Myeloma Working Group; MR = minimal response; PD = progressive disease; PR = partial response; sCR = stringent complete response; SD = stable disease; SPD = sum of the products of diameters; VGPR = very good partial response.
Sources: Kumar et al. (2016).47 Details included in the table are from the sponsor’s Summary of Clinical Evidence.
Progression-Free Survival
The primary outcome for the DREAMM-7 trial was PFS, which was defined as the time from the date of randomization until the earliest date of documented disease progression determined by an IRC, according to IMWG criteria,25 or death due to any cause. Results of PFS are available for both IA1 and IA2. Disease assessments were conducted every 3 weeks after treatment discontinuation for reasons other than disease progression.
In the DREAMM-7 trial, the reasons for censoring for PFS included no disease progression or being alive at the data cut-off date for the first or second interim analyses (IA1 or IA2), the absence of an adequate baseline or postbaseline assessment, no disease progression or being alive with an adequate postbaseline assessment, the initiation of new antimyeloma treatment before documented disease progression with or without an adequate postbaseline assessment, and death or disease progression after missing 2 or more scheduled assessments.
Overall Survival
OS was a key secondary end point in the DREAMM-7 study and was defined as the time from the date of randomization until the date of death due to any cause. Patients who were alive at the data cut-off date were censored at the date of last contact. Assessments for survival were conducted every 3 weeks after treatment discontinuation for reasons other than disease progression, and every 12 weeks after disease progression. The results of OS are available for both IA1 and IA2.
Duration of Response
DoR was a key secondary end point in the DREAMM-7 trial and was defined as the time from the first documented evidence of PR or better until PD or death due to any cause, based on an IRC assessment per IMWG criteria. In the DREAMM-7 trial, responders without disease progression were censored at the censoring time point for time to progression. The reasons for censoring for DoR included being alive with or without an adequate baseline assessment, being alive and having no disease progression with postbaseline assessment, the absence of postbaseline assessment before the initiation of new antimyeloma treatment, the initiation of new antimyeloma treatment before documented disease progression with an adequate postbaseline assessment, and disease progression with or without death after missing 2 or more scheduled assessments.
MRD Negativity
MRD was a key secondary end point in the DREAMM-7 trial and was defined as the percentage of patients who achieved MRD-negative status (as assessed by next-generation sequencing at a 10-5 threshold) at least once during the time of confirmed CR or better response (i.e., CR or sCR), based on an IRC assessment per IMWG criteria. The US FDA considers MRD a biomarker that is a reliable quantification of tumour burden, independent of the assay used.19 In MM, the FDA recommends that MRD should be assessed only in patients who are in CR, which aligns with the criteria used in the DREAMM-7 trial. After the initial MRD sample collection during the screening period, subsequent MRD testing was to be conducted when a patient first achieved a confirmed response of very good partial response (VGPR), and then every 6 months from the time of the last sample collection until disease progression or suspected CR.
Complete Response Rate
CRR was a secondary end point in the DREAMM-7 trial and was defined as the percentage of patients with a confirmed CR or better response (i.e., CR or sCR), based on an IRC assessment per IMWG criteria. While both CR and sCR require the absence of detectable M protein in serum and urine, as well as fewer than 5% of plasma cells in the bone marrow, sCR also requires a normal FLC ratio and the absence of clonal cells detectable by immunohistochemistry, indicating a deeper level of response.
Overall Response Rate
ORR was a secondary end point in the DREAMM-7 trial and was defined as the percentage of patients with a confirmed PR or better (i.e., VGPR, CR, or sCR), based on an IRC assessment per IMWG criteria. ORR is a direct measure of antitumour activity and is a well-established end point in oncology clinical trials,48,49 having been used as a secondary end point in pivotal clinical trials of other approved systemic therapies in RRMM.50-52
HRQoL
HRQoL was a secondary end point in the DREAMM-7 trial and was measured by the change in baseline in the EORTC QLQ-C30 score.
The EORTC QLQ-C30 module is a 30-item questionnaire containing both single- and multi-item measures to assess HRQoL in patients living with cancer. These 30 items can be categorized into the following: 1 GHS or QoL scale, 5 functional scales, 3 symptom scales, and 6 single-item scales. Each scale is scored from 0 to 100, with a higher score representing more of the concept (e.g., more functioning, more symptoms). Each of the multi-item scales includes a different set of items. No item occurs in more than 1 scale. Here is a breakdown of the scales:
1 GHS or QoL scale (2 items)
5 functional scales — physical functioning (5 items), role functioning (2 items), emotional functioning (4 items), cognitive functioning (2 items), and social functioning (2 items)
3 symptom scales — fatigue (3 items), nausea and vomiting (2 items), and pain (2 items)
6 single-item scales relating to dyspnea, insomnia, appetite loss, constipation, diarrhea, and financial difficulties.
The validity, reliability, and minimal important difference of the EORTC QLQ-C30 are summarized in Table 9.
Harms Outcomes
Safety and tolerability were assessed at each visit based on the incidence of AEs, SAEs, deaths, AEs leading to discontinuation, AEs leading to dose reduction or interruption, and AEs of special interest. AEs were coded using the standard Medical Dictionary for Regulatory Activities and graded by the investigator according to the National Cancer Institute’s Common Terminology Criteria for Adverse Events version 5 (CTCAE v5.0), or the KVA scale, as appropriate.53 All SAEs were collected from the initiation of the study intervention until at least 70 days after the discontinuation of all study interventions. Any SAEs considered related to study participation (e.g., study intervention, change in existing therapy) were recorded from the time the patient consented to participate in the study through any follow-up period.
The AEs of special interest for belantamab included ocular events, corneal events, thrombocytopenia, and infusion-related reactions. Corneal events associated with belantamab were graded using the KVA scale while other treatment-related ocular AEs were assessed according to the CTCAE v5.0 criteria for eye disorders. The severity of all other AEs of special interest was graded using CTCAE v5.0.53
Table 9: Summary of Outcome Measures and Their Measurement Properties
Outcome measure | Type | Conclusion about measurement properties | MID |
|---|---|---|---|
EORTC QLQ-C30 | A cancer-specific, patient-reported standardized questionnaire that is commonly used in oncology clinical trials to evaluate HRQoL. The core questionnaire consists of 30 questions that are scored to create 5 multi-item functional scales (physical, role, emotional, cognitive, and social), 3 multi-item symptom scales (fatigue, nausea and vomiting, and pain), 6 single-item symptom scales (dyspnea, insomnia, appetite loss, constipation, diarrhea, and financial difficulties), and a global health status QoL scale.54,55 Most items have 4 response options (“not at all,” “a little,” “quite a bit,” and “very much”), with scores on these items ranging from 1 to 4, respectively. For the global health status and QoL scale, a 7-point Likert-type scale is used, with anchors between 1 (very poor) and 7 (excellent).55 Thus, a decline in score on the symptom scale would reflect an improvement, whereas an increase in score on the function and QoL scales would reflect an improvement.55 | Osborne et al.56 conducted a systematic literature review of validated HRQoL tools in MM. For EORTC QLQ-C30, the sample included patients with newly diagnosed MM, relapsed MM, mixed disease stages of MM, and treatment experiences, and patients treated with HSCT.56 Validity: For construct validity, the subscales for pain, fatigue, physical, and global QoL were considered able to discriminate between patients (mixed disease stages and treatment experiences, including 69 [29%] patients with relapsed MM or disease progression) who improved vs. patients who were stable or had deteriorated (N = 239).57 All subscales, with the exception of the single-item diarrhea scale, were considered able to discriminate between patients with newly diagnosed MM according to their performance and response status (N = 484).58 Reliability: For internal consistency, the Cronbach alpha ranged from 0.54 to 0.89 for all subscales in patients with newly diagnosed MM, patients with mixed disease stages and treatments, and patients treated with HSCT.58-61 Responsiveness: Responsiveness of the subscales to change over time varied depending on the sample population studied (listed earlier).56 To assess responsiveness, Kvam et al.62 used the global rating of change to identify whether patients with mixed disease stages and treatments changed over time. Of note, 69 (29%) patients had relapsed or had progressive disease.a, 62 For the global QoL scale, the SRMb in patients who reported improvement and deterioration over a period of 3 months was 0.32 and 0.57, respectively (N = 239). In patients rating themselves as unchanged, the SRM was negligible.62 | From the systemic review of validated HRQoL tools in MM conducted by Osborne et al.,56 the following estimated MIDs were reported for patients with mixed disease stages and treatments: |
EORTC QLQ-C30 = European Organisation for Research and Treatment of Cancer Quality of Life Questionnaire Core 30; HRQoL = health-related quality of life; HSCT = hematopoietic stem cell transplant; MID = minimal important difference; MM = multiple myeloma; QoL = quality of life; SRM = standardized response mean; vs. = versus.
aThe EBMT criteria for response were used to determine the patients’ disease phase.
bTo assess the magnitude of the difference in scores between patients who improved, deteriorated, and remained stable, SRMs were calculated and compared against the Cohen rule of thumb for interpreting the magnitude of mean differences in HRQoL scores, with 0.20 representing a small change, 0.50 a moderate change, and more than 0.80 a large change.
cThe MIDs were estimated using an anchor-based approach; they were anchored to a structured QoL interview (response options were improved, deteriorated, or unchanged).
Statistical Analysis
A summary of the statistical analyses performed for all efficacy end points is presented in Table 10.
Sample Size and Power Calculation
The sample size was driven by the analysis of the primary end point, PFS. Based on data from the CASTOR study,64 it was estimated that approximately 259 events (disease progression or death) were needed to ensure 90% power to detect a significant difference between the BVd group and the DVd group in PFS, at a 1-sided significance level of 2.5%. It was estimated that the targeted 259 PFS events would be observed approximately 33 months from the time when the first patient was randomized under the alternative hypothesis, assuming an annual dropout rate of 5%.
The DREAMM-7 study was designed to include 3 interim analyses followed by a final analysis. The first interim analysis (IA1) was planned at the time when approximately 250 of the 280 targeted PFS events (an approximately 89% information fraction) had been observed. If PFS demonstrated statistical significance at IA1, the rationale for IA2 would be driven by the requirements for OS (PFS would not be retested). The timing of subsequent analyses would be determined based on the OS information fraction.
Using available data from the CASTOR study, the median OS in the DVd group was expected to be around 49 months. With 478 patients, the power to test the null hypothesis for OS (HR = 1 versus the specific alternative hypothesis HR = 0.85) was approximately 16%. It was estimated that approximately 137 deaths would be observed at the time of the primary PFS analysis. To ensure 80% power to test the null hypothesis for OS, a total of 355 deaths needed to be observed. The information fraction may shift dependent on the actual timing of analyses and the observed OS events at that time and the boundaries may be adjusted accordingly.
Table 10: Statistical Analysis of Efficacy End Points in the DREAMM-7 Trial
End point | Statistical model | Adjustment factors | Handling of missing data | Sensitivity analyses |
|---|---|---|---|---|
PFS | Cox proportional hazards model, log-rank test, KM estimates |
|
|
|
OS | Cox proportional hazards model, log-rank test, KM estimates |
|
|
|
DoR | Nonparametric approach |
|
|
|
MRD negativity | Descriptive statistics, CMH test |
|
|
|
ORR | Descriptive statistics |
|
|
|
CRR | Descriptive statistics |
|
|
|
EORTC QLQ-C30 | Restricted maximum likelihood-based MMRM, descriptive statistics |
|
| None |
CMH = Cochran-Mantel-Haenszel; CRR = complete response rate; DoR = duration of response; EORTC QLQ-C30 = European Organisation for Research and Treatment of Cancer Quality of Life Questionnaire Core 30; KM = Kaplan-Meier; mITT = modified intention to treat; MMRM = mixed model of repeated measures; MRD = minimal residual disease; ORR = overall response rate; OS = overall survival; PFS = progression-free survival; RMDoR = restricted mean duration of response; VGPR = very good partial response.
Sources: Clinical Study Report for the DREAMM-7 study (2024).26 Details included in the table are from the sponsor’s Summary of Clinical Evidence.
Multiple Comparisons and Multiplicity
At the time of IA1, using the October 2, 2023, data cut-off, the familywise type I error rate for testing multiple end points was strongly controlled with a step-down or hierarchical testing procedure. The hierarchical multiple-testing strategy is presented in Figure 4.
The evaluation of the primary and key secondary end points was structured in terms of 2 families of hypotheses as follows.26,65 The first family was based on the primary end point of PFS at IA1 and IA2. IA1 was performed with a multiplicity-adjusted boundary for a significance of P of less than 0.018. The Lan-DeMets approach,66 which approximates the O’Brien-Fleming spending, was used to maintain an overall 1-sided, 2.5% type I error when testing PFS across IA1 and the primary PFS analysis or IA2.26,65
The second family was based on the 3 key secondary end points: OS, DoR (assessed using RMDoR), and MRD negativity. OS was planned to be evaluated through 4 planned analyses: IA1, the primary PFS analysis or IA2, a third interim analysis (interim analysis 3 or IA3), and the final OS analysis. IA3 is planned to occur after approximately 266 OS events (an approximately 75% OS information fraction), and the final OS analysis will be conducted after approximately 355 OS events (a 100% OS information fraction). Given that the testing of the first family was successful (P ≤ 0.018 for PFS), the full significance level (alpha = 0.025) was propagated to the second family of hypotheses. For the second family, a weighted Bonferroni procedure was applied across OS and DoR, where alpha was split between the end points, with a larger proportion initially assigned to OS. At the time of IA1, for the second family, DoR (assessed using RMDoR) was significant (P value ≤ 0.005) but OS was not significant (P value > 0.00037); therefore, OS was analyzed descriptively. Additionally, MRD negativity testing was contingent upon the successful rejection of the null hypothesis for OS, in accordance with a hierarchical testing procedure. However, given that OS was not successful, MRD negativity was analyzed descriptively.
The analysis of key secondary end points DoR and MRD negativity was based on data available at the time of IA1 in accordance with the prespecified statistical analysis plan. At the time of IA2, PFS was analyzed descriptively without formal testing, based on the data available at the data cut-off. Regardless of the timing of PFS statistical significance, formal testing of DoR and MRD negativity should be based on data at the time of IA1. At the time of IA2, the key secondary end points DoR and MRD negativity were analyzed descriptively, without formal testing.
Figure 4: Multiple-Testing Strategy in the DREAMM-7 Trial
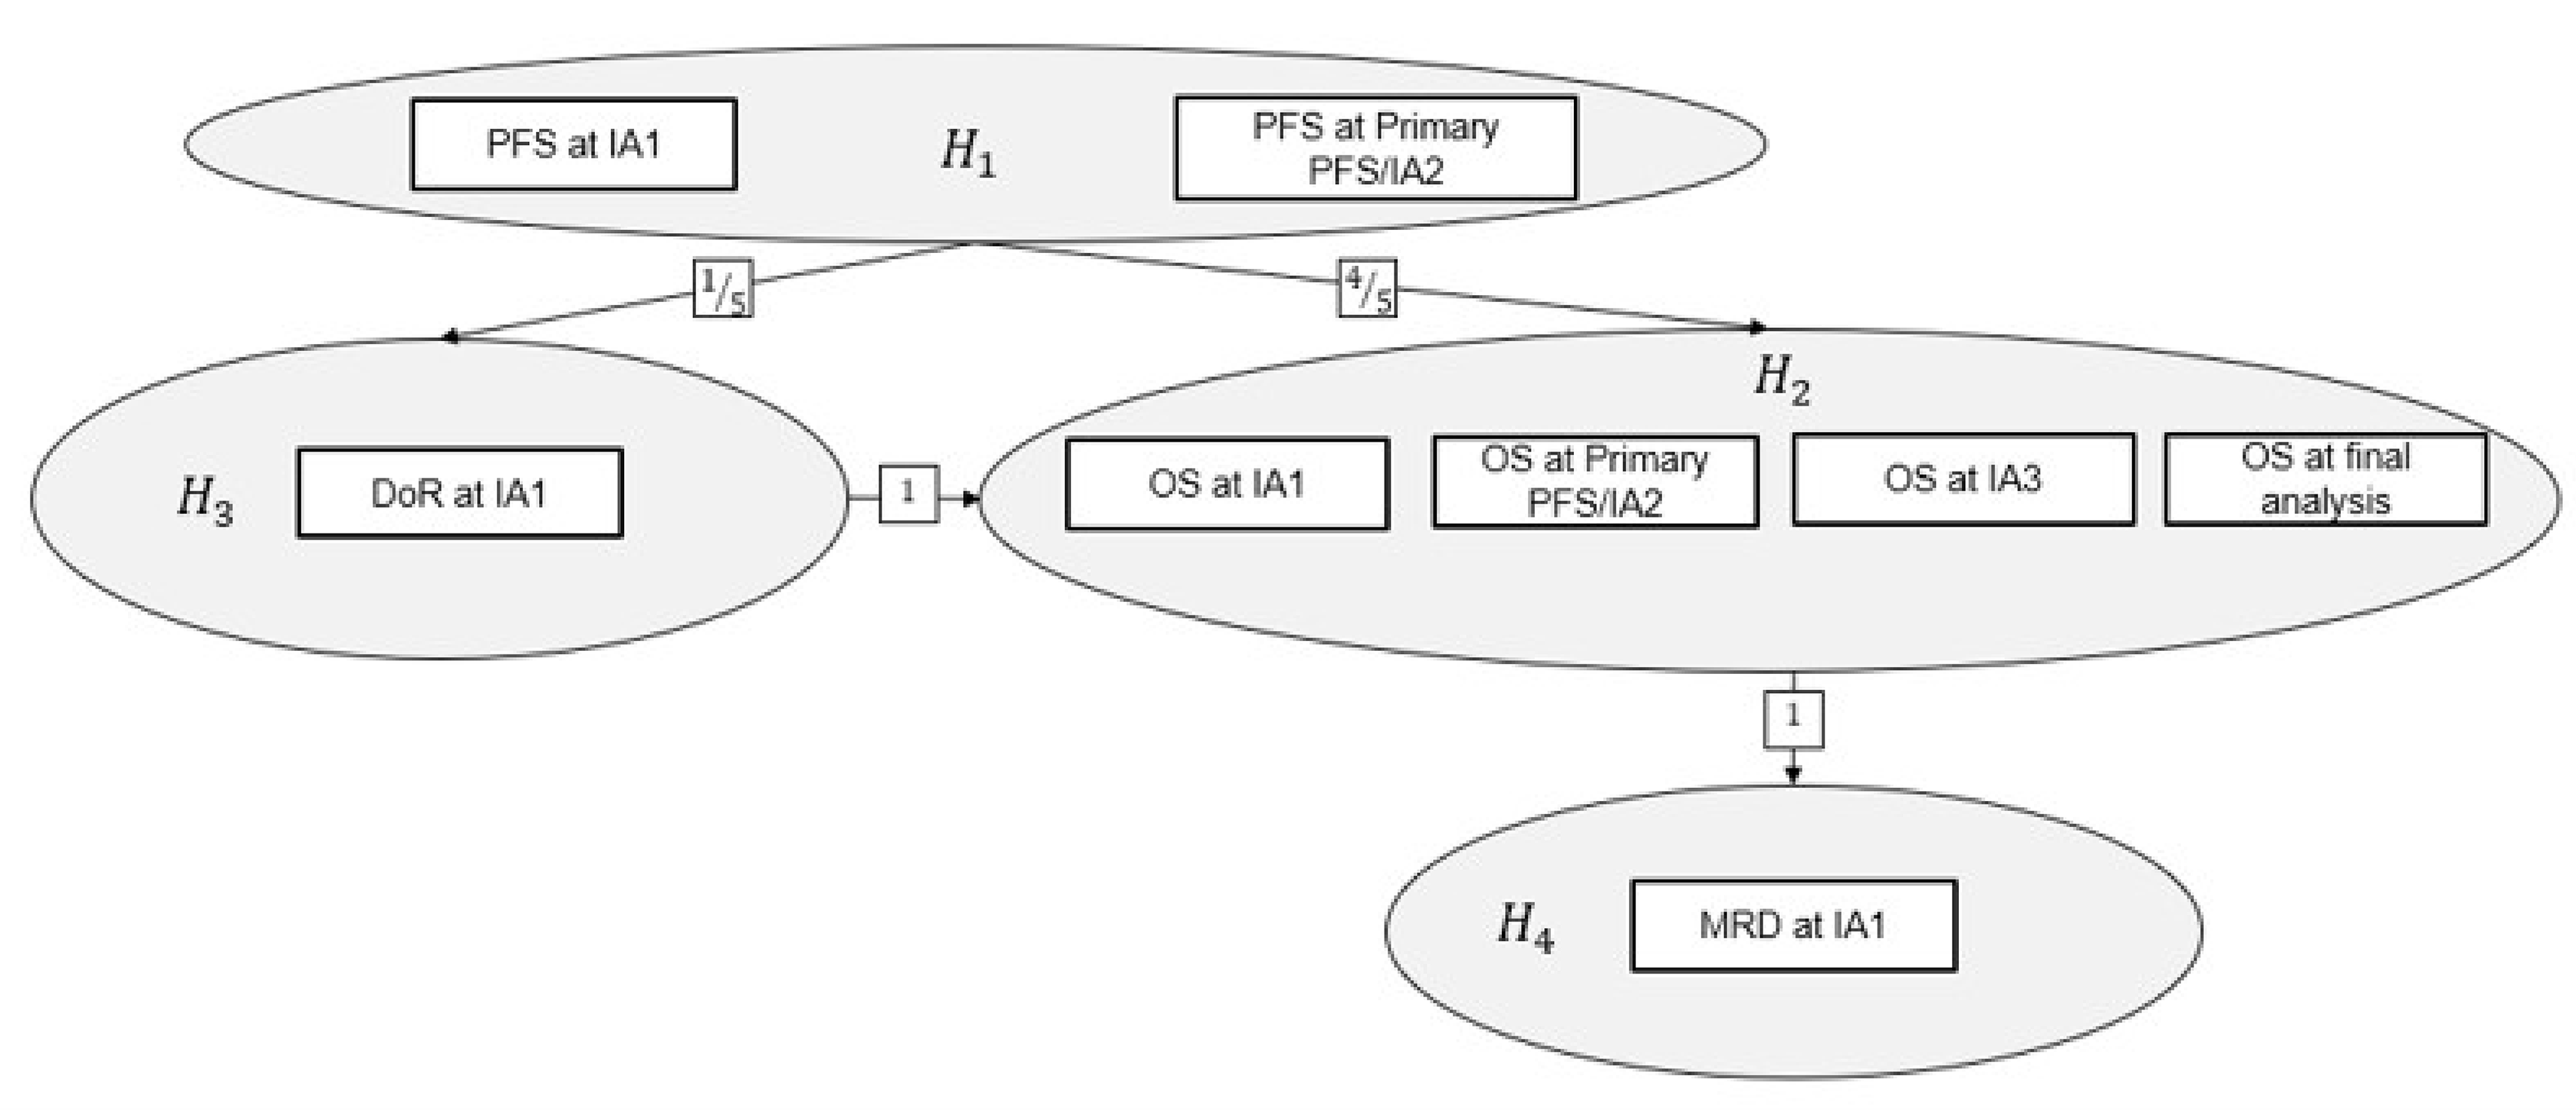
DoR = duration of response; H1 = hypothesis 1; H2 = hypothesis 2; H3 = hypothesis 3; H4 = hypothesis 4; IA1 = interim analysis 1; IA2 = interim analysis 2; IA3 = interim analysis 3; MRD = minimal residual disease; OS = overall survival; PFS = progression-free survival.
Note: Hi denotes the 1-sided null hypothesis for the primary and key secondary end points, where i equals 1,2,3,4 denotes the index indicating PFS, OS, DoR, and MRD negativity rate, respectively. Upon the successful rejection of the hypothesis and regardless of the timing of the rejection, the full alpha allocated to testing the hypothesis can be propagated. Arrows indicate the direction and proportion of alpha reallocation. H1 was to be tested at the 1-sided 2.5% significance level. All other hypotheses had an initial alpha of 0% assigned. The number of rectangular boxes indicates the number of planned analyses with alpha allocation for a given hypothesis, with text indicating the corresponding end point and time point of data extraction to be tested. Alpha was to be adjusted to account for multiple testing of an end point across time points using the Lan-DeMets approach that approximates the O'Brien-Fleming spending function. The efficacy boundaries were to be adjusted based on the observed number of events at the time of analysis.
Sources: Clinical Study Report for the DREAMM-7 study (2024).26 Details included in the table are from the sponsor’s Summary of Clinical Evidence.
Statistical Analysis
PFS and OS
The analysis of time-to-event outcomes PFS and OS was conducted using the ITT population. A stratified Cox proportional hazards model with the Efron method of tie handling and treatment group as the sole explanatory variable was used to assess the magnitude of the treatment difference (HR) in PFS and OS between the treatment groups. The treatment difference was compared using the log-rank test at a 1-sided alpha level of 0.025, stratified by randomization factors. The nonparametric KM method was employed to estimate survival curves for PFS, with KM curves presented by treatment group. The PFS rate at 6 months, 12 months, 18 months, and 24 months with a corresponding 95% CI was also estimated from the KM analysis, using the Brookmeyer-Crowley method.67 The type of events (progressions and deaths) and censoring reasons were summarized.
The proportional hazards assumption was assessed using the following methods: a KM plot by treatment group, a plot of log(time) against log(-log[survival]) by treatment group, a plot of Schoenfeld residuals for treatment, and an evaluation of time dependency of treatment effect by adding an interaction term of treatment and time in the Cox model.
The following sensitivity analyses for PFS were performed at the time of the primary analysis (IA1):
the non–proportional hazards effect on PFS, using —
the restricted mean survival time (RMST) method68 to account for the possible non–proportional hazards effect
RMST as the expected survival time restricted to a specific time horizon common punctuation time (t*)
the cut-off t* for determining the RMST was the smallest value among the largest observed times across study interventions
the PFS primary estimand based on investigator-assessed response, including only the primary estimand of PFS (i.e., the handling of intercurrent events premised on primary events and censoring rules) based on the investigator-assessed response
the PFS primary estimand based on stratification data from the clinical database; premised on the presence of mis-stratification for stratification factors used for randomization, a supplementary analysis was performed using the stratification data based on the clinical database
the PFS primary estimand based on a modified ITT analysis set using an IRC-assessed response
the PFS primary estimand considering local efficacy laboratories.
The following additional analyses of supplementary PFS estimands were conducted:
a primary analysis of supplementary estimand 1 (an IRC-assessed response and alternative censoring rules 1 [when progression was documented between scheduled visits, the event date was considered as the minimum date of the next scheduled visit or the date of death])
a primary analysis of supplementary estimand 2 (an IRC-assessed response and alternative censoring rules 2 [the date of starting new antimyeloma therapy was considered as an event])
a primary analysis of supplementary estimand 3 (an IRC-assessed response and alternative censoring rules 3 [when death or progression occurred after an extended loss to follow-up, this was considered as an event at the date of death or progression])
a primary analysis of supplementary estimand 4 (an IRC-assessed response and alternative censoring rules 4 [treatment discontinuation due to clinical progression before progressive disease or death was considered as an event at the date of treatment discontinuation])
a primary analysis of the COVID-19 supplementary estimand (an IRC-assessed response and COVID-19 censoring rules).
The following sensitivity analyses for OS were performed:
the non–proportional hazards effect on OS — the RMST method was conducted to account for the possible non–proportional hazards effect
adjusting for the poststudy therapy on OS to obtain a less biased estimate of treatment effect, an inverse probability of censoring weighting method was performed for OS to adjust for poststudy therapy.69
Subgroup Analyses of PFS
Subgroup analyses were performed using the same methods as for the primary PFS analysis but only including patients within the relevant subgroup category. The following subgroup analyses were performed to compare the primary estimand of PFS between treatment groups, identified as important by clinical experts consulted by CDA-AMC (Table 11).
Table 11: Subgroup Analyses for the DREAMM-7 Trial
Subgroup | Category |
|---|---|
Prior lines of therapy | 1 vs. 2 or 3 vs. 4, and 1 vs. > 1 |
Prior bortezomib use | Yes or no |
R-ISS stage | Stage I vs. stage II or stage III |
1 prior line of therapy with relapse | Relapse at < 18 months vs. ≥ 18 months |
Cytogenetic risk | High risk vs. other |
R-ISS = Revised International Staging System; vs. = versus.
Sources: Clinical Study Report for the DREAMM-7 study (2024).26 Details included in the table are from the sponsor’s Summary of Clinical Evidence.
Duration of Response
For the primary analysis of DoR, all patients were included in the analysis, regardless of response status, to allow for a valid statistical comparison between the 2 groups. The response was based on an IRC assessment per IMWG criteria.25 The DoR was analyzed based on the RMDoR, which is the difference between the KM curves of PFS and response or PFS for a treatment group, using a nonparametric approach.70 Using this approach, nonresponders had an observed DoR of 0. The approach accounts for time to response (TTR), ORR, and DoR where the summary measure is the time from response to progression or death.26 The comparison of RMDoR between the 2 treatment groups was based on a 1-sided z test at the overall significance level of 2.5%. The RMDoR and the corresponding 95% CI were calculated for each group.25
The following sensitivity analyses for DoR were performed at the time of the primary analysis:
DoR based on RMDoR analysis, using an investigator-assessed response
DoR based on conventional DoR analysis in responders, using an IRC-assessed response, but among patients who achieved a response (confirmed PR or better).
As an exploratory analysis, a conventional DoR analysis was performed, where responders without disease progression were censored at the censoring time point for TTP; however, death due to causes other than disease progression was handled in the same way as death due to disease progression. The distribution of DoR was summarized using the KM method by treatment group. The median and corresponding 95% CIs were estimated using the Brookmeyer-Crowley method.
MRD Negativity
The number and proportion of patients who were MRD-negative at the primary PFS analysis were summarized by treatment groups. The corresponding exact 95% CI for the MRD negativity rate and associated P value were provided. The P value was obtained using the Cochran-Mantel-Haenszel test, stratified by 2 randomization factors (the number of prior lines of therapy, and prior bortezomib use) at a 1-sided significance level of 0.025. A supportive P value was calculated as well from the Fisher exact test.
The following sensitivity analyses for MRD negativity were performed at the time of the primary analysis:
MRD based on the modified ITT analysis set using investigator-assessed responses
MRD based on participants with VGPR or better, using both IRC and investigator-assessed responses
MRD based on stratification data from the clinical database
based on the presence of mis-stratification for stratification factors used for randomization, a supplementary analysis was performed using the stratification data based on the clinical database.
CRR and ORR
The number and percentage of patients for each of the following categories were summarized by treatment group: sCR, CR, VGPR, PR, ORR, minimal response, stable disease, and disease progression. Patients with unknown or missing responses were considered nonresponders. The earliest date of the 2 consecutive assessments was used as the date of the confirmed response.
European Organisation for Research and Treatment of Cancer Quality of Life Questionnaire Core 30
Descriptive summaries (mean, SD, median, minimum, and maximum) of both the actual value and change from baseline at selected time points were provided for EORTC QLQ-C30 domain and symptom scores, including GHS or QoL. Time points included, but were not limited to, worst case postbaseline, end of treatment, and last follow-up visit. Longitudinal changes from baseline by treatment group for selected EORTC QLQ-C30 domain and symptom scores (fatigue, physical functioning, role functioning, and GHS or QoL) were analyzed using a restricted maximum likelihood-based mixed model of repeated measures. This model compared between-treatment difference while adjusting for correlations across multiple time points within each patient, controlling for the baseline variables. The mixed model of repeated measures included patient, treatment (as a random effect), analysis visit, and treatment-by-visit interaction (as a fixed effect) as explanatory variables, with the baseline value as a covariate along with the baseline-by-visit interaction. For scales requiring a single-item measure, if the item was missing, the score was considered missing. For scales requiring multiple items, if at least half of the items from the scale were available, the score was calculated based on the available items; if more than half of the items from the scale were missing, the score was set to missing.
Analysis Populations
The analysis populations of the DREAMM-7 trial are provided in Table 12. The efficacy outcomes, including HRQoL, were analyzed based on the ITT population. The safety outcomes were analyzed using the safety analysis set, defined as patients who received at least 1 dose of study treatment.
Table 12: Analysis Populations of the DREAMM-7 Trial
Population | Definition | Application |
|---|---|---|
All-screened | This population consisted of all patients who signed the ICF to participate in the clinical trial. | Data from these patients were used for the screen failure summary. |
Enrolled | This population consisted of all patients who entered the study (e.g., patients who were identified on the screen failure form as having not advanced past screening). | Study population and participants characteristics |
Safety | This population comprised all randomized patients who took at least 1 dose of the study treatment. Patients were analyzed based on the actual treatment received. | Safety outcomes |
ITT | This population comprised all patients who were randomized, regardless of whether they received the assigned treatment. Any patient who was assigned a treatment randomization number was considered to have been randomized. | Efficacy outcomes |
mITT | This population included patients meeting the following criteria:
| Sensitivity analyses of primary and key secondary end points |
ICF = informed consent form; ITT = intention to treat; mITT = modified intention to treat.
Sources: Clinical Study Report for the DREAMM-7 study (2024).26 Details included in the table are from the sponsor’s Summary of Clinical Evidence.
Results
Patient Disposition
Patient disposition for the DREAMM-7 trial is summarized in Table 13. A total of 129 of the 623 (20.7%) patients screened in the DREAMM-7 trial did not advance past screening, primarily due to an inability to meet eligibility criteria, including not meeting measurable disease parameters (8%) or adequate organ system functions (33%), or having corneal epithelial disease (12%) or hepatitis B (19%). In total, 243 patients were randomized to the BVd group and 251 patients to the DVd group. Two patients were initially randomized to the DVd group but were not treated; these patients were rescreened and rerandomized to the BVd and DVd groups within a short time frame. Because these patients had multiple randomizations and baseline datasets, the recommended approach to preserve the balance in prognostic factors achieved by randomization was to retain both sets of baseline data and randomizations, counting them as 4 unique patients.
At the time of IA1, using the October 2, 2023, data cut-off, the median duration of follow-up was 29.2 months (range, 0.2 month to 40.0 months) in the BVd group and 27.6 months (range, 0.1 month to 39.7 months) in the DVd group. A total of 161 (66%) patients in the BVd group and 195 (78%) patients in the DVd group discontinued study treatment. The most common reasons for treatment discontinuation were disease progression (36.6% and 75.9% in the BVd and DVd groups, respectively), AEs (28.0% and 11.3% in the BVd and DVd groups, respectively), and physician decision (20.5% and 5.1% in the BVd and DVd groups, respectively). A higher proportion of deaths was reported in the DVd group (54%) compared to the BVd group (21%). Additionally, a greater proportion of patients in the BVd group was still on study treatment at the data cut-off date (33%) compared to the DVd group (20%).
At the time of IA2, using the October 7, 2024, data cut-off, the median duration of follow-up was 40.2 months (range, 0.2 month to 52.3 months) in the BVd group and 38.2 months (range, 0.1 month to 51.3 months) in the DVd group. The sponsor did not report the reasons for the study withdrawal. A total of 182 (75%) patients in the BVd group and 208 (83%) patients in the DVd group discontinued study treatment. The most common reasons for treatment discontinuation were disease progression (30% and 64% in the BVd and DVd groups, respectively) and AEs (21% and 9% in the BVd and DVd groups, respectively), followed by physician decision (13% and 4% in the BVd and DVd groups, respectively). A greater proportion of patients in the BVd group was still on study treatment at the data cut-off date (25%) compared to the DVd group (15%).
Table 13: Summary of Patient Disposition From the DREAMM-7 Trial
Patient disposition | IA1a | IA2b | ||
|---|---|---|---|---|
BVd group | DVd group | BVd group | DVd group | |
Screened, N | 623 | |||
Reason for not advancing past screening, n | ||||
Did not meet eligibility criteria | 129 | |||
Withdrawal | 8 | |||
Physician decision | 3 | |||
Enrolled, n | 494 | |||
Randomized, N | 243 | 251 | 243 | 251 |
Received treatment, n (%) | 242 (99.6) | 246 (98.0) | 242 (99.5) | 246 (98) |
Not treated, n (%) | 1 (0.5) | 5 (2.0) | 1 (0.5) | 5 (2) |
Discontinued from study, n (%) | 24 (10) | 39 (16) | NR | NR |
Reason for discontinuation, n (%) | ||||
Withdrawal by patient | 19 (8) | 26 (10) | NR | NR |
Physician decision | 4 (2) | 10 (4) | NR | NR |
Lost to follow-up | 1 (< 1) | 3 (1) | NR | NR |
Discontinued study treatment (monotherapy or combination therapy), n (%) | 161 (66) | 195 (78) | 182 (75) | 208 (83) |
Progressive disease | 59 (36.6) | 148 (75.9) | 74 (30) | 160 (64) |
Adverse events | 45 (28.0) | 22 (11.3) | 50 (21) | 23 (9) |
Physician decision | 33 (20.5) | 10 (5.1) | 32 (13) | 10 (4) |
Withdrawal by patient | 22 (13.7) | 13 (6.7) | 24 (10) | 13 (5) |
Loss to follow-up | 1 (0.6) | 1 (0.5) | 1 (< 1%) | 1 (< 1%) |
Protocol deviation | 1c (0.6) | 1 (0.5) | 1 (< 1%) | 1 (< 1%) |
Deaths, n (%) | 50 (21) | 135 (54) | 68 (28) | 103 (41) |
Ongoing, n (%) | 169 (70) | 135 (54) | NR | NR |
On study treatment | 81 (33) | 51 (20) | 60 (25) | 38 (15) |
In follow-up | 88 (36) | 81 (33) | NR | NR |
Duration of follow-up (months)c | ||||
Median (range) | 29.2 (0.2 to 40.0) | 27.6 (0.1 to 39.7) | 40.2 (0.2 to 52.3) | 38.2 (0.1 to 51.3) |
ITT, N | 243 | 251 | 243 | 251 |
mITT, N | 241 | 243 | 241 | 243 |
Safety, N | 242 | 246 | 242 | 246 |
BVd = belantamab mafodotin plus bortezomib and dexamethasone; DVd = daratumumab plus bortezomib and dexamethasone; IA1 = interim analysis 1; IA2 = interim analysis 2; ITT = intention to treat; mITT = modified intention to treat; NR = not reported.
Note: Patients could have more than 1 reason for not advancing past screening; hence, the percentage might sum to more than 100%. Patients could have only 1 primary reason for withdrawal. Two participants were randomized, not treated, rescreened, and rerandomized.
aOctober 2, 2023, data cut-off.
bOctober 7, 2024, data cut-off.
cThe duration of follow-up was defined as the time from randomization to last contact or death.
Sources: Clinical Study Report for the DREAMM-7 study (2024)26 and Clinical Study Report Addendum (Interim Analysis 2) for the DREAMM-7 study (2025).27 Details included in the table are from the sponsor’s Summary of Clinical Evidence.
Baseline Characteristics
The baseline characteristics in the ITT population outlined in Table 14 are limited to those that are most relevant to this review or were felt to affect the outcomes or interpretation of the study results. In general, patient demographic and disease characteristics were well balanced between the BVd and DVd treatment groups. The mean age of patients was 64.5 (SD = 9.5) years in the BVd group and 63.6 (SD = 10.1) years in the DVd group. Half of the patients were aged younger than 65 years (50% in both groups). Most patients had an ECOG PS score of 0 or 1 (96% in both groups). The majority of patients had an R-ISS score of stage I or stage II (95% and 94% in the BVd and DVd groups, respectively). A high proportion of patients had refractory or relapsed disease (97% and 98% in the BVd and DVd groups, respectively). Of the 494 patients, 250 (51%) patients had received 1 prior line of therapy, 117 (24%) patients had received 2 prior lines of therapy, and 70 (14%) patients had received 3 prior lines of therapy. Additionally, 257 (52%) patients had prior exposure to lenalidomide and 166 (34%) patients had disease refractory to lenalidomide. Immunoglobulin G was the most common myeloma immunoglobulin (66% and 63% in the BVd and DVd groups, respectively). Prior stem cell transplants were reported in 164 (67%) patients in the BVd group and 173 (69%) patients in the DVd group. High-risk cytogenetic abnormalities were present in 67 (28%) patients in the BVd group and 69 (27%) patients in the DVd group, with t(4;14) and 17p13del being the most common high-risk cytogenetic abnormalities in both groups.
Table 14: Summary of Baseline Characteristics From the DREAMM-7 Trial — ITT Population
Characteristic | DREAMM-7 study | |
|---|---|---|
BVd group (N = 243) | DVd group (N = 251) | |
Age (years)a | ||
Mean (SD) | 64.5 (9.5) | 63.6 (10.1) |
Median (minimum to maximum) | 65.0 (34 to 86) | 64.0 (32 to 89) |
Age groups (years), n (%) | ||
18 to < 65 | 121 (50) | 126 (50) |
65 to < 75 | 85 (35) | 95 (38) |
> 75 | 37 (15) | 30 (12) |
Sex, n (%) | ||
Female | 115 (47) | 107 (43) |
Male | 128 (53) | 144 (57) |
Ethnicity, n (%) | ||
Patients contributing to the analysis, N | ███ | ███ |
Hispanic or Latino | 30 (12) | 41 (16) |
Not Hispanic or Latino | 213 (88) | 208 (83) |
Race, n (%) | ||
Patients contributing to the analysis, N | ███ | ███ |
Asian | 28 (12) | 33 (13) |
Black or African-American | 8 (3) | 12 (5) |
White | 206 (85) | 203 (81) |
Mixed race | 0 | 1 (< 1) |
BMI (kg/m2) | ||
Patients contributing to the analysis, N | ███ | ███ |
Mean (SD) | 27.68 (50.09) | 27.84 (4.74) |
Median (range) | 27.131 (18.63 to 47.53) | 27.254 (18.29 to 50.90) |
R-ISS at screening, n (%) | ||
Stage I | 102 (42) | 103 (41) |
Stage II | 130 (53) | 132 (53) |
Stage III | 9 (4) | 14 (6) |
Unknown | 2 (< 1) | 2 (< 1) |
Relapsed or refractory disease, n (%) | ||
████████ ████████████ ██ ███ █████████ | ███ | ███ |
████████ | ███ ████ | ███ ████ |
██████████ | ███ ████ | ███ ████ |
███████| | | ███ | | ███ |
Extramedullary disease, n (%) | ||
No | 230 (95) | 226 (90) |
Yes | 13 (5) | 25 (10) |
█████ ████ ████████ █ ███ | ||
██ | ██ ████ | ██ ████ |
███ | ███ ████ | ███ ████ |
Myeloma immunoglobulin, n (%)e, f | ||
███ | ██ ████ | ██ ████ |
███ | | ████ | | ███ |
███ | || | || |
IgG | 161 (66) | 159 (63) |
███ | | ████ | | ████ |
████ ███████ | ██ ███ | ██ ████ |
███████ | | ████ | | ████ |
███████ █████ ██████ █ ███ | ||
████ █████ █████ █████ | ███ ████ | ███ ████ |
████ ██████ █████ █████ | ██ ████ | ██ ████ |
██ ███████ █████ █████ | | ███ | | ████ |
█████ ██ ████████ ████████ █ ███ | ||
█████████████ | | ███ | | ███ |
█████████ | ███ █████ | ███ █████ |
Prior antimyeloma therapy n (%) | ||
Bortezomib | 210 (86) | 211 (84) |
Carfilzomib | 31 (13) | 35 (14) |
Ixazomib | 13 (5) | 11 (4) |
Lenalidomide | 127 (52) | 130 (52) |
Thalidomide | 121 (50) | 144 (57) |
Pomalidomide | 25 (10) | 19 (8) |
Daratumumab | 3 (1) | 4 (2) |
Steroids | 241 (> 99) | 247 (98) |
Chemotherapy | 198 (81) | 206 (82) |
Refractory to prior antimyeloma therapy, n (%) | ||
Carfilzomib | 12 (5) | 17 (7) |
Ixazomib | 7 (3) | 8 (3) |
Bortezomib | 4 (2) | 0 (0.0) |
Lenalidomide | 79 (33) | 87 (35) |
Thalidomide | 16 (7) | 22 (9) |
Pomalidomide | 17 (7) | 12 (5) |
Steroids | 65 (27) | 66 (26) |
Chemotherapy | 30 (12) | 28 (11) |
Lines of therapy completed before screening | ||
Mean (SD) | 2.0 (1.3) | 1.9 (1.3) |
1 line, n (%) | 125 (51) | 125 (50) |
2 lines, n (%) | 54 (22) | 63 (25) |
3 lines, n (%) | 34 (14) | 36 (14) |
≥ 4 lines, n (%) | 30 (12) | 27 (11) |
Prior stem cell transplant, n (%) | ||
No | 79 (33) | 78 (31) |
Yes | 164 (67) | 173 (69) |
Cytogenetic risk categories, n (%) | ||
High riskg | 67 (28) | 69 (27) |
Standardh | 175 (72) | 175 (70) |
Missing or not evaluable | 1 (< 1) | 7 (3) |
High-risk cytogenetic abnormalities, n (%)e, f | ||
t(4;14) | 41 (17) | 42 (17) |
t(14;16) | 8 (3) | 6 (2) |
17p13del | 30 (12) | 35 (14) |
Other cytogenetic abnormalities, n (%)e, f | ||
Del 13 | 18 (7) | 28 (11) |
Del 1p | 22 (9) | 31 (12) |
Hyperdiploidy | 33 (14) | 28 (11) |
t(11;14) | 13 (5) | 15 (6) |
t(14;20) | 1 (< 1) | 1 (< 1) |
1q21+ | 94 (39) | 79 (31) |
Other | 30 (12) | 24 (10) |
Time to relapse after completion of 1 line of therapy, n (%)i | ||
≤ 12 months | 49 (20) | 50 (20) |
> 12 months | 194 (80) | 201 (80) |
Actual time since initial diagnosis at randomization (years) | ||
Median (range) | 4.28 (0.2 to 26.0) | 3.94 (0.1 to 23.4) |
|██ ████████ | ████ | ████ |
|██ ████████ | ████ | ████ |
ECOG PSj | ||
Patients contributing to the analysis, N | ███ | ███ |
|| | ███ ████ | ███ ████ |
|| | ███ ████ | ███ ████ |
|| | ██ ███ | ██ ███ |
BMI = body mass index; BVd = belantamab mafodotin plus bortezomib and dexamethasone; CRF = case report form; DVd = daratumumab plus bortezomib and dexamethasone; ECOG PS = Eastern Cooperative Oncology Group Performance Status; eCRF = electronic case report form; IgA = immunoglobulin A; IgD = immunoglobulin D; IgE = immunoglobulin E; IgG = immunoglobulin G; IgM = immunoglobulin M; ITT = intention to treat; PD = progressive disease; R-ISS = Revised International Staging System; R/R = relapsed/refractory; SD = standard deviation.
Note: Data cut-off date of October 2, 2023.
aAge was imputed when the full date of birth was not provided.
bCollected in the CRF as follows: PD after more than 60 days of stopping treatment (includes the eCRF categories of relapsed < 6 months, relapsed at 6 months to 12 months, and relapsed > 12 months).
cCollected in the CRF as follows: PD on treatment or within 60 days of stopping treatment (includes the eCRF categories of relapsed < 60 days, refractory, primary refractory, relapsed, and refractory).
dIncludes the CRF category of relapsed (time period unknown).
eParticipants could be included in more than 1 category.
fOnly positive results were summarized.
gIf the patients had at least 1 high-risk abnormality: t(4;14), t(14;16), or 17p13del.
hIf the patients had negative results for all high-risk abnormalities: t(4;14), t(14;16), or 17p13del.
iTime to relapse was defined as the time between the start date of the first line of therapy to the PD date on first-line treatment. If no PD date was available, the start date of the second line of treatment was used. If no PD date or start date of the second line of treatment was available, the date of randomization into the study was used.
jAnalyzed using the safety population.
Sources: Clinical Study Report for the DREAMM-7 study (2024).26 Details included in the table are from the sponsor’s Summary of Clinical Evidence.
Exposure to Study Treatments
At the time of IA1, using the October 2, 2023, data cut-off, the median number of treatment cycles in the BVd group was 12.0 cycles (range, 1 cycle to 55 cycles) compared to 15.0 cycles (range, 1 cycle to 46 cycles) in the DVd group (Table 15). A longer median duration of exposure was observed for patients receiving BVd compared to those receiving DVd (15.9 months [range, 0.7 month to 40.2 cycles] versus 12.9 months [range, 0.2 month to 40.5 months], respectively).
At the time of IA2, using the October 7, 2024, data cut-off, the median number of treatment cycles in the BVd group was 13.0 cycles (range, 1 cycle to 69 cycles) compared to 15.0 cycles (range, 1 cycle to 55 cycles) in the DVd group. A longer median duration of exposure was observed for patients receiving BVd compared to those receiving DVd (15.9 months [range, 0.7 month to 52.3 months] versus 12.8 months [range, 0.2 month to 48.8 months], respectively).
At the time of IA1, using the October 2, 2023, data cut-off, patients in the BVd group had received a median of 9 treatment cycles of belantamab (range, 1 cycle to 55 cycles), with the overall median dose intensity being 1.27 mg/kg per cycle (range, 0.2 mg/kg per cycle to 2.6 mg/kg per cycle) once every 3 weeks, and the median relative dose intensity being 50.9% (Table 16). As a result, the average treatment dose and administration schedule of belantamab within the BVd regimen were both lower and less frequent than those specified in the trial’s per-protocol dosing schedule. This was primarily due to necessary dose adjustments and extended dosing intervals for most patients to manage ocular AEs.
At the time of IA2, using the October 7, 2024, data cut-off, patients in the BVd group had received a median of 9 treatment cycles of belantamab (range, 1 cycle to 69 cycles), with the overall median dose intensity being 1.22 mg/kg per cycle (range, 0.2 mg/kg per cycle to 2.6 mg/kg per cycle) once every 3 weeks.
At the time of IA1, using the October 2, 2023, data cut-off, patients in the DVd group had received a median of 15 treatment cycles (range, 1 cycle to 46 cycles) of daratumumab. The overall median dose intensity of daratumumab was 45.5 mg/kg per cycle (range, 13.1 mg/kg per cycle to 52.2 mg/kg per cycle) for cycle 1 to cycle 3, 16.0 mg/kg per cycle (range, 2.5 mg/kg per cycle to 19.2 mg/kg per cycle) for cycle 4 to cycle 8, and 15.8 mg/kg per cycle (range, 12.0 mg/kg per cycle to 19.2 mg/kg per cycle) for cycles 9 and beyond (Table 17). At the time of IA2, using the October 7, 2024, data cut-off, patients in the BVd group had received a median of 15 treatment cycles of belantamab (range, 1 cycle to 55 cycles).
At the time of IA1, using the October 2, 2023, data cut-off, exposure to bortezomib (Table 18) and dexamethasone (Table 19) was similar in patients in the BVd and DVd groups.
Table 15: Summary of Patient Exposure, Both Combination Therapy and Monotherapy Phases of Treatment in the DREAMM-7 Trial — Safety Population
Exposure | IA1 | |
|---|---|---|
BVd group (N = 242) | DVd group (N = 246) | |
Number of cyclesa | ||
Mean (SD) | 14.1 (9.9) | 17.7 (11.7) |
Median (range) | 12.0 (1 to 55) | 15.0 (1 to 46) |
Overall total duration of exposure (months)b | ||
Mean (SD) | 17.07 (12.1) | 15.35 (10.9) |
Median (range) | 15.9 (0.7 to 40.2) | 12.9 (0.2 to 40.5) |
Overall total duration of exposure based on the date of the decision to discontinue (months)c | ||
Mean (SD) | 17.75 (11.9) | 15.49 (10.8) |
Median (range) | 16.8 (0.7 to 40.2) | 12.91 (0.2 to 40.5) |
AE = adverse event; BVd = belantamab mafodotin plus bortezomib and dexamethasone; DVd = daratumumab plus bortezomib and dexamethasone; IA1 = interim analysis 1; SD = standard deviation.
Note: Data cut-off date of October 2, 2023.
aThe number of cycles includes all cycles during which at least 1 component was administered. The number of cycles represents the number of doses; however, the number of cycles does not include dose delays (such as those due to ocular AEs for belantamab mafodotin).
bTotal duration of exposure = [(overall study treatment end date) – (overall study treatment start date) + 1].
cTotal duration of exposure (based on the date of the decision to discontinue treatment) = [(latest of [overall study treatment end date, latest date of decision to discontinue treatment]) – (overall study treatment start date) + 1].
Sources: Clinical Study Report for the DREAMM-7 study (2024).26 Details included in the table are from the sponsor’s Summary of Clinical Evidence.
Table 16: Summary of Exposure to Belantamab Mafodotin in the DREAMM-7 Trial — Safety Population
Exposure | BVd group (N = 242) |
|---|---|
Number of cyclesa | |
Mean (SD) | 11.7 (10.2) |
Median (range) | 9.0 (1 to 55) |
Overall dose intensity (mg/kg per cycle)b | |
Mean (SD) | 1.4 (0.8) |
Median (range) | 1.27 (0.2 to 2.6) |
Relative dose intensity (%)c | |
Mean (SD) | 56.2 (30.3) |
Median (range) | 50.9 (9.9 to 103.5) |
BVd = belantamab mafodotin plus bortezomib and dexamethasone; SD = standard deviation.
Note: Data cut-off date of October 2, 2023.
aCycles represent doses. Cycles during which no dose was administered due to dose delays were not counted.
bOverall dose intensity was the cumulative actual dose divided by (duration of exposure in days divided by planned cycle length).
cRelative dose intensity was calculated as a percentage and was defined as 100 multiplied by (overall dose intensity divided by planned dose intensity).
Sources: Clinical Study Report for DREAMM-7, 2024.26 Details included in the table are from the sponsor’s Summary of Clinical Evidence.
Table 17: Summary of Exposure to Daratumumab in the DREAMM-7 Trial — Safety Population
Exposure | BVd group (N = 242) |
|---|---|
Number of cyclesa | |
Mean (SD) | 17.6 (11.6) |
Median (range) | 15.0 (1 to 46) |
Overall dose intensity (mg/kg per cycle)b | |
Cycle 1 to cycle 3 | |
Patients contributing to the analysis, N | 246 |
Mean (SD) | 42.6 (7.3) |
Median (range) | 45.5 (13.1 to 52.2) |
Cycle 4 to cycle 8 | |
Patients contributing to the analysis, N | 221 |
Mean (SD) | 15.3 (1.7) |
Median (range) | 16.0 (2.5 to 19.2) |
Cycles 9 and beyond | |
Patients contributing to the analysis, N | 180 |
Mean (SD) | 15.5 (0.8) |
Median (range) | 15.8 (12.0 to 19.2) |
Relative dose intensity (%) | |
Cycle 1 to cycle 3 | |
Patients contributing to the analysis, N | 246 |
Mean (SD) | 88.8 (15.3) |
Median (range) | 94.8 (27.3 to 108.9) |
Cycle 4 to cycle 8 | |
Patients contributing to the analysis, N | 221 |
Mean (SD) | 95.8 (10.8) |
Median (range) | 100.0 (15.7 to 120.0) |
Cycles 9 and beyond | |
Patients contributing to the analysis, N | 180 |
Mean (SD) | 97.2 (5.3) |
Median (range) | 98.8 (75.1 to 120.0) |
DVd = daratumumab plus bortezomib and dexamethasone; SD = standard deviation.
Note: Data cut-off date of October 2, 2023.
aDose intensity was the cumulative actual dose divided by (the duration of exposure in days divided by planned cycle length). This was only calculated for daratumumab due to changes in the dosing regimen at cycle 4 and an increase in cycle length to 28 days at cycle 9.
bRelative dose intensity was calculated as a percentage and was defined as 100 multiplied by (dose intensity divided by planned dose intensity, within the indicated cycles).
Sources: Clinical Study Report for the DREAMM-7 study (2024).26 Details included in the table are from the sponsor’s Summary of Clinical Evidence.
Table 18: Summary of Exposure to Bortezomib in the DREAMM-7 Trial — Safety Population
Exposure | BVd group (N = 242) | DVd group (N = 246) |
|---|---|---|
Number of cycles | ||
Mean (SD) | 6.5 (2.3) | 6.7 (2.1) |
Median (range) | 8.0 (1 to 8) | 8.0 (1 to 8) |
Overall dose intensity (mg/kg per cycle)a | ||
Mean (SD) | 3.9 (1.2) | 4.3 (1.1) |
Median (range) | 3.9 (1.0 to 9.0) | 4.5 (1.5 to 9.1) |
Relative dose intensity (%)b | ||
Mean (SD) | 75.4 (22.7) | 83.2 (20.1) |
Median (range) | 75.3 (19.6 to 172.7) | 86.1 (28.4 to 175.8) |
BVd = belantamab mafodotin plus bortezomib and dexamethasone; DVd = daratumumab plus bortezomib and dexamethasone; SD = standard deviation.
Note: Data cut-off date of October 2, 2023.
aOverall dose intensity was the cumulative actual dose divided by (the duration of exposure in days divided by planned cycle length).
bRelative dose intensity was calculated as a percentage and was defined as 100 multiplied by (overall dose intensity divided by planned dose intensity).
Sources: Clinical Study Report for the DREAMM-7 study (2024).26 Details included in the table are from the sponsor’s Summary of Clinical Evidence.
Table 19: Summary of Exposure to Dexamethasone in the DREAMM-7 Trial — Safety Population
Exposure | BVd group (N = 242) | DVd group (N = 246) |
|---|---|---|
Number of cyclesa | ||
Mean (SD) | 6.8 (2.1) | 6.9 (2.1) |
Median (range) | 8.0 (1 to 8) | 8.0 (1 to 9) |
Overall dose intensity (mg/kg per cycle)b for 10 mg | ||
Patients contributing to the analysis, N | 13 | 8 |
Mean (SD) | 69.6 (27.3) | 64.7 (30.6) |
Median (range) | 68.2 (31.1 to 144.1) | 58.06 (28.5 to 126.0) |
Overall dose intensity (mg/kg per cycle)b for 20 mg | ||
N of patients contributing to the analysis | 229 | 238 |
Mean (SD) | 129.5 (38.4) | 131.3 (46.2) |
Median (range) | 138.0 (12.7 to 280.0) | 143.02 (38.3 to 420.0) |
Relative dose intensity (%) | ||
N of patients contributing to the analysis | 242 | 246 |
Mean (SD) | 81.3 (24.6) | 82.0 (29.2) |
Median (range) | 86.2 (8.0 to 180.1) | 89.1 (23.9 to 262.5) |
BVd = belantamab mafodotin plus bortezomib and dexamethasone; DVd = daratumumab plus bortezomib and dexamethasone; SD = standard deviation.
Note: Data cut-off date of October 2, 2023.
aOverall dose intensity was the cumulative actual dose divided by (duration of exposure in days divided by planned cycle length).
bRelative dose intensity was calculated as a percentage and was defined as 100 multiplied by (overall dose intensity divided by planned dose intensity).
Sources: Clinical Study Report for the DREAMM-7 study (2024).26 Details included in the table are from the sponsor’s Summary of Clinical Evidence.
Concomitant Medications
At the time of IA1, using the October 2, 2023, data cut-off, concomitant medications in the DREAMM-7 trial were administered to 242 (99.6%) patients in the BVd group and 245 (98%) patients in the DVd group. A higher proportion of patients in the BVd group had received blood products compared to those in the DVd group (28% versus 16%, respectively). Additionally, a greater proportion of patients in the BVd group had received platelet transfusions compared to the DVd group (19% versus 9%, respectively). The use of blood-supportive care products was similar between the 2 treatment groups.
Subsequent Antimyeloma Therapy
At the time of IA1, using the October 2, 2023, data cut-off, subsequent antimyeloma therapy was reported for 62 (26%) patients in the BVd group and 110 (44%) patients in the DVd group (Table 20). The median time from study treatment discontinuation to the initiation of subsequent antimyeloma therapy was longer in the BVd group compared with the DVd group (69 days [range, 4 days to 698 days] versus 44.0 days [range, 2 days to 610 days], respectively). At the time of IA2, using the October 7, 2024, data cut-off, subsequent antimyeloma therapy was reported for 87 (36%) patients in the BVd group and 130 (52%) patients in the DVd group.71 Given that both the IA1 and IA2 data cut-offs on October 2, 2023, and October 7, 2024, respectively, considering any line of subsequent therapy, a higher proportion of patients in the DVd group initiated steroids, immunomodulators, and proteasome inhibitors compared to the BVd group. Conversely, more patients in the BVd group initiated monoclonal antibody therapy compared to the DVd group.71
Table 20: Summary of Subsequent Treatment From the DREAMM-7 Trial — ITT Population
Exposure | IA1 | IA2 | ||
|---|---|---|---|---|
BVd group (N = 243) | DVd group (N = 251) | BVd group (N = 243) | DVd group (N = 251) | |
Any antimyeloma therapy, n (%) | 62 (26) | 110 (44) | 87 (36) | 130 (52) |
Steroids | 52 (21) | 88 (35) | 77 (32) | 107 (43) |
Immunomodulator | 43 (18) | 79 (32) | 60 (25) | 92 (37) |
Proteasome inhibitor | 29 (12) | 61 (24) | 46 (19) | 80 (32) |
Chemotherapy | 16 (7) | 33 (13) | 25 (10) | 39 (16) |
Monoclonal antibody | 37 (15) | 16 (6) | 63 (26) | 25 (10) |
Antibody-drug conjugate | 1 (< 1) | 20 (8) | 2 (< 1) | 22 (9) |
Bispecific antibody (BiTE) | 5 (2) | 11 (4) | 10 (4.1) | 18 (7) |
Engineered T/NK cell therapy | 0 (0) | 2 (< 1) | 1 (< 1) | 3 (1) |
Stem cell transplant | 2 (< 1) | 2 (< 1) | 3 (1) | 2 (< 1) |
Dexamethasone | NR | NR | 75 (31) | 106 (42) |
Lenalidomide | NR | NR | 22 (9) | 47 (19) |
Pomalidomide | NR | NR | 41 (17) | 47 (19) |
Carfilzomib | NR | NR | 26 (11) | 54 (22) |
Bortezomib | NR | NR | 21 (9) | 21 (8) |
Isatuximab | NR | NR | 22 (9) | 2 (< 1) |
BiTE = Bispecific T Cell Engager; BVd = belantamab mafodotin plus bortezomib and dexamethasone; DVd = daratumumab plus bortezomib and dexamethasone; IA1 = interim analysis 1; IA2 = interim analysis 2; ITT = intention to treat; NR = not reported; T/NK = T-cell/natural killer.
Note: Drug class contains all medications taken for the specific follow-up anticancer line of therapy. Drug class percentages are based on the number of participants who received the subsequent line of therapy number.
Sources: Clinical Study Report for the DREAMM-7 study (2024)26 and Hungria et al. (2024).71 Details included in the table are from the sponsor’s Summary of Clinical Evidence.
Dose Modifications
At the time of IA1, using the October 2, 2023, data cut-off, dose delays were reported in 88% of patients in the BVd group and 72% of patients in the DVd group. The median duration of a dose delay was 54 days (range, 1 day to 732 days) for belantamab compared to 5 days (range, 1 day to 180 days) for daratumumab. Dose interruptions were reported in 1% of patients receiving belantamab and 22% of those receiving daratumumab, with a total of 73 dose interruptions reported for daratumumab. Of these, 55% were due to AEs. A total of 194 dose reductions were reported for belantamab, with 49% of these reductions attributed to corneal exam findings and 41% due to AEs. Nearly all dose reductions occurred within the first 9 cycles.
Protocol Deviations
The proportion of patients with any important protocol deviation was higher in the BVd group compared with the DVd group (78% versus 63%, respectively). The most common types of protocol deviation in both treatment groups were related to assessment or time point completion (44% versus 37% in the BVd and DVd groups, respectively), wrong study treatment or administration of dose (39% versus 14% in the BVd and DVd groups, respectively), informed consent (19% versus 20% in the BVd and DVd groups, respectively), and study procedures (16% versus 14% in the BVd and DVd groups, respectively).
Efficacy
Only those efficacy outcomes and analyses of subgroups identified as important to this review are reported. Findings for key efficacy outcomes in the DREAMM-7 trial are summarized in Table 21.
Primary Outcome
PFS per IRC Assessment
At the time of IA1, using the October 2, 2023, data cut-off, the median duration of follow-up was 28.2 months. In the ITT population, PFS events were reported for 91 (37%) patients in the BVd group and 158 (63%) patients in the DVd group. The median PFS was 36.6 months (95% CI, 28.4 months to not estimable) in the BVd group and 13.4 months (95% CI, 11.1 months to 17.5 months) in the DVd group, with a between-group HR of 0.41 (95% CI, 0.31 to 0.53; P < 0.00001) in favour of the BVd group (Figure 5). The KM-estimated probabilities of being alive or progression-free at 12 months and 18 months were 78.3% (95% CI, 72.2% to 83.2%) versus 53.3% (95% CI, 46.5% to 59.5%), and 68.8% (95% CI, 62.0% to 74.7%) versus 42.8% (95% CI, 36.2% to 49.2%), in the BVd and DVd groups, respectively. The proportional hazards assumption for PFS was tested, using a diagnostics plot (log of time versus log of negative log of estimated survival), along with a plot of Schoenfeld residuals. These tests indicated no significant interaction between time and treatment (P value = 0.9408), providing insufficient evidence to suggest a violation of the assumption.
PFS reached the predefined boundary for statistical significance at IA1 and, in accordance with the study protocol, was evaluated as an exploratory end point at the time of IA2. At the time of IA2, using the October 7, 2024, data cut-off, the median PFS was ████ ██████ ████ ███ ████ ██████ ██ ████ ███████ in the BVd group and ████ ██████ ████ ███ ████ ██████ ██ ████ ███████ in the DVd group, with a between-group ██ ██ ████ █████ ██ ████) in favour of the BVd group. The KM-estimated probabilities of being alive and progression-free at 24 months and 36 months were █████ ████ ███ █████ ██ ██████ versus █████ ████ ███ █████ ██ ███████ and █████ ████ ███ █████ ██ ██████ versus █████ ████ ███ █████ ██ ███████ in the BVd and DVd groups, respectively.
The results of predefined exploratory subgroup analyses at IA1 were consistent with the primary PFS analyses, including for those exposed or refractory to lenalidomide (HR = 0.33 [95% CI, 0.23 to 0.48] and HR = 0.37 [95% CI, 0.24 to 0.56], respectively), those with more than 1 prior line of therapy (HR = 0.33 [95% CI, 0.23 to 0.48]), those with high cytogenetic risk (HR = 0.36 [95% CI, 0.22 to 0.58]) and R-ISS stage II or stage III (HR = 0.45 [95% CI, 0.32 to 0.64]).
The results of all sensitivity analyses at IA1 were consistent with the primary PFS analyses. The results of the PFS analyses per IRC assessment were consistent with those from the investigator assessment.
Figure 5: KM Plot of PFS at IA1 per IRC Assessment in the DREAMM-7 Trial — ITT Population
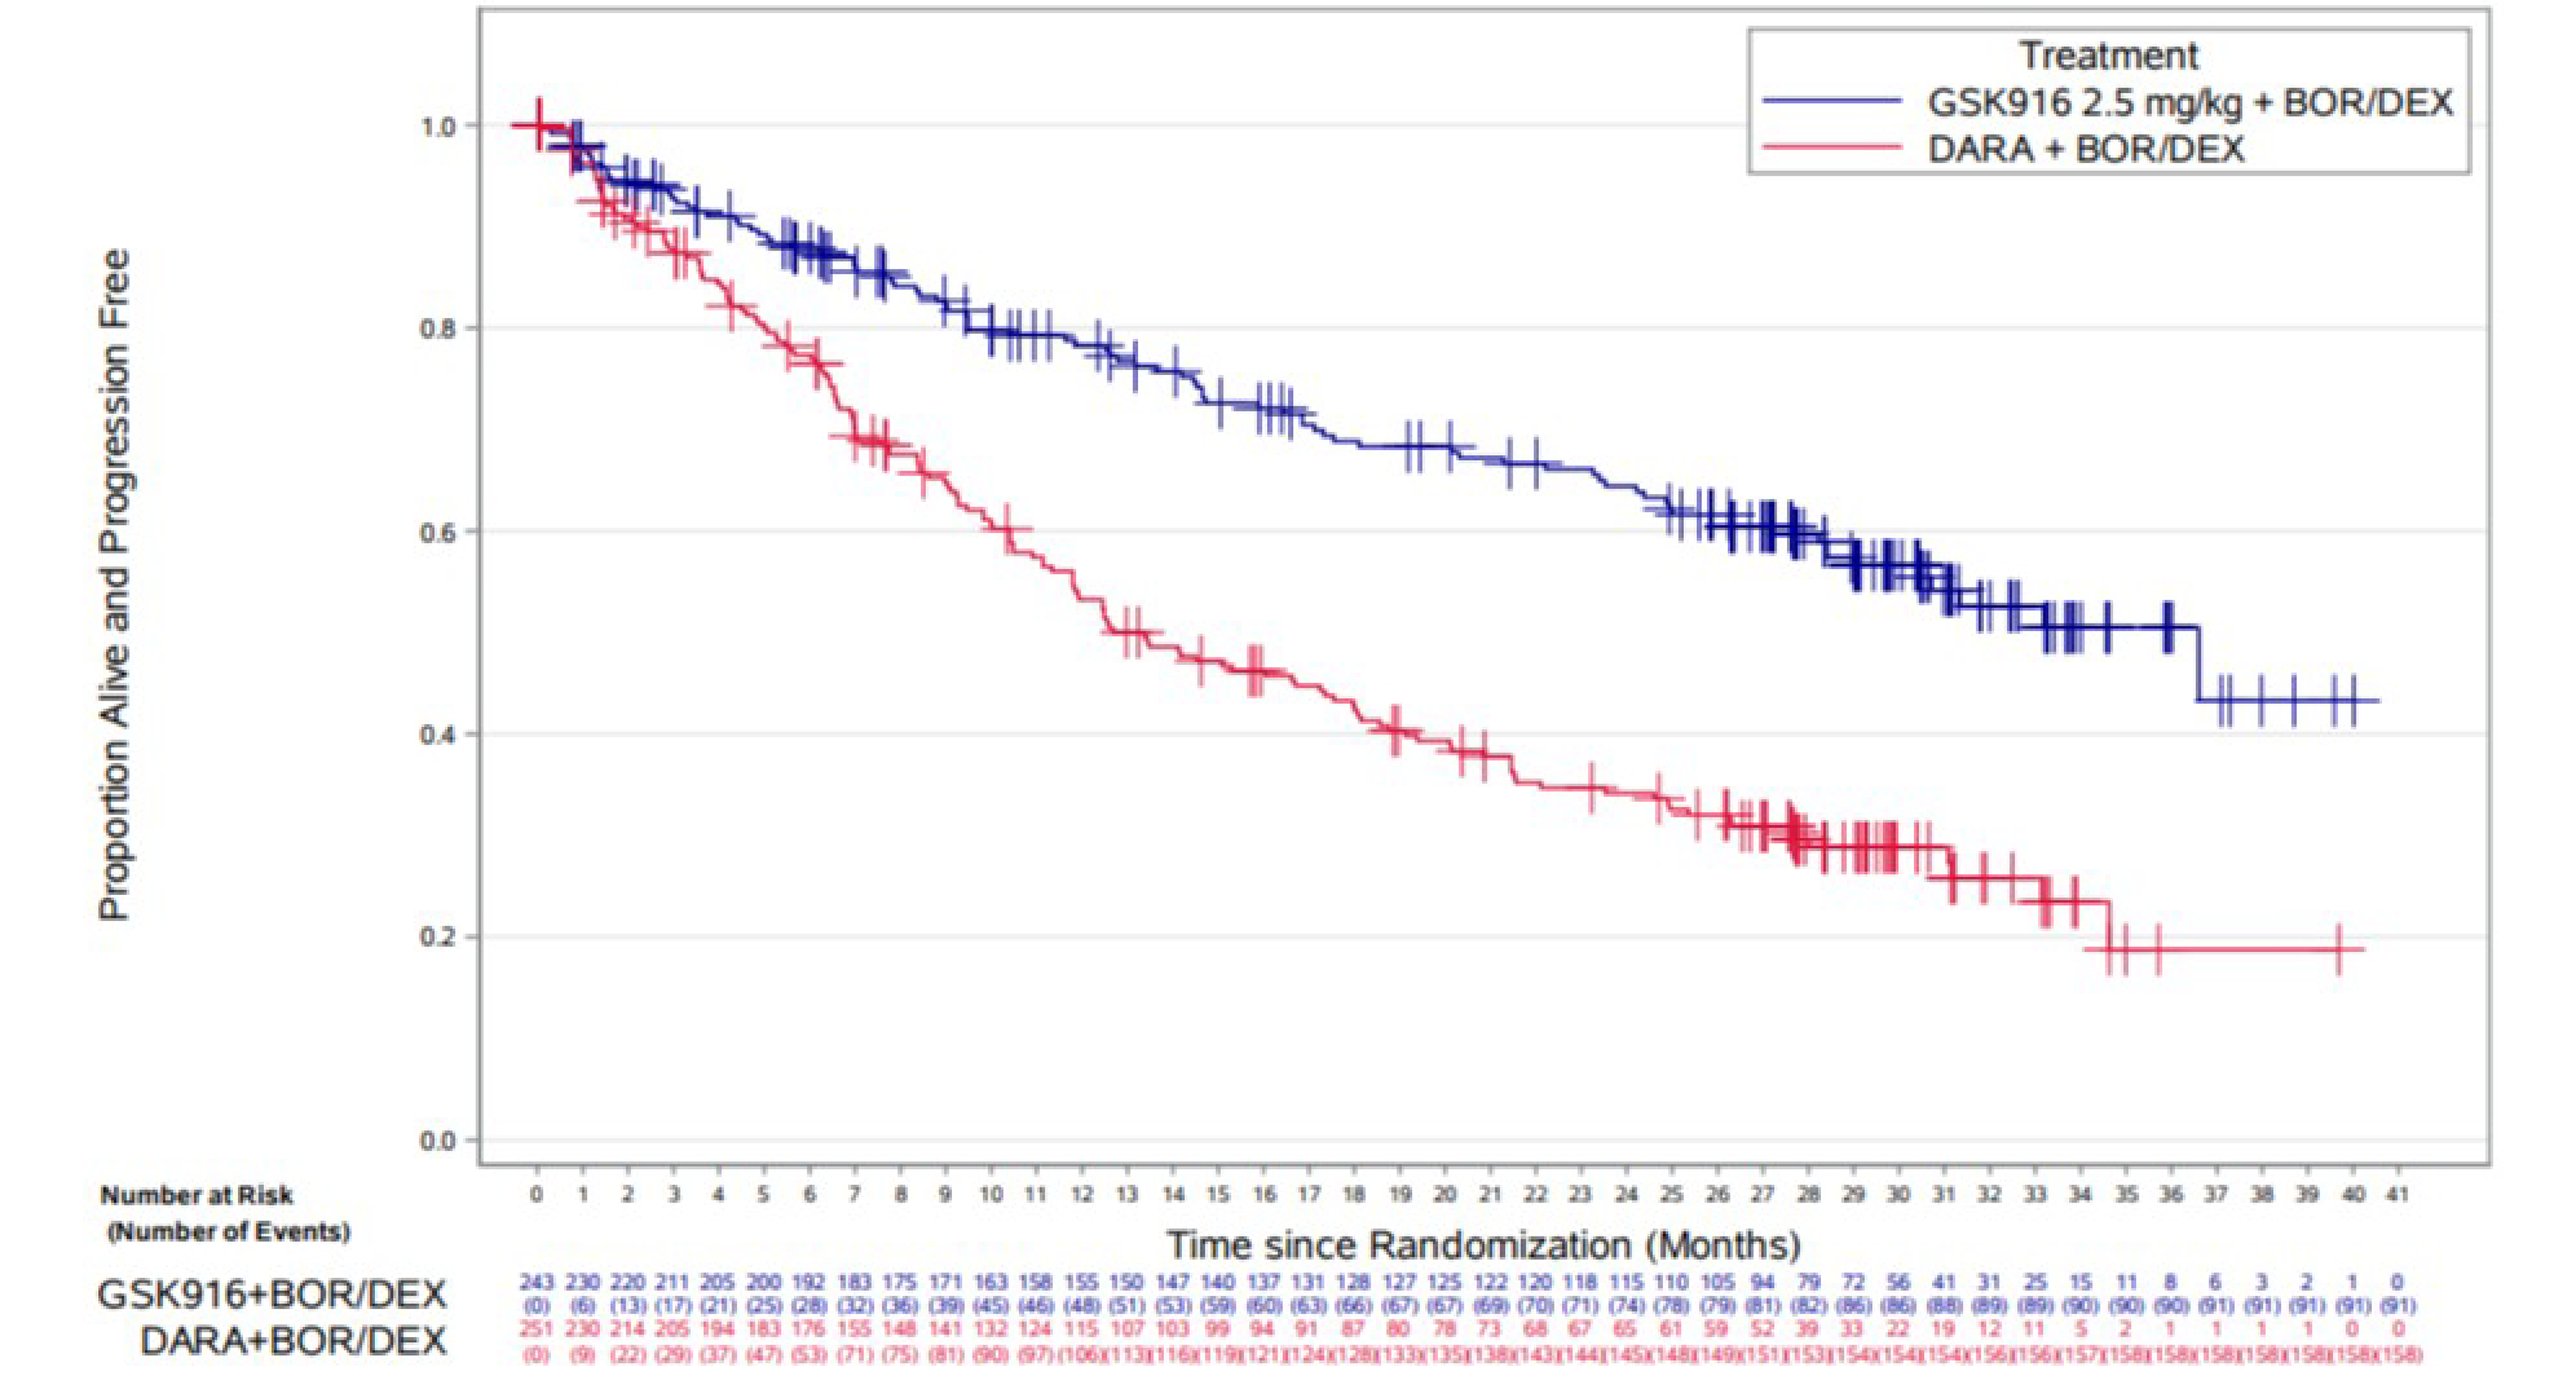
BOR = bortezomib; DARA = daratumumab; DEX = dexamethasone; GSK916 = belantamab mafodotin plus bortezomib and dexamethasone; IA1 = interim analysis 1; IRC = independent review committee; ITT = intention to treat; KM = Kaplan-Meier; PFS = progression-free survival.
Notes: There were 2 participants in the ITT population who were randomized, not treated, rescreened, and rerandomized. They were counted as 4 unique participants in Figure 5.
The data cut-off date was October 2, 2023.
Source: Clinical Study Report for the DREAMM-7 study (2024).26
Key Secondary Outcomes
Overall Survival
At the time of IA1, using the October 2, 2023, data cut-off, OS data had reached 29% (141 of 494 patients) overall maturity, and the median OS was not reached in either treatment group. Death was reported in 54 (22%) patients in the BVd group and 87 (35%) patients in the DVd group, with a between-group HR of 0.57 (95% CI, 0.40 to 0.80; P value = 0.00049). At the time of IA1, the results for OS did not meet the significance criterion. The KM-estimated probabilities of being alive at 12 months and 18 months were 86.5% (95% CI, 81.5% to 90.3%) versus 80.7% (95% CI, 75.2% to 85.1%), and 83.9% (95% CI, 78.6% to 88.0%) versus 72.6% (95% CI, 66.5% to 77.8%), in the BVd and DVd groups, respectively. The subgroup analyses for OS were not performed due to the immaturity of data at the time of analysis.
At the time of IA2, using the October 7, 2024, data cut-off, the median OS had not been reached in either treatment group. Death was reported in 68 (28%) patients in the BVd group and 103 (41%) patients in the DVd group, with a between-group HR of 0.58 (95% CI, 0.43 to 0.79; P value = 0.00023) in favour of the BVd group. At the time of IA2, OS data had reached 34.6% (171 of 494patients) overall maturity, and the significance criterion was met (P < 0.00112). The KM-estimated probabilities of being alive at 24 months and 36 months were 79.0% (95% CI, 73.2% to 83.7%) versus 67.4% (95% CI, 61.0% to 73.0%), and 71.4% (95% CI, 67.9% to 79.2%) versus 60.2% (95% CI, 53.6% to 66.2%), in the BVd and DVd groups, respectively (Figure 6).
Figure 6: KM Plot of OS at IA2 per IRC Assessment in the DREAMM-7 Trial — ITT Population
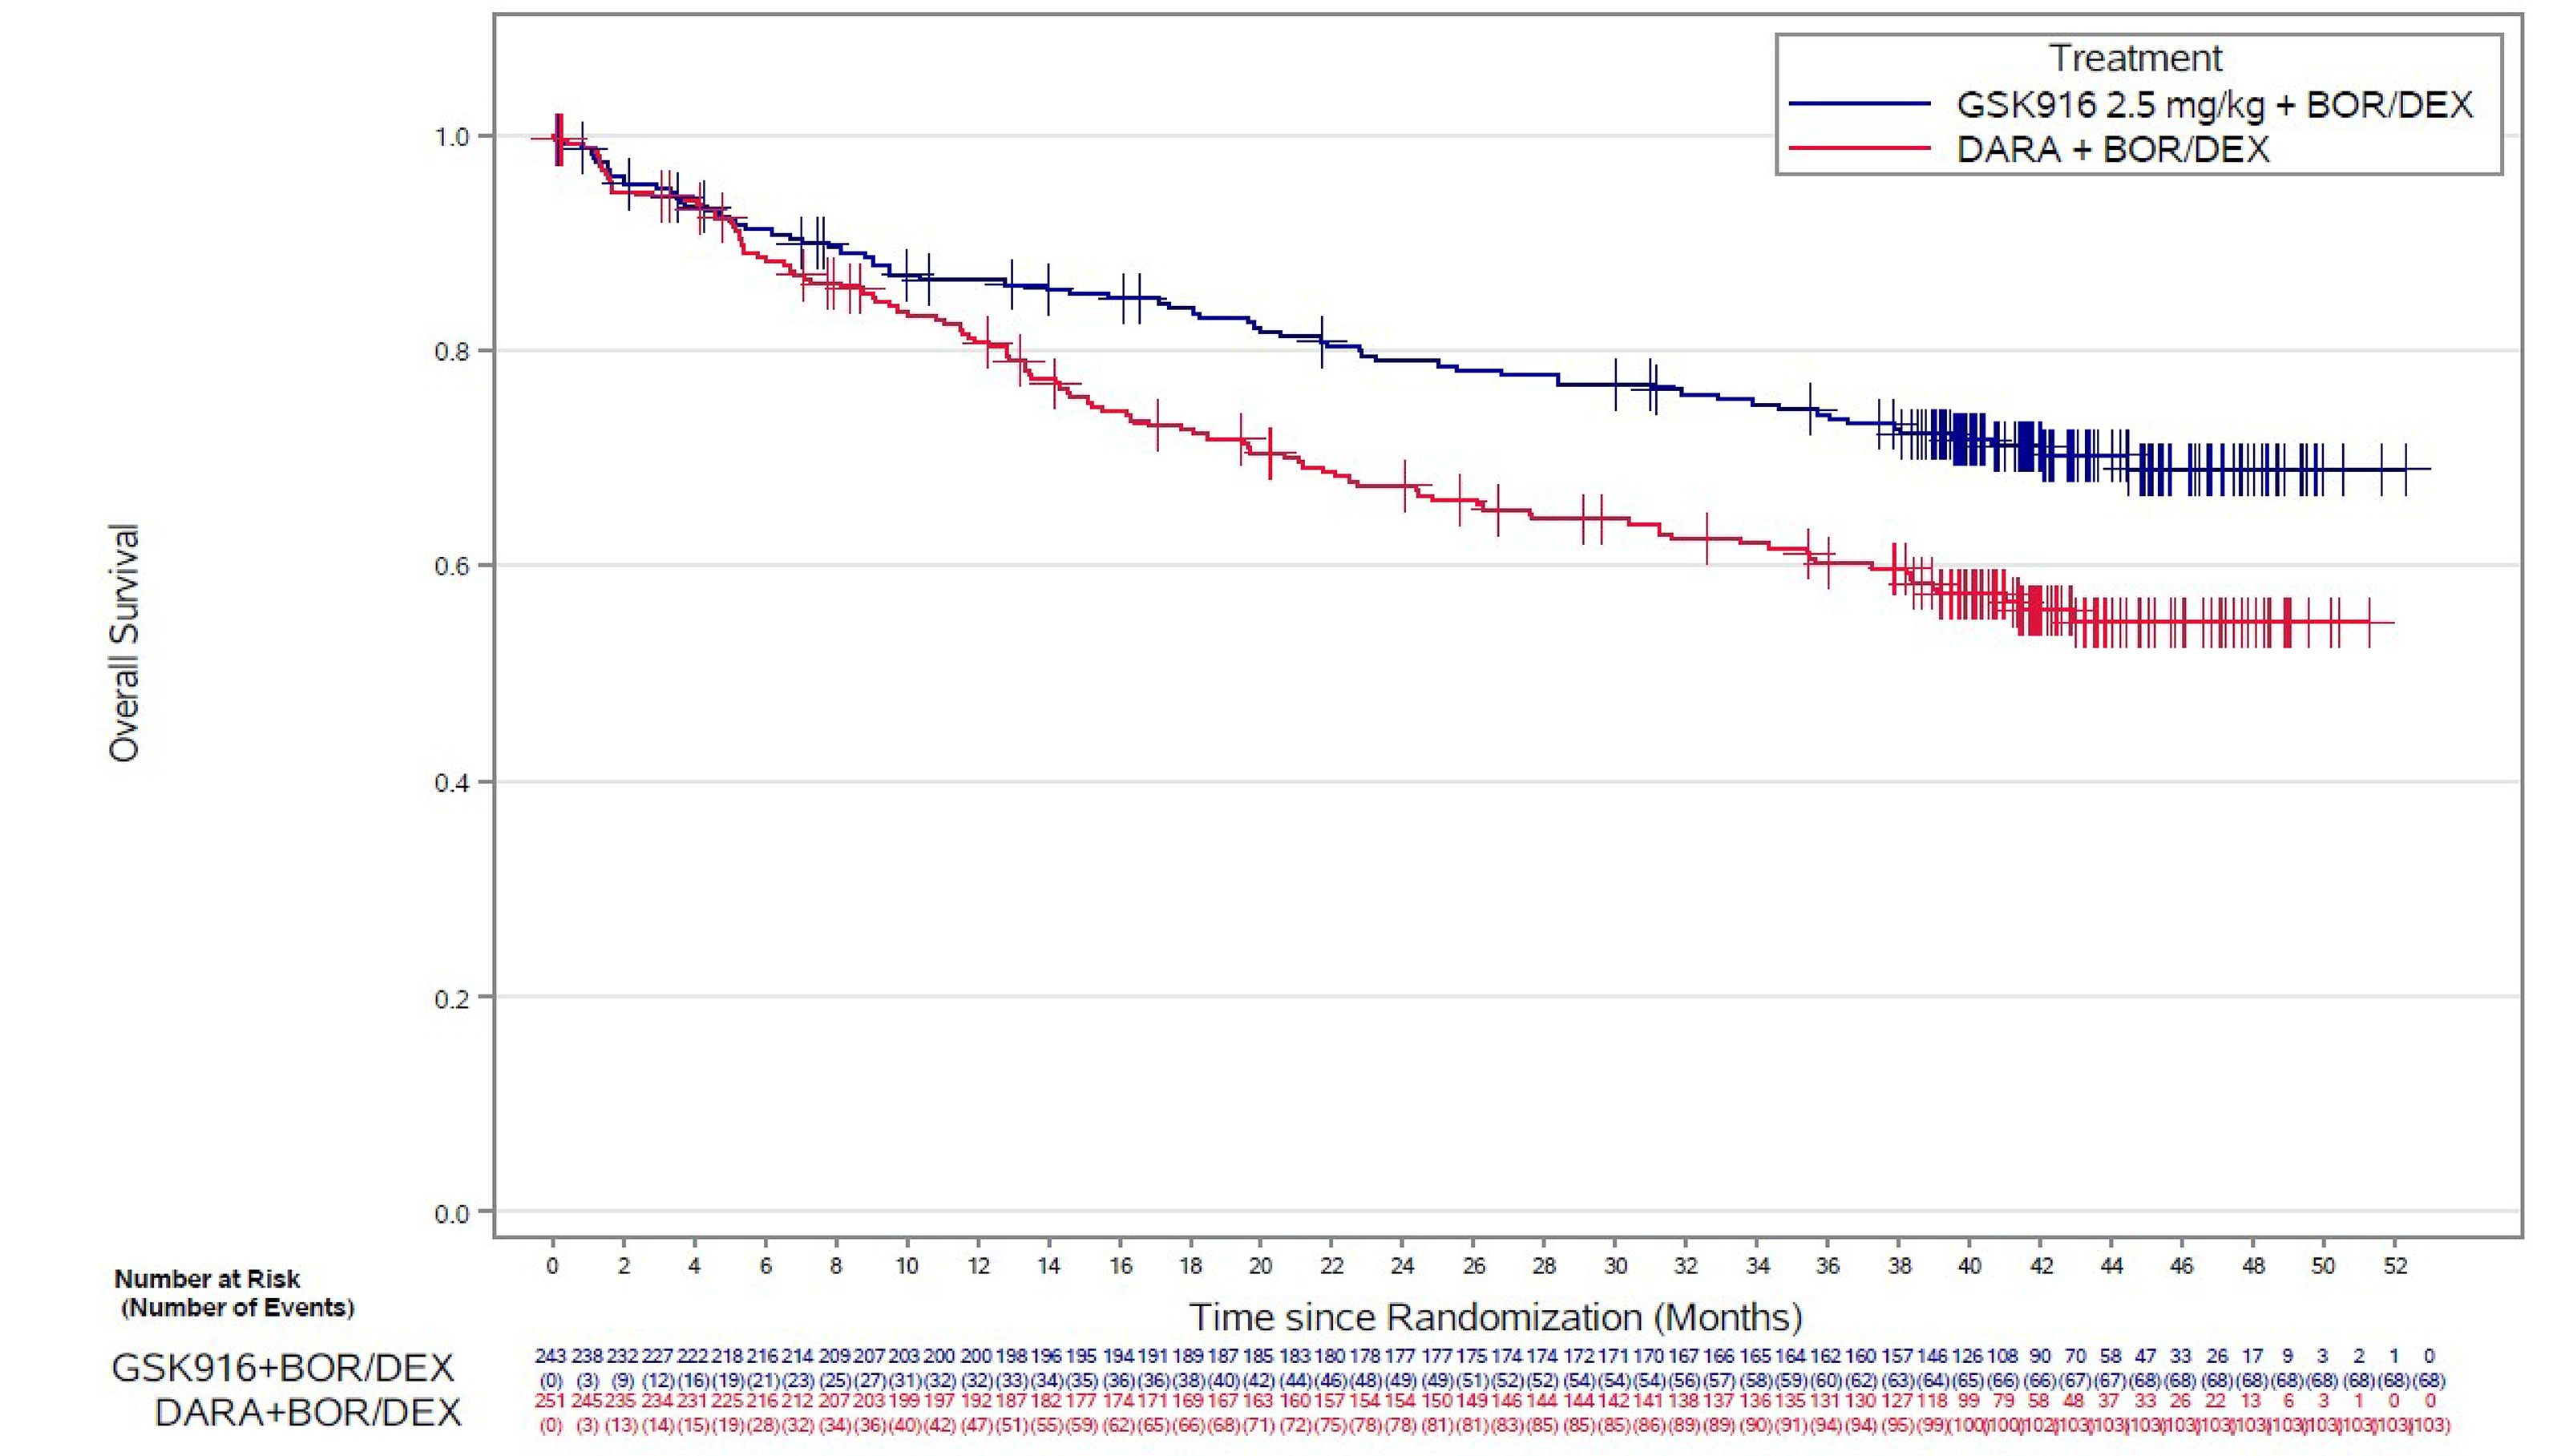
BOR = bortezomib; DARA = daratumumab; DEX = dexamethasone; GSK916 = belantamab mafodotin plus bortezomib plus dexamethasone; IA2 = interim analysis 2; IRC = independent review committee; ITT = intention to treat; KM = Kaplan-Meier; OS = overall survival.
Notes: There were 2 participants in the ITT population who were randomized, not treated, rescreened, and rerandomized. They were counted as 4 unique participants in Figure 6.
The data cut-off date was October 7, 2024.
Sources: Clinical Study Report for the DREAMM-7 study (2024)26 and (2025). 27
Duration of Response
The RMDoR is a composite end point that integrates overall response data and PFS data, allowing cross-group comparison, and efficiently assesses the treatment effect related to tumour reductions. At the time of IA1, using the October 2, 2023, data cut-off, the RMDoR was 19.0 months (95% CI, 17.7 months to 20.4 months) in the BVd group and 13.2 months (95% CI, 11.8 months to 14.6 months) in the DVd group, with a ratio of RMDoR of 1███ ████ ███ ████ ██ █████ P value < 0.00001) in favour of the BVd group.
A conventional assessment of DoR was conducted among patients with PR or better, and was defined as the time from the first documented evidence of PR or better until disease progression or death due to any cause. At the time of IA1, using the October 2, 2023, data cut-off, the median DoR was 35.6 months (95% CI, 30.5 months to not estimable) in the BVd group and 17.8 months (95% CI, 13.8 months to 23.6 months) in the DVd group.
At the time of IA2, using the October 7, 2024, data cut-off, the median DoR was 40.8 months (95% CI, 30.5 months to not estimable) in the BVd group and 17.8 months (95% CI, 13.8 months to 23.6 months) in the DVd group. The KM-estimated probabilities of maintaining response at 12 months and 18 months were 83.3% (95% CI, 77.1% to 87.9%) versus 61.2% (95% CI, 53.4% to 68.0%), and 75.6% (95% CI, 68.6% to 81.3%) versus 49.1% (95% CI, 41.3% to 56.5%), in the BVd and DVd groups, respectively (Figure 7).
The sensitivity analysis for DoR based on the IRC assessment, which considered death due to disease progression only, was consistent with the conventional DoR analysis that included death from any cause.
Figure 7: KM Plot of DoR per IRC Assessment in the DREAMM-7 Trial — ITT Population
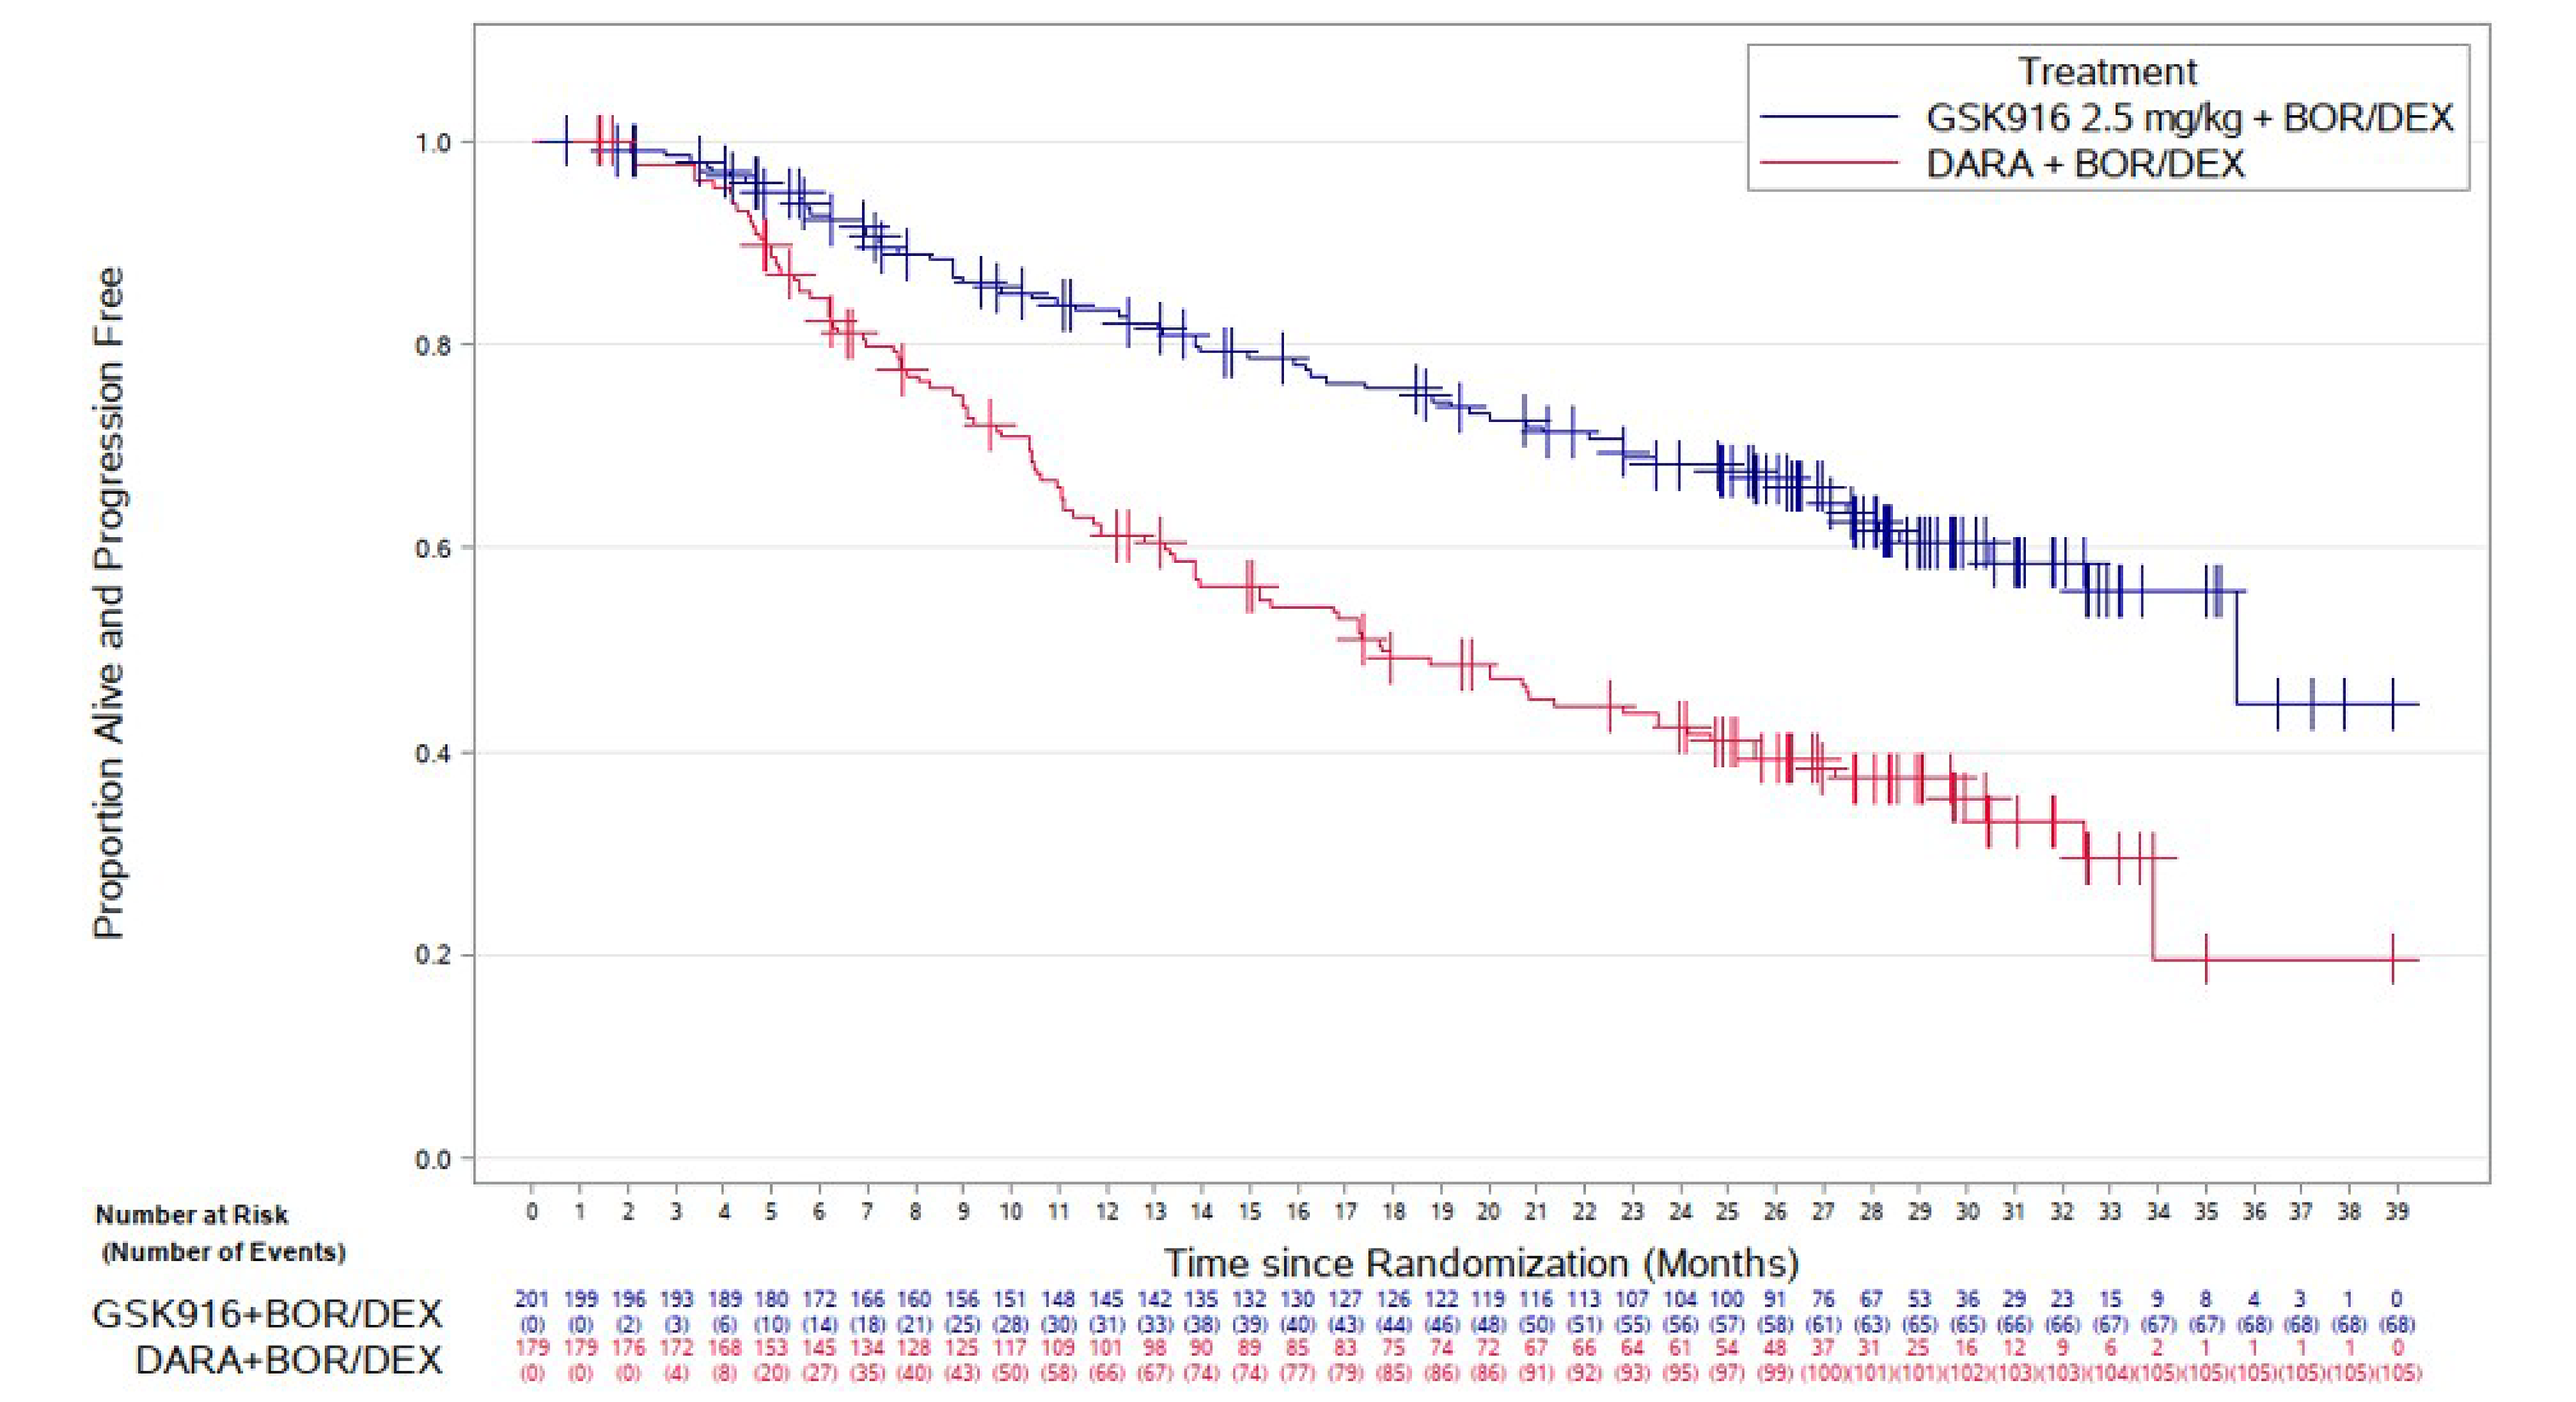
BOR = bortezomib; DARA = daratumumab; DEX = dexamethasone; DoR = duration of response; GSK916 = belantamab mafodotin plus bortezomib and dexamethasone; IRC = independent review committee; ITT = intention to treat; KM = Kaplan-Meier.
Notes: There were 2 participants in the ITT population who were randomized, not treated, rescreened, and rerandomized. They were counted as 4 unique participants in Figure 7.
The data cut-off date was October 2, 2023.
Source: Clinical Study Report for the DREAMM-7 study (2024).26
Minimal Residual Disease
At the time of IA1, using the October 2, 2023, data cut-off, the MRD negativity analysis was exploratory in nature because the OS results were not significant at the time of IA1. The proportion of patients who achieved MRD negativity by best response (CR or sCR) was higher in the BVd group compared with the DVd group at 24.7% versus 9.6%, respectively (P < 0.00001). MRD negativity by best response based on an IRC assessment showed higher MRD negativity rates in the BVd group compared with the DVd group across all response categories. Because the IA2 analysis of OS reached statistical significance, the MRD negativity results from the IA1 primary analysis can be considered statistically significant due to the prespecified hierarchical testing of outcomes. At the time of IA2, using the October 7, 2024, data cut-off, MRD negativity rates by CR or sCR remained consistent with the IA1 results. The BVd group showed higher MRD negativity rates (25.1%) compared with the DVd group (10.4%).
Secondary Outcomes
Complete Response Rate
At the time of IA1, using the October 2, 2023, data cut-off, a greater proportion of patients in the BVd group (34.6%) compared with the DVd group (17.1%) had achieved CR or sCR, with a between-group difference of 17.4% (95% CI, 8.6% to 26.1%).
Overall Response Rate
At the time of IA1, using the October 2, 2023, data cut-off, a greater proportion of patients in the BVd group (82.7%) compared with the DVd group (71.3%) had achieved confirmed PR or better, with a between-group difference of 11.4% (95% CI, 2.6% to 20.1%).
European Organisation for Research and Treatment of Cancer Quality of Life Questionnaire Core 30
EORTC QLQ-C30 data reported in this section are from IA1, with the data cut-off date of October 2, 2023.
GHS Domain
The EORTC QLQ-C30 GHS domain remained stable across both treatment groups over time (Figure 8). Both groups showed a slight mean deterioration in GHS scores between week 4 and week 43, after which scores stabilized and remained consistent throughout the treatment period. Between week 43 and week 100, 24% to 35% of patients in the BVd group experienced an improvement in GHS or QoL scores (a 10-point increase or higher). Small sample sizes at later time points limited the ability to interpret the results (Figure 8).
For example, at week 43, in the GHS score, patients in the DVd group had experienced a mean change of ███ ██████ from baseline compared with a change of ███ ██████ in the DVd group, with a least squares mean difference between groups of ███ ████ ███ ████ ██ ████. At week 121, in the GHS score, patients in the DVd group had experienced a mean change of ███ ██████ from baseline compared with a change of ████ ██████ in the DVd group, with a least squares mean difference between groups ███ ████ ███ ████ ██ ████.
Figure 8: Change From Baseline in EORTC QLQ-C30 Global Health Status and QoL Domain Score — ITT Population
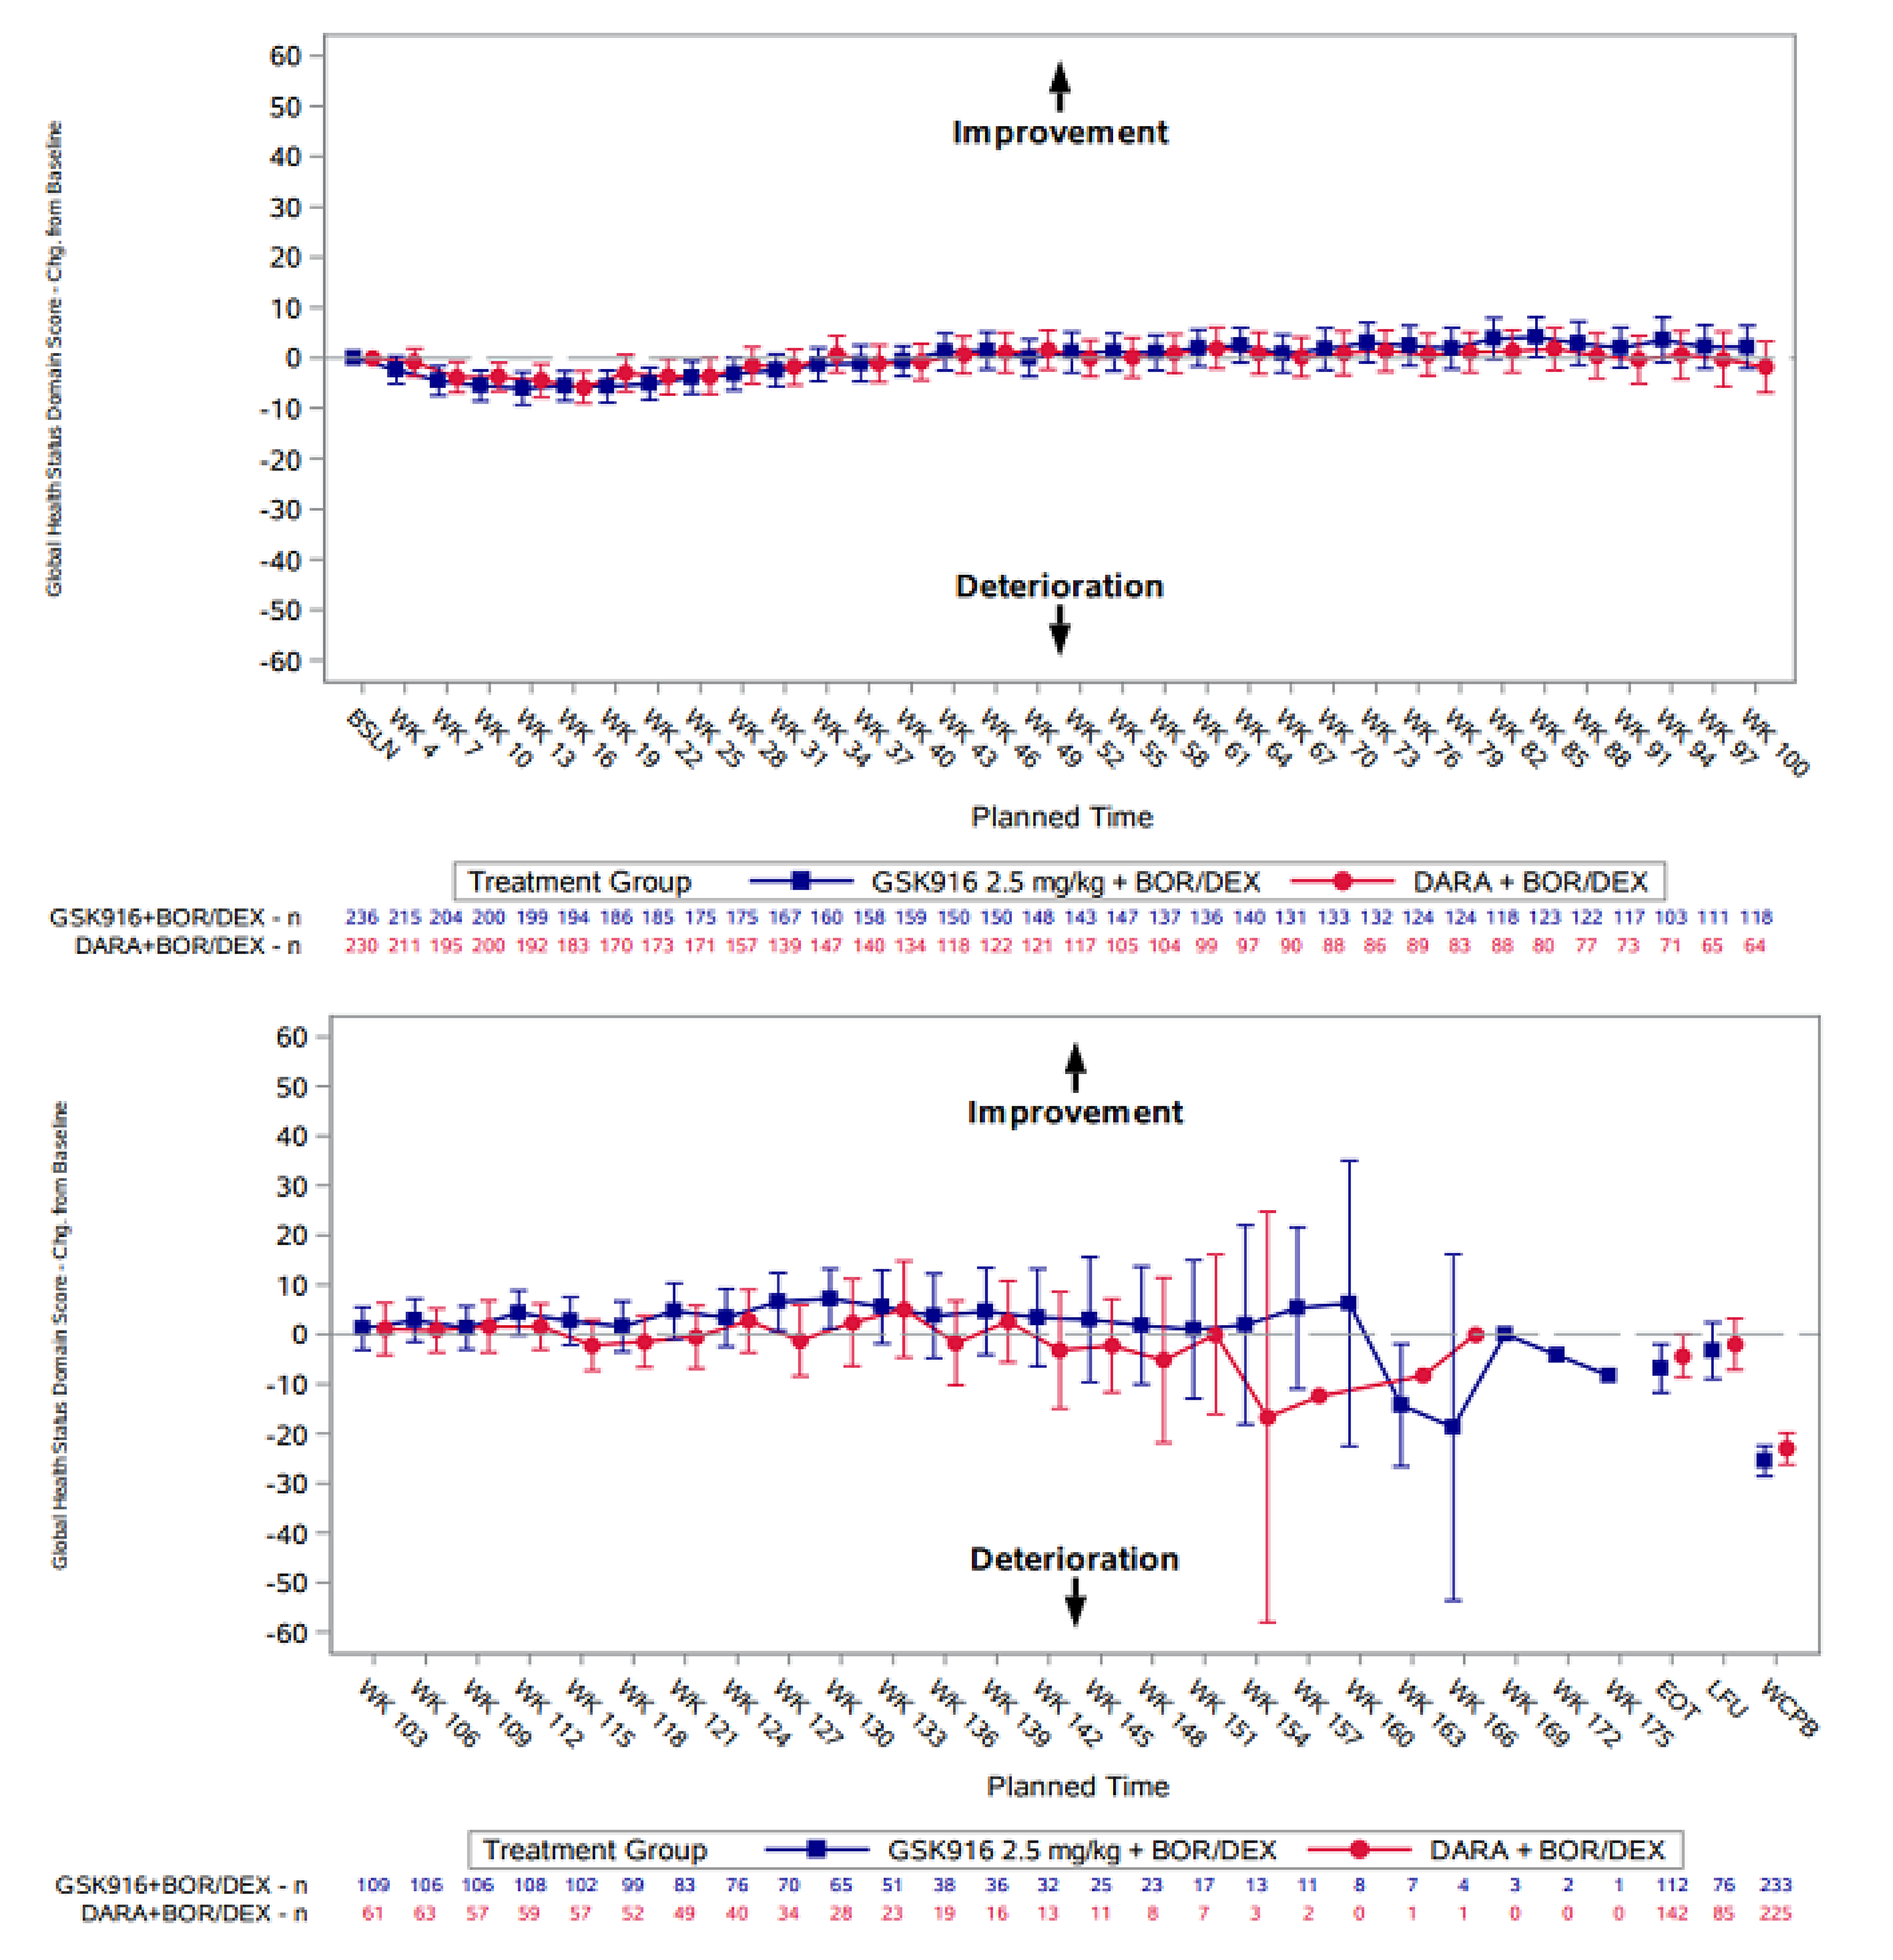
BOR = bortezomib; BSLN = baseline, chg = change; DARA = daratumumab; DEX = dexamethasone; EORTC QLQ-C30 = European Organisation for Research and Treatment of Cancer Quality of Life Questionnaire Core 30; EOT = end of treatment; GSK916 = belantamab mafodotin plus bortezomib and dexamethasone; ITT = intention to treat; LFU = last follow-up; QoL = quality of life; WCPB = worst case postbaseline; WK = week.
Notes: There were 2 participants in the ITT population who were randomized, not treated, rescreened, and rerandomized. They were counted as 4 unique participants in Figure 8.
The data cut-off date was October 2, 2023.
Source: Clinical Study Report for the DREAMM-7 study (2024).26
Table 21: Summary of Key Efficacy Results of the DREAM-7 Trial — ITT Population
Variable | IA1 | IA2 | ||
|---|---|---|---|---|
BVd group N = 243 | DVd group N = 251 | BVd group N = 243 | DVd group N = 251 | |
PFS per IRC assessment | ||||
PFS events, n (%) | 91 (37) | 158 (63) | ███ ████ | ███ ████ |
Progressive disease | 67 (28) | 139 (55) | ██ ████ | ███ ████ |
Death | 24 (10) | 19 (8) | ██ ████ | ██ ███ |
Censored, n (%) | 152 (63) | 93 (37) | ███ ██ | |
Censored, follow-up ended | 44 (18) | 41 (16) | ██ ████ | ██ ████ |
Censored, follow-up ongoing | 108 (44) | 52 (21) | ██ ████ | ██ ████ |
Reasons for censoring, n (%) | ||||
Date of last adequate assessment | ███ ████ | ██ ████ | NR | NR |
Date of randomization | | ███ | ██ ████ | NR | NR |
Last adequate assessment on or before new antimyeloma therapy | ██ ████ | ██ ████ | NR | NR |
Median PFS (95% CI), monthsa | 36.6 (28.4 to NE) | 13.4 (11.1 to 17.5) | ████ █████ ██ █████ | ████ █████ ██ █████ |
HRb (95% CI) | 0.41 (0.31 to 0.53) | ████ █████ ██ █████ | ||
Log-rank testc P value | < 0.00001 | NR | ||
Probability of being alive and progression-freem | ||||
At 12 months, % (95% CI) | 78.3 █████ ██ ████) | 53.3 (████ ██ ████) | ████ █████ ██ ███ | ████ █████ ██ █████ |
Absolute difference (95% CI) | ████ █████ ██ █████ | ████ █████ ██ ██████ | ||
At 18 months, % (95% CI) | 68.8 (████ ██ ████) | 42.8 (████ ██ ████) | ████ █████ ██ █████ | ████ █████ ██ █████ |
Absolute difference (95% CI) | ████ █████ ██ █████ | ████ █████ ██ ██████ | ||
At 24 months, % (95% CI) | NA | NA | ████ █████ ██ █████ | ████ █████ ██ █████ |
Absolute difference (95% CI) | NA | ████ █████ ██ ██████ | ||
At 36 months, % (95% CI) | NA | NA | ████ █████ ██ █████ | ████ █████ ██ █████ |
Absolute difference (95% CI) | NA | ████ █████ ██ █████ | ||
OS per IRC assessment | ||||
Censored, follow-up ended, n (%) | 20 (8) | 28 (11) | ██ ████ | ██ ████ |
Alive date obtained, n (%) | | ███ | ██ ███ | ██ ███ | ██ ███ |
No alive date obtained, n (%) | ██ ███ | ██ ███ | ██ ███ | ██ ███ |
Censored, follow-up ongoing, n (%) | 169 (70) | 136 (54) | ███ ████ | ███ ████ |
Died (event), n (%) | 54 (22) | 87 (35) | 68 (28) | 103 (41) |
HRa (95% CI) | 0.57 (0.40 to 0.80) | 0.58 (0.43 to 0.79) | ||
P value | 0.00049g | 0.00023h | ||
Probability of being alivem | ||||
At 12 months, % (95% CI) | 86.5 (81.5 to 90.3) | 80.7 (75.2 to 85.1) | 86.5 (81.5 to 90.3) | 80.7 (75.2 to 85.1) |
Absolute difference (95% CI) | ███ █████ ██ █████ | ███ █████ ██ ██████ | ||
At 18 months, % (95% CI) | 83.9 (78.6 to 88.0) | 72.6 (66.5 to 77.8) | 83.9 (78.6 to 88.0) | 72.6 (66.5 to 77.8) |
Absolute difference (95% CI) | ████ ████ ██ █████ | ████ ████ ██ ██████ | ||
At 24 months, % (95% CI) | NA | NA | 79.0 (73.2 to 83.7) | 67.4 (61.0 to 73.0) |
Absolute difference (95% CI) | NA | ████ ████ ██ █████ | ||
At 36 months, % (95% CI) | NA | NA | 71.4 (67.9 to 79.2) | 60.2 (53.6 to 66.2) |
Absolute difference (95% CI) | NA | ████ ████ ██ █████ | ||
RMDoR per IRC assessment | ||||
RMDoR estimates at t* (27.8), months (95% CI)d | 19.0 (17.7 to 20.4) | 13.2 (11.8 to 14.6) | NR | NR |
Absolute difference (95% CI) | ███ █████ ██ █████ | NR | NR | |
Between-group difference in RMDoR at t* (27.8), months (95% CI)d | 5.9 (4.0 to 7.8) | NR | ||
Ratio of RMDoR at t* (27.8 months),d (95% CI) | ████ █████ ██ █████ | NR | ||
RMST teste P valuef | < 0.00001 | NR | ||
DoR | ||||
Patients contributing to the analysis, n | 201 | 179 | 202 | 179 |
Progressed or died (event), n (%) | 68 (34) | 105 (59) | 86 (43) | 114 (64) |
Disease progression | ██ ████ | ██ ████ | ██ ████ | ███ ████ |
Death | ██ ███ | | ███ | ██ ███ | | ███ |
Censored, follow-up ended, n (%) | 27 (13) | 22 (12) | ██ ████ | ██ ████ |
Censored, follow-up ongoing, n (%) | 106 (53) | 52 (29) | ██ ████ | ██ ████ |
Median DoR (95% CI), monthsa | 35.6 (30.5 to NE) | 17.8 (13.8 to 23.6) | 40.8 (30.5 to NE) | 17.8 (13.8 to 23.6) |
Probability of maintaining response | ||||
At 12 months, % (95% CI) | 83.3 (77.1 to 87.9) | 61.2 (53.4 to 68.0) | 83.3 (77.1 to 87.9) | 61.2 (53.4 to 68.0) |
Absolute difference (95% CI) | ████ █████ ██ █████ | ████ █████ ██ █████ | ||
At 18 months, % (95% CI) | 75.6 (68.6 to 81.3) | 49.1 (41.3 to 56.5) | 75.6 (68.6 to 81.3) | 49.1 (41.3 to 56.5) |
Absolute difference (95% CI) | ████ █████ ██ █████ | ████ █████ ██ █████ | ||
At 24 months, % (95% CI) | NA | NA | ████ █████ ██ █████ | ████ █████ ██ █████ |
Absolute difference (95% CI) | NA | ████ █████ ██ █████ | ||
At 36 months, % (95% CI) | NA | NA | ████ █████ ██ █████ | ████ █████ ██ █████ |
Absolute difference (95% CI) | NA | ████ █████ ██ █████ | ||
MRD negativity rate by best response per IRC assessment | ||||
sCR and CR | ||||
Patients with sCR with MRD data, N | 60 | 24 | 61 | 26 |
MRD negativity rate, % (95% CI) | 24.7 (19.4 to 30.6) | 9.6 (6.2 to 13.9) | 25.1 █████ ██ █████ | 10.4 ████ ██ █████ |
P valuea, i | < 0.00001 | NR | ||
Absolute difference (95% CI) | ████ ████ ██ █████ | NR | ||
MRD negativity rate by best confirmed response per IRC assessment | ||||
sCR | ||||
Patients contributing to the analysis, N | 34 | 13 | NR | NR |
Number of sCR patients with MRD data | ██ | ██ | NR | NR |
MRD negativity rate, n (%) | ██ ██████ | | ██████ | NR | NR |
95% CI | █████ ██ █████ | █████ ██ █████ | NR | NR |
CR | ||||
Patients contributing to the analysis, N | 50 | 30 | NR | NR |
Number of CR patients with MRD data | ██ | ██ | NR | NR |
MRD negativity rate, n (%) | ██ ██████ | ██ ██████ | NR | NR |
95% CI | █████ ██ █████ | █████ ██ █████ | NR | NR |
CRR | ||||
CRR (sCR and CR), n (%) | 84 (34.6) | 43 (17.1) | 87 (35.8) | 44 (17.5) |
95% CI | 28.6 to 40.9 | 12.7 to 22.4 | 29.8 to 42.2 | 13.0 to 22.8 |
Between-group difference, % (95% CI)j | ████ ████ ██ █████ | ████ ████ ██ █████ | ||
ORR | ||||
Confirmed PR or better, n (%) | 201 (82.7) | 179 (71.3) | 202 (83.1) | 179 (71.3) |
95% CI | 77.4 to 87.3 | 65.3 to 76.8 | 77.8 to 87.6 | 65.3 to 76.8 |
Between-group difference, % (95% CI)j | ████ ████ ██ █████ | ████ ████ ██ █████ | ||
EORTC QLQ-C30 global health status score | ||||
Baseline | ||||
Patients contributing to the analysis, N | 236 | 230 | NR | |
Mean (SD) | ████ ██████ | ████ ██████ | NR | |
Week 43 | ||||
Patients contributing to the analysis, N | ███ | ███ | NR | |
Improvement ≥ 10 points, n (%) | ██ ████ | ██ ████ | NR | |
Mean (SD) | ████ ██████ | ████ ██████ | NR | |
Change from baseline, LSM (SE) | ████ █████ | ████ █████ | NR | |
LSM difference (95% CI)j, l | ███ █████ ██ ████ | NR | ||
Week 121 | ||||
Patients contributing to the analysis, N | ██ | ██ | NR | |
Improvement ≥ 10 points, n (%) | ██ ████ | ██ ████ | NR | |
Mean (SD) | ████ ██████ | ████ ██████ | NR | |
Change from baseline, LSM (SE) | ███ █████ | ████ █████ | NR | |
LSM difference (95% CI)j, l | ███ █████ ██ ████ | NR | ||
End of treatment | ||||
Patients contributing to the analysis, N | ███ | ███ | NR | |
Improvement ≥ 10 points, n (%) | ██ ████ | ██ ████ | NR | |
Mean (SD) | ████ ██████ | ████ ██████ | NR | |
Change from baseline, mean (SD) | ████ ██████ | ████ ██████ | NR | |
BVd = belantamab mafodotin plus bortezomib and dexamethasone; CDA-AMC = Canada’s Drug Agency; CI = confidence interval; CR = complete response; CRR = complete response rate; DoR = duration of response; DVd = daratumumab plus bortezomib and dexamethasone; EORTC QLQ-C30 = European Organisation for Research and Treatment of Cancer Quality of Life Questionnaire Core 30; HR = hazard ratio; IA1 = interim analysis 1; IA2 = interim analysis 2; IRC = independent review committee; ITT = intention to treat; LSM = least squares mean; KM = Kaplan-Meier; MRD = minimal residual disease; NA = not available; NE = not estimable; NR = not reported; ORR = overall response rate; OS = overall survival; PFS = progression-free survival; PR = partial response; R-ISS = Revised International Staging System; RMDoR = restricted mean duration of response; RMST = restricted mean survival time; sCR = stringent complete response; SD = standard deviation; SE = standard error; t* = common truncation time.
Notes: There were 2 participants in the ITT population who were randomized, not treated, rescreened, and rerandomized. They were counted as 4 unique participants.
The data cut-off dates were October 2, 2023, for IA1 and October 7, 2024, for IA2.
aCIs were estimated using the Brookmeyer-Crowley method.
bHRs were estimated using a Cox proportional hazards model stratified by the number of lines of prior therapy (1 versus 2 or 3 versus ≥ 4), prior bortezomib use (no or yes), and R-ISS at screening (stage I versus stage II or stage III), with a covariate of treatment.
cThe P value was from a 1-sided stratified log-rank test.
dT* was calculated using the algorithm defined in Huang and Tian.70
eRMDoR for a treatment group was the difference between the KM curves of PFS, and response or PFS. The comparison of RMDoR between the 2 treatment groups was based on a 1-sided z test at the overall 2.5% level of significance.
fThe 1-sided P value was from a mean DoR test.
gThe P value was nominal, derived from a 1-sided stratified log-rank test.
hThe P value was from a 1-sided stratified log-rank test. At 171 actual events (a 48.2% OS information fraction), OS was declared significant if the P value was less than 0.00112.
iThe MRD negativity rate was compared between treatment groups using an unadjusted Fisher exact test. CIs were based on the exact method. Patients without an MRD assessment were assumed to be nonnegative.
jCIs were based on the exact method. The CIs were not adjusted for multiplicity and cannot be used in place of hypothesis testing.
kVisits were included in the model only if the number of patients with analyzable data at the current time point was at least 10 in both treatment groups.
lAnalysis was performed using a mixed model of repeated measures with covariates of treatment group, visit, baseline value, treatment-by-visit interactions, and baseline-value-by-visit interactions.
mWithin-group probabilities were estimated using the KM method, as specified in the statistical analysis plan. The between-group estimates were calculated using the KM method at the request of CDA-AMC.
Sources: Clinical Study Report for the DREAMM-7 study (2024) 26 and Clinical Study Report Addendum (Interim Analysis 2) for the DREAMM-7 study (2025).27 Details included in the table are from the sponsor’s Summary of Clinical Evidence.
Harms
A summary of harms reported in the safety population in the DREAMM-7 trial is provided in Table 22.
Adverse Events
In the DREAMM-7 trial, all patients in both groups experienced at least 1 AE. The most common AEs of any grade in the BVd group included thrombocytopenia, blurred vision, dry eye, photophobia, foreign body sensation in eyes, and eye irritation. At the time of IA1, 95% of patients in the BVd group and 78% of patients in the DVd group had experienced at least 1 AE of grade 3 or higher. The most common AEs of grade 3 or higher in the BVd group were thrombocytopenia (55% in the BVd group versus 35% in the DVD group), blurred vision (22% in the BVd group versus less than 1% in the DVD group), decreased platelet count (18% in the BVd group versus 11% in the DVD group), neutropenia (12% in the BVd group versus 6% in the DVD group), and pneumonia (12% in the BVd group versus 4% in the DVD group). The population with an AE of grade 3 or higher was not reported at IA2.
Serious Adverse Events
At the time of IA1, a higher proportion of patients in the BVd group had experienced at least 1 SAE compared to those in the DVd group (50% versus 37%, respectively). The most common SAEs in the BVd and DVd groups were pneumonia (11% versus 4%, respectively), COVID-19 (5% versus 4%, respectively), pyrexia (5% versus 4%, respectively), and COVID-19 pneumonia (93% in both groups). The IA2 data on SAEs were not available at the time of submission to CDA-AMC.
Withdrawals Due to Adverse Events
At the time of IA1 and IA2, a higher proportion of patients in the BVd group had discontinued treatment due to AEs compared to those in the DVd group (31% versus 19%, and 32% versus 19%, respectively). At the time of IA2, the most common reason for discontinuation was peripheral sensory neuropathy (6%) in the BVd group and peripheral neuropathy (4%) in the DVd group. At the time of IA1 and IA2, a higher proportion of patients in the BVd group had experienced a dose reduction compared to those in the DVd group (75% versus 59%, respectively). The most common reasons for dose reduction in the BVd group were thrombocytopenia, peripheral sensory neuropathy, blurred vision, and peripheral neuropathy. At the time of IA1 and IA2, a higher proportion of patients in the BVd group had experienced a dose interruption or delay of study treatment compared to the DVd group (94% versus 75%, and 95% versus 76%, respectively). The most common reasons for dose interruption or delay in the BVd group were thrombocytopenia, blurred vision, COVID-19, dry eye, photophobia, and eye irritation.
Mortality
At the time of IA1, deaths were reported in 21% of patients in the BVd group and in 31% of patients in the DVd group. The majority of deaths in both groups was attributed to cancer, with 7% in the BVd group and 19% in the DVd group. Fatal SAEs were reported in 10% of patients in the BVd group and 8% of patients in the DVd group. At the time of IA2, using the October 7, 2024, data cut-off, deaths were reported in 29% of patients in the BVd group and in 41% of patients in the DVd group.
Notable Harms
At the time of IA1 and IA2, a higher proportion of patients in the BVd group had experienced at least 1 ocular AE of any grade compared to the DVd group (79% versus 29%, ███ ███ ██████ ████ respectively). Blurred vision and dry eye were reported in more than half of the patients in this treatment group. Ocular AEs in the BVd group were more severe, with ███ classified as grade 3 or grade 4 while the majority in the DVd group were classified as grade 1 (███). At the time of IA2, treatment discontinuations due to ocular AEs were reported in ██ of patients in the BVd group compared to none in the DVd group. Treatment modifications due to corneal AEs were more common in the BVd group, with 52% of patients experiencing ocular AEs having doses interrupted, delayed, or reduced compared to only 2% in the DVd group.
At the time of IA1, investigator-assessed corneal events and BCVA events, as evaluated by the KVA scale, had been reported exclusively in patients in the BVd group. At the time of IA1, 201 (83%) patients in the BVd group had an incidence of corneal events (overall KVA grade). The severity of the corneal events was high, with ███ of the 201 patients classified as grade 3 and ███ as grade 4. Most corneal events were managed through dose modifications, with 89% of affected patients having doses interrupted or delayed, and 31% of affected patients experiencing dose reductions. The incidence of BCVA events, as evaluated by the KVA scale, was ███ in the BVd group, with the majority of findings classified as grade 2. Most patients required a dose interruption or delay due to a BCVA event while only a few patients needed to discontinue study treatment. Specifically, 87% of patients experienced a dose interruption or delay while 6% of patients discontinued the study treatment. The population with investigator-assessed corneal and BCVA events was not reported at IA2.
At the time of IA1 and IA2, a higher proportion of patients in the BVd group had experienced thrombocytopenia compared to those in the DVd group (87% versus 65%, and 88% versus 65%, respectively). At the time of IA2, of the 212 patients in the BVd group and 160 patients in the DVd group who had experienced thrombocytopenia, grade 3 and grade 4 thrombocytopenia were more frequent in the BVd group (83%) compared to the DVd group (71%). Thrombocytopenia events of grade 4 were reported in 53% of patients receiving BVd versus 33% of patients receiving DVd. In the DREAMM-7 trial, ███ of patients in the BVd group and ██ in the DVd group had received platelet transfusions. At the time of IA2, despite the high incidence, few patients ███ ██ █████ in either group had experienced SAEs related to thrombocytopenia, and treatment discontinuation rates due to thrombocytopenia were low (██ in the BVd group and ██ in the DVD group). Dose reductions and interruptions or delays were more common in the BVd group compared to the DVd group (43% versus 20%, and 53% versus 39%, respectively).
At the time of IA1, neutropenia was reported in ███ of patients in the BVd group and ███ of patients in the DVd group. Among patients who had experienced neutropenia AEs, most in both the BVd and DVd groups had grade 3 events (███ ██████ ████ respectively). Neutropenia events of grade 4 were more common in the BVd group (███) compared to the DVd group (███). The neutropenia events were manageable with dose modifications (including dose reductions and delays or interruptions), and no patients in either treatment group discontinued study treatment due to neutropenia events. The population with neutropenia events was not reported at IA2. At the time of IA1, a higher proportion of patients in the DVd group had experienced infusion-related reactions (███) compared to the BVd group (██), with more than ███ of patients in both treatment groups having grade 2 events.
Table 22: Summary of Harms Results From the DREAMM-7 Trial — Safety Population
AE | IA1 | IA2 | ||
|---|---|---|---|---|
BVd group (N = 242) | DVd group (N = 246) | BVd group (N = 242) | DVd group (N = 246) | |
Most common AEs, n (%) | ||||
Patients with ≥ 1 AE | 242 (100) | 246 (100) | 242 (100) | 246 (100) |
Thrombocytopenia | 167 (69) | 122 (50) | 169 (70) | 122 (50) |
Vision, blurred | 160 (66) | 26 (11) | 165 (68) | 27 (11) |
Dry eye | 123 (51) | 17 (7) | 129 (53) | 19 (8) |
Photophobia | 114 (47) | 6 (2) | 120 (50) | 6 (2) |
Eye irritation | 103 (43) | 13 (5) | 111 (46) | 12 (5) |
Foreign body sensation in eyes | 106 (44) | 10 (4) | 111 (46) | 12 (5) |
AEs of grade 3 or higher | 230 (95) | 192 (78) | NR | NR |
Thrombocytopenia | 134 (55) | 87 (35) | NR | NR |
Vision, blurred | 53 (22) | 2 (< 1) | NR | NR |
Platelet count, decreased | 44 (18) | 26 (11) | NR | NR |
Neutropenia | ██ ████ | ██ ███ | NR | NR |
Pneumonia | 28 (12) | 10 (4) | NR | NR |
Gamma-glutamyltransferase, increased | 22 (9) | 4 (2) | NR | NR |
Alanine aminotransferase, increased | 14 (6) | 3 (1) | NR | NR |
SAEs in ≥ 2% patients, n (%) | ||||
Patients with ≥ 1 SAE | 121 (50) | 90 (37) | NR | NR |
Pneumonia | 27 (11) | 10 (4) | NR | NR |
COVID-19 | 11 (5) | 10 (4) | NR | NR |
Pyrexia | 12 (5) | 9 (4) | NR | NR |
COVID-19 pneumonia | 8 (3) | 8 (3) | NR | NR |
Thrombocytopenia | | ███ | | ███ | NR | NR |
Anemia | 4 (2) | 3 (1) | NR | NR |
Patients who stopped treatment due to AEs, n (%) | ||||
Patients with ≥ 1 AE | 75 (31) | 46 (19) | 77 (32) | 47 (19) |
Peripheral sensory neuropathy | 13 (5) | 6 (2) | 14 (6) | 6 (2) |
Pneumonia | 9 (4) | 0 (0) | 9 (4) | 0 (0) |
Polyneuropathy | 7 (3) | 5 (2) | 7 (3) | 5 (2) |
Neuropathy, peripheral | 6 (2) | 11 (4) | 6 (2) | 11 (4) |
Thrombocytopenia | | ███ | | ██ ██ | | ███ | | ██ ██ |
Vision, blurred | 5 (2) | 0 (0) | 5 (2) | 0 (0) |
COVID-19 | 3 (1) | 4 (2) | 3 (1) | 4 (2) |
COVID-19 pneumonia | 2 (< 1) | 5 (2) | 2 (< 1) | 5 (2) |
Sepsis | 2 (< 1) | 3 (1) | 2 (< 1) | 3 (1) |
AEs leading to dose reduction in ≥ 2% patients, n (%) | ||||
Patients with ≥ 1 AE | 182 (75) | 146 (59) | 182 (75) | 146 (59) |
Thrombocytopenia | 67 (28) | 24 (10) | 69 (29) | 24 (10) |
Peripheral sensory neuropathy | 33 (14) | 31 (13) | 33 (14) | 31 (13) |
Blurred vision | 27 (11) | 2 (< 1) | 27 (11) | 2 (< 1) |
Neuropathy, peripheral | 24 (10) | 33 (13) | 24 (10) | 33 (13) |
Platelet count, decreased | 22 (9) | 8 (3) | 22 (9) | 8 (3) |
Insomnia | 12 (5) | 13 (5) | 12 (5) | 13 (5) |
Polyneuropathy | 9 (4) | 8 (3) | 9 (4) | 8 (3) |
AEs leading to dose interruption or delay of study treatment in ≥ 3% patients, n (%) | ||||
Patients with ≥ 1 AE | 228 (94) | 185 (75) | 229 (95) | 186 (76) |
Thrombocytopenia | 85 (35) | 50 (20) | 85 (35) | 50 (20) |
Vision, blurred | 80 (33) | 1 (< 1) | 86 (36) | 1 (< 1) |
COVID-19 | 37 (15) | 27 (11) | 38 (16) | 30 (12) |
Dry eye | 33 (14) | 0 (0) | 36 (15) | 0 (0) |
Photophobia | 33 (14) | 0 (0) | 40 (17) | 0 (0) |
Eye irritation | 32 (13) | 0 (0) | 35 (14) | 0 (0) |
Foreign body sensation in eyes | 30 (12) | 0 (0) | 35 (14) | 0 (0) |
Platelet count, decreased | 28 (12) | 13 (5) | 28 (12) | 13 (5) |
Deaths, n (%) | ||||
Patients who dieda | 50 (21) | 77 (31) | 69 (29) | 101 (41) |
Cancer | 18 (7) | 46 (19) | 23 (10) | 53 (22) |
Equivocally due to MM | 2 (< 1) | 7 (3) | 3 (1) | 7 (3) |
Unequivocally due to MM | 16 (7) | 37 (15) | 19 (8) | 44 (18) |
Other cancer | 0 | 2 (< 1) | 1 (< 1) | 2 (< 1) |
Hemorrhage | 4 (2) | 2 (< 1) | NR | NR |
Cardiovascular condition | 2 (< 1) | 1 (< 1) | 8 (3) | 4 (2) |
Sepsis | 6 (2) | 4 (2) | 8 (3) | 4 (2) |
Stroke | 0 (0) | 1 (< 1) | 0 (0) | 1 (< 1) |
Other noncardiovascular cause | 19 (8) | 21 (9) | 24 (10) | 25 (10) |
AEs of special interest, n (%) | ||||
Patient with ≥ 1 ocular AEb | 191 (79) | 72 (29) | ███ ████ | ██ ████ |
Grade 1 | 42 (22) | 44 (61) | 42 (22) | 44 (61) |
Grade 2 | 67 (35) | 21 (29) | 67 (35) | 21 (29) |
Grade 3 | ██ ████ | 6 (8) | ██ ████ | 7 (9) |
Grade 4 | | ███ | 1 (1) | | ███ | 1 (1) |
Grade 3 and grade 4 | 82 (34) | 7 (3) | NR | NR |
Vision, blurred | 53 (22) | 2 (< 1) | NR | NR |
Dry eye | 17 (7) | 0 | NR | NR |
Visual impairment | 13 (5) | 1 (< 1) | NR | NR |
Eye irritation | 12 (5) | 0 | NR | NR |
Investigator-assessed corneal events by the KVA scale | 201 (83) | NR | NR | NR |
Grade 1 | 10 (5) | NR | NR | NR |
Grade 2 | 19 (9) | NR | NR | NR |
Grade 3 | ███ ████ | NR | NR | NR |
Grade 4 | ██ ████ | NR | NR | NR |
Investigator-assessed BCVA events by the KVA scale | ███ ████ | NR | NR | NR |
Grade 1 | 16 (8) | NR | NR | NR |
Grade 2 | 52 (27) | NR | NR | NR |
Grade 3 | 119 (61) | NR | NR | NR |
Grade 4 | 9 (5) | NR | NR | NR |
Thrombocytopenia | 211 (87) | 160 (65) | 212 (88) | 160 (65) |
Serious | 11 (5) | 4 (2) | 11 (5) | 4 (2) |
Grade 1 | 11 (5) | 15 (9) | 11 (5) | 15 (9) |
Grade 2 | 24 (10) | 32 (13) | 25 (10) | 32 (13) |
Grade 3 | 63 (26) | 60 (24) | 63 (26) | 60 (24) |
Grade 4 | 113 (47) | 53 (22) | 113 (47) | 53 (22) |
Neutropenia | 43 (18) | 41 (17) | NR | NR |
Serious | 1 (< 1) | 1 (< 1) | NR | NR |
Grade 1 | 2 (5) | 7 (17) | NR | NR |
Grade 2 | 7 (16) | 12 (29) | NR | NR |
Grade 3 | 21 (49) | 18 (44) | NR | NR |
Grade 4 | 13 (30) | 4 (10) | NR | NR |
Infusion-related reactions | | ███ | ██ ████ | NR | NR |
Ahenia | | ██ ██ | ██ | NR | NR |
Cough | | ██ ██ | | ███ | NR | NR |
Diarrhea | | ██ ██ | | ██ ██ | NR | NR |
Nausea | | ██ ██ | | ██ ██ | NR | NR |
Dyspnea | ██ | | ███ | NR | NR |
Bronchospasm | ██ | | ██ ██ | NR | NR |
Chills | ██ | | ██ ██ | NR | NR |
Abdominal pain | ██ | | ██ ██ | NR | NR |
AE = adverse event; BCVA = best corrected visual acuity; BVd = belantamab mafodotin plus bortezomib and dexamethasone; DVd = daratumumab plus bortezomib and dexamethasone; eCRF = electronic case report form; GSK = GlaxoSmithKline; IA1 = interim analysis 1; IA2 = interim analysis 2; KVA = Keratopathy and Visual Acuity; MM = multiple myeloma; NR = not reported; SAE = serious adverse event.
Note: Data cut-off date of October 2, 2023.
aThere were 3 patients with an unknown primary cause of death. One patient in the DVd group died due to disease progression; however, the death was erroneously assigned to “Other noncardiovascular causes.”
bOcular AEs are based on a hybrid of terms identified in the eCRF, and a list of terms identified by GSK internal review.
Sources: Clinical Study Report for the DREAMM-7 study (2024).26 Details included in the table are from the sponsor’s Summary of Clinical Evidence.
Critical Appraisal
Internal Validity
Randomization was performed using an appropriate methodology with adequate allocation concealment, and randomization stratification was prespecified. An interactive response methodology using a permuted block randomization scheme was used, and randomization with stratification was performed centrally, which typically has a low risk of bias. Overall, baseline patient and disease characteristics were balanced. The open-label design introduced a potential bias in the assessment of ORR, PFS, DoR, and CRR; however, this bias was mitigated by the use of a blinded IRC for disease assessment. Knowledge of the assigned treatment could have led to bias in the reporting and measurement of subjective outcomes, including patient-reported outcomes (e.g., HRQoL) and subjective AEs. However, the extent and direction of bias due to treatment knowledge is uncertain. A physician’s knowledge of their patient’s assigned treatment may influence how they manage the patient, while patients’ awareness of their assigned treatment may impact their likelihood of staying in the study. There was a moderately increased and imbalanced loss to follow-up across groups (10% of patients in the BVd group and 16% of patients in the DVd group). Reasons were similar across groups but were limited in their description (i.e., withdrawal by participant, physician decision, or loss to follow-up). This did not appear to have an important impact on the assessment of PFS and OS.
Based on the enrolled sample size, the study was powered to test its primary and key secondary end points. The analyses of primary and key secondary outcomes were conducted using the ITT population, which maintains randomization and minimizes the risk of bias by comparing groups with similar prognostic factors. Statistical analysis methods appear to be acceptable. Both interim analyses were planned a priori. A hierarchical testing strategy to sequentially test the primary and secondary outcomes was used to reduce the risk of type I error across these analyses. At the time of the first interim analysis, the weighted Bonferroni procedure was applied across OS and DoR, which is deemed conservative in controlling type I error. Results for the primary outcome were based on a prespecified interim analysis (249 PFS events), which occurred at an 89% information fraction, relative to the planned final PFS analysis (280 PFS events). The OS data were informed by a small information fraction (35% at IA2) at both interim analyses, and the median OS was not reached in either treatment group. Because the study outcomes are based on interim analyses, there is a risk that the effect of BVd compared with DVd is overestimated, particularly for OS; however, the existence and extent of any overestimation remains uncertain.20-22 In addition, there is uncertainty as to whether the PFS benefits (as a surrogate outcome for OS) will translate into survival benefits. PFS reflects tumour growth and can be assessed before determining a survival benefit, without being influenced by subsequent therapies.49 The US FDA considers the treatment effect measured by PFS as a potential surrogate end point to support accelerated drug approval.49 However, data are insufficient to robustly evaluate the correlation between treatment effects on OS and PFS in clinical trials.49,72 Given that the results at the data cut-off represent interim analyses for OS and are based on a limited information fraction, longer-term follow-up is needed to inform the true effect of BVd compared with DVd on survival.
Patients were allowed to receive posttreatment anticancer medications after discontinuing study treatment, which could influence the assessment of OS. A sensitivity analysis was planned to adjust for posttreatment anticancer medications, but the results were not reported. The subsequent treatments were not balanced between groups; this is expected because fewer patients progressed in the DVd group. There was a higher proportion of patients censored whose follow-up had ended in the analysis of PFS; the primary reason was the initiation of new antimyeloma therapy. Most of the censoring reasons were addressed in supplemental analyses that applied different censoring rules. The results for PFS were robust to these supplemental analyses and several sensitivity analyses. The results for the proportional hazards assumption were reported only for the PFS analysis, indicating insufficient evidence to suggest a violation of the assumption. Subgroup analyses were prespecified and conducted only for PFS; however, there was no multiplicity control for the subgroup analyses. Most subgroup results for PFS were consistent with the primary analysis, favouring BVd, although some of these analyses were limited by small sample sizes. DoR was analyzed based on the RMDoR, using a nonparametric approach, which was deemed appropriate.
Protocol deviations were reported in 78% to 63% of patients across the 2 treatment groups, and the proportion of protocol deviations was comparable between groups and identified before the database lock date. A large number of patients in the DREAMM-7 trial discontinued treatment, with fewer discontinuations (both from monotherapy and combination therapy) in the BVd group (66%) compared to the DVd group (78%). The clinical experts consulted indicated that the main reasons for treatment discontinuation (disease progression and AEs) were as expected, with ocular toxicity being the main concern associated with belantamab treatment. They also noted that several strategies have been developed to manage the ocular toxicity of belantamab and prevent permanent drug discontinuation. These strategies include the reduction of doses, the delay of treatments, the early detection of corneal toxicity, and the use of cooling masks. The BVd group had longer exposure to the study drug than the DVd group; therefore, differences in treatment discontinuation and exposure between the study groups may have influenced the interpretation of harms outcomes. In the DREAMM-7 trial, dose modifications were not permitted for daratumumab whereas dose modifications and delays were allowed for belantamab.
HRQoL was assessed only on the evaluable data with missing assessments handled implicitly based on a missing at random assumption. No strong conclusions could be drawn about the effect of BVd compared with DVd on HRQoL due to a high risk of attrition bias, particularly at longer follow-up. Including only evaluable patients in the model can introduce selection bias because this group may not be representative of the overall patient population. For example, patients who drop out or are excluded due to missing data or other factors may differ significantly from those who remain in the study, potentially skewing the results. The analysis method for HRQoL outcomes relied on the likely implausible assumption that data were missing at random, and no sensitivity analyses were conducted to assess robustness to different missingness mechanisms.
External Validity
According to the clinical experts consulted by CDA-AMC for this review, the patient population in the DREAMM-7 trial generally reflects patients in clinical practice in this setting. A total of 20.7% of the patients in the DREAMM-7 trial did not pass screening, primarily due to an inability to meet eligibility criteria. However, clinical experts consulted did not identify any major concerns regarding generalizability. Patients were eligible for inclusion in the DREAMM-7 trial if they met 1 of the measurability parameters, including having a serum M protein concentration of 0.5 g/dL or higher. The clinical experts noted that some patients with serum M protein concentration below 0.5 g/dL would still be eligible for the treatment with BVd in clinical practice. The clinical experts indicated that the exclusion criteria of the DREAMM-7 trial are consistent with clinical practice. However, the clinical experts viewed the exclusion of patients who were refractory to daratumumab as inappropriate because this does not align with clinical practice, where daratumumab is not commonly used as a comparator. They also noted that while daratumumab is a suboptimal comparator for belantamab, it was considered an appropriate comparator at the time the DREAMM-7 trial was designed. The clinical experts noted that bortezomib was administered twice a week in the trial (day 1, day 4, day 8, and day 11) whereas in clinical practice in Ontario, it is typically administered once a week for patient convenience. However, the clinical experts did not view this difference as a concern because efficacy and tolerability are generally comparable between the 2 dosing schedules.
According to the clinical experts consulted, the demographic and disease characteristics of the DREAMM-7 trial population were reflective of patients living in Canada with RRMM. The mean age of patients in the DREAMM-7 trial was 64 years, with clinical experts noting that in the real-world setting, transplant-eligible patients would likely be younger while patients with relapsed or refractory disease would typically be older. Most patients were white and not of Hispanic or Latino ethnicity; however, the clinical experts noted that this would not limit generalizability to patients in clinical practice in Canada. Most patients in the DREAMM-7 trial had an ECOG PS score of 0 or 1, and an R-ISS score of stage I and stage II. The clinical experts consulted indicated that this would be reflective of clinical practice in the second-line setting, but not in later relapse. As a result, the trial findings may be less generalizable to patients with more advanced disease or poorer performance status. They also pointed out that clinicians would prescribe belantamab to patients with an ECOG PS score of 2 and an R-ISS score of stage III. Although BVd is indicated for the treatment of patients with MM who have received at least 1 prior line of therapy, more patients in the trial had received 1 prior line of therapy (50.6%), and fewer had received 2 (23.7%) or 3 (14.2%) prior lines of therapy. However, the clinical experts consulted indicated that the evidence for PFS across subgroups still suggests a benefit for patients who have received 2 or more prior lines of therapy. All patients in the DREAMM-7 trial were previously exposed to lenalidomide or thalidomide, which is consistent with clinical practice. Only 34% of patients in the trial were refractory to lenalidomide. The clinical experts indicated that, in the real-world setting, the proportion of patients who are refractory to lenalidomide in second-line therapy and beyond would be higher because it is commonly used as maintenance therapy after achieving a response to initial treatment. They also noted that these patients may have a poorer response to second-line or third-line treatments compared to those who are not refractory to lenalidomide. According to clinical experts, in real-world settings, a proportion of relapsed patients are expected to be anti-CD38 refractory — a scenario that was not represented in the trial population. As a result, the DREAMM-7 trial population could overestimate treatment effectiveness and limit the generalizability of the trial results to a broader real-world population.
The clinical experts consulted by CDA-AMC for this review did not have any major concerns with the end points used in the trial. According to the clinical experts and patient and clinician group input, OS, PFS, clinical response outcomes, and HRQoL are the most important outcomes for assessing the response to treatment. Because the DREAMM-7 trial is ongoing, final OS data are not yet available. The difference in HRQoL outcomes between the groups was not formally assessed, which precludes definitive conclusions from being drawn about this important outcome. The analyses were performed in the HRQoL-evaluable population of patients who had evaluable assessment at baseline and follow-up time points, which limits the generalizability of the results.
In the DREAMM-7 trial, the study population was drawn from a number of sites around the globe, including Canada. The clinical experts indicated that there are no major concerns with generalizing the findings from the trial to the clinical setting in Canada.
GRADE Summary of Findings and Certainty of the Evidence
Methods for Assessing the Certainty of the Evidence
For pivotal studies and RCTs identified in the sponsor’s systematic review, GRADE was used to assess the certainty of the evidence for outcomes considered most relevant to inform expert committee deliberations, and a final certainty rating was determined as outlined by the GRADE Working Group:23,24
“High certainty: We are very confident that the true effect lies close to that of the estimate of the effect.
Moderate certainty: We are moderately confident in the effect estimate — The true effect is likely to be close to the estimate of the effect, but there is a possibility that it is substantially different. We use the word ‘likely’ for evidence of moderate certainty (e.g., ‘X intervention likely results in Y outcome’).
Low certainty: Our confidence in the effect estimate is limited — The true effect may be substantially different from the estimate of the effect. We use the word ‘may’ for evidence of low certainty (e.g., ‘X intervention may result in Y outcome’).
Very low certainty: We have very little confidence in the effect estimate — The true effect is likely to be substantially different from the estimate of effect. We describe evidence of very low certainty as ‘very uncertain.’”
Following the GRADE approach, evidence from the RCT started as high-certainty evidence and could be rated down for concerns related to study limitations (which refers to internal validity or risk of bias), inconsistency across studies, indirectness, the imprecision of effects, and publication bias.
When possible, certainty was rated in the context of the presence of an important (nontrivial) treatment effect; if this was not possible, certainty was rated in the context of the presence of any treatment effect (i.e., the clinical importance is unclear). In all cases, the target of the certainty of evidence assessment was based on the point estimate and where it was located relative to the threshold for a clinically important effect (when a threshold was available) or to the null. For this review, the target of the certainty of evidence assessment was based on the presence or absence of an important effect as informed by thresholds identified based on clinical expert input.
Results of GRADE Assessments
The GRADE assessments included an evaluation of the main outcomes considered important by clinicians, patient groups, and committee members.
Table 2 presents the GRADE summary of findings for BVd versus DVd in patients with MM.
Long-Term Extension Studies
No long-term extension studies were identified by the sponsor.
Indirect Evidence
Content in this section has been informed by materials submitted by the sponsor. The following has been summarized and validated by the review team.
Objectives for the Summary of Indirect Evidence
The DREAMM-773 trial provides comparative evidence of the efficacy of BVd compared with DVd in patients with RRMM who had received at least 1 line of therapy. In the absence of direct comparative data for belantamab versus other relevant comparators used in clinical practice, aside from DVd, the feasibility of conducting ITCs through an NMA was assessed. ITCs were deemed feasible and performed for the primary outcome of PFS and other outcomes of interest, including OS and ORR.
Description of Indirect Comparison
One report that included ITCs was supplied by the sponsor. It included an SLR and an NMA, comparing BVd with cyclophosphamide plus carfilzomib plus dexamethasone, CyVd, DVd, EVd, hKd, hkDd, IhKd, Kd, PanoVd, PVd, SVd, and Vd.
Based on the prespecified eligibility criteria as outlined in Table 23, the sponsor conducted an SLR to identify studies investigating the efficacy of interventions used in the management of patients with RRMM who had received at least 1 prior therapy. The literature search was carried out in December 2021, with updates in May 2023 and January 2024. Multiple databases were searched to identify clinical trials. The study screening, study selection, and data extraction were conducted by 2 independent reviewers. Any discrepancies between the 2 reviewers were resolved by a third senior reviewer. Studies identified from the systematic literature search were first screened based on the title and abstract. Full-text screening was then carried out for studies selected from the title and abstract screening stage. Two independent reviewers extracted data and assessed the risk of bias in the included studies using the Cochrane risk-of-bias assessment tool for randomized trials.74
The initial search strategy and the study selection criteria for the SLR were broad, incorporating comparators beyond those used in clinical practice in Canada to ensure relevance across multiple countries. At the full-text review stage, more restrictive selection criteria were applied. The list of studies identified in the SLR was narrowed down to include only studies with a connection to the DREAMM-7 study,73 and further refined to include only treatments approved by the US FDA or the European Medicines Agency, as well as any regimens that are likely to serve as future comparators to the DREAMM-7 study’s regimen (BVd). The studies included patients with documented MM who have been previously treated with at least 1 line of therapy and had experienced disease progression during or after their most recent treatment. Only RCTs, including both primary and post hoc analyses, were considered. The intervention and comparator could involve any therapy or combination of treatments used for the treatment of RRMM.
Table 23: Study Selection Criteria and Methods for ITCs Submitted by the Sponsor
Characteristic | Indirect comparison |
|---|---|
Population | Adults (aged 18 years and older) with documented MM, previously treated with at least 1 prior treatment, and with documented disease progression during or after most recent therapy |
Intervention | Any treatment or combination of treatments, including but not restricted to:
|
Comparator |
|
Outcome | Efficacy outcomes, including but not restricted to the following:
Safety outcomes, including but not restricted to the following:
|
Study designs | Primary and post hoc analyses of RCTs |
Publication characteristics |
|
Exclusion criteria | Population:
|
Intervention:
| |
Comparators: Dose finding or single intervention comparisons | |
Outcomes:
| |
Study design:
| |
Publication type: Narrative reviews, editorials, protocols, letters, notes, or comments | |
Language: Non-English language | |
Time frame: Studies published before 2008 | |
Databases searched |
|
Selection process | Titles and abstracts identified by the search strategy were independently assessed for possible eligibility by 2 reviewers. Those studies that did not meet eligibility criteria were excluded. For those records that were deemed potentially relevant, full texts were retrieved, and eligibility criteria applied. Any discrepancies between the 2 reviewers were resolved by a third senior reviewer. |
Data extraction process | Data from included studies was extracted into a comprehensive data extraction grid in Microsoft Excel. Initial data extraction was performed by a single reviewer and quality-checked for accuracy by a second reviewer; if any discrepancies existed, these were resolved by a third senior reviewer. |
Quality assessment | Risk-of-bias assessment was conducted using the revised Cochrane RoB 2 tool for individually randomized parallel group trials.75 |
Anti-CD38 = anti–Cluster of Differentiation 38; ADC = antibody-drug conjugate; AE = adverse event; ASCT = autologous stem cell transplant; cilta-cel = ciltacabtagene autoleucel; CLR-131 = iopofosine I-131; CR = complete response; CRS = cytokine release syndrome; DoR = duration of response; GSK = GlaxoSmithKline; GSK’916 = GlaxoSmithKline 916; HDAC = histone deacetylase; HLH/MAS = hemophagocytic lymphohistiocytosis/macrophage activation syndrome; ICANS = immune cell-associated neurotoxicity syndrome; ide-cel = idecabtagene vicleucel; INAHTA = International Network of Agencies for Health Technology Assessment; ITC = indirect treatment comparison; lete-cel = letetresgene autoleucel; MM = multiple myeloma; MR = minimal response; MRD = minimal residual disease; ORR = overall response rate; OS = overall survival; PD = progressive disease; PFS = progression-free survival; PFS2 = progression-free survival-2; PI = proteasome inhibitor; PR = partial response; RCT = randomized controlled trial; RoB 2 = risk of bias 2; RRMM = relapsed or refractory multiple myeloma; SAE = serious adverse event; sCR = stringent complete response; TRAEs = treatment-related adverse events; TTBR = time to best response; TTNT = time to next therapy; TTP = time to progression; TTSR = time to systemic response; TTTF = time to treatment failure; URTI = upper respiratory tract infection; VGPR = very good partial response.
Sources: Sponsor-submitted indirect treatment comparison report.76 Details included in the table are from the sponsor’s Summary of Clinical Evidence.
ITC Design
The primary objective of the ITC was to assess the comparative efficacy of BVd in a population matching the ITT population of the DREAMM-7 trial, relative to other comparators for which PFS data were available. The secondary objectives of the NMA were to assess the comparative efficacy of BVd in a population of prior lenalidomide-exposed patients, based on available data for OS and ORR, and in a population of lenalidomide-refractory patients, relative to comparators for which data were available for PFS and ORR.
The following outcomes were reported to address the objectives of the NMA: PFS, OS, and ORR for the ITT population, and PFS and ORR for the lenalidomide-exposed and lenalidomide-refractory populations. PFS was defined using IMWG guidelines25 as the time from randomization to the first documented disease progression or death due to any cause, whichever occurs first. OS was defined as the time from randomization to death due to any cause. ORR was defined as the percentage of patients with a confirmed PR or better (i.e., VGPR, CR, or sCR), in line with the IMWG response criteria25 and recorded by an IRC. To meet submission timelines, the number of outcomes was narrowed, excluding MRD negativity, CR or better, VGPR or better, and progression-free survival-2. OS was not analyzed for the lenalidomide-exposed or lenalidomide-refractory populations due to the absence of reported data in the CASTOR77,78 and LEPUS79 studies, which prevented the formation of a connected network.
ITC Analysis Methods
Bayesian NMAs were performed using random-effects or fixed-effects models for all analyses. A fixed-effects model was applied for the base-case analysis, a random-effects model was used for an exploratory analysis. For time-to-event end points, it was assumed that the treatment effect (log-HRs) follows a normal distribution. For binary end points, a standard binomial model with a logit link was used. The primary analysis was performed for PFS, OS, and ORR to assess the efficacy of BVd relative to comparators in the ITT population. The secondary analyses were performed for PFS and ORR to assess the efficacy of BVd relative to comparators in the lenalidomide-exposed and lenalidomide-refractory populations. Based on potential biases identified in the feasibility assessment, subgroup analyses were performed for PFS in patients with 1 prior line of therapy and high cytogenetic risk. The prior distributions for between-study heterogeneity were derived from the study by Turner et al.80 and were used as informative priors to directly inform the random-effects NMA. Convergence to the target posterior distributions was assessed using the Gelman-Rubin statistic.81 Convergence was monitored quantitatively using the latest implementation Gelman-Rubin diagnostic (Rhat) based on 4 chains. For each analysis, the goodness of fit to the model was assessed by using the deviance information criterion and residual deviance. The presence of clinical and methodological heterogeneity was assessed through a feasibility assessment in which the population and study characteristics were compared. The inconsistency assessment for the NMA evaluated the consistency between estimates from direct and indirect evidence. League tables were used to present the results of the pairwise comparisons from the NMA between treatments. The multi-NMA package version 0.7.0 and R version 4.2.1 or above via Rstudio were used to perform the analysis.
Table 24: ITC Analysis Methods
Method | Description |
|---|---|
Analysis methods | NMAs were performed within a Bayesian framework. A suitable burn-in and number of iterations of the Markov chain to estimate the parameters were selected, allowing for thinning if required. For time-to-event end points (PFS and OS), a normal distribution was assumed for the treatment effect (log-HRs) reported within each study. The results were reported using HRs with 95% CrIs. For the binary outcome of ORR, a binomial distribution was assumed for the treatment effect reported within each study. The results were reported using ORs with 95% CrIs. |
Priors: Time-to-event end points | Due to the sparsity of the networks (with only 1 study informing most treatment comparisons), the prior distribution for the between-study heterogeneity was elicited from the study by Turner et al. (2015),80 to directly inform a random-effects NMA. Given that all studies in the network were pharmacological vs. pharmacological, the prior for this comparison was used. |
Priors: Binary end points | A set of informative priors for between-study variance in studies with binomial outcomes developed by Turner et al.80 was used. Given that all studies being considered were pharmacological vs. pharmacological, the prior for this comparison was used to inform the random-effects NMA. For the outcome relating to number of patients (ORR), the generic prior in a general health care setting from Turner et al.80 was used. |
NMA model selection | The feasibility assessment for this NMA demonstrated that there is considerable heterogeneity between the studies included in the analyses, though there is only 1 study per link, which is not sufficient to reliably estimate between-study variances. Therefore, the primary analysis for this NMA considered a fixed-effects model. The random-effects model was considered as a secondary analysis. |
Assessment of model fit | For each analysis, the goodness of fit to the model was assessed by using the DIC and residual deviance. |
Assessment of consistency | The inconsistency assessment for the NMA evaluated the consistency between estimates from direct and indirect evidence. This was not possible due to the lack of closed loops. |
Assessment of convergence | Convergence to the target posterior distributions was assessed using the Gelman-Rubin statistic.81 In cases in which this statistic was larger than 1.1, the simulation was deemed to have not converged. To assist convergence, prior distributions were adjusted dependent on the end point and prior in question based on trial and error, and judging the best compromise between convergence and realistic priors that reflect the parameter they were based on. |
Outcomes |
|
Follow-up time points | Latest result or follow-up time point |
Construction of nodes | Treatment nodes distinguished between different combination therapies. |
Secondary analyses | Prior lenalidomide exposure and lenalidomide-refractory status have both been suggested as potential TEM for patients treated for RRMM. The following secondary analyses were performed to assess the impact of these factors on the efficacy of BVd relative to comparators:
|
Subgroup analysis | Number of prior therapies and cytogenetic risk have been shown to be TEMs. The impact of these were explored in subgroup analyses of:
|
Methods for pairwise meta-analysis | League tables were used to present the results of the pairwise comparisons from the NMA between treatments. |
BVd = belantamab mafodotin plus bortezomib and dexamethasone; CR = complete response; CrI = credible interval; DIC = deviance information criterion; HR = hazard ratio; IA = investigator assessed; IMWG = International Myeloma Working Group; IRC = independent review committee; ITC = indirect treatment comparison; log-HR = log–hazard ratio; NMA = network meta-analysis; OR = odds ratio; ORR = overall response rate; OS = overall survival; PFS = progression-free survival; RRMM = relapsed or refractory multiple myeloma; sCR = stringent complete response; TEM = treatment effect modifier; VGPR = very good partial response; vs. = versus.
Note: Several sensitivity and subgroup analyses were planned but deprioritized due to time constraints.
Sources: Sponsor-submitted indirect treatment comparison report.76 Details included in the table are from the sponsor’s Summary of Clinical Evidence.
Results of ITC
Summary of Included Studies
From the original and update searches, conducted in December 2021 and February 2024, respectively, 63 unique studies were identified from a total of 204 publications. No geographic regions were specified when conducting the SLR.
The feasibility assessment was originally conducted using the December 2021 SLR results. The evidence network was then reduced to include only studies with a connection to the DREAMM-7 treatment groups.26 Of the 47 studies identified, 16 studies investigating 17 treatments were found to form a connected network, anchored through 4 common treatments: Vd, hKd, Kd, and DVd. The network was further restricted to include only treatments that are approved by the US FDA or the European Medicines Agency and any regimens likely to be a future health technology assessment comparator to BVd, the DREAMM-726 study regimen. Based on these criteria, 4 of the 17 treatments (from 6 studies) did not meet the inclusion criteria and were excluded from the analysis: venetoclax plus bortezomib plus dexamethasone; thalidomide plus dexamethasone; and tabalumab (100 mg and 300 mg) plus dexamethasone plus bortezomib.82-87 The restricted evidence network based on 13 studies, including the ARROW,88 BOSTON,89 CANDOR,52,90 CASTOR,77,78 ENDEAVOR,91,92 IKEMA,29 OPTIMISMM,50 GEM-KyCyDex,93 LEPUS,79 PANORAMA-1,94,95 NCT01478048,96 NCT00813150,97 and DREAMM-726 studies, is presented in Figure 9 and Table 28. The SLR updates identified new studies, all of which were deemed infeasible to include in the network based on an initial feasibility assessment. The majority of new studies were either single-arm trials, lacked a connection to the network, or did not report any outcomes of interest.
Lenalidomide plus dexamethasone, daratumumab plus lenalidomide and dexamethasone, and carfilzomib plus lenalidomide and dexamethasone are also available treatment options for patients with RRMM in clinical practice in Canada. However, because the majority of patients in Canada receive a lenalidomide-based therapy in the first line of therapy, these treatments were not considered relevant comparators to BVd in the second-line settings and beyond.28
Figure 9: Network of Evidence Based on Studies Identified in the SLR
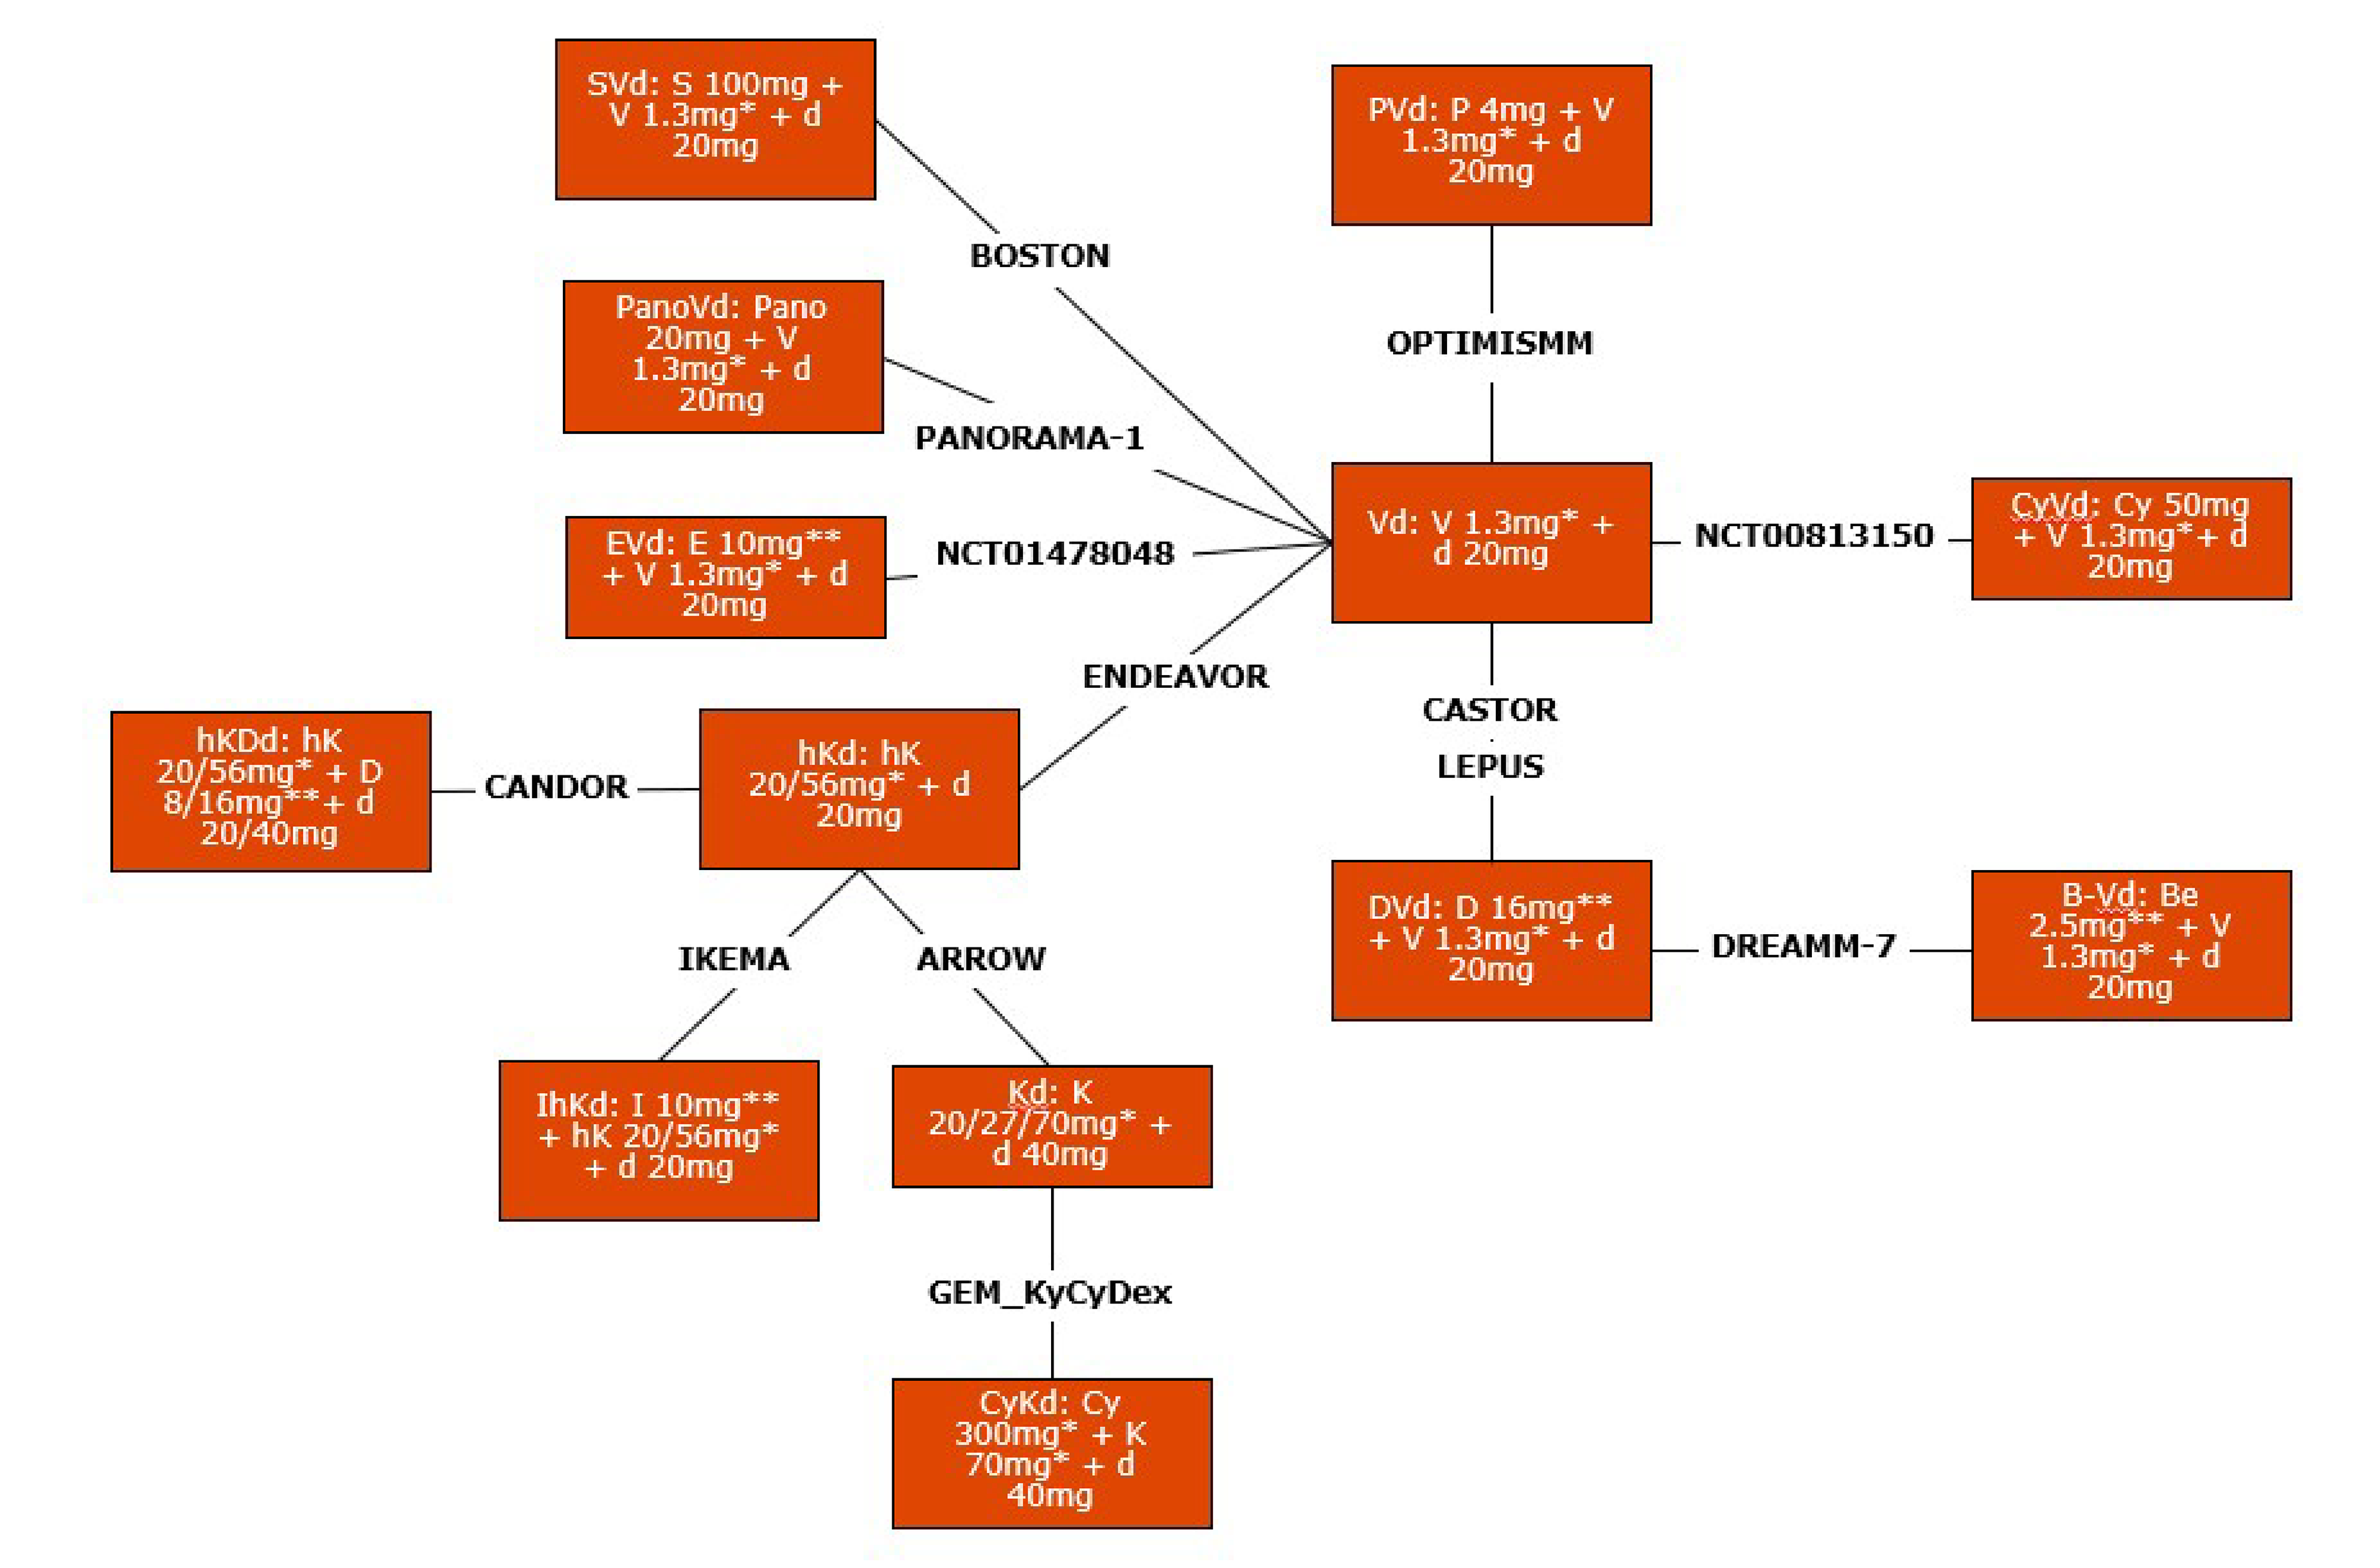
* mg/m2
** mg/kg
B-Vd = belantamab mafodotin plus bortezomib and dexamethasone; Be = belantamab; Cy = cyclophosphamide; CyKd = cyclophosphamide plus carfilzomib and dexamethasone; CyVd = cyclophosphamide plus bortezomib and dexamethasone; d = dexamethasone; D = daratumumab; DVd = daratumumab plus bortezomib and dexamethasone; E = elotuzumab; EVd = elotuzumab plus bortezomib and dexamethasone; hK = high-dose carfilzomib; hKd = high-dose carfilzomib plus dexamethasone; hKDd = high-dose carfilzomib plus daratumumab and dexamethasone; IhKd = isatuximab plus high-dose carfilzomib and dexamethasone; K = carfilzomib; Kd = carfilzomib plus dexamethasone; P = pomalidomide; Pano = panobinostat; PanoVd = panobinostat plus bortezomib and dexamethasone; PVd = pomalidomide plus bortezomib plus dexamethasone; S = selinexor; SLR = systematic literature review; SVd = selinexor plus bortezomib plus dexamethasone; V = bortezomib; Vd = bortezomib plus dexamethasone.
Note: The Vd treatment group also included placebo.
The carfilzomib and dexamethasone dosage and treatment pattern are identical in each GEM-KyCyDex study group and in the low-dose treatment group for the ARROW trial.
Sources: Sponsor-submitted indirect treatment comparison report.76 Details included in the table are from the sponsor’s Summary of Clinical Evidence.
Feasibility Assessment
A feasibility assessment was conducted to inform on whether an NMA between the RCTs identified in the SLR would be feasible. This included determining whether the treatment effect modifiers (TEMs) — variables that can influence the effect of treatment on outcomes — along with study characteristics, population characteristics, and RRMM-specific characteristics, were homogenous.
The potential TEMs in patients with MM were identified through a targeted literature review and were based on the opinion of the sponsor’s clinical expert. TEMs in RRMM have been studied in a Bayesian NMA by Dimopoulos et al. (2018)98 and an NMA and simulation study by Rose et al. (2023).99 Dimopoulos et al. found more than 1 previous line of therapy to be a relevant TEM while Rose et al. found weak evidence of an interaction for within-trial TEMs for PFS by line of therapy and prior use of IMiD or lenalidomide-refractory status.99 The potential list of TEMs included the prior line of therapy, the refractory status to the specific drug in the trial, the ISS stage, the cytogenetic risk profile, extramedullary disease, creatine clearance, the time from diagnosis, age, gender, ethnicity, comorbidities, and ECOG PS score.
To identify which variables are TEMs in the RRMM population, efficacy results by subgroup for potential TEMs and prognostic variables were explored for each study. PFS was used as the primary way to evaluate whether a factor was a TEM because it was the primary end point of the DREAMM-7 study. The TEMs explored for inclusion were those variables that exhibited imbalances between studies in the ITT populations and for which comparisons were feasible. The variables explored included:
prior therapy
prior IMiD exposure
ISS stage
ECOG PS
prior lenalidomide exposure
prior daratumumab use
cytogenic risk profile.
None of the studies in the network stratified results by prior daratumumab exposure. Consequently, this variable was not available for exploration as a TEM. Upon assessing the available PFS data by subgroup across the studies included in the NMA, the results indicated that prior therapy, ECOG PS score, and ISS stage may be TEMs in the RRMM population.
Study Characteristics
All studies were phase III RCTs, except for 2 studies, which were phase II RCTs (Table 28). The trials were published between 2014 and 2024, during which time the treatment landscape had evolved. Crossover was permitted in 2 trials (the BOSTON89 and LEPUS studies79), which poses a risk of bias for OS results. Substantial variation was observed in the follow-up time at which outcomes were evaluated in the studies, with follow-up time for reporting PFS ranging from 5.6 months (the PANORAMA-1 trial94,95) to 47 months (the CASTOR trial77,78). In the case of the OPTIMISMM study,50 58.3% of patients in the Vd group subsequently received PVd, and therefore a crossover-adjusted OS HR was used to minimize the potential bias. The PANORAMA-1 study94,95 was the only study of the network to include a placebo as part of a treatment regimen. Most treatment nodes in the network were only connected by 1 study. In the DREAMM-7 trial,26 PFS was recorded by both IRC (primary end point) and IA, whereas the remaining 12 studies used an IRC (8 studies) or IA (4 studies) for recording this outcome.
The dosing of dexamethasone across the network exhibited some differences in either dose or cycle structure of dexamethasone between the ARROW,88 CASTOR,77,78 CANDOR,52,90 and DREAMM-7 studies26 (Table 28, Appendix 1). In particular, the following differences emerged:
The dexamethasone dose was consistent for most of the network at 20 mg, except in the ARROW88 and CANDOR studies,52,90 in which patients received 40 mg doses. However, in the CANDOR study,52,90 there was an option to reduce the dosage of dexamethasone to 20 mg for patients aged 75 years or older.
The dexamethasone dosing structure was equivalent for the CASTOR study77,78 and both groups of the DREAMM-7 study26 with doses on day 1, day 2, day 4, day 5, day 8, day 9, day 11, and day 12. The GEM-KyCyDex93 study had a slightly different dosing structure of dexamethasone with doses on day 1, day 2, day 8, day 9, day 15, and day 16 for both treatment groups77,78 and both groups of the DREAMM-7 study26 with doses on day 1, day 2, day 4, day 5, day 8, day 9, day 11, and day 12. The GEM-KyCyDex93 study had a slightly different dosing structure of dexamethasone with doses on day 1, day 2, day 8, day 9, day 15, and day 16 for both treatment groups.
Dosing frequency was comparable across the network (once weekly and twice weekly).
Population Characteristics
Table 25 provides a comparison of the characteristics of the populations included in studies comprising the network. The median ages of patients and the proportion of males were comparable across the studies. Race data were only available for only 6 of the 13 studies; comparability could not be fully assessed, but race distribution was comparable across those 3 studies. The time since diagnosis was available for 7 of the 13 studies; comparability could not be fully assessed but was consistent across studies that reported this characteristic.
Table 25: Similarity of Patient Population Characteristics
Characteristic | Study | Description |
|---|---|---|
Age in years, median (range) | Reported in 11 of 13 studies | The mean of the median age across the studies was 65.2 years (range, 61.0 years to 71.0 years). Studies NCT0147804896 and NCT0081315097 did not report median age, alternatively reporting mean age. These values for both studies were within the range reported for median age in the remaining network. |
Males (%) | Reported in all studies | The mean proportion of males across the studies was 54.5% (range, 49.0% to 60.3%). |
Race | Reported in 6 of 13 studies Not reported in the ARROW,88 BOSTON,89 CANDOR,90 LEPUS,79 NCT00813150,97 OPTIMISMM,50 or GEM-KyCyDex93 studies | The most common racial group across the studies was white, with representation ranging from 64.0% to 88.0%. Patients of Asian ethnicity were the next most common, with proportions ranging from 12.0% to 33.0%. |
Time since diagnosis, months | Reported in 8 of 13 studies Not reported in the ARROW,88 ENDEAVOR,92 PANORAMA-1,94,95 NCT00813150,97 or GEM-KyCyDex96 studies | In the ITT populations, time since diagnosis was broadly consistent, ranging from 37.5 months to 48.0 months. |
ITT = intention to treat.
Sources: Sponsor-submitted indirect treatment comparison report (2024).76 Details included in the table are from the sponsor’s Summary of Clinical Evidence.
Disease Characteristics
An assessment of heterogeneity in terms of disease-specific characteristics of the patient populations of the 13 included studies is summarized in Table 26.
Number of prior lines of therapy: Considerable variation was observed across studies in the number of prior treatments patients had received, although in most studies, approximately 50% of patients had received 1 prior therapy. Two studies (the ARROW88 and NCT0081315027 trials) did not report data for 1 prior line of therapy, and the data availability for 2 or 3 prior lines of therapy was poor. In 8 studies (the ARROW,88 BOSTON,89 NCT00813150,97 ENDEAVOR,91,92 OPTIMISMM,50 IKEMA,29 LEPUS,79 and PANORAMA-194,95 studies), more than 30% of enrolled patients had 2 prior lines of therapy, and 1 study (the ARROW trial88) had a patient population of which 30% had received 3 or more prior treatments. None of the studies included in the network stratified results by prior daratumumab exposure. There was variation across the studies in the previously prescribed therapies, with IMiDs (thalidomide or lenalidomide), carfilzomib, and bortezomib being the most frequently prescribed prior therapies among study patients.
ISS stage: The BOSTON study89 did not report ISS stage data. Across the network, study populations were predominantly composed of patients with ISS stage I and stage II. The proportion of patients in ISS stage I ranged from 15.0% to 54.0% while the proportion of patients in ISS stage II ranged from 24.0% to 56.0%. The proportion of patients at ISS stage III varied between 16% and 60% across the studies.
ECOG PS: The NCT00813150 study97 did not report ECOG PS data. The proportion of patients with an ECOG PS score of 1 and 2 was similar across the studies. The mean proportion of patients with an ECOG PS score of 1 across the network was 45.5% (range, 38.5% to 54.5%) while the mean proportion of patients with an ECOG PS score of 2 was 5.8% (range, 1% to 9.0%).
Prior lenalidomide exposure: Three studies did not report prior lenalidomide exposure (the NCT00813150,97 GEM-KyCyDex,93 and NCT0147804896 trials). Considerable variation was observed across the remaining studies related to this characteristic. The PANORAMA-194,95 study reported a prior lenalidomide exposure rate below 25%, whereas 5 studies (the BOSTON,89 ENDEAVOR,92 CANDOR,90 IKEMA,29 and CASTOR77 trials) reported exposure rates ranging from 25% to 75%. Two studies (the ARROW88 and OPTIMISMM50 studies) reported a prior lenalidomide exposure rate exceeding 75%.
Prior IMiD exposure: Five studies did not report prior IMiD exposure (the ARROW,88 BOSTON,89 NCT00813150,97 NCT01478048,96 and PANORAMA-194,95 trials). Variability was observed in prior IMiD exposure among the remaining studies. Prior lenalidomide exposure averaged 51.3%, with a range from 20.5% to 100%, while prior thalidomide exposure averaged 49.9%, with a range from 49% to 51%. Some studies did not report either prior lenalidomide or thalidomide exposure. As a result, the range for prior IMiD exposure does not include values from the ranges of lenalidomide or thalidomide exposure.
Cytogenic risk profile: Cytogenetic risk was categorized into a single subgroup: high cytogenetic risk. Three studies did not report on patients’ cytogenic risk profile (the BOSTON,89 PANORAMA-1,94,95 and NCT0081315097 trials). Important variation was observed across the 10 studies that reported the proportion of patients with high cytogenetic risk, with values ranging from 3.5% to 36% and a mean of 18.1%.
Some variability was also noted in the proportions of those having exposure to prior IMiDs, being refractory to proteasome inhibitors, and being refractory to the last therapy in the studies.
Table 26: Assessment of Heterogeneity in Disease-Specific Characteristics
Study | Prior line of therapy (%) | ISS stage (%) | ECOG PS (%) | Prior lenalidomide use (%) | Prior IMiD (%) | High cytogenetic risk (%) |
|---|---|---|---|---|---|---|
ARROW study88 | 1: 0.0 2: 50.5 3: 49.5 ≥ 4: 0 Median: NR | I: 40.5 II: 33.5 III: 24.5 Unknown: 1.0 | 0: 49.5 1: 50.0 2: < 1 | 84 | NR | 17 |
BOSTON study89 | 1: 49.5 2: 32 3: 18.5 ≥ 4: NR Median: NR | NR | 0: 36.0 1: 54.5 2: 9.0 | 38 | NR | NR |
GEM-KyCyDex study93 | 1: 66.5 2: 24.4 3: 9.6 Median: 1 | I: 28.4 II: 32.0 III: 19.8 Unknown: 20.3 | 0 to 1: 95.0 | NR | 69.5 | 26.4 |
1: 51.5 2: 30.0 3: 18.5 ≥ 4: NR Median: NR | I: 40.0 II: 25.5 III: 21.5 Unknown: 13.0 | 0: 44.0 1: 49.0 2: 6.5 | 20.5 | NR | NR | |
NCT01478048 study96 | 1: 66.5 2: NR 3: NR ≥ 4: NR Median: NR | I: 29.5 II: 28.5 III: 17.5 Unknown: 24.5 | 0: 55.0 1: 38.5 2: 5.5 | NR | NR | 3.5 |
1: 50.0 2: 32.5 3: 17.5 ≥ 4: 0.2 Median: 2 | I: 44.0 II: 56.0 III: NR Unknown: NR | 0: 49.0 1: 44.5 2: 6.5 | 38.0 | 72 | 22.5 | |
OPTIMISMM study50 | 1: 40.5 2: 39.5 3: 20 ≥ 4: NR Median: 2 | I: 51.5 II: 31.0 III: 17.5 Unknown: NR | 0: 51.0 1: 43.0 2: 6.0 | 100.0 | 100.0 | 20.0 |
IKEMA study29 | 1: 44.5 2: 32.5 3: 21.0 ≥ 4: 2.0 Median: 2 | I: 54.0 II: 30.0 III: 15.5 Unknown: 1.0 | 0: 56.0 1: 39.0 2: 5.0 | 44.0 | 78.5 | 24.0 |
1: 45.5 2: NR 3: NR ≥ 4: NR Median: NR | I: 49.0 II: 32.0 III: 19.0 Unknown: < 1 | 0: 95.0 1: NR 2: 5 | 43.5 | 68.5 | 16.0 | |
1: 47.5 2: 29.0 3: 14.0 ≥ 4: NR Median: NR | I: 39.0 II: 38.5 III: 22.5 Unknown: 0.0 | 0: 44.5 ≥ 1: 55.2 | 42.0 | 75.5 | 15.0 | |
NCT00813150 study97 | 1: 57.0 2: 29.0 3: 9.5 ≥ 4: 1.0 Median: NR | I: 15.0 II: 24.0 III: 60.0 Unknown: NR | NR | NR | NR | NR |
LEPUS study79 | 1: 28.1 2: 33.8 3: 14.5 > 3: 23.5 | I: 49.8 II: 31.6 III: 18.5 | 0: 42.1 1: 49.8 2: 8.2 | 35.5 | 91.8 | 36.5 |
DREAMM-7 study26 | 1: 51 2 or 3: 38 ≥ 4: 12 | I: 41 II: 53 III: 5 Unknown: 1 | 0: 48 1: 48 2: 4 | 52 | 83.5 | 28 |
ECOG PS = Eastern Cooperative Oncology Group Performance Status; IMiD = immunomodulatory drug; ISS = International Staging System; NR = not reported.
Sources: Sponsor-submitted indirect treatment comparison report (2024).76 Details included in the table are from the sponsor’s Summary of Clinical Evidence.
The overall risk of bias was heterogeneous among included studies, but no studies were regarded as outliers. On this basis, it was not recommended to exclude any studies based on the risk-of-bias assessment. In particular, 3 of the studies included in the NMA were assessed as having a low risk of bias, whereas 3 studies were assessed as having some concerns.
Figure 10: PFS Network — ITT Population [Redacted]

ITT = intention to treat; PFS = progression-free survival.
Note: Figure 10 contained confidential information and was removed at the request of the sponsor.
Figure 11: PFS Network — Lenalidomide-Exposed Population [Redacted]

PFS = progression-free survival.
Note: Figure 11 contained confidential information and was removed at the request of the sponsor.
Figure 12: PFS Network — Lenalidomide-Refractory Population [Redacted]

PFS = progression-free survival.
Note: Figure 12 contained confidential information and was removed at the request of the sponsor.
Figure 13: OS Network — ITT Population [Redacted]

ITT = intention to treat; OS = overall survival.
Note: Figure 13 contained confidential information and was removed at the request of the sponsor.
Figure 14: ORR Network — ITT Population [Redacted]

ITT = intention to treat; ORR = overall response rate.
Note: Figure 14 contained confidential information and was removed at the request of the sponsor.
Figure 15: ORR Network — Lenalidomide-Exposed Population [Redacted]

ORR = overall response rate.
Note: Figure 15 contained confidential information and was removed at the request of the sponsor.
Figure 16: ORR Network — Lenalidomide-Refractory Population [Redacted]

ORR = overall response rate.
Note: Figure 16 contained confidential information and was removed at the request of the sponsor.
Efficacy Results
The NMA results presented in the CDA-AMC review report were limited to focus on comparisons between BVd and regimens relevant to Canada for this submission:
IhKd
hKd
PVd
SVd
DVd
Vd
Kd.
Figure 10 to Figure 16 present the networks of evidence for base-case analysis of PFS, OS, and ORR in the ITT population, as well as in the lenalidomide-exposed and lenalidomide-refractory populations. Detailed efficacy results are presented in Table 27.
Progression-Free Survival
According to the sponsor, all studies in the network applied an equivalent definition of PFS, but censoring rules were not mentioned. In the DREAMM-7 trial, PFS was assessed by both the IRC and investigator; in 8 studies, PFS was assessed by the IRC; and in 4 studies, PFS was assessed by the investigator. The primary analysis NMA used IRC-assessed PFS for the DREAMM-7 trial and other studies when available, with investigator-assessed PFS used elsewhere, based on the latest follow-up date available for each study. Median follow-up data for PFS in the study network were provided for a median of 21.7 months. The shortest reported median follow-up for PFS was 6.03 months (the PANORAMA94,95 study), whereas the longest was 64.5 months (the OPTIMISMM50 study).
Primary Analysis
In the ITT population, results from the fixed-effects models indicated that BVd demonstrated a favourable improvement in PFS compared with all 7 comparators, with HRs ranging from 0.13 (95% CrI, 0.09 to 0.18) versus Vd to 0.42 (95% CrI, 0.26 to 0.69) versus IhKd. The results from the corresponding random-effects model showed a favourable improvement in PFS for BVd compared with DVd, hKd, PVd, SVd, and Vd, with HRs ranging from 0.13 (95% CrI, 0.06 to 0.28) versus Vd to 0.41 (95% CrI, 0.22 to 0.75) versus DVd. However, the evidence regarding a difference in PFS improvement between BVd and IhKd, as well as Kd, was insufficient to show a difference between groups. The point estimates were comparable across both the fixed-effects and random-effects models.
Secondary Analysis
Among lenalidomide-exposed patients, results from the fixed-effects models found that BVd demonstrated a favourable improvement in PFS compared with all comparators. The results from the corresponding random-effects model showed a favourable improvement in PFS for BVd versus DVd, hKd, and Vd; evidence versus other comparators (IhKd, Kd, PVd, and SVd) were insufficient to show a difference between groups.
Among lenalidomide-refractory patients, results from the fixed-effects models found that BVd demonstrated a favourable improvement in PFS compared with all comparators. The results from the corresponding random-effects model showed a favourable improvement in PFS of BVd versus DVd, hKd, and Vd; evidence versus other comparators (IhKd, Kd, and PVd) was insufficient to show a difference between groups.
Subgroup Analysis
In the subgroup with 1 prior therapy, results of the fixed-effects model indicated a favourable improvement in PFS for BVd compared with DVd, hKd, IhKd, PVd, SVd, and Vd. The results from the corresponding random-effects model showed a favourable improvement in PFS for BVd versus SVd and Vd. In the subgroup with high cytogenetic risk, results of the fixed-effects model demonstrated a favourable improvement in PFS for BVd compared with all 7 comparators. The results from the corresponding random-effects model showed a favourable improvement in PFS for BVd compared with DVd, hKd, PVd, SVd, and Vd.
OS
In the DREAMM-7 study, OS was defined as the time from randomization to death due to any cause. An equivalent definition was used in most studies, with the OPTIMISMM trial50 being the only study to apply an alternative definition: “…the length of time from the start of the study treatment that patients are alive.” The primary analysis used the latest available follow-up for each study. Median follow-up data for OS in the study network was provided for a median of 44.0 months. The shortest reported median follow-up for OS was 12.9 months (the ARROW study88) while the longest was 72.6 months (the CASTOR study77).
Primary Analysis
In the ITT population, results from the fixed-effects models indicated that BVd demonstrated a favourable improvement in OS compared with DVd, hKd, PVd, SVd, and Vd, with HRs ranging from 0.39 (95% CrI, 0.26 to 0.59) compared to Vd to 0.57 (95% CrI, 0.40 to 0.80) compared to DVd. However, results from the corresponding random-effects model for OS showed that the evidence for a difference between BVd and other comparators was insufficient to show a difference between groups. No secondary or subgroup analyses for OS were conducted or reported in the sponsor-submitted NMA.
Overall Response Rate
In the DREAMM-7 trial, ORR was defined as the percentage of patients with a confirmed PR or better (i.e., VGPR, CR, or sCR), in line with IMWG response criteria.46 ORR was assessed by both IRC and the investigator. Almost all studies in the network used an equivalent definition of ORR. In all studies, the IRC-assessed ORR was used. The median reported follow-up for ORR was 16.2 months, with a range spanning from 5.59 months (the PANORAMA trial94,95) to 37 months (the GEM-KyCyDex trial96) across the studies.
Primary Analysis
In the ITT population, results from fixed-effects models found that BVd demonstrated a favourable improvement in ORR compared with DVd, hKd, PVd, SVd, and Vd, with ORs ranging from 1.94 (95% CrI, 1.27 to 2.99) compared to DVd to 5.99 (95% CrI, 3.41 to 10.64) compared to Vd. The results from the corresponding random-effects model for PFS showed that BVd demonstrated a favourable improvement in ORR compared with Vd alone; evidence for other comparisons was insufficient to show a difference between groups. The point estimates were comparable across the fixed-effects and random-effects models.
Secondary Analysis
Among lenalidomide-exposed patients, results from fixed-effects models found that BVd demonstrated a favourable improvement in ORR compared with DVd, hKd, hkDd, PVd, SVd, and Vd. The results from the corresponding random-effects model showed a favourable improvement in ORR versus only Vd; evidence for the other comparisons was insufficient to show a difference between groups.
Among lenalidomide-refractory patients, results from fixed-effects models found that BVd demonstrated a favourable improvement in ORR compared with SVd and Vd. The results from the corresponding random-effects model showed a favourable improvement in ORR versus Vd alone; evidence for the other comparisons was insufficient to show a difference between groups. No subgroup analyses for ORR were conducted or reported in the sponsor-submitted NMA.
Table 27: Summary of NMA Results for Efficacy Outcomes of BVd
Population | Comparator | Model | PFS, HR (95% Crl) | OS, HR (95% Crl) | ORR, OR (95% Crl) |
|---|---|---|---|---|---|
Overall population | DVd | Fixed-effects | 0.41 (0.31 to 0.54) | 0.57 (0.40 to 0.80) | 1.94 (1.27 to 2.99) |
Random-effects | 0.41 (0.22 to 0.75) | 0.57 (0.22 to 1.51) | 1.93 (0.83 to 4.51) | ||
hKd | Fixed-effects | 0.25 (0.17 to 0.36) | 0.52 (0.33 to 0.81) | 3.05 (1.61 to 5.77) | |
Random-effects | 0.25 (0.10 to 0.66) | 0.46 (0.09 to 1.85) | 3.01 (0.79 to 11.31) | ||
IhKd | Fixed-effects | 0.42 (0.26 to 0.69) | 0.66 (0.37 to 1.18) | 2.30 (0.93 to 5.71) | |
Random-effects | 0.43 (0.14 to 1.38) | 0.59 (0.08 to 3.17) | 2.26 (0.43 to 11.88) | ||
Kd | Fixed-effects | 0.36 (0.23 to 0.56) | 0.65 (0.36 to 1.15) | 1.23 (0.59 to 2.57) | |
Random-effects | 0.36 (0.12 to 1.13) | 0.57 (0.08 to 3.09) | 1.21 (0.25 to 5.91) | ||
PVd | Fixed-effects | 0.23 (0.16 to 0.34) | 0.52 (0.33 to 0.82) | 1.29 (0.65 to 2.55) | |
Random-effects | 0.24 (0.09 to 0.62) | 0.46 (0.09 to 1.87) | 1.26 (0.33 to 4.85) | ||
SVd | Fixed-effects | 0.19 (0.12 to 0.29) | 0.47 (0.27 to 0.82) | 3.04 (1.49 to 6.22) | |
Random-effects | 0.19 (0.07 to 0.51) | 0.42 (0.08 to 1.75) | 3.0 (0.76 to 11.77) | ||
Vd | Fixed-effects | 0.13 (0.09 to 0.18) | 0.39 (0.26 to 0.59) | 5.99 (3.41 to 10.64) | |
Random-effects | 0.13 (0.06 to 0.28) | 0.35 (0.09 to 1.03) | 5.89 (2.01 to 17.16) | ||
Lenalidomide-exposed population | DVd | Fixed-effects | 0.29 (0.19 to 0.43) | — | 2.45 (1.39 to 4.40) |
Random-effects | 0.29 (0.11 to 0.77) | — | 2.45 (0.72 to 8.31) | ||
hKd | Fixed-effects | 0.17 (0.09 to 0.31) | — | 5.03 (1.93 to 13.40) | |
Random-effects | 0.17 (0.03 to 0.90) | — | 5.03 (0.63 to 42.35) | ||
IhKd | Fixed-effects | 0.29 (0.13 to 0.64) | — | — | |
Random-effects | 0.29 (0.04 to 2.07) | — | — | ||
Kd | Fixed-effects | 0.23 (0.12 to 0.45) | — | — | |
Random-effects | 0.23 (0.04 to 1.59) | — | — | ||
PVd | Fixed-effects | 0.21 (0.12 to 0.37) | — | 1.74 (0.68 to 4.52) | |
Random-effects | 0.21 (0.04 to 1.10) | — | 1.74 (0.21 to 14.48) | ||
SVd | Fixed-effects | 0.18 (0.09 to 0.37) | — | 4.40 (1.50 to 13.12) | |
Random-effects | 0.18 (0.04 to 1.01) | — | 4.40 (0.51 to 37.58) | ||
Vd | Fixed-effects | 0.12 (0.07 to 0.20) | — | 8.09 (3.47 to 19.52) | |
Random-effects | 0.12 (0.03 to 0.46) | — | 8.11 (1.42 to 47.35) | ||
Lenalidomide-refractory population | DVd | Fixed-effects | 0.31 (0.20 to 0.49) | — | 3.32 (1.61 to 7.19) |
Random-effects | 0.31 (0.12 to 0.81) | — | 3.32 (0.90 to 12.29) | ||
hKd | Fixed-effects | 0.17 (0.08 to 0.35) | — | — | |
Random-effects | 0.17 (0.03 to 0.85) | — | — | ||
IhKd | Fixed-effects | 0.29 (0.12 to 0.70) | — | — | |
Random-effects | 0.29 (0.05 to 1.96) | — | — | ||
Kd | Fixed-effects | 0.23 (0.10 to 0.49) | — | — | |
Random-effects | 0.23 (0.03 to 1.50) | — | — | ||
PVd | Fixed-effects | 0.21 (0.11 to 0.42) | — | — | |
Random-effects | 0.21 (0.04 to 1.03) | — | — | ||
SVd | Fixed-effects | — | — | 5.96 (1.43 to 25.91) | |
Random-effects | — | — | 5.94 (0.56 to 60.65) | ||
Vd | Fixed-effects | 0.14 (0.07 to 0.26) | — | 14.30 (4.42 to 49.81) | |
Random-effects | 0.14 (0.04 to 0.52) | — | 14.32 (2.10 to 98.34) |
BVd = belantamab mafodotin plus bortezomib and dexamethasone; CrI = credible interval; DVd = daratumumab plus bortezomib and dexamethasone; hKd = high-dose carfilzomib plus dexamethasone; HR = hazard ratio; IhKd = isatuximab plus high-dose carfilzomib and dexamethasone; Kd = carfilzomib plus dexamethasone; NMA = network meta-analysis; OR = odds ratio; ORR = overall response rate; OS = overall survival; PFS = progression-free survival; PVd = pomalidomide plus bortezomib plus dexamethasone; SVd = selinexor plus bortezomib plus dexamethasone; Vd = bortezomib plus dexamethasone.
Note: Cells in bold reported 95% CrIs that excluded the null.
Sources: Sponsor-submitted indirect treatment comparison report.76 Details included in the table are from the sponsor’s Summary of Clinical Evidence.
Critical Appraisal of ITC
Overall, the SLR conducted to identify potentially relevant studies for the ITC was methodologically robust, with the sponsor employing a comprehensive literature search strategy, conducting study selection, data extraction, and risk-of-bias assessments in duplicate, and providing a list of excluded studies along with justifications for their exclusion. However, it was unclear in the ITC report whether the feasibility assessment was carried out by a single assessor or multiple assessors. The inclusion and exclusion criteria for the studies included in this NMA were not provided, which reduced the potential to assess heterogeneity. The sponsor reported that 3 studies had some concerns for risk of bias. However, the Cochrane Risk of Bias tool version 2 was not used as intended because the appraisals were performed at the study level. This methodology ignores that risk of bias can vary depending on the effect estimate being evaluated, particularly for such domains as performance, detection, attrition, and reporting bias.74 Additionally, the appraisals did not consider that randomization may not have been preserved within population subgroups used for analysis.
The clinical experts consulted noted that some of the regimens included in the NMA were appropriate comparators for BVd in the second-line setting and beyond for RRMM. The clinical experts indicated that the most relevant comparators included in the NMA depended on transplant eligibility. IhKd was most relevant for transplant-eligible patients with MM, and SVd and PVd were most relevant for transplant-ineligible patients. The clinical experts also noted that clinicians would prefer prescribing IhKd over hKd, as well as Kd, in transplant-ineligible patients in these settings. Additionally, the clinical experts noted that CyVd, CyhKd, PanoVd, hkDd, and EVd included in this NMA are not relevant to clinical practice in Canada for RRMM. The studies of these treatments add information to the network but may have resulted in increased heterogeneity.
The feasibility assessment for this NMA revealed considerable heterogeneity among the studies included in the analyses. The NMA did not report an assessment of the transitivity assumption, although several important sources of heterogeneity were noted across the included trials in terms of study design (e.g., crossover, placebo as a comparator, the inclusion of phase II trials) and dosing regimens. While the definitions of end points were similar across the trials, there was considerable variation in the duration of follow-up, and the censoring rules across the PFS analyses were not specified, which may represent a potential source of heterogeneity. The publication date of the trials ranged from 2014 to 2024, indicating a temporal discordance during which the treatment landscape has evolved. Prior treatments to which patients were exposed in older trials may have differed from more contemporary trials. The proportional hazards assumption within individual trials was not assessed; therefore, it is not known whether a constant HR NMA was appropriate. The OS data from the DREAMM-7 study are not mature, which reduces certainty in the OS comparisons. These sources of heterogeneity cannot be adjusted for within the NMA. The absence of closed loops of evidence meant that the inconsistency assessment (the statistical manifestation of transitivity) could not be completed.
Several important disease-specific characteristics were not reported in some studies within the network, which limits the ability to assess heterogeneity between the studies. Notably, there was considerable variation across studies in the number of prior lines of therapy, prior lenalidomide and IMiD exposures, and cytogenic risk profile. The limited number of included studies did not allow for meta-regression or other techniques to adjust for differences in effect modifiers across studies within the NMA. The impact of the number of prior lines of therapies and cytogenetic risk were instead explored in subgroup analyses for PFS. The magnitude of the treatment effects appeared consistent compared to the main analysis for each subgroup; however, the 95% CrIs were wider given the smaller sample sizes, leading to greater uncertainty in the resulting treatment effects. These analyses alone are insufficient to confirm a lack of impact from these effect modifiers on the overall results. The studies included in the secondary and subgroup analyses for PFS differed from those in the full network, meaning the subgroup analyses did not directly compare the same network as the full population analyses. Narrowing the network could potentially impact the results. Results were presented for only 1 side of the subgroups, which limited interpretation. For instance, showing results for high cytogenic risk without including the corresponding low cytogenic risk analysis limits the ability to determine whether the results would be consistent across both groups, and may suggest that the overall results are being driven by the presented subgroup. The studies within networks included a mix of patients in multiple lines of therapy, which may introduce bias because patients in earlier or later lines of therapies can influence each network differently. According to the clinical experts consulted by CDA-AMC, patients in earlier lines of therapy are likely to have better outcomes compared with patients in later lines of therapy. The clinical experts consulted indicated that ECOG PS score and ISS stage are known TEMs in MM; however, these factors were not assessed in subgroup analyses of the NMA. The sponsor did not provide information on the proportion of transplant-eligible and transplant-ineligible patients in the studies included in the NMA network.
The network of evidence was sparse (i.e., few studies contributing to several comparisons); in many cases, there was only 1 study per link, which was insufficient to reliably estimate between-study variances. This uncertainty is reflected in the wide CrIs of the comparisons of treatment effects, particularly for ORR and OS. Bayesian fixed-effects models were used as a base-case analysis, with a random-effects model for the exploratory analysis. When heterogeneity is present, the CrIs of the fixed-effects model may be narrower and less conservative than those of the random-effects model, underestimating the uncertainty arising from between-study variation. Additionally, the assumptions of the fixed-effects model (e.g., a single true effect size, no between-study heterogeneity) are likely less realistic than those of the random-effects model (e.g., assumes variation in effect sizes across studies). The point estimates for efficacy outcomes were comparable between the fixed-effects and random-effects models. However, as expected, the CrIs for the random-effects models are wider. Secondary analyses were performed for lenalidomide-exposed and lenalidomide-refractory patient populations because it is expected that most patients living in Canada will receive a regimen based on lenalidomide in the first line of therapy, with subsequent therapies tailored to the patient’s initial response. Some trials included in the NMA allowed crossovers. The crossover-adjusted results were used, but it needs to be considered that the interpretation of adjusted results is hindered because these rely on strong assumptions that may not be plausible and cannot be verified.98
No patient-reported QoL data, which was considered an important end point for this review, were evaluated. Furthermore, no comparative effect estimates for harms were provided. These limitations preclude a comprehensive assessment of the balance of benefits and harms and must be considered when drawing conclusions from the NMA results.
Studies Addressing Gaps in the Systematic Review Evidence
No studies addressing gaps in the pivotal and RCT evidence were identified by the sponsor.
Discussion
Summary of Available Evidence
One ongoing, phase III, randomized, open-label, multicentre trial, the DREAMM-7 study (N = 494), met the inclusion criteria for the systematic review conducted by the sponsor. The objective of the DREAMM-7 trial was to assess the efficacy and safety of BVd compared with DVd in adult patients with MM. The trial enrolled patients who had received at least 1 prior line of MM therapy and had documented disease progression during or after their most recent treatment. The outcomes most relevant to the CDA-AMC review included the primary end point of PFS as assessed by the IRC, a key secondary end point of OS, and secondary end points of DoR, MRD negativity, HRQoL as measured by an EORTC QLQ-C30 GHS score, and safety outcomes. The mean age of patients was 64.5 (SD = 9.5) years. Most patients had an ECOG PS score of 0 or 1 and were classified as R-ISS stage I or stage II. Nearly half of the patients had received 1 prior line of therapy, with 52% of these patients having prior exposure to lenalidomide, and 34% being refractory to lenalidomide.
In the absence of direct comparative evidence of BVd versus other relevant comparators aside from DVd, an NMA was conducted by the sponsor. The objective of the NMA was to provide evidence for the efficacy of BVd relative to hKd, IhKd, PVd, SVd, and Vd in adult patients with RRMM who had received at least 1 line of therapy. Fixed-effects and random-effects models were applied for PFS, OS, and ORR using a Bayesian framework. Secondary analyses were also conducted for PFS and ORR in the lenalidomide-exposed and lenalidomide-refractory populations.
Interpretation of Results
The clinical experts consulted by CDA-AMC emphasized that while various classes of drugs are available to manage MM at different stages, no single treatment can offer a definitive cure for the disease. Additionally, they indicated that a critical treatment gap exists for patients who become refractory to lenalidomide or anti-CD38 therapies, especially in older adults. According to the clinician group and clinical experts consulted, patients with MM often require treatment regimens with manageable side effects to preserve their QoL, and there is an increasing demand for therapies that involve fewer clinic visits and less intensive monitoring.
The evidence from the pivotal DREAMM-7 trial addressed treatment outcomes deemed important by both patients and clinicians. Input from the patient group emphasized key priorities such as stopping disease progression, prolonging life, and improving HRQoL. Similarly, input from the clinician group and clinical experts consulted by CDA-AMC highlighted that the most important treatment goals for patients with MM are to prolong survival, delay disease progression, extend the DoR, improve QoL, and minimize side effects. Therefore, results from the analyses of the following outcomes measured in the DREAMM-7 trial at the time of IA1 and IA2 were summarized and assessed using the GRADE tool: PFS, OS, HRQoL, and safety outcomes, including ocular AEs and SAEs. Additionally, ORR, CR, DoR, and MRD negativity were included in the report as supportive information.
Efficacy
Direct comparative evidence from the DREAMM-7 trial supported a clinically meaningful improvement in PFS with BVd compared to DVd in adults with RRMM who had received at least 1 prior therapy. The median PFS was 36.6 months in the BVd group and 13.4 months in the DVd group, which was considered clinically meaningful by clinical experts consulted by CDA-AMC. PFS reached the predefined boundary for statistical significance at IA1 and, in accordance with the study protocol, was evaluated as an exploratory end point at the time of IA2. Based on a clinically important threshold of a 10% absolute risk difference between groups suggested by the clinical experts consulted by CDA-AMC, there is high certainty of a PFS benefit of BVd over DVd at both 12 months and 36 months. The point estimate for the difference between groups exceeded 20%. The overall PFS findings were robust to several sensitivity analyses, and consistent across the subgroup analyses; however, the subgroup analyses were exploratory and potentially not powered to detect differences between groups.
At the time of both IA1 and IA2, the median OS had not been reached in either treatment group. At the time of IA2, OS data had reached 34.6% overall maturity, and the significance criterion was met. Based on a 5% clinical importance threshold suggested by clinical experts consulted by CDA-AMC, the potential for an OS benefit of BVd over DVd became apparent at 12 months, though there was uncertainty due to imprecision. A clinically important improvement in OS was observed at 36 months. Follow-up was inadequate to understand the potential impact on OS at longer time points; to date, the results rely on a small information fraction. According to the clinical experts consulted, given the importance of this outcome to patients and clinicians, longer follow-up durations for the OS analysis would have been preferred to determine the clinical value of treatment with BVd. Because the OS results were based on interim analyses, there is a risk that the effect (HR) of BVd compared with DVd is overestimated; however, the existence and extent of any overestimation remains uncertain.20-22 In the DREAMM-7 trial, patients were allowed to receive posttreatment anticancer medications after discontinuing study treatment, which could influence the assessment of OS. The subsequent treatments were not balanced between groups.
HRQoL is an important outcome to patients and clinicians and was assessed as an exploratory outcome by measuring the EORTC QLQ-C30 scale score. For the EORTC QLQ-C30 GHS score, there is very low certainty of evidence for a clinically important between-group difference, based on the sponsor’s suggested threshold (informed by the literature) of a 10-point change from baseline score, when compared with DVd. The very low certainty of evidence was attributed to a risk of bias because of a large amount of missing outcome data over time, the potential bias due to assessor knowledge of treatment assignment, and imprecision. The clinical experts consulted indicated that ocular AEs have a negative impact on patients’ HRQoL.
At the time of IA2, median DoR was 40.8 months in the group receiving BVd and 17.8 months in the DVD group. At the time of IA1, a greater proportion of patients in the BVd group had achieved CR or sCR, MRD negativity by best response (CR or sCR), and confirmed PR or better compared with the DVd group (34.6% versus 17.1%, 24.7% versus 9.6%, and 82.7% versus 71.3%, respectively). These results were deemed clinically meaningful by the clinical experts consulted by CDA-AMC.
Overall, there are no major concerns with the generalizability of the pivotal trial results. However, clinical expert input indicated that the proportion of patients refractory to lenalidomide is higher in clinical practice than in the trial. The experts consulted by the review team also noted that such patients may have a poorer response to second-line or third-line treatments compared to those who are not refractory to lenalidomide. Additionally, the DREAMM-7 trial appeared to enrol a higher proportion of patients with 1 prior therapy, an ECOG PS score of 0 or 1, and an R-ISS stage of I or II, with immunoglobulin G being the most common myeloma immunoglobulin. The clinical experts consulted indicated that this would be reflective of clinical practice in the second-line setting, but not in later relapse. They also noted that while daratumumab is considered a suboptimal comparator for belantamab, it was regarded as an appropriate comparator at the time the DREAMM-7 trial was designed.
There are many treatments for RRMM that are available and reimbursed in Canada. Consequently, comparative evidence to inform the relative safety and efficacy of new treatments is critical for the assessment of the value of a new therapy. All comparative evidence beyond the comparison to DVd that was available for this submission is based on the sponsor-submitted NMA. In the ITT population of the sponsor-submitted NMA, the results for PFS of the fixed-effects model were in favour of BVd in comparison with all other comparators, whereas the corresponding results for PFS of the random-effects model favoured BVd over DVd, hKd, PVd, SVd, and Vd. The results of the fixed-effects model for OS were in favour of BVd over DVd, hKd, PVd, SVd, and Vd. However, results from the corresponding random-effects model for OS showed that the evidence was insufficient to show a difference between BVd and other comparators. In the ITT population, results from fixed-effects models found that BVd demonstrated a favourable improvement in ORR compared with DVd, hKd, PVd, SVd, and Vd. The results from the corresponding random-effects model for PFS showed that BVd demonstrated a favourable improvement in ORR compared with Vd alone but that the evidence was insufficient to show a difference versus other comparators. The CrIs from the random-effects model are more likely to accurately reflect the uncertainty arising from between-study heterogeneity. Several important sources of heterogeneity were noted across the included trials in terms of study design, dosing regimens, follow-up duration, and disease-specific characteristics. The between-group differences were informed by a sparse network within which there was considerable variation across studies in the number of prior lines of therapy, prior lenalidomide and IMiD exposures, and high cytogenic risk profile. The observed heterogeneity violates the underlying assumption of exchangeability, contributing to uncertainty in the validity of the findings. This uncertainty is reflected in the wide CrIs of the comparisons of treatment effects, particularly for ORR and OS. Thus, the results of the sponsor-submitted NMA suggested a favourable treatment effect of BVd on PFS and OS compared to several other regimens; however, the magnitude of these effects remains uncertain.
Based on the sponsor-submitted NMA, among lenalidomide-exposed patients, results from the fixed-effects model found that BVd demonstrated a favourable improvement in PFS compared with all comparators. The results from the corresponding random-effects model showed a favourable improvement in PFS for BVd versus DVd, hKd, and Vd. Among lenalidomide-refractory patients, results from the fixed-effects models found that BVd demonstrated a favourable improvement in PFS compared with DVd, hKd, IhKd, PVd, Kd, and Vd. The results from the corresponding random-effects model showed a favourable improvement in PFS of BVd versus DVd, hKd, and Vd. The studies included in the secondary analyses for PFS (the lenalidomide-exposed and lenalidomide-refractory populations) differ from those in the full network, meaning the subgroup analyses do not directly compare the same network as the full population analyses. Narrowing the network could potentially impact the results. Thus, the results of the NMA suggested a favourable treatment effect of BVd in terms of PFS among lenalidomide-exposed and lenalidomide-refractory populations compared to several other regimens; however, the magnitude of this effect remains uncertain.
In consultation with the clinical expert, an additional relevant comparator was found to be missing in the network — cyclophosphamide in combination with doublet therapies (Kd and Vd); therefore, the relative effect of BVd versus this comparator of interest is unknown. Given these significant limitations that suggest some concerns about potential bias in the estimates, the magnitude of effect associated with BVd relative to other comparators remains uncertain.
Harms
At the time of IA2, using the October 7, 2024, data cut-off, 100% of patients in both groups had experienced at least 1 AE. A higher proportion of patients in the BVd group had experienced at least 1 SAE compared to those in the DVd group (50% versus 37%, respectively). The most common SAEs in the BVd and DVd groups were pneumonia, COVID-19, and pyrexia. There was moderate certainty of evidence for BVd resulting in an increase in the proportion of patients who experience SAEs compared with DVd; the review team noted some uncertainty arising from a potential bias due to open-label harms reporting. The clinical experts indicated that the reported AEs were reasonable for what is known about RRMM and the study treatments (belantamab, bortezomib, and dexamethasone) and that with appropriate care, the AEs would be manageable for many patients. Deaths were reported in 29% of patients in the BVd group and in 41% of patients in the DVd group (including deaths attributed to MM).
A higher proportion of patients in the BVd group experienced at least 1 ocular event of any grade compared to those in the DVd group. Ocular AEs in the BVd group were more severe, with ███ classified as grade 3, while the majority in the DVd group were classified as grade 1 (███). Treatment modifications due to ocular AEs were more common in the BVd group, including doses interrupted, delayed, or reduced, compared to the DVd group. Blurred vision and dry eye were reported in more than half of the patients in this treatment group. A total of ██ in the BVd group and none in the DVd group discontinued study treatment due to ocular AEs. In the BVd group, 83% of patients had an incidence of corneal events, as evaluated by the KVA scale. The severity of the corneal events was high, with ███ classified as grade 3 and ███ as grade 4. Most corneal events were managed through dose modifications, with 89% of affected patients having doses interrupted or delayed, and 31% of affected patients experiencing dose reductions. In the BVd group, ███ of patients had BCVA events, mostly classified as grade 2 or higher. The clinical experts consulted emphasized that ocular toxicity with belantamab therapy can negatively impact QoL and necessitates more intensive monitoring than is typically required for MM. Specifically, they highlighted the need for regular ophthalmologic assessments and slit lamp examinations to guide dose adjustments and mitigate the risk of severe ocular toxicity. According to the clinical experts, the availability of ophthalmologists may pose a concern in smaller medical centres. Additionally, input from participating drug programs highlighted that potential out-of-pocket costs for eye care, such as eye exams and eye drops, could be a barrier for some patients who may not be able to afford these expenses. Furthermore, clinical experts indicated that ocular toxicity may require extending dosing intervals to every 8 weeks to 12 weeks, and in severe or intolerable cases, treatment may be discontinued. The clinical experts noted that, like other treatments, extensive teaching, training, and guidelines have been developed to manage the ocular toxicity associated with belantamab. They also emphasized that ocular toxicities can often be detected at early stages, allowing for timely interventions to prevent progression to grade 3 or grade 4 in severity.
A higher proportion of patients in the BVd group had experienced thrombocytopenia (███) compared to those in the DVd group (███). Despite the high incidence, few patients (██ ██ ███s) in either group had experienced SAEs related to thrombocytopenia, and treatment discontinuation rates due to thrombocytopenia were low (██ ██ ████). Thrombocytopenia events of grade 4 were reported in 53% of patients receiving BVd versus 33% of patients receiving DVd. In the DREAMM-7 trial, ███ of patients in the BVd group and ██ in the DVd group had received platelet transfusions. Neutropenia was reported in ███ of patients in the BVd group and ███ of patients in the DVd group. Neutropenia events of grade 4 were more common in the BVd group (███) compared to the DVd group (███). The clinical experts indicated that hematologists are well-equipped to manage thrombocytopenia and febrile neutropenia, and neither of these conditions is considered concerning. Additionally, a higher proportion of patients in the DVd group had experienced infusion-related reactions (███) compared to those in the BVd group (██). The clinical experts consulted indicated that unlike other therapies, belantamab does not exhibit significant myelosuppressive toxicities, making it a good option for older patients who are more vulnerable to the adverse effects of other treatments.
The sponsor-submitted NMA did not include harms; therefore, no conclusions could be drawn about the safety of BVd relative to other relevant comparators.
Conclusion
The available evidence from the pivotal, open-label, multicentre RCT (the DREAMM-7 study) provides important insights into the efficacy and safety of BVd compared with DVd in adults with RRMM who have received at least 1 prior therapy. Compared with DVd, BVd results in a clinically important increase in the probability of being alive and progression-free at 12 months and 36 months. At 36 months, BVd likely results in a clinically important increase in the probability of being alive when compared with DVd. At the time of both interim analyses, median OS had not been reached in either group and the effects of BVd on OS beyond 36 months is uncertain. No definitive conclusion can be drawn regarding the effects of BVd treatment on HRQoL because of the high amount of missing data over time, the potential bias due to assessor knowledge of treatment assignment, and imprecision, making the direction of effects unclear.
Overall, the safety of BVd was consistent with the known safety profiles of the individual drugs for RRMM. However, the DREAMM-7 trial showed that treatment with BVd likely results in an increase in the proportion of patients who experience SAEs when compared with DVd. Notably, ocular AEs were more common and severe in the group receiving BVd, requiring more frequent treatment modifications. Despite these higher incidences of AEs in the BVd group, they were expected to be manageable with proper monitoring and supportive care in clinical practice. Further, unlike other therapies, belantamab does not exhibit significant myelosuppressive toxicities, making it a beneficial treatment option for older patients who are more vulnerable to the adverse effects of other treatments.
The results of the sponsor-submitted NMA suggested a favourable treatment effect of BVd on PFS compared to several other regimens, including IhKd, hKd, PVd, SVd, Kd, and Vd. Similarly, a favourable effect on OS was observed relative to hKd, PVd, SVd, and Vd. However, the magnitude of these effects remains uncertain.
References
1.Kyle RA, Rajkumar SV. Criteria for diagnosis, staging, risk stratification and response assessment of multiple myeloma. Leukemia. 2009;23(1):3-9. doi:10.1038/leu.2008.291 PubMed
2.Bird SA, Boyd K. Multiple myeloma: An overview of management. Palliat Care Soc Pract. 2019;13:1178224219868235. doi:10.1177/1178224219868235 PubMed
3.Rajkumar SV. Multiple myeloma: 2022 update on diagnosis, risk stratification, and management. Am J Hematol. 2022;97(8):1086-1107. doi:10.1002/ajh.26590 PubMed
4.Canadian Cancer Society. Canadian Cancer Statistics 2023. 2023. Accessed January 15, 2025. https://cdn.cancer.ca/-/media/files/Research/Cancer%20statistics/2023%20Statistics/2023_Source_file.xlsx
5.Government of Canada. Canadian Cancer Statistics. 2023. Accessed January 16, 2025. https://cdn.cancer.ca/-/media/files/research/cancer-statistics/2023-statistics/2023_PDF_EN.pdf
6.Canadian Cancer Society. Canadian Cancer Statistics 2024. 2024. Accessed January 16, 2025. https://cdn.cancer.ca/-/media/files/research/cancer-statistics/2024-statistics/2024-cmaj/2024_source_file.xlsx?rev=-1&hash=737473C6BAAFBC54A248916D53650E13&_gl=1*6ktbdi*_gcl_au*MTAwMTgxNzY3My4xNzI4MzEwNDkz
7.Podar K, Leleu X. Relapsed/Refractory Multiple Myeloma in 2020/2021 and Beyond. Cancers (Basel). 2021;13(20):5154. doi:10.3390/cancers13205154 PubMed
8.Mikhael J, Ismaila N, Cheung MC, et al. Treatment of Multiple Myeloma: ASCO and CCO Joint Clinical Practice Guideline. J Clin Oncol. 2019;37(14):1228-1263. doi:10.1200/jco.18.02096 PubMed
9.Canadian Cancer Society. Symptoms of multiple myeloma. Accessed January 16, 2025. https://cancer.ca/en/cancer-information/cancer-types/multiple-myeloma/signs-and-symptoms
10.Canadian Cancer Society. Stages of multiple myeloma. 2024. Accessed January 16, 2025. https://cancer.ca/en/cancer-information/cancer-types/multiple-myeloma/staging
11.Greipp PR, San Miguel J, Durie BG, et al. International staging system for multiple myeloma. J Clin Oncol. 2005;23(15):3412-20. doi:10.1200/jco.2005.04.242 PubMed
12.Canadian Cancer Society. Survival statistics for multiple myeloma. 2024. Accessed January 16, 2025. https://cancer.ca/en/cancer-information/cancer-types/multiple-myeloma/prognosis-and-survival/survival-statistics
13.Da Vià MC, Ziccheddu B, Maeda A, Bagnoli F, Perrone G, Bolli N. A Journey Through Myeloma Evolution: From the Normal Plasma Cell to Disease Complexity. Hemasphere. 2020;4(6):e502. doi:10.1097/hs9.0000000000000502 PubMed
14.Anderson KC, Kyle RA, Rajkumar SV, Stewart AK, Weber D, Richardson P. Clinically relevant end points and new drug approvals for myeloma. Leukemia. 2008;22(2):231-9. doi:10.1038/sj.leu.2405016 PubMed
15.Sonneveld P, Broijl A. Treatment of relapsed and refractory multiple myeloma. Haematologica. 2016;101(4):396-406. doi:10.3324/haematol.2015.129189 PubMed
16.McCurdy A, Mian H, LeBlanc R, et al. Redefining attrition in multiple myeloma (MM): a Canadian Myeloma Research Group (CMRG) analysis. Blood Cancer J. 2023;13(1):111. doi:10.1038/s41408-023-00883-x PubMed
17.Ramsenthaler C, Osborne TR, Gao W, et al. The impact of disease-related symptoms and palliative care concerns on health-related quality of life in multiple myeloma: a multi-centre study. BMC Cancer. 2016;16:427. doi:10.1186/s12885-016-2410-2 PubMed
18.Baz R, Lin HM, Hui AM, et al. Development of a conceptual model to illustrate the impact of multiple myeloma and its treatment on health-related quality of life. Support Care Cancer. 2015;23(9):2789-97. doi:10.1007/s00520-015-2644-6 PubMed
19.U.S. Food and Drug Administration. Hematologic Malignancies: Regulatory Considerations for Use of Minimal Residual Disease in Development of Drug and Biological Products for Treatment: Guidance for Industry [sponsor submitted reference]. 2020. https://www.fda.gov/media/134605/download
20.Bassler D, Briel M, Montori VM, et al. Stopping Randomized Trials Early for Benefit and Estimation of Treatment Effects: Systematic Review and Meta-regression Analysis. JAMA. 2010;303(12):1180-1187. doi:10.1001/jama.2010.310 PubMed
21.Briel M, Bassler D, Wang AT, Guyatt GH, Montori VM. The dangers of stopping a trial too early. J Bone Joint Surg Am. 2012;94 Suppl 1:56-60. doi:10.2106/jbjs.k.01412 PubMed
22.Wilcox RA, Djulbegovic B, Moffitt HL, Guyatt GH, Montori VM. Randomized trials in oncology stopped early for benefit. J Clin Oncol. 2008;26(1):18-9. doi:10.1200/jco.2007.13.6259 PubMed
23.Balshem H, Helfand M, Schünemann HJ, et al. GRADE guidelines: 3. Rating the quality of evidence. Journal of Clinical Epidemiology. 2011;64(4):401-406. doi:10.1016/j.jclinepi.2010.07.015 PubMed
24.Santesso N, Glenton C, Dahm P, et al. GRADE guidelines 26: informative statements to communicate the findings of systematic reviews of interventions. J Clin Epi. 2020;119:126-135. doi:10.1016/j.jclinepi.2019.10.014 PubMed
25.Kumar S, Paiva B, Anderson KC, et al. International Myeloma Working Group consensus criteria for response and minimal residual disease assessment in multiple myeloma. Lancet Oncol. 2016;17(8):e328-e346. doi:10.1016/S1470-2045(16)30206-6 PubMed
26.GlaxoSmithKline Inc. DREAMM-7 - Clinical Study Report (Primary analysis, DCO: 2 Oct 2023). 2024.
27.GlaxoSmithKline I. DREAMM-7 - Clinical Study Report Addendum (IA2, DCO: 7 Oct 2024). 2024.
28.CDA-AMC. CDA Reimbursement Review for Selinexor (Xpovio). 2022. Accessed December 6, 2024. https://www.cadth.ca/selinexor
29.Moreau P, Dimopoulos MA, Mikhael J, et al. Isatuximab, carfilzomib, and dexamethasone in relapsed multiple myeloma (IKEMA): a multicentre, open-label, randomised phase 3 trial. Lancet. 2021;397(10292):2361-2371. doi:10.1016/S0140-6736(21)00592-4 PubMed
30.Bruno AS, Willson JL, Opalinska JM, et al. Recent real-world treatment patterns and outcomes in US patients with relapsed/refractory multiple myeloma. Expert Review of Hematology. 2020;13(9):1017-1025. PubMed
31.Tai YT, Mayes PA, Acharya C, et al. Novel anti-B-cell maturation antigen antibody-drug conjugate (GSK2857916) selectively induces killing of multiple myeloma. Blood. 2014;123(20):3128-38. doi:10.1182/blood-2013-10-535088 PubMed
32.Tai YT, Anderson KC. Targeting B-cell maturation antigen in multiple myeloma. Immunotherapy. 2015;7(11):1187-99. doi:10.2217/imt.15.77 PubMed
33.Montes de Oca R, Alavi AS, Vitali N, et al. Belantamab mafodotin (GSK2857916) drives immunogenic cell death and immune-mediated antitumor responses in vivo. Molecular Cancer Therapeutics. 2021;20(10):1941-1955. PubMed
34.Proskorovsky I, Lewis P, Williams CD, et al. Mapping EORTC QLQ-C30 and QLQ-MY20 to EQ-5D in patients with multiple myeloma. Health Qual Life Outcomes. 2014;12:35. doi:10.1186/1477-7525-12-35 PubMed
35.Shamseer L, Moher D, Clarke M, et al. Preferred reporting items for systematic review and meta-analysis protocols (PRISMA-P) 2015: elaboration and explanation. BMJ. 2015;350:g7647. doi:10.1136/bmj.g7647 PubMed
36.Electronic Medicines Compendium. BLENREP 100 mg powder for concentrate for solution for infusion - Summary of Product Characteristics (SmPC). 2023. Accessed February 28, 2024] https://www.medicines.org.uk/emc/product/12545/smpc#gref
37.BLENREP (belantamab mafodotin for injection) 50 mg/mL powder solution for infusion [product monograph]. GlaxoSmithKline Inc.; 2024.
38.DARZALEX (daratumumab): 20 mg/mL concentrate for solution for infusion [product monograph]. Janssen Inc.; April 30, 2024.
39.SARCLISA (isatuximab for injection): 100 mg/5 mL or 500 mg/25 mL, concentrate for solution for infusion, in single use vial [product monograph]. Sanofi-aventis Canada Inc.; January 12, 2024.
40.VELCADE (bortezomib for injection) Lyophilized powder, 3.5 mg/vial bortezomib, as the mannitol boronic ester intravenous or subcutaneous injection [Product Monograph]. February 7, 2022.
41.Xpovio (selinexor): 20 mg oral tablets [product monograph]. FORUS Therapeutics Inc; March 22, 2024.
42.Pomalyst (pomalidomide): 1 mg, 2 mg, 3 mg and 4 mg, oral capsules [product monograph]. Bristol-Myers Squibb Canada; January 25, 2024.
43.Kyprolis (carfilzomib): 10, 30, 60 mg per vial, powder for injection [product monograph]. Amgen Canada Inc.; October 19, 2018.
44.Rajkumar SV, Dimopoulos MA, Palumbo A, et al. International Myeloma Working Group updated criteria for the diagnosis of multiple myeloma. Lancet Oncol. 2014;15(12):e538-48. doi:10.1016/S1470-2045(14)70442-5 PubMed
45.GlaxoSmithKline Inc. DREAMM-7 - Study Protocol (Amendment 6). 2024.
46.Durie BG, Harousseau JL, Miguel JS, et al. International uniform response criteria for multiple myeloma. Leukemia. 2006;20(9):1467-73. doi:10.1038/sj.leu.2404284 PubMed
47.Kumar S, Paiva B, Anderson KC, et al. International Myeloma Working Group consensus criteria for response and minimal residual disease assessment in multiple myeloma. The Lancet Oncology. 2016;17(8):e328-e346. doi:10.1016/S1470-2045(16)30206-6 PubMed
48.Pazdur R. Endpoints for assessing drug activity in clinical trials. Oncologist. 2008;13 Suppl 2:19-21. doi:10.1634/theoncologist.13-S2-19 PubMed
49.U.S. Food and Drug Administration. Clinical Trial Endpoints for the Approval of Cancer Drugs and Biologics: Guidance for Industry. 2018. Accessed April 15, 2024. https://www.fda.gov/media/71195/download
50.Richardson PG, Oriol A, Beksac M, et al. Pomalidomide, bortezomib, and dexamethasone for patients with relapsed or refractory multiple myeloma previously treated with lenalidomide (OPTIMISMM): a randomised, open-label, phase 3 trial. Lancet Oncol. 2019;20(6):781-794. doi:10.1016/S1470-2045(19)30152-4 PubMed
51.Sonneveld P, Chanan-Khan A, Weisel K, et al. Overall Survival With Daratumumab, Bortezomib, and Dexamethasone in Previously Treated Multiple Myeloma (CASTOR): A Randomized, Open-Label, Phase III Trial. J Clin Oncol. 2023;41(8):1600-1609. doi:10.1200/JCO.21.02734 PubMed
52.Dimopoulos M, Quach H, Mateos MV, et al. Carfilzomib, dexamethasone, and daratumumab versus carfilzomib and dexamethasone for patients with relapsed or refractory multiple myeloma (CANDOR): results from a randomised, multicentre, open-label, phase 3 study. Lancet. 2020;396(10245):186-197. doi:10.1016/S0140-6736(20)30734-0 PubMed
53.GlaxoSmithKline Inc. DREAMM-7 - Statistical Analysis Plan v3.0. 2024.
54.Aaronson NK, Ahmedzai S, Bergman B, et al. The European Organization for Research and Treatment of Cancer QLQ-C30: A quality-of-life instrument for use in international clinical trials in oncology. J Natl Cancer Inst. 1993;85(5):365-76. doi:10.1093/jnci/85.5.365 PubMed
55.Fayers PM, Aaronson NK, Bjordal K, Groenvold M, Curran D, Bottomley A. The EORTC QLQ-C30 scoring manual (3rd Edition). European Organisation for Research and Treatment of Cancer; 2001. Accessed November 6, 2023. https://www.eortc.org/app/uploads/sites/2/2018/02/SCmanual.pdf
56.Osborne TR, Ramsenthaler C, Siegert RJ, Edmonds PM, Schey SA, Higginson IJ. What issues matter most to people with multiple myeloma and how well are we measuring them? A systematic review of quality of life tools. Eur J Haematol. 2012;89(6):437-57. doi:10.1111/ejh.12012 PubMed
57.Kvam AK, Wisloff F, Fayers PM. Minimal important differences and response shift in health-related quality of life: A longitudinal study in patients with multiple myeloma. Health Qual Life Outcomes. 2010;8(1):79. doi:10.1186/1477-7525-8-79 PubMed
58.Wisloff F, Eika S, Hippe E, et al. Measurement of health-related quality of life in multiple myeloma. Nordic Myeloma Study Group. Br J Haematol. 1996;92(3):604-13. doi:10.1046/j.1365-2141.1996.352889.x PubMed
59.Danaher EH, Ferrans C, Verlen E, et al. Fatigue and physical activity in patients undergoing hematopoietic stem cell transplant. Oncol Nurs Forum. 2006;33(3):614-24. doi:10.1188/06.ONF.614-624 PubMed
60.Molassiotis A, Wilson B, Blair S, Howe T, Cavet J. Unmet supportive care needs, psychological well-being and quality of life in patients living with multiple myeloma and their partners. Psychooncology. 2011;20(1):88-97. doi:10.1002/pon.1710 PubMed
61.Ringdal K, Ringdal GI, Kaasa S, et al. Assessing the consistency of psychometric properties of the HRQoL scales within the EORTC QLQ-C30 across populations by means of the Mokken Scaling Model. Qual Life Res. 1999;8(1-2):25-43. doi:10.1023/a:1026419414249 PubMed
62.Kvam AK, Fayers PM, Wisloff F. Responsiveness and minimal important score differences in quality-of-life questionnaires: A comparison of the EORTC QLQ-C30 cancer-specific questionnaire to the generic utility questionnaires EQ-5D and 15D in patients with multiple myeloma. Eur J Haematol. 2011;87(4):330-7. doi:10.1111/j.1600-0609.2011.01665.x PubMed
63.Kvam AK, Fayers P, Wisloff F. What changes in health-related quality of life matter to multiple myeloma patients? A prospective study. Eur J Haematol. 2010;84(4):345-53. doi:10.1111/j.1600-0609.2009.01404.x PubMed
64.Spencer A, Lentzsch S, Weisel K, et al. Daratumumab plus bortezomib and dexamethasone versus bortezomib and dexamethasone in relapsed or refractory multiple myeloma: updated analysis of CASTOR. Haematologica. 2018;103(12):2079-2087. doi:10.3324/haematol.2018.194118 PubMed
65.Hungria V, Robak P, Hus M, et al. Belantamab Mafodotin, Bortezomib, and Dexamethasone for Multiple Myeloma (Supplement). N Engl J Med. 2024;391(5):393-407. doi:10.1056/NEJMoa2405090 PubMed
66.Lan KKG, DeMets DL. Discrete Sequential Boundaries for Clinical Trials. Biometrika. 1983;70(3):659-663. doi:10.2307/2336502
67.Brookmeyer R, Crowley J. A Confidence Interval for the Median Survival Time. Biometrics. 1982;38(1):29-41. doi:10.2307/2530286
68.Uno H, Tian L, Claggett B, Wei LJ. A versatile test for equality of two survival functions based on weighted differences of Kaplan-Meier curves. Stat Med. 2015;34(28):3680-95. doi:10.1002/sim.6591 PubMed
69.Watkins C, Huang X, Latimer N, Tang Y, Wright EJ. Adjusting overall survival for treatment switches: commonly used methods and practical application. Pharm Stat. 2013;12(6):348-57. doi:10.1002/pst.1602 PubMed
70.Huang B, Tian L. Utilizing restricted mean duration of response for efficacy evaluation of cancer treatments. Pharm Stat. 2022;21(5):865-878. doi:10.1002/pst.2198 PubMed
71.Hungria V, Robak P, Hus M, et al. Belantamab Mafodotin, Bortezomib, and Dexamethasone vs Daratumumab, Bortezomib, and Dexamethasone in Relapsed/Refractory Multiple Myeloma: Overall Survival Analysis and Updated Efficacy Outcomes of the Phase 3 DREAMM-7 Trial (AWAITING PUBLICATION [CONFIDENTIAL]). 66th ASH Annual Meeting & Exposition; 2024.
72.Dimopoulos M, Sonneveld P, Manier S, et al. Progression-free survival as a surrogate endpoint for overall survival in patients with relapsed or refractory multiple myeloma. BMC Cancer. 2024;24(1):541. doi:10.1186/s12885-024-12263-0 PubMed
73.GlaxoSmithKline I. DREAMM-7 - Clinical Study Report (Primary analysis, DCO: 2 Oct 2023). 2024.
74.Sterne JAC, Savović J, Page MJ, et al. RoB 2: a revised tool for assessing risk of bias in randomised trials. BMJ. 2019;366:l4898. doi:10.1136/bmj.l4898 PubMed
75.Yang ZR, Sun F, Zhan SY. [Risk on bias assessment: (2) Revised Cochrane risk of bias tool for individually randomized, parallel group trials (RoB2.0)]. Zhonghua Liu Xing Bing Xue Za Zhi. 2017;38(9):1285-1291. doi:10.3760/cma.j.issn.0254-6450.2017.09.028 PubMed
76.GlaxoSmithKline Inc. Systematic literature review (SLR) and Network meta-analysis (NMA) of B-Vd versus comparative treatments for patients with 2L+ relapsed/refractory multiple myeloma (RRMM). 2024.
77.Palumbo A, Chanan-Khan A, Weisel K, et al. Daratumumab, Bortezomib, and Dexamethasone for Multiple Myeloma. N Engl J Med. 2016;375(8):754-66. doi:10.1056/NEJMoa1606038 PubMed
78.Mateos MV, Sonneveld P, Hungria V, et al. Daratumumab, Bortezomib, and Dexamethasone Versus Bortezomib and Dexamethasone in Patients With Previously Treated Multiple Myeloma: Three-year Follow-up of CASTOR. Clin Lymphoma Myeloma Leuk. 2020;20(8):509-518. doi:10.1016/j.clml.2019.09.623 PubMed
79.Lu J, Fu W, Li W, et al. Daratumumab, Bortezomib, and Dexamethasone Versus Bortezomib and Dexamethasone in Chinese Patients with Relapsed or Refractory Multiple Myeloma: Phase 3 LEPUS (MMY3009) Study. Clin Lymphoma Myeloma Leuk. 2021;21(9):e699-e709. doi:10.1016/j.clml.2021.04.012 PubMed
80.Turner RM, Jackson D, Wei Y, Thompson SG, Higgins JP. Predictive distributions for between-study heterogeneity and simple methods for their application in Bayesian meta-analysis. Stat Med. 2015;34(6):984-98. doi:10.1002/sim.6381 PubMed
81.Brooks SP, Gelman A. General Methods for Monitoring Convergence of Iterative Simulations. Journal of Computational and Graphical Statistics. 1998;7(4):434-455. doi:10.1080/10618600.1998.10474787
82.Chen W, Xia Z, Fang B, et al. P-192: Circularly permuted TRAIL (CPT) combined with Thalidomide and Dexamethasone in patients with relapsed/refractory Multiple Myeloma: a randomized, double-blind, placebo-controlled phase 3 study. Clinical Lymphoma, Myeloma and Leukemia. 2021;21:S143. doi:10.1016/S2152-2650(21)02319-3
83.Hjorth M, Hjertner O, Knudsen LM, et al. Thalidomide and dexamethasone vs. bortezomib and dexamethasone for melphalan refractory myeloma: a randomized study. Eur J Haematol. 2012;88(6):485-96. doi:10.1111/j.1600-0609.2012.01775.x PubMed
84.Kumar SK, Harrison SJ, Cavo M, et al. Venetoclax or placebo in combination with bortezomib and dexamethasone in patients with relapsed or refractory multiple myeloma (BELLINI): a randomised, double-blind, multicentre, phase 3 trial. Lancet Oncol. 2020;21(12):1630-1642. doi:10.1016/S1470-2045(20)30525-8 PubMed
85.Leng Y, Hou J, Jin J, et al. Circularly permuted TRAIL plus thalidomide and dexamethasone versus thalidomide and dexamethasone for relapsed/refractory multiple myeloma: a phase 2 study. Cancer Chemother Pharmacol. 2017;79(6):1141-1149. doi:10.1007/s00280-017-3310-0 PubMed
86.Raje NS, Moreau P, Terpos E, et al. Phase 2 study of tabalumab, a human anti-B-cell activating factor antibody, with bortezomib and dexamethasone in patients with previously treated multiple myeloma. Br J Haematol. 2017;176(5):783-795. doi:10.1111/bjh.14483 PubMed
87.Xia Z, Leng Y, Fang B, et al. Aponermin or placebo in combination with thalidomide and dexamethasone in the treatment of relapsed or refractory multiple myeloma (CPT-MM301): a randomised, double-blinded, placebo-controlled, phase 3 trial. BMC Cancer. 2023;23(1):980. doi:10.1186/s12885-023-11489-8 PubMed
88.Moreau P, Mateos MV, Berenson JR, et al. Once weekly versus twice weekly carfilzomib dosing in patients with relapsed and refractory multiple myeloma (A.R.R.O.W.): interim analysis results of a randomised, phase 3 study. Lancet Oncol. 2018;19(7):953-964. doi:10.1016/S1470-2045(18)30354-1 PubMed
89.Grosicki S, Simonova M, Spicka I, et al. Once-per-week selinexor, bortezomib, and dexamethasone versus twice-per-week bortezomib and dexamethasone in patients with multiple myeloma (BOSTON): a randomised, open-label, phase 3 trial. Lancet. 2020;396(10262):1563-1573. doi:10.1016/S0140-6736(20)32292-3 PubMed
90.Usmani SZ, Quach H, Mateos MV, et al. Final analysis of carfilzomib, dexamethasone, and daratumumab vs carfilzomib and dexamethasone in the CANDOR study. Blood Adv. 2023;7(14):3739-3748. doi:10.1182/bloodadvances.2023010026 PubMed
91.Orlowski RZ, Moreau P, Niesvizky R, et al. Carfilzomib-Dexamethasone Versus Bortezomib-Dexamethasone in Relapsed or Refractory Multiple Myeloma: Updated Overall Survival, Safety, and Subgroups. Clin Lymphoma Myeloma Leuk. 2019;19(8):522-530 e1. doi:10.1016/j.clml.2019.04.018 PubMed
92.Dimopoulos MA, Moreau P, Palumbo A, et al. Carfilzomib and dexamethasone versus bortezomib and dexamethasone for patients with relapsed or refractory multiple myeloma (ENDEAVOR): a randomised, phase 3, open-label, multicentre study. Lancet Oncol. 2016;17(1):27-38. doi:10.1016/S1470-2045(15)00464-7 PubMed
93.Mateos M-VO, Sureda Balari A, Oriol A, et al. Randomized Phase 2 Study of Weekly Carfilzomib 70 Mg/M2 and Dexamethasone Plus/Minus Cyclophosphamide in Relapsed and/or Refractory Multiple Myeloma (RRMM) Patients (GEM-KyCyDex). Blood. 2020:8-9.
94.San-Miguel JF, Hungria VT, Yoon SS, et al. Overall survival of patients with relapsed multiple myeloma treated with panobinostat or placebo plus bortezomib and dexamethasone (the PANORAMA 1 trial): a randomised, placebo-controlled, phase 3 trial. Lancet Haematol. 2016;3(11):e506-e515. doi:10.1016/S2352-3026(16)30147-8 PubMed
95.San-Miguel JF, Hungria VT, Yoon SS, et al. Panobinostat plus bortezomib and dexamethasone versus placebo plus bortezomib and dexamethasone in patients with relapsed or relapsed and refractory multiple myeloma: a multicentre, randomised, double-blind phase 3 trial. Lancet Oncol. 2014;15(11):1195-206. doi:10.1016/S1470-2045(14)70440-1 PubMed
96.Jakubowiak A, Offidani M, Pegourie B, et al. Randomized phase 2 study: elotuzumab plus bortezomib/dexamethasone vs bortezomib/dexamethasone for relapsed/refractory MM. Blood. 2016;127(23):2833-40. doi:10.1182/blood-2016-01-694604 PubMed
97.Kropff M, Vogel M, Bisping G, et al. Bortezomib and low-dose dexamethasone with or without continuous low-dose oral cyclophosphamide for primary refractory or relapsed multiple myeloma: a randomized phase III study. Ann Hematol. 2017;96(11):1857-1866. doi:10.1007/s00277-017-3065-z PubMed
98.Dimopoulos MA, Kaufman JL, White D, et al. A Comparison of the Efficacy of Immunomodulatory-containing Regimens in Relapsed/Refractory Multiple Myeloma: A Network Meta-analysis. Clin Lymphoma Myeloma Leuk. 2018;18(3):163-173 e6. doi:10.1016/j.clml.2017.12.011 PubMed
99.Rose CJ, Ohm IK, Giske L, Naess GE, Fretheim A. Effect modification in network meta-analyses for relapsed/refractory multiple myeloma: systematic review and meta-analysis. BMJ Open. 2023;13(8):e067966. doi:10.1136/bmjopen-2022-067966 PubMed
Appendix 1: Detailed Outcome Data
Please note that this appendix has not been copy-edited.
Table 28: Studies Included in the NMA Evidence Network
Trial | Intervention | Comparator | Year | Phase | N | Dosing and schedule |
|---|---|---|---|---|---|---|
ARROW trial88 | Kd | hKd | 2018 | 3 | 478 | Kd: Carfilzomib on day 1, day 2, day 8, day 9, day 15, day 16 (10-minute infusion) plus dexamethasone 40 mg weekly hKD: Carfilzomib on day 1, day 8, day 15 (30-minute infusion) plus dexamethasone 40 mg weekly |
BOSTON trial89 | SVd | Vd | 2020 | 3 | 402 | SVd: Selinexor (100 mg), bortezomib (1.3 mg/m2), dexamethasone (20 mg) once weekly Vd: Bortezomib (1.3 mg/m2) and dexamethasone (20 mg) twice weekly for first 24 weeks, once weekly thereafter |
hkDd | hKd | 2023 | 3 | 466 | hkDd: Carfilzomib on day 1, day 2, day 8, day 9, day 15, and day 16 (56 mg/m2 after first cycle), daratumumab (16 mg/kg) every week for first 2 cycles, then every 2 weeks for 4 cycles, and every 4 weeks thereafter, dexamethasone 40 mg weekly hKd: Carfilzomib (same schedule) plus dexamethasone 40 mg weekly | |
DVd | Vd | 2016 | 3 | 498 | DVd: Daratumumab 16 mg/kg on day 1, day 8, day 15 of cycle 1 to cycle 3, every 3 weeks for cycle 4 to cycle 8, and every 4 weeks thereafter; bortezomib 1.3 mg/m2 on day 1, day 4, day 8, and day 11 of a 21-day cycle; dexamethasone 20 mg on day 1, day 2, day 4, day 5, day 8, day 9, day 11, and day 12 Vd: Bortezomib and dexamethasone on the same schedule as DVd group | |
hKd | Vd | 2016 | 3 | 929 | hKd: Carfilzomib 20 mg/m2 on day 1 and day 2 of cycle 1, 56 mg/m2 thereafter on day 1, day 2, day 8, day 9, day 15, and day 16; dexamethasone 20 mg on day 1, day 2, day 8, day 9, day 15, day 16, day 22, and day 23 of a 28-day cycle Vd: Bortezomib 1.3 mg/m2 on day 1, day 4, day 8, and day 11 of a 21-day cycle; dexamethasone 20 mg on day 1, day 2, day 4, day 5, day 8, day 9, day 11, and day 12 | |
IKEMA trial29 | IhKd | hKd | 2021 | 3 | 302 | IhKd: Isatuximab 10 mg/kg intravenously weekly for the first 4 weeks, then every 2 weeks; carfilzomib 20 mg/m2 on day 1 and day 2, then 56 mg/m2 on days 8, 9, 15, and 16 of the first cycle, and 56 mg/m2 on day 1, day 2, day 8, day 9, day 15, and day 16 of subsequent cycles; dexamethasone 20 mg on day 1, day 2, day 8, day 9, day 15, day 16, day 22, and day 23 hKd: Same schedule as IhKd |
OPTIMISMM trial50 | PVd | Vd | 2019 | 3 | 559 | PVd: Pomalidomide 4 mg orally on day 1 to day 14, bortezomib 1.3 mg/m2 on day 1, day 4, day 8, and day 11 (first 8 cycles), dexamethasone 20 mg on day 1, day 2, day 4, day 5, day 8, day 9, day 11, and day 12 for cycle 1 to cycle 8, day 1, day 2, day 8, and day 9 from cycle 9 onward Vd: Bortezomib and dexamethasone on the same schedule as PVD group |
GEM-KyCyDex trial93 | CyKd | hKd | 2020 | 2 | 198 | CyKd: Carfilzomib 70 mg/m2 on day 1, day 8, day 15; cyclophosphamide 300 mg/m2 on day 1, day 8, day 15; dexamethasone 20 mg weekly hKd: Carfilzomib 70 mg/m2 on day 1, day 8, day 15; dexamethasone 20 mg weekly |
LEPUS trial79 | DVd | Vd | 2021 | 3 | 211 | DVd: Daratumumab 16 mg/kg weekly during cycle 1 to cycle 3, every 3 weeks during cycle 4 to cycle 8, and every 4 weeks thereafter; bortezomib 1.3 mg/m2 on day 1, day 4, day 8, and day 11; dexamethasone 20 mg orally/IV on day 1, day 2, day 4, day 5, day 8, day 9, day 11, and day 12 Vd: Bortezomib 1.3 mg/m2 on day 1, day 4, day 8, and day 11; dexamethasone 20 mg orally/IV on day 1, day 2, day 4, day 5, day 8, day 9, day 11, and day 12 |
PanoVd | Vd | 2014 | 3 | 768 | PanoVd: Panobinostat 20 mg on day 1, day 3, day 5, day 8, day 10, day 12; bortezomib 1.3 mg/m2 on day 1, day 4, day 8, and day 11; dexamethasone 20 mg on day 1, day 2, day 4, day 5, day 8, day 9, day 11, and day 12 Vd: Placebo plus bortezomib plus dexamethasone on the same schedule | |
NCT01478048 trial96 | EVd | Vd | 2016 | 2 | 152 | EVd: Elotuzumab 10 mg/kg on day 1, day 8, day 15, and day 22 (21-day cycles), then day 1 and day 11 from cycle 3 onward, bortezomib 1.3 mg/m2 on day 1, day 4, day 8, and day 11, dexamethasone 20 mg on day 1, day 2, day 4, day 5, day 8, day 9, day 11, and day 12 Vd: Bortezomib and dexamethasone on the same schedule as EVd group |
NCT00813150 trial97 | CyVd | Vd | 2017 | 3 | 96 | CyVd: Bortezomib 1.3 mg/m2 on day 1, day 4, day 8, and day 11; dexamethasone 20 mg orally on day 1, day 2, day 4, day 5, day 8, day 9, day 11, and day 12; cyclophosphamide 50 mg orally daily Vd: Bortezomib 1.3 mg/m2 on day 1, day 4, day 8, and day 11; dexamethasone 20 mg orally on day 1, day 2, day 4, day 5, day 8, day 9, day 11, and day 12 |
DREAMM-7 trial26 | BVd | DVd | 2024 | 3 | 494 | BVd: Belantamab 2.5 mg/kg IV on day 1 of every 21-day cycle; bortezomib 1.3 mg/m2 SC on day 1, day 4, day 8, and day 11 of every 21-day cycle for a total of 8 cycles; dexamethasone 20 mg (orally or IV) on the day of and the day after bortezomib treatment DVd: Daratumumab 16 mg/kg IV weekly for cycle 1 to cycle 3 (9 doses), Day 1 of cycle 4 to cycle 8 (5 doses), then every 4 weeks from cycle 9 onward; bortezomib and dexamethasone on the same schedule as BVd group |
BVd = belantamab mafodotin plus bortezomib and dexamethasone; CyhKd = cyclophosphamide plus high-dose carfilzomib plus dexamethasone; CyVd = cyclophosphamide plus bortezomib plus dexamethasone; DVd = daratumumab plus bortezomib and dexamethasone; EVd = elotuzumab plus bortezomib plus dexamethasone; hKd = high-dose carfilzomib plus dexamethasone; hkDd = high-dose carfilzomib plus daratumumab plus dexamethasone; IhKd = isatuximab plus high-dose carfilzomib plus dexamethasone; Kd = carfilzomib plus dexamethasone; PanoVd = panobinostat plus bortezomib plus dexamethasone; PVd = pomalidomide plus bortezomib plus dexamethasone; SVd = selinexor plus bortezomib plus dexamethasone; Vd = bortezomib plus dexamethasone.
Note: The BOSTON, LEPUS, and OPTIMISMM trials are the only studies in which crossover was permitted, while the PANORAMA-1 trial is the only double-blind study. All other trials were conducted with an open-label design.
Source: Sponsor-submitted indirect treatment comparison report.76
Pharmacoeconomic Review
Abbreviations
AE
adverse event
BCMA
B-cell maturation antigen
BIA
budget impact analysis
BPd
belantamab mafodotin plus pomalidomide and dexamethasone
BVd
belantamab mafodotin in combination with bortezomib and dexamethasone
CDA-AMC
Canada’s Drug Agency
cilta-cel
ciltacabtagene autoleucel
CUA
cost-utility analysis
CyKd
cyclophosphamide plus carfilzomib and dexamethasone
CyPd
cyclophosphamide plus pomalidomide and dexamethasone
DVd
daratumumab in plus bortezomib and dexamethasone
HR
hazard ratio
ICER
incremental cost-effectiveness ratio
IsaKd
isatuximab in combination with carfilzomib and dexamethasone
IPD
individual participant data
Kd
carfilzomib plus dexamethasone
LY
life-year
MM
multiple myeloma
NMA
network meta-analysis
OS
overall survival
pCPA
pan-Canadian Pharmaceutical Alliance
Pd
pomalidomide plus dexamethasone
PFS
progression-free survival
PSM
partitioned survival model
PVd
pomalidomide plus bortezomib plus dexamethasone
QALY
quality-adjusted life-year
RDI
relative dose intensity
RRMM
relapsed or refractory multiple myeloma
SVd
selinexor plus bortezomib plus dexamethasone
TTD
time to treatment discontinuation
Vd
bortezomib plus dexamethasone
Economic Review
The objective of the economic review undertaken by Canada’s Drug Agency (CDA-AMC) is to review and critically appraise the pharmacoeconomic evidence submitted by the sponsor on the cost-effectiveness and budget impact of belantamab mafodotin in combination with bortezomib and dexamethasone (BVd) compared to comparators for the treatment of adults with relapsed or refractory multiple myeloma (RRMM) who have received at least 1 prior line of therapy.
Item | Description |
|---|---|
Drug product | Belantamab mafodotin (Blenrep), powder for solution for injection (50 mg/mL), 70 mg and 100 mg single-use vials |
Indication | Belantamab mafodotin in combination with bortezomib and dexamethasone is indicated for the treatment of adults with relapsed or refractory multiple myeloma who have received at least 1 prior line of therapy. |
Submitted price | Belantamab mafodotin: $19,460.00 per 70 mg vial Belantamab mafodotin: $27,800.00 per 100 mg vial |
Health Canada approval status | NOC |
Health Canada review pathway | Standard review |
NOC date | July 18, 2025 |
Reimbursement request | Per indication |
Sponsor | GlaxoSmithKline Inc. |
Submission history | Previously reviewed: No |
NOC = Notice of Compliance.
Key Messages
Belantamab mafodotin is available as powder for solution for injection (50 mg/mL). At the submitted price of $278.00 per mg (available as 70 mg or 100 mg single-use vials), the 28-day cycle cost of belantamab mafodotin is expected to be $77,656 per patient in the first cycle of treatment and $74,133 in subsequent cycles, based on the Health Canada–recommended dosage.
Clinical efficacy in the economic analysis was derived from the DREAMM-7 trial, which compared BVd with daratumumab in combination with bortezomib and dexamethasone (DVd). Evidence from the DREAMM-7 trial suggests that BVd likely results in a clinically important improvement in progression-free survival (PFS) and overall survival (OS) compared with DVd for patients with multiple myeloma (MM), although OS data remain immature and the effects of BVd on OS beyond 40 months are uncertain. For the comparison between BVd and remaining comparators, clinical efficacy was derived from a sponsor-submitted indirect treatment comparison, which suggests that BVd may result in a favourable PFS or OS benefit versus comparators among patients with MM. However, limitations such as considerable heterogeneity among included studies were identified by CDA-AMC, suggesting that the magnitude of benefit could not be determined.
The results of the CDA-AMC base case suggest the following:
These treatments are on the cost-effectiveness frontier — bortezomib plus dexamethasone (Vd), pomalidomide plus bortezomib plus dexamethasone (PVd), carfilzomib plus dexamethasone (Kd), and BVd.
BVd is associated with higher total costs to the health care system than Kd (incremental costs = $1,649,889), primarily driven by increased drug acquisition costs related to BVd.
BVd is associated with a gain of 1.27 life-years (LYs) compared to Kd and is anticipated to improve health-related quality of life based on time in improved health states where BVd results in a gain of 0.94 quality-adjusted life-years (QALYs) compared to Kd.
The incremental cost-effectiveness ratio (ICER) of BVd compared to Kd is $1,758,284 per QALY gained in the CDA-AMC base case. The estimated ICER was highly sensitive to the predicted OS benefit and drug acquisition costs of BVd, and more than 75% of the incremental benefit was gained in the extrapolated period (i.e., after 40 months). In the absence of comparative evidence beyond this time point and uncertainty in the comparative clinical evidence, the QALYs gained for patients receiving BVd predicted in the CDA-AMC base case are highly uncertain and may be overestimated. Additional price reductions may therefore be required.
CDA-AMC estimates that the budget impact of reimbursing BVd for the treatment of patients with RRMM who have received at least 1 prior line of therapy will be approximately $940 million over the first 3 years of reimbursement compared to the amount currently spent on comparators, with an estimated expenditure of $1.3 billion on BVd over this period. The actual budget impact of reimbursing BVd will depend on BVd dosing assumptions, drug usage, and the distribution of subsequent therapies. The incremental budget impact of BVd is expected to be greater than $40 million in year 1, year 2, and year 3 of reimbursement. Given the substantial difference between the estimates from the sponsor and CDA-AMC, and the resulting uncertainty in the projected impact, these issues must be addressed to ensure the feasibility of adoption.
Summary of the Submitted Economic Evaluation
The sponsor submitted a cost-utility analysis (CUA) to estimate the cost-effectiveness of BVd from the perspective of a public health care payer in Canada over a lifetime horizon (36 years). The modelled population comprised adult patients with RRMM who have received at least 1 prior line of therapy and who had progressive disease during or after the most recent therapy, which is aligned with the Health Canada indication and reimbursement request, and was based on the participants in the DREAMM-7 trial. The sponsor’s base-case analysis included costs related to drug acquisition (the submitted price for belantamab mafodotin as part of the BVd regimen and public list prices for comparators), administration, subsequent treatment, health care resource use, adverse events (AEs), and end-of-life costs.
In the sponsor’s base case, Vd, PVd, and BVd were identified as being on the cost-effectiveness frontier. BVd was associated with incremental costs of $776,271 and 4.48 incremental QALYs and being relative to PVd. This resulted in an ICER of $173,206 per QALY gained. Of the incremental benefit compared to PVd (4.48 incremental QALYs and 5.44 incremental LYs), approximately 67% of QALY benefit and 75% of LYs gained was predicted to be accrued after the treatment duration of the DREAMM-7 trial (trial period = 40 months). Additional information about the sponsor’s submission is summarized in Appendix 3.
CDA-AMC identified several key issues with the sponsor’s analysis (refer to Table 2; full details are provided in Appendix 4). A revised base case was therefore developed.
Table 2: Key Issues With the Sponsor’s Economic Submission
Issue | What evidence is there to inform this issue? | How was this issue addressed by CDA-AMC? | Did CDA-AMC explore uncertainty in a scenario analysis? |
|---|---|---|---|
The magnitude of comparative effectiveness of BVd is highly uncertain based on the indirect evidence submitted by the sponsor. | The clinical review conducted by CDA-AMC could not draw definitive conclusions on the relative effectiveness of BVd vs. comparators. | CDA-AMC could not address this issue in the base case due to a lack of clinical data. | No scenario analysis — best evidence was used in the CDA-AMC base case. |
The long-term OS benefit predicted for BVd relative to other comparators is highly uncertain. | The sponsor predicted an OS benefit for BVd vs. PVd based on immature DREAMM-7 study data. Clinical experts noted that long-term survival remains highly uncertain. | CDA-AMC used the exponential distribution to extrapolate long-term OS for BVd, aligning with clinical expert input. | No scenario analysis — the selected distribution in the CDA-AMC base case was best aligned with clinical expert input and face validity. |
The modelling approach may overestimate comparative efficacy. | The sponsor predicted a postprogression survival benefit with BVd that is not aligned with clinical expectations or available clinical evidence. | CDA-AMC could not address this issue in the base case due to the lack of long-term clinical data and the structural bias surrounding the use of a PSM. | No scenario analysis — best evidence was used in the CDA-AMC base case and assumptions underpinning the PSM structure were not flexible. |
The modelling of TTD led to projections that did not meet face validity and underestimated the drug acquisition cost associated with BVd. | The sponsor assumed patients on BVd would discontinue treatment even if progression-free, but this was not supported by trial data, where progression was the primary reason for stopping treatment. | CDA-AMC assumed alternative parametric distributions to extrapolate TTD for BVd and DVd, resulting in fewer patients predicted to discontinue treatment while progression-free. | No scenario analysis —selected distributions provided best statistical fit for extrapolating TTD. |
The IPD-based approach used to calculate BVd costs underestimated drug acquisition costs. | The sponsor applied dose categorizations and assumptions in the IPD approach that led to an underestimation of BVd drug acquisition costs. | CDA-AMC adopted dosing based on the product monograph, applying RDI consistent with the approach used for DVd and all nontrial comparators. | A scenario analysis was conducted to explore the impact of adopting an IPD costing approach for BVd, as well as the cost of ophthalmologic examinations before infusions, reflecting the Health Canada product monograph. |
The exclusion of ocular toxicity due to BVd from the analysis is inappropriate. Ocular AEs included severe keratopathy, blurred vision, and dry eyes. | The sponsor did not account for disutility associated with ocular toxicity from BVd, despite its occurrence in the DREAMM-7 study and its identification by clinical experts as an important consideration in clinical decision-making. | CDA-AMC included disutility associated with grade 3 and greater ocular toxicity events from BVd. | No scenario analysis — best evidence was used in the CDA-AMC base case. |
The modelling of subsequent therapy is highly uncertain. | The sponsor modelled subsequent therapies as a single 1-time cost, which is methodologically inappropriate. Additionally, the distribution of subsequent treatments lacked face validity. | CDA-AMC excluded subsequent therapy from the base-case analysis. As a result, the impact of these costs on the cost-effectiveness of BVd remains unknown. | CDA-AMC conducted a scenario analysis incorporating subsequent therapy and adjusted fourth-line treatment distribution to reflect clinical practice in Canada. |
The treatment schedule for carfilzomib and dexamethasone is not reflective of clinical practice in Canada. | The sponsor assumed twice weekly dosing for carfilzomib and dexamethasone, but evidence supports the more effective and commonly used once weekly regimen. | CDA-AMC adopted the once weekly dosing schedule in the base-case analysis. | No scenario analysis — best evidence was used in the CDA-AMC base case. |
AE = adverse event; BVd = belantamab mafodotin plus bortezomib and dexamethasone; CDA-AMC = Canada’s Drug Agency; DVd = daratumumab plus bortezomib and dexamethasone; IPD = individual participant data; OS = overall survival; PSM = partitioned survival model; PVd = pomalidomide plus bortezomib plus dexamethasone; RDI = relative dose intensity; TTD = time to treatment discontinuation; vs. = versus.
CDA-AMC Assessment of Cost-Effectiveness
The CDA-AMC base case was derived by making changes to model parameter values and assumptions (refer to Table 8), in consultation with clinical experts. In the CDA-AMC base case, the cost-effectiveness frontier includes Vd, PVd, Kd, and BVd. Hence, cost-effectiveness comparisons are focused on BVd and Kd. Detailed information about the base case is provided in Appendix 4.
Impact on Health Care Costs
BVd is expected to be associated with additional health care costs compared to Kd (incremental costs = $1,649,889). This increase in health care spending results from drug acquisition costs associated with belantamab mafodotin (refer to Figure 1).
Figure 1: Impact of BVd Versus Kd on Health Care Costs
BVd = belantamab mafodotin plus bortezomib and dexamethasone; Kd = carfilzomib plus dexamethasone; PVd = pomalidomide plus dexamethasone plus bortezomib; Vd = bortezomib plus dexamethasone.
Note: Results for Vd and PVd are not presented in Figure 1. Refer to Appendix 4 for full results.
Impact on Health
Relative to Kd, BVd is expected to increase the amount of time a patient remains in the PFS health state by approximately 2.39 years and extend OS by 1.27 years. Considering the impact of treatment on both quality and length of life, BVd is expected to result in 0.94 additional QALYs per patient compared to Kd (refer to Figure 2).
Figure 2: Impact of BVd Versus Kd on Patient Health
BVd = belantamab mafodotin plus bortezomib and dexamethasone; Kd = carfilzomib plus dexamethasone; PD = progressed disease; PFS = progression-free survival; PVd = pomalidomide plus dexamethasone plus bortezomib; QALY = quality-adjusted life-year; Vd = bortezomib plus dexamethasone.
Note: Results for Vd and PVd are not presented in Figure 2. Refer to Appendix 4 for full results.
Overall Results
The results of the CDA-AMC base case suggest an ICER of $1,758,284 per QALY gained for BVd compared to Kd (refer to Table 3). Additional details on the CDA-AMC base case are available in Appendix 4.
Table 3: Summary of CDA-AMC Economic Evaluation Results
Drug | Total costs ($) | Total QALYs | Total LYs | Sequential ICER ($/QALY) |
|---|---|---|---|---|
Vd | 90,820 | 3.48 | 4.28 | Reference |
PVd | 132,386 | 4.57 | 5.61 | 37,966 vs. Vd |
Kd | 252,903 | 5.72 | 7.00 | 105,439 vs. PVd |
BVd | 1,902,792 | 6.66 | 8.29 | 1,758,284 vs. Kd |
BVd = belantamab mafodotin plus bortezomib and dexamethasone; CDA-AMC = Canada’s Drug Agency; ICER = incremental cost-effectiveness ratio; Kd = carfilzomib plus dexamethasone; LY = life-year; PVd = pomalidomide plus dexamethasone plus bortezomib; QALY = quality-adjusted life-year; Vd = bortezomib plus dexamethasone; vs. = versus.
Note: Publicly available list prices were used for all comparators.
Uncertainty and Sensitivity
A scenario analysis was conducted to explore the impact of including subsequent therapies with fourth-line distribution adjusted to meet face validity according to clinical experts consulted for this review. Based on the results of this analysis, the ICER for BVd may be decreased to $1,540,448 per QALY gained compared to Kd.
An additional scenario analysis was conducted to explore the impact of adopting an individual participant data (IPD) costing approach for BVd, as well as the cost of ophthalmologic examinations before infusions, reflecting the Health Canada product monograph. Based on the results of this analysis, the ICER for BVd may be decreased to $1,027,597 per QALY gained compared to Kd.
Summary of the Budget Impact
The sponsor submitted a budget impact analysis (BIA) to estimate the 3-year (2025 to 2027) budget impact of reimbursing BVd for use in patients with RRMM.1 The sponsor assumed that the payer would be public drug plans participating in the CDA-AMC reimbursement review process and derived the size of the eligible population using an epidemiologic approach.2 The price of belantamab mafodotin was aligned with the price included in the sponsor’s economic evaluation, while the prices of comparators were based on the publicly available list prices.3,4 Additional information pertaining to the sponsor’s submission is provided in Appendix 5. CDA-AMC identified a number of issues with the sponsor’s estimated budget impact and made changes to model parameters and assumptions in consultation with clinical experts to derive the CDA-AMC base case (Appendix 5). CDA-AMC estimated that 9,540 patients would be eligible for treatment with BVd over a 3-year period (year 1 = 3,097 patients; year 2 = 3,181 patients; year 3 = 3,262 patients), of whom 1,823 are expected to receive BVd (year 1 = 395 patients; year 2 = 638 patients; year 3 = 790 patients). The estimated incremental budget impact of reimbursing BVd is expected to be approximately $940 million over the first 3 years, with an expected expenditure of $1.3 billion on BVd. The actual budget impact will depend on real-world dosing and drug usage in clinical practice in Canada as well as the proportion and types of subsequent therapies.
Conclusions
Based on the CDA-AMC base case, BVd would be considered cost-effective at the submitted price if the public health care system was willing to pay at least $1,758,284 for each additional QALY gained. If the public health care system is not willing to pay that amount, a price reduction should be considered (refer to Figure 3; full details are in Table 12). The estimated cost-effectiveness of BVd compared to Kd is uncertain due to immaturity of the available OS data and uncertainty in the long-term comparative clinical efficacy of treatment.
The budget impact of reimbursing BVd to the public drug plans in the first 3 years is estimated to be approximately $940 million. The 3-year expenditure on BVd (i.e., not accounting for current expenditure on comparators) is estimated to be $1.3 billion. The estimated budget impact is highly uncertain due to dosing assumptions, drug usage, subsequent therapy, and market share assumptions.
Figure 3: Summary of the CDA-AMC Economic Analysis and Price Reduction
BVd = belantamab mafodotin in combination with bortezomib and dexamethasone; CDA-AMC = Canada’s Drug Agency; ICER = incremental cost-effectiveness ratio; Kd = carfilzomib plus dexamethasone; QALY = quality-adjusted life-year.
Note: The second column in the first table presents the per 28-day cost of belantamab mafodotin. Expenditure includes only the drug cost of BVd.
References
1.GSK. Health Canada Draft Product Monograph (Belantamab Mafodotin). 2024.
2.Budget Impact Analysis [internal sponsor's report]. In: Drug Reimbursement Review sponsor submission: Belantamab mafodotin for injection: powder for solution for infusion, 70 mg/vial, 100 mg/vial, 50 mg/mL. Mississauga (ON): GlaxoSmithKline Inc; 2024 Dec 19.
3.DeltaPA. IQVIA; 2023. Accessed 1800 Jan 1. https://www.iqvia.com/
4.GSK. Data on File. Multiple Myeloma Internal Market Research. 2024.
5.Belantamab mafodotin for injection: powder for solution for infusion, 70 mg/vial, 100 mg/vial, 50 mg/mL [product monograph]. GlaxoSmithKline Inc.; 2024 [draft].
6.Pharmacoeconomic evaluation [internal sponsor's report]. In: Drug Reimbursement Review sponsor submission: Belantamab mafodotin for injection: powder for solution for infusion, 70 mg/vial, 100 mg/vial, 50 mg/mL. Mississauga (ON): GlaxoSmithKline Inc; 2024 Dec 19.
7.GSK. Data on File. DREAMM-7 - Clinical Study Report (Primary analysis, DCO: 2 Oct 2023). 2024.
8.GSK. Data on File. Parametric Survival Analyses for DREAMM-7 Using Informative Priors from CASTOR. Results deck (Data on file). 2024. Updated March 2024. Accessed May.
9.GSK. Data on file. NMA results for Belamaf, bortezomib and dexamethasone (BVd) in patients with relapsed/refractory multiple myeloma. 2024.
10.IQVIA. Data on File. Delta PA Price List. May 2024.
11.Ontario Ministry of Health. Schedule of Benefits. Physicians Services. 2024. https://www.ontario.ca/files/2024-04/moh-schedule-benefit-2024-02-20.pdf
12.CIHI. CIHI patient cost estimator. 2023. Accessed July 1 2024. https://www.cihi.ca/en/patient-cost-estimator
13.Ontario Ministry of Health. Schedule of Benefits for Optometry Services. 2023. https://www.ontario.ca/files/2024-01/moh-ohip-schedule-of-benefits-optometry-services-2024-01-24.pdf
14.Ontario Ministry of Health and Long-Term Care. Schedule of Benefits for Laboratory Services. 2024. https://www.ontario.ca/files/2024-01/moh-ohip-schedule-of-benefits-laboratory-services-2024-01-24.pdf
15.de Oliveira C, Pataky R, Bremner KE, et al. Phase-specific and lifetime costs of cancer care in Ontario, Canada. BMC Cancer. 2016;16(1):809. doi: 10.1186/s12885-016-2835-7 PubMed
16.GSK. Data on File. 207503 - EQ-5D-3L Utility Model - Canada Value Set. 2024.
17.Everest L, Blommaert S, Chu RW, Chan KKW, Parmar A. Parametric Survival Extrapolation of Early Survival Data in Economic Analyses: A Comparison of Projected Versus Observed Updated Survival. Value Health. 2022;25(4)(2022;25(4):622-629):622-629. doi: 10.1016/j.jval.2021.10.004
18.Mian H, Reece D, Masih-Khan E, et al. Survival and outcomes of newly diagnosed multiple myeloma patients stratified by transplant status 2007-2018: retrospective analysis from the Canadian Myeloma Research Group Database. Clinical Lymphoma Myeloma and Leukemia. 2022;22(8):608-617. PubMed
19.pan-Canadian Pharmaceutical Alliance. Carvykti (ciltacabtagene autoleucel). 2024.
20.pan-Canadian Pharmaceutical Alliance. Elrexfio (elranatamab). 2024.
21.pan-Canadian Pharmaceutical Alliance. Tecvayli (teclistamab). 2024.
22.Moreau P, Mateos MV, Berenson JR, et al. Once weekly versus twice weekly carfilzomib dosing in patients with relapsed and refractory multiple myeloma (A.R.R.O.W.): interim analysis results of a randomised, phase 3 study. Lancet Oncol. 2018;19(7):953-964. doi: 10.1016/S1470-2045(18)30354-1 PubMed
23.pan-Canadian Oncology Drug Review Committee (pERC) final recommendation: Ciltacabtagene Autoleucel (Carvykti). CADTH; 2024. Accessed 2025 March 27. https://www.cda-amc.ca/sites/default/files/DRR/2024/PG0361REC_Carvykti_Final.pdf
24.Alliance p-CP. Carvykti Drug Negotiations Status. pan-Canadian Pharmaceutical Alliance; 2025. Accessed 2025 Mar 27. https://www.pcpacanada.ca/negotiation/22916
25.Drug Reimbursement Review: Belantamab mafodotin, pomalidomide, dexamethasone for previously treated multiple myeloma. CADTH. 2025. Updated 2025 April 4. https://www.cda-amc.ca/belantamab-mafodotin-pomalidomide-dexamethasone
26.Statistics Canada. Population estimates on July 1, by age and gender. Accessed May 24, 2024. https://www150.statcan.gc.ca/t1/tbl1/en/tv.action?pid=1710000501
27.Canadian Cancer Statistics Advisory Committee in collaboration with the Canadian Cancer Society, Statistics Canada, and the Public Health Agency of Canada. Canadian Cancer Statistics 2023. Canadian Cancer Society; 2023. Accessed December 19, 2024. https://cancer.ca/en/cancer-information/resources/publications/canadian-cancer-statistics-2023
28.CDA-AMC. CADTH Reimbursement Review: Isatuximab (SARCLISA). 2022. https://www.cda-amc.ca/sites/default/files/DRR/2022/PC0256-Sarclisa-CombinedReport.pdf
29.Sponsor's NMA report title [internal sponsor's report]. In: Drug Reimbursement Review sponsor submission: Blenrep (belantamab mafodotin for injection): powder for solution for infusion, 70 mg/vial, 100 mg/vial, 50 mg/mL. GlaxoSmithKline Inc; 2024.
30.San-Miguel J, Dhakal B, Yong K, et al. Cilta-cel or standard care in lenalidomide-refractory multiple myeloma. N Engl J Med. 2023;389(4):335-347. doi:10.1056/NEJMoa2303379 PubMed
31.National Institute for Health and Care Excellence. Teclistamab for treating relapsed and refractory multiple myeloma after 3 or more treatments—draft guidance consultation. 2024.
32.National Institute for Health and Care Excellence. Elranatamab for treating relapsed or refractory multiple myeloma after 3 therapies. 2024.
33.pan-Canadian Pharmaceutical Alliance. Drug Negotiations Status. pan-Canadian Pharmaceutical Alliance; 2025. Accessed March 27, 2025. https://www.pcpacanada.ca/negotiations
34.Cancer Care Ontario. CARFDEXA Regimen. 2024. https://www.cancercareontario.ca/sites/ccocancercare/files/CARFDEXA_HEM_MY.pdf
Appendix 1: Cost Comparison Table
Please note that this appendix has not been copy-edited.
The comparators presented in the following table have been deemed to be appropriate based on feedback from clinical experts and CDA-AMC–participating public drug plans. Comparators may be recommended (appropriate) practice or actual practice. Existing Product Listing Agreements are not reflected in the table and as such, the table may not represent the actual costs to public drug plans.
Table 4: Cost Comparison for RRMM
Treatment | Strength and/or concentration | Form | Price ($) | Recommended dosage | Daily cost ($) | 28-day cost ($) |
|---|---|---|---|---|---|---|
BVd | ||||||
Belantamab mafodotin | 70 mg 100 mg | Solution for infusion | 19,460.0000 27,800.0000 | 2.5 mg/kg on day 1 every 21 days | 2,648 | 74,133 |
Bortezomib | 3.5 mg | Powder in vial | 654.3100 | 1.3 mg/m2 on days 1, 4, 8, and 11 of cycle 1 to 8 for a 21-day cycle | Cycle 1 to 8: 124.63 | Cycle 1 to 8: 3,490 |
Dexamethasone | 4 mg | Tablet | 0.6112 | 20 mg on days 1, 2, 4, 5, 8, 9, 11, and 12 of cycle 1 to 8 for a 21-day cycle | Cycle 1 to 8: 1.16 | Cycle 1 to 8: 32.60 |
BVd | Cycle 1 to 8: 2,773 Cycle 9+: 2,648 | Cycle 1 to 8: 77,656 Cycle 9+: 74,133 | ||||
DVd IV | ||||||
Daratumumab | 100 mg 400 mg | Solution for infusion | 630.9100 2,523.6400 | Cycle 1 to 3: 16 mg/kg on days 1, 8, and 15 of cycle 1 to 3 for a 21-day cycle Cycle 4 to 8: 16 mg/kg on day 1 of cycle 4 to 8 for a 21-day cycle Cycle 9+: 16 mg/kg on day 1 of cycle 9 onward every 28 days | Cycle 1 to 3: 1,082 Cycle 4 to 8: 360.52 Cycle 9+: 270.39 | Cycle 1 to 3: 30,284 Cycle 4 to 8: 10,095 Cycle 9+: 7,571 |
Bortezomib | 3.5 mg | Powder in vial | 654.3100 | 1.3 mg/m2 on days 1, 4, 8, and 11 of cycle 1 to 8 for a 21-day cycle | Cycle 1 to 8: 124.63 | Cycle 1 to 8: 3,490 |
Dexamethasone | 4 mg | Tablet | 0.6112 | 20 mg on days 1, 2, 4, 5, 8, 9, 11, and 12 of cycle 1 to 8 for a 21-day cycle | Cycle 1 to 8: 1.16 | Cycle 1 to 8: 32.60 |
DVd IV | Cycle 1 to 8: 1,568 Cycle 9+: 270.39 | Cycle 1 to 8: 43,900 Cycle 9+: 7,571 | ||||
DVd SC | ||||||
Daratumumab | 1,800 mg | Solution for infusion | 7,712.0510 | Cycle 1 to 3: 1,800 mg on days 1, 8, and 15 of cycle 1 to 3 for a 21-day cycle Cycle 4 to 8: 1,800 mg on day 1 of cycle 4 to 8 for a 21-day cycle Cycle 9+: 1,800 mg on day 1 of cycle 9 onward every 28 days | Cycle 1 to 3: 1,102 Cycle 4 to 8: 367.24 Cycle 9+: 275.43 | Cycle 1 to 3: 30,848 Cycle 4 to 8: 7,712 Cycle 9+: 7,712 |
Bortezomib | 3.5 mg | Powder in vial | 654.3100 | 1.3 mg/m2 on days 1, 4, 8, and 11 of cycles 1 to 8 for a 21-day cycle | Cycle 1 to 8: 124.63 | Cycle 1 to 8: 3,490 |
Dexamethasone | 4 mg | Tablet | 0.6112 | 20 mg on days 1, 2, 4, 5, 8, 9, 11, and 12 of cycles 1 to 8 for a 21-day cycle | Cycle 1 to 8: 1.16 | Cycle 1 to 8: 32.60 |
DVd SC | Cycle 1 to 3: 1,228 Cycle 4 to 8: 493.04 Cycle 9+: 275.43 | Cycle 1 to 3: 34,370 Cycle 4 to 8: 13,805 Cycle 9+: 7,712 | ||||
SVd | ||||||
Selinexor | 20 mg | Tablet | 550.0000 | 100 mg on days 1, 8, 15, 22, and 29 every 35 days | 392.86 | 11,000 |
Bortezomib | 3.5 mg | Powder in vial | 654.3100 | 1.3 mg/m2 on days 1, 8, 15, and 22 every 35 days | 74.78 | 2,094 |
Dexamethasone | 4 mg | Tablet | 0.6112 | 20 mg on days 1, 2, 8, 9, 15, 16, 22, 23, 29, and 30 every 35 days | 0.87 | 24.45 |
SVd | 468.51 | 13,118 | ||||
PVd | ||||||
Pomalidomide | 4 mg | Capsule | 125.0000 | 4 mg on days 1 to 14 every 21 days | 83.33 | 2,333 |
Bortezomib | 3.5 mg | Powder in vial | 654.3100 | Cycle 1 to 8: 1.3 mg/m2 on days 1, 4, 8, and 11 of cycles 1 to 8 for a 21-day cycle Cycle 9+: 1.3 mg/m2 on days 1 and 8 of cycle 9 every 21 days thereafter | Cycle 1 to 8: 124.63 Cycle 9+: 62.32 | Cycle 1 to 8: 3,490 Cycle 9+: 1,745 |
Dexamethasone | 4 mg | Tablet | 0.6112 | Cycle 1 to 8: 20 mg on days 1,2, 4, 5, 8, 9, 11, and 12 of cycles 1 to 8 for a 21-day cycle Cycle 9+: 20 mg on days 1, 2, 8, and 9 of cycle 9 every 21 days thereafter | Cycle 1 to 8: 1.16 Cycle 9+: 0.58 | Cycle 1 to 8: 32.60 Cycle 9+: 16.30 |
PVd | Cycle 1 to 8: 209.13 Cycle 9+: 146.23 | Cycle 1 to 8: 5,856 Cycle 9+: 4,094 | ||||
IKd | ||||||
Isatuximab | 100 mg | Solution for infusion | 757.9000 | Cycle 1: 10 mg/kg on days 1, 8, 15, and 22 of cycles 1 for a 28-day cycle Cycle 2+: 10 mg/kg on day 1 and 15 of cycle 2 every 28 days thereafter | Cycle 1: 866.17 Cycle 2+: 433.09 | Cycle 1: 24,253 Cycle 2+: 12,126 |
Carfilzomib | 10 mg | Powder in vial | 255.5500 | Cycle 1: 20 mg/m2 on days 1 and 2, followed by 56 mg/m2 on days 8, 9, 15, and 16 of cycle 1 for a 28-day cycle Cycle 2+: 56 mg/m2 on days 1, 2, 8, 9, 15, and 16 of cycle 2 every 28 days thereafter | Cycle 1: 511.11 Cycle 2+: 657.14 | Cycle 1: 14,311 Cycle 2+: 18,400 |
Dexamethasone | 4 mg | Tablet | 0.6112 | 20 mg on days 1,2, 4, 5, 8, 9, 11, and 12 every 28 days | 0.87 | 24.45 |
IKd | Cycle 1: 1,378 Cycle 2+: 1,091 | Cycle 1: 38,588 Cycle 2+: 30,551 | ||||
Kd: Once weekly | ||||||
Carfilzomib | 10 mg | Powder in vial | 255.5500 | Cycle 1: 20 mg/m2 on day 1 followed by 70 mg/m2 on days 8 and 15 of cycle 1 for a 28-day cycle Cycle 2+: 70 mg/m2 on days 1, 8, and 15 of cycle 2 every 28 days thereafter | Cycle 1: 255.55 Cycle 2+: 328.57 | Cycle 1: 7,156 Cycle 2+: 9,200 |
Dexamethasone | 4 mg | Tablet | 0.6112 | 40 mg on days 1, 8, 15, and 22 every 28 days | 0.87 | 24.45 |
Kd (once weekly) | Cycle 1: 256.43 Cycle 2+: 329.44 | Cycle 1: 7,180 Cycle 2+: 9,224 | ||||
Kd: Twice weekly | ||||||
Carfilzomib | 10 mg | Powder in vial | 255.5500 | Cycle 1: 20 mg/m2 on days 1 and 2, followed by 56 mg/m2 on days 8, 9, 15, and 16 of cycle 1 for a 28-day cycle Cycle 2+: 56 mg/m2 on days 1, 2, 8, 9, 15, and 16 of cycle 2 every 28 days thereafter | Cycle 1: 511.11 Cycle 2+: 657.14 | Cycle 1: 14,311 Cycle 2+: 18,400 |
Dexamethasone | 4 mg | Tablet | 0.6112 | 20 mg on days 1,2, 8, 9, 15, 16, 22, and 23 every 28 days | 0.87 | 24.45 |
Kd (twice weekly) | Cycle 1: 511.98 Cycle 2+: 658.01 | Cycle 1: 14,311 Cycle 2+: 18,424 | ||||
Vd | ||||||
Bortezomib | 3.5 mg | Powder in vial | 654.3100 | 1.3 mg/m2 on days 1, 8, 15, and 22 every 35 days | 74.78 | 2,094 |
Dexamethasone | 4 mg | Tablet | 0.6112 | 40 mg once weekly every 35 days | 0.87 | 24.45 |
Vd | 75.65 | 2,118 | ||||
CyKd | ||||||
Cyclophosphamide | 25 mg 50 mg | Tablet | 0.3545 0.4773 | 300 mg/m2 on days 1, 8, 15, and 22 of cycle 1 to 12 for a 28-day cycle | 0.75 | 21.00 |
Carfilzomib | 10 mg | Powder in vial | 255.5500 | Cycle 1: 20 mg/m2 on day 1 followed by 70 mg/m2 on days 8 and 15 of cycle 1 for a 28-day cycle Cycle 2+: 70 mg/m2 on days 1, 8, and 15 of cycle 2 every 28 days thereafter | Cycle 1: 255.55 Cycle 2+: 328.57 | Cycle 1: 7,156 Cycle 2+: 9,200 |
Dexamethasone | 4 mg | Tablet | 0.6112 | 40 mg on days 1, 8, 15, and 22 every 28 days | 0.87 | 24.45 |
CyKd | Cycle 1: 256.30 Cycle 2+: 330.19 | Cycle 1: 7,177 Cycle 2+: 9,245 | ||||
CyVd | ||||||
Cyclophosphamide | 25 mg 50 mg | Tablet | 0.3545 0.4773 | 300 mg/m2 on days 1, 8, 15, and 22 every 28 days | 0.75 | 21.00 |
Bortezomib | 3.5 mg | Powder in vial | 654.3100 | 1.5 mg/m2 on days 1, 8, 15, and 22 every 28 days | 93.47 | 2,617 |
Dexamethasone | 4 mg | Tablet | 0.6112 | Cycle 1 to 2: 40 mg on days 1 to 4, 9 to 12, and 17 to 20 of cycle 1 to 2 for a 28-day cycle Cycle 3+: 40 mg on days 1, 8, 15, and 22 of cycle 3 every 28 days thereafter | Cycle 1 to 2: 2.62 Cycle 3+: 0.87 | Cycle 1 to 2: 73.34 Cycle 3+: 24.45 |
CyVd | Cycle 1 to 2: 96.84 Cycle 3+: 95.10 | Cycle 1 to 2: 2,712 Cycle 3+: 2,663 | ||||
CAR T-cell therapy | ||||||
Ciltacabtagene autoleucel | 0.5 to 1.0x10⁶ CAR-positive viable T-cells per kg body weight with a maximum of 1x10⁸ CAR-positive viable T-cells | Cell suspension in patient-specific single infusion bag | 632,455.0000 | One-time dose | NA | NA |
Monoclonal antibody monotherapies | ||||||
Elranatamab | 44 mg 75 mg | Solution for subcutaneous injection | 4,053.0000 7,000.0000 | Cycle 1: 12 mg on day 1; 32 mg on day 4; 76 mg on days 8, 15, and 22 for a cycle of 28 days Cycle 2 to 6: 76 mg on days 1, 8, 15, and 22 for a cycle of 28 days Cycle 7+: 76 mg on day 1 and 15 every 28 days thereafter | Cycle 1: 1,040 Cycle 2 to 6: 1,000 Cycle 7+: 500.00 | Cycle 1: 29,106 Cycle 2 to 6: 28,000 Cycle 7+: 14,000 |
Teclistamab | 30 mg 153 mg | Solution for subcutaneous injection | 1,322.0000 6,741.0000 | Step-up dosing schedule: Cycle 1: 0.1 mg/kg on day 1; 0.3 mg/kg on day 3; 1.5 mg/kg on day 5 for 1 7-day cycle Cycle 2+: Dosing schedule from week 2 onward: 1.5 mg/kg once weekly | Cycle 1: 1,341 Cycle 2+: 963.00 | Cycle 1: 37,540 Cycle 2+: 26,964 |
BSA = body surface area; BVd = belantamab mafodotin plus bortezomib and dexamethasone; CyKd = cyclophosphamide plus carfilzomib and dexamethasone; CyVd = cyclophosphamide plus bortezomib and dexamethasone; DVd = daratumumab plus bortezomib and dexamethasone; IKd = isatuximab plus carfilzomib and dexamethasone; Kd = carfilzomib plus dexamethasone; NA = not available; PVd = pomalidomide plus bortezomib plus dexamethasone; RRMM = relapsed or refractory multiple myeloma; SC = subcutaneous; SVd = selinexor plus bortezomib plus dexamethasone; Vd = bortezomib plus dexamethasone.
Notes: All prices are from the Ontario Drug Benefit Formulary (accessed February 2025), unless otherwise indicated, and do not include dispensing fees.
All patient doses are calculated based on an average body weight of 77.20 kg and a BSA of 1.9m.2
Appendix 2: Input Relevant to the Economic Review
Please note that this appendix has not been copy-edited.
This section is a summary of the input received from the patient groups, clinician groups, and drug plans that participated in the CDA-AMC review process.
Patient input was received from Myeloma Canada through a survey conducted of patients (n = 254) and caregivers (n = 28). Most respondents were living in Canada (n = 277) and 10 among them had experience with belantamab mafodotin (as belantamab mafodotin plus pomalidomide and dexamethasone [BPd] or in combination with dexamethasone), however none had received BVd. The most important outcomes for patients included delaying disease progression and achieving durable remission, with the ultimate objective of improving survival; reducing side effects from treatments; preserving independence to minimize the burden on caregivers; and maintaining quality of life. Overall, patients’ disease experience was influenced by the physical symptoms associated with MM and the psychosocial effects associated with the disease (i.e., anxiety associated with disease progression and the interruption of life goals due to absence from work and/or early retirement). Regarding prior treatment exposure, 108 respondents indicated that they had received 1 prior line of therapy, 87 respondents indicated having received 2 prior lines of therapy, 40 respondents indicated having received 3 prior lines of therapy, 26 received 4 prior lines of therapy, and 13 respondents received 5 prior lines of therapy. Patients emphasized the need for therapies to control various aspects of the disease, including infections, pain, fatigue, kidney complications, decreased mobility, gastrointestinal issues, and secondary cancers. Among the 10 individuals with experience using belantamab mafodotin, patients reported a range of side effects, including infections, neutropenia, thrombocytopenia, anemia, blurry vision, eye pain, fever, and decreased appetite. Patient feedback regarding treatment outcomes with BVd was not available.
Clinician group input was received from the Ontario Health (Cancer Care Ontario) Hematology Cancer Drug Advisory Committee. Clinicians noted that the current pathway of care in the second-line setting consists of DVd, isatuximab plus carfilzomib and dexamethasone IsaKd, Kd, and selinexor plus bortezomib plus dexamethasone (SVd). Treatment goals include disease control, improvement in symptoms, prolonged survival, and prevention of end-organ damage. Clinician input indicated that not all treatments work effectively in relapsed MM, highlighting the unmet need for second-line B-cell maturation antigen (BCMA)–targeted therapy. BVd is expected to be an additional second-line treatment option for patients who are sensitive to V in the current provisional funding algorithm for MM. Clinician input noted that BVd use may preclude future access to BCMA-targeted chimeric antigen receptor T-cell therapy, making it a more suitable therapeutic option for patients unlikely to receive chimeric antigen receptor T-cell therapy. Input further highlighted the potential ocular toxicity associated with the use of belantamab mafodotin, which may be a concern to some patients.
Input from CDA-AMC–participating drug plans noted concerns with the in-trial comparator DVd which is less relevant in clinical practice in Canada compared to options like Kd, SVd, IsaKd, and PVd. Drug plans commented that out-of-pocket eye care costs due to AEs associated with BVd may not be affordable for some patients and will require ophthalmologist visits. Drug plans also noted that the trial excluded patients with prior BCMA-targeted therapies and questioned whether there was sufficient evidence to support the sequencing of BVd with other BCMA-targeted therapies. Drug plans noted that belantamab mafodotin has relatively short stability and dose reductions were needed in the trial, which can result in drug wastage. Finally, it was noted that ciltacabtagene autoleucel (cilta-cel) for 1 to 3 prior lines and fourth-line treatment, and elranatamab and teclistamab, are in active negotiations at the pan-Canadian Pharmaceutical Alliance (pCPA). There are confidential prices for carfilzomib, isatuximab, pomalidomide, and selinexor.
Several of these concerns were addressed in the sponsor’s model:
The impact of disease and treatment on patient’s quality of life was captured with utility values.
AEs, including neutropenia, thrombocytopenia, and anemia, were incorporated as disutilities.
CDA-AMC addressed some of these concerns as follows:
AEs such as ocular toxicity with belantamab mafodotin were incorporated as disutilities within the analysis.
Dosing based on the product monograph with relative dose intensity (RDI) was used to reflect dose reductions and delays observed in the DREAMM-7 study.
Subsequent therapy costs were included in a scenario analysis.
CDA-AMC was unable to address the following concerns:
Lack of head-to-head trial data for BVd versus comparators other than DVd.
Appendix 3: Summary of the Sponsor’s Submission
Please note that this appendix has not been copy-edited.
Summary of the Sponsor’s Economic Evaluation
For the pharmaceutical reviews program, clinical and economic information is submitted to CDA-AMC by the sponsor. The CDA-AMC health economics team reviews the submitted economic information and appraises the information in collaboration with clinical experts and the clinical review team to evaluate key assumptions, influential parameters, and the overall rigour of the economic submission. Based on what the team learns through this process, adjustments may be made to the sponsor’s model to produce the CDA-AMC base case. The CDA-AMC base case represents the team’s current understanding of the clinical condition, clinical evidence currently available, and best interpretation of the economic evidence based on the information provided.
For the review of BVd, the sponsor provided a CUA and a BIA. The sponsor’s economic submission is summarized in Table 5.
Table 5: Key Components of the Sponsor’s Economic Evaluation
Component | Description |
|---|---|
Treatment information | |
Drug under review | Belantamab mafodotin, powder for solution for injection (50 mg/mL), 70 mg and 100 mg vials |
Submitted price of drug under review | Belantamab mafodotin: $19,460.0000 per 70 mg vial Belantamab mafodotin: $27,800.0000 per 100 mg vial Bortezomib: $654.3100 per 3.5 mg vial Dexamethasone: $0.6112 per 4 mg tablet |
Regimen | 2.5 mg/kg administered on day 1 of each 21-day cycle in combination with bortezomib (1.3 mg/m2 on days 1, 4, 8, and 11) and dexamethasone (20 mg on days 1, 2, 4, 5, 8, 9, 11, and 12) for the first 8 cycles, and then continued as a single drug until completion of treatment 5 |
Per-course cost of drug under review | Belantamab mafodotin: from $32,559 to $59,748 per patient per 28-day cycle (cycles 1 to 8) and from $8,147 to $23,216 per patient per 28-day cycle (cycle 9 onward)a, 6 |
Model information | |
Type of economic evaluation | CUA PSM |
Treatment | BVd |
Included comparators |
|
Perspective | Publicly funded health care payer perspective |
Time horizon | Lifetime (36 years) |
Cycle length | 1 week |
Modelled population | Adult patients with RRMM who have received at least 1 prior line of therapy |
Characteristics of modelled population | Derived from the DREAMM-7 trial (mean age = 64 years; baseline weight = ██ kg; baseline BSA = ████ m2; sex = 45% female, 55% male)5 |
Model health states |
For additional information, refer to Model Structure |
Data sources | |
Comparative efficacy |
|
Natural history and/or clinical pathway | |
Costs included in the model |
|
Health-related utilities and disutilities |
|
Summary of the submitted results | |
Base-case results | BVd was associated with an ICER of $173,206 per QALY gained compared to PVd (incremental costs = $776,271; incremental QALYs = 4.48; incremental LYs = 5.44) |
Scenario analysis resultsb |
|
AE = adverse event; BVd = belantamab mafodotin plus bortezomib and dexamethasone; CIHI = Canadian Institute for Health Information; cilta-cel = ciltacabtagene autoleucel; CUA = cost-utility analysis; CyKd = cyclophosphamide plus carfilzomib and dexamethasone; CyPd = cyclophosphamide plus pomalidomide and dexamethasone; CyVD = cyclophosphamide plus bortezomib and dexamethasone; DVd = daratumumab plus bortezomib and dexamethasone; HR = hazard ratio; ICER = incremental cost-effectiveness ratio; IsaKd = isatuximab-carfilzomiband dexamethasone; IsaPd = isatuximab plus pomalidomide and dexamethasone; Kd = carfilzomib plus dexamethasone; LY = life-year; NMA = network meta-analysis; OS = overall survival; PFS = progression-free survival; PSM = partitioned survival model; PVd = pomalidomide plus dexamethasone plus bortezomib; QALY = quality-adjusted life-year; RDI = relative dose intensity; SVd = selinexor plus bortezomib plus dexamethasone; TTD = time to treatment discontinuation; Vd = bortezomib plus dexamethasone; vs. = versus.
aBVd = from $34,667 to $61,856 per patient per 28-day cycle (cycles 1 to 8) and from $10,255 to $25,324 per patient per 28-day cycle (cycle 9 onward). Weight-based dosing used a distribution of patients’ weight and BSA from the DREAMM-7 trial individual participant data to obtain a weighted cost per administration.
bResults of scenario analyses that had a meaningful impact on the estimated ICER compared to the sponsor’s base case.
Model Structure
The sponsor submitted a partitioned survival model (PSM) consisting of 4 mutually exclusive health states: progression-free on-treatment, progression-free off-treatment, progressed disease, and death.6 The allocation of patients into health states is based on treatment-specific time to treatment discontinuation (TTD), PFS, and OS functions. Patients enter the model in the progression-free on-treatment state and receive BVd or a comparator treatment. Patients can either remain in the on-treatment state, transition to the off-treatment state after discontinuing therapy (based on TTD), transition to the progressed disease state (based on PFS), or die (based on OS). Once patients stop treatment but remain progression-free, they enter the progression-free off-treatment state, from which they can either progress or die. Upon disease progression, patients transition to the progressed disease state, with the duration defined by the difference between OS and PFS. While in the progressed disease state, patients can receive up to 2 subsequent lines of therapy. Death is modelled as an absorbing state, representing the final outcome for all patients, with transitions possible from any health state during any model cycle. A figure of the sponsor’s model structure is available in Appendix 3 (Figure 4).6
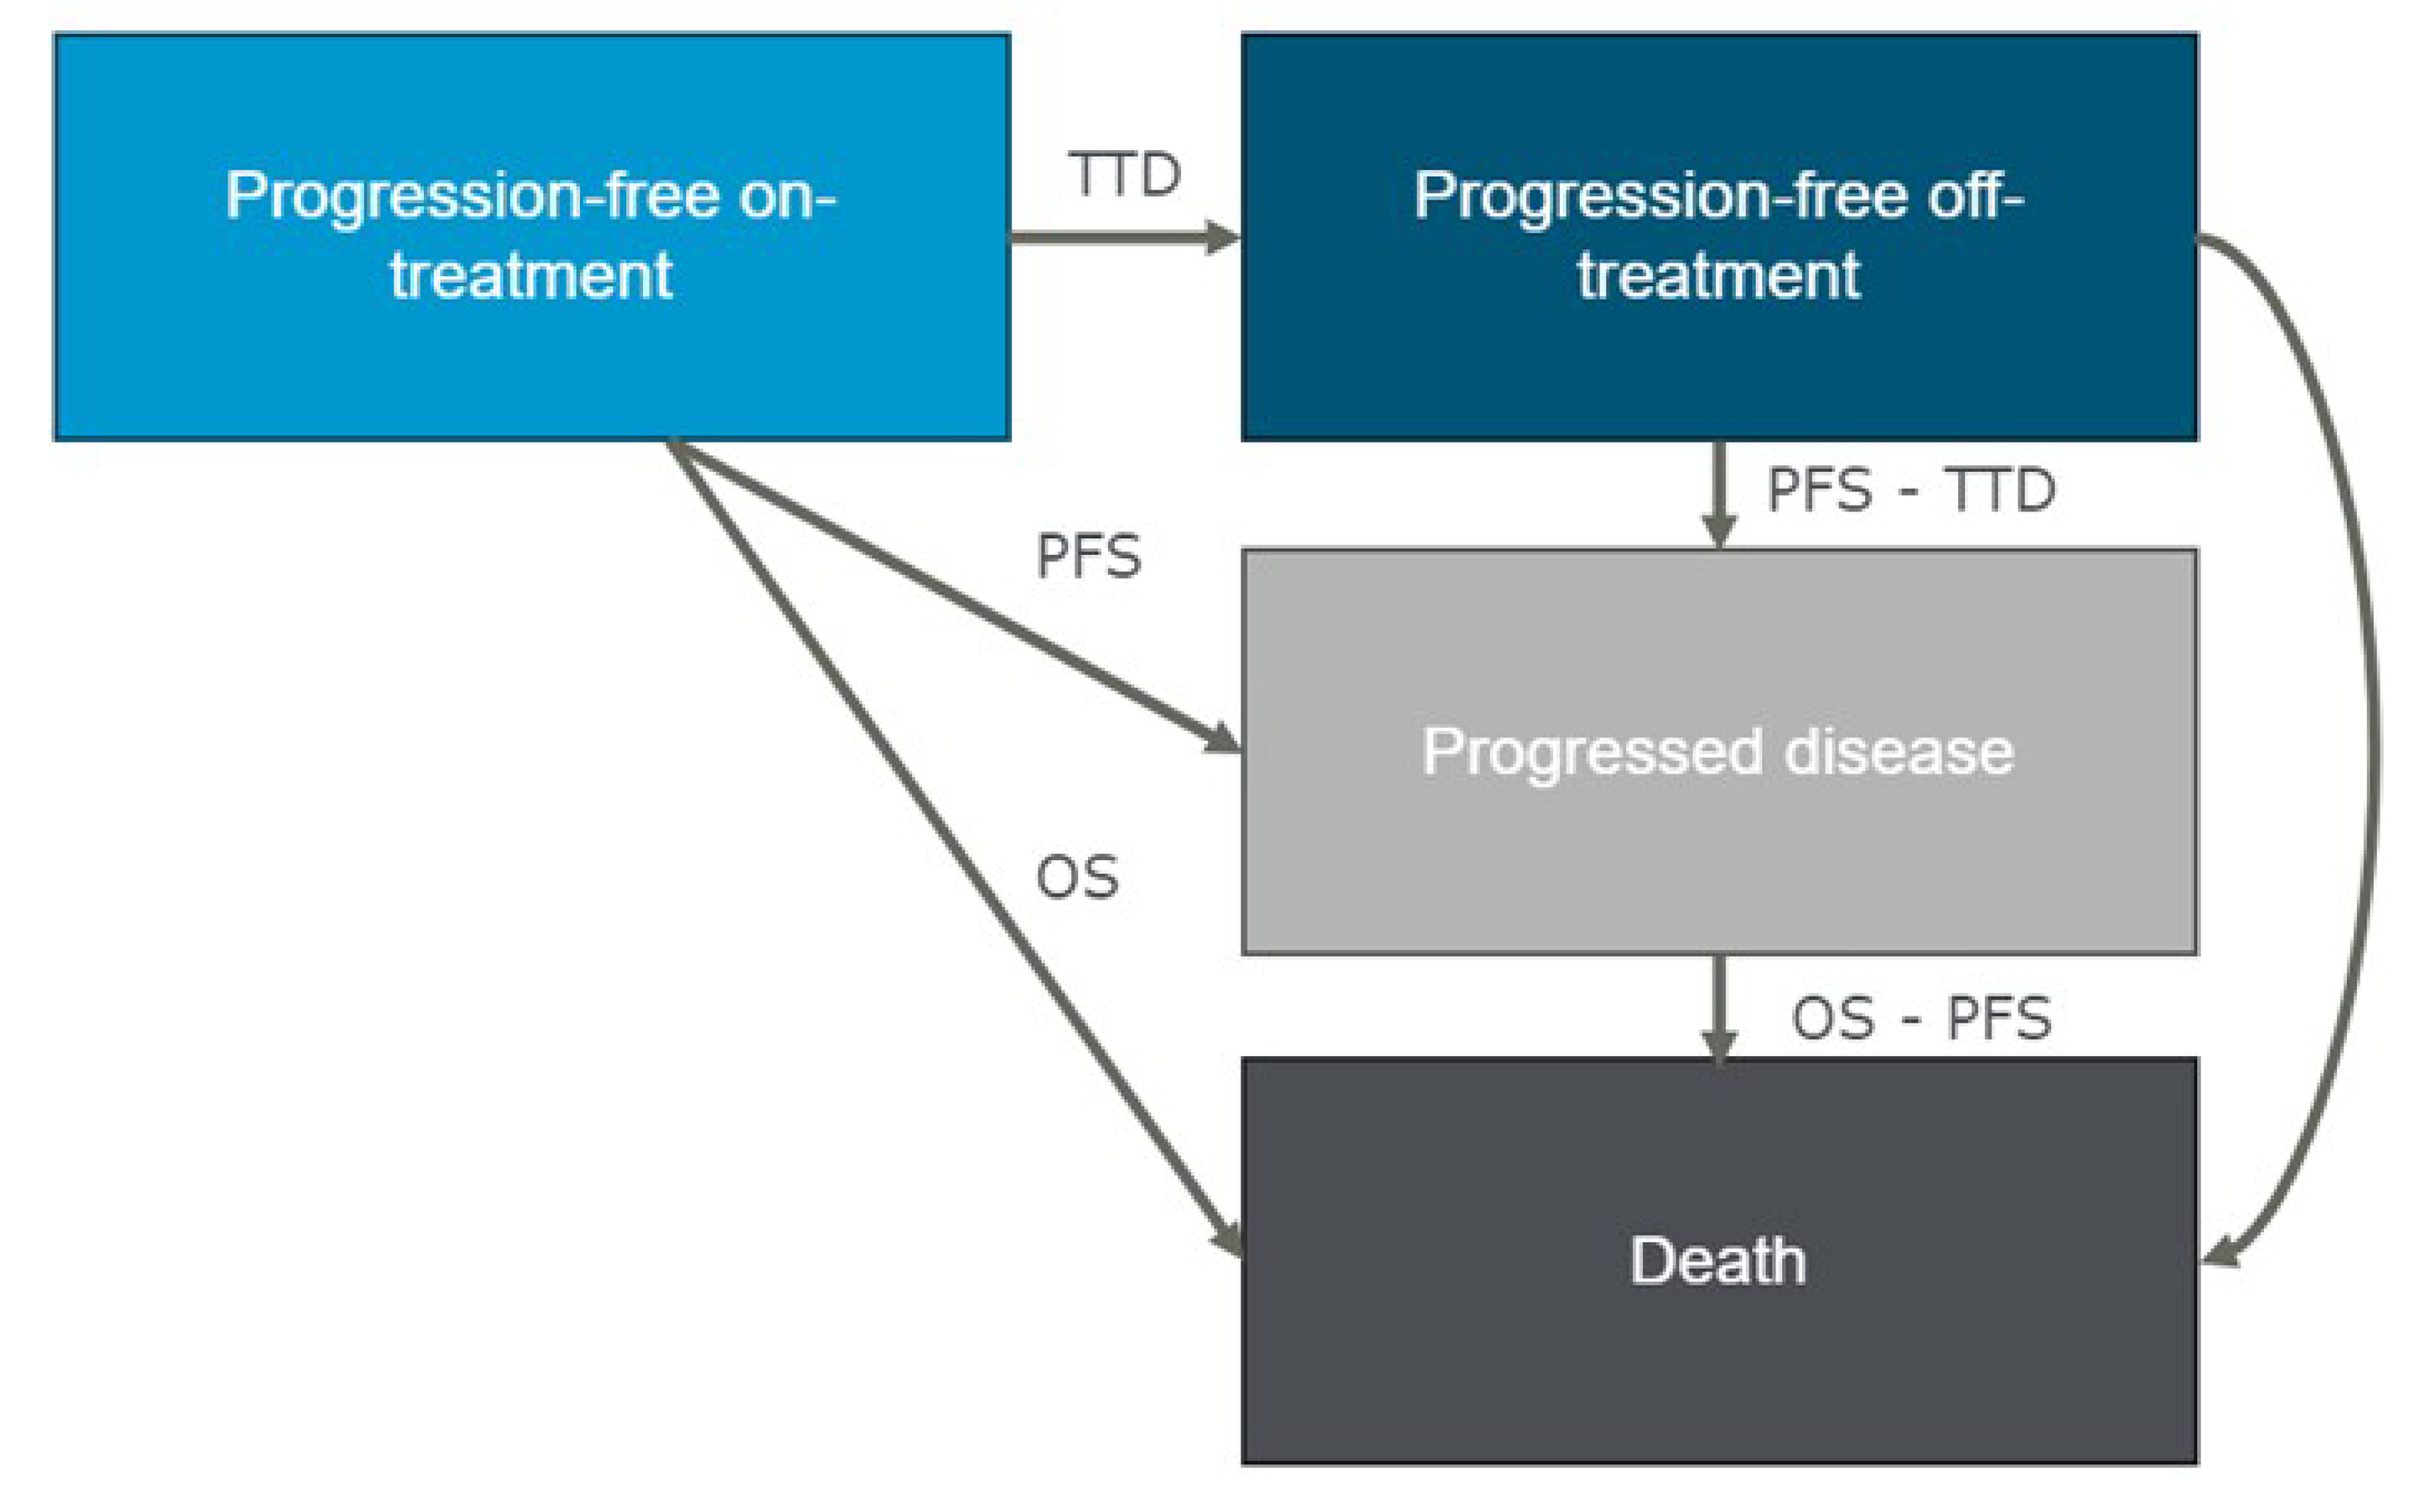
OS = overall survival; PFS = progression-free survival; TTD = time to treatment discontinuation.
Source: Sponsor’s pharmacoeconomic submission.6
Appendix 4: Additional Details of CDA-AMC Reanalyses
Please note that this appendix has not been copy-edited.
Clinical Data in the Economic Model
The CDA-AMC clinical review found that BVd likely improves PFS and OS compared to DVd in patients with RRMM, based on findings from the DREAMM-7 trial. Evidence from this open-label randomized controlled trial suggests a clinically meaningful improvement in PFS and OS with BVd, although OS data remain immature at the time of interim analysis and the effects of BVd on OS beyond 40 months is uncertain. The impact of BVd on health-related quality of life is also uncertain, as the assessment of patient-reported outcomes may have been influenced by the lack of blinding and high amount of missing data over time. The CDA-AMC clinical review also found that belantamab mafodotin is associated with an increased risk of ocular AEs and serious AEs compared to DVd. A sponsor-submitted network meta-analysis (NMA) suggested a favourable PFS and OS treatment effect with BVd compared to several other comparators. However, the magnitude of the effect of BVd relative to other comparators remains uncertain due to heterogeneity across trials and potential bias in the NMA estimates.
In the economic model submitted by the sponsor, OS for BVd and DVd was extrapolated beyond the DREAMM-7 trial period using survival models that assumed no waning of treatment effect over the 36-year lifetime time horizon. Clinical experts consulted by CDA-AMC indicated that there is no evidence to support this assumption and considered it plausible that treatment effectiveness may diminish earlier than modelled. Notably, 75% of the survival benefit associated with BVd in the sponsor’s model was accrued beyond the observed trial follow-up of 40 months, contributing to additional uncertainty in the projected LYs and QALYs gained. Furthermore, the absence of comparative clinical data for relevant nontrial comparators limited the ability of CDA-AMC to validate the sponsor’s results. Consequently, the CDA-AMC reanalysis is subject to a high degree of uncertainty due to the lack of comparative efficacy data for nontrial comparators and the assumptions underpinning long-term survival benefit for BVd. Taken together, these limitations contribute to considerable uncertainty in the estimated cost-effectiveness of BVd relative to other treatment options for RRMM.
Key Issues of the Submitted Economic Evaluation
CDA-AMC identified the following key issues with the sponsor’s analysis:
Comparative efficacy of BVd is highly uncertain. In the sponsor’s pharmacoeconomic submission, the clinical efficacy of BVd, DVd, and nontrial comparators was characterized using PFS and OS. However, head-to-head trial data are only available for BVd versus DVd; no direct evidence exists for comparisons between BVd and other relevant treatment options. To address this gap, the sponsor applied hazard ratios (HRs) derived from a sponsor-conducted NMA to the DVd survival curves to estimate PFS and OS for nontrial comparators. While the CDA-AMC clinical review concluded that BVd likely improves PFS and OS compared to DVd, OS data remain immature and long-term OS after the trial follow-up duration is uncertain. Results from the sponsor-submitted NMA suggested that BVd may demonstrate favourable efficacy over several comparators in the fixed-effects model. However, none of the comparisons — aside from BVd versus Vd for ORR — favoured BVd in the more appropriate random-effects model. The NMA results should be interpreted with caution due to considerable heterogeneity in effect modifiers across included studies. Consequently, the CDA-AMC reanalysis is subject to a high degree of uncertainty due to the absence of robust comparative efficacy data for nontrial comparators. This uncertainty is further compounded by the sponsor’s modelling assumptions, which attribute approximately 75% of the survival benefit to the period beyond the observed 40-month trial duration.
CDA-AMC could not address this limitation in reanalysis owing to lack of clinical data.
Impact of BVd on long-term OS is highly uncertain. The sponsor’s estimated that BVd would provide approximately 5.5 additional LYs compared with PVd, based on interim data from the DREAMM-7 trial (data cut-off: October 2, 2023; ITT population, n = 494). In this analysis, BVd was associated with an OS HR of 0.57 (95% confidence interval, 0.40 to 0.80) compared with DVd. However, the certainty of the OS evidence is low due to imprecision, the interim nature of the data, and risk of bias related to postprogression treatment crossover. Median OS was not reached in the overall population (29%), limiting the ability to draw definitive conclusions. Evidence suggests that early OS results in oncology trials often differ from later mature data, and as such, the true magnitude of BVd’s survival benefit remains highly uncertain.17 CDA-AMC notes that approximately 75% of the modelled incremental survival benefit with BVd occurs beyond the observed trial period, increasing uncertainty around the sponsor’s projections.
In the extrapolation of OS, the sponsor selected a Weibull distribution, which assumes a decreasing hazard of death over time. However, the sponsor modelled PFS using an exponential distribution, implying a constant rate of progression. This inconsistency results in assumptions that lack face validity. Modelling OS using an exponential distribution—implying a constant hazard of death—is more consistent with clinical expectations. Clinical experts consulted by CDA-AMC, as well as published literature,18 indicate that a substantial proportion of patients with RRMM are likely to die within the first year of treatment. The patients who remain beyond this point are typically those who respond to therapy and have a different survival trajectory than the broader initial cohort. This distinction supports the use of a model that reflects a consistent hazard over time, rather than 1 that assumes improving survival. The sponsor also assumed no treatment waning effect, implying indefinite benefit for patients receiving BVd. Clinical experts consulted by CDA-AMC indicated that this assumption lacks supporting evidence and does not reflect real-world treatment patterns in RRMM, where most patients require multiple subsequent lines of therapy due to disease progression. As a result, the assumption of indefinitely sustained treatment benefit was considered to lack face validity.
CDA-AMC used the exponential distribution to extrapolate long-term OS for BVd, aligning with clinical expert input.
Modelling approach may overestimate comparative efficacy. Results from the sponsor’s model suggest that treatment with BVd is associated with longer survival after progression. The sponsor’s base case predicted that BVd extended LYs gained in ‘progression-free’ health states (2.21 years), as well as in “progressed disease” (2.54 years), relative to DVd, indicating that treatment with BVd is associated with reductions in the rate of postprogression mortality. Specifically, the sponsor’s modelling approach predicts that 53% of the incremental survival attributed to BVd relative to DVd is due to a benefit that begins after the treatment has stopped controlling the disease (i.e., postprogression period), which does not align with clinical expectations or available clinical evidence. CDA-AMC notes that while the DREAMM-7 trial showed a clinically meaningful effect of BVd on PFS and OS, there was no robust evidence that BVd would continue to provide clinical benefit after patients experience progression. The sponsor’s use of a PSM introduces structural assumptions about the relationship between PFS and OS that likely do not accurately reflect causal relationships within the disease pathway. These assumptions may produce a postprogression survival bias that favours BVd. Due to the assumed independence between OS and PFS end points in a PSM, extrapolations for each end point may reflect within-trial trends in the rates of relapse and death. However, as the postprogression mortality transition is not modelled directly in the PSM approach, it is not possible to establish whether this effect is supported by the trial data or is an artifact of the modelling choice.
CDA-AMC was unable to determine the extent to which the implied postprogression benefit was due to the effect of treatment versus due to structural bias within the PSM and could not address this in reanalysis.
TTD for patients receiving BVd and comparators is uncertain. The sponsor’s approach to modelling treatment discontinuation did not align with clinical expectations and resulted in estimates that lacked face validity. In the model, TTD was used to estimate drug acquisition costs. For BVd and DVd, TTD curves were derived from the DREAMM-7 study’s KM data and fitted using a Weibull distribution. However, the model assumed no correlation between TTD and PFS for these trial arms, meaning patients were assumed to discontinue treatment while remaining progression-free. This implies that toxicity was the primary reason for discontinuation, which contradicts both clinical data from the DREAMM-7 study and expert feedback indicating that disease progression is the most common reason for treatment discontinuation. For nontrial comparators, the sponsor estimated TTD by applying PFS HRs from the NMA to the DVd TTD curve, thereby assuming a proportional relationship between PFS and TTD. Overall, the sponsor’s modelling approach may underestimate treatment duration and associated drug acquisition costs for BVd.
CDA-AMC conducted a reanalysis using the log-normal parametric distribution to extrapolate TTD for BVd and the exponential distribution to extrapolate TTD for DVd, which, together with meeting clinical face validity, were assessed to represent the best statistical fit among all standard parametric curves considered.
Calculation of drug acquisition costs for BVd is inappropriate. The sponsor used IPD from the DREAMM-7 study to estimate drug acquisition costs for belantamab mafodotin, calculating dosing based on the draft Health Canada product monograph. However, weekly dosing in the IPD was recorded in broad categories (< 1.7 mg/kg, 1.7 to 2.7 mg/kg, and > 2.7 mg/kg). The sponsor calculated the proportion of patients receiving each dose category among those on treatment and used this to estimate average drug costs. Beyond the point where fewer than 50 patients remained on treatment, dosing was extrapolated by aggregating dose and exposure data from the remaining IPD weeks. While dosing within the 1.7 to 2.7 mg/kg broad categories were delineated by 0.1 mg/kg, intervals, several assumptions were applied to the less than 1.7 mg/kg and greater than 2.7 mg/kg broad categories. Due to a lack of data to inform costs for doses less than 1.7 mg/kg and greater than 2.7 mg/kg, the sponsor assumed acquisition costs equivalent to 1.7 mg/kg and 2.7 mg/kg, respectively — likely underestimating true drug costs. In the base case, doses of 1.7 to 2.1 mg/kg and 2.2 to 2.7 mg/kg were costed as 1.9 mg/kg and 2.5 mg/kg, respectively, based on labelled dosing in the draft monograph. Additionally, it was inconsistent to use this IPD-based costing approach for BVd while applying RDI-adjusted costing for all comparator treatments, which incorporated dose reductions and delays where data were available.
CDA-AMC adopted dosing based on the product monograph using RDI to account for dose reductions or delays as per the DREAMM-7 trial, aligned with DVd and the approach used for nontrial comparators.
CDA-AMC conducted a scenario analysis that adopted the IPD costing approach for BVd. In this scenario, patients were assumed to receive 1 ophthalmologic examination before each of the first 6 infusions of BVd, and 1 ophthalmologic examination every 3 infusions of BVd thereafter, in accordance with the Health Canada product monograph.
Exclusion of ocular toxicity due to BVd is inappropriate. According to the product monograph for belantamab mafodotin, dosage modifications for ocular adverse reactions are suggested based on ophthalmic examination findings (including corneal examination findings and changes in best-corrected visual acuity as assessed by an eye care professional). Based on the worst finding in the worse affected eye, a dose reduction to 1.9 mg/kg every 3 weeks is suggested based on severity of ocular AEs. The sponsor did not model ocular toxicity and instead assumed that they would be resolved with ophthalmologist visits and artificial tears. However, ocular toxicity with BVd was observed in the DREAMM-7 trial and was noted by clinical experts consulted by CDA-AMC as important treatment considerations. These AEs included severe keratopathy, blurred vision, and dry eye. As such, the exclusion of AEs due to ocular toxicity in the sponsor’s analysis likely biased cost-effectiveness results in favour of BVd.
CDA-AMC included disutilities related to ocular toxicity with BVd in reanalysis.
Modelling of subsequent therapy is highly uncertain. The submitted model did not define explicit health states for subsequent lines of treatment. Instead, medication and administration costs for up to 2 lines of therapy after disease progression were applied as a single, 1-off cost. Based on published literature and internal market research, the proportion of patients receiving third- and fourth-line treatment was estimated to be 52% and 55%, respectively.18 In the third-line setting, subsequent treatment options included IsaKd, DVd, IsaPd, Kd, SVd, cyclophosphamide plus pomalidomide and dexamethasone (CyPd), and cyclophosphamide plus carfilzomib and dexamethasone (CyKd), while in the fourth-line setting, available options comprised SVd, CyPd, CyKd, cilta-cel, elranatamab, and teclistamab (Table 6). The distribution of subsequent therapies across treatment groups was based on sponsor internal market research and did not meet face validity. Clinical experts consulted by CDA-AMC indicated that subsequent treatment pathways are expected to be generally similar between BVd and comparators. However, the sponsor’s assumptions result in cost savings in subsequent therapy for BVd of $150,986 versus PVd, and cost savings of $125,989 versus Vd that are highly uncertain.
Particularly, CDA-AMC notes that there is uncertainty in the availability of subsequent therapies in the fourth-line setting as cilta-cel, teclistamab, and elranatamab have recently underwent active negotiation at pCPA. Negotiations for cilta-cel are ongoing, while teclistamab recently received a letter of intent on April 10, 2025, and elranatamab negotiations concluded without agreement on March 27, 2025.19-21 Therefore, while teclistamab is now available for public reimbursement in the fourth-line setting, elranatamab and cilta-cel remain unavailable for public reimbursement in this treatment setting. As subsequent treatments in the model only affect costs and not OS, any potential survival benefit associated with these therapies has not been captured.
Due to limitations in the PSM structure and uncertainties surrounding the distribution of subsequent therapies, CDA-AMC excluded subsequent therapy costs from the base-case analysis. Consequently, the impact of these costs on the cost-effectiveness of BVd remains unknown.
CDA-AMC conducted a scenario analysis that adjusted the market share of fourth-line subsequent therapies to better align with expectations of clinical practice in Canada (Table 7). Due to the submitted model structure any subsequent therapy costs estimated in the model are uncertain.
Table 6: Distribution of Subsequent Therapies Across Treatment Arms in the Sponsor’s Analysis (Second Subsequent Treatment)
Subsequent treatment | Initial treatment | |||||||
|---|---|---|---|---|---|---|---|---|
BVd | Kd | IsaKd | SVd | Vd | PVd | DVd | Cyc-doublets | |
IsaKd | ██ | ██ | ██ | ██ | ██ | ██ | ██ | ██ |
DVd (IV) | ██ | ██ | ██ | ██ | ██ | ██ | ██ | ██ |
DVd (SC) | ██ | ██ | ██ | ██ | ██ | ██ | ██ | ██ |
Pd | ██ | ██ | ██ | ██ | ██ | ██ | ██ | ██ |
IsaPd | ██ | ██ | ██ | ██ | ██ | ██ | ██ | ██ |
Vd | ██ | ██ | ██ | ██ | ██ | ██ | ██ | ██ |
BVd | ██ | ██ | ██ | ██ | ██ | ██ | ██ | ██ |
Kd (Twice weekly) | ██ | ██ | ██ | ██ | ██ | ██ | ██ | ██ |
Kd (Once weekly) | ██ | ██ | ██ | ██ | ██ | ██ | ██ | ██ |
SVd | ██ | ███ | ███ | ██ | ██ | ██ | ██ | ███ |
PVd | ██ | ██ | ██ | ██ | ██ | ██ | ██ | ██ |
Cyc-doublets (CyPd) | ██ | ███ | ███ | ██ | ██ | ██ | ██ | ██ |
Cyc-doublets (CyKd) | ████ | ██ | ██ | ███ | ███ | ███ | ███ | ███ |
Cyc-doublets (CyVD) | ██ | ██ | ██ | ██ | ██ | ██ | ██ | ██ |
Cilta-cel | ██ | ███ | ███ | ███ | ███ | ███ | ███ | ███ |
Elranatamab | ██ | ███ | ███ | ███ | ███ | ███ | ███ | ███ |
Teclistamab | ██ | ███ | ███ | ███ | ███ | ███ | ███ | ███ |
BVd = belantamab mafodotin plus bortezomib and dexamethasone; cilta-cel = ciltacabtagene autoleucel; cyc-doublets = CyKd and CyVd; CyKd = cyclophosphamide plus carfilzomib and dexamethasone; CyPd = cyclophosphamide plus pomalidomide and dexamethasone; CyVd = cyclophosphamide plus bortezomib and dexamethasone; DVd = daratumumab plus bortezomib and dexamethasone; IsaKd = isatuximab-carfilzomiband dexamethasone; IsaPd = isatuximab plus pomalidomide and dexamethasone; Kd = carfilzomib plus dexamethasone; PVd = pomalidomide plus dexamethasone plus bortezomib; SC = subcutaneous; SVd = selinexor plus bortezomib plus dexamethasone; Vd = bortezomib plus dexamethasone.
Table 7: Distribution of Subsequent Therapies Across Treatment Arms in the CDA-AMC Scenario Analysis (Second Subsequent Treatment)
Subsequent treatment | Initial treatment | |||||||
|---|---|---|---|---|---|---|---|---|
BVd | Kd | IsaKd | SVd | Vd | PVd | DVd | Cyc-doublets | |
IsaKd | ██ | ██ | ██ | ██ | ██ | ██ | ██ | ██ |
DVd (IV) | ██ | ██ | ██ | ██ | ██ | ██ | ██ | ██ |
DVd (SC) | ██ | ██ | ██ | ██ | ██ | ██ | ██ | ██ |
Pd | ██ | ██ | ██ | ██ | ██ | ██ | ██ | ██ |
IsaPd | ██ | ██ | ██ | ██ | ██ | ██ | ██ | ██ |
Vd | ██ | ██ | ██ | ██ | ██ | ██ | ██ | ██ |
BVd | ██ | ██ | ██ | ██ | ██ | ██ | ██ | ██ |
Kd (Twice weekly) | ██ | ██ | ██ | ██ | ██ | ██ | ██ | ██ |
Kd (Once weekly) | ██ | ██ | ██ | ██ | ██ | ██ | ██ | ██ |
SVd | ██ | ███ | ███ | ██ | ██ | ██ | ██ | ███ |
PVd | ██ | ██ | ██ | ██ | ██ | ██ | ██ | ██ |
Cyc-doublets (CyPd) | ██ | ███ | ███ | ██ | ██ | ██ | ██ | ██ |
Cyc-doublets (CyKd) | ███ | ██ | ██ | ███ | ███ | ███ | ███ | ███ |
Cyc-doublets (CyVd) | ██ | ██ | ██ | ██ | ██ | ██ | ██ | ██ |
Cilta-cel | ██ | ███ | ███ | ███ | ███ | ███ | ███ | ███ |
Elranatamab | ██ | ███ | ███ | ███ | ███ | ███ | ███ | ███ |
Teclistamab | ███ | ███ | ███ | ███ | ███ | ███ | ███ | ███ |
BVd = belantamab mafodotin plus bortezomib and dexamethasone; CDA-AMC = Canada’s Drug Agency; cilta-cel = ciltacabtagene autoleucel; cyc-doublets = CyKd and CyVd; CyKd = cyclophosphamide plus carfilzomib and dexamethasone; CyPd = cyclophosphamide plus pomalidomide and dexamethasone; CyVd = cyclophosphamide-bortezomib-dexamethasone; DVd = daratumumab plus bortezomib and dexamethasone; IsaKd = isatuximab plus carfilzomib and dexamethasone; IsaPd = isatuximab plus pomalidomide and dexamethasone; Kd = carfilzomib plus dexamethasone; PVd = pomalidomide plus dexamethasone plus bortezomib; SC = subcutaneous; SVd = selinexor plus bortezomib plus dexamethasone; Vd = bortezomib plus dexamethasone.
Treatment schedule for carfilzomib and dexamethasone is not reflective of clinical practice in Canada. The sponsor assumes patients receiving carfilzomib and dexamethasone will receive the treatment on a twice weekly schedule in the economic model. It was noted that most centres in Canada use the once weekly schedule in practice. The once weekly schedule was found to have a potentially improved efficacy profile compared to the twice weekly schedule, in addition to having a more convenient dosing schedule for patients because it requires less frequent administrations.22
CDA-AMC updated the dosing schedule for carfilzomib and dexamethasone to align with the following once weekly dosing: 28-day cycle; Cycle 1: 20 mg/m2 on Day 1 then 70 mg/m2 on days 8 and 15; Cycle 2: 70 mg/m2 on days 1, 8, and 15. CDA-AMC also updated the data source to align with the available once weekly dosing efficacy data for Kd available in the sponsor’s submitted model.
CDA-AMC Reanalysis of the Economic Evaluation
The CDA-AMC base case was derived by making changes in model parameter values and assumptions, in consultation with clinical experts (refer to Table 8). The impact of these changes, individually and collectively, is presented in Table 9.
Table 8: Revisions to the Submitted Economic Evaluation
Stepped analysis | Sponsor’s value or assumption | CDA-AMC value or assumption |
|---|---|---|
1. Impact of BVd on long-term OS | Weibull | Exponential |
2. TTD for patients receiving BVd and comparators |
|
|
3. Calculation of drug acquisition costs for BVd | IPD approach | RDI approach |
4. Disutility due to ocular toxicity | Excluded | Included |
5. Subsequent therapy | Included | Excluded |
6. Dosing for carfilzomib and dexamethasone | Twice weekly | Once weekly |
CDA-AMC base case (health care payer perspective) | ― | Reanalysis 1 + 2 + 3 + 4 + 5 + 6 |
BVd = belantamab mafodotin in combination with bortezomib and dexamethasone; CDA-AMC = Canada’s Drug Agency; IPD = individual participant data; OS = overall survival; PVd = pomalidomide plus bortezomib plus dexamethasone; RDI = relative dose intensity; TTD = time to treatment discontinuation.
Note: CDA-AMC was unable to resolve the issues with the lack of long-term clinical evidence and immaturity of the available OS data.
Table 9: Summary of the Stepped Analysis
Stepped analysis | Drug | Total costs ($) | Total QALYs | ICER ($/QALY) |
|---|---|---|---|---|
Sponsor base case | Vd | 310,958 | 3.32 | Reference |
PVd | 378,207 | 4.44 | 60,379 | |
BVd | 1,152,033 | 9.12 | 165,342 | |
Dominated treatments | ||||
SVd | 430,737 | 4.02 | Dominated | |
Cyc-doublets | 492,934 | 3.98 | Dominated | |
Kd | 493,114 | 4.44 | Extendedly dominated | |
DVd | 510,773 | 4.89 | Extendedly dominated | |
IsaKd | 860,832 | 5.65 | Extendedly dominated | |
CDA-AMC reanalysis 1 — OS | Vd | 310,958 | 3.32 | Reference |
PVd | 378,207 | 4.44 | 60,379 | |
BVd | 1,147,857 | 6.71 | 350,806 | |
Dominated treatments | ||||
SVd | 430,737 | 4.02 | Dominated | |
Cyc-doublets | 492,934 | 3.98 | Dominated | |
Kd | 493,114 | 4.44 | Extendedly dominated | |
DVd | 510,773 | 4.89 | Extendedly dominated | |
IsaKd | 860,832 | 5.65 | Extendedly dominated | |
CDA-AMC reanalysis 2 — TTD | Vd | 310,514 | 3.32 | Reference |
PVd | 377,720 | 4.44 | 60,341 | |
BVd | 1,425,626 | 9.12 | 223,904 | |
Dominated treatments | ||||
SVd | 428,831 | 4.02 | Dominated | |
Kd | 492,020 | 4.44 | Extendedly dominated | |
Cyc-doublets | 494,996 | 3.98 | Dominated | |
DVd | 512,270 | 4.89 | Extendedly dominated | |
IsaKd | 868,629 | 5.65 | Extendedly dominated | |
CDA-AMC reanalysis 3 — RDI | Vd | 310,958 | 3.32 | Reference |
PVd | 378,207 | 4.44 | 60,379 | |
BVd | 1,612,399 | 9.12 | 263,707 | |
Dominated treatments | ||||
SVd | 430,737 | 4.02 | Dominated | |
Cyc-doublets | 492,934 | 3.98 | Dominated | |
Kd | 493,114 | 4.44 | Extendedly dominated | |
DVd | 510,773 | 4.89 | Extendedly dominated | |
IsaKd | 860,832 | 5.65 | Extendedly dominated | |
CDA-AMC reanalysis 4 — ocular disutilities | Vd | 310,958 | 3.32 | Reference |
PVd | 378,207 | 4.44 | 60,379 | |
BVd | 1,152,033 | 9.00 | 169,520 | |
Dominated treatments | ||||
SVd | 430,737 | 4.02 | Dominated | |
Cyc-doublets | 492,934 | 3.98 | Dominated | |
Kd | 49,314 | 4.44 | Extendedly dominated | |
DVd | 510,773 | 4.89 | Extendedly dominated | |
IsaKd | 860,832 | 5.65 | Extendedly dominated | |
CDA-AMC reanalysis 5 — subsequent treatments | Vd | 91,209 | 3.32 | Reference |
PVd | 133,872 | 4.44 | 38,304 | |
BVd | 1,056,031 | 9.12 | 197,036 | |
Dominated treatments | ||||
SVd | 211,679 | 4.02 | Dominated | |
Cyc-doublets | 269,029 | 3.98 | Dominated | |
Kd | 280,455 | 4.44 | Extendedly dominated | |
DVd | 314,383 | 4.89 | Extendedly dominated | |
IsaKd | 659,582 | 5.65 | Extendedly dominated | |
CDA-AMC reanalysis 6 — Kd dosing schedule | Vd | 310,958 | 3.32 | Reference |
PVd | 378,207 | 4.44 | 60,379 | |
Kd | 465,050 | 5.52 | 80,270 | |
BVd | 1,152,033 | 9.12 | 190,920 | |
Dominated treatments | ||||
SVd | 430,737 | 4.02 | Dominated | |
Cyc-doublets | 492,934 | 3.98 | Dominated | |
DVd | 510,773 | 4.89 | Dominated | |
IsaKd | 860,832 | 5.65 | Extendedly dominated | |
CDA-AMC base case (Reanalysis 1 + 2 + 3 + 4 + 5 + 6) (deterministic) | Vd | 90,765 | 3.32 | Reference |
PVd | 133,385 | 4.44 | 38,266 | |
Kd | 25,561 | 5.52 | 112,558 | |
BVd | 1,904,618 | 6.56 | 1,583,666 | |
Dominated treatments | ||||
SVd | 209,773 | 4.02 | Dominated | |
Cyc-doublets | 271,090 | 3.98 | Dominated | |
DVd | 315,880 | 4.89 | Dominated | |
IsaKd | 667,380 | 5.65 | Extendedly dominated | |
CDA-AMC base case (Reanalysis 1 + 2 + 3 + 4 + 5 + 6) (probabilistic) | Vd | 90,820 | 3.48 | Reference |
PVd | 132,386 | 4.57 | 37,966 | |
Kd | 252,903 | 5.72 | 105,439 | |
BVd | 1,902,792 | 6.66 | 1,758,284 | |
Dominated treatments | ||||
SVd | 207,141 | 4.21 | Dominated | |
Cyc-doublets | 266,669 | 4.15 | Dominated | |
DVd | 316,044 | 4.91 | Dominated | |
IsaKd | 654,035 | 5.86 | Extendedly dominated | |
BVd = belantamab mafodotin plus bortezomib and dexamethasone; CDA-AMC = Canada’s Drug Agency; DVd = daratumumab in combination with bortezomib and dexamethasone; ICER = incremental cost-effectiveness ratio; IsaKd = isatuximab plus carfilzomib and dexamethasone; IsaPd = isatuximab plus pomalidomide and dexamethasone; Kd = carfilzomib plus dexamethasone; Pd = pomalidomide plus dexamethasone; PVd = pomalidomide plus dexamethasone plus bortezomib; QALY = quality-adjusted life-year; RDI = relative dose intensity; SVd = selinexor plus bortezomib plus dexamethasone; TTD = time to treatment discontinuation; Vd = bortezomib plus dexamethasone; vs. = versus.
Note: The CDA-AMC reanalysis is based on the publicly available prices of the comparator treatments.
Table 10: Summary of CDA-AMC Economic Evaluation Results
Drug | Total costs ($) | Total QALYs | Sequential ICER ($/QALY) |
|---|---|---|---|
Vd | 90,820 | 3.48 | Reference |
PVd | 132,386 | 4.57 | 37,966 vs. Vd |
Kd | 252,903 | 5.72 | 105,439 vs. PVd |
BVd | 1,902,792 | 6.66 | 1,758,284 vs. Kd |
Dominated treatments | |||
SVd | 207,141 | 4.21 | Dominated |
Cyc-doublets | 266,669 | 4.15 | Dominated |
DVd | 316,044 | 4.91 | Dominated |
IsaKd | 654,035 | 5.86 | Extendedly dominated |
BVd = belantamab mafodotin in combination with bortezomib and dexamethasone; CDA-AMC = Canada’s Drug Agency; DVd = daratumumab in combination with bortezomib and dexamethasone; ICER = incremental cost-effectiveness ratio; IsaKd = isatuximabin combination with carfilzomib and dexamethasone; Kd = carfilzomib plus dexamethasone; PVd = pomalidomide plus bortezomib plus dexamethasone; QALY = quality-adjusted life-year; SVd = selinexor plus bortezomib plus dexamethasone; Vd = bortezomib plus dexamethasone; vs. = versus.
Note: Publicly available list prices were used for all comparators.
Table 11: Disaggregated Results of the CDA-AMC Base Case
Parameter | BVd | Kd | PVd | Vd |
|---|---|---|---|---|
Discounted LYs | ||||
Total | 8.28 | 7.00 | 5.61 | 4.28 |
PFS (on-treatment) | 2.90 | 1.34 | 0.87 | 0.50 |
PFS (off-treatment) | 1.12 | 0.29 | 0.21 | 0.12 |
PD | 4.26 | 5.38 | 4.52 | 3.66 |
Discounted QALYs | ||||
Total | 6.66 | 5.72 | 4.57 | 3.48 |
PFS (on-treatment) | 2.26 | 1.10 | 0.72 | 0.40 |
PFS (off-treatment) | 0.93 | 0.24 | 0.18 | 0.10 |
PD | 3.47 | 4.38 | 3.68 | 2.98 |
Discounted costs ($) | ||||
Total | 1,902,792 | 252,903 | 132,386 | 90,820 |
Drug acquisition | 1,811,776 | 169,945 | 53,624 | 14,831 |
Administration | 7,944 | 6,686 | 3,292 | 1,683 |
Health state costs | 19,365 | 16,758 | 13,444 | 10,288 |
Terminal care costs | 50,910 | 52,046 | 53,351 | 54,564 |
Subsequent treatment costs | 0 | 0 | 0 | 0 |
Adverse event costs | 12,797 | 7,468 | 8,675 | 9,455 |
BVd = belantamab mafodotin in combination with bortezomib and dexamethasone; CDA-AMC = Canada’s Drug Agency; Kd = carfilzomib plus dexamethasone; LY = life-year; OS = overall survival; PD = progressed disease; PFS = progression-free survival; PVd = pomalidomide plus bortezomib plus dexamethasone; QALY = quality-adjusted life-year; Vd = bortezomib plus dexamethasone.
Price Reduction Analysis
CDA-AMC conducted price reduction analyses using the sponsor’s base case and the CDA-AMC base case (refer to Table 12).
Table 12: Results of the Price Reduction Analysis
Price reduction | Unit drug cost ($)a | Cost per 28 days ($) | ICERs for BVd vs. comparators ($/QALY) | |
|---|---|---|---|---|
Sponsor base case | CDA-AMC base case | |||
No price reduction | 27,800b | 74,133 | 173,206 (vs. PVd) | 1,758,284 (vs. Kd) |
10% | 25,020 | 66,720 | 152,153 (vs. PVd) | 1,566,954 (vs. Kd) |
20% | 22,240 | 59,306 | 131,099 (vs. PVd) | 1,375,623 (vs. Kd) |
30% | 19,460 | 51,893 | 110,045 (vs. PVd) | 1,184,292 (vs. Kd) |
40% | 16,680 | 44,480 | 88,992 (vs. PVd) | 992,961 (vs. Kd) |
50% | 13,900 | 37,067 | 67,938 (vs. Vd) | 801,630 (vs. Kd) |
60% | 11,120 | 29,653 | 49,275 (vs. Vd) | 610,299 (vs. Kd) |
70% | 8,340 | 22,240 | 32,456 (vs. Vd) | 418,969 (vs. Kd) |
80% | 5,560 | 14,827 | 15,638 (vs. Vd) | 227,638 (vs. Kd) |
90% | 2,780 | 7,413 | Dominant | 74,272 (vs. Kd) |
BVd = belantamab mafodotin plus bortezomib and dexamethasone; CDA-AMC = Canada’s Drug Agency; ICER = incremental cost-effectiveness ratio; Kd = carfilzomib plus dexamethasone; PVd = pomalidomide plus bortezomib plus dexamethasone QALY = quality-adjusted life-year; vs. = versus.
aThe unit drug cost presented in this table reflects the submitted price of the belantamab mafodotin 100 mg vial. The submitted price for the 70 mg vial is $19,460.00.
bSponsor’s submitted price for BVd.6
Assessment of Uncertainty
CDA-AMC used the CDA-AMC base case to conduct scenario analyses to address uncertainty within the economic evaluation. The results are provided in Table 13.
Scenario 1: Included subsequent therapies with adjusted market shares for fourth-line treatments to better reflect expected clinical practice in Canada (Table 7).
Scenario 2: Assumed IPD-based costing approach for BVd, as well as the cost of ophthalmologic examinations before infusions, reflecting the Health Canada product monograph.
Table 13: Results of CDA-AMC Scenario Analyses
Analysisa | Drug | Total costs ($) | Total QALYs | ICER ($/QALYs) |
|---|---|---|---|---|
CDA-AMC base case | Vd | 90,820 | 3.48 | Reference |
PVd | 132,386 | 4.57 | 37,966 | |
Kd | 252,903 | 5.72 | 105,439 | |
BVd | 1,902,792 | 6.66 | 1,758,284 | |
CDA-AMC scenario 1: Subsequent therapies included, with adjusted fourth-line distribution | Vd | 310,514 | 3.32 | Reference |
PVd | 377,720 | 4.44 | 60,341 | |
Kd | 466,379 | 5.52 | 81,948 | |
BVd | 2,070,824 | 6.56 | 1,540,448 | |
CDA-AMC scenario 2: IPD-based costing for BVd and ophthalmologic exams before infusions | Vd | 90,765 | 3.32 | Reference |
PVd | 133,385 | 4.44 | 38,266 | |
Kd | 255,161 | 5.52 | 112,558 | |
BVd | 1,325,449 | 6.56 | 1,027,597 |
BVd = belantamab mafodotin plus bortezomib and dexamethasone; CDA-AMC = Canada’s Drug Agency; ICER = incremental cost-effectiveness ratio; IPD = individual participant data; Kd = carfilzomib plus dexamethasone; PVd = pomalidomide plus dexamethasone plus bortezomib; QALY = quality-adjusted life-year; Vd = bortezomib plus dexamethasone.
aDeterministic analyses presented.
Issues for Consideration
Cilta-cel received a positive recommendation from CDA-AMC on November 1, 2024, for the treatment of adult patients with MM who have received 1 to 3 prior lines of therapy, including a proteasome inhibitor and an immunomodulatory drug, and whose disease is refractory to lenalidomide.23 Cilta-cel is currently undergoing active negotiation at pCPA to achieve a negotiated price for public payers.24 The availability of cilta-cel in earlier lines of therapy (i.e., the second line) was not modelled in the current submission. The cost-effectiveness of cilta-cel versus BVd is unknown.
Belantamab mafodotin is currently under review at CDA-AMC as an alternate regimen in combination with pomalidomide and dexamethasone (BPd) for the treatment of MM in adult patients who have received at least 1 prior therapy including lenalidomide.25 The cost-effectiveness of BVd versus BPd is unknown.
Appendix 5: Budget Impact Analysis
Please note that this appendix has not been copy-edited.
Summary of the Sponsor’s BIA
The sponsor submitted a BIA that estimated the expected incremental budgetary impact of reimbursing BVd for the treatment of adults with RRMM who have received at least 1 prior line of therapy.1
The BIA was conducted from the perspective of public drug plan payers over a 3-year time horizon (2025 to 2027), with 2024 as the base year. The sponsor’s estimate reflects the aggregated results from the jurisdictional provincial budgets (excluding Quebec), as well as the Non-Insured Health Benefits program. The sponsor estimated the eligible population using an epidemiologic approach.2 The sponsor’s base case included primary drug acquisition costs and the cost of subsequent treatment.2 The market uptake for BVd was estimated using the sponsor’s internal market share estimates.4 The key inputs to the BIA are documented in Table 14
The sponsor estimated the 3-year incremental budget impact associated with reimbursing BVd for the treatment of adult patients with RRMM who have received at least 1 prior line of therapy would be $400,706,280 (year 1 = $70,289,895; year 2 = $131,713,369; year 3 = $198,703,015).
Table 14: Key Model Parameters
Parameter | Sponsor’s estimate (reported as year 1 / year 2 / year 3) | |
|---|---|---|
Target population | ||
Starting number of people | 32,170,244 / 32,723,421 / 33,286,34626 | |
Annual population growth rate in Canada | 0.9%26 | |
Incidence of disease | 9.64 per 100,00027 | |
Percentage of patients with MM receiving 1L treatment | 95%28 | |
ASCT status | ASCT | No ASCT |
Percentage of total 1L patients with MM18, a | 58.8% | 41.2% |
Percentage of 1L receiving 2L18 | 56.3% | 59.9% |
1L progressing to 2L – Year 118 | ██████ | ██████ |
1L progressing to 2L – Year 218 | ██████ | ██████ |
1L progressing to 2L – Year 318 | ██████ | ██████ |
1L progressing to 2L – Year 418 | ██████ | █████ |
1L progressing to 2L – Year 518 | █████ | █████ |
1L progressing to 2L – Year 618 | █████ | █████ |
Percentage of 2L patients receiving 3L18 | 60.9% | 54.1% |
2L progressing to 3L – Year 118 | ██████ | ██████ |
2L progressing to 3L – Year 218 | ██████ | ██████ |
2L progressing to 3L – Year 318 | ██████ | ██████ |
2L progressing to 3L – Year 418 | █████ | █████ |
2L progressing to 3L – Year 518 | █████ | █████ |
2L progressing to 3L – Year 618 | █████ | █████ |
Percentage of 3L patients receiving 4L18 | 61.5% | 44.6% |
3L progressing to 4L – Year 118 | ██████ | ██████ |
3L progressing to 4L – Year 218 | ██████ | ██████ |
3L progressing to 4L – Year 318 | █████ | █████ |
3L progressing to 4L – Year 418 | █████ | █████ |
3L progressing to 4L – Year 518 | █████ | █████ |
3L progressing to 4L – Year 618 | █████ | █████ |
Percentage aged less than 65 years7 | 50% | |
Percentage aged less than 65 years with public health coverage2 | 100% | |
Percentage aged older than 64 years7 | 50% | |
Percentage aged older than 64 years with public health coverage2 | 100% | |
Number of patients eligible for drug under review | 3,097 / 3,181 / 3,262 | |
Cost of treatment (per patient in year 1) | ||
BVd | $497,082 | |
DVd | $167,979 | |
PVd | $60,921 | |
SVd | $171,076 | |
IKd | $337,267 | |
Kd | $200,188 | |
Vd | $27,585 | |
Cyclophosphamide doubletsb | $157 | |
Cilta-celc | $632,455 | |
Elranatamab | $253,731 | |
Teclistamab | $354,380 | |
1L = first line; 2L = second line; 3L = third line; 4L = fourth line; ASCT = autologous stem cell transplant; BVd = belantamab mafodotin plus bortezomib and dexamethasone; cyclophosphamide doublets = CyKd + CyVd; CyKd = cyclophosphamide plus carfilzomib and dexamethasone; CyVd = cyclophosphamide + bortezomib and dexamethasone; DVd = daratumumab in combination with bortezomib and dexamethasone; IKd = isatuximab plus carfilzomib and dexamethasone; Kd = carfilzomib plus dexamethasone; MM = multiple myeloma; PVd = pomalidomide plus bortezomib plus dexamethasone; SVd = selinexor plus bortezomib plus dexamethasone; Vd = bortezomib plus dexamethasone.
aReference for these estimates were derived using digitizer software from the figures from Mian et al. but are not reported values within the publication.
bIncludes cost of cyclophosphamide only; respective background therapies excluded.
cOne-time dose.
Table 15: Key Model Parameters — Market Share
Market share by line of therapy | Second line4 | Third line4 | Fourth line4 |
|---|---|---|---|
Market shares (reference scenario) | |||
BVd | 0% / 0% / 0% | 0% / 0% / 0% | 0% / 0% / 0% |
DVd | ██ █ ██ █ ██ | ███ █ ███ █ ███ | — |
PVd | ██ █ ██ █ ██ | ██ █ ██ █ ██ | — |
SVd | ███ █ ███ █ ███ | ███ █ ███ █ ███ | ███ █ ███ █ ███ |
IsaKd | ███ █ ███ █ ███ | ███ █ ███ █ ███ | — |
Kd | ██ █ ██ █ ██ | ███ █ ███ █ ███ | ██ █ ██ █ ██ |
Vd | — | ██ █ ██ █ ██ | — |
Cyclophosphamide doublets | ███ █ ███ █ ███ | ███ █ ███ █ ███ | — |
Cyclophosphamide in combination with Kd | — | — | ███ █ ███ █ ███ |
Cilta-cel | — | — | ███ █ ███ █ ███ |
Elranatamab | — | — | ███ █ ███ █ ███ |
Teclistamab | — | — | ███ █ ███ █ ███ |
Market shares (new drug scenario) | |||
BVd | 33% / 37% / 41% | 0% / 0% / 0% | 0% / 0% / 0% |
DVd | ██ █ ██ █ ██ | ███ █ ███ █ ███ | — |
PVd | ██ █ ██ █ ██ | ██ █ ██ █ ██ | — |
SVd | ███ █ ███ █ ███ | ███ █ ███ █ ███ | ███ █ ███ █ ███ |
IsaKd | ███ █ ███ █ ███ | ███ █ ███ █ ███ | — |
Kd | ██ █ ██ █ ██ | ███ █ ███ █ ███ | ██ █ ██ █ ██ |
Vd | ██ █ ██ █ ██ | ██ █ ██ █ ██ | — |
Cyclophosphamide doublets | ███ █ ███ █ ███ | ███ █ ███ █ ███ | — |
Cyclophosphamide in combination with (Kd) | — | — | ███ █ ███ █ ███ |
Cilta-cel | — | — | ███ █ ███ █ ███ |
Elranatamab | — | — | ███ █ ███ █ ███ |
Teclistamab | — | — | ███ █ ███ █ ███ |
BVd = belantamab mafodotin plus bortezomib and dexamethasone; cyclophosphamide doublets = CyKd + CyVd; CyKd = cyclophosphamide plus carfilzomib and dexamethasone; CyVd = cyclophosphamide plus bortezomib and dexamethasone); DVd = daratumumab in combination with bortezomib and dexamethasone; IsaKd = isatuximab plus carfilzomib and dexamethasone; Kd = carfilzomib plus dexamethasone; PVd = pomalidomide plus bortezomib plus dexamethasone; SVd = selinexor plus bortezomib plus dexamethasone; Vd = bortezomib plus dexamethasone.
Key Issues of the Submitted BIA
CDA-AMC identified several key issues to the sponsor’s analysis that have notable implications on the results of the BIA:
Inappropriate use of IPD and RDI for drug acquisition cost calculation. Consistent with the limitation identified in the submitted pharmacoeconomic model (refer to Appendix 4), the sponsor used IPD from the DREAMM-7 trial to estimate drug acquisition costs for belantamab mafodotin, calculating dosing based on the draft Health Canada product monograph.1 While weekly doses between 1.7 to 2.7 mg/kg broad categories were delineated by 0.1 mg/kg intervals, several assumptions were applied to the less than 1.7 mg/kg and greater than 2.7 mg/kg broad categories, with drug acquisition costs extrapolated when fewer than 50 patients remained on treatment.2 Due to limited data, the model assumed that doses less than 1.7 mg/kg and greater than 2.7 mg/kg incurred the same costs as 1.7 mg/kg and 2.7 mg/kg, which may have underestimated drug costs.2 Costs were also based on the closest labelled doses (1.9 mg/kg and 2.5 mg/kg), even when actual doses fell between these ranges.2 Unlike comparators, which applied RDI to account for dose reductions or delays, the sponsor’s approach for BVd may have introduced bias in favour of BVd. Moreover, the sponsor estimated drug costs by multiplying the base dose from product monographs with RDI estimates from the DREAMM-7 trial, assuming 100% RDI where data were unavailable.2 This approach introduces uncertainty, as real-world dosing may vary due to dose delays, missed doses, reductions to manage toxicity, or re-escalation, all of which impact drug costs. For IV medications, applying RDI alongside wastage assumptions further reduced estimated drug usage, while prescription pills and oral treatments could be reimbursed regardless of adherence, creating inconsistencies in cost estimates.
CDA-AMC conducted a base-case reanalysis in which drug acquisition costs for BVd were calculated using RDI.
CDA-AMC conducted a scenario analysis in which all treatments were assumed to have 100% RDI.
CDA-AMC conducted a scenario analysis that adopted the IPD costing approach for BVd.
TTD estimates for patients receiving BVd and comparators is uncertain. The sponsor’s model estimated first-line treatment costs using TTD and PFS data from the DREAMM-7 trial, applying a Weibull distribution for both BVd and DVd groups.29 In the absence of published TTD data for external comparators, PFS from the sponsor-submitted NMA was used as a proxy.29 In the BIA base case, TTD was estimated using the area under the extrapolated parametric curves.2 For cilta-cel, the sponsor applied a PFS HR relative to DVd.30 For teclistamab and elranatamab, time to next treatment HRs versus pomalidomide plus dexamethasone (Pd) and PFS HRs versus Pd were used to calculate TTD.31,32 Using PFS and time to next treatment as proxies for TTD may introduce bias, as they do not directly reflect treatment duration, given that patients may experience PFS even after treatment has been discontinued. Furthermore, cilta-cel efficacy estimates were based on the CARTITUDE-4 trial, in which only 25.8% of patients were triple-exposed, limiting the generalizability of the results to the fourth-line triple-exposed population.30 These assumptions are subject to the same limitations outlined in the critical appraisal of the pharmacoeconomic submission (refer to Appendix 4)
CDA-AMC conducted a base-case reanalysis using the log-normal parametric distribution to extrapolate TTD for BVd and the exponential distribution to extrapolate TTD for DVd.
Assumptions regarding subsequent therapies are highly uncertain. The sponsor assumed that the proportion of patients receiving subsequent therapy was the same across all treatment arms, based on available literature.18 Additionally, the sponsor used internal market estimates to derive the distribution of third-line and fourth-line treatments.4 Consistent with the limitation identified in the pharmacoeconomic submission (refer to Appendix 4), clinical experts consulted by CDA-AMC agreed that treatment pathways for BVd and comparators are expected to be similar. However, substantial uncertainty remains regarding the distribution of subsequent therapies in the fourth-line setting, as cilta-cel, teclistamab, and elranatamab were under active negotiation with the pCPA at the time of the current review.33
CDA-AMC conducted a base-case reanalysis that adjusted the proportion of subsequent therapies in the fourth-line setting to better align with expectations of clinical practice in Canada (refer to Table 7).
CDA-AMC conducted a scenario analysis that excluded subsequent therapies in the third-line and fourth-line setting.
Treatment schedule of carfilzomib and dexamethasone is not reflective of clinical practice in Canada: The sponsor assumed that patients receiving carfilzomib and dexamethasone would follow a twice weekly dosing schedule.34 In consultation with clinical experts, it was noted that most centres in Canada use the once weekly schedule. This choice is attributed to the greater convenience for patients and a potentially improved efficacy profile.
CDA-AMC conducted a base-case reanalysis that adjusted the dosing schedule for carfilzomib and dexamethasone to align with the following once weekly dosing: (28-day cycle) Cycle 1: 20 mg/m2 on day 1 then 70 mg/m2 on day 8 and day 15; Cycle 2: 70 mg/m2 on day 1, day 8, and day 15.
Market share estimates are highly uncertain. In the sponsor’s submitted BIA, the market share distributions in both the reference and new drug scenarios were based on internal market estimates.4 Given the rapidly evolving RRMM treatment landscape, clinical experts consulted by CDA-AMC indicated that the market share distribution of SVd, Pd, Kd, and CyKd was likely underestimated, with greater uncertainty in third-line and fourth-line settings. As previously noted, cilta-cel, elranatamab, and teclistamab were undergoing active negotiations with pCPA at the time of the current review, further contributing to uncertainty in the sponsor’s market share assumptions.33
CDA-AMC was unable to address this limitation due to the high degree of uncertainty surrounding the market share assumptions.
Impact of OS on the budget impact is uncertain. The sponsor’s model estimated OS for the DVd and BVd treatment groups using a Weibull distribution, with survival calculated as the area under the extrapolated parametric curves. OS for other comparators was based on estimated relative treatment effects versus DVd from the sponsor-submitted NMA.29 Given that BCMA-targeted therapies (cilta-cel, teclistamab, and elranatamab) were not included in the NMA, the sponsor employed naive comparisons using HRs. For cilta-cel, the sponsor used an HR versus DVd.30 However, cilta-cel estimates were based on the CARTITUDE-4 trial, in which only 25.8% of patients were triple-exposed, limiting the generalizability of the results to the fourth-line triple-exposed population.30 For teclistamab and elranatamab, the sponsor used HRs versus Pd to estimate OS.31,32 This approach is subject to the same limitations identified in the CUA, as naive comparisons are less reliable than adjusted indirect comparisons.
CDA-AMC explored the impact of using the exponential distribution to extrapolate OS for BVd, to align with the approach used in the CUA. However, this change did not meaningfully affect the results of the BIA. As a result, no reanalysis was conducted.
CDA-AMC Reanalyses of the BIA
CDA-AMC revised the sponsor’s submitted analyses by making changes in model parameter values and assumptions, in consultation with clinical experts, as outlined in Table 15.
Table 16: Revisions to the Submitted BIA
Stepped analysis | Sponsor’s value or assumption | CDA-AMC value or assumption |
|---|---|---|
1. BVd dosing assumption | IPD | RDI |
2. TTD extrapolation function |
|
|
3. Subsequent therapy | ||
4. Kd dosing schedule | Twice weekly | Once weekly |
CDA-AMC base case | ― | Reanalysis 1 + 2 + 3 + 4 |
BIA = budget impact analysis; BVd = belantamab mafodotin in combination with bortezomib and dexamethasone; CDA-AMC = Canada’s Drug Agency; DVd = daratumumab in combination with bortezomib and dexamethasone; IPD = individual patient data; Kd = carfilzomib plus dexamethasone; RDI = relative dose intensity.
The results of the CDA-AMC step-wise reanalysis are presented in summary format in Table 16 and a more detailed breakdown is presented in Table 17. In the CDA-AMC base case, the 3-year budget impact of reimbursing BVd for the treatment of adult patients with RRMM who have received at least 1 prior line of therapy was $940,329,524 (year 1 = $166,401,336; year 2 = $316,404,684; year 3 = $457,523,504).
Table 17: Summary of the Stepped Analysis of the CDA-AMC Base Case
Stepped analysis | Three-year total ($) |
|---|---|
Submitted base case | 400,706,280 |
CDA-AMC reanalysis 1 | 800,444,242 |
CDA-AMC reanalysis 2 | 383,587,204 |
CDA-AMC reanalysis 3 | 536,411,292 |
CDA-AMC reanalysis 4 | 432,135,083 |
CDA-AMC base case: (reanalysis 1 + 2 + 3 + 4) | 940,329,524 |
CDA-AMC = Canada’s Drug Agency.
Note: The CDA-AMC reanalysis is based on publicly available prices of the comparator treatments.
CDA-AMC used the CDA-AMC base case to conduct scenario analyses to explore uncertainty in the estimated budget impact of reimbursing BVd. The results are provided in Table 17.
Scenario 1: Subsequent therapy in the third-line and fourth-line settings were excluded from the CDA-AMC base case due to high degree of uncertainty surrounding their market shares.
Scenario 2: Assumed 100% RDI across all therapies.
Scenario 3: Assumed IPD costing approach for BVd.
Table 18: Disaggregated Summary of the BIA
Stepped analysis | Scenario | Year 0 (current situation) ($) | Year 1 ($) | Year 2 ($) | Year 3 ($) | Three-year total ($) |
|---|---|---|---|---|---|---|
Submitted base case | Reference total | 1,060,820,474 | 1,090,404,592 | 1,278,077,677 | 1,382,009,092 | 3,750,491,362 |
BVd | 0 | 0 | 0 | 0 | 0 | |
All other comparators | — | — | — | — | — | |
New drug total | 1,060,820,474 | 1,160,694,488 | 1,409,791,047 | 1,580,712,107 | 4,151,197,641 | |
BVd | 0 | 200,664,876 | 311,657,438 | 418,038,372 | 930,360,685 | |
All other comparators | 1,060,820,474 | 960,029,612 | 1,098,133,609 | 1,162,673,735 | 3,220,836,956 | |
Budget impact | 0 | 70,289,895 | 131,713,369 | 198,703,015 | 400,706,280 | |
CDA-AMC base case | Reference total | 1,041,216,330 | 1,070,225,395 | 1,238,591,386 | 1,334,494,711 | 3,643,311,492 |
BVd | 0 | 0 | 0 | 0 | 0 | |
All other comparators | — | — | — | — | — | |
New drug total | 1,041,216,330 | 1,236,626,731 | 1,554,996,070 | 1,792,018,215 | 4,583,641,016 | |
BVd | 0 | 250,648,088 | 439,112,028 | 610,013,235 | 1,299,773,351 | |
All other comparators | 1,041,216,330 | 985,978,643 | 1,115,884,042 | 1,182,004,980 | 3,283,867,665 | |
Budget impact | 0 | 166,401,336 | 316,404,684 | 457,523,504 | 940,329,524 | |
CDA-AMC scenario analyses | ||||||
Scenario 1: Excluding 3L and 4L subsequent therapies | Reference total | 414,475,321 | 425,982,786 | 576,927,182 | 655,926,847 | 1,658,836,814 |
New drug total | 414,475,321 | 617,449,493 | 922,009,736 | 1,146,062,398 | 2,685,521,627 | |
Budget impact | 0 | 191,466,706 | 345,082,554 | 490,135,552 | 1,026,684,812 | |
Scenario 2: 100% RDI applied across therapies | Reference total | 1,070,847,409 | 1,100,685,734 | 1,278,821,345 | 1,380,328,519 | 3,759,835,598 |
New drug total | 1,070,847,409 | 1,417,030,082 | 1,860,731,952 | 2,208,401,531 | 5,486,163,564 | |
Budget impact | 0 | 316,344,348 | 581,910,608 | 828,073,011 | 1,726,327,967 | |
Scenario 3: IPD-based costing approach | Reference total | 1,041,216,330 | 1,070,225,395 | 1,238,591,386 | 1,334,494,711 | 3,643,311,492 |
New drug total | 1,041,216,330 | 1,182,252,387 | 1,419,006,973 | 1,592,491,210 | 4,193,750,570 | |
Budget impact | 0 | 112,026,992 | 180,415,587 | 257,996,499 | 550,439,078 | |
3L = third line; 4L = fourth line; BIA = budget impact analysis; BVd = belantamab mafodotin in combination with bortezomib and dexamethasone; CDA-AMC = Canada’s Drug Agency; RDI = relative dose intensity.
Note: The CDA-AMC reanalysis is based on the publicly available prices of the comparator treatments.
ISSN: 2563-6596
Canada’s Drug Agency (CDA-AMC) is a pan-Canadian health organization. Created and funded by Canada’s federal, provincial, and territorial governments, we’re responsible for driving better coordination, alignment, and public value within Canada’s drug and health technology landscape. We provide Canada’s health system leaders with independent evidence and advice so they can make informed drug, health technology, and health system decisions, and we collaborate with national and international partners to enhance our collective impact.
Disclaimer: CDA-AMC has taken care to ensure that the information in this document was accurate, complete, and up to date when it was published, but does not make any guarantee to that effect. Your use of this information is subject to this disclaimer and the Terms of Use at cda-amc.ca.
The information in this document is made available for informational and educational purposes only and should not be used as a substitute for professional medical advice, the application of clinical judgment in respect of the care of a particular patient, or other professional judgments in any decision-making process. You assume full responsibility for the use of the information and rely on it at your own risk.
CDA-AMC does not endorse any information, drugs, therapies, treatments, products, processes, or services. The views and opinions of third parties published in this document do not necessarily reflect those of CDA-AMC. The copyright and other intellectual property rights in this document are owned by the Canadian Agency for Drugs and Technologies in Health (operating as CDA-AMC) and its licensors.
Questions or requests for information about this report can be directed to Requests@CDA-AMC.ca.