Drugs, Health Technologies, Health Systems
Reimbursement Review
Erdafitinib (Balversa)
Sponsor: Janssen Inc.
Therapeutic area: Locally advanced unresectable or metastatic urothelial carcinoma
This multi-part report includes:
Clinical Review
TPA Review
Pharmacoeconomic Review
Clinical Review
Abbreviations
AE
adverse event
BCC
Bladder Cancer Canada
CDA-AMC
Canada’s Drug Agency
CI
confidence interval
CR
complete response
CrI
credible interval
CSR
central serous retinopathy
DoR
duration of response
ESS
effective sample size
FACT-Bl
Functional Assessment of Cancer Therapy–Bladder
FACT-G
Functional Assessment of Cancer Therapy–General
FGFR
fibroblast growth factor receptor
GRADE
Grading of Recommendations Assessment, Development and Evaluation
GU DAC
Genitourinary Cancer Drug Advisory Committee
HR
hazard ratio
HRQoL
health-related quality of life
ICI
immune checkpoint inhibitor
IDMC
Independent Data Monitoring Committee
ITC
indirect treatment comparison
ITT
intention-to-treat
KM
Kaplan-Meier
la/mUC
locally advanced unresectable or metastatic urothelial carcinoma
MAIC
matching-adjusted indirect comparison
MIBC
muscle-invasive bladder cancer
MID
minimal important difference
NMIBC
non–muscle-invasive bladder cancer
OR
odds ratio
ORR
objective response rate
OS
overall survival
PD
progressive disease
PFS
progression-free survival
PGI-S
Patient Global Impression of Severity
PH
proportional hazards
PR
partial response
PRO
patient-reported outcome
RCT
randomized controlled trial
RECIST 1.1
Response Evaluation Criteria in Solid Tumours Version 1.1
RR
risk ratio
SAE
serious adverse event
SD
standard deviation
SLR
systematic literature review
SMD
standardized mean difference
TEAE
treatment-emergent adverse event
TEM
treatment-effect modifier
UC
urothelial carcinoma
ULN
upper limit of normal
Executive Summary
An overview of the submission details for the drug under review is provided in Table 1.
Table 1: Background Information of Application Submitted for Review
Item | Description |
|---|---|
Drug product | Erdafitinib (Balversa), single-dose tablets containing 3 mg, 4 mg, or 5 mg of erdafitinib that are administered orally |
Sponsor | Janssen Inc., a Johnson & Johnson company |
Indication | Erdafitinib is indicated for the treatment of adult patients with locally advanced unresectable or metastatic urothelial carcinoma harbouring susceptible fibroblast growth factor receptor 3 (FGFR3) genetic alterations, who have disease progression during or following at least 1 line of prior therapy, including within 12 months of neoadjuvant or adjuvant therapy. Erdafitinib should not be used for the treatment of patients who are eligible for and have not received prior PD-1 or PD-L1 inhibitor therapy. Treatment with erdafitinib should be initiated following confirmation of a susceptible FGFR genetic alteration using a validated test. |
Reimbursement request | As per indication |
Health Canada approval status | Approved, with NOC The indication is based on a supplement to a New Drug Submission, confirmatory in fulfillment of the conditions of Notice of Compliance with conditions granted in 2019. |
Health Canada review pathway | Standard pathway |
NOC date | September 25, 2024 |
Recommended dose | 8 mg orally once daily. Dose increase to 9 mg once daily if serum phosphate < 9 mg/dL and there is no drug-related toxicity. |
FGFR = fibroblast growth factor receptor; NOC = Notice of Compliance.
Introduction
Urothelial carcinoma (UC) is a malignant transformation of urothelial cells, primarily affecting the bladder, and accounts for 90% to 95% of bladder cancer cases. In 2023, Canada saw an estimated 13,400 new bladder cancer cases, with 2,600 deaths expected annually. The most common symptom of bladder cancer is hematuria, although other symptoms, such as pain during urination, abdominal pain, and fatigue, may also occur. The cancer predominantly affects individuals older than 50 years, and there is a higher incidence in males and in those with risk factors like smoking, chemical exposure, or a family history of bladder cancer. Diagnosis is typically made through cystoscopy and biopsy; most patients are diagnosed with non–muscle-invasive bladder cancer (NMIBC), although a significant portion may progress to muscle-invasive bladder cancer (MIBC) or metastatic disease. Fibroblast growth factor receptors (FGFRs) play a crucial role in UC, and abnormalities in the FGFR3 gene are linked to up to 42% of UC cases.
Treatment for locally advanced unresectable or metastatic urothelial carcinoma (la/mUC) focuses on slowing disease progression, extending life, and improving quality of life. The standard first-line treatment is cisplatin-based chemotherapy, although platinum-based chemotherapy is generally preferred. For patients who are ineligible for platinum-based chemotherapy, immune checkpoint inhibitors (ICIs), like pembrolizumab and avelumab, are offered as an alternative first-line option and are commonly used as second-line treatment after progression on chemotherapy. Newer therapies, such as enfortumab vedotin (Padcev) and erdafitinib (Balversa), are also part of the treatment landscape, particularly for patients with specific genetic alterations. Despite these therapies, la/mUC remains largely incurable, with a poor prognosis.
Erdafitinib, a targeted therapy, inhibits FGFRs and is used in cases of la/mUC with FGFR3 alterations. It has been approved by Health Canada for the for the treatment of adult patients with locally advanced unresectable or metastatic UC, harbouring susceptible FGFR3 genetic alterations, who have disease progression during or following at least 1 line of prior therapy, including within 12 months of neoadjuvant or adjuvant therapy. Erdafitinib should not be used for the treatment of patients who are eligible for and have not received prior PD-1 or PD-L1 inhibitor therapy. Treatment with erdafitinib should be initiated following confirmation of a susceptible FGFR genetic alteration using a validated test.
The objective of this report is to review and critically appraise the evidence submitted by the sponsor on the beneficial and harmful effects of erdafitinib tablets — 3 mg, 4 mg, and 5 mg — administered orally for the treatment of adult patients with la/mUC harbouring susceptible FGFR3 genetic alterations.
Patient, Clinician, and Drug Program Perspectives
The information in this section is a summary of input provided by the patient group and the clinician groups that responded to the CDA-AMC call for input and from clinical experts consulted by Canada's Drug Agency (CDA-AMC) for the purpose of this review.
Patient Input
One patient group, Bladder Cancer Canada (BCC), provided input for this CDA-AMC review. BCC is a registered national charity that serves those facing a bladder cancer diagnosis. The information provided by BCC was collected with an online survey, which asked about the impact of FGFR3 metastatic UC on the lives of patients, the effect of current treatments, and patient experience with erdafitinib. The online survey was completed by 4 people (identified by BCC as patients A, B, C, and D), all of whom were from Canada and all of whom had la/mUC with an FGFR3 mutation. Of the 2 survey respondents (patients A and B) who had treatment experience with erdafitinib, 1 agreed to participate in a telephone interview to discuss their survey responses.
The most common cancer symptoms reported by respondents were fatigue, insomnia, neuropathy, and decreased mobility. Survey responses suggested that the cancer symptoms of participants were not adequately managed with current therapies. Fatigue, neuropathy, and hair loss were the most commonly reported side effects of treatments. One patient-reported difficulty in accessing treatment was related to travel time. Regarding respondent willingness to tolerate new side effects from drugs that can control disease progression or improve overall survival (OS), the average score was 6.25 on a scale of 1 (will not tolerate side effects) to 10 (will tolerate significant side effects), with scores ranging from 4 to 10.
Of the respondents who were treated with erdafitinib, patient A had completed a full course of treatment and patient B had been receiving erdafitinib for 6 weeks. When these patients were asked to rate how their lives had changed with erdafitinib in terms of certain categories (metastatic cancer symptoms, drug side effects, maintaining quality of life, controlling disease progression, and preventing recurrence), compared to other therapies they had received, scores generally suggested that neither respondent experienced a major difference with erdafitinib. Reported side effects from erdafitinib were dysgeusia (patient A) and dry mouth, nausea, and leg pain (patient B). Tolerability of the side effects of erdafitinib, on a scale of 1 (completely tolerable) to 10 (completely intolerable), was rated as 9 by patient A and 3 by patient B. Both patients reported that taking erdafitinib orally made their treatment easier and both indicated that they would recommend erdafitinib to other patients with bladder cancer.
Clinician Input
Input From Clinical Experts Consulted by CDA-AMC
Clinical experts consulted by CDA-AMC for the review of erdafitinib in the treatment of la/mUC identified several key considerations. For unmet needs, one of the most significant challenges is determining the optimal sequencing of erdafitinib and enfortumab vedotin for patients with FGFR alterations. Although enfortumab vedotin is currently the standard treatment after progression on platinum-based chemotherapy and ICIs, it may not be suitable for all patients because of its associated toxicities. Additionally, the anticipated approval of enfortumab vedotin used in combination with pembrolizumab as a first-line therapy raises concerns about the lack of subsequent treatment options, highlighting another unmet need.
Erdafitinib is expected to be used as monotherapy after platinum-based chemotherapy and ICI therapy, particularly in patients with FGFR alterations, as supported by the pivotal THOR trial. However, clinical experts noted that the ideal sequencing of enfortumab vedotin and erdafitinib remains uncertain, which could impact treatment decisions.
The target population for erdafitinib includes patients with tumours harbouring FGFR alterations, necessitating genetic testing to identify these alterations. Experts agreed that la/mUC is not a rare disease and that the patient population studied in clinical trials is consistent with the intended target population for this therapy.
In terms of treatment assessment, the experts recommended monitoring clinical symptoms and using imaging studies to evaluate disease progression. Treatment discontinuation should be considered in cases of disease progression, significant toxicity, or intolerability, with decisions made on a case-by-case basis, following the criteria used in clinical trials. The experts also emphasized that the management of diagnosis, treatment, and ongoing patient monitoring should be handled by oncology specialists, including in outpatient settings, to ensure the best possible care for patients.
Clinician Group Input
Seven clinicians from the Ontario Health (Cancer Care Ontario) Genitourinary Cancer Drug Advisory Committee (GU DAC) provided input for this review. Ontario Health (Cancer Care Ontario) Drug Advisory Committees provide timely evidence-based clinical and health system guidance on drug-related issues, including the Provincial Drug Reimbursement Programs and the Systemic Treatment Program, in support of Cancer Care Ontario’s mandate.
In communicating current treatments for la/mUC, the GU DAC noted that patients who have previously received an ICI, chemotherapy, or the combination of both are eligible for treatment with enfortumab vedotin, and the goal of treatment is to improve OS. The GU DAC expressed an unmet need for a treatment for patients with genomic alterations, noting that erdafitinib is effective for the FGFR genetic alteration and would be the first targeted therapy identified for this patient population based on molecular testing. Regarding place in therapy, the GU DAC indicated that patients who would be eligible and best suited for treatment with erdafitinib are those with FGFR mutations and/or alterations who have previously received or who have a contraindication to ICI therapy. The GU DAC stated that erdafitinib would be administered in the outpatient setting under the supervision of a medical oncologist. Patient response to treatment is assessed in clinical practice using conventional imaging (CT scan of the chest, abdomen, and/or pelvis), at the physician’s discretion. Discontinuation of treatment with erdafitinib would be considered when the patient experiences unacceptable toxicity or clinically significant disease progression.
Drug Program Input
The drug programs provided input and posed several questions regarding the implementation of erdafitinib in patients with la/mUC harbouring FGFR alterations. These questions aim to clarify the drug's place in therapy, the appropriate patient population, and considerations for its use.
In response to the question about relevant comparators from the THOR clinical trial, the clinical experts agreed that a platinum-doublet chemotherapy regimen serves as an appropriate comparator for erdafitinib in fit patients with FGFR alterations who experience disease progression on first-line enfortumab vedotin with pembrolizumab (if recommended and funded). Furthermore, the drug programs also noted that single-drug chemotherapy with docetaxel or paclitaxel would likely be the next line of therapy in patients who experience disease progression on first-line enfortumab vedotin with pembrolizumab, validating the choice of comparators. This aligns with the standard treatment protocols currently in use for la/mUC, again validating the choice of comparators in the trial.
When asked about the initiation of erdafitinib therapy, particularly in patients with different histologic subtypes of UC, the experts noted that erdafitinib should be considered specifically for patients who have been treated previously with platinum-based chemotherapy and an ICI and have shown disease progression. This underscores the importance of considering FGFR alterations as a critical factor when determining the suitability of erdafitinib for a patient. The experts recommended starting erdafitinib after other standard treatments, and emphasized its role as a subsequent line of therapy, particularly in patients with FGFR alterations.
Clinical Evidence
Systematic Review
Description of Studies
One pivotal study was included in this submission. The THOR study was a global, phase III, randomized controlled trial (RCT) designed to evaluate the efficacy and safety of erdafitinib compared to standard chemotherapy in patients with la/mUC who had specific FGFR3 and/or FGFR2 genetic alterations and had progressed after treatment with anti-PD-1 or anti-PD-L1 checkpoint inhibitors. The trial enrolled 266 patients, who were randomly assigned in a 1:1 ratio to receive either erdafitinib (n = 136) or the investigator’s choice of chemotherapy (docetaxel or vinflunine; n = 130). The primary outcomes of interest were OS and progression-free survival (PFS), with secondary outcomes including objective response rate (ORR) and safety profiles. The pivotal trial had 2 cohorts; the population of interest for this submission is cohort 1 (i.e., those previously treated with an anti-PD-L1 drug).
The baseline characteristics of the study population were well balanced between the 2 treatment arms. The median age of patients was approximately 67 years, and a majority were male. Most patients had an Eastern Cooperative Oncology Group Performance Status Performance Status (ECOG PS) of 0 or 1, and all had previously received at least 1 line of therapy, including anti-PD-1 or anti-PD-L1 drugs. The genetic profile of the patients, defined by FGFR3 and/or FGFR2 alterations, was consistent across both groups, ensuring comparability when evaluating the treatment effects of erdafitinib and chemotherapy.
Of note, the Independent Data Monitoring Committee (IDMC) recommended that cohort 1 be stopped early because of the superiority of erdafitinib treatment over chemotherapy.
Efficacy Results
Overall Survival
The primary end point of the THOR trial was OS, which was deemed critical for decision-making by clinical experts consulted by CDA-AMC. The median OS was 12.06 months (95% confidence interval [CI], 10.28 to 16.36 months) in the erdafitinib group and 7.79 months (95% CI, 6.54 to 11.07 months) in the chemotherapy group. The estimated 6-month survival rates were 85% for erdafitinib and 66% for chemotherapy, a difference of █████ ████ ███ ████ █████, whereas the 24-month rates were 26% and 20%, respectively, with a difference of ████ ████ ███ █████ █████. The OS analysis demonstrated that erdafitinib significantly reduced the time to death compared to chemotherapy (hazard ratio [HR] = 0.64; P = 0.005). Subgroup analyses were not designed to establish treatment effects within specific subgroups.
Progression-Free Survival
PFS was a secondary end point in the THOR study. Median PFS was 5.55 months (95% CI, 4.40 to 5.65 months) for erdafitinib and 2.73 months (95% CI, 1.81 to 3.68 months) for chemotherapy. The estimated 6-month PFS rates were higher in the erdafitinib group (37%) than in the chemotherapy group (27%), a difference (absolute effect) of ████ ████ ███ ███ █████, with both groups showing low PFS rates by 24 months. These absolute effects in PFS at 6 months and 24 months presented imprecise CIs (i.e., no evidence of a meaningful difference between erdafitinib and chemotherapy). However, the overall relative effects, measured with a Cox proportional hazards (PH) regression model analysis, showed an improvement in PFS for erdafitinib against chemotherapy, with a HR of 0.58 (95% CI, 0.44 to 0.78; P = 0.0002).
Objective Response Rate
The ORR, defined as the proportion of patients achieving a complete response (CR) or a partial response (PR), was significantly higher in the erdafitinib group, with 45.6% of patients responding, than in the chemotherapy group, with 11.5% of patients responding. An absolute difference of ███ ████ ███ █████ █████. The risk ratio (RR) of achieving an objective response was almost 4 times higher with erdafitinib as with chemotherapy (RR = 3.94; 95% CI, 2.37 to 6.57).
Duration of Response
The median duration of response (DoR) was 4.86 months (95% CI, 3.84 to 7.46 months) for erdafitinib and 5.55 months (95% CI, 2.14 to 6.01 months) for chemotherapy. The results suggest that although erdafitinib is more effective in inducing responses, the duration of these responses may be comparable to that of chemotherapy. For instance, the 6-month probability of remaining in response was 42.0% in the erdafitinib group (95% CI, 0.29% to 0.55%) and 32.0% in the chemotherapy group (95% CI, 10.0% to 57.0%), a difference of █████ ████ ███ ██████ █████. The overall HR was 0.85 (95% CI, 0.43 to 1.66) for erdafitinib compared to chemotherapy. However, the DoR analysis was based on a small number of patients, especially in the chemotherapy group, which can lead to imprecision in the estimates.
Patient-Reported Outcomes (Health-Related Quality of Life)
Patient-reported outcomes (PROs) were assessed to evaluate the impact of treatments on health-related quality of life (HRQoL). Baseline HRQoL scores were similar between in the 2 treatment groups, and compliance with HRQoL assessments remained high through the early treatment cycles but declined in later cycles because of disease progression and death. Across all PRO measures — including the Functional Assessment of Cancer Therapy–Bladder (FACT-Bl), the EQ-5D-5L, and the Patient Global Impression of Severity (PGI-S) — there were no significant differences in HRQoL between erdafitinib and chemotherapy. Both treatment groups maintained general HRQoL and overall health status throughout the study, suggesting that although erdafitinib improves survival outcomes, it does not lead to a substantial difference in PROs compared to chemotherapy.
Harms Results
The THOR study revealed that both erdafitinib and chemotherapy were associated with a high incidence of adverse events (AEs), with nearly all patients experiencing at least 1 AE. For instance, at least 1 AE was reported in 133 of 135 patients (98.5%) in the erdafitinib group and 109 of 112 patients (97.3%) in the chemotherapy group. The most common AEs (i.e., reported by at least 10% of patients) included hyperphosphatemia (80.0%), diarrhea (62.2%), and stomatitis (48.1%) in the erdafitinib group, and anemia (32.1%), constipation (27.7%), and asthenia (25.0%). in the chemotherapy group
At least 1 serious adverse event (SAE) was reported in 56 patients (41.5%) in the erdafitinib treatment group and 47 patients (41.9%) in the chemotherapy group. The most frequently reported SAEs (by at least > 2% of patients) were urinary tract infection (4.4%) and hematuria (3.7%) in the erdafitinib group, and febrile neutropenia (6.3%) and febrile bone marrow aplasia (3.6%) in the chemotherapy group.
Among AEs of special interest, central serous retinopathy (CSR) was a notable AE specific to erdafitinib, occurring in 23 (17.0%) patients (compared to 0 patients in the chemotherapy group), which necessitated regular ophthalmologic monitoring because of the potential for vision impairment. Hyperphosphatemia, another event of interest, occurred in 108 of 135 patients (80.0%) in the erdafitinib group and 0 patients in the chemotherapy group. Last, nail and skin disorders were deemed worthy of attention, with nail disorders reported in 90 patients (66.7%) in the erdafitinib group and in 6 patients (5.4%) in the chemotherapy group. Similarly, skin disorders were reported in 74 patients (54.8%) and 14 patients (12.5%), respectively.
The rates of treatment discontinuation due to AEs were slightly lower in the erdafitinib group (14.1%) than in the chemotherapy group (17.9%).
Critical Appraisal
The THOR study was a well-designed RCT comparing erdafitinib to chemotherapy in patients with la/mUC harbouring FGFR alterations who have previously been treated with anti-PD-1 or anti-PD-L1 therapies. The randomization process was properly conducted, although some imbalances, such as the difference in the number of patients declining chemotherapy, were noted. Despite these minor issues, most baseline characteristics were balanced. The open-label design could potentially introduce bias, particularly in subjective measures. The exploratory subgroup analyses were not predefined, raising concerns about potential type I errors, although these analyses were not the primary focus of the study and there was no evidence of imbalance among subgroups (i.e., evidence suggesting subgroup effects).
In terms of external validity, the THOR study was conducted in 23 countries, which enhances its generalizability, although the underrepresentation of certain demographic groups, particularly Black patients, could limit its applicability in multicultural settings like Canada. According to the clinical experts consulted for this review, the median participant age aligns with the typical age range for patients with UC in Canada, supporting the relevance of the findings. The focus on patients with FGFR alterations highlights the importance the availability of molecular testing for the generalizability of the results. The chemotherapy options used in the study are consistent with those available in Canada, further supporting the study’s external validity. Overall, the clinical experts believe that the study's findings are applicable to most patients with la/mUC in Canada who meet the specified criteria.
GRADE Summary of Findings and Certainty of the Evidence
For pivotal studies and RCTs identified in the sponsor’s systematic review, the Grading of Recommendations Assessment, Development and Evaluation (GRADE) approach was used to assess the certainty of the evidence for outcomes considered most relevant to CDA-AMC expert committee deliberations, and a final certainty rating was determined as outlined by the GRADE Working Group.
Table 2: Summary of Findings for Erdafitinib Versus Chemotherapy for Patients With la/mUC Harbouring an FGFR Alteration
Outcome and follow-up | Patients (studies), N | Relative effect (95% CI) | Absolute effects | Certainty | What happens | ||
|---|---|---|---|---|---|---|---|
Chemotherapy | Erdafitinib | Difference (95% CI) | |||||
Survival | |||||||
Overall survival at 6 months | 266 | — | ███ patients per 1,000 | ███ patients per 1,000 | ███ ██ | Moderatea | Erdafitinib likely results in a clinically important increase in overall survival at 6 months, compared with chemotherapy. |
Overall survival at 24 months | 266 | — | ███ patients per 1,000 | ███ patients per 1,000 | ██ ███ | Lowb | Erdafitinib may result in a clinically important increase in overall survival at 24 months, compared with chemotherapy. |
Progression-free survival at 6 months | 266 | — | ███ per 1,000 | ███ per 1,000 | ██ ████ | Lowb | Erdafitinib may result in a clinically important increase in progression-free survival at 6 months, compared with chemotherapy. |
Progression-free survival at 24 months | 266 | — | ██ per 1,000 | ██ per 1,000 | ██ ████ | Lowb | Erdafitinib may result in little-to-no difference in progression-free survival at 24 months, compared with chemotherapy. |
Clinical response | |||||||
Objective response rate, CR + PR | 266 | RR = 3.94 | 115 per 1,000 | 456 per 1,000 | ██ ████ | Moderatea | Erdafitinib likely results in a clinically important increase in objective response rate, compared with chemotherapy. |
Duration of response at 6 months | 77 | — | ███ patients per 1,000 | ███ patients per 1,000 | ██ ████ | Lowb | Erdafitinib may result in a clinically important increase in duration of response at 6 months, compared with chemotherapy. |
HRQoL | |||||||
HRQoL, FACT-Bl, PGI-S, and EQ-5D-5L | 112 (1 RCT) | Assessment of the FACT-Bl, PGI-S, and EQ-5D-5L health utility index and VAS for all domains and total scores showed that effects on HRQoL measures were similar in the erdafitinib and chemotherapy groups, with no evidence of a difference between them at the end of treatment. | Lowc | Erdafitinib may result in little-to-no difference in HRQoL, compared with chemotherapy. | |||
Harms | |||||||
AEs | 247 (1 RCT) | At least 1 AE was reported in 133 of 135 patients (98.5%) in the erdafitinib group and 109 of 112 patients (97.3%) in the chemotherapy group. AEs reported by at least 10% of patients in the erdafitinib group were hyperphosphatemia (80.0%), diarrhea (62.2%), and stomatitis (48.1%), and in the chemotherapy group were anemia (32.1%), constipation (27.7%), and asthenia (25.0%). | Moderated | Erdafitinib likely results in little-to-no difference in the total number of AEs, compared with chemotherapy. The types of AEs differ between the groups. | |||
SAEs | 247 (1 RCT) | At least 1 SAE was reported in 56 of 135 patients (41.5%) in the erdafitinib treatment group and 47 of 112 patients (41.9%) in the chemotherapy group. The most frequently reported SAE (by > 2% of patients) in the erdafitinib group were urinary tract infection (4.4%) and hematuria (3.7%), and in the chemotherapy group were febrile neutropenia (6.3%) and febrile bone marrow aplasia (3.6%). | Moderated | Erdafitinib likely results in little-to-no difference in the total number of SAEs, compared with chemotherapy. The types of SAEs differ between the groups. | |||
AEs of special interest | 247 (1 RCT) | Central serous retinopathy was reported in 23 of 135 patients (17.0%) in the erdafitinib treatment group and in 0 patients in the chemotherapy group. Hyperphosphatemia was reported in 108 of 135 (80.0%) patients in the erdafitinib group and in 0 patients in the chemotherapy group. Nail disorders were reported in 90 of 135 patients (66.7%) in the erdafitinib group and in 6 of 112 patients (5.4%) in the chemotherapy group, and skin disorders were reported in 74 patients (54.8%) and 14 patients (12.5%), respectively. | Highd | Erdafitinib results in a higher incidence of these specific AEs of special interest, compared with chemotherapy. The clinical significance of each effect is uncertain and varies by AE of special interest. | |||
AE = adverse event; CI = confidence interval; CR = complete response; FACT-Bl = Functional Assessment of Cancer Therapy–Bladder; HRQoL = health-related quality of life; la/mUC = locally advanced unresectable or metastatic urothelial carcinoma; PGI-S = Patient Global Impression of Severity; PR = partial response; RCT = randomized controlled trial; RR = risk ratio; SAE = serious adverse event; VAS = visual analogue scale.
aThe 95% CI excludes the null and a conservative threshold of 20 patients per 1,000 treated; the sample size or optimal information size (in the THOR study calculated for OS) was not reached (N = 280) before the study was stopped early for benefit. Therefore, the estimate was rated down 1 level for imprecision.
bThe 95% CI includes the null but also a conservative threshold of 20 patients per 1,000 treated (for benefit or harm). Furthermore, the sample size was considered small for a conservative estimate of an optimal information size of 280. Therefore, the imprecision domain was rated down 2 levels.
cNo statistical tests were performed. However, the number of patients in these analyses tend to decrease over the assessment period, decreasing the sample size. No evidence of difference was detected, with wide CIs in the estimates at the end of treatment for both arms. Therefore, 2 levels were rated down for imprecision.
dNo statistical tests were performed. The difference in effect between the 2 groups was considered very large and certain based on input from clinical experts, so it was not rated down for imprecision.
Source: Sponsor’s Summary of Clinical Evidence.
When possible, certainty was rated in the context of the presence of an important (nontrivial) treatment effect; if this was not possible, certainty was rated in the context of the presence of any treatment effect (i.e., the clinical importance is unclear). In all cases, the target of the certainty of evidence assessment was based on the point estimate and where it was located relative to the threshold for a clinically important effect (when a threshold was available) or to the null.
The GRADE assessments are presented in Table 2. The selection of outcomes for the GRADE approach was based on the sponsor’s Summary of Clinical Evidence, consultation with clinical experts, and input received from patient group, clinician groups, and public drug plans. The following list of outcomes was finalized in consultation with expert committee members: OS, PFS, ORR, DoR, HRQoL, and harms.
Long-Term Extension Studies
No long-term extension studies were available for this submission.
Indirect Comparisons
Description of Studies
The sponsor submitted an indirect treatment comparison (ITC) designed to assess the efficacy and safety of erdafitinib relative to enfortumab vedotin in patients with UC who had progressed after 1 or 2 prior treatments, including at least 1 anti-PD-L1 drug. Because of the lack of direct head-to-head evidence between erdafitinib and enfortumab vedotin, an anchored matching-adjusted indirect comparison (MAIC) was performed. This approach allowed for indirect comparisons while adjusting for differences in measured baseline characteristics between the trials. To estimate the relative efficacy and safety of these treatments, the authors used individual patient data from 1 pivotal study (THOR) that assessed erdafitinib and aggregate data from 1 available study (EV-301 trial) that evaluated enfortumab vedotin. A Bayesian approach was used, but the Bucher method was used to complete the sensitivity analysis.
The MAIC produced estimates comparing erdafitinib to enfortumab vedotin in the EV-301 trial population, incorporating additional eligibility criteria that excluded patients with no prior exposure to platinum-based chemotherapy, patients with an ECOG PS of 2, and those who had received more than 1 prior chemotherapy. The population-matching process reduced the effective sample size (ESS) from 197 to 126, a 36% reduction, which was deemed adequate to support comparisons across all efficacy and safety outcomes.
Efficacy Results
In the base-case analyses, the effect estimates for OS, PFS, ORR, and CR showed wide credible intervals (CrIs), reflecting an inability to determine whether one treatment is superior to the other for any of these end points.
In terms of survival end points, the postadjustment HR for OS with erdafitinib was 0.92 (95% CrI, 0.54 to 1.57) compared to enfortumab vedotin. Although the CrIs widened after the adjustment, this was consistent with the observed reduction in ESS.
Similar effects were observed for PFS, where the postadjustment HR for erdafitinib was 0.93 (95% CrI, 0.55 to 1.56).
For the ORR, the RR was 1.49 (95% CrI, 0.56 to 3.90), and for CR, it was 2.89 (95% CrI, 0.27 to 30.33). Despite these increases, the wide CrIs reflect substantial uncertainty, particularly for CR. Sensitivity analyses, adjusted for each covariate cumulatively, confirmed the consistency of the Bayesian and Bucher estimates across all efficacy outcomes.
When matched patients in the THOR study were compared to the intent-to-treat (ITT) population and to those receiving 1 or 2 prior lines of therapy in the EV-301 study, similar results were observed for OS and PFS.
Harms Results
For harms, the RR for any AE was 1.02 (95% CrI, 0.98 to 1.06). For the remaining AEs, erdafitinib demonstrated a safety profile comparable to that of enfortumab vedotin, with an RR close to 1 in most cases.
Critical Appraisal
Overall, the results from the ITC suggest substantial uncertainty about whether erdafitinib and enfortumab vedotin differ meaningfully in terms of survival, response outcomes, or harms. This uncertainty is primarily attributed to the imprecision observed in the CrIs of the effect estimates.
Conclusions
Evidence from the pivotal THOR study shows that in patients with la/mUC harbouring FGFR3 and/or FGFR2 alterations, erdafitinib improves OS, PFS, and the overall response rate, compared with chemotherapy. These benefits come with specific, although clinically manageable, AEs, such as hyperphosphatemia and CSR. Although the study provides robust evidence of efficacy, there are gaps in the available data, particularly regarding long-term safety and the effects in specific populations, such as those with a poorer performance status or extensive prior chemotherapy exposure. From a clinical perspective, the benefits of erdafitinib align with patient needs and expectations for new treatments that prolong survival.
There is a lack of direct comparative data on the clinical effects and position of erdafitinib against other emerging relevant comparators in the treatment landscape of la/mUC in Canada. The sponsor-submitted ITC, which used a MAIC, assessed the efficacy and safety of erdafitinib relative to enfortumab vedotin using data from the THOR and EV-301 trials. The results showed adjusted HRs for OS and PFS with wide CrIs, indicating substantial imprecision, making it difficult to determine whether erdafitinib or enfortumab vedotin offers a superior outcome. Although a potential increase in ORR and CR rates is suggested with erdafitinib, the wide CrIs again reflect a high level of uncertainty. In terms of safety, risk ratios for AEs also showed wide CrIs, which contribute to the uncertainty and make it difficult to draw definitive conclusions.
Overall, erdafitinib offers a significant clinical benefit over chemotherapy by extending survival and inducing responses for a targeted group of patients with la/mUC, but more certainty is needed to assess the effects erdafitinib against other emerging relevant comparator therapies in the clinical landscape of Canada.
Introduction
The objective of this report is to review and critically appraise the evidence submitted by the sponsor on the beneficial and harmful effects of erdafitinib tablets — 3 mg, 4 mg, and 5 mg — administered orally for the treatment of adult patients with la/mUC harbouring susceptible FGFR3 genetic alterations.
Disease Background
The contents within this section have been informed by materials submitted by the sponsor and clinical expert input. The following has been summarized and validated by the CDA-AMC review team.
UC is the malignant transformation and growth of urothelial cells, which line the renal pelvis, ureters, bladder, and urethra of the urinary tract.1,2
UC accounts for 90% to 95% of all cases of bladder cancer.3-5 Bladder cancer is the fifth most common cancer in Canada and is the fourth and ninth most common cancer among men and women, respectively.6 In Canada in 2023, it was estimated that 13,400 new cases of bladder cancer would be diagnosed and that 2,600 deaths due to bladder cancer would occur; for 2024, these estimates are expected to be 12,300 and 2,600, respectively.6,7 The estimated 5-year prevalence is estimated at 134.7 per 100,000 people in Canada.8
Microscopic or gross hematuria (blood in the urine) is the most common presenting sign of bladder cancer. Frequent or urgent urination, burning or pain during urination, difficulty urinating, abdominal pain, lower back pain, and pelvic pain may also be present. Other symptoms, such as fatigue, weight loss, anorexia, and bone pain, may develop with advanced or metastatic disease.9-13 Bladder cancer typically affects people older than 50 years and more commonly occurs in males than females.6,14 Other risk factors for bladder cancer include white race, personal or family history of bladder cancer, smoking, and environmental and occupational exposures (e.g., chemical carcinogens, arsenic).4,9,15,16
Bladder cancer is usually diagnosed by a urologist in an outpatient setting. If urinalysis detects blood or abnormal cells in the urine, cystoscopy is performed to visually examine the bladder and urethra for the presence of tumours.9,17-20 A biopsy, most commonly transurethral resection of bladder tumour, is collected to confirm the diagnosis.9,17-19 The transurethral resection of bladder tumour involves removal of the tumour and some surrounding muscle to evaluate the spread of the cancer to nearby tissues.17 These diagnostic procedures are combined with various blood tests and imaging assessments.9,17
Bladder cancer can be categorized as NMIBC, MIBC, or locally advanced and/or metastatic.9,21,22 In NMIBC, cancer cells are present in the inner lining of the bladder or connective tissue of the urothelial wall, whereas MIBC is characterized by spread through the connective tissue into the muscle layers of the bladder. Locally advanced bladder cancer involves spread to nearby lymph nodes or other tissues (e.g., prostate, vagina, uterus), and metastatic disease is characterized by spread to the abdomen wall, pelvis, distant lymph nodes, or other areas of the body (e.g., lungs, liver, bones).22-25 Cancer that cannot be surgically removed is considered unresectable.23 A clinical expert in Canada consulted by CDA-AMC indicated that, at diagnosis, approximately 70% of patients have NMIBC, 25% have MIBC, and 5% have metastatic disease. Furthermore, 20% of individuals diagnosed with NMIBC go on to develop MIBC and, depending on the stage (e.g., T4, N1), approximately 50% of patients with MIBC will develop advanced and/or metastatic disease recurrence.
Canada-specific survival statistics for locally advanced and metastatic bladder cancer are not available.26 In the US, the 5-year relative survival rate for patients with metastatic disease is 8.8%.27 The clinical experts consulted by CDA-AMC indicated that, based on RCTs, the 5-year OS rate is closer to 10% to 15%.
FGFR1 through FGFR4 comprise a family of transmembrane receptor tyrosine kinases that play a role in proliferation, differentiation, cell migration, and survival.28 Abnormal activity of these FGFRs have been associated with UC, and various gene abnormalities in FGFR3 have been identified in this cancer.29,30 Erdafitinib binds to and inhibits FGFR1 through FGFR4, resulting in reduced cell viability in cancer cell lines that express activating FGFR genetic alterations; the indication for erdafitinib includes the requirement that la/mUC harbour susceptible FGFR3 genetic alterations.31,32 According to the literature, mutations in FGFR3 have been found in up to 42% of all UCs, up to 15% of MIBCs, and up to 20% of cases of metastatic disease.33 A clinical expert in Canada consulted by CDA-AMC estimated the proportion of patients with metastatic bladder cancer with an FGFR3 mutation to be 10% to 15%. This expert also estimated that approximately 40% of patients are currently receiving testing for FGFR alterations; this testing is part of routine care for la/mUC in some settings, although there is a patchwork across Canada with respect to this testing.
Standards of Therapy
The contents within this section have been informed by materials submitted by the sponsor and clinical expert input. The following has been summarized and validated by the CDA-AMC review team.
Health professionals provide tailored treatment plans for patients with la/mUC that follow overarching guidelines and recommendations.34 The goal for patients with la/mUC is to slow disease progression, promote remission, extend life, and improve patient quality of life.34,35 This is in agreement with the clinical experts consulted by CDA-AMC.
According to the 2019 consensus statement issued by the Canadian Urological Association and the Genitourinary Medical Oncologists of Canada ,36 the 2022 Cancer Care Ontario guideline on muscle-invasive and metastatic bladder cancer,37 and the 2023 Cancer Care Alberta Locally Advanced/Metastatic Bladder Cancer Clinical Practice Guideline,3 therapies for la/mUC include chemotherapy, immunotherapy, and therapies such as enfortumab vedotin and erdafitinib. Locally advanced, unresectable, or metastatic UC has a poor prognosis and is largely incurable. Cisplatin-based chemotherapy is currently the preferred standard of care for patients with newly diagnosed la/mUC. Platinum-based chemotherapy is typically first-line treatment for patients with la/mUC.3,36,37 Immunotherapy with ICIs, such as pembrolizumab or avelumab, can be offered as a first-line treatment option for patients who are ineligible for platinum-based chemotherapy,37 but is typically offered as second-line treatment for patients who experience disease progression during or after platinum-based chemotherapy, for patients who relapse in the 12 months after receiving neoadjuvant or adjuvant platinum-based chemotherapy for earlier-stage disease, or as maintenance therapy for patients who have stable disease or a response to first-line platinum-based chemotherapy.3,36,37
An outline summary of the therapies that are currently used in Canada for the treatment of la/mUC is presented in Figure 1, with the proposed place in therapy, as outlined by the sponsor. The information was obtained from Canadian guidelines and the latest CADTH Provisional Funding Algorithm Diagram for Metastatic Urothelial Carcinoma developed in January 2023.38
Figure 1: Sponsor’s Proposed Place in Therapy for Erdafitinib in la/mUC
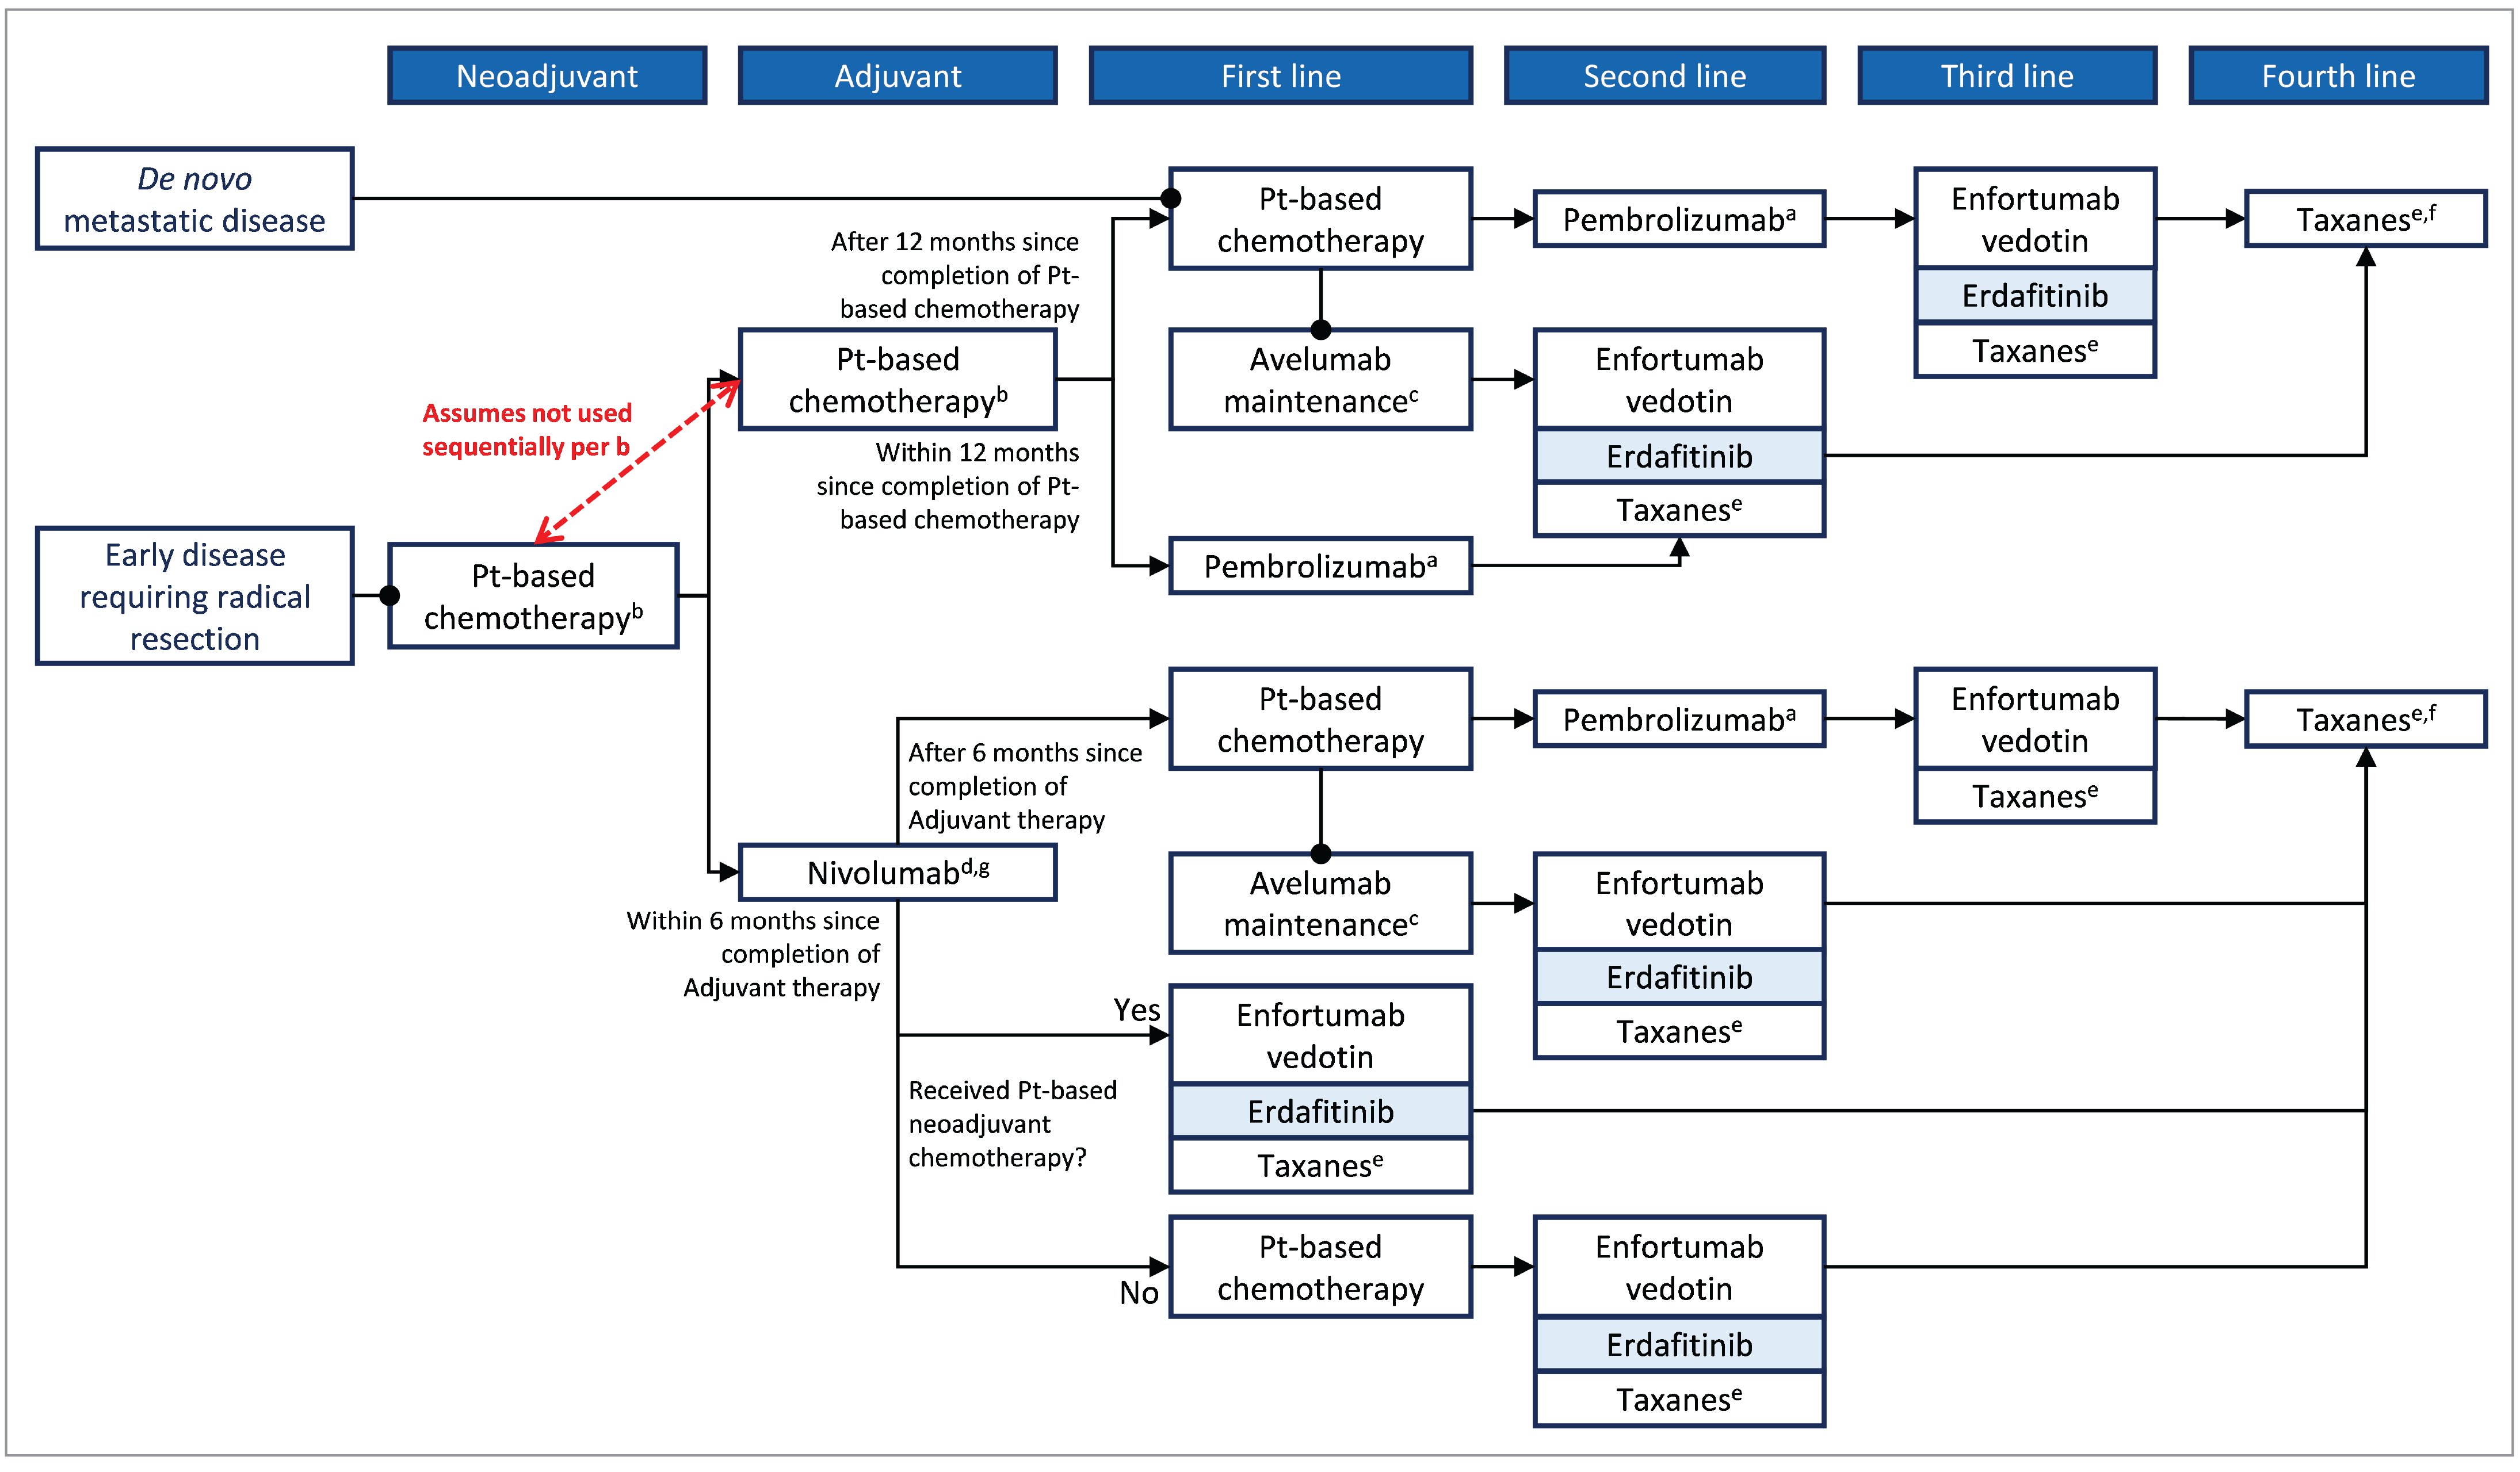
CDA-AMC = Canada’s Drug Agency; la/mUC = locally advanced unresectable or metastatic urothelial carcinoma; Pt = platinum; UC = urothelial carcinoma.
aPatients who stopped pembrolizumab treatment after 2 years (35 cycles) for reasons other than disease progression or intolerability are eligible for up to 1 additional year of pembrolizumab upon relapse.
bIn usual practice, individuals would not receive the platinum-based chemotherapy sequentially in both the neoadjuvant and adjuvant settings.
cOnly if patients received 4 to 6 cycles of chemotherapy without disease progression.
dFor patients with muscle-invasive urothelial carcinoma who are at high risk of disease recurrence after undergoing radical resection, treatment with nivolumab should be initiated no more than 120 days after completion of therapy.
eWith the introduction of enfortumab vedotin, taxanes have largely been displaced and are received after enfortumab vedotin; however, they remain an available therapeutic option after PD-L1 inhibitor therapy.
fPatients would receive a taxane after enfortumab vedotin and/or erdafitinib (if they have not previously received taxane).
gThe CADTH metastatic UC Provisional Funding Algorithm is the only Canadian algorithm to include treatment sequencing after nivolumab adjuvant therapy.
Source: Sponsor Clinical Evidence submission.
Drug Under Review
Key characteristics of erdafitinib are summarized in Table 3, along with other treatments available for la/mUC.
Erdafitinib has been approved by Health Canada for the treatment of adult patients with la/mUC harbouring susceptible FGFR3 genetic alterations, who have disease progression during or after at least 1 line of prior therapy, including in the 12 months after neoadjuvant or adjuvant therapy. Erdafitinib should not be used for the treatment of patients who are eligible for but have not received PD-1 or PD-L1 inhibitor therapy. Treatment with erdafitinib should be initiated after confirmation of a susceptible FGFR genetic alteration with a validated test.31 Erdafitinib is a pan-FGFR tyrosine kinase inhibitor that binds to and inhibits FGFR1 through FGFR4. Inhibition of FGFR results in decreased FGFR-related signalling and reduced cell viability in cancer cell lines that express activating FGFR genetic alterations.31,32
Erdafitinib is available as 3 mg, 4 mg, and 5 mg tablets for oral administration. The recommended starting dose of erdafitinib is 8 mg taken orally once daily. The product monograph recommends a dose increase to 9 mg once daily if there is no drug-related toxicity and if serum phosphate concentration is less than 9.0 mg/dL 14 to 21 days after the start of treatment. Dose-modification instructions, based on serum phosphate concentrations and for the management of adverse effects, are detailed in the product monograph. Regular monitoring for elevated serum phosphate concentrations and ocular disorders (with ophthalmological examinations and patient-administered tests) is required. The presence of a susceptible FGFR genetic alteration should be confirmed before initiating treatment with erdafitinib, and erdafitinib should be prescribed and managed by a health care professional with experience in the use of anticancer drug.31
The sponsor has requested reimbursement per the Health Canada–approved indication.39,40 Erdafitinib has not previously been reviewed by CDA-AMC.
Erdafitinib was approved by the FDA in January 2024 for the treatment of “adult patients with locally advanced or metastatic UC with susceptible FGFR3 genetic alterations, as determined by an FDA-approved companion diagnostic test, whose disease has progressed on or after at least one line of prior systemic therapy,” with the limitation that erdafitinib is “not recommended for the treatment of patients who are eligible for and have not received prior PD-1 or PD-L1 inhibitor therapy.”40,41
On June 27, 2024, the European Medicines Agency Committee for Medicinal Products for Human Use recommended granting marketing authorization for erdafitinib to be used as monotherapy for “the treatment of adult patients with unresectable or metastatic UC harbouring susceptible FGFR3 genetic alterations who have previously received at least one line of therapy containing a PD-1 or PD-L1 inhibitor in the unresectable or metastatic treatment setting.”42
Table 3: Key Characteristics of Erdafitinib, Enfortumab Vedotin, Docetaxel, and Paclitaxel
Characteristic | Erdafitinib | Enfortumab vedotin | Single-drug docetaxel | Single-drug paclitaxel |
|---|---|---|---|---|
Mechanism of action | Erdafitinib is a pan-FGFR tyrosine kinase inhibitor that binds to and inhibits FGFR1 through FGFR4. Inhibition of FGFR results in decreased FGFR-related signalling and reduced cell viability in cancer cell lines that express activating FGFR genetic alterations, including point mutations, amplifications, and fusions. | Enfortumab vedotin is an ADC that consists of a monoclonal antibody conjugated to MMAE. Enfortumab vedotin binds to Nectin-4 adhesion proteins (expressed on the surface of urothelial cancer cells), causing internalization of the ADC andnectin-4 complex and intracellular release of MMAE, which then induces cell cycle arrest and apoptotic cell death. | Docetaxel binds tubulin, which causes disruption of the cellular microtubular network and results in the inhibition of cell division. | Paclitaxel binds tubulin, which causes disruption of the cellular microtubular network and results in the inhibition of cell division. |
Indicationa | Treatment of adult patients with locally advanced, unresectable or metastatic UC harbouring susceptible FGFR3 genetic alterations, who have disease progression during or after at least 1 line of prior therapy, including in the 12 months after neoadjuvant or adjuvant therapy. Erdafitinib should not be used for the treatment of patients who are eligible for but have not received prior PD-1 or PD-L1 inhibitor therapy. Treatment with erdafitinib should be initiated after confirmation of a susceptible FGFR genetic alteration with a validated test. | Treatment of adult patients with unresectable, locally advanced or metastatic UC who have previously received a platinum-containing chemotherapy and PD-1 or PD-L1 inhibitor therapy. | Use in the treatment of UC is off-label. Health Canada–approved indicationsb: breast cancer, non–small cell lung cancer, ovarian cancer, prostate cancer, squamous cell carcinoma of the head and neck. | Use in the treatment of UC is off-label. Health Canada–approved indicationsb: breast cancer, non–small cell lung cancer, ovarian cancer. |
Route of administration | Oral | IV infusion | IV infusion | IV infusion |
Recommended dose | Starting dose: 8 mg orally once daily. A dose increase to 9 mg once daily is recommended, depending on tolerability and serum phosphate concentration. Dose modifications may be required, based on serum phosphate concentrations and for the management of adverse effects. | 1.25 mg/kg (up to a maximum of 125 mg for patients ≥ 100 kg) administered as an IV infusion over 30 minutes on day 1, day 8, and day 15 of a 28-day cycle until disease progression or unacceptable toxicity. Dose modifications may be required for adverse reactions. | Approved indications: 75 mg/m2 administered as a 1-hour infusion every 3 weeks or 100 mg/m2 administered as a 1-hour infusion every 3 weeks, depending on the indication and whether it is used in combination with other therapies. Dose modifications may be required for adverse reactions. | Approved indications: 175 mg/m2 administered as a 3-hour infusion every 3 weeks (may be used in combination with other therapies). |
Serious adverse effects or safety issues | Hyperphosphatemia (soft tissue mineralization, cutaneous calcinosis, nonuremic calciphylaxis, and vascular calcification have been seen in the setting of hyperphosphatemia); serum phosphate monitoring is required. Ocular disorders, including CSR and dry eye symptoms; ophthalmological monitoring required. Stomatitis, dry mouth, dry skin and skin toxicity, and nail disorder. | Skin reactions, predominantly mild-to-moderate maculopapular rash. Severe cutaneous reactions (Stevens-Johnson syndrome, toxic epidermal necrolysis) have been reported. Hyperglycemia and diabetic ketoacidosis, including fatal events, have been reported in patients with and without preexisting diabetes. Peripheral neuropathy. Ocular disorders, including dry eye and associated events (e.g., keratitis, blurred vision). Events of severe, life-threatening, or fatal pneumonitis and/or interstitial lung disease have occurred. Infusion-site extravasation during administration can result in skin and soft tissue injury, including delayed reactions. | Patients with hepatic impairment are at higher risk of severe adverse reactions. Potential for severe hypersensitivity reactions. Treatment-related second primary malignancies may occur. Ventricular arrhythmia, tumour lysis syndrome, fluid retention, serious gastrointestinal toxicity (including fatal enterocolitis), neutropenia, peripheral neurotoxicity, cystoid macular edema, adverse respiratory reactions, dermatologic toxicity. | Patients with hepatic impairment are at higher risk of severe adverse reactions. Potential for severe hypersensitivity reactions. Cardiovascular adverse effects (cardiac conduction abnormalities, hypotension, hypertension, bradycardia), neutropenia, peripheral neuropathy, injection-site reactions. |
Other | Erdafitinib should be prescribed and managed by health care professionals with experience in the use of anticancer drugs. Patients are required to have confirmation of a susceptible FGFR genetic alteration with a validated test before initiating treatment. | Enfortumab vedotin administration should be supervised by physicians with experience in the treatment of cancer. | Docetaxel administration should be supervised by physicians with experience in the use of anticancer drugs. Premedication with an oral corticosteroid (e.g., dexamethasone) is recommended. | Paclitaxel administration should be supervised by physicians with experience in the use of anticancer drugs. Premedication with corticosteroids, antihistamines, and H2 antagonists is recommended. |
ADC = antibody-drug conjugate; CSR = central serous retinopathy; FGFR = fibroblast growth factor receptor; MMAE = monomethyl auristatin E; UC = urothelial carcinoma.
aHealth Canada–approved indication.
bDepending on the indication, this medication may be used as monotherapy or in combination with other medications.43,44
Sources: Balversa (erdafitinib) product monograph,31 UpToDate erdafitinib drug information,32 Padcev (enfortumab vedotin) product monograph,45 docetaxel product monograph,43 paclitaxel product monograph,44 National Institutes of Health National Library of Medicine StatPearls – Paclitaxel.46
Patient, Clinician, and Drug Program Perspectives
Patient Group Input
This section was prepared by the review team based on the input provided by patient groups.
One patient group, BCC, provided input for this CDA-AMC review. BCC is a registered national charity that serves those facing a bladder cancer diagnosis. The objectives of BCC are to help bladder cancer patients and their support teams address the day-to-day issues of this disease; increase awareness among the public and medical community; and fund research into the diagnosis, treatment, and elimination of bladder cancer.
The information provided by BCC was collected with an online survey posted in May, June, and September of 2024, which asked questions about the impact of FGFR3 metastatic UC on the lives of patients, the effect of current treatments, and patient experience with erdafitinib. Despite the various methods used to reach potential respondents (e.g., BCC mailing list, social media posts, online discussion boards), patients with appropriate experience were difficult to identify. The online survey was completed by 4 people (identified by BCC as patients A, B, C, and D), all of whom were from Canada and had la/mUC with an FGFR3 mutation. The year of diagnosis and number of previously received treatments varied among patients. Patient D is now deceased. Of the 2 respondents (patients A and B) who had treatment experience with erdafitinib, 1 agreed to participate in a telephone interview to discuss their survey responses.
The most common cancer symptoms reported by the 4 respondents were fatigue (75%), as well as insomnia, neuropathy, and decreased mobility (all 50%). Respondents had treatment experience with enfortumab vedotin, gemcitabine, cisplatin, pembrolizumab, carboplatin, docetaxel, and doxorubicin (among others). When asked to rate agreement with the statement “My current therapies are able to manage my cancer symptoms” on a scale of 1 (strongly disagree) to 10 (strongly agree), the average score of 4 (n = 3) suggested that respondents’ symptoms were not adequately managed by current therapies. Fatigue (75%), as well as neuropathy and hair loss (50% each) were the most commonly reported side effects of these treatments. One respondent (patient A) reported difficulty accessing treatment because of travel time. Regarding respondent willingness to tolerate new side effects from drugs that can control disease progression or improve OS on a scale of 1 (will not tolerate side effects) to 10 (will tolerate significant side effects), the 2 patients with erdafitinib experience each responded with a score of 4, whereas the other 2 respondents had scores of 7 and 10; the average score was 6.25.
Patient respondents who were treated with erdafitinib received this treatment after at least 1 line of PD-1 or PD-L1 inhibitor therapy, including in the 12 months after neoadjuvant or adjuvant therapy. Patient A had completed the full course of treatment and patient B had been receiving erdafitinib for 6 weeks. Respondents rated, on a scale of 1 (much worse) to 5 (much better), how their lives had changed on erdafitinib compared to other therapies they had received in terms of categories of metastatic cancer symptoms, drug side effects, maintaining quality of life, controlling disease progression, and preventing recurrence. Scores of 3 from both respondents in every category (except for a score of 4 for maintaining quality of life from patient B) suggested that neither respondent experienced a major difference with erdafitinib, although 1 patient reported that it helped manage their insomnia. Reported side effects from erdafitinib were dysgeusia (patient A) and dry mouth, nausea, and leg pain (patient B). Tolerability of the side effects of erdafitinib, on a scale of 1 (completely tolerable) to 10 (completely intolerable), was rated as 9 by patient A and 3 by patient B, who also commented that the side effects were “better than expected.” Both patients reported that taking erdafitinib orally made their treatment easier, with 1 person commenting, “I like the freedom of it.” Both respondents indicated that they would recommend erdafitinib to other patients with bladder cancer.
Clinician Input
Input From Clinical Experts Consulted by CDA-AMC
All CDA-AMC review teams include at least 1 clinical specialist with expertise in the diagnosis and management of the condition for which the drug is indicated. Clinical experts are a critical part of the review team and are involved in all phases of the review process (e.g., providing guidance on the development of the review protocol, assisting in the critical appraisal of clinical evidence, interpreting the clinical relevance of the results, and providing guidance on the potential place in therapy). The following input was provided by 2 clinical specialists with expertise in the diagnosis and management of bladder cancer.
Unmet Needs
The primary goals in treating la/mUC are to prolong survival and improve or maintain quality of life. The standard treatment includes platinum-based chemotherapy followed by maintenance avelumab for patients who show a response or have stable disease. Alternatives include second-line pembrolizumab. For patients progressing after ICI therapy, enfortumab vedotin is the standard treatment. After enfortumab vedotin, options are limited, with single-drug chemotherapy (e.g., taxanes) being the most common choice. Although enfortumab vedotin is currently the standard after progression on platinum-based chemotherapy and an ICI, it does have toxicities that may not be suitable for all patients. A significant unmet need is determining the optimal sequencing of erdafitinib and enfortumab vedotin, particularly in patients with FGFR alterations. Additionally, with the anticipated approval of enfortumab vedotin combined with pembrolizumab as a first-line therapy, there will be an unmet need for treatment options after enfortumab vedotin plus pembrolizumab.
Place in Therapy
Erdafitinib would be used as monotherapy after platinum-based chemotherapy and an ICI, as supported by the pivotal THOR trial, specifically in patients with FGFR alterations. However, the ideal sequencing of enfortumab vedotin and erdafitinib remains unclear, according to the clinical experts consulted by CDA-AMC.
Patient Population
The target population includes patients whose tumours harbour FGFR alterations, as identified in the pivotal trial. This requires initial testing to detect the genetic alteration. The clinical experts agree that la/mUC is not a rare disease, and that the patient population evaluated in the body of evidence is consistent with the intended target population for this therapy.
Assessing the Response Treatment
The response to treatment should be determined by the response in clinical symptoms to monitor deterioration, as well as by imaging studies that assess the progression of the condition. The timing suggested by experts to assess response (supported by imaging studies) is every 3 months.
Discontinuing Treatment
Clinical experts recommend discontinuing treatment if there is disease progression, significant toxicity, or intolerability, and decisions should be made on a case-by-case basis. These criteria should align with those established in the pivotal trial.
Prescribing Considerations
Diagnosis, treatment prescribing, and ongoing patient monitoring should be managed by clinicians or health care teams with expertise in oncology, including in outpatient settings, as advised by clinical experts.
Clinician Group Input
This section was prepared by the CDA-AMC review team based on the input provided by clinician groups. The full original clinician group input received by CDA-AMC have been included in the Patient, Clinician, and Drug Program Input section of this report.
Seven clinicians from the Ontario Health (Cancer Care Ontario) GU DAC provided input for this review. Ontario Health (Cancer Care Ontario) Drug Advisory Committees provide timely evidence-based clinical and health system guidance on drug-related issues, including the Provincial Drug Reimbursement Programs and the Systemic Treatment Program, in support of Cancer Care Ontario’s mandate.
In communicating current treatments for la/mUC, the GU DAC noted that patients who have previously received an ICI, chemotherapy, or a combination of both are eligible for treatment with enfortumab vedotin, with the goal of improving OS (this goal of treatment was also identified by clinical experts consulted by CDA-AMC). The GU DAC expressed an unmet need for a treatment for patients with genomic alterations, noting that erdafitinib is effective for the FGFR genetic alteration and would be the first targeted therapy identified for this patient population based on molecular testing. Regarding place in therapy, the GU DAC indicated that patients who would be eligible and best suited for treatment with erdafitinib are those with FGFR mutations and/or alterations who have previously received, or have a contraindication to, ICI therapy. A clinical expert consulted by CDA-AMC noted that erdafitinib would be used as monotherapy after chemotherapy and ICI, per the THOR trial. The GU DAC stated that erdafitinib would be administered in the outpatient setting under the supervision of a medical oncologist. Patient response to treatment is assessed in clinical practice using conventional imaging (CT scan of the chest, abdomen, and/or pelvis), at the physician’s discretion. Discontinuation of treatment with erdafitinib would be considered upon unacceptable toxicity or clinically significant disease progression. These treatment aspects (setting, assessment of response, and criteria for discontinuation) are in alignment with those identified by a clinical expert consulted by CDA-AMC.
Drug Program Input
The drug programs provide input on each drug being reviewed through the CDA-AMC reimbursement review processes by identifying issues that may impact their ability to implement a recommendation. The implementation questions and corresponding responses from the clinical experts consulted by CDA-AMC are summarized in Table 4.
Table 4: Summary of Drug Plan Input and Clinical Expert Response
Drug program implementation questions | Clinical expert response |
|---|---|
Relevant comparators | |
In cohort 1 of the phase III THOR clinical trial, erdafitinib was used for patients with FGFR3 alterations after PD-L1 treatment. There are no targeted treatments currently funded for FGFR3 alterations. The current publicly funded standard of care after disease progression on PD-L1 treatment in the advanced setting includes enfortumab vedotin as a single drug or chemotherapy (usually docetaxel or paclitaxel). If a patient experiences disease relapse > 6 months after completion of adjuvant nivolumab (after complete resection in high-risk patients), platinum-based chemotherapy would usually be the next line of therapy, followed by PD-L1 treatment as either maintenance or as a second-line therapy. Note: At the time of this input, enfortumab vedotin in combination with pembrolizumab as a first-line treatment for la/mUC is under pCODR review. If recommended and funded, single-drug chemotherapy with docetaxel or paclitaxel would likely be the next line of therapy in patients who experience disease progression on first-line enfortumab vedotin with pembrolizumab. If patients are fit, platinum-doublet chemotherapy may also be an option. | The clinical experts agreed that a platinum-doublet chemotherapy would be a reasonable second-line option after treatment with enfortumab vedotin plus pembrolizumab. |
Considerations for initiation of therapy | |
Are all histologic subtypes of urothelial carcinoma eligible, provided they harbour an FGFR3 genetic alteration? | The clinical experts advised that the different histological subtypes would need at least some component of urothelial carcinoma (i.e., not purely squamous or adenocarcinoma or small cell carcinoma). |
In patients who have been previously treated with PD-L1 therapies and remain sensitive despite disease progression (e.g., disease relapse occurs > 6 to 12 months after stopping), should erdafitinib be used at any time, or only if a patient is re-treated with PD-L1 therapy and is subsequently considered resistant to PD-L1 therapy? | According to the clinical experts, erdafitinib should be an option after ICI, regardless of when the progression happened. Re-treatment with an ICI can be done at the clinician's discretion and on a case-by-case basis. |
Considerations for continuation or renewal of therapy | |
The trial allowed erdafitinib to be continued beyond disease progression at the discretion of the investigator. What are the discontinuation criteria for erdafitinib? | The clinical experts advised that symptomatic progression and issues of toxicity and/or tolerability would be considered part of the criteria. |
Generalizability | |
Should patients with an FGFR3 genetic alteration who are receiving alternate therapies after PD-L1 treatment be switched to erdafitinib, or could erdafitinib be used as the next line of therapy? | Erdafitinib can be used as the next line in this situation, according to the clinical experts. |
Funding algorithm (oncology only) | |
Drug may change the place in therapy of comparator drugs. | This is a comment for pERC deliberations. |
Care provision issues | |
The recommended starting dose of erdafitinib is 8 mg orally once daily, with a dose increase to 9 mg once daily based on serum phosphate levels and tolerability, assessed 14 to 21 days after initiating treatment. Erdafitinib is available as a 3 mg, 4 mg, and 5 mg tablet; some drug wastage may be expected due to dose adjustments, depending on what strength and quantity was previously dispensed. | This is a comment for pERC deliberations. |
Frequent monitoring is required for toxicities, including palmar-plantar erythrodysesthesia, stomatitis, onycholysis, hyperphosphatemia, diarrhea, central serous retinopathy, and other eye disorders. | This is a comment for pERC deliberations. |
FGFR alteration testing may not be available or routinely tested for la/mUC in some jurisdictions. What is the optimal timing for FGFR biomarker testing? What percentage of la/mUC patients are expected to harbour an FGFR3 genetic alteration? | Approximately 20% of patients with la/mUC harbour the FGFR3 alteration. Ideally, testing should happen early using the initial transurethral resection of bladder tumour or cystectomy specimen. |
System and economic issues | |
A confidential pCPA price exists for enfortumab vedotin. Generic versions of docetaxel and paclitaxel exist. | This is a comment for pERC deliberations. |
FGFR = fibroblast growth factor receptor; ICI = immune checkpoint inhibitor; la/mUC = locally advanced unresectable or metastatic urothelial carcinoma; pCODR = pan-Canadian Oncology Drug Review; pCPA = pan-Canadian Pharmaceutical Association; pERC = pan-Canadian Oncology Drug Review Expert Review Committee.
Clinical Evidence
The objective of this CDA-AMC Clinical Review Report is to review and critically appraise the clinical evidence submitted by the sponsor on the beneficial and harmful effects of erdafitinib, 3 mg, 4 mg, or 5 mg, administered orally, in the treatment of patients (≥ 18 years) with la/mUC, FGFR3 alterations, and disease progression during or after at least 1 line of PD-1 or PD-L1 inhibitor therapy, including in the 12 months after neoadjuvant or adjuvant therapy. The focus will be placed on comparing erdafitinib to relevant comparators and identifying gaps in the current evidence.
A summary of the clinical evidence submitted by the sponsor in this review of erdafitinib is presented in 2 sections, with the CDA-AMC critical appraisal of the evidence included at the end of each section. The first section, the Systematic Review, includes pivotal studies and RCTs that were selected in accordance with the sponsor’s systematic review protocol. The CDA-AMC assessment of the certainty of the evidence in this first section, using the GRADE approach, follows the critical appraisal of the evidence. The second section includes indirect evidence from the sponsor.
Included Studies
The following bodies of evidence are included and appraised in this CDA-AMC review document:
1 pivotal study (RCT) identified in the systematic review
1 ITC (a MAIC).
Systematic Review
The contents of this section have been informed by materials submitted by the sponsor. The following information has been summarized and validated by the CDA-AMC review team.
Description of Studies
One pivotal trial (THOR) was included in the systematic review. The study was a global, phase III clinical trial designed to evaluate the efficacy of erdafitinib compared to standard chemotherapy in patients with metastatic UC who had specific FGFR3 and/or FGFR2 genetic alterations and had progressed after treatment with anti-PD-1 or anti-PD-L1 checkpoint inhibitors. The study involved 266 patients who were randomly assigned to receive either erdafitinib or the investigator’s choice of chemotherapy (docetaxel or vinflunine). The population of interest for this submission is cohort 1 of the THOR study (as opposed to cohort 2, which compared a different population against a group treated with pembrolizumab). Characteristics of cohort 1 are summarized in Table 5. A schematic overview of the study design is presented in Figure 2.
Table 5: Details of the THOR Trial
Characteristics | THOR trial, cohort 1 |
|---|---|
Study design | Randomized, open-label, multicentre, global, phase III study |
Locations | This study was conducted at 121 investigative centres in 23 countries, including Canada. |
Patient enrolment dates | Start date: April 26, 2018 (cohort 1 initiation date was August 6, 2018) End date: Ongoing (cohort 1 clinical cut-off date was January 15, 2023; database lock date was March 2, 2023) |
Randomized (N) | Total N: 266 Erdafitinib: 136 Chemotherapy: 130 Patients were randomized in a 1:1 ratio to erdafitinib or chemotherapy (vinflunine or docetaxel). Choice of chemotherapy was determined by the investigator at the site level before enrolment. Stratified randomization was implemented with the following factors: region (North America vs. Europe vs. rest of the world), ECOG PS (0 or 1 vs. 2), and disease distribution (presence vs. absence of visceral metastases: lung, liver, or bone). |
Inclusion criteria |
|
Exclusion criteria |
|
Drugs | |
Intervention | Erdafitinib was administered orally, in tablet form, once daily for 21 days in a 21-day cycle. All patients randomized to erdafitinib received erdafitinib 8 mg once daily from day 1 to day 14 of cycle 1. Patients with cycle 1, day 14 serum phosphate levels of less than 7.00 mg/dL had the option to increase the dose to 9 mg. Patients with cycle 1, day 14 serum phosphate levels between 7.00 mg/dL and 8.99 mg/dL (≤ 2.90 mmol/L) could increase the dose to 9 mg while receiving concomitant treatment with a phosphate binder. Patients with serum phosphate levels higher than 9.00 mg/dL had erdafitinib treatment withheld and were assessed at least weekly until serum phosphate until levels returned to less than 7.00 mg/dL while treatment with a phosphate binder was initiated. Erdafitinib was administered until progression, intolerable toxicity, withdrawal of consent, or a decision by the investigator to discontinue treatment. |
Comparator(s) | Docetaxel was administered at a dose of 75 mg/m2 as a 1-hour IV infusion every 3 weeks until progression, intolerable toxicity, withdrawal of consent, or a decision by the investigator to discontinue treatment. Vinflunine was administered at a dose of 320 mg/m2 as a 20-minute IV infusion once every 3 weeks until progression, intolerable toxicity, withdrawal of consent, or a decision by the investigator to discontinue treatment. |
Study duration | |
Screening phase | The screening phase comprised molecular and full-study screening. For molecular screening, eligibility was determined based on FGFR test results. Full-study screening started 30 days before the first dose of the study drug. |
Treatment phase | The treatment phase extended from randomization until disease progression, intolerable toxicity, withdrawal of consent, or a decision by the investigator to discontinue treatment. |
Follow-up phase | The posttreatment phase extended from the end-of-treatment visit until the patient died, withdrew consent, was lost to follow-up, or the study ended, whichever came first. |
Outcomes | |
Primary end point | The primary end point was OS, which was measured from the date of randomization to the date of the patient’s death. If the patient was alive or the vital status was unknown, the patient was censored at the date the patient was last known to be alive. |
Secondary and exploratory end points | Secondary:
Exploratory:
|
Publication status | |
Publications | Loriot Y, Matsubara N, Park SH, Huddart RA, Burgess EF et al. (2023) Erdafitinib or Chemotherapy in Advanced or Metastatic Urothelial Carcinoma. N Engl J Med 389 (21): 1961 to 1971. |
Clinical trial record number | NCT03390504 |
AE = adverse event; CR = complete response; DoR = duration of response; ECOG PS = Eastern Cooperative Oncology Group Performance Status; FACT-Bl = Functional Assessment of Cancer Therapy–Bladder; FGFR = fibroblast growth factor receptor; HRQoL = health-related quality of life; NMIBC = non–muscle-invasive bladder cancer; ORR = objective response rate; OS = overall survival; PD = progressive disease; PFS = progression-free survival; PGI-S = Patient Global Impression of Severity; PR = partial response; RECIST = Response Evaluation Criteria in Solid Tumours Version 1.1; SAE = serious adverse event.
Sources: 2023 Clinical Study Report for the THOR study, cohort 1;47 sponsor’s Summary of Clinical Evidence.
Figure 2: Schematic Overview of the THOR Trial
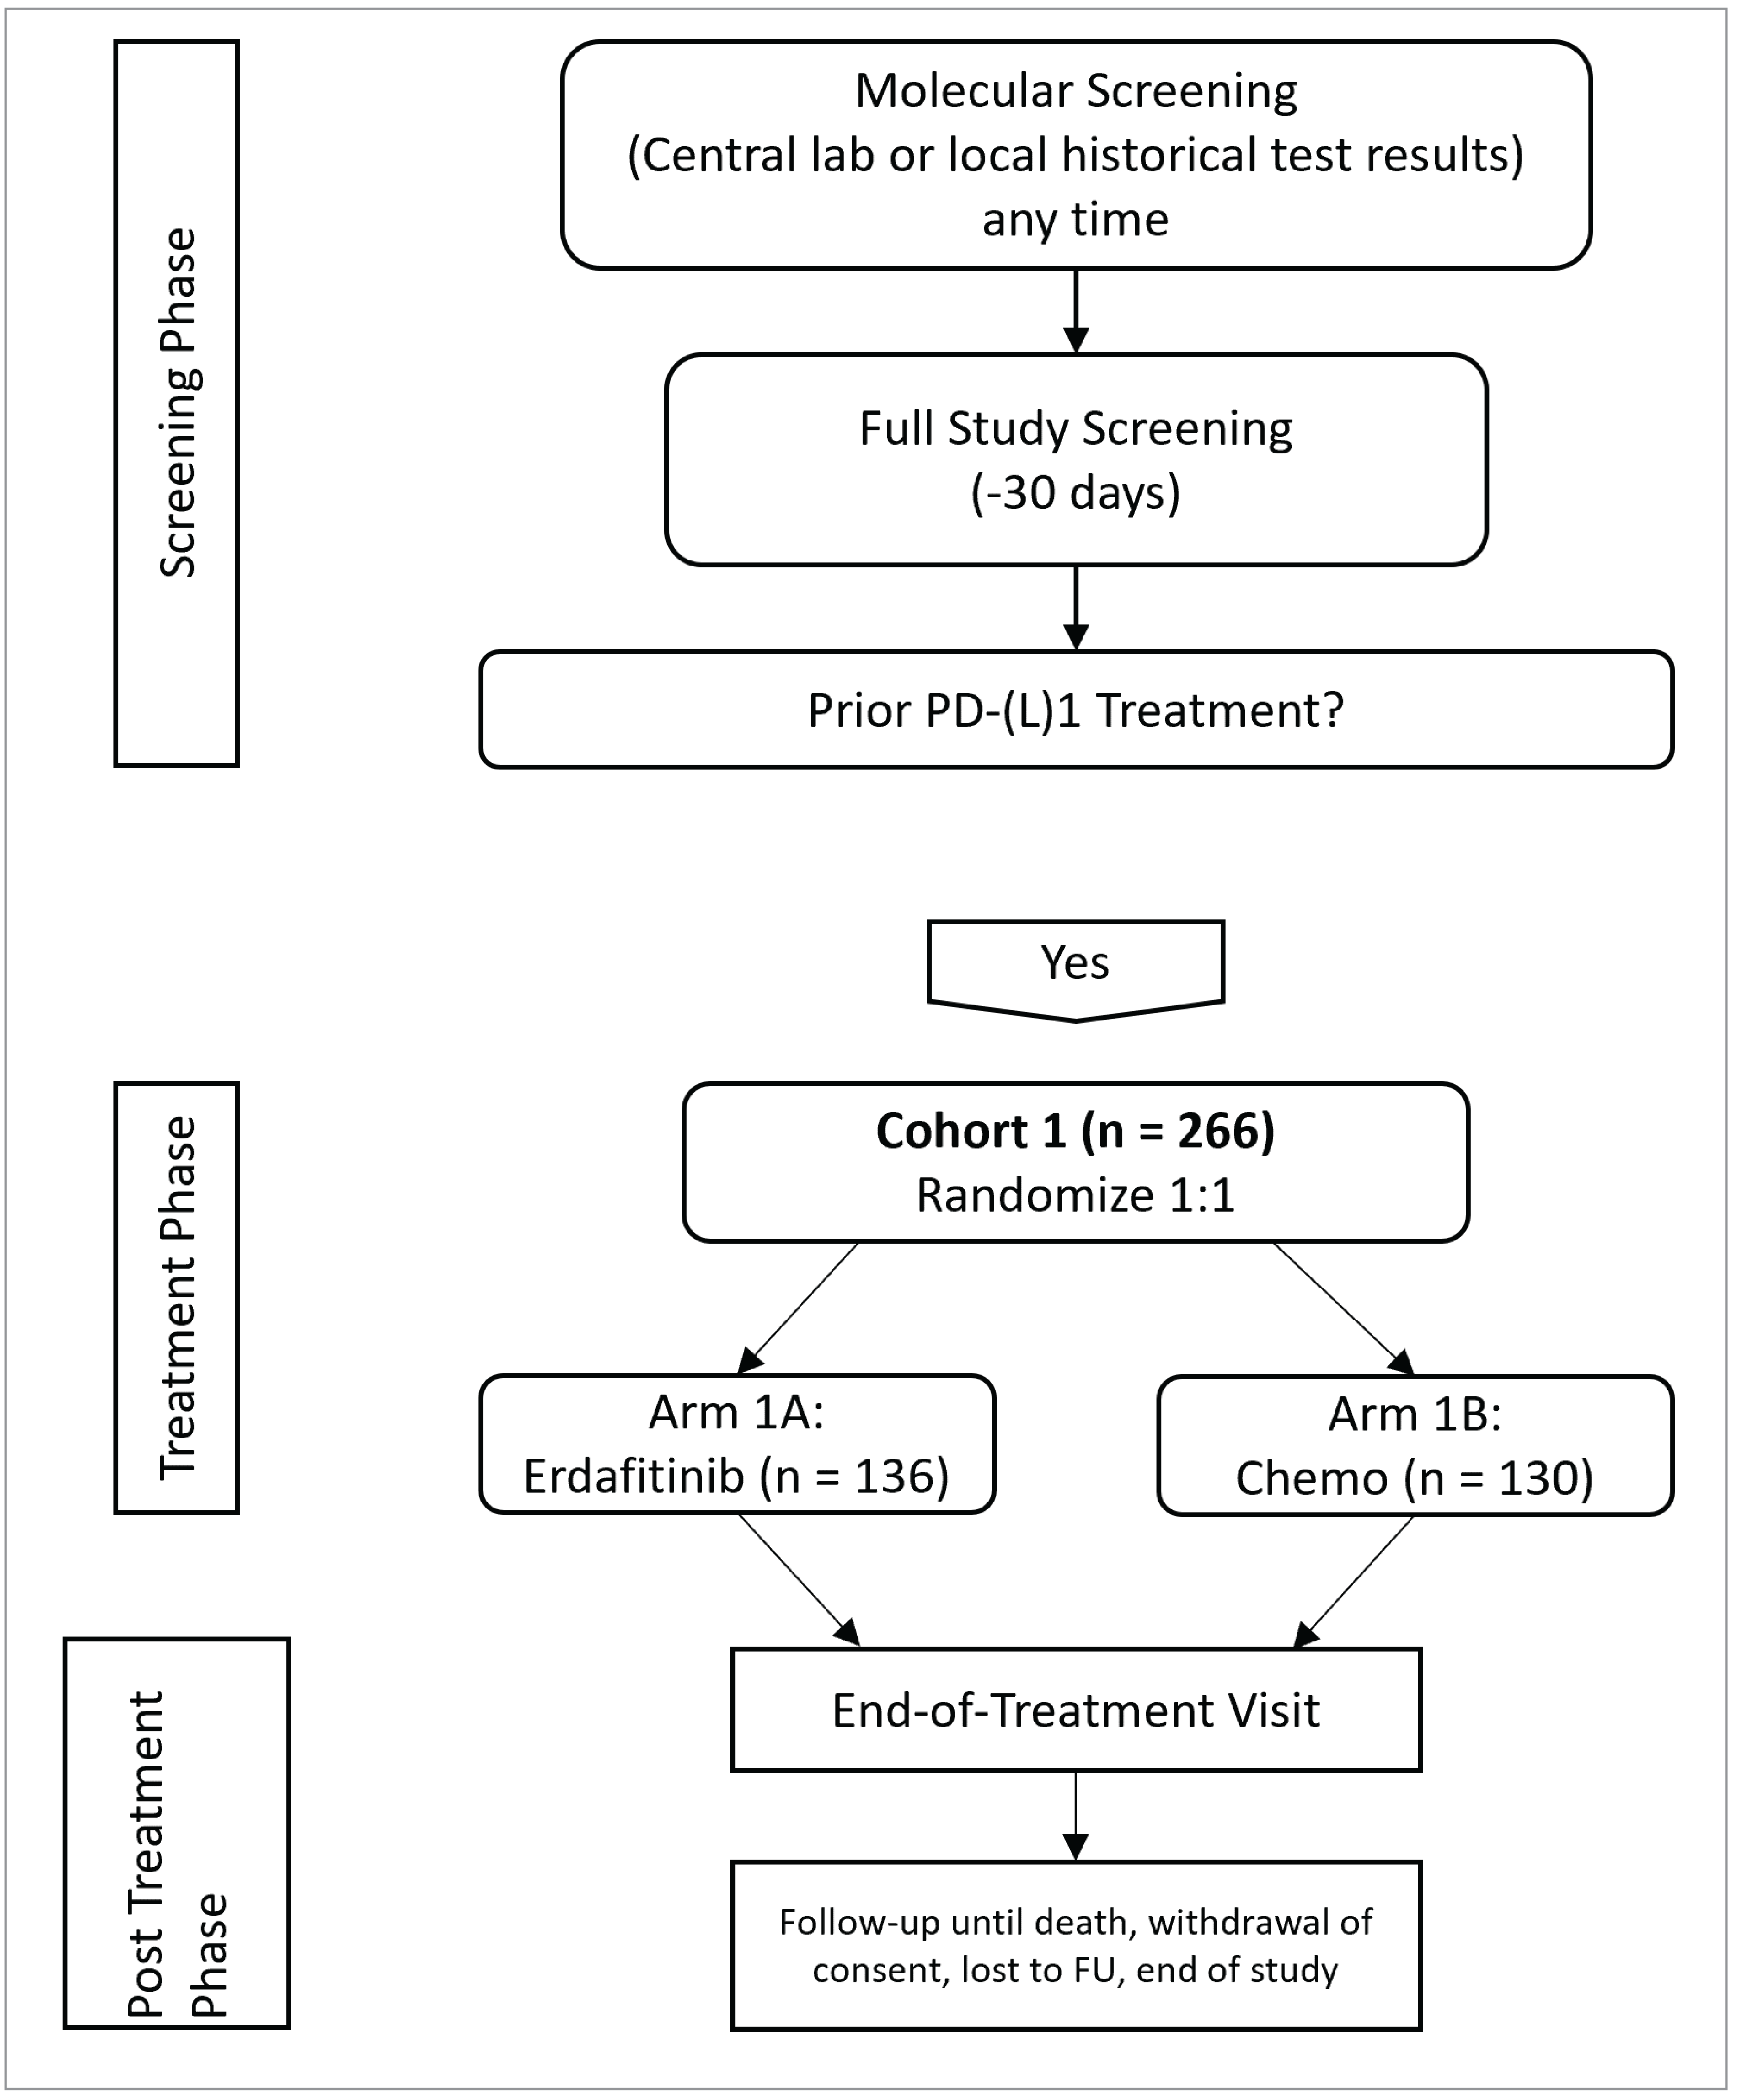
Chemo = chemotherapy; FU = follow-up; lab = laboratory.
Note: This figure was adapted from the THOR Clinical Study Report to only depict cohort 1.
Source: 2023 Clinical Study Report for the THOR study, cohort 1.47
Populations
Inclusion and Exclusion Criteria
Eligible patients from cohort 1 of the THOR trial were adults with a histologic demonstration of transitional cell carcinoma of the urothelium, specifically, metastatic or surgically unresectable urothelial cancer. Patients were required to have an ECOG PS of 0, 1, or 2, documented disease progression before randomization, and specific FGFR genomic alterations identified by a companion diagnostic test. Additionally, eligible patients must have undergone prior treatment with an anti-PD-L1 drug as monotherapy or as a combination therapy; however, patients could have received no more than 2 prior lines of systemic treatment. Prior treatment with an anti-PD-L1 drug could have been given as frontline or maintenance therapy in a neoadjuvant, adjuvant, or metastatic setting.
Patients were ineligible if they had received prior FGFR inhibitor treatment, or had known allergies, hypersensitivity, or intolerance to erdafitinib or its excipients.
Interventions
Erdafitinib was administered orally in tablet form once daily over the course of 21-day cycles until disease progression, intolerable toxicity, withdrawal of consent, or a decision by the investigator to discontinue treatment after disease progression. Treatment with erdafitinib could continue beyond the initial demonstration of disease progression if the patient was clinically stable, at the discretion of the investigator. If a clinically significant increase in tumour burden was identified by tumour imaging at least 4 weeks after the first imaging that indicated progressive disease (PD), erdafitinib was discontinued. Each dose of erdafitinib was taken at home at approximately the same time each day, with or without food. Patients were instructed to avoid consuming grapefruit or Seville oranges due to cytochrome P450 3A4 (CYP450 3A4/5) inhibition. If a dose was missed, it could be taken up to 6 hours after the scheduled time and the patient could return to the normal schedule the next day. If it was more than 6 hours after the missed dose, that dose was skipped and the patient continued treatment at the scheduled time the next day. If vomiting occurred with drug administration, no replacement dose was taken.
All patients randomized to erdafitinib received 8 mg of erdafitinib once daily from day 1 to day 14 of cycle 1, with the option for up-titration to 9 mg, depending on serum phosphate levels on day 14 of cycle 1. If a patient’s serum phosphate level was higher than 9.00 mg/dL (2.91 mmol/L), erdafitinib treatment was withheld. Patients with serum phosphate levels of 7.00 to 8.99 mg/dL (2.25 mmol/L to 2.90 mmol/L) had the option to increase the dose of erdafitinib to 9 mg once daily and concurrently initiate treatment with a phosphate binder. Patients with serum phosphate levels of less than 7.00 mg/dL (< 2.25 mmol/L) had the option to increase the dose of erdafitinib to 9 mg once daily. Dose reductions were allowed, if recommended by a physician in response to an AE. If the AE that resulted in the dose reduction was resolved, the patient was allowed to resume treatment with erdafitinib, with doses re-escalated on a schedule that was the inverse of the dose reduction schedule.
Docetaxel was administered as a 1-hour IV infusion every 3 weeks at a dose of 75 mg/m2. Patients continued treatment until disease progression, intolerable toxicity, withdrawal of consent, or a decision by the investigator to discontinue treatment. All patients were premedicated with oral corticosteroids, such as dexamethasone 16 mg per day (e.g., 8 mg twice daily) for 3 days, starting 1 day before docetaxel administration, to reduce the incidence and severity of fluid retention and the severity of hypersensitivity reactions. Docetaxel was not given to patients with bilirubin levels greater than 1 times the upper limit of normal (ULN), or to patients with aspartate transaminase or alanine transaminase levels greater than 1.5 times the ULN and concomitant alkaline phosphatase levels greater than 2.5 times the ULN. Docetaxel could not be given to patients with a neutrophil count of less than1,500 cells/mm3. Treatment with docetaxel was withheld for all grades of neutropenia, thrombocytopenia, and anemia.
Vinflunine was administered as a 20-minute IV infusion once every 3 weeks at a dose of 320 mg/m2. Treatment was administered until disease progression, intolerable toxicity, withdrawal of consent, or a decision by the investigator to discontinue treatment. In patients with an ECOG PS of 0 and prior pelvic irradiation or an ECOG PS of at least 1, vinflunine treatment was started at the dose of 280 mg/m2. The dose was increased to 320 mg/m2 if no hematological toxicity causing treatment delay or dose reduction occurred during the first cycle. Patients who began vinflunine treatment at 320 mg/m2 had a dose reduction to 280 mg/m2 if an AE occurred. For patients who initiated treatment at 280 mg/m2 and experienced an AE, the dose was reduced to 250 mg/m2 after the first occurrence and resolution of the AE. If a second AE occurred, treatment was discontinued.
Outcomes
A list of efficacy end points assessed in this Clinical Review Report is provided in Table 6, followed by descriptions of the outcome measures. Summarized end points are based on outcomes included in the sponsor’s Summary of Clinical Evidence, as well as any outcomes identified as important to this review by the clinical experts consulted by CDA-AMC and input from patient and clinician groups and public drug plans. Using the same considerations, the CDA-AMC review team selected end points that were most relevant to CDA-AMC expert committee deliberations and finalized this list of end points in consultation with members of the expert committee. All summarized efficacy end points were assessed using the GRADE approach. Select notable harms outcomes considered important for CDA-AMC expert committee deliberations were also assessed using the GRADE approach.
Table 6: Outcomes Summarized in the THOR Trial Included in the Systematic Review
Outcome measure | Time point | THOR |
|---|---|---|
OS | Measured from the date of randomization to the date of the patient’s death. If the patient was alive or the vital status was unknown, the patient was censored at the date the patient was last known to be alive. | Primary |
PFS | Measured from the date of randomization to the date of disease progression, relapse from CR, or death, whichever occurred first. For patients who were alive and did not have disease progression and for patients with unknown disease progression or unknown survival status as of the clinical cut-off date, PFS was censored at the date of the last adequate disease assessment. If there was no postbaseline tumour assessment for patients, PFS was censored on the date of randomization. | Key secondarya |
ORR (CR+ PR) | Measured from the date of randomization to the date of clinical cut-off. | Key secondary |
DoR | Only measured in responders. Measured in days from the date of initial documentation of a response to the date of first documented evidence of PD, relapse from CR, or death. Censoring was similar to that for PFS. | Secondary |
PROs | Measured as a change from baseline in HRQoL, assessed by FACT-Bl, EQ-5D-5L, and PGI-S, and time until urinary bladder cancer symptom deterioration (subset of FACT-Bl items). | Key and nonkey secondary |
Occurrence and severity of AEs and SAEs | All AEs were reported from the time the informed consent form was signed to 30 days after the last dose of the study treatment, until the patient withdrew consent for study participation or the end of the study, whichever occurred first. Patients who discontinued the study drug because of drug-related toxicity were continually monitored for this toxicity until it resolved to baseline levels, was stabilized, or was deemed to be irreversible, or until the patient died or subsequent therapy was started, whichever occurred first. | Secondary |
AE = adverse event; CR = complete response; DoR = duration of response; FACT-Bl = Functional Assessment of Cancer Therapy–Bladder; HRQoL = health-related quality of life; ORR = objective response rate; OS = overall survival; PD = progressive disease; PFS = progression-free survival; PGI-S = Patient Global Impression of Severity; PR = partial response; PRO = patient-reported outcome; SAE = serious adverse event.
aStatistical testing for these end points was adjusted for multiple comparisons (e.g., hierarchal testing approach, with the following testing order: PFS, ORR, and time to urinary bladder cancer symptom deterioration). Of the PRO end points, only time to urinary bladder cancer symptom deterioration was a key secondary end point and subjected to hierarchical statistical testing. All other PRO end points were nonkey secondary end points.
Sources: 2023 Clinical Study Report for cohort 1 of the THOR trial, sponsor’s Summary of Clinical Evidence.
The outcomes obtained by CDA-AMC were the same as depicted in Table 6. The clinical experts consulted by CDA-AMC agreed on the importance of these outcomes and their evaluation in the body of evidence submitted by the sponsor.
Overall Survival
OS was defined as the time from randomization to the date of death from any cause. OS (in months) was calculated as:
(date of death − date of randomization + 1) / 30.4375
If the patient was alive or the vital status was unknown (for example, if the patient was lost to follow-up or withdrew consent), the patient was censored at the date the patient was last known to be alive. Patients lacking data beyond randomization had their OS censored at the date of randomization. The ITT analysis set was used for OS analyses.
Clinically meaningful survival benefits are being assessed in the cancer landscape in Canada, with 1 study citing an improvement of 2 months or more in median OS, a HR for survival of 0.75 or lower, or both, as the threshold for a clinically meaningful benefit in metastatic colorectal cancer.48,49 However, no minimal important difference (MID) was identified for OS in la/mUC. The clinical experts consulted by CDA-AMC agreed that patients with la/mUC have, overall, a poor prognosis and will likely consider an improvement in median survival of 2 or 3 months to be meaningful.
Progression-Free Survival
PFS was defined as the duration (in days) from the date of randomization to the date of disease progression (assessed with Response Evaluation Criteria in Solid Tumours Version 1.1 [RECIST 1.1] by the investigator) or relapse from CR or death, whichever is reported first.
RECIST defines PD as at least a 20% increase in the sum of diameters of up to 5 target lesions (maximum 2 lesions per organ), taking as reference the smallest sum on the study and an absolute lesion increase of at least 5 mm or the appearance of new lesions. A CR is the disappearance of all target lesions, and a PR is defined as at least a 30% decrease in the sum of the target lesions. Stable disease is defined as not fitting the criteria for PD or for a PR.50
PFS was censored at the date of the last adequate disease assessment for patients who did not have disease progression and were alive, and for patients with unknown disease progression or unknown survival status at the clinical cut-off date. If there is no postbaseline tumour assessment for a patient, PFS was censored on the date of randomization. No threshold or MID for PFS was identified for la/mUC.
Objective Response Rate
ORR was defined as the proportion of patients who achieved a CR or PR, assessed with RECIST 1.1 by the investigator, in the ITT analysis set.
Patients were considered nonresponders if they did not have a CR or PR while on the study, did not have a baseline or postbaseline tumour assessment, or did not have adequate baseline tumour evaluation, or if they died, had PD, dropped out for any reason, or received subsequent therapy before achieving a CR or PR. No threshold or MID for ORR was identified for la/mUC.
Duration of Response
DoR was only measured in responders, and was defined as the duration, in days, from the date of initial documentation of an overall response (CR or PR) to the date of first documented evidence of PD, or relapse for patients who achieved a CR during the study, or death. The censoring employed was similar to that used for PFS. No MID was identified for DoR in la/mUC.
HRQoL or PROs
Functional status, symptoms, and HRQoL were assessed using 3 PRO measures: FACT-Bl, PGI-S, and EQ-5D-5L. The performance values of these tools are presented in Table 7. Time to urinary bladder cancer symptom deterioration was a novel end point generated from the urinary bladder cancer symptoms score from 3 items on the FACT-Bl.
Functional Assessment of Cancer Therapy–Bladder
The FACT-Bl consists of 36 core items, with 5-point Likert response subscales that cover 5 primary domains: physical well-being, social/family well-being, emotional well-being, functional well-being, and bladder cancer subscale. The 5-point Likert scales ranged from 0, meaning not at all to 4, meaning very much. Each subscale consists of multiple questions, and the subscale score is calculated by summing the question scores, multiplying this sum by the number of items in the subscale, then dividing by the number of items answered. Total subscale scores can range from 0 to 28 on the physical well-being, social/family well-being, and functional well-being subscales, 0 to 24 on the emotional well-being scale, and 0 to 48 on the bladder cancer subscale. The trial outcome index, Functional Assessment of Cancer Therapy–General (FACT-G), and total FACT-Bl scores are derived from the subscale scores. The trial outcome index is calculated as the sum of the physical well-being, functional well-being, and bladder cancer symptom scores. Trial outcome index scores can range from 0 to 104. The FACT-G total score is calculated as the sum of the physical well-being, social/family well-being, emotional well-being, and functional well-being scores. FACT-G total scores can range from 0 to 108. The FACT-Bl total score is calculated as the sum of the physical well-being, social/family well-being, emotional well-being, functional well-being, and bladder cancer symptom scores. FACT-Bl total scores can range from 0 to 156. According to the FACT-Bl version 4 scoring guidelines, a higher score indicates a better quality of life. The MID of the FACT-Bl was determined to be 11.26.
Time to urinary bladder cancer symptom deterioration was a novel end point generated from the urinary bladder cancer symptoms score from 3 items on the FACT-Bl (I have trouble controlling my urine, I urinate more frequently than usual, and it burns when I urinate).
Time to deterioration was defined as the first time to worsening from baseline in the urinary bladder cancer symptoms score beyond a meaningful change threshold (−1 point) from the day of randomization. The meaningful change threshold was established using anchor-based analysis, with the PGI-S as the anchor. Patients who experienced disease progression or death were censored from the analyses. The validity, reliability, and responsiveness measures of this tool have not been assessed.
Patient Global Impression of Severity
The PGI-S is a single verbal question regarding disease severity: “Considering all aspects of your bladder cancer symptoms right now, would you say your bladder cancer symptoms are none (0), mild (1), moderate (2), severe (3), or very severe (4)?” The PGI-S was an anchor question that was used to establish the magnitude of MID thresholds for each PRO-derived score, allowing the classification of patients as improved, stable, worse. For patients with UC, specific studies focusing on the MID for PGI-S are absent.
EQ-5D-5L
The EQ-5D-5L is a generic measure of health status. It is a 5-item questionnaire that assesses 5 domains, each scored across 5 levels (no problems, slight problems, moderate problems, severe problems, and extreme problems). The domains include mobility, self-care, usual activities, pain/discomfort, and anxiety/depression, and a visual analogue scale is used to rate a patient’s health today, with anchors ranging from 0 (worst imaginable health state) to 100 (best imaginable health state).51
The scores for the 5 separate questions are categorical and cannot be analyzed as cardinal numbers. However, the scores for the 5 dimensions were used to compute a single utility score that ranged from 0.0 to 1.0, representing the general health status of the individual. The EQ-5D-5L asks respondents to select their response based on their current health (today), and takes less than 5 minutes to complete. A unique EQ-5D health state is defined by combining 1 level from each of the 5 dimensions, and responses to the 5 items are converted to a weighted health state index (utility score) that ranges from 0 (death) to 1 (perfect health).
A simulation-based study showed that the MID of the EQ-5D-5L index score ranged from 0.037 and 0.069 for algorithms from Canada, China, England, Japan, Spain, and Uruguay, and the Canadian-specific estimate was 0.037 (standard deviation [SD] = 0.001).52 Currently, there is no specific mention of an MID for la/mUC.
Table 7: Summary of Patient-Reported Outcome Measures and Their Measurement Properties
Outcome measure | Type | Conclusions about measurement properties | MID |
|---|---|---|---|
FACT-Bl | A disease-specific tool designed to assess the quality of life in patients with bladder cancer. | The psychometric properties of FACT-Bl have ranged from acceptable to very good.53 Validity for relevant FACT-Bl subscales and total score has been demonstrated.53 Internal consistency and test-retest reliability generally exceeded standards for good reliability, with most Cronbach alpha coefficients ranging from 0.66 to 0.85 (full range, 0.63 to 0.93), most estimated ICCs exceeding 0.70, and mean ICC being 0.72 (of note, ICCs were lower than 0.70 for emotional well-being [0.58] and social well-being [0.66]).53 FACT-Bl subscale and total scores were responsive to changes in bladder cancer symptom severity, assessed by comparing changes in FACT-Bl scores between responders and nonresponders.53 | A study to evaluate the psychometric properties of FACT-Bl in patients with advanced UC also explored preliminary clinically meaningful changes in FACT-Bl scores. The mean clinically meaningful threshold (average of mean distributional methods, anchor-clinical group, and anchor-PRO group) for the FACT-Bl total score was estimated to be 11.26.53 |
PGI-S | A generic, single-item, PRO measure that asks patients to rate the severity of their condition on a scale that typically ranges from none to very severe. Higher points mean worse outcomes. It captures the patient’s overall perception of the severity of their disease or symptoms at a specific point in time. | The PGI-S has been validated in various conditions, including UC, demonstrating good construct validity. It correlates well with other clinical measures of severity and quality of life, such as the FACT-Bl and BCI, when used in patients with bladder cancer. Adequate reliability across different patient populations, typically assessed through test-retest reliability, with studies showing that it maintains consistency when a patient’s clinical status remains stable. PGI-S is responsive to changes in a patient's clinical condition, making it a useful tool for assessing the impact of treatments over time. In UC, it has been shown to detect clinically meaningful changes in the severity of symptoms perceived by the patient.54,55 | For patients with UC, specific studies focusing on the MID for PGI-S are absent. |
EQ-5D-5L and/ or EQ-5D-3L | A standardized instrument developed by the EuroQol group to measure HRQoL. It is designed to provide a simple, generic measure of health for clinical and economic appraisal. | The EQ-5D-5L has been widely validated in different populations and conditions, including cancer. It has demonstrated good construct validity. In the context of bladder cancer, it has been shown to reflect the impact of the disease and its treatment on overall health and quality of life. The EQ-5D-5L has shown high reliability, with consistent results when administered to patients with stable disease over time. Test-retest reliability studies have demonstrated that the EQ-5D-5L produces stable results in patients whose health status has not changed. It is responsive to changes in a patient’s health status.56 | Although specific MIDs for bladder cancer patients in the EQ-5D-5L are not universally established, studies in similar cancer populations suggest that an MID for the EQ-5D index score typically ranges from 0.05 to 0.10.57 |
BCI = Bladder Cancer Index; FACT-Bl =Functional Assessment of Cancer Therapy–Bladder; HRQoL = health-related quality of life; ICC = intraclass correlation coefficient; MID = minimal important difference; PGI-S = Patient Global Impression of Severity; PRO = patient-reported outcome; UC = urothelial carcinoma.
Statistical Analysis
The statistical analyses of all clinical trial end points are summarized in Table 8.
Overall Survival
The primary efficacy analysis, OS, was based on the ITT analysis set. The survival curves of OS were described using the Kaplan-Meier (KM) method together with the estimated median (in months), with a 95% CI for each treatment group. A stratified log-rank test was used to compare the treatment groups within cohort 1 at an overall alpha level of 0.05. Additionally, the HR for erdafitinib relative to chemotherapy and its associated 95% CI were calculated using a Cox PH model. A stratified analysis for OS using ECOG PS (0 or 1 versus 2), disease distribution (presence versus absence of visceral [lung, liver, or bone] metastases), and region (North America versus Europe versus rest of the world) was prespecified. However, due to the limited number of events by treatment group per strata (i.e., < 10) for OS, the analyses for OS were unstratified.58
Additional sensitivity, exploratory, and subgroup analyses were performed for OS:47,58
Sensitivity analysis of OS compared the erdafitinib and chemotherapy treatment arms using a log-rank test without adjustments for stratification factors.
Sensitivity analyses for OS were performed in the safety population (all randomized patients who received at least 1 dose of study drug).
Exploratory analyses on OS were performed using a selected set of potential prognostic variables (obtained at or before baseline) as covariates in Cox regression models. Potential prognostic factors included age, sex, race, region, baseline ECOG PS, baseline disease distribution, hemoglobin level, and FGFR alteration.
Subgroup analyses were conducted to assess efficacy consistency across patient populations with different demographics or baseline characteristics. Subgroups are outlined in Table 9.
Subgroup analysis of median OS was performed for patients who received vinflunine and docetaxel.
Subgroup analysis of median OS was performed for patients who received prior cisplatin-based or carboplatin-based chemotherapy.
The key secondary end points were tested for statistical significance using a hierarchical testing approach, with the following testing order: PFS, ORR, time to urinary bladder cancer symptom deterioration), meaning that if the primary efficacy end point of OS showed a statistically significant improvement in OS for patients in the erdafitinib group compared to the chemotherapy group, the statistical significance would be assessed in the secondary end points.
Table 8: Statistical Analysis of Efficacy End Points for Patients Treated in Cohort 1 of the THOR Trial
End point | Statistical model | Adjustment factors | Handling of missing data | Sensitivity analyses |
|---|---|---|---|---|
OS | KM method, stratified log-rank test, and Cox PH model (median in months, 95% CI; HR, 95% CI). | Stratification factors used: ECOG PS, disease distribution, and region. | If the patient was alive or the vital status was unknown, the patient was censored at the date the patient was last known to be alive. | Sensitivity analyses: Log-rank test without adjustment for stratification factors. Log-rank test using the safety analysis set. Subgroup analyses: Subgroup analyses to assess efficacy consistency across patient populations, median OS for patients who received vinflunine and docetaxel, and median OS for patients who received prior cisplatin-based or carboplatin-based chemotherapy. |
PFS | KM method, stratified log-rank test, and Cox PH model (median in months, 95% CI; HR, 95% CI). | Stratification factors used: ECOG PS, disease distribution, and region. | For patients with no disease progression who were alive and for those with unknown disease progression or unknown survival status as of the clinical cut-off date, PFS was censored at the date of the last adequate disease assessment. If there was no postbaseline tumour assessment for a patient, PFS was censored on the date of randomization. | Sensitivity analyses: Log-rank test without adjustment for stratification factors. Log-rank test using the safety analysis set. Log-rank test with patients censored at their last disease evaluation if they progressed or died after missing ≥ 2 consecutive assessments. Subgroup analyses: Subgroup analyses to assess efficacy consistency across patient populations, median PFS for patients who received vinflunine and docetaxel, and median PFS for patients who received prior cisplatin-based or carboplatin-based chemotherapy. |
ORR | Stratified Cochran-Mantel-Haenszel test (risk ratio, 95% Cl). | Stratification factors used: ECOG PS, disease distribution, and region. | NR | Sensitivity analyses: NR. Subgroup analyses: Subgroup analyses to assess efficacy consistency across patient populations, median ORR for patients who received vinflunine and docetaxel, and median ORR for patients who received prior cisplatin-based or carboplatin-based chemotherapy. |
DoR | KM method (median in months, 95% CI; HR, 95% Cl). | NR | Same censoring as for PFS. | Sensitivity analyses: NR. Subgroup analyses: NR. |
PROs | FACT-Bl and EQ-5D-5L scores: Descriptive statistics (number of observations, mean, SD, minimum, maximum) of scores at baseline and change from baseline, and MMRM. PGI-S: Frequency count and percentage of each score level (1 to 5) over time. Time to urinary bladder cancer symptom deterioration: KM method and HR (95% CI) by stratified Cox PH model. | Stratification factors used: ECOG PS, disease distribution, and region. | Patients who experienced disease progression or death were censored from the analyses. | Sensitivity analyses: Time to urinary bladder cancer symptom deterioration: log-rank test that included disease progression and death as deterioration events. Subgroup analyses: NR. |
Harms | Continuous variables were summarized by descriptive statistics by cohort (N, mean, SD, median, and range). Categorical variables were summarized by cohort, using frequency counts and percentages. | NR | NR | Sensitivity analyses: NR. Subgroup analyses: NR. |
CI = confidence interval; DoR = duration of response; ECOG PS = Eastern Cooperative Oncology Group Performance Status; FACT-Bl = Functional Assessment of Cancer Therapy–Bladder; HR = hazard ratio; KM = Kaplan-Meier; MMRM = mixed model for repeated measures; NR = not reported; ORR = objective response rate; OS = overall survival; PFS = progression-free survival; PGI-S = Patient Global Impression of Severity; PH = proportional hazards; PRO = patient-reported outcome; SD = standard deviation.
Sources: 2023 Statistical Analysis Plan for the THOR study,58 sponsor’s Summary of Clinical Evidence.
Progression-Free Survival
The ITT analysis set was used for all secondary analyses. PFS was analyzed using the same method as for OS. A stratified analysis for PFS, with the same stratification factors used to analyze OS, was prespecified. However, due to the limited number of events by treatment group per strata (i.e., < 10) for PFS, the analyses for PFS were unstratified.
The following subgroup and sensitivity analyses for PFS were performed:47,58
Sensitivity analyses for PFS were performed in the safety population (all randomized patients who received at least 1 dose of study drug).
Sensitivity analysis of PFS was performed with patients censored at their last disease evaluation if they had progressed or died after missing ≥ 2 consecutive assessments.
Subgroup analyses were conducted to assess efficacy consistency across patient populations with different demographics or baseline characteristics. Subgroups are outlined in Table 9.
Subgroup analysis of median PFS was performed for patients who received vinflunine and docetaxel.
Subgroup analysis of median PFS was performed for patients who received prior cisplatin-based or carboplatin-based chemotherapy.
Objective Response Rate
A stratified Cochran-Mantel-Haenszel test was used to assess treatment differences in ORR at a significance level of 0.05 and to estimate the RR and P values between the treatment groups. The 95% CIs for the RRs were calculated based on Wald statistics and were estimated using ECOG PS (0 or 1 versus 2) as a stratification factor. An analysis that used region (North America versus Europe versus rest of the world), ECOG PS (0 or 1 versus 2), and disease distribution (presence versus absence of visceral [lung, liver, or bone] metastases) as stratification factors was prespecified. However, data were pooled for the stratification factors, per the pooling algorithm specified in the statistical analysis plan. The pooling algorithm requires that the patients be pooled together, and drops stratification factors until there are at least 10 events in each stratum. The stratification factors were dropped in the following order: region, disease distribution, ECOG PS (0 or 1 versus 2).
Subgroup and sensitivity analyses for ORR were performed:58
Subgroup analyses were conducted to assess efficacy consistency across patient populations with different demographics or baseline characteristics. Subgroups are outlined in Table 9.
Subgroup analysis of median ORR was performed for patients who received vinflunine and docetaxel.
Subgroup analysis of median ORR was performed for patients who received prior cisplatin-based or carboplatin-based chemotherapy.
Duration of Response
DoR was described using the KM method together with estimated median (in months), with a 95% CI for each treatment group. Additionally, the HR for erdafitinib relative to chemotherapy and its associated 95% CI were calculated using a Cox PH model.58
Table 9: Definition of Subgroups in the THOR Trial
Subgroup | Definition |
|---|---|
Region | Europe North America Rest of the world |
Baseline ECOG PS | 0 to 1 2 |
Disease distribution (presence or absence of the following visceral metastases: lung, liver, or bone) | Presence Absence |
Bone metastasis | Yes No |
Liver metastasis | Yes No |
Lung metastasis | Yes No |
Primary tumour location | Lower tract:
Upper tract:
|
FGFR alteration type | Translocations Mutations |
PD-L1 status | Positive (CPS ≥ 10) Negative (CPS < 10) |
Baseline creatinine clearance | < 30 mL/min 30 to < 60 mL/min ≥ 60 mL/min |
Baseline hemoglobin level | < 10 g/dL ≥ 10 g/dL |
Sex | Female Male |
Age group | < 65 years ≥ 65 years |
Racea | American Indian or Alaska Native [wording from original source] Asian Black or African American Native Hawaiian or other Pacific Islander White Not reported |
Ethnicity | Hispanic or Latino Not Hispanic or Latino Not reported |
CPS = combined positive score; ECOG PS = European Cooperative Oncology Group Performance Status; FGFR = fibroblast growth factor receptor.
aIf the number of patients from a treatment group (i.e., American Indian or Alaska Native [wording from original source], Asian, Native Hawaiian or other Pacific Islander, and not reported) was less than 10, then those patients were combined into a new subgroup, named “other.”
Source: 2023 THOR Statistical Analysis Plan.58
Patient-Reported Outcomes
All PROs were analyzed using the ITT analysis set. To evaluate changes in scores from baseline over time, descriptive statistics (number of observations, mean, SD, minimum, maximum) of scores at baseline and change from baseline at each scheduled visit were reported for FACT-Bl and EQ-5D-5L. For EQ-5D-5L scores, separate summaries were performed at the treatment phase and follow-up phase. For PGI-S, the frequency count and percentage of each score level (1 to 5) over time were provided.
A mixed model for repeated measures analysis was conducted to estimate the change from baseline at each scheduled visit for the 2 treatment arms for FACT-Bl and EQ-5D-5L scores. Changes from baseline were fitted to a mixed-effects model that included patients as a random effect, and baseline value, treatment group, time in month, treatment-by-time interaction, and stratification factors as fixed effects. The stratification factors that were used in the analysis were region (North America versus Europe versus rest of the world), ECOG PS (0 or 1 versus 2), and disease distribution (presence versus absence of visceral [lung, liver, or bone] metastases). Swim plots of the change from baseline, with SD, over time by treatment group were produced.
The median time to deterioration was estimated using a KM method, and the HR and associated 95% CI were estimated using a stratified Cox PH model, with stratification variables identical to those listed for FACT-Bl and EQ-5D-5L scores. A sensitivity analysis for time to urinary bladder cancer symptom deterioration was also conducted, and included disease progression and death as deterioration events.
Safety
Safety data were analyzed using the safety analysis set. The baseline value for safety assessment was defined as the value collected at the time closest to, but before, the administration of the first dose of the study drug. Descriptive statistics or frequency counts and percentages by treatment group were derived for continuous and categorical safety variables, respectively.
Sample Size and Power Calculation
The planned enrolment for cohort 1 was approximately 280 patients (approximately 140 patients to each arm). The data cut-off date for the final analysis was when approximately 208 death events had occurred. Assuming a 53% improvement in median OS for the erdafitinib arm over the chemotherapy arm (an HR of 0.65, under the exponential distribution assumption), the study had at least 85% power to detect an HR of 0.65 at a statistical significance level of 5% (2-sided), with 1 interim analysis for efficacy at an approximately 65% information fraction (approximately 136 deaths) and a final analysis.
Statistical Testing
The type I error was controlled at 5% (2-sided) in cohort 1. All tests were conducted at a 2-sided alpha level of 0.05, and 95% CIs were provided. The familywise type I error was strongly controlled at 5% (2-sided) for the secondary end points. A hierarchical testing approach was used for testing the secondary end points (i.e., a secondary null hypothesis was tested in each cohort if, and only if, the primary null hypothesis and all the secondary null hypotheses that preceded it had been rejected). For the PROs, the level of testing was assumed to be 0.05.
At both the interim and final analyses, the secondary end points were assessed at the same significance levels as specified for testing the primary end point (OS), based on the O'Brien-Fleming alpha-spending function, to protect the overall type I error rate, per the THOR statistical analysis plan. The testing order of these end points was as follows: PFS, ORR, and time to urinary bladder cancer symptom deterioration. If the null hypothesis for any of these end points failed to be rejected at the interim analysis, then any of the subsequent end point(s) were not tested until the final analysis. If the null hypothesis for an end point was rejected at the interim analysis, it remained rejected and was not retested at the final analysis.
The plan was that the interim analysis for cohort 1 would occur after an approximately 65% information fraction (approximately 136 of 208 deaths) occurred. Both superiority and futility were assessed at the interim analysis. The classic O’Brien-Fleming boundaries were used for these assessments. The stopping boundaries were implemented with the Lan-DeMets spending function to control the type I error at the 0.05 significance level overall. The futility assessment was not binding.
The cohort 1 interim analysis occurred after 155 death events had been observed (at approximately 75% information fraction), and the significance level was determined using the O’Brien-Fleming alpha-spending function to control the type I error at the 0.05 significance level (2-sided). The efficacy boundary P value was predetermined to be 0.019 (2-sided). The IDMC recommended that cohort 1 be stopped due to the superiority of erdafitinib treatment over chemotherapy, and that patients be allowed to crossover to erdafitinib treatment. Because cohort 1 was stopped, the interim analysis of cohort 1 is considered the final analysis.
Analysis Populations
The 5 analysis sets employed in this study are listed in Table 10.
Table 10: Analysis Populations of the THOR Trial
Population | Definition | Application |
|---|---|---|
ITT population | The ITT analysis set included all randomized patients. Patients in this population were analyzed according to the treatment to which they were randomized. | Baseline characteristics, efficacy analyses, PRO analyses. |
Safety | The safety analysis set included all randomized patients who received at least 1 dose of the study drug. Safety data were analyzed according to the actual treatment received. | Safety analyses, and the sensitivity analyses of OS and PFS. |
ITT = intention-to-treat; OS = overall survival; PFS= progression-free survival; PRO = patient-reported outcome.
Source: 2023 THOR Statistical Analysis Plan.58
Results
Patient Disposition
Patient disposition in the cohort 1 ITT analysis set of the THOR trial is summarized in Table 11 and in Figure 3. All these variables were equally distributed between groups, except for the proportion of patients who received the study treatment in the chemotherapy group (86.2%), which was lower than in the erdafitinib group (99.3%).
Table 11: Patient Disposition in Cohort 1 of the THOR Trial (ITT Analysis Set; January 15, 2023, Clinical Cut-Off)
Patient disposition | THOR trial, cohort 1 | ||
|---|---|---|---|
Erdafitinib | Chemotherapy | Total | |
Analysis set: ITT | 136 | 130 | 266 |
Patients who received study treatment, n (%) | 135 (99.3) | 112 (86.2) | 247 (92.9) |
Patients who discontinued study treatment, n (%) | 106 (77.9) | 102 (78.5) | 208 (78.2) |
Reason for discontinuation of study treatment, n (%)a | |||
Progressive disease | 81 (76.4) | 62 (60.8) | 143 (68.8) |
Adverse event | 17 (16.0) | 19 (18.6) | 36 (17.3) |
COVID-19-related | 0 | 1 (1.0) | 1 (0.5) |
Death | 2 (1.9) | 1 (1.0) | 3 (1.4) |
Nonadherence to study drug | 4 (3.8) | 9 (8.8) | 13 (6.3) |
Other | 1 (0.9) | 5 (4.9) | 6 (2.9) |
COVID-19-related | 0 | 0 | 0 |
Physician decision | 1 (0.9) | 6 (5.9) | 7 (3.4) |
Patients who completed the study | 77 (56.6) | 78 (60.0) | 155 (58.3) |
Patients who continued in the study | 57 (41.9) | 37 (28.5) | 94 (35.3) |
Patients who discontinued the study | 2 (1.5) | 15 (11.5) | 17 (6.4) |
Reason for discontinuation of the studyb | |||
Withdrawal by patient | 1 (50.0) | 13 (86.7) | 14 (82.4) |
Lost to follow-up | 0 | 2 (13.3) | 2 (11.8) |
Other | 1 (50.0) | 0 | 1 (5.9) |
COVID-19-related | 0 | 0 | 0 |
ITT = intention-to-treat.
Notes: Patients were considered to have completed the study if they died during the study or had not been withdrawn from the study by the end of the study.
Three patients did not receive prior anti-PD-L1 therapy but were incorrectly randomized to cohort 1.
aPercentages are based on patients who discontinued the study treatment.
bPercentages are based on patients who discontinued the study.
Source: 2023 Clinical Study Report for the THOR study, cohort 1.47
Baseline Characteristics
Baseline demographics, disease characteristics, and a summary of prior anticancer therapy of patients from cohort 1 of the THOR trial are summarized in Table 12, Table 13, and Table 14, respectively.
In the THOR trial, imbalances were noted in some variables, such as the difference in number of patients receiving 2 previous lines of chemotherapy and the number declining chemotherapy; however, these were not considered to affect the properness of randomization, and the distribution of baseline characteristics was considered, overall, to be well balanced in the erdafitinib and chemotherapy treatment groups. Although the inclusion criteria allowed for patients with FGFR2 and/or FGFR3 alterations, no enrolled patients had an FGFR2 alteration, which is rare.
Figure 3: Disposition of Patients in Cohort 1 of the THOR Trial

ITT = intention-to-treat.
Source: 2023 Clinical Study Report for the THOR study, cohort 1.47
In the cohort 1 ITT analysis set, 78 patients (29.3%) had received 1 prior line of systemic therapy (33.1% of patients in the erdafitinib group and 25.4% of patients in the chemotherapy group) and 187 patients (70.3%) had received 2 prior lines of systemic therapy (66.2% patients in the erdafitinib group and 74.6% patients in the chemotherapy group). One patient (0.4%) had received 3 prior lines of systemic therapy and 3 patients did not receive a prior anti-PD-L1 drug (1 patient randomized to erdafitinib, 2 patients randomized to chemotherapy); they were incorrectly assigned to cohort 1 because of incorrect cohort assignment flow in the Interactive Web Response System at the time of randomization. All 4 patients were included in the final analyses.
Note that in the THOR trial, induction chemotherapy followed by maintenance anti-PD-L1 therapy was considered a single line of therapy. More than half of the patients in both treatment groups (55.9% erdafitinib, 58.5% chemotherapy) received anti-PD-1 or anti-PD-L1 as a single drug in the second-line setting. The most received anti-PD-L1 drugs were pembrolizumab (35.3%), avelumab (22.2%), and atezolizumab (19.5%).
Table 12: Summary of Baseline Characteristics in Cohort 1 of the THOR Trial (ITT Analysis Set; January 15, 2023, Clinical Cut-Off)
Characteristic | THOR trial, cohort 1 | ||
|---|---|---|---|
Erdafitinib | Chemotherapy | Total | |
Analysis set: ITT | 136 | 130 | 266 |
Age, years | |||
N | 136 | 130 | 266 |
Mean (SD) | 64.8 (10.40) | 67.9 (9.07) | 66.3 (9.87) |
Median | 66.0 | 69.0 | 67.0 |
Range | 32 to 85 | 35 to 86 | 32 to 86 |
< 65 years, n (%) | 59 (43.4) | 45 (34.6) | 104 (39.1) |
65 to 69 years, n (%) | 30 (22.1) | 23 (17.7) | 53 (19.9) |
70 to 74 years, n (%) | 21 (15.4) | 32 (24.6) | 53 (19.9) |
≥ 75 years, n (%) | 26 (19.1) | 30 (23.1) | 56 (21.1) |
Sex | |||
N | 136 | 130 | 266 |
Female, n (%) | 40 (29.4) | 36 (27.7) | 76 (28.6) |
Male, n (%) | 96 (70.6) | 94 (72.3) | 190 (71.4) |
Race | |||
N | 136 | 130 | 266 |
Asian, n (%) | 37 (27.2) | 40 (30.8) | 77 (28.9) |
Black or African American, n (%) | 0 | 1 (0.8) | 1 (0.4) |
White, n (%) | 81 (59.6) | 63 (48.5) | 144 (54.1) |
Multiple, n (%) | 0 | 1 (0.8) | 1 (0.4) |
Not reported, n (%) | 18 (13.2) | 25 (19.2) | 43 (16.2) |
Ethnicity | |||
N | 136 | 130 | 266 |
Hispanic or Latino, n (%) | 2 (1.5) | 4 (3.1) | 6 (2.3) |
Not Hispanic or Latino, n (%) | 114 (83.8) | 96 (73.8) | 210 (78.9) |
Not reported, n (%) | 20 (14.7) | 30 (23.1) | 50 (18.8) |
Geographic region | |||
N | 136 | 130 | 266 |
Europe, n (%) | 82 (60.3) | 80 (61.5) | 162 (60.9) |
North America, n (%) | 8 (5.9) | 5 (3.8) | 13 (4.9) |
Rest of the world, n (%) | 46 (33.8) | 45 (34.6) | 91 (34.2) |
Weight, kg | |||
N | 136 | 130 | 266 |
Mean (SD) | 73.24 (17.867) | 72.51 (15.261) | 72.88 (16.617) |
Median | 71.00 | 70.30 | 70.90 |
Range | 41.0 to 166.0 | 44.0 to 113.0 | 41.0 to 166.0 |
Height, cm | |||
N | 135 | 130 | 265 |
Mean (SD) | 168.77 (9.281) | 168.10 (9.711) | 168.45 (9.483) |
Median | 170.00 | 169.55 | 170.00 |
Range | 145.5 to 192.0 | 144.0 to 190.0 | 144.0 to 192.0 |
ITT = intention-to-treat; SD = standard deviation.
Source: 2023 Clinical Study Report for the THOR study, cohort 1.47
Table 13: Baseline Disease Characteristics of Patients in Cohort 1 of the THOR Trial (ITT Analysis Set; January 15, 2023, Clinical Cut-Off)
Characteristic | THOR trial, cohort 1 | ||
|---|---|---|---|
Erdafitinib | Chemotherapy | Total | |
Analysis set: ITT | 136 | 130 | 266 |
Time from progression and/or relapse on the last line of prior therapy to randomization, months | |||
N | 128 | 124 | 252 |
Mean (SD) | 2.72 (4.715) | 1.82 (1.993) | 2.28 (3.660) |
Median | 1.40 | 1.31 | 1.36 |
Range | 0.2 to 41.1 | 0.2 to 19.7 | 0.2 to 41.1 |
Time from diagnosis of surgically unresectable or metastatic disease to randomization, months | |||
N | 135 | 130 | 265 |
Mean (SD) | 17.53 (13.158) | 14.15 (10.415) | 15.87 (11.989) |
Median | 12.91 | 11.71 | 12.68 |
Range | 0.6 to 74.6 | 1.8 to 63.5 | 0.6 to 74.6 |
Primary tumour location | |||
N | 136 | 130 | 266 |
Lower tract, n (%) | 95 (69.9) | 82 (63.1) | 177 (66.5) |
Bladder | 90 (66.2) | 74 (56.9) | 164 (61.7) |
Urethra | 5 (3.7) | 8 (6.2) | 13 (4.9) |
Prostate | 0 | 0 | 0 |
Upper tract, n (%) | 41 (30.1) | 48 (36.9) | 89 (33.5) |
Renal pelvis | 19 (14.0) | 20 (15.4) | 39 (14.7) |
Ureter | 22 (16.2%) | 28 (21.5) | 50 (18.8) |
Type of histology | |||
N | 136 | 130 | 266 |
Transitional cell carcinoma, n (%) | 128 (94.1) | 124 (95.4) | 252 (94.7) |
Transitional cell carcinoma with minor components (< 50% overall) of variant histology, n (%) | 8 (5.9) | 6 (4.6) | 14 (5.3) |
Bladder cancer stage at initial diagnosis | |||
N | 102 | 102 | 204 |
0a, n (%) | 7 (6.9) | 8 (7.8) | 15 (7.4) |
0is, n (%) | 2 (2.0) | 2 (2.0) | 4 (2.0) |
I, n (%) | 14 (13.7) | 16 (15.7) | 30 (14.7) |
II, n (%) | 19 (18.6) | 8 (7.8) | 27 (13.2) |
III, n (%) | 32 (31.4) | 35 (34.3) | 67 (32.8) |
IV, n (%) | 28 (27.5) | 33 (32.4) | 61 (29.9) |
Baseline ECOG PS | |||
N | 136 | 130 | 266 |
0, n (%) | 63 (46.3) | 51 (39.2) | 114 (42.9) |
1, n (%) | 61 (44.9) | 66 (50.8) | 127 (47.7) |
2, n (%) | 12 (8.8) | 13 (10.0) | 25 (9.4) |
Disease distribution at study entry | |||
N | 136 | 130 | 266 |
Presence of visceral metastases, n (%) | 101 (74.3) | 97 (74.6) | 198 (74.4) |
Lung | 71 (52.2) | 67 (51.5) | 138 (51.9) |
Liver | 31 (22.8) | 38 (29.2) | 69 (25.9) |
Bone | 36 (26.5) | 39 (30.0) | 75 (28.2) |
Absence of visceral metastases (lung, liver, or bone) , n (%) | 35 (25.7) | 33 (25.4) | 68 (25.6) |
PD-L1 status | |||
N | 96 | 79 | 175 |
CPS ≥ 1, n (%) | 38 (39.6) | 38 (48.1) | 76 (43.4) |
CPS < 1, n (%) | 58 (60.4) | 41 (51.9) | 99 (56.6) |
CPS ≥ 10, n (%) | 7 (7.3) | 11 (13.9) | 18 (10.3) |
CPS < 10, n (%) | 89 (92.7) | 68 (86.1) | 157 (89.7) |
Number of prior systemic therapy lines, n (%) | |||
N | 136 | 130 | 266 |
1 | 45 (33.1) | 33 (25.4) | 78 (29.3) |
2 | 90 (66.2) | 97 (74.6) | 187 (70.3) |
3 | 1 (0.7) | 0 | 1 (0.4) |
Creatinine clearance, mL/min | |||
N | 136 | 130 | 266 |
< 30, n (%) | 2 (1.5) | 1 (0.8) | 3 (1.1) |
30 to < 60, n (%) | 57 (41.9) | 73 (56.2) | 130 (48.9) |
≥ 60, n (%) | 77 (56.6) | 56 (43.1) | 133 (50.0) |
Hemoglobin, g/dL | |||
N | 136 | 130 | 266 |
< 10, n (%) | 24 (17.6) | 20 (15.4%) | 44 (16.5%) |
≥ 10, n (%) | 112 (82.4) | 110 (84.6%) | 222 (83.5%) |
FGFR alteration status | |||
N | 136 | 130 | 266 |
Patients with any FGFR alterations, n (%) | 135 (99.3) | 129 (99.2) | 264 (99.2) |
Mutations (excluding fusions) | 108 (79.4) | 107 (82.3) | 215 (80.8) |
Fusions (excluding mutations) | 25 (18.4) | 19 (14.6) | 44 (16.5) |
Mutations and fusions | 2 (1.5) | 3 (2.3) | 5 (1.9) |
CPS = combined positive score; ECOG PS = Eastern Cooperative Oncology Group Performance Status; FGFR = fibroblast growth factor receptor; ITT = intention-to-treat; SD = standard deviation.
Source: 2023 Clinical Study Report for the THOR study, cohort 1.47
Table 14: Summary of Prior Anticancer Therapy in Cohort 1 of the THOR Trial (ITT Analysis Set; January 15, 2023, Clinical Cut-Off)
Variable | THOR trial, cohort 1 | ||
|---|---|---|---|
Erdafitinib | Chemotherapy | Total | |
Analysis set: ITT | 136 | 130 | 266 |
Prior anticancer therapy by line of therapy, n (%) | |||
One line of prior systemic therapy | 45 (33.1) | 33 (25.4) | 78 (29.3) |
Chemotherapy + anti-PD-L1 | 32 (23.5) | 14 (10.8) | 46 (17.3) |
Anti-PD-L1 | 9 (6.6) | 13 (10.0) | 22 (8.3) |
Anti-PD-L1 + other | 2 (1.5) | 3 (2.3) | 5 (1.9) |
Chemotherapy | 1 (0.7) | 2 (1.5) | 3 (1.1) |
Chemotherapy + anti-PD-L1 + other | 1 (0.7) | 1 (0.8) | 2 (0.8) |
Two lines of prior systemic therapy | 90 (66.2) | 97 (74.6) | 187 (70.3) |
Chemotherapy; anti-PD-L1 | 75 (55.1) | 74 (56.9) | 149 (56.0) |
Chemotherapy + anti-PD-L1; chemotherapy | 5 (3.7) | 6 (4.6) | 11 (4.1) |
Anti-PD-L1; chemotherapy | 4 (2.9) | 5 (3.8) | 9 (3.4) |
Anti-PD-L1 + other; chemotherapy | 1 (0.7%) | 3 (2.3) | 4 (1.5) |
Chemotherapy; chemotherapy + anti-PD-L1 | 2 (1.5) | 1 (0.8) | 3 (1.1) |
Chemotherapy + anti-PD-L1; ADC | 0 | 2 (1.5) | 2 (0.8) |
Anti-PD-L1; other | 2 (1.5) | 0 | 2 (0.8) |
Other; anti-PD-L1 | 0 | 2 (1.5) | 2 (0.8) |
Chemotherapy + anti-PD-L1; chemotherapy + anti-PD-L1 | 0 | 1 (0.8) | 1 (0.4) |
Chemotherapy + anti-PD-L1; chemotherapy + other | 0 | 1 (0.8) | 1 (0.4) |
Chemotherapy + anti-PD-L1; anti-PD-L1 | 1 (0.7) | 0 | 1 (0.4) |
Chemotherapy; anti-PD-L1 + other | 0 | 1 (0.8) | 1 (0.4) |
Anti-PD-L1; chemotherapy + anti-PD-L1 + other | 0 | 1 (0.8) | 1 (0.4) |
Two lines of prior systemic therapy | 90 (66.2) | 97 (74.6) | 187 (70.3) |
First line of therapy | |||
Chemotherapy | 77 (56.6) | 76 (58.5) | 153 (57.5) |
Chemotherapy + anti-PD-L1 | 6 (4.4) | 10 (7.7) | 16 (6.0) |
Anti-PD-L1 | 6 (4.4) | 6 (4.6) | 12 (4.5) |
Anti-PD-L1 + other | 1 (0.7) | 3 (2.3) | 4 (1.5) |
Other | 0 | 2 (1.5) | 2 (0.8) |
Second line of therapy | |||
Anti-PD-L1 | 76 (55.9) | 76 (58.5) | 152 (57.1) |
Chemotherapy | 10 (7.4) | 14 (10.8) | 24 (9.0) |
Chemotherapy + anti-PD-L1 | 2 (1.5) | 2 (1.5) | 4 (1.5) |
ADC | 0 | 2 (1.5) | 2 (0.8) |
Other | 2 (1.5) | 0 | 2 (0.8) |
Chemotherapy + anti-PD-L1 + other | 0 | 1 (0.8) | 1 (0.4) |
Chemotherapy + other | 0 | 1 (0.8) | 1 (0.4) |
Anti-PD-L1 + other | 0 | 1 (0.8) | 1 (0.4) |
Prior anticancer therapy, n (%) | |||
Radiation therapy | 39 (28.7) | 44 (33.8) | 83 (31.2) |
Prior urinary surgery | 122 (89.7) | 116 (89.2) | 238 (89.5) |
Chemotherapy | 123 (90.4) | 114 (87.7) | 237 (89.1) |
Any platinum-based therapy | 122 (89.7) | 111 (85.4) | 233 (87.6) |
Cisplatin | 76 (55.9) | 59 (45.4) | 135 (50.8) |
Gem-cisplatin | 69 (50.7) | 55 (42.3) | 124 (46.6) |
No gem-cisplatin or MVAC | 0 | 0 | 0 |
MVAC | 7 (5.1) | 4 (3.1) | 11 (4.1) |
Carboplatin | 37 (27.2) | 41 (31.5) | 78 (29.3) |
Gem-carboplatin | 36 (26.5) | 40 (30.8) | 76 (28.6) |
Other carboplatin | 1 (0.7) | 1 (0.8) | 2 (0.8) |
Multiple platinum-based therapy | 8 (5.9) | 10 (7.7) | 18 (6.8) |
No platinum-based therapy | 1 (0.7) | 3 (2.3) | 4 (1.5) |
Antibody-drug conjugate | 0 | 2 (1.5) | 2 (0.8) |
Enfortumab vedotin | 0 | 2 (1.5) | 2 (0.8) |
Anti-PD-L1 therapy | 135 (99.3) | 128 (98.5) | 263 (98.9) |
Pembrolizumab | 47 (34.6) | 47 (36.2) | 94 (35.3) |
Avelumab | 31 (22.8) | 28 (21.5) | 59 (22.2) |
Atezolizumab | 26 (19.1) | 26 (20.0) | 52 (19.5) |
Nivolumab | 11 (8.1) | 13 (10.0) | 24 (9.0) |
Durvalumab | 13 (9.6) | 4 (3.1) | 17 (6.4) |
Tislelizumab | 5 (3.7) | 3 (2.3) | 8 (3.0) |
Toripalimab | 2 (1.5) | 2 (1.5) | 4 (1.5) |
Not specified | 1 (0.7) | 2 (1.5) | 3 (1.1) |
Cemiplimab | 0 | 1 (0.8) | 1 (0.4) |
Sintilimab | 0 | 1 (0.8) | 1 (0.4) |
Tocilizumab | 0 | 1 (0.8) | 1 (0.4) |
Prior systemic therapy indication, n (%) | |||
Metastatic urothelial cancer | 128 (94.1) | 122 (93.8) | 250 (94.0) |
Adjuvant | 17 (12.5) | 15 (11.5) | 32 (12.0) |
Neoadjuvant | 11 (8.1) | 14 (10.8) | 25 (9.4) |
ADC = antibody-drug conjugate; ITT = intention-to-treat; gem = gemcitabine; MVAC = methotrexate, vinblastine, doxorubicin (Adriamycin), cisplatin.
Notes: Percentages are based on the number of patients in the analysis set of the corresponding treatment group.
One patient with 3 prior lines of prior systemic therapy is not included in this table.
The + symbol indicates medications that are part of the same line of therapy, which may have been administered sequentially or concurrently. The ; symbol indicates medication(s) administered as a separate line of therapy.
Source: 2023 Clinical Study Report for the THOR study, cohort 1.47
Exposure to Study Treatments
Study Treatments
Patient exposure in cohort 1 of the THOR trial for the safety analysis set is summarized in Table 15. The median extent of exposure in cohort 1 was 146.0 days (range, 5 days to 1,162 days) in the erdafitinib group and 43.0 days (range, 1 day to 820 days) in the chemotherapy group. At the time of clinical cut-off for the cohort 1 analysis (January 15, 2023), 29 patients in the erdafitinib group and 10 patients in the chemotherapy group were still on the study treatment.
Table 15: Patient Exposure Characteristics in Cohort 1 of the THOR Trial (Safety Analysis Set; January 15, 2023, Clinical Cut-Off)
Variable | THOR trial, cohort 1 | ||
|---|---|---|---|
Erdafitinib | Chemotherapy | Total | |
Analysis set: Safety | 135 | 112 | 247 |
Patients with blood sample drawn for serum phosphate concentration on day 14 of cycle 1, n (%) | |||
Yes | 128 (94.8) | NA | NA |
Serum phosphate level, mg/dL | |||
> 9.0 | 0 | NA | NA |
7.0 to 9.0 | 12 (8.9) | NA | NA |
< 7.0 | 116 (85.9) | NA | NA |
No | 7 (5.2) | NA | NA |
Patients with dose reductions, n (%) | 69 (51.1) | NA | NA |
1 dose reduction | 33 (24.4) | NA | NA |
2 dose reductions | 19 (14.1) | NA | NA |
3 dose reductions | 16 (11.9) | NA | NA |
> 3 dose reductions | 1 (0.7) | NA | NA |
Patients with no up-titration | 31 (23.0) | NA | NA |
0 dose reduction | 9 (6.7) | NA | NA |
1 dose reduction | 8 (5.9) | NA | NA |
2 dose reductions | 8 (5.9) | NA | NA |
3 dose reductions | 6 (4.4) | NA | NA |
> 3 dose reductions | 0 | NA | NA |
NA | 0 | NA | NA |
Patients with up-titrationa | 104 (77.0) | NA | NA |
0 dose reduction | 57 (42.2) | NA | NA |
1 dose reduction | 25 (18.5) | NA | NA |
2 dose reductions | 11 (8.1) | NA | NA |
3 dose reductions | 10 (7.4) | NA | NA |
> 3 dose reductions | 1 (0.7) | NA | NA |
Extent of exposure, days | |||
N | 135 | 112 | 247 |
Mean (SD) | 206.8 (193.93) | 85.3 (117.37) | 151.7 (174.29) |
Median | 146.0 | 43.0 | 104.0 |
Range | 5 to 1,162 | 1 to 820 | 1 to 1,162 |
Number of chemotherapy cycles | |||
N | NA | 112 | NA |
Mean (SD) | NA | 4.8 (5.12) | NA |
Median | NA | 3.0 | NA |
Range | NA | 1 to 35 | NA |
Relative dosing intensity, % | |||
N | 135 | 112 | 247 |
Mean (SD) | 69.0 (18.67) | 98.8 (10.45) | 82.5 (21.45) |
Median | 67.4 | 100.0 | 97.2 |
Range | 14 to 100 | 4 to 117 | 4 to 117 |
NA = not applicable; SD = standard deviation.
Source: 2023 Clinical Study Report for the THOR study, cohort 1.47
Concomitant Medications and Cointerventions
No concomitant medications or cointerventions were required during the THOR trial. Concomitant medications were allowed; however, concomitant treatment with investigational drugs, antineoplastic drugs, and hormonal anticancer therapy were prohibited for all patients in cohort 1. Concomitant treatment with strong inhibitors of the CYP3A4 enzymes or live vaccines in the 30 days before the first dose, during the study, and for 3 months after the last dose of study therapy were prohibited for patients in the chemotherapy arm. Concomitant treatment with strong inducers of CYP3A4 enzymes and QT- and/or QTc-prolonging drugs were prohibited for patients in the chemotherapy arm receiving vinflunine.
Permitted concomitant medications for cohort 1 of the THOR trial were as follows:
Symptomatic treatments: Supportive care, such as antibiotics, analgesics, transfusions, diet, and concomitant medications for the symptomatic treatment of related toxicities (grade 1 to 4) could be administered in accordance with the standard of care at the site, at the treating physician’s discretion, as clinically indicated.
Prophylactic medications: Appropriate prophylactic antiemetic regimens could be provided if required, in accordance with institutional practice and current European Society of Medical Oncology guidelines.
Chronic supportive therapies: Ongoing bisphosphonates and denosumab or other supportive therapies were permitted.
Palliative radiotherapy: Localized radiotherapy for symptomatic control was permitted, but did not include definitive radiation to target lesions.
The most frequently used concomitant medications started during treatment (received by ≥ 30% of patients overall), by anatomic therapeutic chemical class, are summarized in Table 16. After study entry, 130 of 135 patients (96.3%) in the erdafitinib group and 106 of 112 patients (94.6%) in the chemotherapy group received concomitant medication.
Subsequent Treatment
Crossover to the erdafitinib treatment group was permitted after the January 15, 2023, clinical cut-off because of the superiority of erdafitinib treatment over chemotherapy. Crossover results are not reported in the 2023 Clinical Study Report for cohort 1 of the THOR trial and, therefore, are not included in this report, as crossover occurred after the interim efficacy and safety analyses were conducted.
Table 16: Summary of Concomitant Medication Started During Treatment in Cohort 1 of the THOR Trial (Safety Analysis Set; January 15, 2023, Clinical Cut-Off)
Variable | THOR trial, cohort 1 | ||
|---|---|---|---|
Erdafitinib | Chemotherapy | Total | |
Analysis set: safety | 135 | 112 | 247 |
Patients who received concomitant medications, n (%) | 130 (96.3) | 106 (94.6) | 236 (95.5) |
Most common concomitant medication in ≥ 20% of all patients, by ATC class, n (%) | |||
Analgesics | 73 (54.1) | 57 (50.9) | 130 (52.6) |
Antibacterials for systemic use | 70 (51.9) | 47 (42.0) | 117 (47.4) |
Corticosteroids for systemic use | 44 (32.6) | 63 (56.3) | 107 (43.3) |
Drugs for acid-related disorders | 48 (35.6) | 47 (42.0) | 95 (38.5) |
Antidiarrheals, intestinal anti-inflammatory, and/or anti-infective drugs | 71 (52.6) | 11 (9.8) | 82 (33.2) |
Blood substitutes and perfusion solutions | 45 (33.3) | 33 (29.5) | 78 (31.6) |
Drugs for constipation | 42 (31.1) | 36 (32.1) | 78 (31.6) |
ATC = anatomic therapeutic chemical.
Source: 2023 Clinical Study Report for the THOR study, cohort 1.47
A summary of subsequent anticancer therapy based on the January 15, 2023; clinical cut-off is reported in Table 17. Chemotherapy was the most common type of subsequent anticancer therapy in both groups.
Table 17: Summary of Subsequent Anticancer Therapy in Cohort 1 of the THOR Trial (ITT Analysis Set; January 15, 2023, Clinical Cut-Off)
Variable | THOR trial, cohort 1 | ||
|---|---|---|---|
Erdafitinib | Chemotherapy | Total | |
Analysis set: ITT | 136 | 130 | 266 |
Number of patients with any subsequent therapy, n (%) | 44 (32.4) | 48 (36.9) | 92 (34.6) |
Number of subsequent systemic therapy lines, n (%) | |||
1 | 33 (24.3) | 40 (30.8) | 73 (27.4) |
2 | 9 (6.6) | 8 (6.2) | 17 (6.4) |
3 | 0 | 0 | 0 |
> 3 | 2 (1.5) | 0 | 2 (0.8) |
Chemotherapy | 21 (15.4) | 21 (16.2) | 42 (15.8) |
Carboplatin | 8 (5.9) | 9 (6.9) | 17 (6.4) |
Gemcitabine | 6 (4.4) | 10 (7.7) | 16 (6.0) |
Paclitaxel | 8 (5.9) | 6 (4.6) | 14 (5.3) |
Docetaxel | 4 (2.9) | 2 (1.5) | 6 (2.3) |
Vinflunine | 4 (2.9) | 0 | 4 (1.5) |
Cisplatin | 0 | 2 (1.5) | 2 (0.8) |
Methotrexate | 0 | 2 (1.5) | 2 (0.8) |
Pemetrexed | 2 (1.5) | 0 | 2 (0.8) |
Doxorubicin | 0 | 1 (0.8) | 1 (0.4) |
Vinblastine | 0 | 1 (0.8) | 1 (0.4) |
Immunotherapy | 9 (6.6) | 9 (6.9) | 18 (6.8) |
Pembrolizumab | 4 (2.9) | 4 (3.1) | 8 (3.0) |
Atezolizumab | 2 (1.5) | 2 (1.5) | 4 (1.5) |
Tislelizumab | 1 (0.7) | 2 (1.5) | 3 (1.1) |
Nivolumab | 1 (0.7) | 1 (0.8) | 2 (0.8) |
Avelumab | 1 (0.7) | 0 | 1 (0.4) |
FGFR inhibitors | 3 (2.2) | 10 (7.7) | 13 (4.9) |
Erdafitinib | 0 | 6 (4.6) | 6 (2.3) |
Derazantinib | 3 (2.2) | 2 (1.5) | 5 (1.9) |
Pemigatinib | 0 | 2 (1.5) | 2 (0.8) |
Antibody-drug conjugate | 22 (16.2) | 14 (10.8) | 36 (13.5) |
Enfortumab vedotin | 19 (14.0) | 13 (10.0) | 32 (12.0) |
Sacituzumab govitecan | 3 (2.2) | 0 | 3 (1.1) |
Disitamab vedotin | 0 | 1 (0.8) | 1 (0.4) |
Other systemic therapy | 2 (1.5) | 1 (0.8) | 3 (1.1) |
Sitravatinib | 1 (0.7) | 1 (0.8) | 2 (0.8) |
Lenvatinib | 1 (0.7) | 0 | 1 (0.4) |
Investigational systemic therapy | 0 | 3 (2.3) | 3 (1.1) |
ABBV-151 | 0 | 1 (0.8) | 1 (0.4) |
BNT 311 or DuoBody-PD-L1x4 to 1BB (no further information) | 0 | 1 (0.8) | 1 (0.4) |
Study drug | 0 | 1 (0.8) | 1 (0.4) |
FGFR = fibroblast growth factor receptor; ITT = intention-to-treat.
Source: 2023 Clinical Study Report for the THOR study, cohort 1.47
Efficacy
The outcomes outlined in this section are presented in the order of importance, determined by the CDA-AMC team from input from clinical experts, clinical groups, and others.
A summary of the primary and secondary efficacy end points for patients treated with erdafitinib in cohort 1 of the THOR trial is provided in Table 18.
Of note, cohort 1 was stopped early; the IDMC recommended that cohort 1 be stopped because of the superiority of erdafitinib treatment over chemotherapy. As such, the interim analysis of cohort 1 is considered the final analysis, and information was extracted from the Clinical Study Report with a January 15, 2023, clinical cut-off.
Table 18: Primary and Secondary Efficacy Outcomes in Cohort 1 of the THOR Trial (ITT Analysis Set; January 15, 2023, Clinical Cut-Off)
Variable | THOR trial, cohort 1 | |
|---|---|---|
Erdafitinib | Chemotherapy | |
Analysis set: ITT | 136 | 130 |
OSa | ||
Median (95% CI), months | 12.06 (10.28 to 16.36) | 7.79 (6.54 to 11.07) |
6-month OS rate (95% CI) | 0.85 (0.77 to 0.90) | 0.66 (0.56 to 0.74) |
Difference (95% CI) | █████ ██████ ██████ | |
12-month OS rate | █████ | █████ |
Difference (95% CI) | █████ ████████ ██████ | |
24-month OS rate (95% CI) | 0.26 (0.17 to 0.36) | 0.20 (0.11 to 0.31) |
Difference (95% CI) | █████ ████████ ██████ | |
Hazard ratio (95% CI)b | 0.64 (0.47 to 0.88) | |
P valuec | 0.0050 | |
PFSd | ||
Median (95% CI), months | 5.55 (4.40 to 5.65) | 2.73 (1.81 to 3.68) |
6-month PFS rate (95% CI) | 0.37 (0.28 to 0.46) | 0.27 (0.19 to 0.37) |
Difference (95% CI) | █████ ███████ ██████ | |
12-month PFS rate | █████ | █████ |
Difference (95% CI) | █████ ████████ ██████ | |
24-month PFS rate (95% CI) | 0.05 (0.01 to 0.12) | 0.04 (0.00 to 0.13) |
Difference (95% CI) | █████ ████████ ██████ | |
Hazard ratio (95% CI)b | 0.58 (0.44 to 0.78) | |
P valuec | 0.0002 | |
ORR (CR + PR) | ||
n (%) | 62 (45.6) | 15 (11.5) |
Risk ratio (95% CI)e | 3.94 (2.37 to 6.57) | |
Difference (95% CI) | ████ ██████ ██████ | |
P valuec | < 0.001 | |
Best overall response, n (%) | ||
CR | 9 (6.6) | 1 (0.8) |
PR | 53 (39.0) | 14 (10.8) |
Stable disease | 50 (36.8) | 41 (31.5) |
PD | 14 (10.3) | 31 (23.8) |
NE | 10 (7.4) | 43 (33.1) |
DoRf | ||
n (%) | 62 (45.6) | 15 (11.5) |
Median (95% CI), months | 4.86 (3.84 to 7.46) | 5.55 (2.14 to 6.01) |
6-month probability of remaining in response (95% CI) | 0.42 (0.29 to 0.55) | .32 (0.10 to 0.57) |
Difference (95% CI) | █████ ████████ ██████ | |
12-month probability of remaining in response | █████ | █████ |
Difference (95% CI) | █████ ████████ ██████ | |
Hazard ratio (95% CI)b | 0.85 (0.43 to 1.66) | |
CI = confidence interval; CR = complete response; DoR = duration of response; ITT = intention-to-treat; NE = not estimable; ORR = objective response rate; OS = overall survival; PD = progressive disease; PFS = progression-free survival; PR = partial response.
Note: For ORR, a risk ratio greater than 1 indicates that the probability of achieving an objective response (PR or CR) is higher in the erdafitinib arm than in the chemotherapy arm.
aNumbers represent the proportion (i.e., 1 = 100%), unless otherwise specified. OS, in months, is calculated as: (date of death – date of randomization + 1)/30.4375. If the patient is alive or the vital status is unknown (for example, if the patient is lost to follow-up or withdrew consent), OS is censored at the date the patient was last known to be alive. Patients lacking data beyond randomization have their OS censored at the date of randomization.
bHazard ratio and 95% CI are estimated using a Cox proportional hazards regression model, with treatment as the only explanatory variable. A hazard ratio of less than 1 indicates longer survival in the erdafitinib arm than in the chemotherapy (vinflunine or docetaxel) arm.
cP value is 2-sided and is based on a log-rank test.
dNumbers represent the proportion (i.e., 1 = 100%), unless otherwise specified. PFS, in months, is defined as the time from the date of randomization to the date of disease progression (assessed with RECIST 1.1 by the investigator) or relapse from CR or death, whichever is reported first, divided by 30.4375. PFS is censored at the date of the last adequate disease assessment for patients who do not have disease progression and are alive, as well as for patients with unknown disease progression or unknown survival status as of the clinical cut-off date. Also, if there is no postbaseline tumour assessment for a patient, PFS is censored on the date of randomization. Patients who die or have disease progression after starting subsequent anticancer therapy are censored at the last tumour assessment date.
eRR, 95% CI, and P value are estimated using Cochran-Mantel-Haenszel test, with ECOG PS (0 or 1 versus 2) as a stratification factor.
fNumbers represent the proportion (i.e., 1 = 100%), unless otherwise specified. DoR, in months, is defined as the time from the date of initial documentation of CR or PR to the date of disease progression (assessed with RECIST 1.1 by the investigator) or relapse from CR or death, whichever is reported first, divided by 30.4375. DoR is only calculated for the subgroup of patients with an overall response of CR or PR. DoR is censored at the date of the last adequate disease assessment for patients who do not have disease progression and are alive, as well as for patients with unknown disease progression or unknown survival status as of the clinical cut-off date. Patients who die or have disease progression after starting subsequent anticancer therapy will be censored at the last tumour assessment date.
Source: 2023 Clinical Study Report for the THOR study, cohort 1.47
Overall Survival
The primary end point of the THOR trial was OS, which was also considered a critical outcome by the clinical experts consulted by CDA-AMC and others involved. This end point was assessed in the ITT analysis set and was measured from the date of randomization to the date of death. If the patient was alive or the vital status was unknown, the patient was censored at the date the patient was last known to be alive.
In an unstratified OS analysis, the median follow-up for OS was 15.90 months (18.04 months for the erdafitinib treatment group and 14.92 months for the chemotherapy treatment group). Median OS was reached in both treatment groups. In the erdafitinib group, the median OS was 12.1 months (95% CI, 10.3 to 16.4 months), with 43.4% of patients censored. The estimated 6-month and 24-month survival rates were 0.85 (95% CI, 0.77 to 0.90) and 0.26 months (95% CI, 0.17 to 0.36 months), respectively. In the chemotherapy group, the median OS was 7.8 months (95% CI, 6.5 to 11.1 months), with 40.0% of patients censored. The estimated 6-month and 24-month survival rates were 0.66 (95% CI, 0.56 to 0.74) and 0.20 (95% CI, 0.11 to 0.31), respectively (Table 18).
Based on a predetermined 2-sided efficacy boundary P value of 0.019, OS was better in patients treated with erdafitinib than with chemotherapy (HR = 0.64; 95% CI, 0.47, 0.88; P value = 0.0050). Based on the HR, treatment with erdafitinib resulted in a 36% reduction in time to death compared to treatment with chemotherapy. The KM curve for OS for patients in the ITT analysis set is provided in Figure 4. The subgroup analysis is presented in Figure 5 and Figure 6. Although subgroup analyses were conducted, the study was not designed to assess the treatment effect within subgroups.
A post hoc sensitivity analysis was performed using the safety analysis set to evaluate the impact of the asymmetry in the number of patients randomized to chemotherapy versus erdafitinib who did not receive treatment. The sensitivity analysis excluded patients who were randomized but did not receive the study treatment (1 patient in the erdafitinib arm and 18 patients in the chemotherapy arm). The results were consistent with the primary analysis (HR = 0.68; 95% CI, 0.49 to 0.94; P value = 0.0199).
Progression-Free Survival
PFS was measured in the ITT analysis set. For patients who did not have disease progression and were alive, as well as for patients with unknown disease progression or unknown survival status as of the clinical cut-off date, PFS was censored at the date of the last adequate disease assessment. If there was no postbaseline tumour assessment for a patient, PFS was censored on the date of randomization. Adequate disease assessment was defined as having sufficient evidence to indicate correctly that progression has or has not occurred.
In an unstratified PFS analysis, median PFS was achieved in both arms. In the erdafitinib arm, median PFS was 5.55 months (95% CI, 4.40 to 5.65 months), with 25.7% of patients censored. The estimated 6-month and 24-month PFS rates were 0.37 (95% CI, 0.28 to 0.46) and 0.05 (95% CI, 0.01 to 0.12), respectively. In the chemotherapy arm, median PFS was 2.73 months (95% CI, 1.81 to 3.68 months), with 30.8% of patients censored. The estimated 6-month and 24-month PFS rates were 0.27 (95% CI, 0.19 to 0.37) and 0.04 (95% CI, 0.00 to 0.13), respectively.
Figure 4: KM Plot for OS in Cohort 1 of the THOR Trial (ITT Analysis Set; January 15, 2023, Clinical Cut-Off)
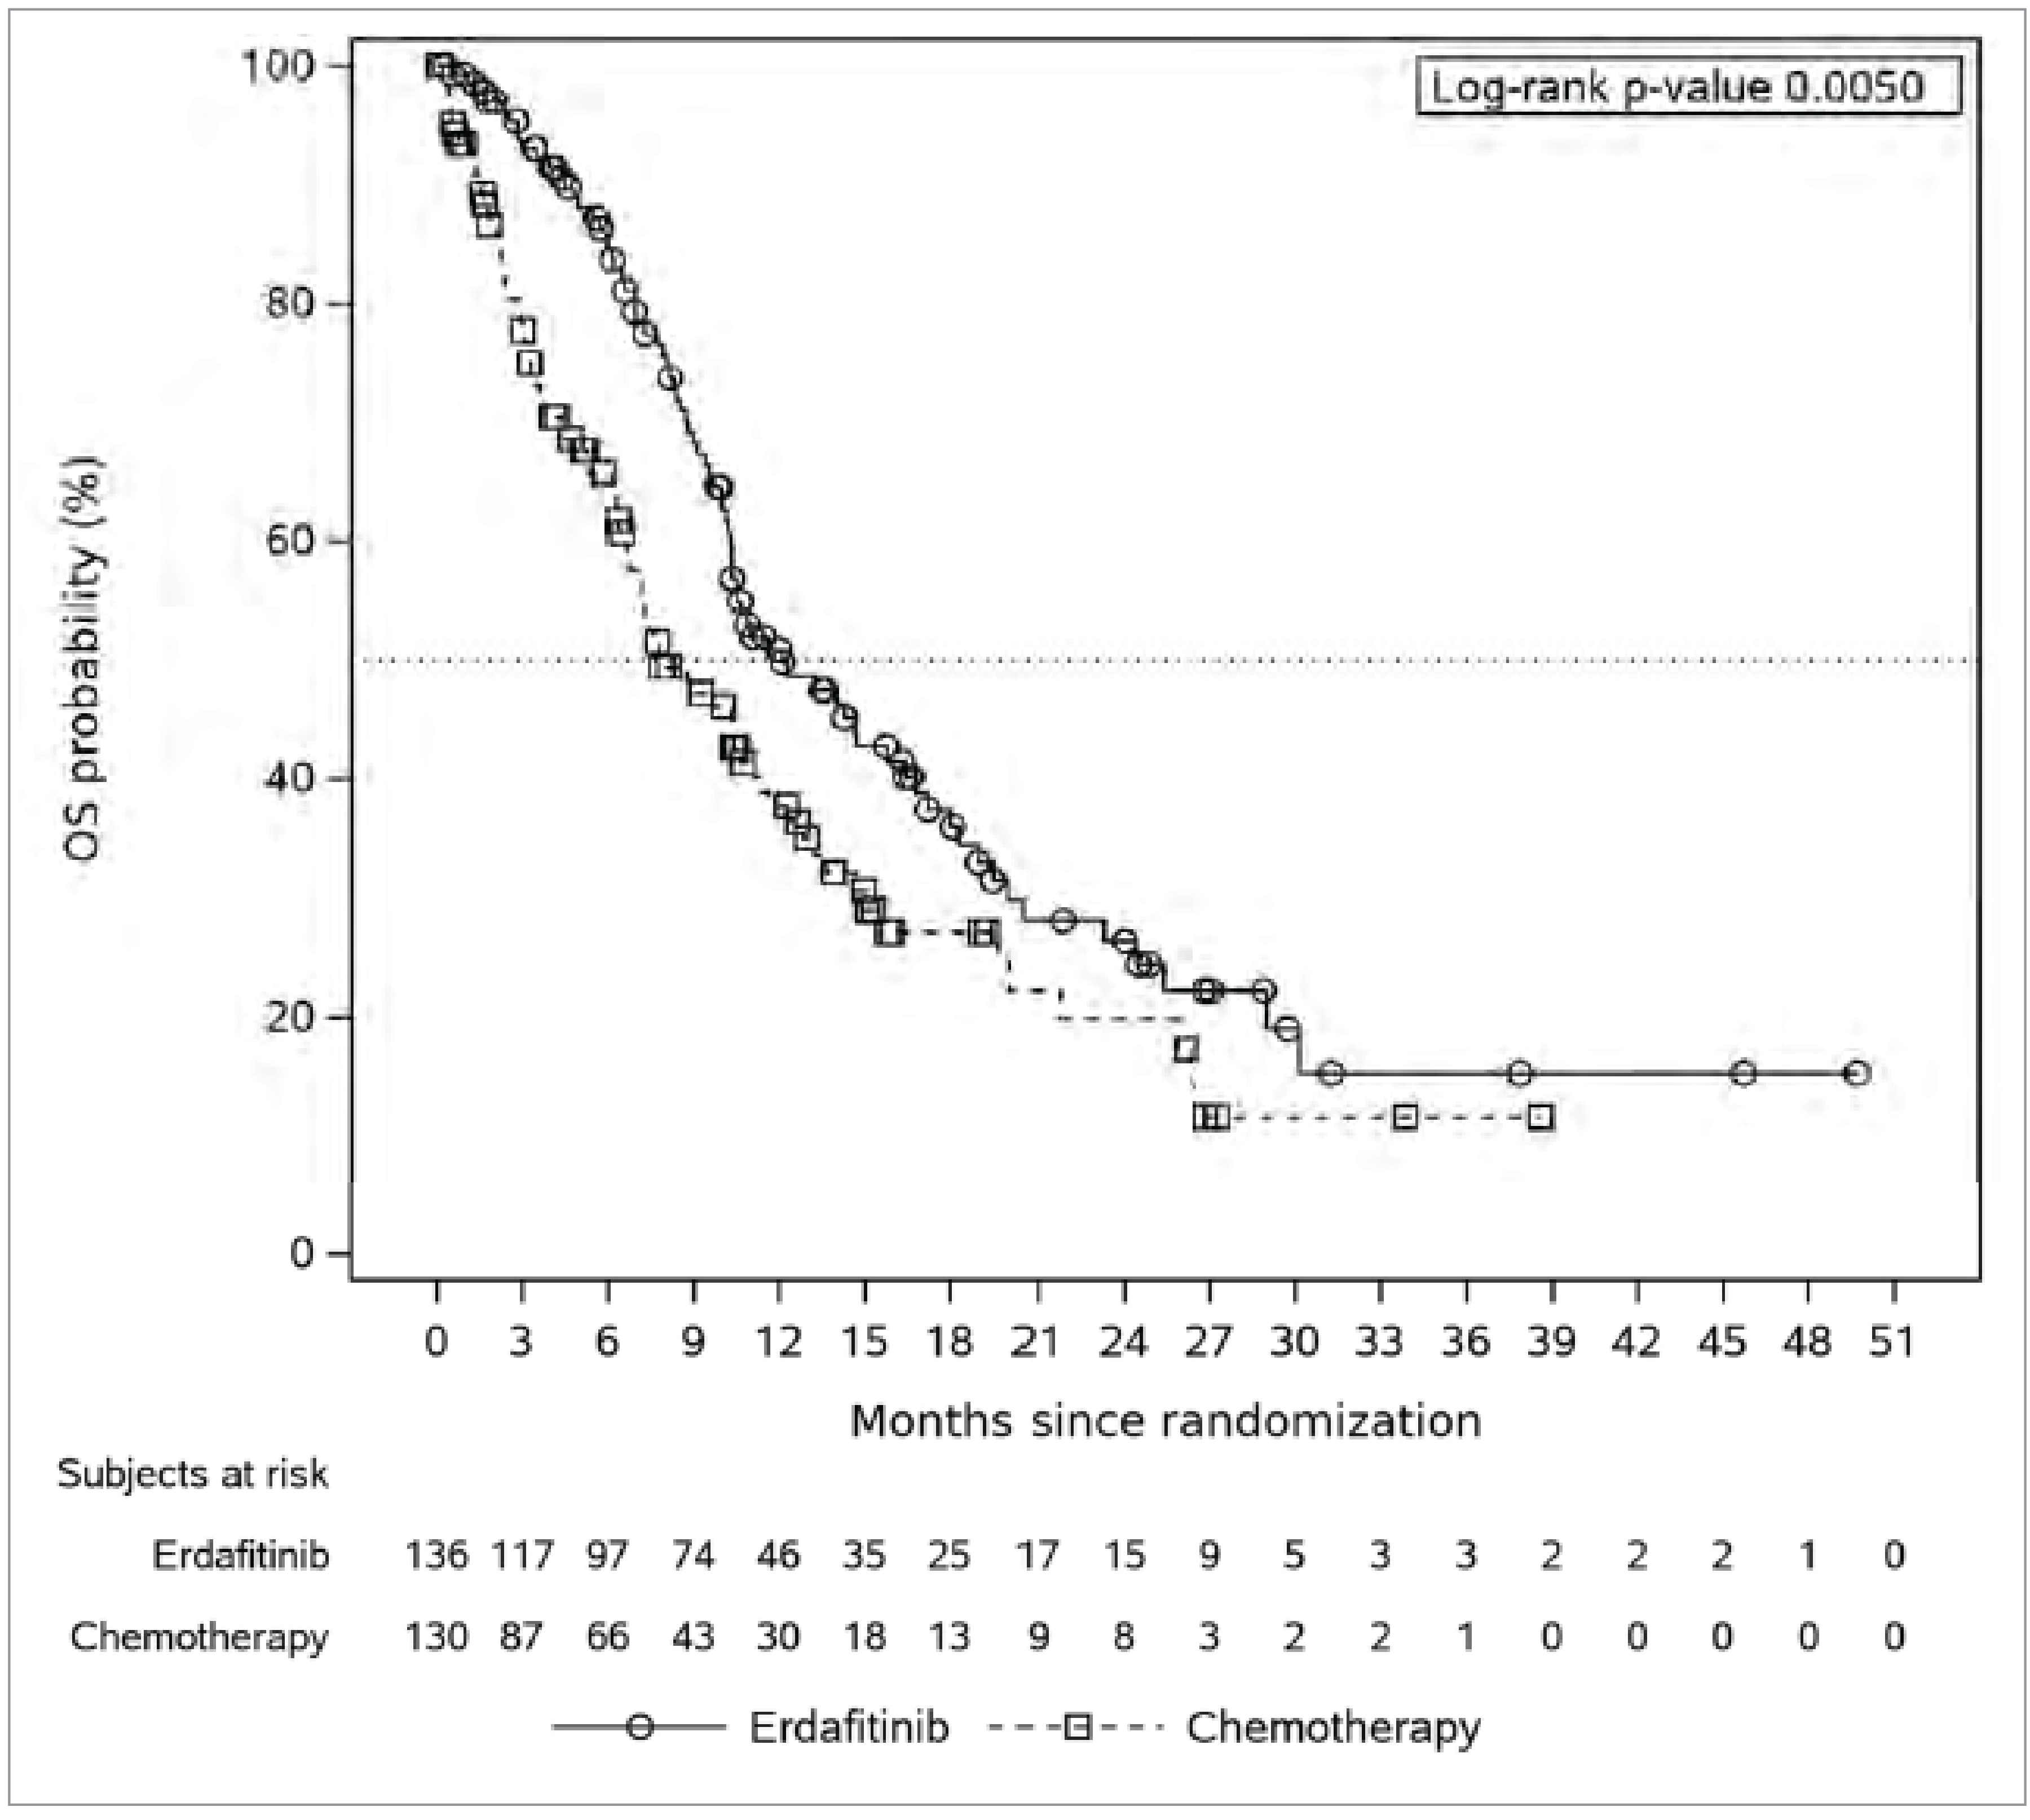
ITT = intention-to-treat; KM = Kaplan-Meier; OS = overall survival.
Source: 2023 Clinical Study Report for the THOR study, cohort 1.
Figure 5: OS Subgroup Analysis for Cohort 1 of the THOR Trial, Part 1 of 2 (ITT Analysis Set; January 15, 2023, Clinical Cut-Off)
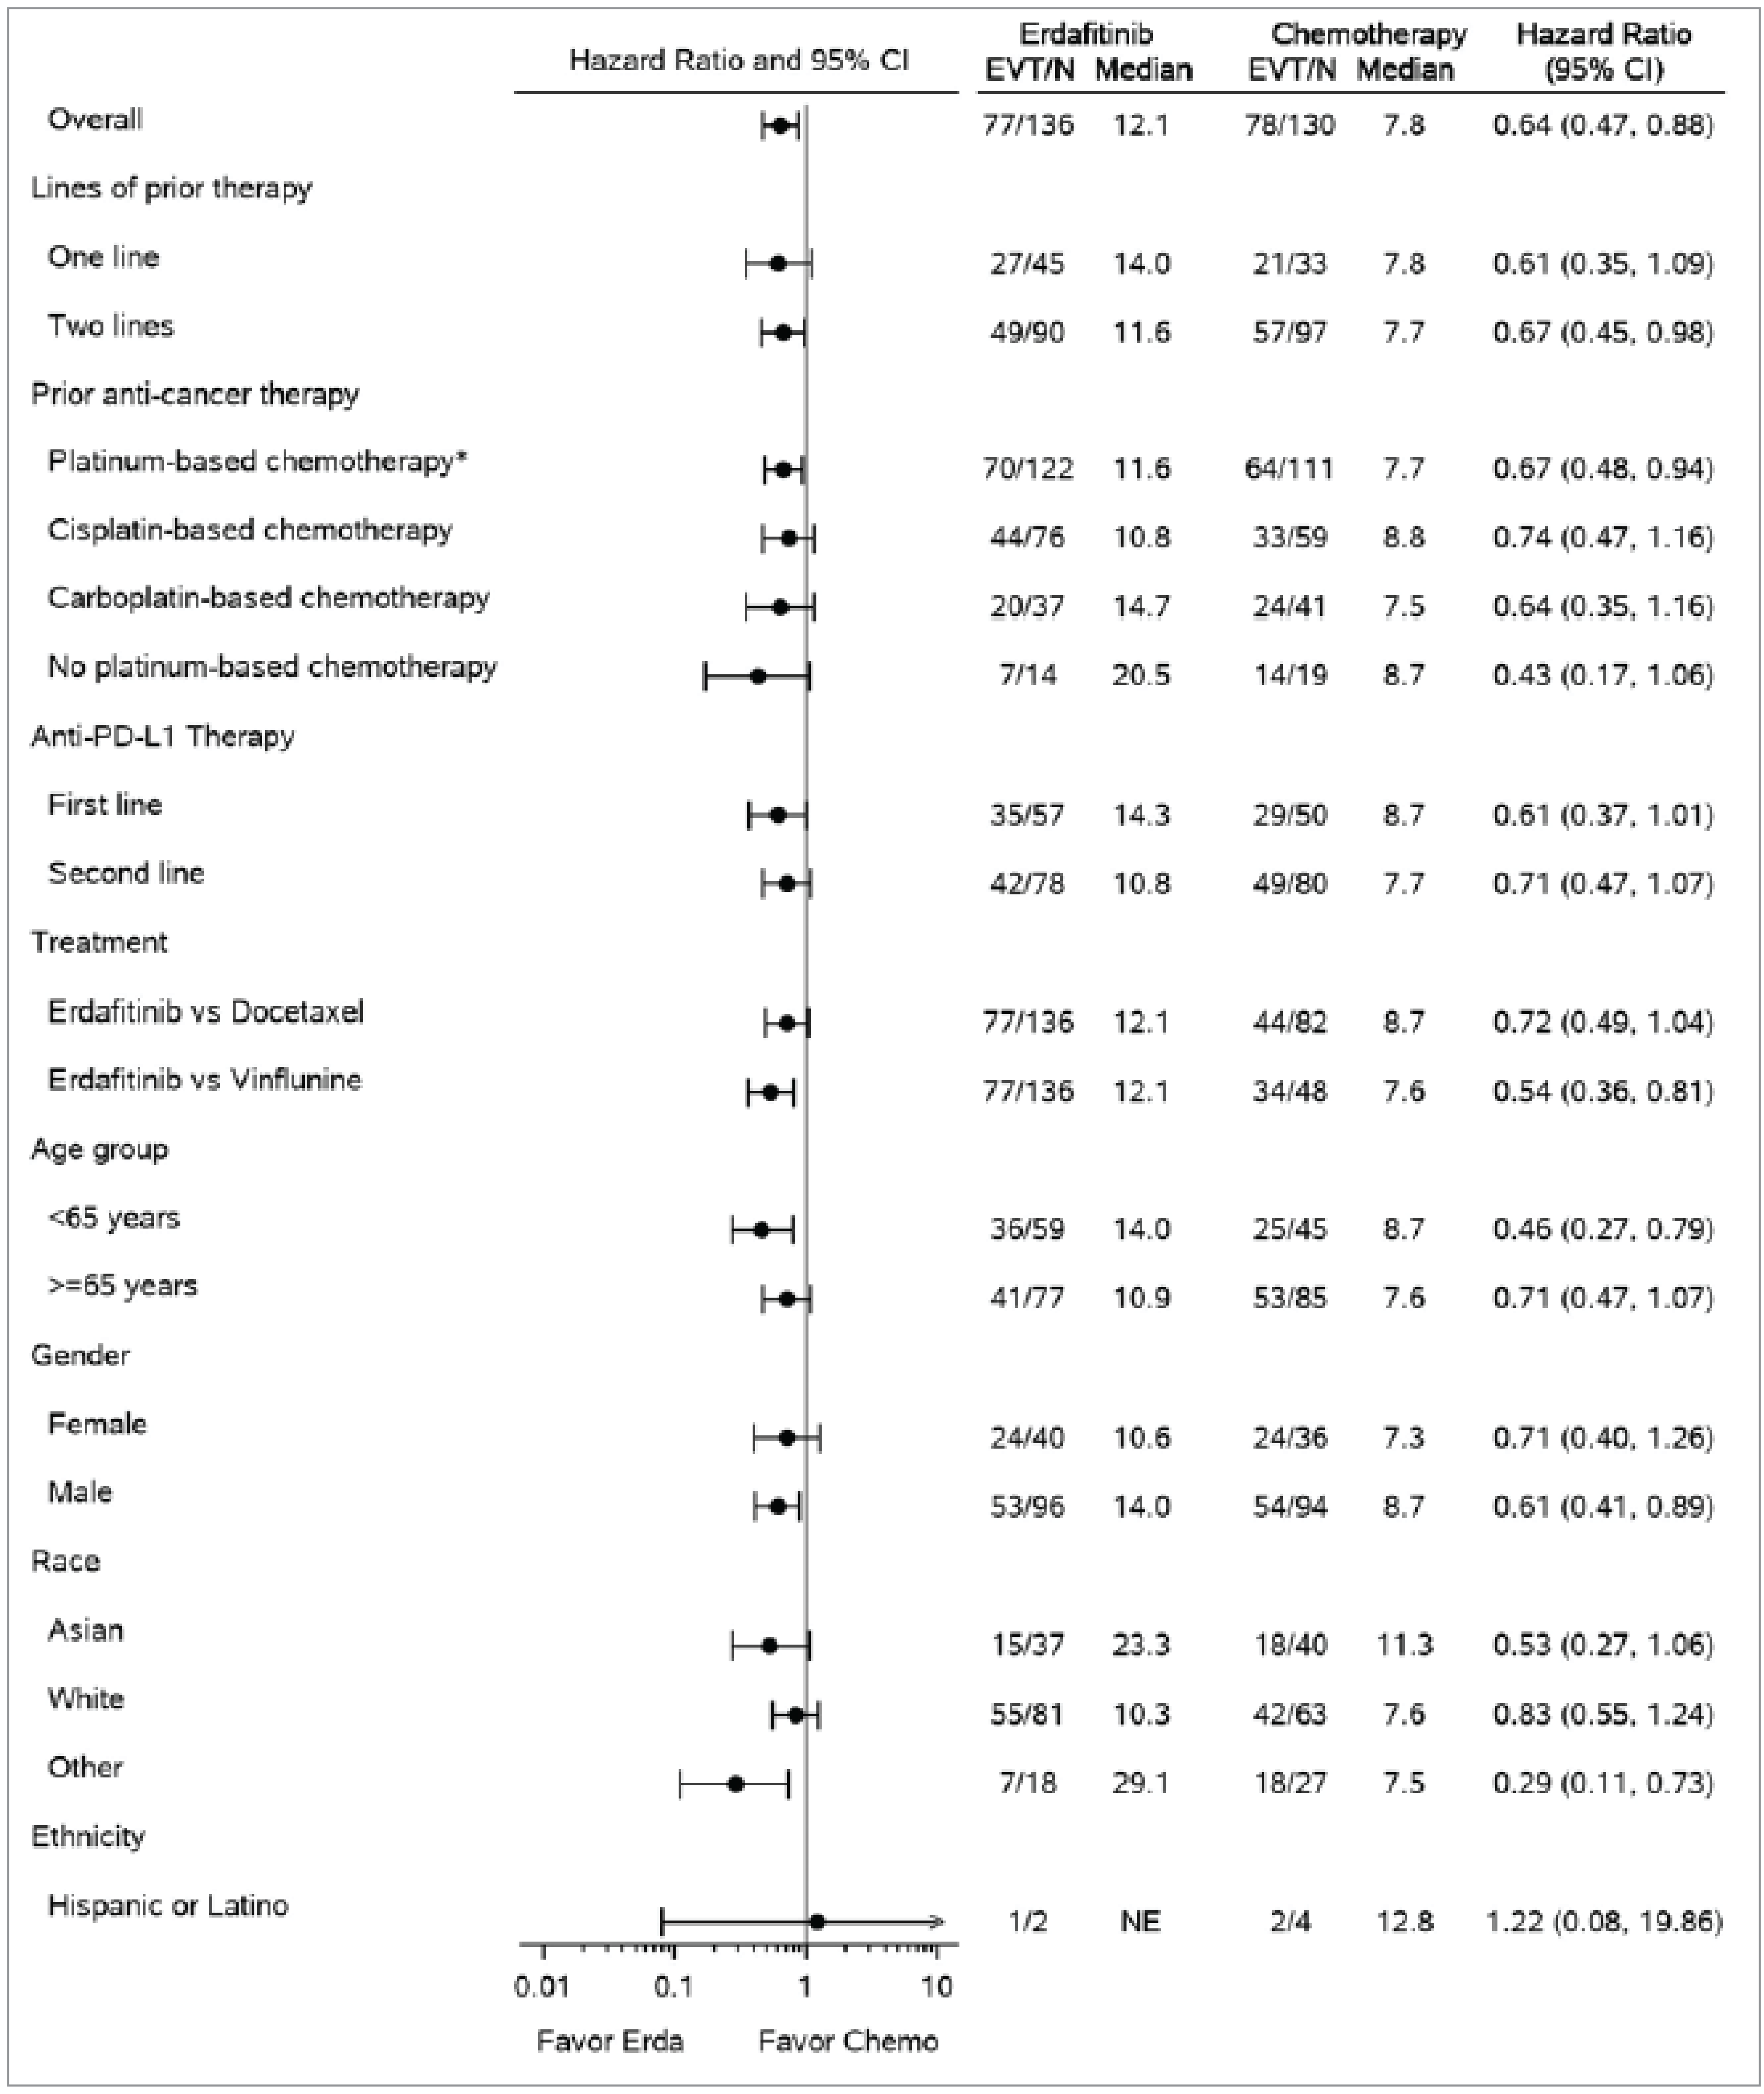
Chemo = chemotherapy; CI = confidence interval; Erda = erdafitinib; EVT = events; ITT = intention-to-treat; NE = not estimable; OS = overall survival.
*Includes cisplatin, carboplatin, and multiple platinum-based chemotherapies.
Source: 2023 Clinical Study Report for the THOR study, cohort 1.47
Figure 6: OS Subgroup Analysis for Cohort 1 of the THOR Trial, Part 2 of 2 (ITT Analysis Set; January 15, 2023, Clinical Cut-Off)
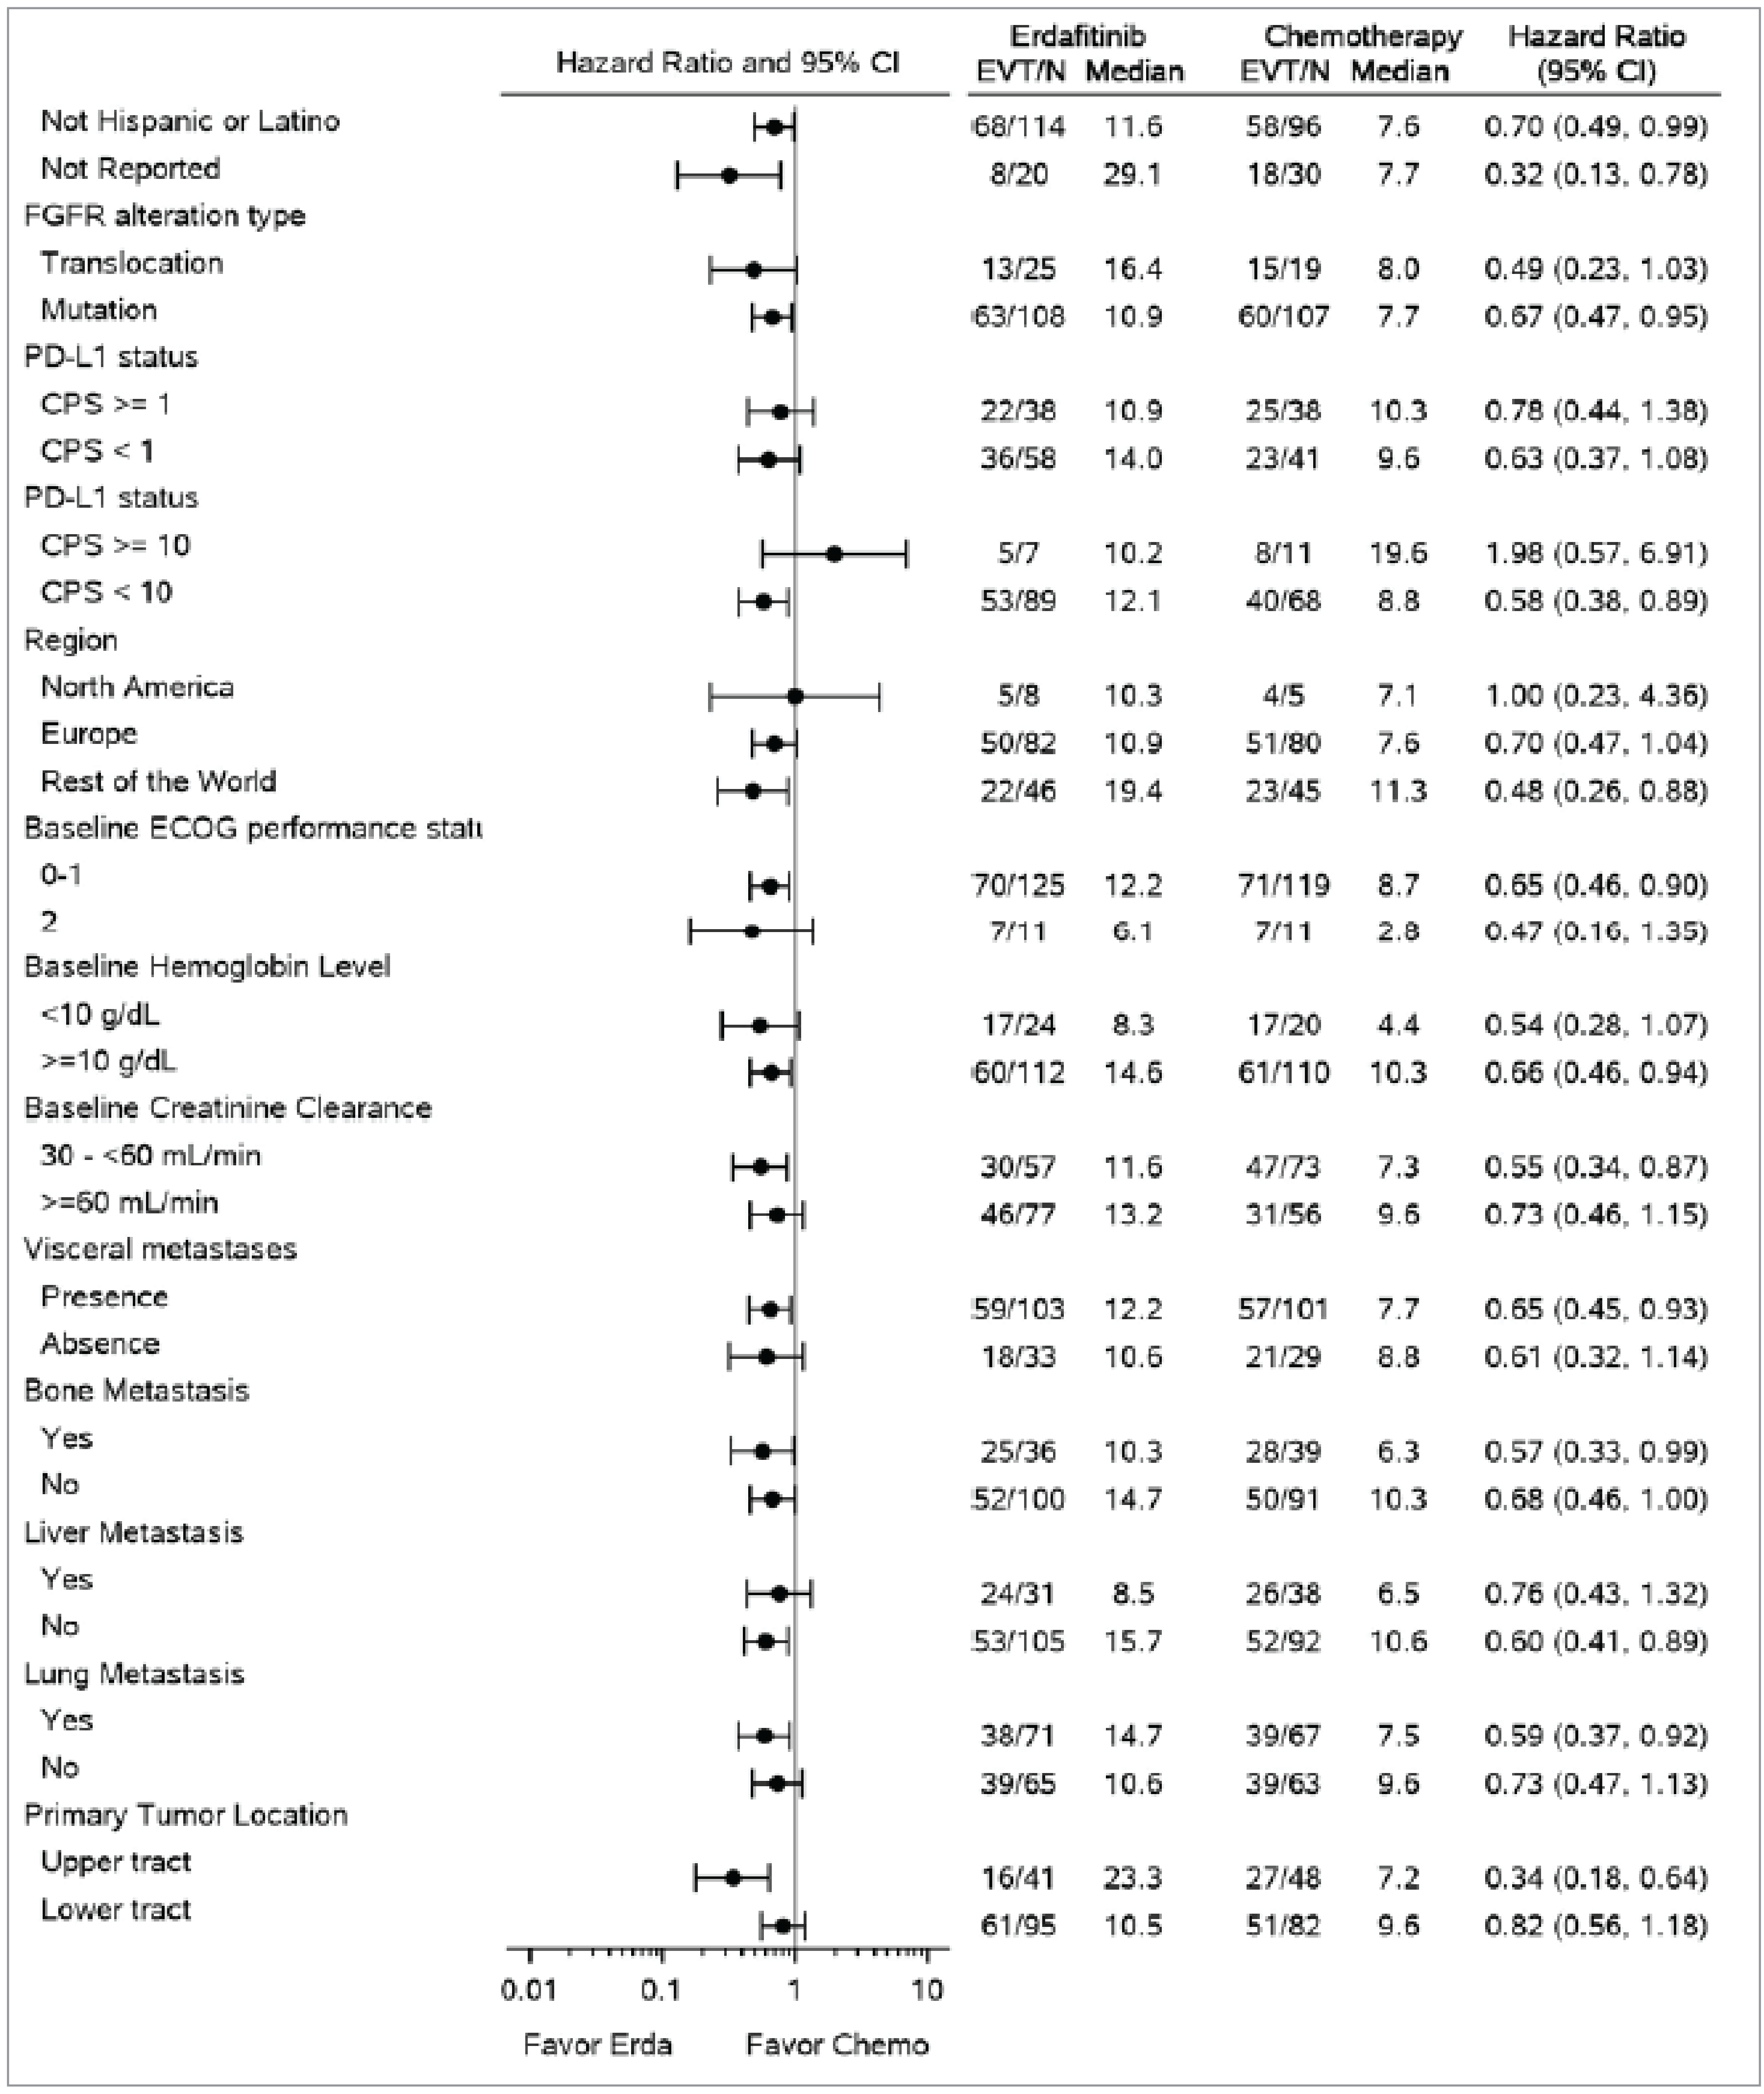
Chemo = chemotherapy; CI = confidence interval; CPS = combined positive score; ECOG = Eastern Cooperative Oncology Group; Erda = erdafitinib; EVT = events; FGFR = fibroblast growth factor receptor; ITT = intention-to-treat; OS = overall survival.
Source: 2023 Clinical Study Report for the THOR study, cohort 1.47
Based on a 2-sided and multiplicity-adjusted significance level of 0.019, the secondary efficacy end point of PFS showed a statistically significant improvement for patients treated with erdafitinib compared to chemotherapy (HR = 0.58; 95% CI, 0.44 to 0.78; P value = 0.0002). Based on the HR, treatment with erdafitinib resulted in a 42% reduction in time to disease progression or death compared to treatment with chemotherapy. The KM curve for PFS for patients in the ITT analysis set is provided in Figure 7.
Figure 7: KM Plot for PFS in Cohort 1 of the THOR Trial (ITT Analysis Set; January 15, 2023, Clinical Cut-Off)
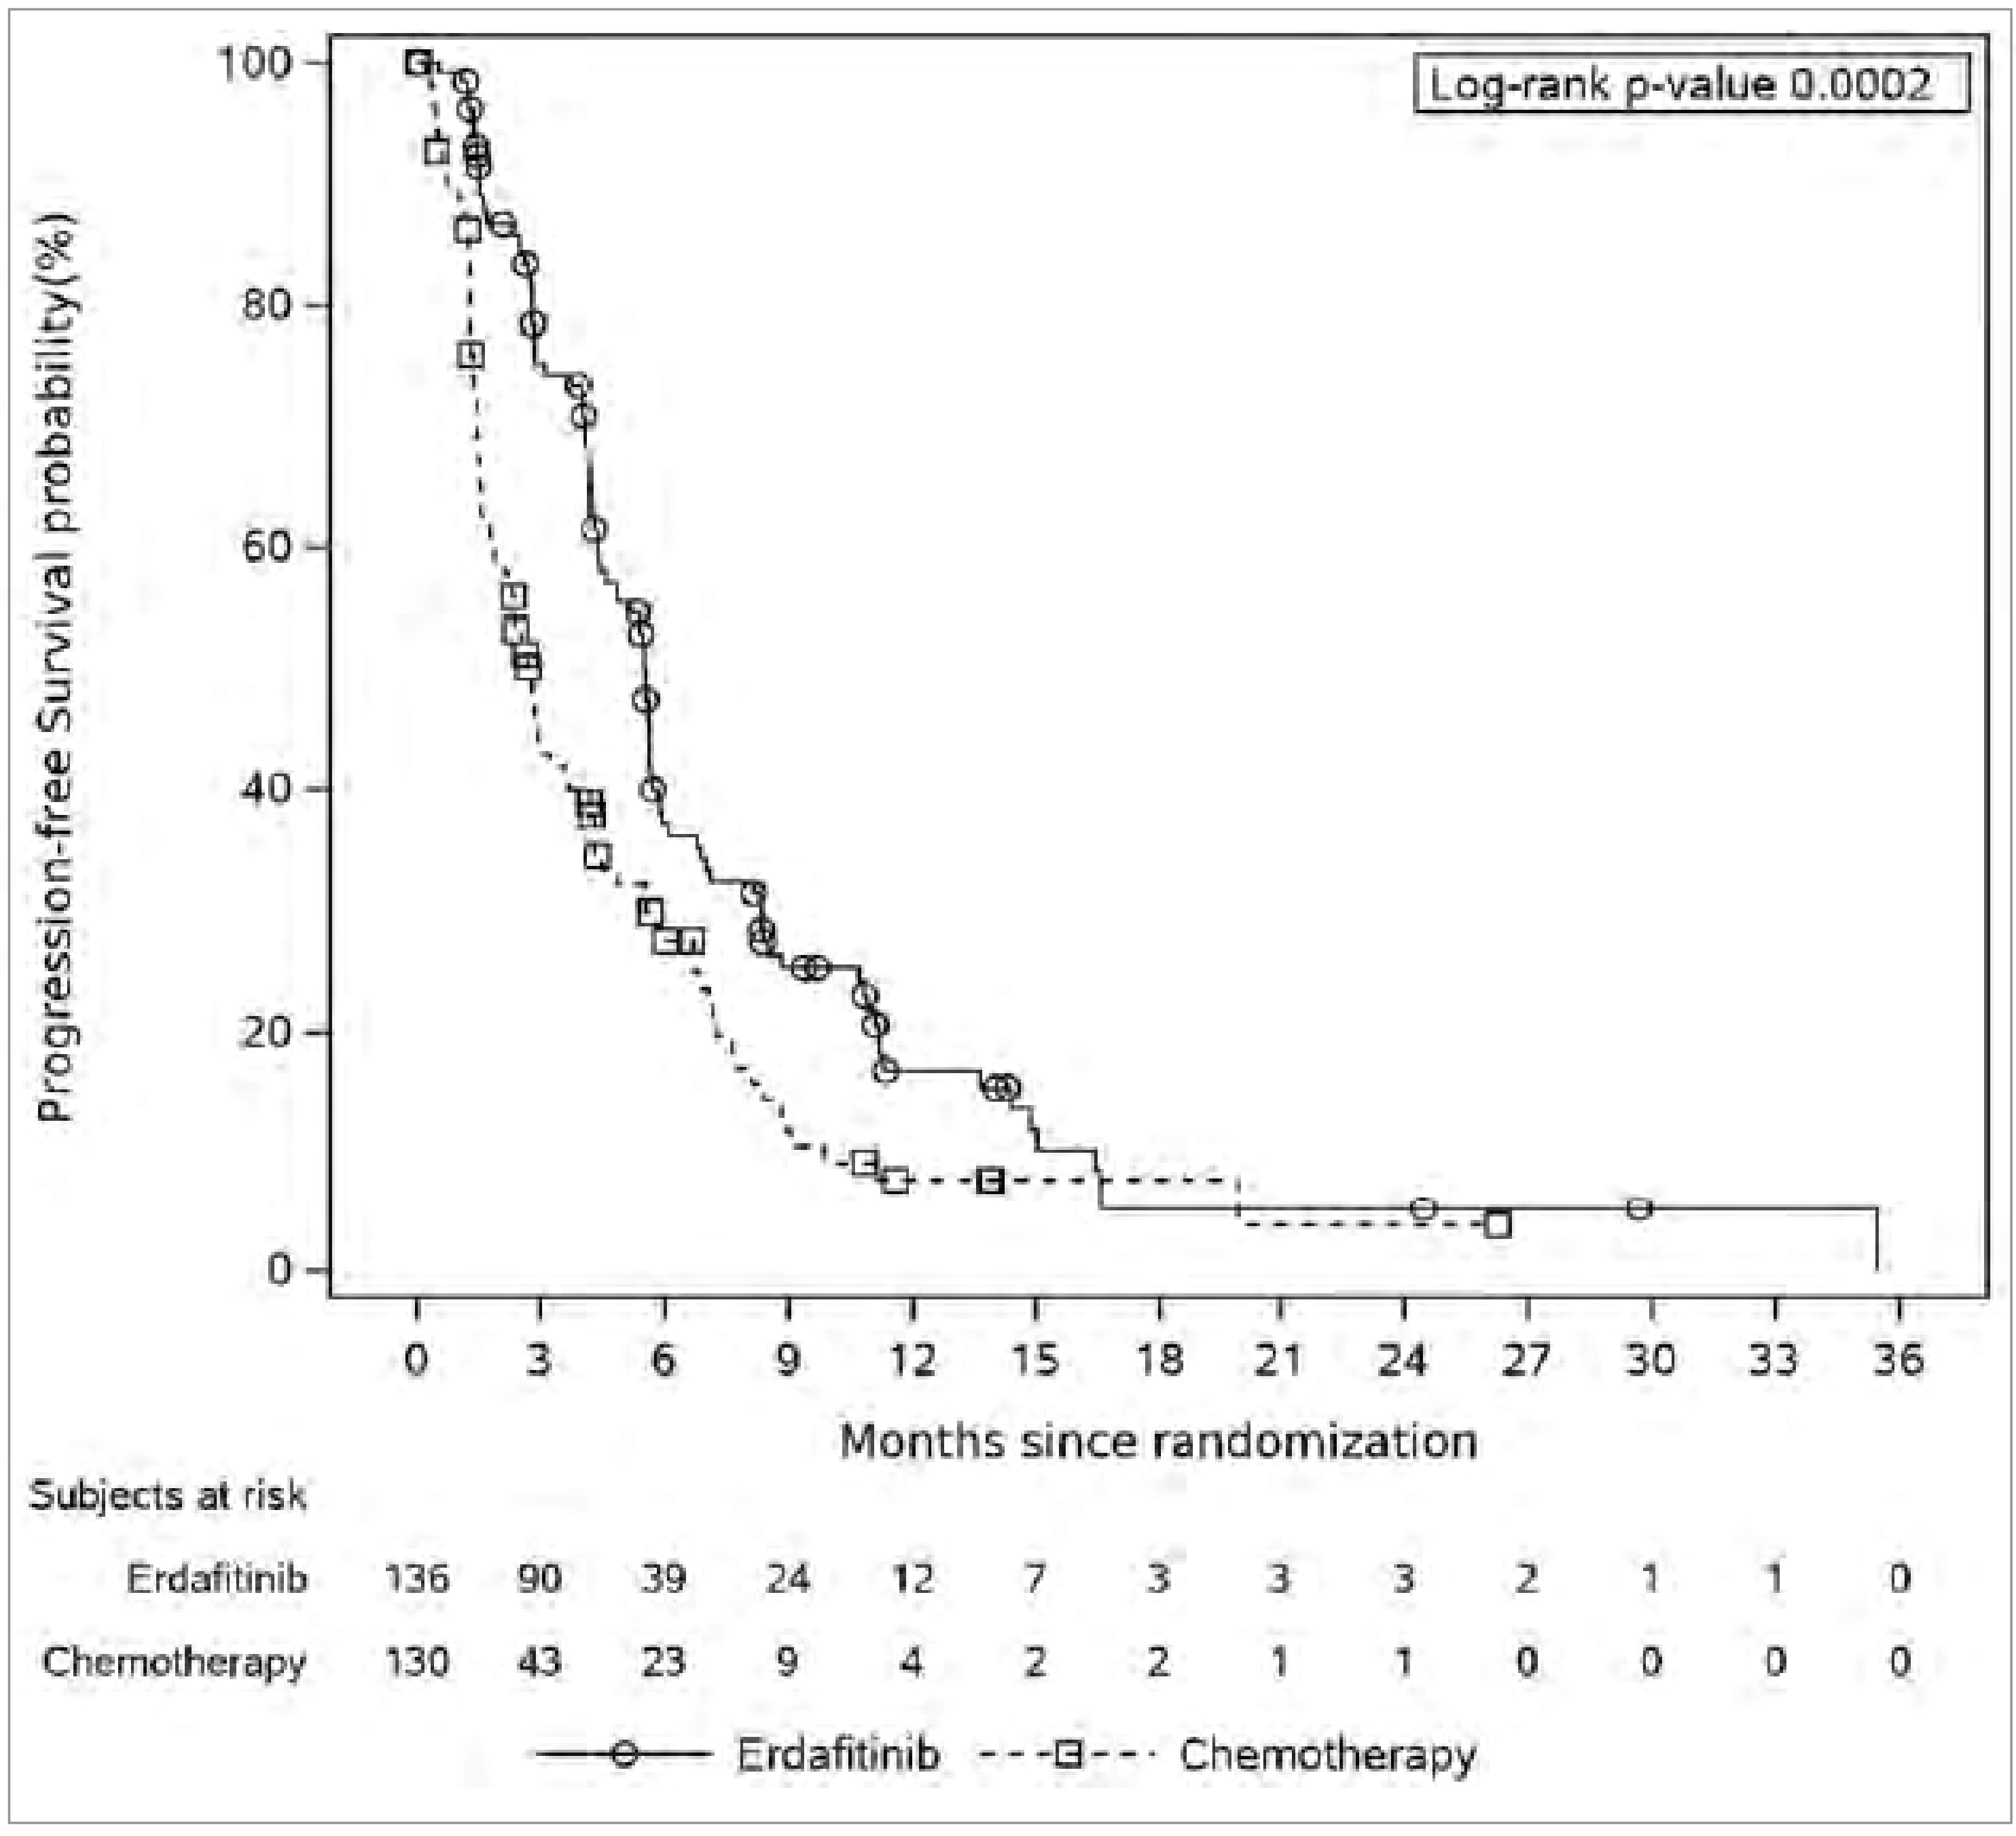
ITT = intention-to-treat; KM = Kaplan-Meier; PFS = progression-free survival.
Source: 2023 Clinical Study Report for the THOR study, cohort 1.47
Two post hoc sensitivity analyses were conducted for PFS. One post hoc sensitivity analysis assessed patients who were censored at their last disease evaluation if they progressed or died after missing at least 2 consecutive assessments. The results of this analysis were consistent with the main PFS analysis. Another post hoc sensitivity analysis, using the safety analysis set, was performed to evaluate the impact of the asymmetry in the number of patients randomized to chemotherapy versus erdafitinib who did not receive treatment. This sensitivity analysis excluded patients who were randomized but did not receive study treatment (1 patient in the erdafitinib arm and 18 patients in the chemotherapy arm). The results were also consistent with the primary analysis (HR = 0.60; 95% CI, 0.45 to 0.81; P value = 0.0006). As with OS, subgroup analyses were conducted but the study was not designed to assess the treatment effect within subgroups, so subgroup effects were not reported.
Objective Response Rate
ORR was measured in the ITT analysis set and defined as the proportion of patients who achieved a CR or PR, as assessed with RECIST 1.1 by the investigator.
ORR was achieved by 62 patients (45.6%) in the erdafitinib treatment arm and 15 patients (11.5%) in the chemotherapy treatment arm (Table 18). Based on a 2-sided and multiplicity-adjusted significance level of 0.019, the difference in ORR was statistically significant between the 2 treatment groups (observed RR, 3.94; 95% CI, 2.37 to 6.57; P < 0.001). Based on the RR, patients treated with erdafitinib are approximately 4 times more likely to achieve an objective response than patients treated with chemotherapy.
The ORR was also examined in prespecified clinically relevant subgroups in the ITT population (FGFR alteration type, PD-L1 status, tumour location, visceral metastases, demographic and baseline characteristics). As with other outcomes, the study was not designed to assess the treatment effect within subgroups, and the number of patients is small. No subgroup effects were apparent.
A post hoc analysis of ORR that compared erdafitinib with docetaxel or vinflunine was consistent (based on HR) with the main ORR analysis comparing erdafitinib with chemotherapy.
Duration of Response
DoR was measured in responders as the duration, in days, from the date of initial documentation of a response to the date of first documented evidence of PD (or relapse for patients who achieved a CR during the study) or death. The censoring was similar to that used for PFS.
The median DoR determined by the investigator was 4.86 months (95% CI, 3.84 to 7.46 months) for the erdafitinib treatment group and 5.55 months (95% CI, 2.14 to 6.01 months) for the chemotherapy treatment group. Patients treated with erdafitinib had a numerically shorter DoR than those treated with chemotherapy (HR = 0.85; 95% CI, 0.43 to 1.66). The DoR in the chemotherapy group was evaluated based on a small number of patients (Table 18).
Of the 17 patients in the erdafitinib group with no disease progression as of the data cut-off date, 16 patients were still on the study treatment and 13 patients continued in the study for more than 2 months. Of the 3 patients in the chemotherapy group with no disease progression as of the data cut-off date, 2 patients were still on the study treatment and 2 patients continued in the study for more than 2 months.
Patient-Reported Outcomes
PROs were measured in the ITT analysis set and evaluated as the change from baseline in HRQoL, assessed with the FACT-Bl, EQ-5D-5L, PGI-S, and time until urinary bladder cancer symptom deterioration (subset of FACT-Bl items). However, the results from the PRO assessments should be interpreted in light of the limitation that the number of patients with available PRO data decreased over time.47
Compliance with the FACT-Bl, EQ-5D-5L, and PGI-S assessments was greater than 80% at baseline and for the majority of treatment cycles through cycle 10 for both treatment groups. In later cycles, the number of expected PRO assessments declined largely because of disease progression or death, particularly in the chemotherapy group. Therefore, adherence to measurements was more variable at later cycles due to smaller sample sizes.47
Change in Scores From Baseline Over Time for FACT-Bl
Baseline FACT-Bl scores were similar in the erdafitinib and chemotherapy groups. A mixed model for repeated measures was used to assess the change from baseline in FACT-Bl scores at each scheduled visit through cycle 11 in the 2 treatment groups. Results from the FACT-Bl assessment for all domains (Figure 8, Figure 9, Figure 10, Figure 11, Figure 12, Figure 13, Figure 14) and total scores (Figure 15) in cohort 1 showed that the effects on HRQoL measures were similar in the erdafitinib and chemotherapy groups.
Figure 8: Mean Change (± SE) From Baseline on the FACT-Bl Physical Well-Being Domain for Patients in Cohort 1 of the THOR Trial (ITT Analysis Set; January 15, 2023, Clinical Cut-Off)
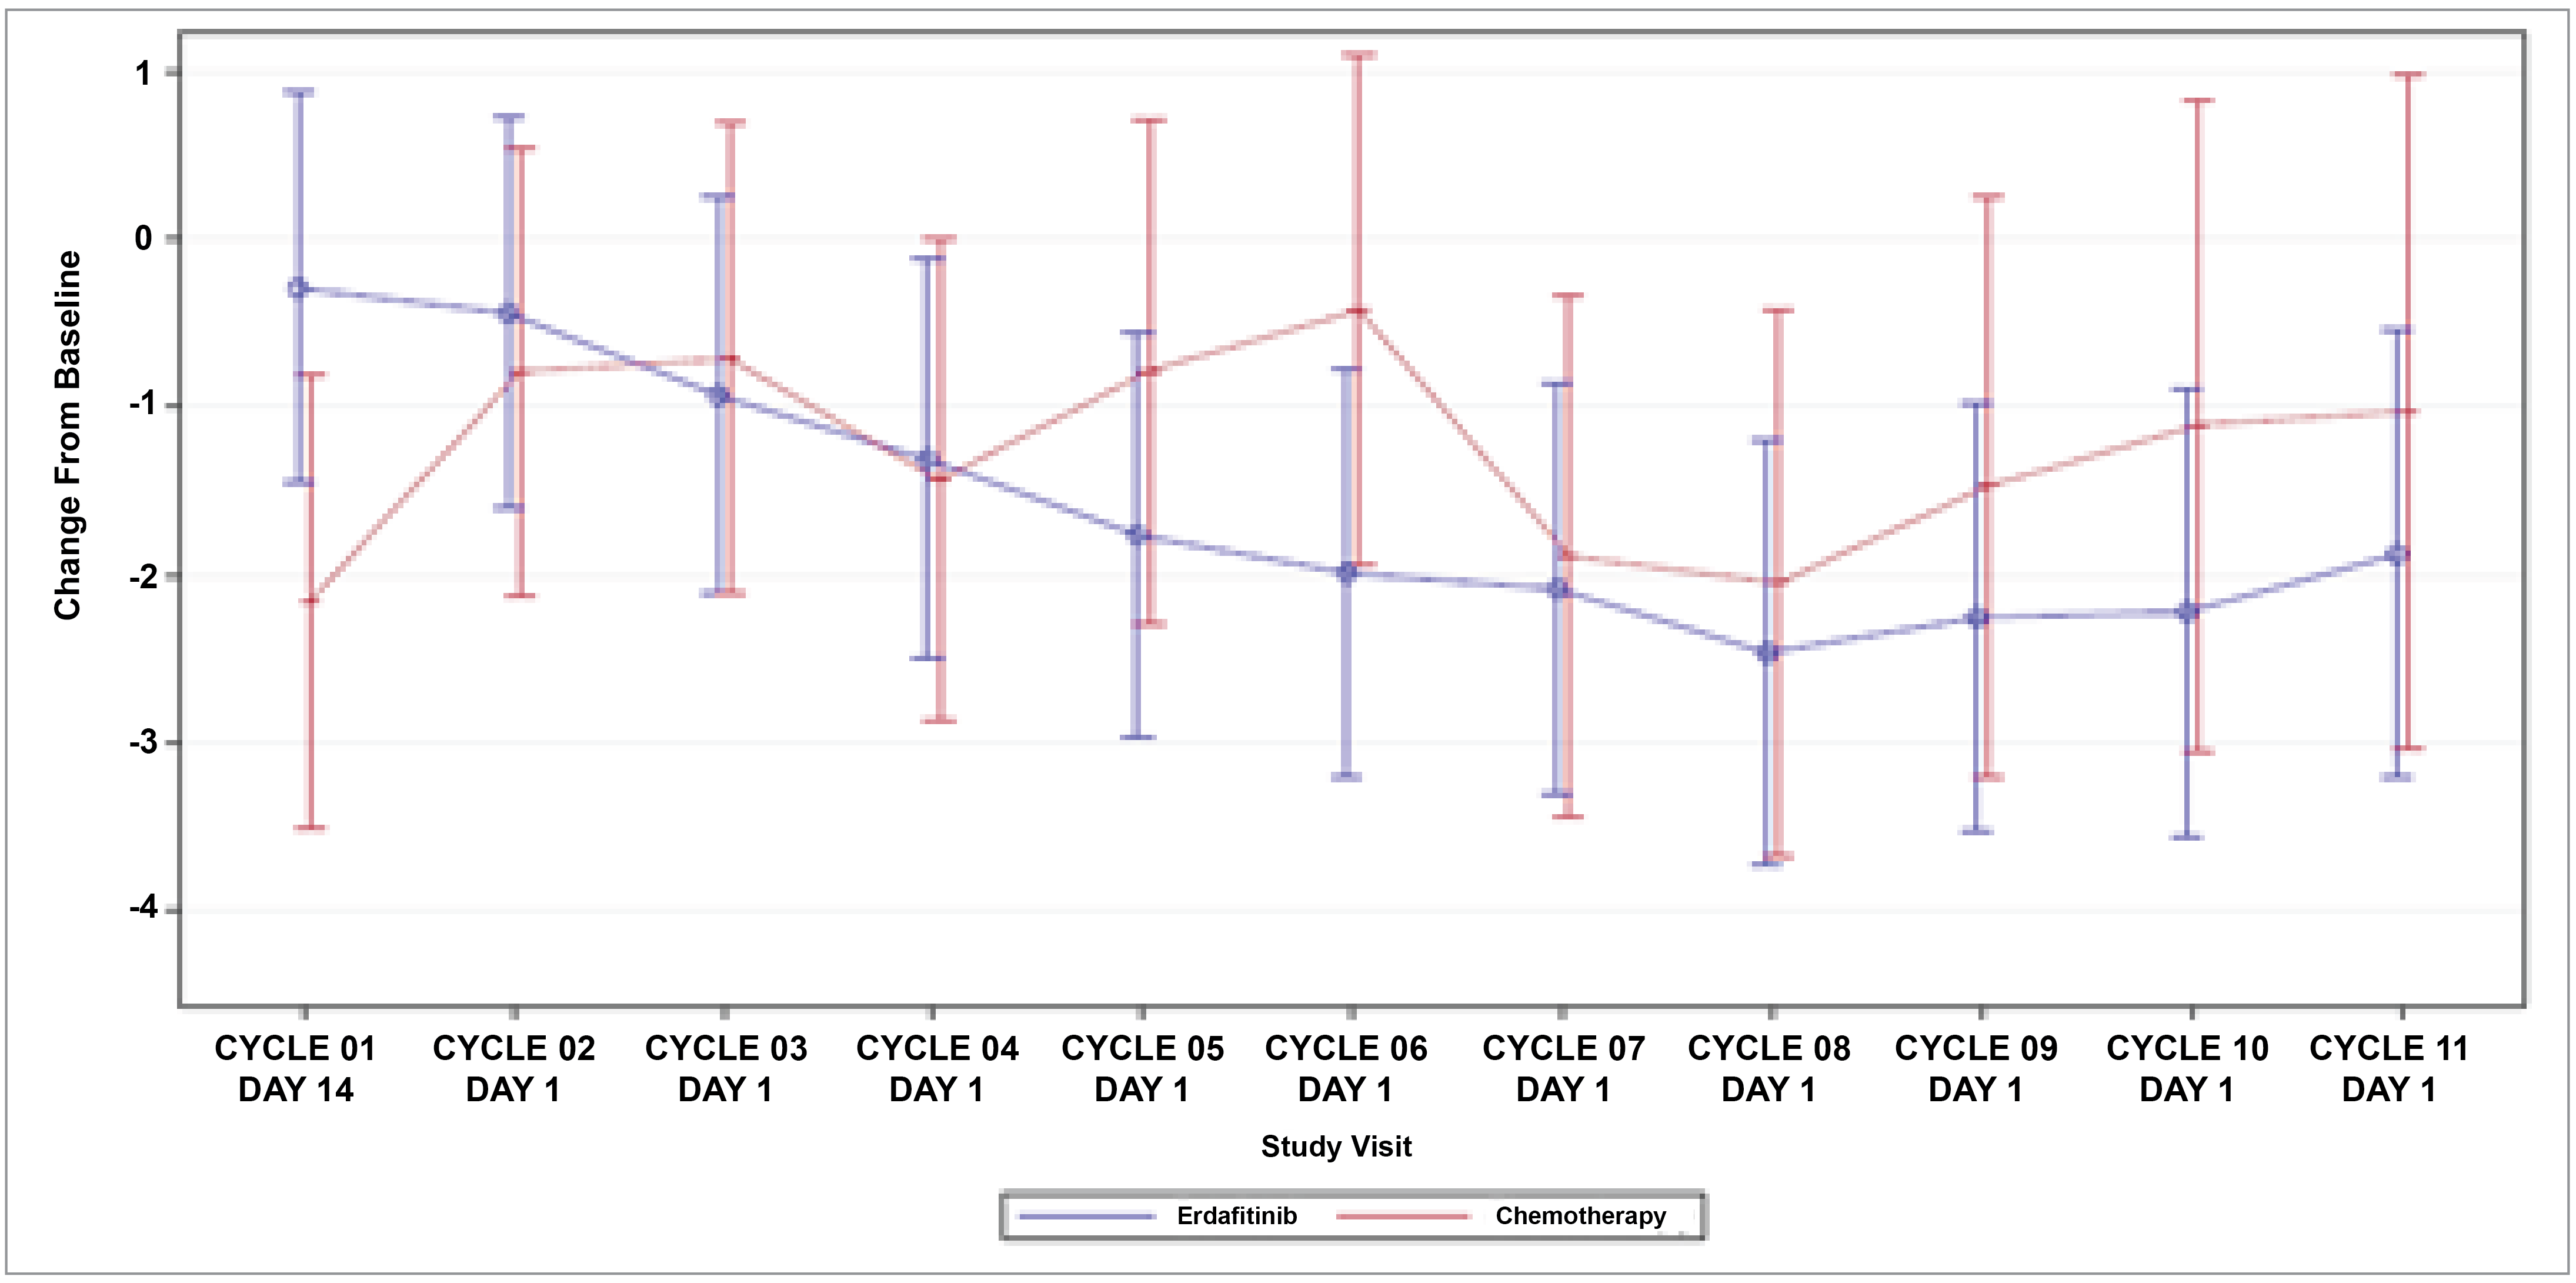
ECOG PS = Eastern Cooperative Oncology Group Performance Status; FACT-Bl = Functional Assessment of Cancer Therapy–Bladder; HRQoL = health-related quality of life; ITT = intention-to-treat; PRO = patient-reported outcome; SE = standard error.
Notes: The primary model includes treatment, time point (categorical), treatment-by-time interaction, baseline PRO score, region, ECOG PS, and disease distribution. The model includes all scheduled visits through cycle 11.
The FACT-Bl is a 39-item questionnaire, with 5-point Likert scales, covering 5 primary domains: physical well-being, social/family well-being, emotional well-being, functional well-being, and additional concerns for patients with bladder cancer. The higher the score, the better the quality of life.
Patients with available PROs data in the ITT population were used.
Source: 2023 Clinical Study Report for the THOR study, cohort 1.47
Figure 9: Mean Change (± SE) From Baseline on the FACT-Bl Social/Family Well-Being Domain for Patients in Cohort 1 of the THOR Trial (ITT Analysis Set; January 15, 2023, Clinical Cut-Off)
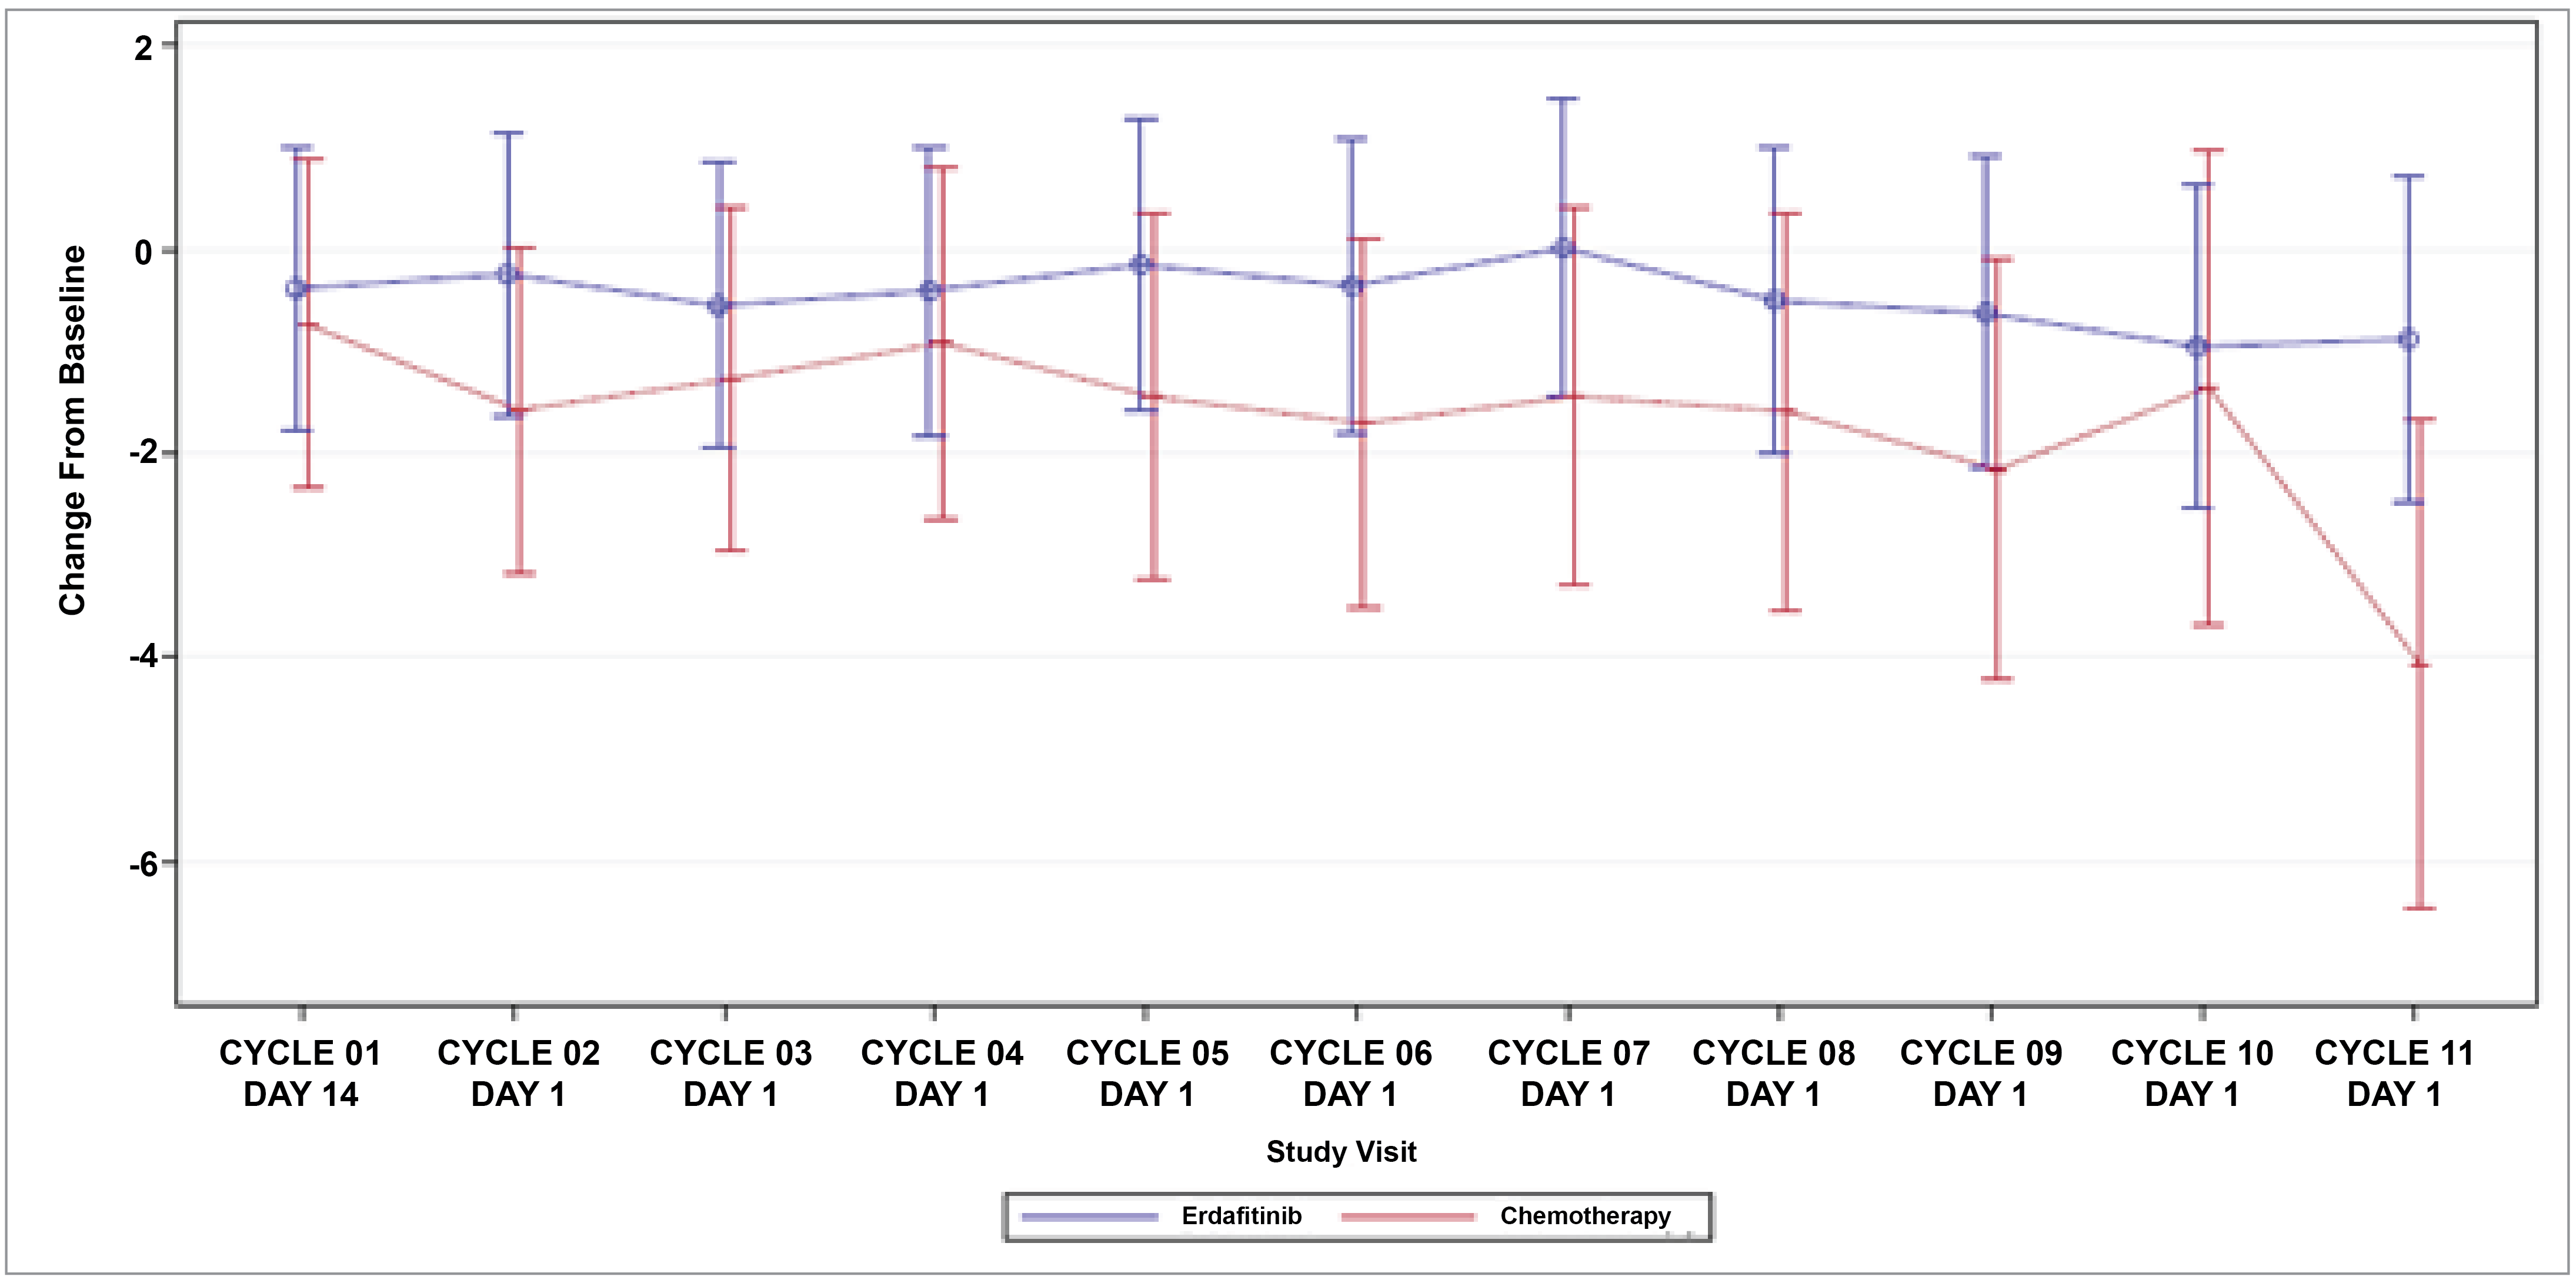
ECOG PS = Eastern Cooperative Oncology Group Performance Status; FACT-Bl = Functional Assessment of Cancer Therapy–Bladder; HRQoL = health-related quality of life; ITT = intention-to-treat; PRO = patient-reported outcome; SE = standard error.
Notes: The primary model includes treatment, time point (categorical), treatment-by-time interaction, baseline PRO score, region, ECOG PS, and disease distribution. The model includes all scheduled visits through cycle 11.
The FACT-Bl is a 39-item questionnaire, with 5-point Likert scales, covering 5 primary domains: physical well-being, social/family well-being, emotional well-being, functional well-being, and additional concerns for patients with bladder cancer. The higher the score, the better the quality of life.
Patients with available PROs data in the ITT population were used.
Source: 2023 Clinical Study Report for the THOR study, cohort 1.47
Figure 10: Mean Change (± SE) From Baseline on the FACT-Bl Emotional Well-Being Domain for Patients in Cohort 1 of the THOR Trial (ITT Analysis Set; January 15, 2023, Clinical Cut-Off)
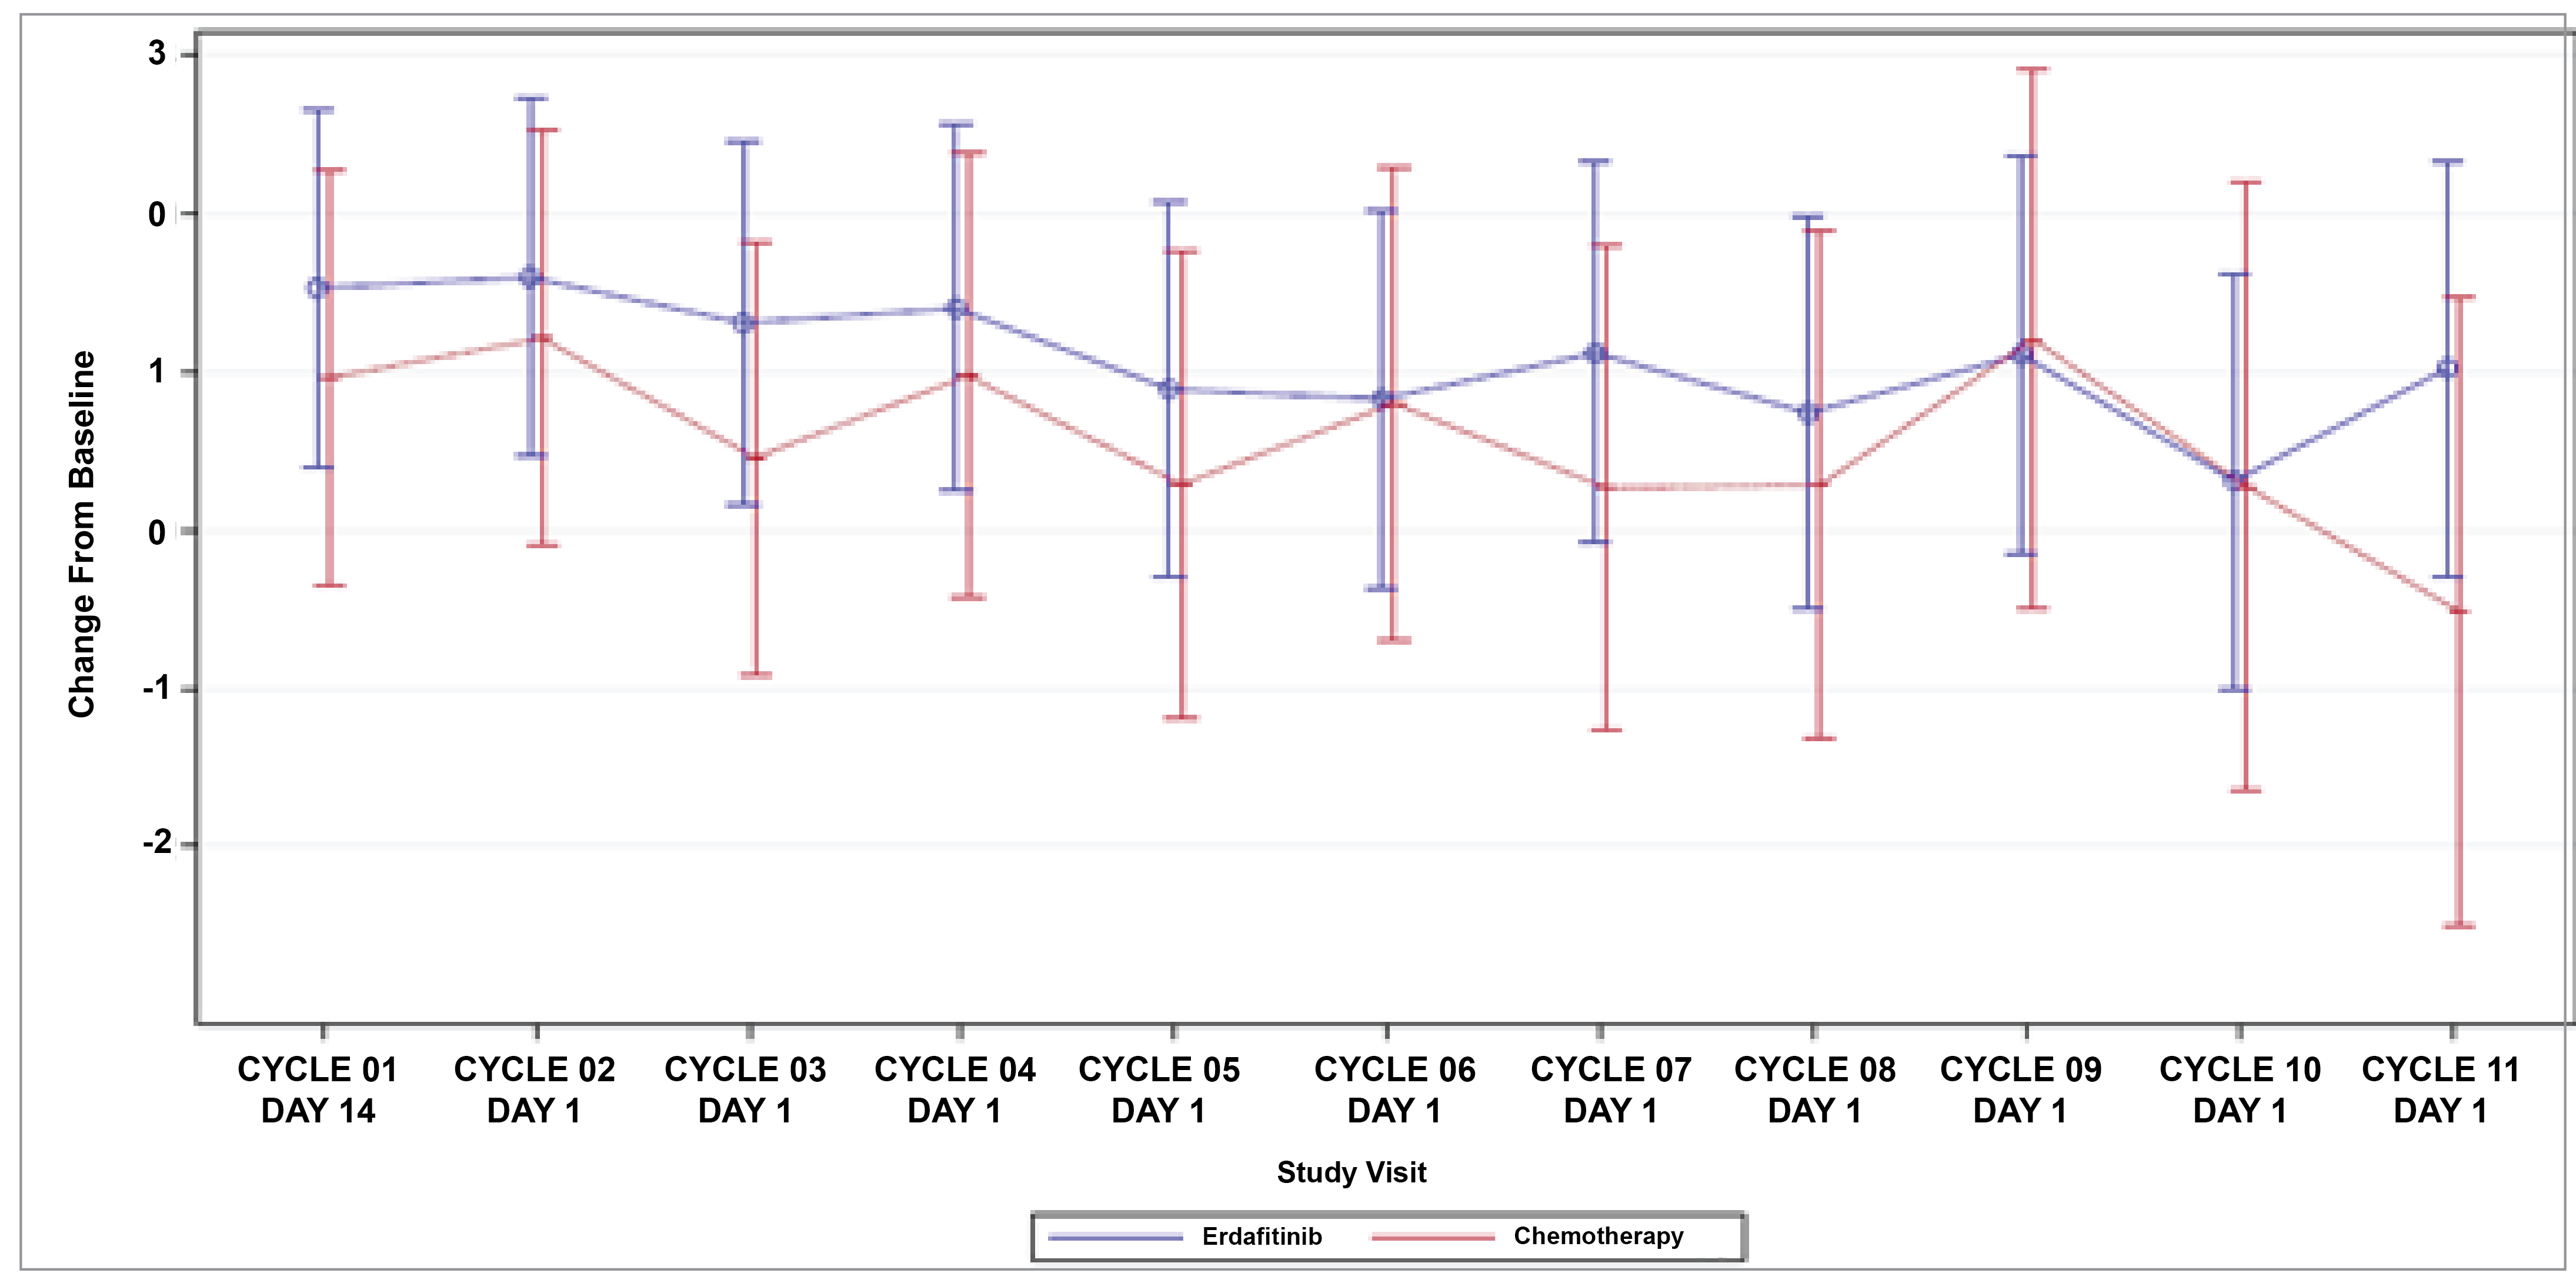
ECOG PS = Eastern Cooperative Oncology Group Performance Status; FACT-Bl = Functional Assessment of Cancer Therapy–Bladder; HRQoL = health-related quality of life; ITT = intention-to-treat; PRO = patient-reported outcome; SE = standard error.
Notes: The primary model includes treatment, time point (categorical), treatment-by-time interaction, baseline PRO score, region, ECOG PS, and disease distribution. The model includes all scheduled visits through cycle 11.
The FACT-Bl is a 39-item questionnaire, with 5-point Likert scales, covering 5 primary domains: physical well-being, social/family well-being, emotional well-being, functional well-being, and additional concerns for patients with bladder cancer. The higher the score, the better the quality of life.
Patients with available PROs data in the ITT population were used.
Source: 2023 Clinical Study Report for the THOR study, cohort 1.47
Figure 11: Mean Change (± SE) From Baseline on the FACT-Bl Functional Well-Being Domain for Patients in Cohort 1 of the THOR Trial (ITT Analysis Set; January 15, 2023, Clinical Cut-Off)
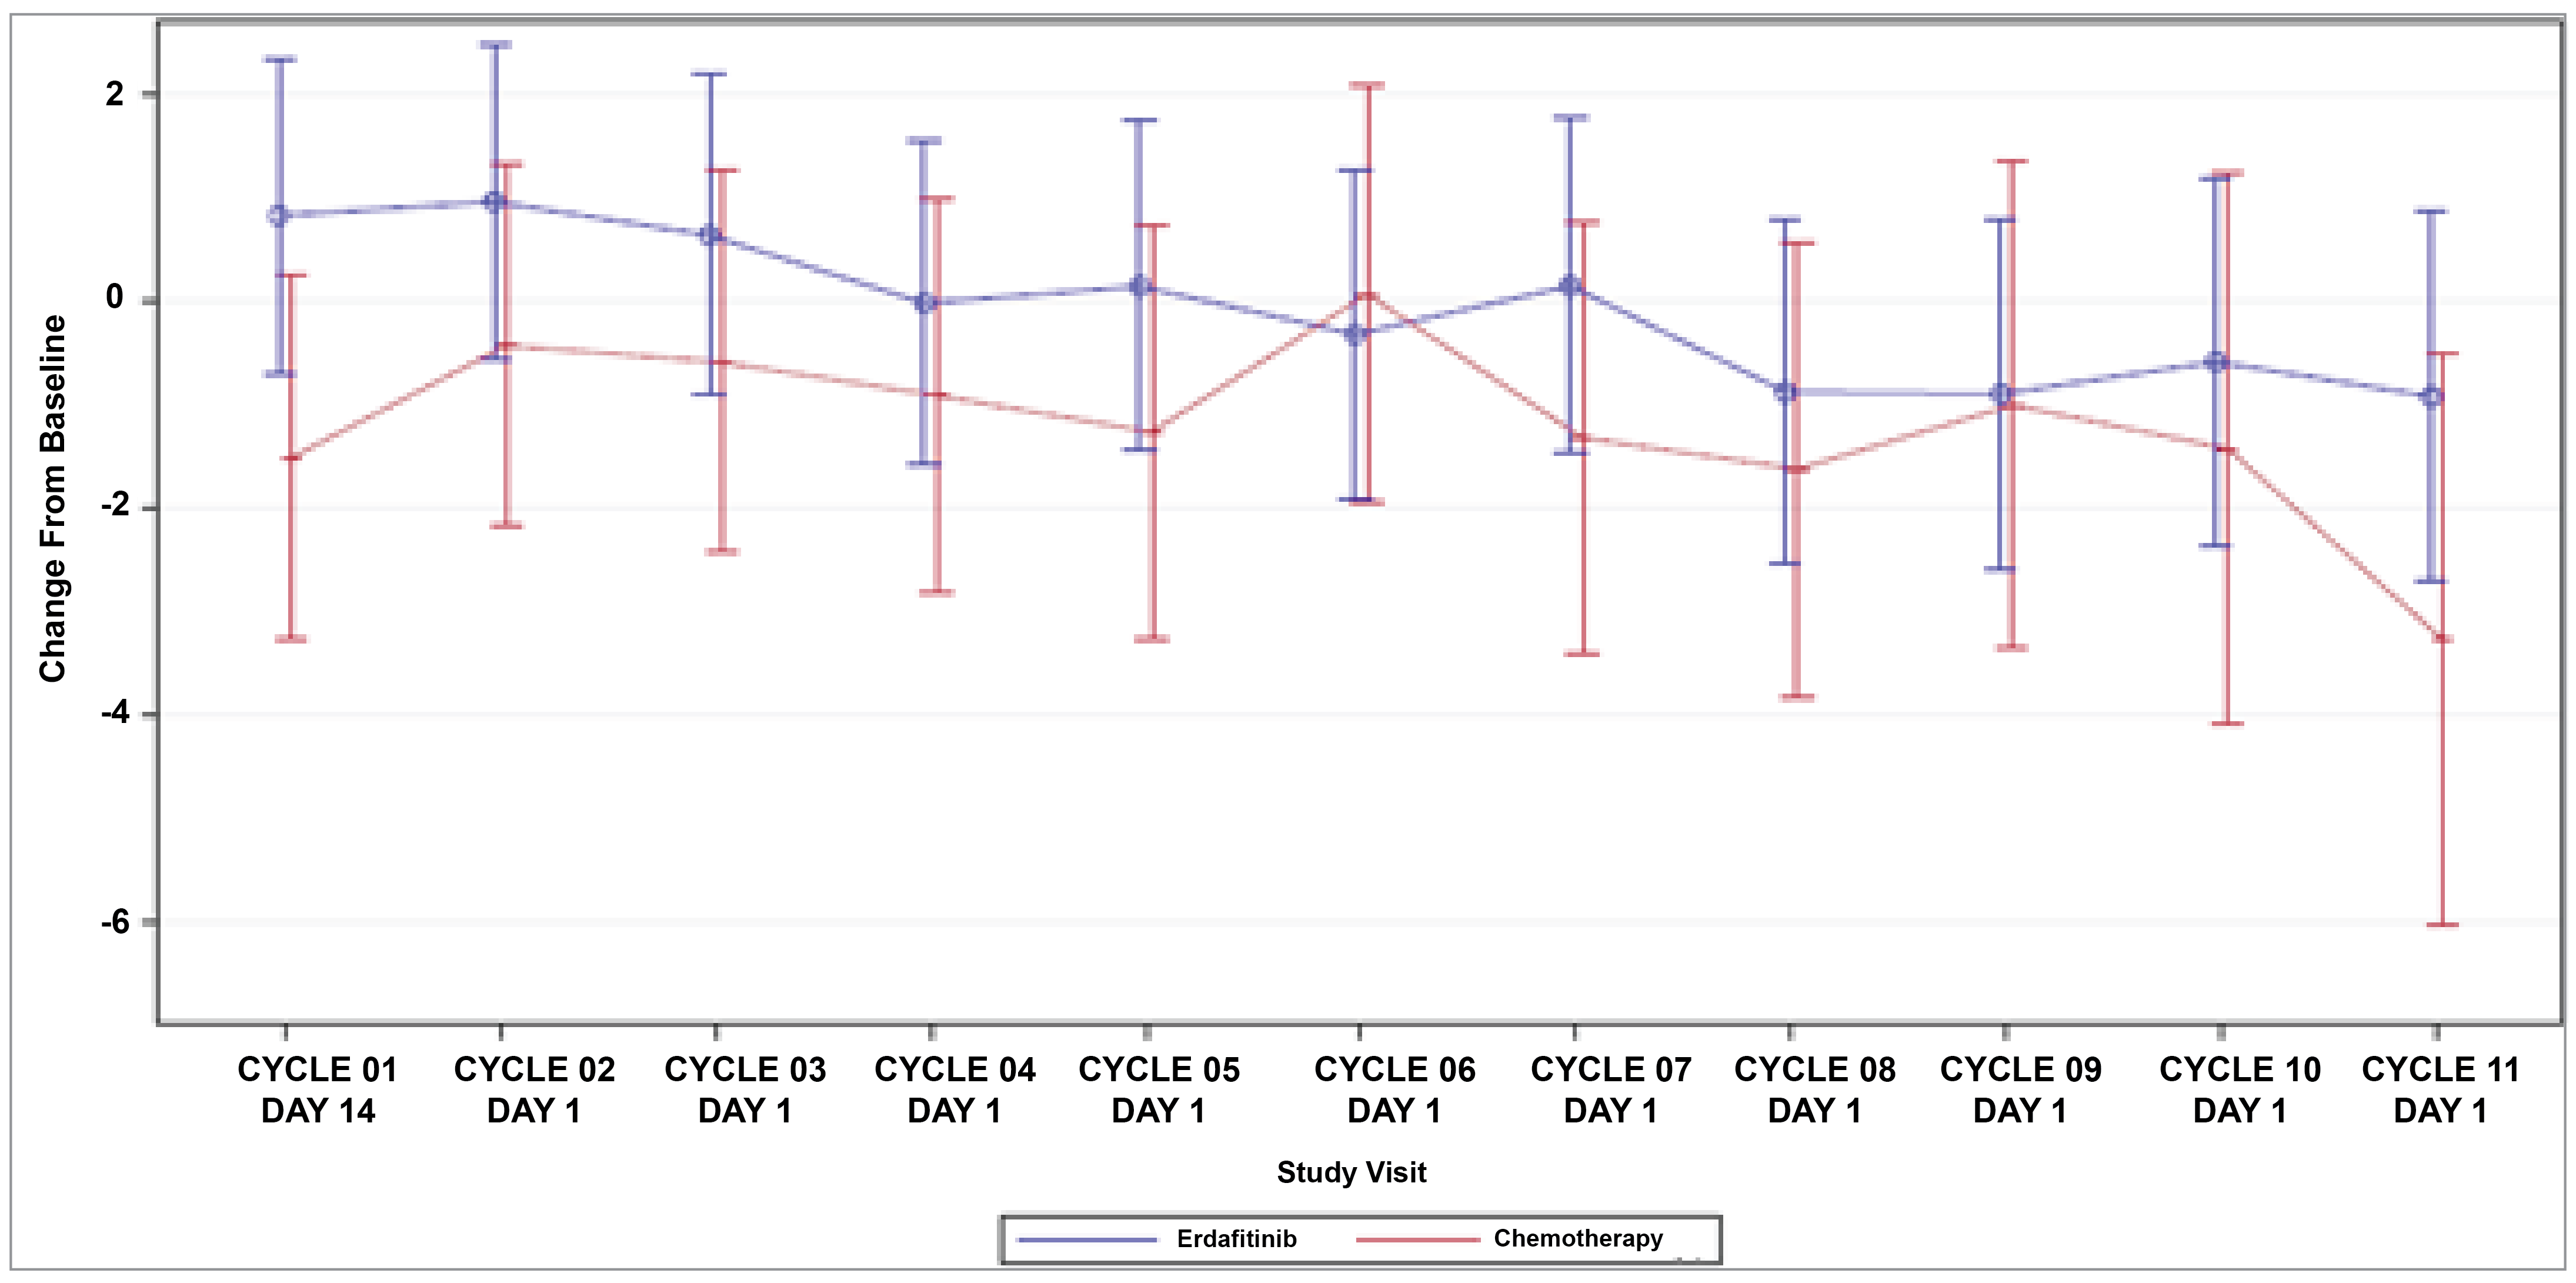
ECOG PS = Eastern Cooperative Oncology Group Performance Status; FACT-Bl = Functional Assessment of Cancer Therapy–Bladder; HRQoL = health-related quality of life; ITT = intention-to-treat; PRO = patient-reported outcome; SE = standard error.
Notes: The primary model includes treatment, time point (categorical), treatment-by-time interaction, baseline PRO score, region, ECOG PS, and disease distribution. The model includes all scheduled visits through cycle 11.
The FACT-Bl is a 39-item questionnaire, with 5-point Likert scales, covering 5 primary domains: physical well-being, social/family well-being, emotional well-being, functional well-being, and additional concerns for patients with bladder cancer. The higher the score, the better the quality of life.
Patients with available PROs data in the ITT population were used.
Source: 2023 Clinical Study Report for the THOR study, cohort 1.47
Figure 12: Mean Change (± SE) From Baseline on the FACT-Bl Bladder Cancer Symptoms Domain for Patients in Cohort 1 of the THOR Trial (ITT Analysis Set; January 15, 2023 Clinical Cut-Off)
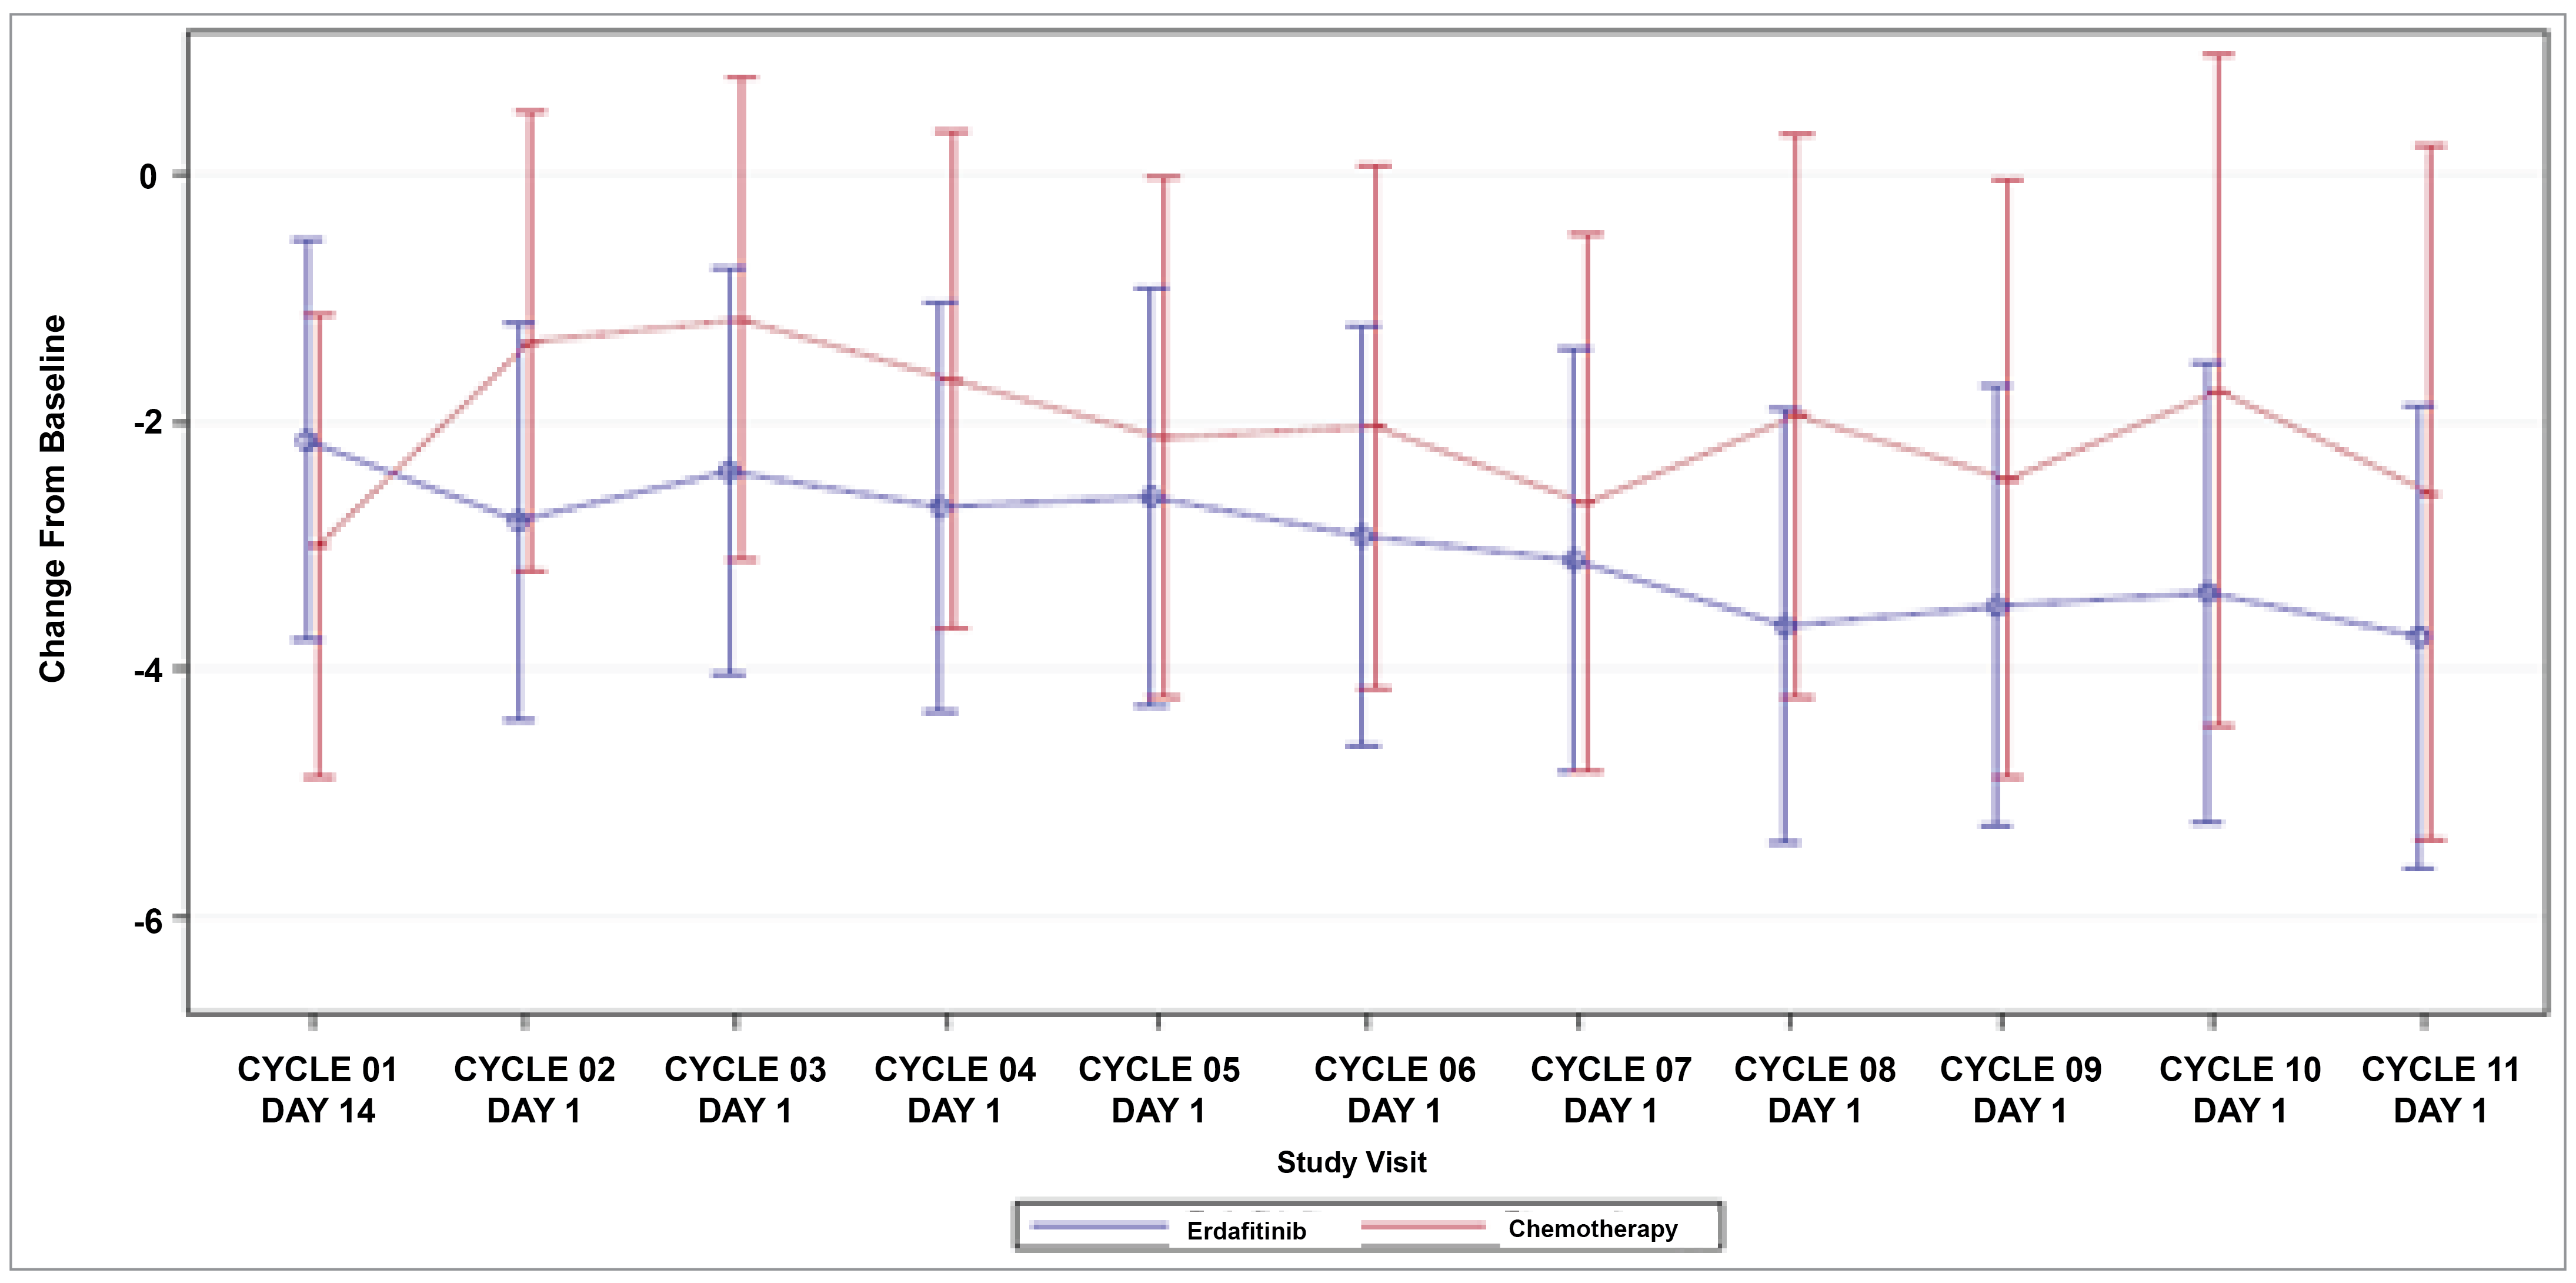
ECOG PS = Eastern Cooperative Oncology Group Performance Status; FACT-Bl = Functional Assessment of Cancer Therapy–Bladder; HRQoL = health-related quality of life; ITT = intention-to-treat; PRO = patient-reported outcome; SE = standard error.
Notes: The primary model includes treatment, time point (categorical), treatment-by-time interaction, baseline PRO score, region, ECOG PS, and disease distribution. The model includes all scheduled visits through cycle 11.
The FACT-Bl is a 39-item questionnaire, with 5-point Likert scales, covering 5 primary domains: physical well-being, social/family well-being, emotional well-being, functional well-being, and additional concerns for patients with bladder cancer. The higher the score, the better the quality of life.
Patients with available PROs data in the ITT population were used.
Source: 2023 Clinical Study Report for the THOR study, cohort 1.47
Figure 13: Mean Change (± SE) From Baseline on the FACT-Bl Trial Outcome Indexa for Patients in Cohort 1 of the THOR Trial (ITT Analysis Set; January 15, 2023 Clinical Cut-Off)
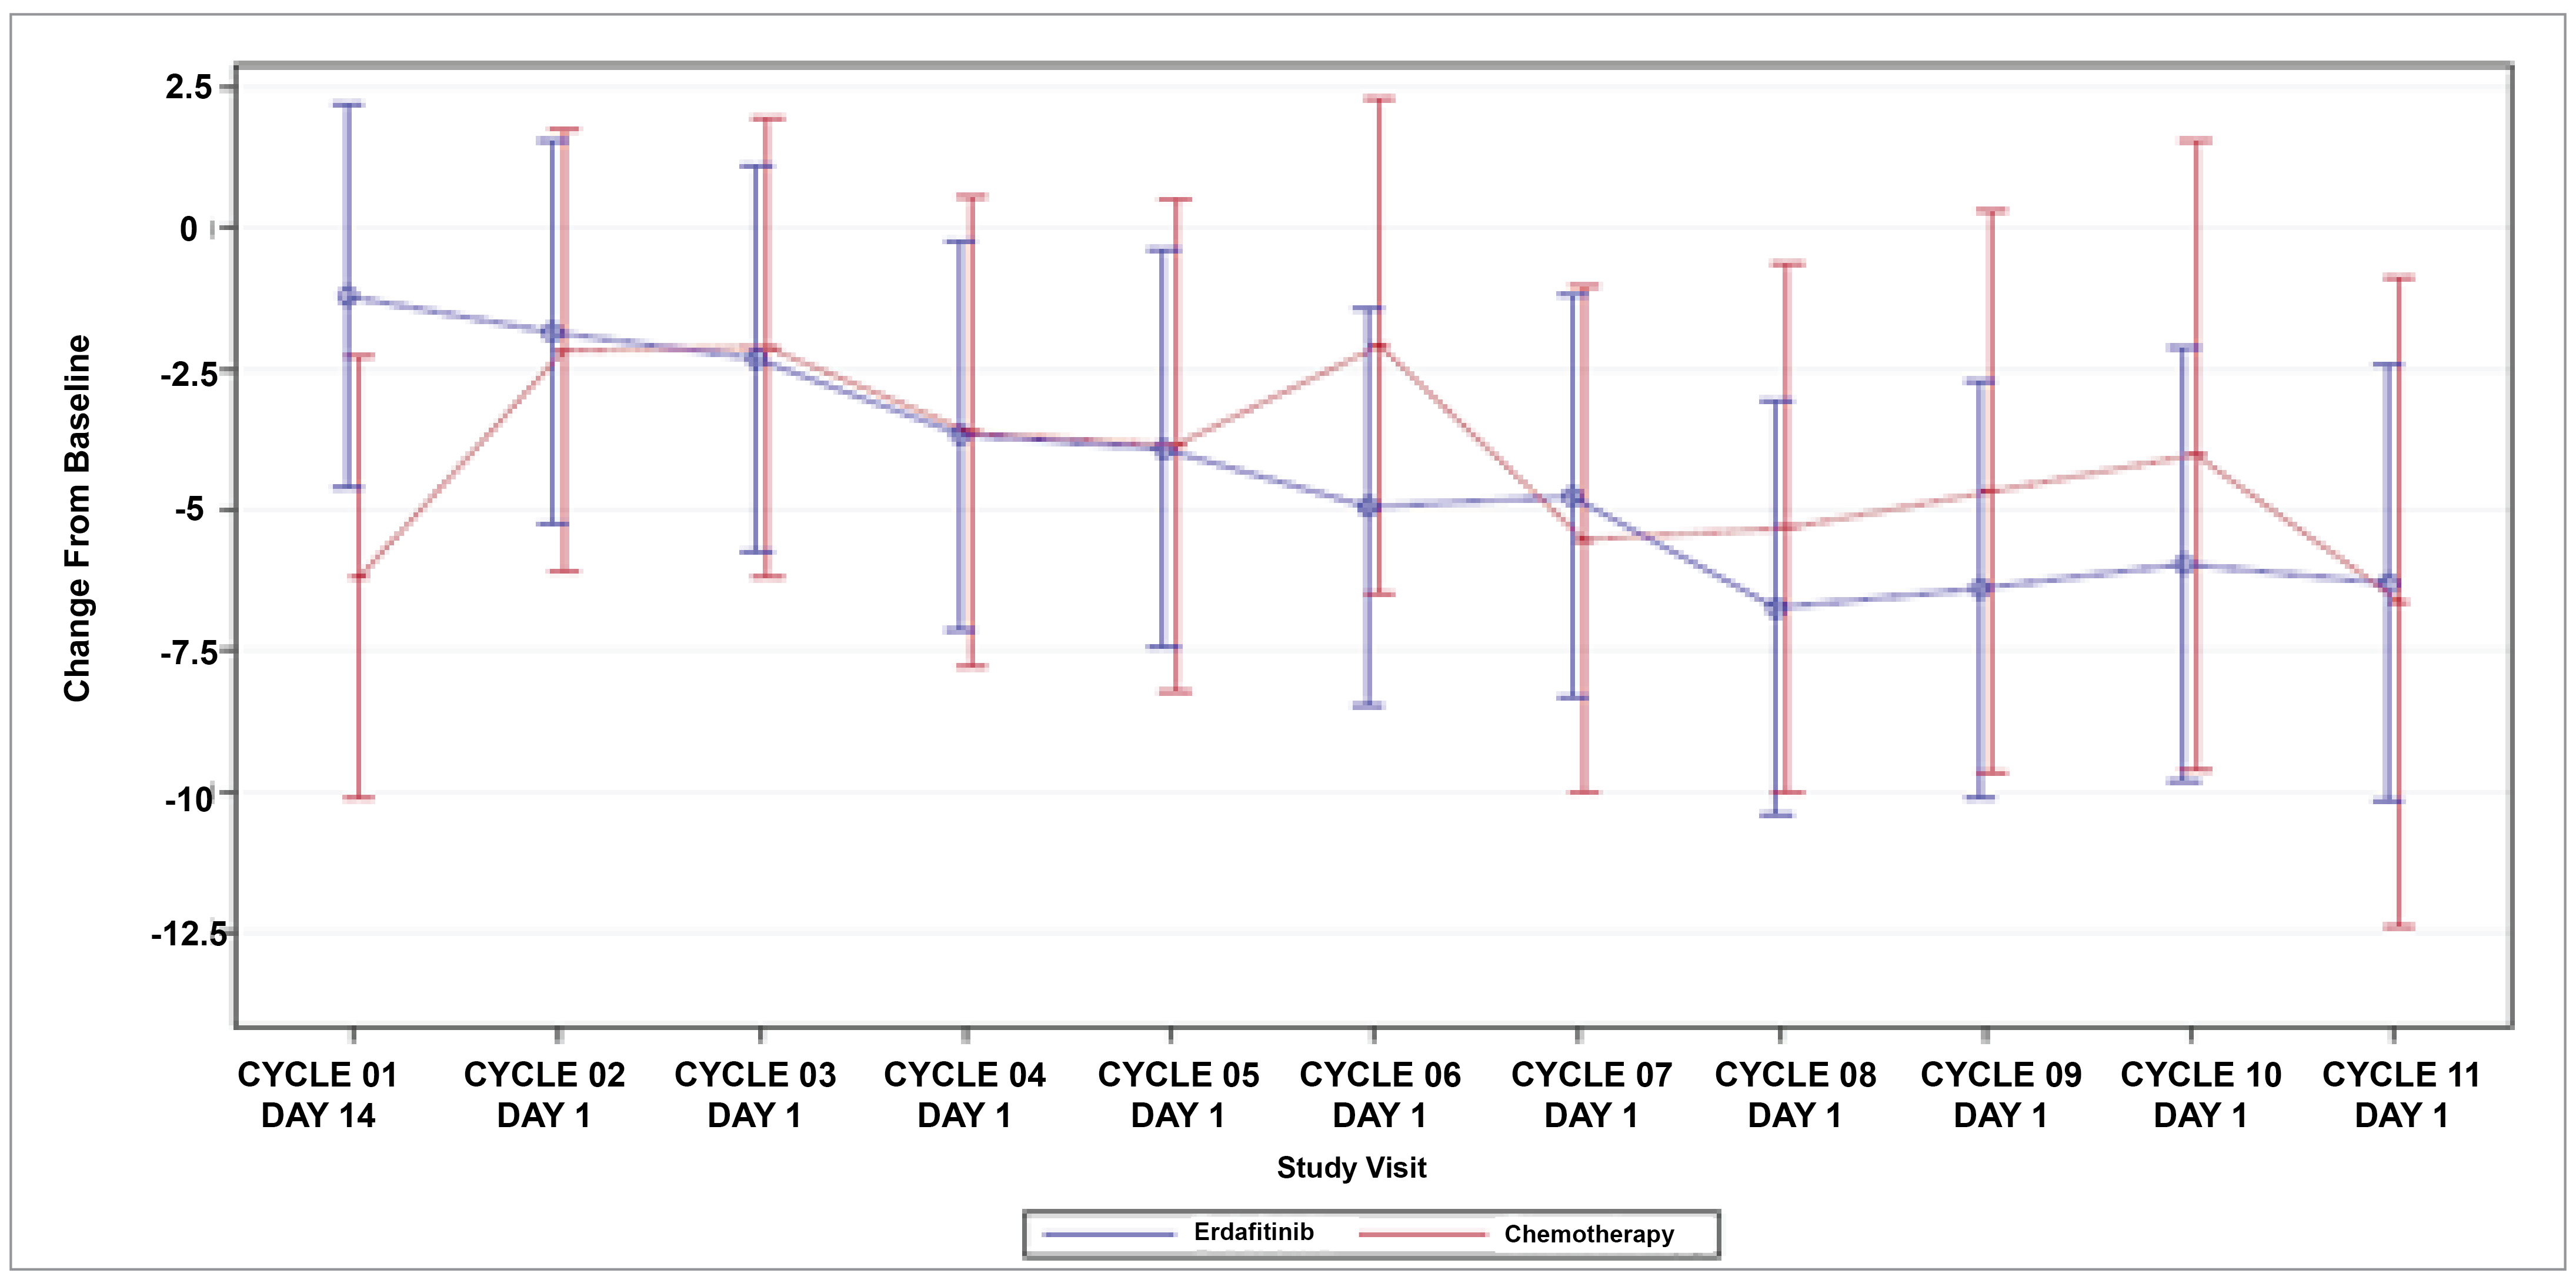
ECOG PS = Eastern Cooperative Oncology Group Performance Status; FACT-Bl = Functional Assessment of Cancer Therapy–Bladder; HRQoL = health-related quality of life; ITT = intention-to-treat; PRO = patient-reported outcome; SE = standard error.
Notes: The primary model includes treatment, time point (categorical), treatment-by-time interaction, baseline PRO score, region, ECOG PS, and disease distribution. The model includes all scheduled visits through cycle 11.
The FACT-Bl is a 39-item questionnaire, with 5-point Likert scales, covering 5 primary domains: physical well-being, social/family well-being, emotional well-being, functional well-being, and additional concerns for patients with bladder cancer. The higher the score, the better the quality of life.
Patients with available PROs data in the ITT population were used.
aThe FACT-Bl Trial Outcome Index is calculated as the sum of the physical well-being, functional well-being, and bladder cancer symptom scores.
Source: 2023 Clinical Study Report for the THOR study, cohort 1.47
Figure 14: Mean Change (± SE) From Baseline on the FACT-Bl and FACT-G Total Scorea for Patients in Cohort 1 of the THOR Trial (ITT Analysis Set; January 15, 2023 Clinical Cut-Off)
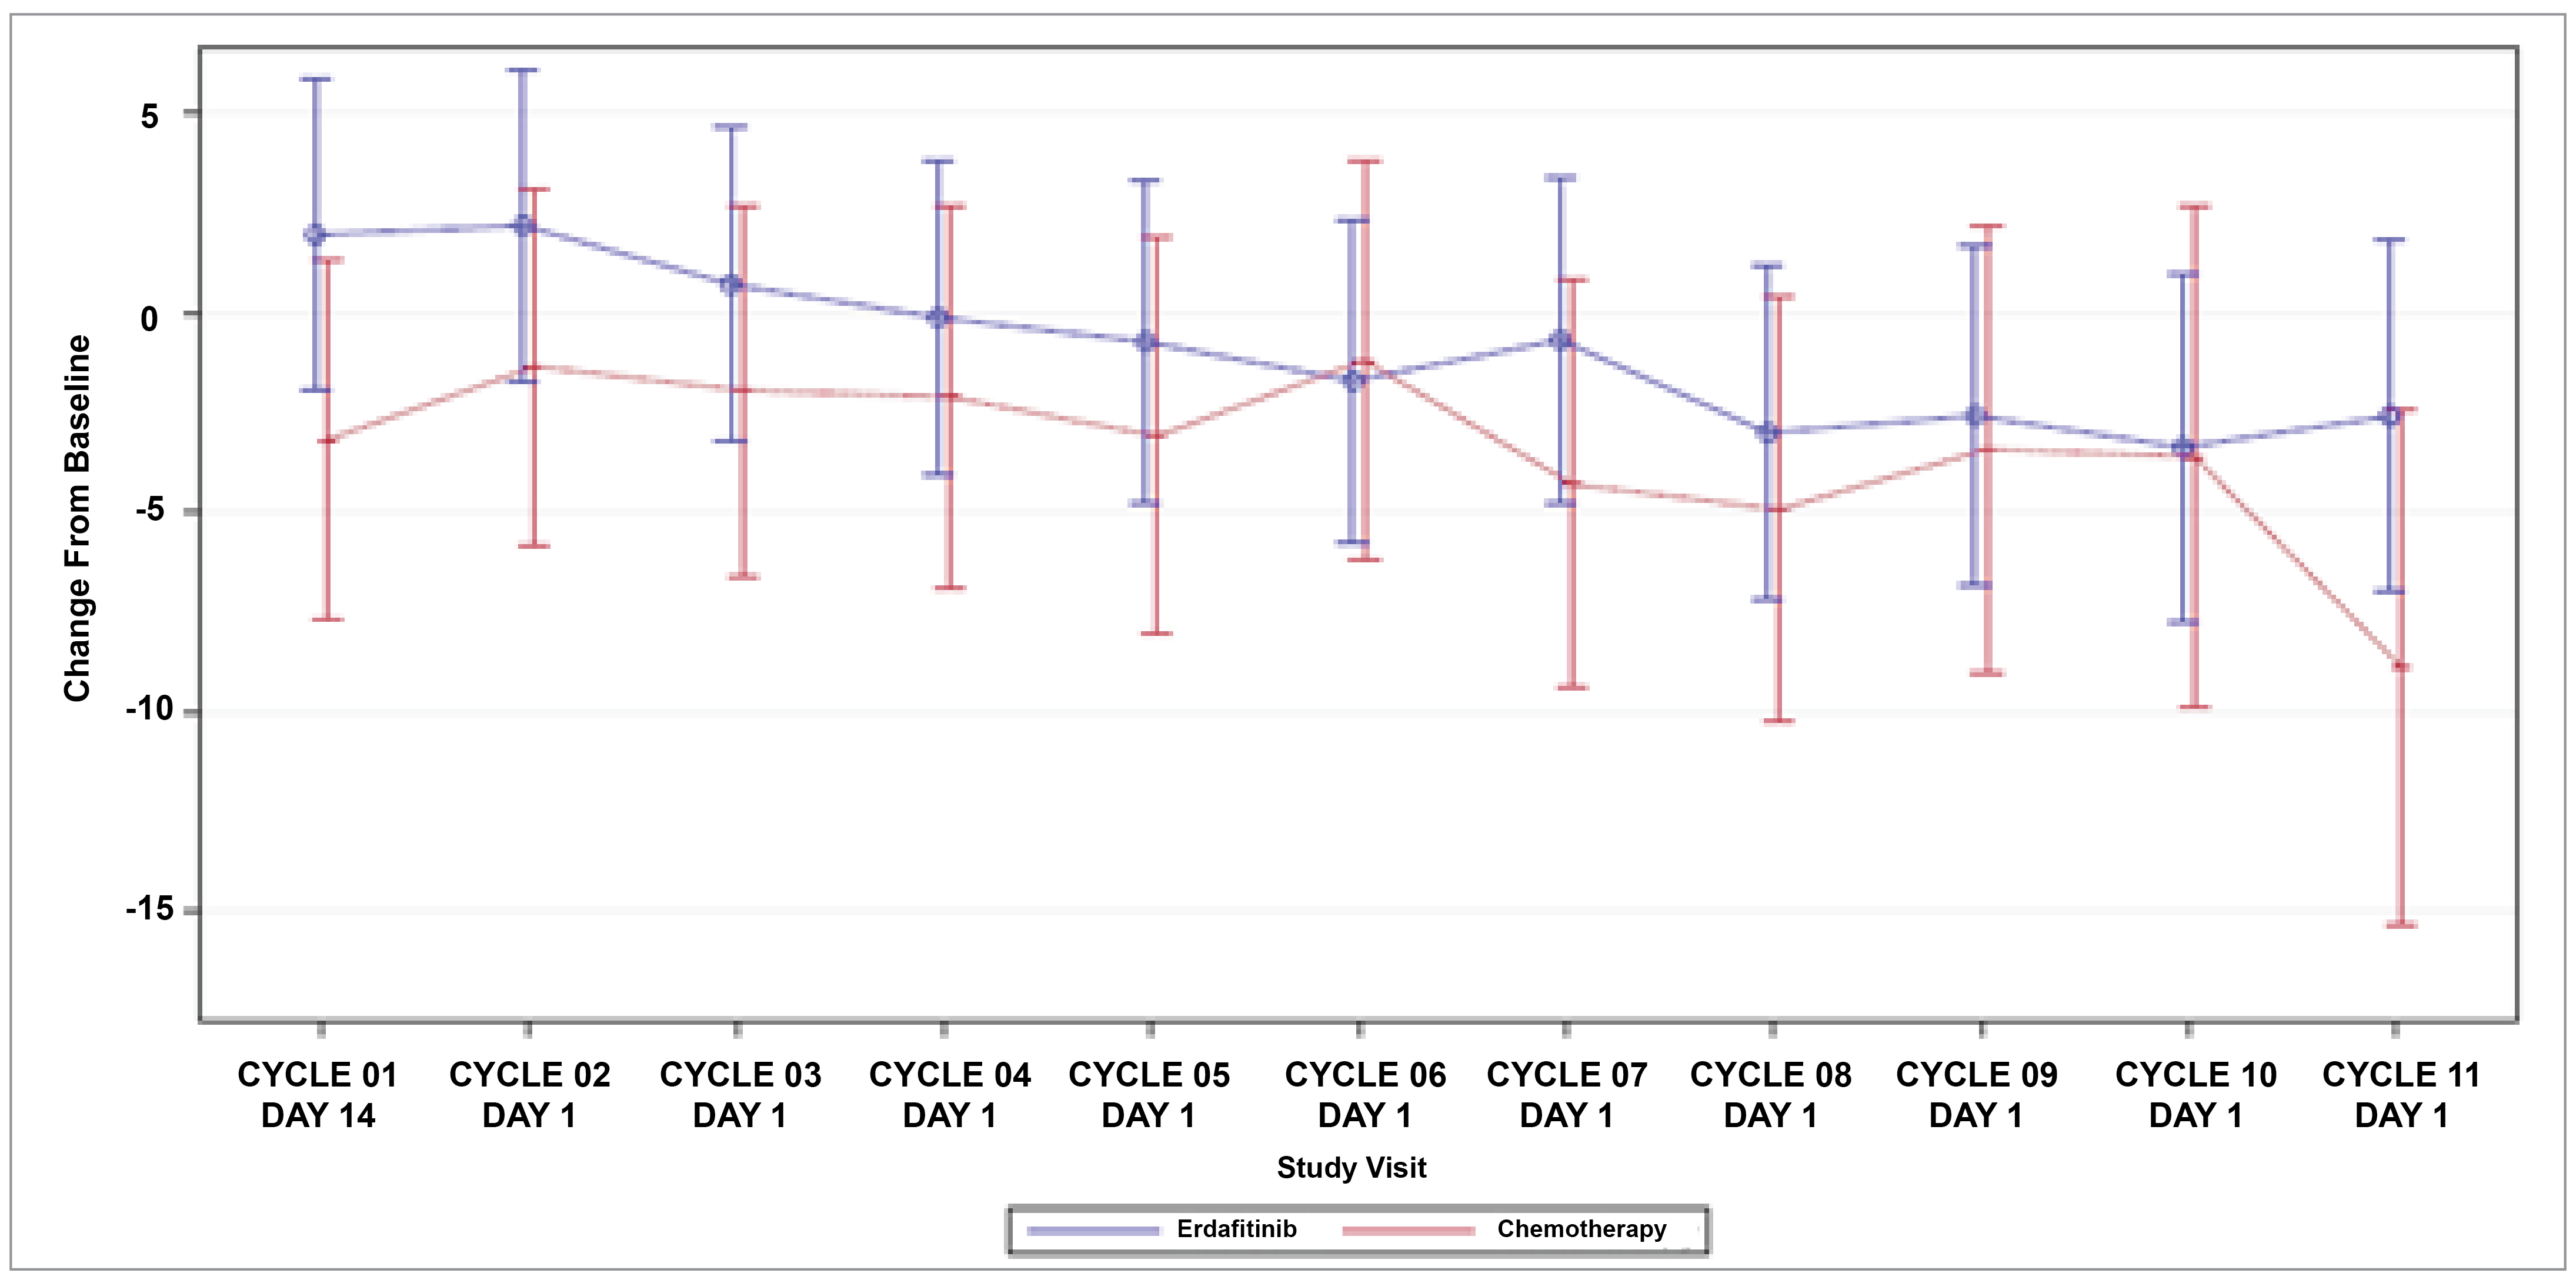
ECOG PS = Eastern Cooperative Oncology Group Performance Status; FACT-Bl = Functional Assessment of Cancer Therapy–Bladder; FACT-G = Functional Assessment of Cancer Therapy–General; HRQoL = health-related quality of life; ITT = intention-to-treat; PRO = patient-reported outcome; SE = standard error.
Notes: The primary model includes treatment, time point (categorical), treatment-by-time interaction, baseline PRO score, region, ECOG PS, and disease distribution. The model includes all scheduled visits through cycle 11.
The FACT-Bl is a 39-item questionnaire, with 5-point Likert scales, covering 5 primary domains: physical well-being, social/family well-being, emotional well-being, functional well-being, and additional concerns for patients with bladder cancer. The higher the score, the better the quality of life.
Patients with available PROs data in the ITT population were used.
aThe FACT-Bl and FACT-G total score is calculated as the sum of the physical well-being, social/family well-being, emotional well-being, functional well-being scores.
Source: 2023 Clinical Study Report for the THOR study, cohort 1.47
Figure 15: Mean Change (± SE) From Baseline on the FACT-Bl Total Scorea for Patients in Cohort 1 of the THOR Trial (ITT Analysis Set; January 15, 2023, Clinical Cut-Off)
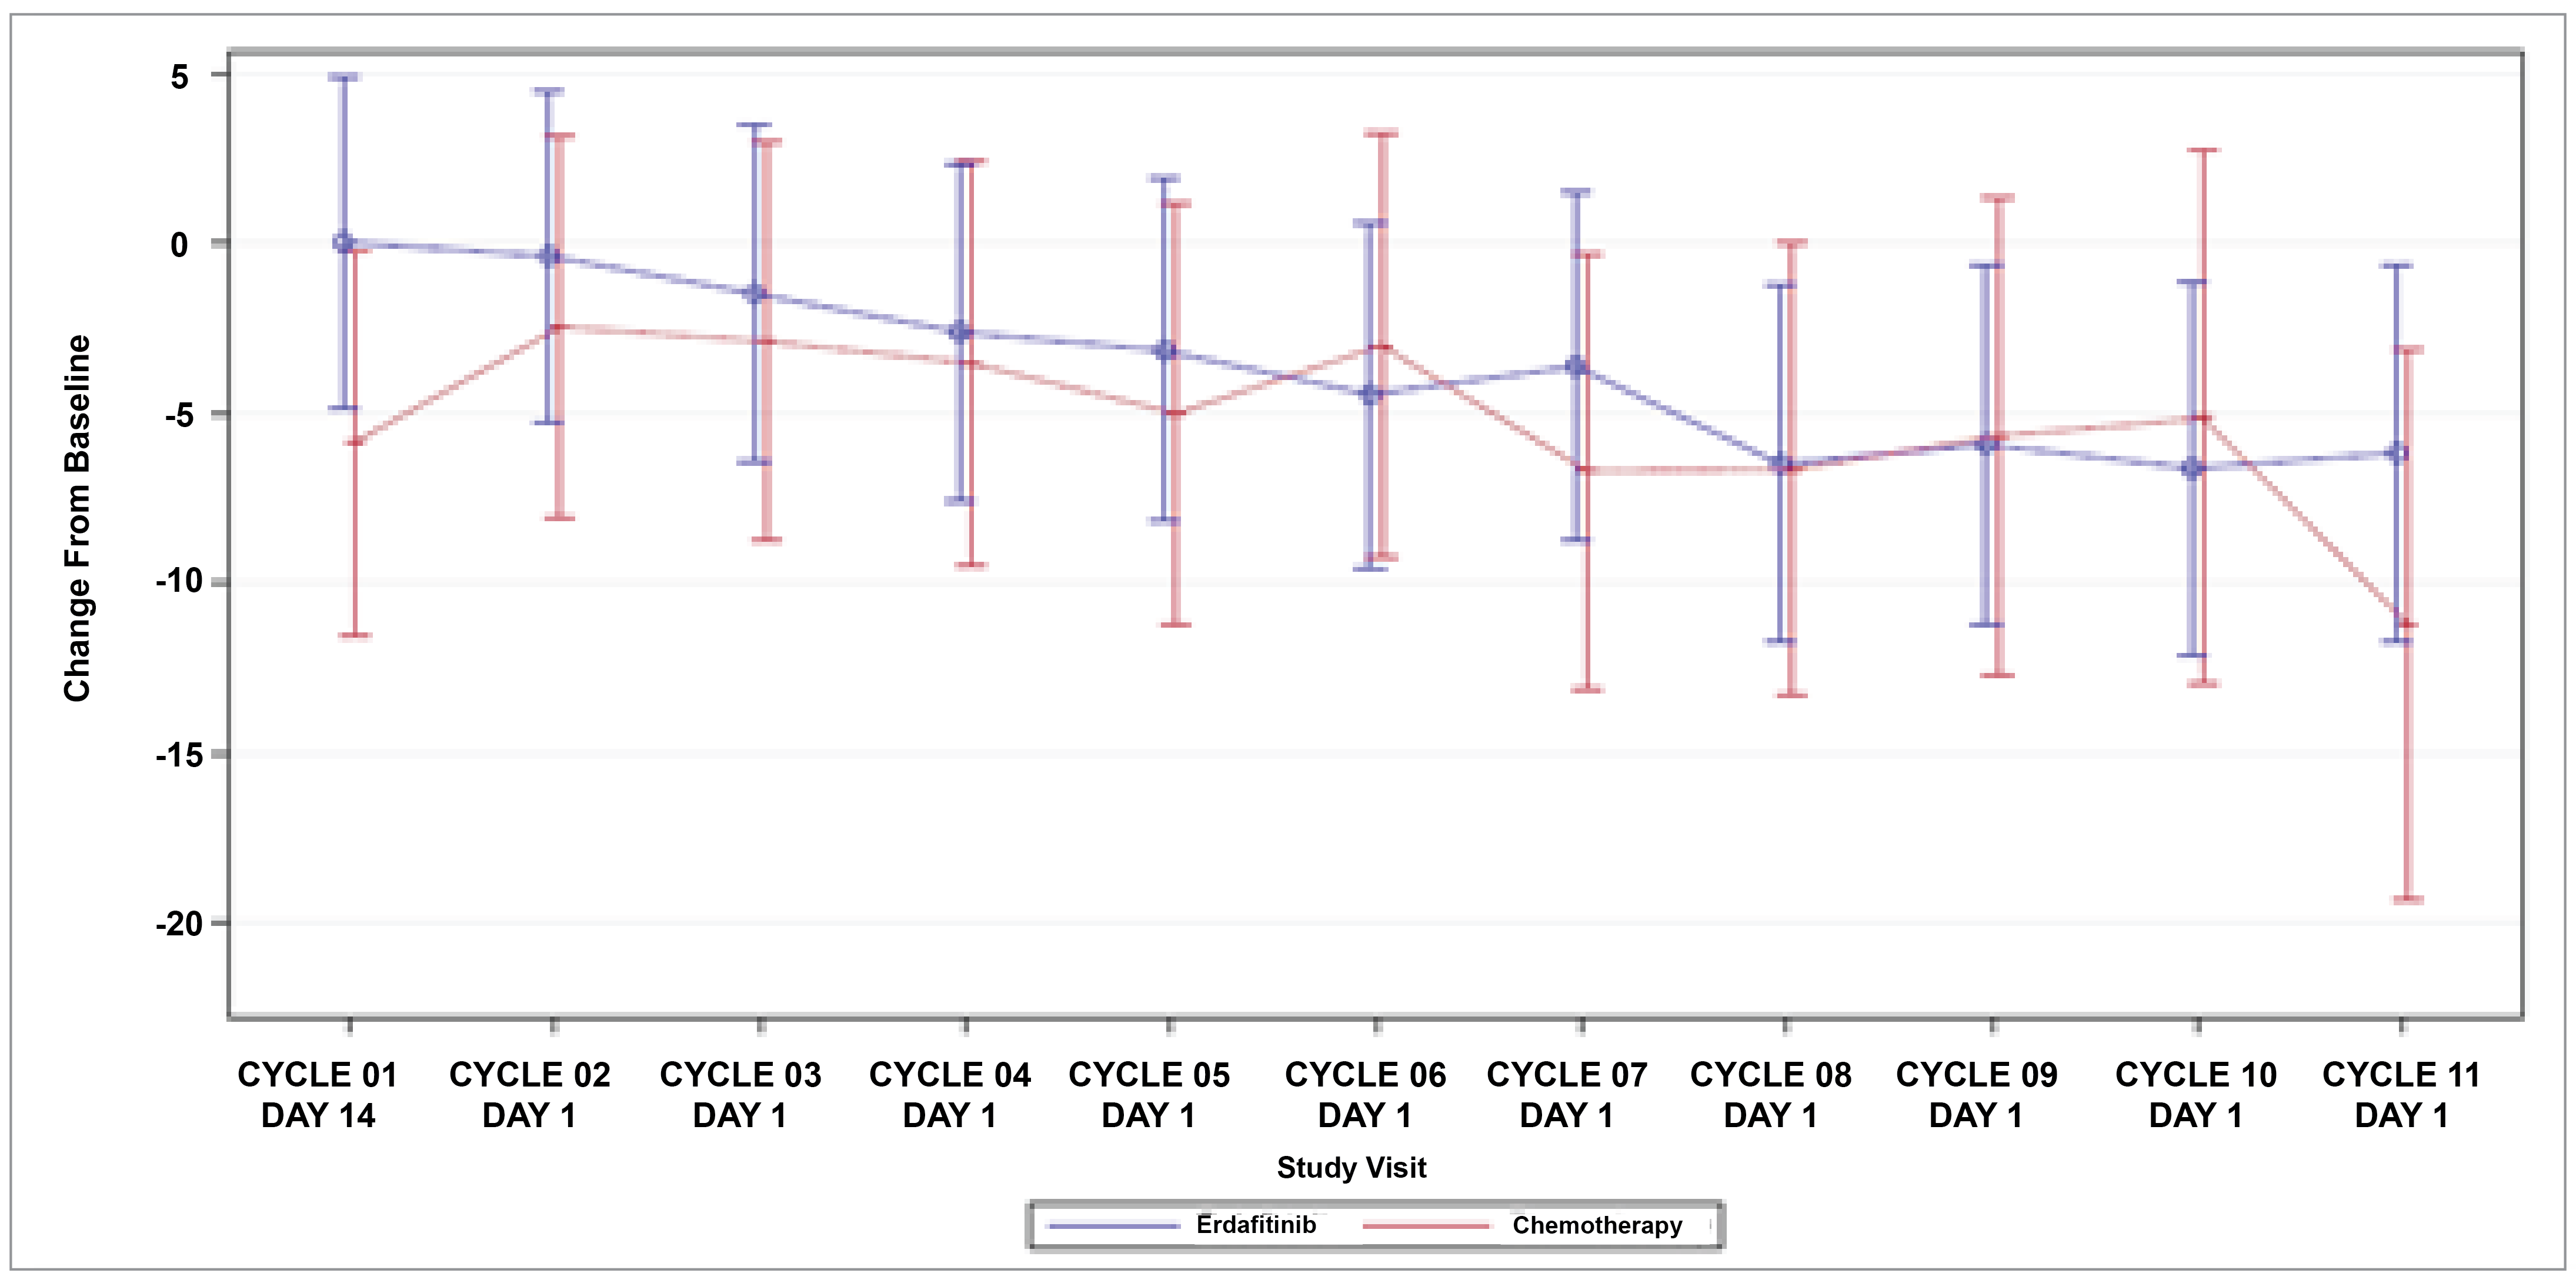
ECOG PS = Eastern Cooperative Oncology Group Performance Status; FACT-Bl = Functional Assessment of Cancer Therapy–Bladder; HRQoL = health-related quality of life; ITT = intention-to-treat; PRO = patient-reported outcome; SE = standard error.
Notes: The primary model includes treatment, time point (categorical), treatment-by-time interaction, baseline PRO score, region, ECOG PS, and disease distribution. The model includes all scheduled visits through cycle 11.
The FACT-Bl is a 39-item questionnaire, with 5-point Likert scales, covering 5 primary domains: physical well-being, social/family well-being, emotional well-being, functional well-being, and additional concerns for patients with bladder cancer. The higher the score, the better the quality of life.
Patients with available PROs data in the ITT population were used.
aThe FACT-Bl total score is calculated as the sum of the physical well-being, social/family well-being, emotional well-being, functional well-being, and bladder cancer symptom scores.
Source: 2023 Clinical Study Report for the THOR study, cohort 1.47
Change in Scores From Baseline Over Time for PGI-S
At cycle 1, day 1, 16.7% and 26.2% of patients in the erdafitinib treatment group reported disease severity as none or mild, respectively, whereas in the chemotherapy group, 28.3% and 23.6% of patients reported disease severity as none or mild, respectively. As treatment progressed, the overall proportion of patients who reported disease severity as none or mild decreased in both treatment groups. By the end of treatment, 16.7% and 18.5% of patients in the erdafitinib treatment group, and 20.7% and 29.3% of patients in the chemotherapy group, reported disease severity as none or mild, respectively (Table 19).
Table 19: Proportion of Responses on the PGI-S (All-Treated Analysis Set; January 15, 2023, Clinical Cut-Off)
Variable | THOR trial, cohort 1 | ||
|---|---|---|---|
Erdafitinib | Chemotherapy | Total | |
Severity | |||
Cycle 1, day 1 | |||
N | 126 | 106 | 232 |
None, n (%) | 21 (16.7) | 30 (28.3) | 51 (22.0) |
Mild, n (%) | 33 (26.2) | 25 (23.6) | 58 (25.0) |
Moderate, n (%) | 47 (37.3) | 31 (29.2) | 78 (33.6) |
Severe, n (%) | 22 (17.5) | 15 (14.2) | 37 (15.9) |
Very severe, n (%) | 3 (2.4) | 5 (4.7) | 8 (3.4) |
End of treatment | |||
N | 54 | 58 | 112 |
None, n (%) | 9 (16.7) | 12 (20.7) | 21 (18.8) |
Mild, n (%) | 10 (18.5) | 17 (29.3) | 27 (24.1) |
Moderate, n (%) | 17 (31.5) | 17 (29.3) | 34 (30.4) |
Severe, n (%) | 15 (27.8) | 11 (19.0) | 26 (23.2) |
Very severe, n (%) | 3 (5.6) | 1 (1.7) | 4 (3.6) |
PGI-S = Patient Global Impression of Severity.
Source: 2023 Clinical Study Report for the THOR study, cohort 1.47
Change in Scores From Baseline Over Time for EQ-5D-5L
Baseline scores for the EQ-5D-5L health utility index and visual analogue scale assessment were similar across treatment groups. Results showed that general HRQoL and overall health status were maintained on treatment for patients in each treatment arm without evidence of a difference between them, with the caveat that few patients completed both baseline and follow-up assessments routinely, so the models were underpowered to find any differences. HRQoL and overall health status were generally similar in both treatment arms over the course of the study (Figure 16 and Figure 17).
Figure 16: Mean Change (± SE) From Baseline on the EQ-5D-5L Health Utility Score VAS Score Domain for Patients in Cohort 1 of the THOR Trial (ITT Analysis Set; January 15, 2023 Clinical Cut-Off)
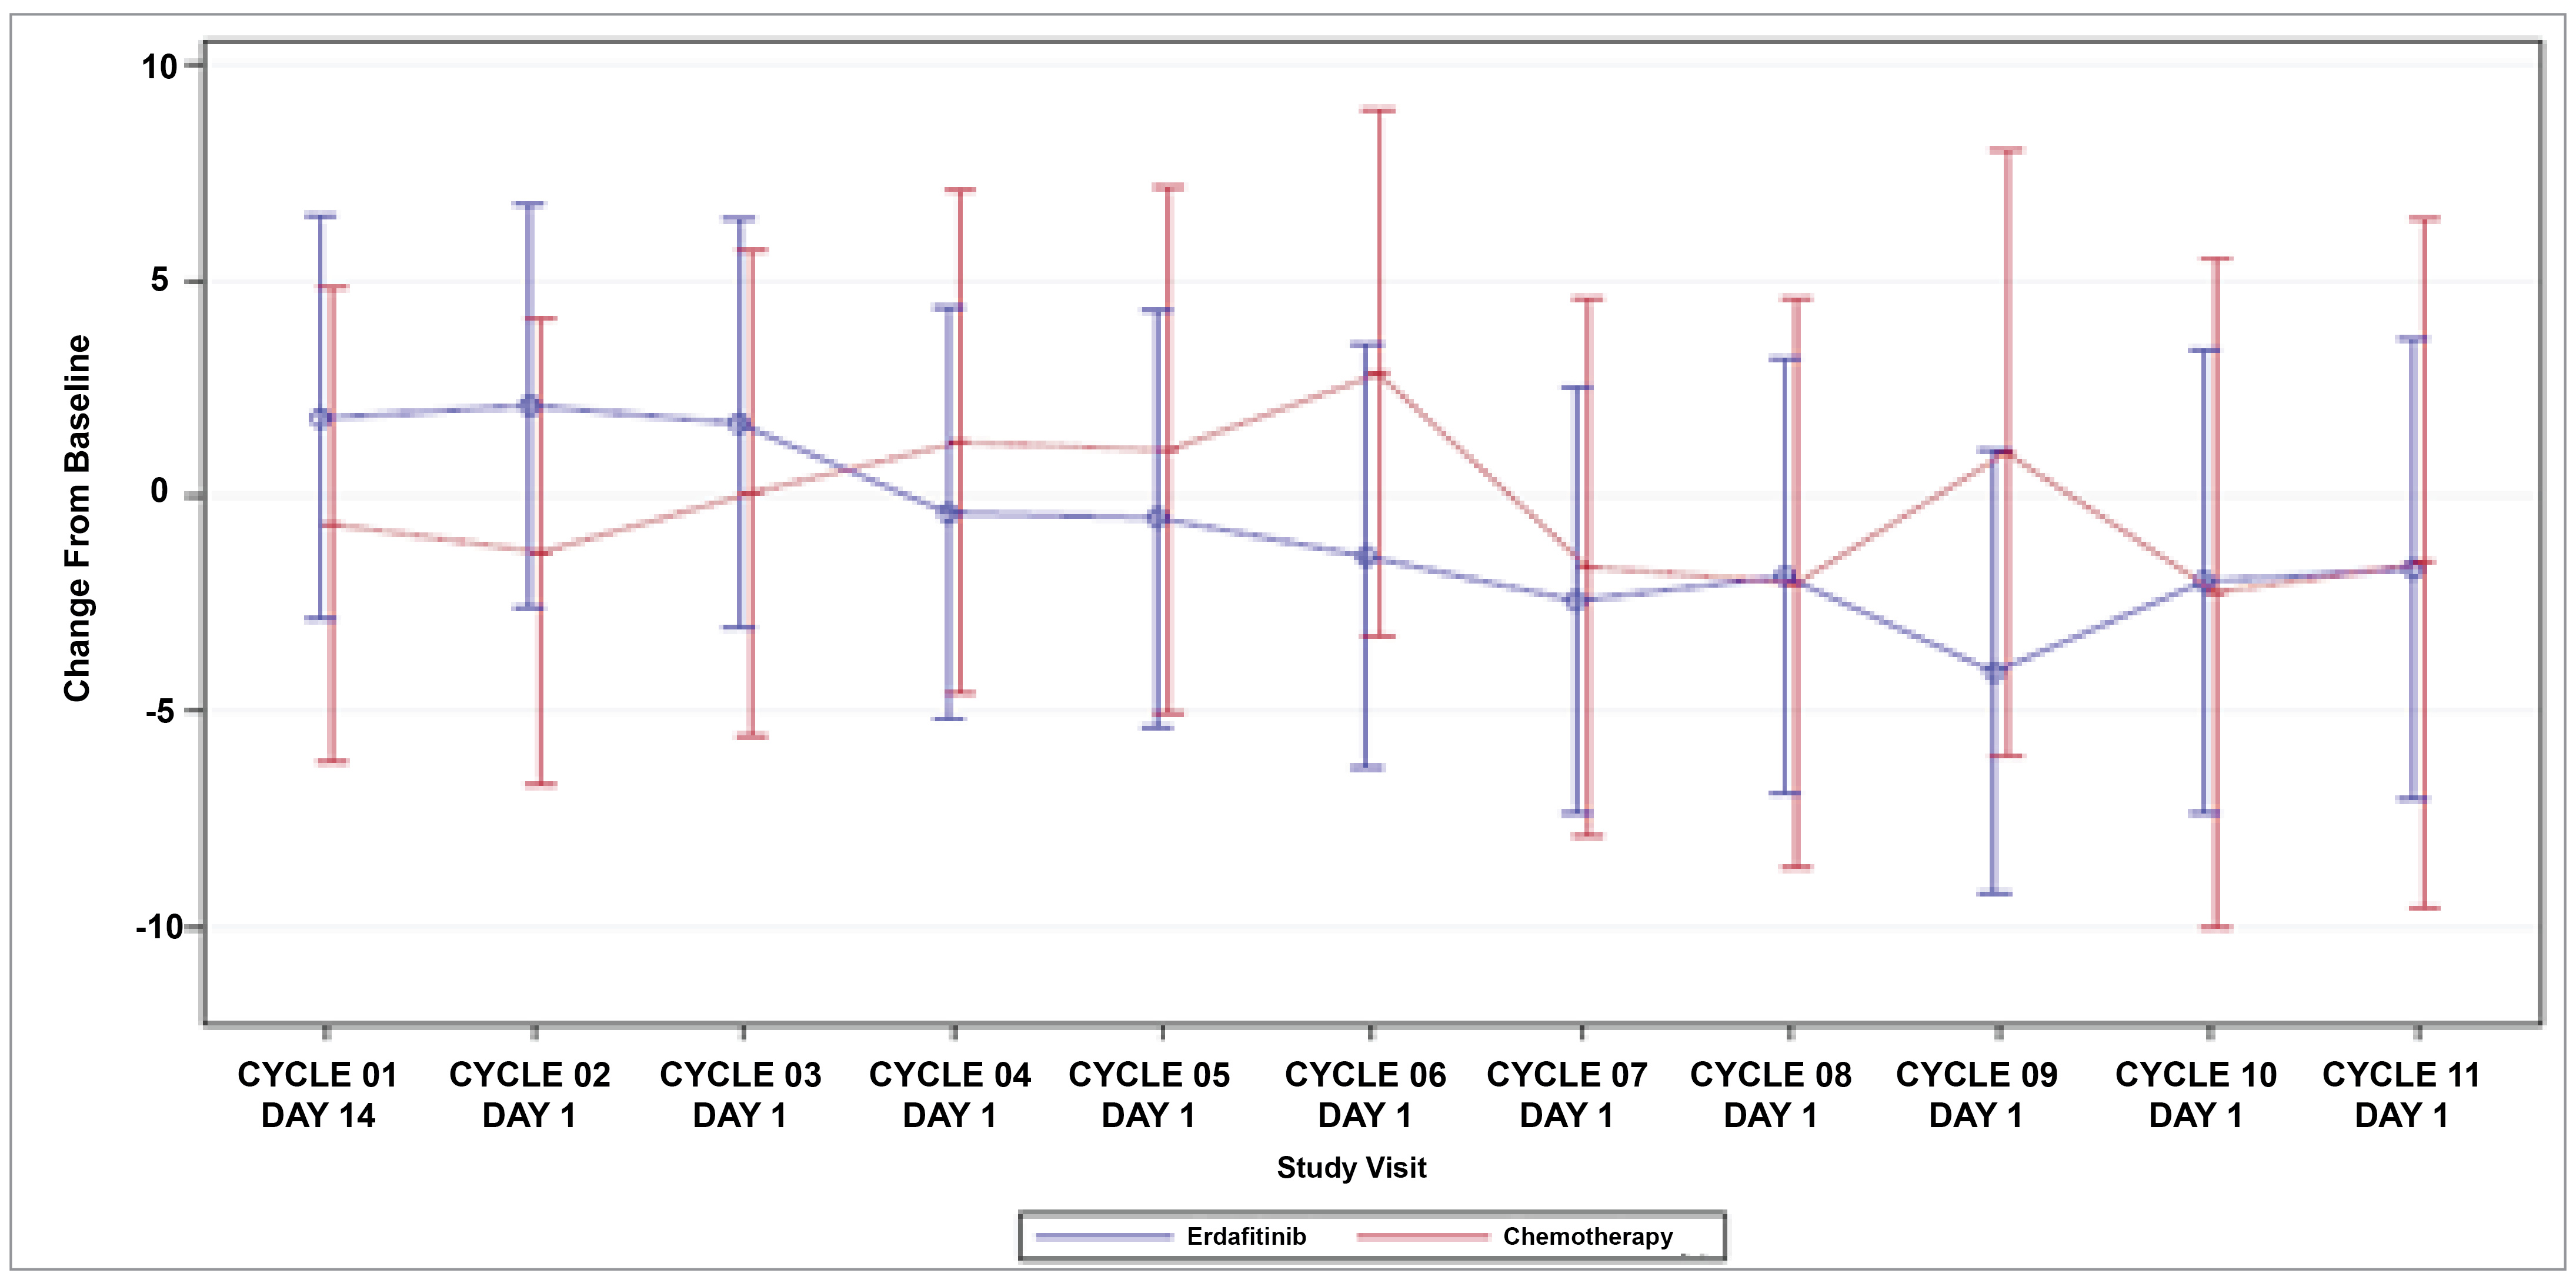
ECOG PS = Eastern Cooperative Oncology Group Performance Status; HRQoL = health-related quality of life; ITT = intention-to-treat; PRO = patient-reported outcome; SE = standard error; VAS = visual analogue scale.
Notes: The primary model includes treatment, time point (categorical), treatment-by-time interaction, baseline PRO score, region, ECOG PS, and disease distribution. The model includes all scheduled visits through cycle 11.
The EQ-5D-5L is a generic health measure that consists of 5 items covering 5 domains, with lower scores indicating better quality of life. A health utility score is also calculated, with values anchored at 0 (a state as bad as being dead) and 1 (full health).
Patients with available PROs data in the ITT population were used.
Source: 2023 Clinical Study Report for the THOR study, cohort 1.47
Harms
The safety of erdafitinib and chemotherapy in the THOR trial were assessed in the safety analysis set. Safety was measured with a monitoring medical review of AE reports and the results of vital sign measurements, electrocardiograms, physical examinations, clinical laboratory tests, ECOG PS, ophthalmologic examinations, Amsler grid test, and other safety evaluations at specified time points. The baseline value for safety assessment was defined as the value collected at the time closest to, but before, administration of the first dose of the study drug. In instances where there were multiple records at a given visit date for lab parameters associated with disease assessment, the most recent lab value was selected as the unique lab value for analysis.
AEs are those considered in the trial to be treatment-emergent adverse events (TEAEs), which were coded in accordance with the Medical Dictionary for Regulatory Activities (MedDRA), version 24.1, using the lower-level term as the description most closely related to the investigator’s terminology, a preferred term describing a group of closely related lower-level terms, and the system organ class, which is the broad category that includes related preferred terms. The severity of all AEs was graded in accordance with the National Cancer Institute Common Terminology Criteria for Adverse Events, version 4.03.
Figure 17: Mean Change (± SE) From Baseline on the EQ-5D-5L Health Utility Score Health Utilities Index Domain for Patients in Cohort 1 of the THOR Trial (ITT Analysis Set; January 15, 2023, Clinical Cut-Off)
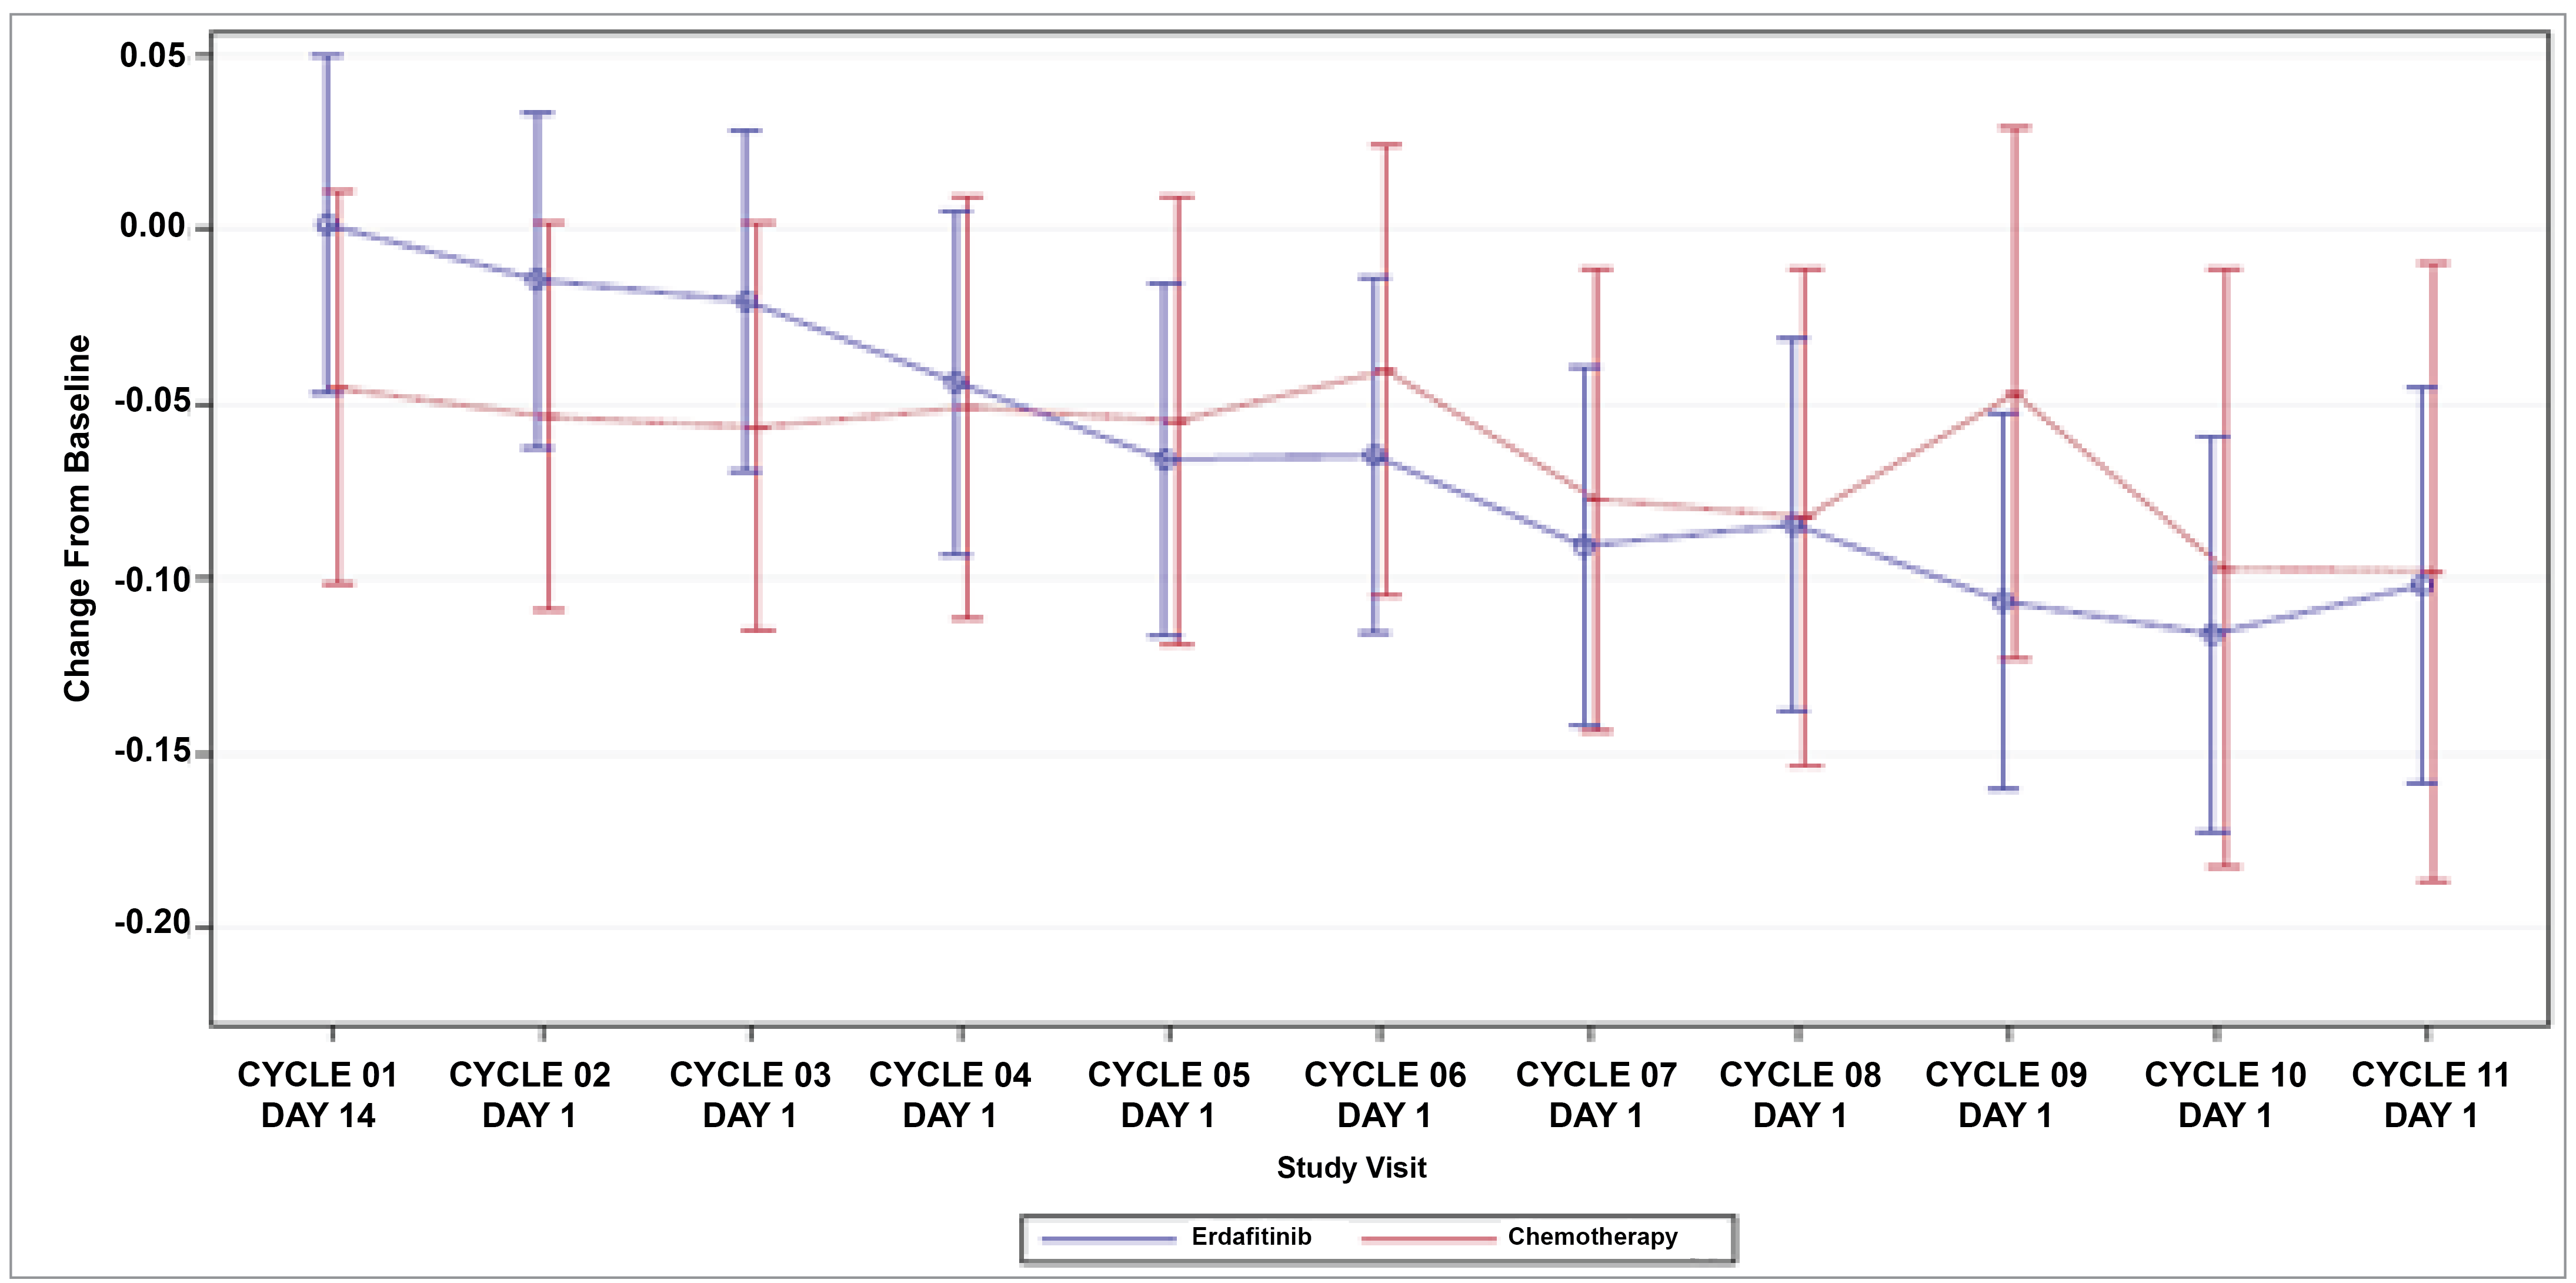
ECOG PS = Eastern Cooperative Oncology Group Performance Status; HRQoL = health-related quality of life; ITT = intention-to-treat; PRO = patient-reported outcome; SE = standard error.
Notes: The primary model includes treatment, time point (categorical), treatment-by-time interaction, baseline PRO score, region, ECOG PS, and disease distribution. The model includes all scheduled visits through cycle 11.
The EQ-5D-5L is a generic health measure that consists of 5 items covering 5 domains, with lower scores indicating better quality of life. A health utility score is also calculated, with values anchored at 0 (a state as bad as being dead) and 1 (full health).
Patients with available PROs data in the ITT population were used.
Source: 2023 Clinical Study Report for the THOR study, cohort 1.47
Adverse Events
At least 1 AE was experienced by 133 of 135 patients (98.5%) in the erdafitinib group. The most frequently reported AEs by preferred term, reported by at least 10% of patients in the erdafitinib group, were hyperphosphatemia (80.0%), diarrhea (62.2%), and stomatitis (48.1%), as depicted in Table 20, Table 21, and Table 22.
In the chemotherapy group, at least 1 AE was experienced by 109 of 112 patients (97.3%). The most frequently reported AEs by preferred term, reported by at least 10% of patients in the chemotherapy group, were anemia (32.1%), constipation (27.7%), and asthenia (25.0%).
Grade 3 to Grade 4 AEs
A total of 85 of 135 patients (63.0%) in the erdafitinib group and 72 of 112 patients (64.3%) in the chemotherapy group experienced at least 1 grade 3 or grade 4 AE. Grade 3 and grade 4 blood system AEs were more common in the chemotherapy group, and no patients in the erdafitinib group experienced neutropenia, febrile neutropenia, or leukopenia.
Table 20: Summary of AEs in Cohort 1 of the THOR Trial (Safety Analysis Set; January 15, 2023, Clinical Cut-Off)
Variable | THOR trial, cohort 1 | ||
|---|---|---|---|
Erdafitinib | Chemotherapy | Total | |
Analysis set: Safety | 135 | 112 | 247 |
Patients with 1 or more AEs, n (%) | 133 (98.5) | 109 (97.3) | 242 (98.0) |
Patients with 1 or more grade 3 or 4 AEs, n (%) | 85 (63.0) | 72 (64.3) | 157 (63.6) |
AEs with an incidence of ≥ 10% in any treatment group, n (%) | |||
System organ class and/or preferred term | |||
Gastrointestinal disorders | 126 (93.3) | 71 (63.4) | 197 (79.8) |
Diarrhea | 84 (62.2) | 19 (17.0) | 103 (41.7) |
Stomatitis | 65 (48.1) | 14 (12.5) | 79 (32.0) |
Constipation | 36 (26.7) | 31 (27.7) | 67 (27.1) |
Dry mouth | 53 (39.3) | 4 (3.6) | 57 (23.1) |
Nausea | 20 (14.8) | 27 (24.1) | 47 (19.0) |
Vomiting | 13 (9.6) | 16 (14.3) | 29 (11.7) |
Metabolism and nutrition disorders | 117 (86.7) | 38 (33.9) | 155 (62.8) |
Hyperphosphatemia | 108 (80.0) | 0 | 108 (43.7) |
Decreased appetite | 36 (26.7) | 23 (20.5) | 59 (23.9) |
General disorders and administration-site conditions | 73 (54.1) | 74 (66.1) | 147 (59.5) |
Asthenia | 20 (14.8) | 28 (25.0) | 48 (19.4) |
Fatigue | 20 (14.8) | 21 (18.8) | 41 (16.6) |
Pyrexia | 20 (14.8) | 14 (12.5) | 34 (13.8) |
Peripheral edema | 8 (5.9) | 13 (11.6) | 21 (8.5) |
Skin and subcutaneous tissue disorders | 103 (76.3) | 38 (33.9) | 141 (57.1) |
Alopecia | 34 (25.2) | 27 (24.1) | 61 (24.7) |
Palmar-plantar erythrodysesthesia syndrome | 41 (30.4) | 1 (0.9) | 42 (17.0) |
Dry skin | 31 (23.0) | 5 (4.5) | 36 (14.6) |
Onycholysis | 31 (23.0) | 1 (0.9) | 32 (13.0) |
Onychomadesis | 28 (20.7) | 2 (1.8) | 30 (12.1) |
Nail discoloration | 24 (17.8) | 2 (1.8) | 26 (10.5) |
Nail disorder | 19 (14.1) | 2 (1.8) | 21 (8.5) |
Infections and infestations | 75 (55.6) | 33 (29.5) | 108 (43.7) |
Urinary tract infection | 15 (11.1) | 8 (7.1) | 23 (9.3) |
Paronychia | 16 (11.9) | 0 | 16 (6.5) |
Blood and lymphatic system disorders | 42 (31.1) | 59 (52.7) | 101 (40.9) |
Anemia | 35 (25.9) | 36 (32.1) | 71 (28.7) |
Neutropenia | 0 | 22 (19.6) | 22 (8.9) |
Leukopenia | 1 (0.7) | 15 (13.4) | 16 (6.5) |
Nervous system disorders | 51 (37.8) | 39 (34.8) | 90 (36.4) |
Dysgeusia | 37 (27.4) | 8 (7.1) | 45 (18.2) |
Investigations | 66 (48.9) | 20 (17.9) | 86 (34.8) |
Alanine aminotransferase increase | 37 (27.4) | 4 (3.6) | 41 (16.6) |
Weight decrease | 30 (22.2) | 3 (2.7) | 33 (13.4) |
Aspartate aminotransferase increase | 29 (21.5) | 3 (2.7) | 32 (13.0) |
Blood creatinine increase | 19 (14.1) | 7 (6.3) | 26 (10.5) |
Blood alkaline phosphatase increase | 14 (10.4) | 4 (3.6) | 18 (7.3) |
Musculoskeletal and connective tissue disorders | 44 (32.6) | 35 (31.3) | 79 (32.0) |
Arthralgia | 14 (10.4) | 9 (8.0) | 23 (9.3) |
Eye disorders | 71 (52.6) | 7 (6.3) | 78 (31.6) |
Dry eye | 23 (17.0) | 2 (1.8) | 25 (10.1) |
Respiratory, thoracic and mediastinal disorders | 45 (33.3) | 31 (27.7) | 76 (30.8) |
Epistaxis | 17 (12.6) | 3 (2.7) | 20 (8.1) |
Renal and urinary disorders | 44 (32.6) | 23 (20.5) | 67 (27.1) |
Hematuria | 16 (11.9) | 10 (8.9) | 26 (10.5) |
AE = adverse event.
Note: For AEs with an incidence of ≥ 10% in any treatment group, patients are counted only once for any given event, regardless of the number of times they actually experienced the event. AEs are coded using the Medical Dictionary for Regulatory Activities (MedDRA), version 24.1.
Source: 2023 Clinical Study Report for the THOR study, cohort 1.47
Table 21: Summary of Deaths in Cohort 1 of the THOR Trial (ITT Analysis Set; January 15, 2023, Clinical Cut-Off)
Variable | THOR trial, cohort 1 | ||
|---|---|---|---|
Erdafitinib | Chemotherapy | Total | |
Analysis set: ITT | 136 | 130 | 266 |
Deaths during study, n (%) | 77 (56.6) | 78 (60.0) | 155 (58.3) |
Progressive disease | 63 (46.3) | 63 (48.5) | 126 (47.4) |
Adverse event | 8 (5.9) | 10 (7.7) | 18 (6.8) |
Related to study druga | 1 (0.7) | 6 (4.6) | 7 (2.6) |
Not related to study drug | 5 (3.7) | 4 (3.1) | 9 (3.4) |
Relationship unknown | 2 (1.5) | 0 | 2 (0.8) |
COVID-19-related | 0 | 1 (0.8) | 1 (0.4) |
Other | 5 (3.7) | 4 (3.1) | 9 (3.4) |
Cause unknownb | 1 (0.7) | 1 (0.8) | 2 (0.8) |
ITT = intention-to-treat.
aIncludes deaths that were very likely, probably, or possibly related to the study drug.
bIncludes doubtful, unknown, or missing relationship to the study drug.
Source: 2023 Clinical Study Report for the THOR study, cohort 1.47
Table 22: AEs Leading to Death in Cohort 1 of the THOR Trial (Safety Analysis Set; January 15, 2023, Clinical Cut-Off)
Variable | THOR trial, cohort 1 | ||
|---|---|---|---|
Erdafitinib | Chemotherapy | Total | |
Analysis set: Safety | 135 | 112 | 247 |
Patients with 1 or more AEs leading to death, n (%) | 6 (4.4) | 7 (6.3) | 13 (5.3) |
AEs leading to death | |||
System organ class and/or preferred term, n (%) | |||
General disorders and administration-site conditions | 2 (1.5) | 1 (0.9) | 3 (1.2) |
Sudden death | 2 (1.5) | 0 | 2 (0.8) |
General physical health deterioration | 0 | 1 (0.9) | 1 (0.4) |
Infections and infestations, n (%) | 2 (1.5) | 3 (2.7) | 5 (2.0) |
Aspiration pneumonia | 1 (0.7) | 0 | 1 (0.4) |
Necrotizing pneumonia | 1 (0.7) | 0 | 1 (0.4) |
Atypical pneumonia | 0 | 1 (0.9) | 1 (0.4) |
Septic shock | 0 | 2 (1.8) | 2 (0.8) |
Cardiac disorders | 1 (0.7) | 0 | 1 (0.4) |
Cardio-respiratory arrest | 1 (0.7) | 0 | 1 (0.4) |
Renal and urinary disorders | 1 (0.7) | 0 | 1 (0.4) |
Renal failure | 1 (0.7) | 0 | 1 (0.4) |
Blood and lymphatic system disorders | 0 | 3 (2.7) | 3 (1.2) |
Febrile bone marrow aplasia | 0 | 2 (1.8) | 2 (0.8) |
Febrile neutropenia | 0 | 1 (0.9) | 1 (0.4) |
AE = adverse events.
Note: Patients are counted only once for any given event, regardless of the number of times they actually experienced the event. The event experienced by the patient with the worst toxicity is used. If a patient has missing toxicity for a specific AE, the patient is only counted in the total column for that AE. AEs are coded using the Medical Dictionary for Regulatory Activities (MedDRA), version 24.1.
Source: 2023 Clinical Study Report for the THOR study, cohort 1.47
Serious Adverse Events
In cohort 1 of the THOR trial, 56 of 135 patients (41.5%) in the erdafitinib treatment group and 47 of 112 patients (42.0%) in the chemotherapy treatment group experienced an SAE, as described in Table 23. The most frequently reported SAE by preferred term reported by at least 2% of patients in the erdafitinib group were urinary tract infection (4.4%) and hematuria (3.7%). The most frequently reported SAE by preferred term reported by at least 2% of patients in the chemotherapy group were febrile neutropenia (6.3%) and febrile bone marrow aplasia (3.6%).
Table 23: Summary of SAEs in Cohort 1 of the THOR Trial (Safety Analysis Set; January 15, 2023, Clinical Cut-Off)
Variable | THOR trial, cohort 1 | ||
|---|---|---|---|
Erdafitinib | Chemotherapy | Total | |
Analysis set: Safety | 135 | 112 | 247 |
Patients with 1 or more SAEs | 56 (41.5) | 47 (42.0) | 103 (41.7) |
SAEs with an incidence of ≥ 2% in any treatment group | |||
System organ class and/or preferred term, n (%) | |||
Infections and infestations | 21 (15.6) | 16 (14.3) | 37 (15.0) |
Urinary tract infection | 6 (4.4) | 2 (1.8) | 8 (3.2) |
Blood and lymphatic system disorders | 2 (1.5) | 16 (14.3) | 18 (7.3) |
Febrile neutropenia | 0 | 7 (6.3) | 7 (2.8) |
Febrile bone marrow aplasia | 0 | 4 (3.6) | 4 (1.6) |
Neutropenia | 0 | 3 (2.7) | 3 (1.2) |
General disorders and administration-site conditions | 7 (5.2) | 8 (7.1) | 15 (6.1) |
Pyrexia | 2 (1.5) | 3 (2.7) | 5 (2.0) |
General physical health deterioration | 1 (0.7) | 3 (2.7) | 4 (1.6) |
Renal and urinary disorders | 10 (7.4) | 4 (3.6) | 14 (5.7) |
Hematuria | 5 (3.7) | 1 (0.9) | 6 (2.4) |
Acute kidney injury | 3 (2.2) | 0 | 3 (1.2) |
Metabolism and nutrition disorders | 7 (5.2) | 2 (1.8) | 9 (3.6) |
Hyponatremia | 3 (2.2) | 1 (0.9) | 4 (1.6) |
AE = adverse event; SAE = serious adverse event.
Note: Patients are counted only once for any given event, regardless of the number of times they actually experienced the event. AEs are coded using the Medical Dictionary for Regulatory Activities (MedDRA), version 24.1.
Source: 2023 Clinical Study Report for the THOR study, cohort 1.47
Withdrawals Due to Adverse Events
In cohort 1 of the THOR trial, in the erdafitinib group, AEs led to the discontinuation of the study drug in 19 of 135 patients (14.1%) and to an interruption of the study drug in 97 of 135 patients (71.9%) (Table 24). In the chemotherapy group, AEs led to the discontinuation of the study drug in 20 of 112 patients (17.9%) and to an interruption of the study drug in 35 of 112 patients (31.3%). A lower percentage of patients in the erdafitinib group (11 patients [8.1%]) experienced AEs that led to treatment discontinuation considered to be related to the study drug than the chemotherapy group (15 patients [13.4%]).
The most frequently reported AEs leading to treatment discontinuation by preferred term in the erdafitinib group were general physical health deterioration (1.5%) and sudden death (1.5%). The most frequently reported AEs leading to discontinuation by preferred term in the chemotherapy group were febrile bone marrow aplasia (2.7%), general physical health deterioration (1.8%), septic shock (1.8%), and diarrhea (1.8%).
Table 24: Summary of AEs Leading to Treatment Discontinuation in Cohort 1 of the THOR Trial (January 15, 2023, Clinical Cut-Off)
Variable | THOR trial, cohort 1 | ||
|---|---|---|---|
Erdafitinib | Chemotherapy | Total | |
Analysis set: Safety | 135 | 112 | 247 |
Patients with 1 or more TEAEs leading to treatment discontinuation, n (%) | 19 (14.1) | 20 (17.9) | 39 (15.8) |
Patients with 1 or more drug-related TEAEs leading to treatment discontinuation, n (%) | 11 (8.1) | 15 (13.4) | 26 (10.5) |
TEAEs leading to treatment discontinuation | |||
System organ class and/or preferred term, n (%) | |||
General disorders and administration-site conditions | 4 (3.0) | 3 (2.7) | 7 (2.8) |
General physical health deterioration | 2 (1.5) | 2 (1.8) | 4 (1.6) |
Sudden death | 2 (1.5) | 0 | 2 (0.8) |
Peripheral edema | 0 | 1 (0.9) | 1 (0.4) |
Infections and infestations | 4 (3.0) | 3 (2.7) | 7 (2.8) |
Septic shock | 0 | 2 (1.8) | 2 (0.8) |
Atypical pneumonia | 0 | 1 (0.9) | 1 (0.4) |
COVID-19 | 1 (0.7) | 0 | 1 (0.4) |
Paronychia | 1 (0.7) | 0 | 1 (0.4) |
Aspiration pneumonia | 1 (0.7) | 0 | 1 (0.4) |
Necrotizing pneumonia | 1 (0.7) | 0 | 1 (0.4) |
Blood and lymphatic system disorders | 0 | 5 (4.5) | 5 (2.0) |
Febrile bone marrow aplasia | 0 | 3 (2.7) | 3 (1.2) |
Anemia | 0 | 1 (0.9) | 1 (0.4) |
Febrile neutropenia | 0 | 1 (0.9) | 1 (0.4) |
Gastrointestinal disorders, n (%) | 2 (1.5) | 3 (2.7) | 5 (2.0) |
Diarrhea | 0 | 2 (1.8) | 2 (0.8) |
Dysphagia | 1 (0.7) | 0 | 1 (0.4) |
Ileus | 0 | 1 (0.9) | 1 (0.4) |
Mouth ulceration | 1 (0.7) | 0 | 1 (0.4) |
Vomiting | 0 | 1 (0.9) | 1 (0.4) |
Eye disorders | 3 (2.2) | 0 | 3 (1.2) |
Detachment of retinal pigment epithelium | 1 (0.7) | 0 | 1 (0.4) |
Keratitis | 1 (0.7) | 0 | 1 (0.4) |
Vision blurred | 1 (0.7) | 0 | 1 (0.4) |
Nervous system disorders | 0 | 3 (2.7) | 3 (1.2) |
Peripheral sensory neuropathy | 0 | 1 (0.9) | 1 (0.4) |
Sciatica | 0 | 1 (0.9) | 1 (0.4) |
Syncope | 0 | 1 (0.9) | 1 (0.4) |
Skin and subcutaneous tissue disorders | 3 (2.2) | 0 | 3 (1.2) |
Onycholysis | 2 (1.5) | 0 | 2 (0.8) |
Dry skin | 1 (0.7) | 0 | 1 (0.4) |
Nail discoloration | 1 (0.7) | 0 | 1 (0.4) |
Nail dystrophy | 1 (0.7) | 0 | 1 (0.4) |
Renal and urinary disorders | 2 (1.5) | 0 | 2 (0.8) |
Hematuria | 1 (0.7) | 0 | 1 (0.4) |
Renal failure | 1 (0.7) | 0 | 1 (0.4) |
Urinary retention | 1 (0.7) | 0 | 1 (0.4) |
Respiratory, thoracic and mediastinal disorders | 0 | 2 (1.8) | 2 (0.8) |
Dyspnea | 0 | 1 (0.9) | 1 (0.4) |
Pneumonitis | 0 | 1 (0.9) | 1 (0.4) |
Vascular disorders | 2 (1.5) | 0 | 2 (0.8) |
Extremity necrosis | 1 (0.7) | 0 | 1 (0.4) |
Hypotension | 1 (0.7) | 0 | 1 (0.4) |
Cardiac disorders | 1 (0.7) | 0 | 1 (0.4) |
Cardio-respiratory arrest | 1 (0.7) | 0 | 1 (0.4) |
Injury, poisoning, and procedural complications | 0 | 1 (0.9) | 1 (0.4) |
Fractured sacrum | 0 | 1 (0.9) | 1 (0.4) |
TEAEs with an incidence of ≥ 1% in any treatment group leading to drug interruption | |||
Patients with 1 or more TEAEs leading to drug interruption | 97 (71.9) | 35 (31.3) | 132 (53.4) |
System organ class and/or preferred term, n (%) | |||
Gastrointestinal disorders | 40 (29.6) | 3 (2.7) | 43 (17.4) |
Stomatitis | 22 (16.3) | 1 (0.9) | 23 (9.3) |
Diarrhea | 12 (8.9) | 1 (0.9) | 13 (5.3) |
Nausea | 2 (1.5) | 1 (0.9) | 3 (1.2) |
Vomiting | 3 (2.2) | 0 | 3 (1.2) |
Dry mouth | 2 (1.5) | 0 | 2 (0.8) |
Skin and subcutaneous tissue disorders | 41 (30.4) | 1 (0.9) | 42 (17.0) |
Palmar-plantar erythrodysesthesia syndrome | 20 (14.8) | 1 (0.9) | 21 (8.5) |
Onycholysis | 11 (8.1) | 0 | 11 (4.5) |
Onychomadesis | 9 (6.7) | 0 | 9 (3.6) |
Dry skin | 4 (3.0) | 0 | 4 (1.6) |
Nail discoloration | 4 (3.0) | 0 | 4 (1.6) |
Nail dystrophy | 3 (2.2) | 0 | 3 (1.2) |
Nail disorder | 2 (1.5) | 0 | 2 (0.8) |
Nail toxicity | 2 (1.5) | 0 | 2 (0.8) |
Infections and infestations | 18 (13.3) | 16 (14.3) | 34 (13.8) |
COVID-19 | 3 (2.2) | 2 (1.8) | 5 (2.0) |
Paronychia | 4 (3.0) | 0 | 4 (1.6) |
Pneumonia | 1 (0.7) | 3 (2.7) | 4 (1.6) |
Urinary tract infection | 2 (1.5) | 2 (1.8) | 4 (1.6) |
Herpes zoster | 0 | 3 (2.7) | 3 (1.2) |
Nail infection | 3 (2.2) | 0 | 3 (1.2) |
Eye disorders | 21 (15.6) | 0 | 21 (8.5) |
Detachment of retinal pigment epithelium | 3 (2.2) | 0 | 3 (1.2) |
Chorioretinopathy | 2 (1.5) | 0 | 2 (0.8) |
Corneal disorder | 2 (1.5) | 0 | 2 (0.8) |
Eye pain | 2 (1.5) | 0 | 2 (0.8) |
Ocular toxicity | 2 (1.5) | 0 | 2 (0.8) |
Vision blurred | 2 (1.5) | 0 | 2 (0.8) |
Metabolism and nutrition disorders | 20 (14.8) | 1 (0.9) | 21 (8.5) |
Hyperphosphatemia | 10 (7.4) | 0 | 10 (4.0) |
Decreased appetite | 4 (3.0) | 1 (0.9) | 5 (2.0) |
Dehydration | 3 (2.2) | 0 | 3 (1.2) |
Investigations | 17 (12.6) | 0 | 17 (6.9) |
Aspartate aminotransferase increase | 8 (5.9) | 0 | 8 (3.2) |
Alanine aminotransferase increase | 7 (5.2) | 0 | 7 (2.8) |
Blood creatinine increase | 4 (3.0) | 0 | 4 (1.6) |
Weight decrease | 2 (1.5) | 0 | 2 (0.8) |
General disorders and administration-site conditions | 8 (5.9) | 7 (6.3) | 15 (6.1) |
Asthenia | 3 (2.2) | 3 (2.7) | 6 (2.4) |
Pyrexia | 3 (2.2) | 2 (1.8) | 5 (2.0) |
Fatigue | 2 (1.5) | 0 | 2 (0.8) |
Blood and lymphatic system disorders | 3 (2.2) | 9 (8.0) | 12 (4.9) |
Anemia | 2 (1.5) | 3 (2.7) | 5 (2.0) |
Neutropenia | 0 | 5 (4.5) | 5 (2.0) |
Musculoskeletal and connective tissue disorders | 9 (6.7) | 2 (1.8) | 11 (4.5) |
Pain in extremity | 4 (3.0) | 1 (0.9) | 5 (2.0) |
Renal and urinary disorders | 7 (5.2) | 1 (0.9) | 8 (3.2) |
Acute kidney injury | 3 (2.2) | 0 | 3 (1.2) |
Hematuria | 3 (2.2) | 0 | 3 (1.2) |
Vascular disorders | 4 (3.0) | 0 | 4 (1.6) |
Hypotension | 2 (1.5) | 0 | 2 (0.8) |
AE = adverse event; TEAE = treatment-emergent adverse event.
Note: Patients are counted only once for any given event, regardless of the number of times they actually experienced the event. AEs are coded using the Medical Dictionary for Regulatory Activities (MedDRA), version 24.1.
Source: 2023 Clinical Study Report for the THOR study, cohort 1.47
AEs of Special Interest
Based on input from clinical experts and others involved (e.g., presenter members from the pan-Canadian Oncology Drug Review Expert Review Committee), 3 AEs of special interest were deemed important: CSR and eye disorders, hyperphosphatemia, and nail and/or skin disorders.
CSR has been identified as an AE of special interest and is a known class effect of FGFR inhibitors. This “AEs of special interest” grouped term consists of the following preferred terms: retinal detachment, vitreous detachment, retinal edema, retinopathy, chorioretinopathy, detachment of retinal pigment epithelium, detachment of macular retinal pigment epithelium, macular detachment, serous retinal detachment, subretinal fluid, retinal thickening, chorioretinitis, serous retinopathy, maculopathy, and choroidal effusion. In cohort 1 of the THOR trial, events of CSR were reported for 23 of 135 patients (17.0%) in the erdafitinib treatment group. No patients in the chemotherapy treatment group experienced events of CSR. The most frequent AEs of CSR in the erdafitinib group reported by at least 3% of patients were chorioretinopathy (5.9%), detachment of retinal pigment epithelium (5.2%), and subretinal fluid (3.7%) (Table 25). The majority of serous retinopathy events were grade 1 or 2 (20 of 135 patients [14.8%]). Three patients (2.2%) experienced a grade 3 event. No patients experienced a grade 4 serous retinopathy event. Events of CSR were manageable with dose modifications; dose reductions were reported for 15 patients (11.1%) and dose interruptions were reported for 7 patients (5.2%). Events of CSR were resolved in the majority of patients (16 of 23 patients [69.6%]) at the time of clinical cut-off; however, 7 patients had an ongoing event, the majority of which were grade 1.
Eye disorders (other than CSR), such as conjunctivitis and dry eye, occurred in 57 of 135 patients (42.2%) in the erdafitinib group and in 6 of 112 patients (5.4%) in the chemotherapy group.
Hyperphosphatemia was also considered of special interest by CDA-AMC, in agreement with clinical experts. In cohort 1, 108 of 135 patients (80%) in the erdafitinib group and 0 patients in the chemotherapy group experienced an event of hyperphosphatemia. The majority of cases were considered grade 1 to 2 (101 patients). Only 1 patient was assessed with a grade 4 event.
The overall incidence of nail disorders was reported in 90 patients (66.7%) in the erdafitinib group and in 6 patients (5.4%) in the chemotherapy group. Similarly, skin disorders were reported in 74 patients (54.8%) and 14 patients (12.5%), respectively.
Table 25: Summary of AEs of Special Interest in Cohort 1 of the THOR Trial (Safety Analysis Set; January 15, 2023, Clinical Cut-Off)
Variable | THOR trial, cohort 1 | |
|---|---|---|
Erdafitinib | Chemotherapy | |
Analysis set: Safety | 135 | 112 |
System organ class and/or preferred term, n (%) | ||
AE of special interest (central serous retinopathy) | 23 (17.0) | 0 |
Chorioretinopathy | 8 (5.9) | 0 |
Detachment of retinal pigment epithelium | 7 (5.2) | 0 |
Subretinal fluid | 5 (3.7) | 0 |
Macular detachment | 2 (1.5) | 0 |
Retinopathy | 2 (1.5) | 0 |
Detachment of macular retinal pigment epithelium | 1 (0.7) | 0 |
AE = adverse event.
Notes: Patients are counted only once for any given event, regardless of the number of times they actually experienced the event. AEs are coded using the Medical Dictionary for Regulatory Activities (MedDRA), version 24.1.
AEs of special interest include the following MedDRA preferred terms: retinal detachment, vitreous detachment, retinal edema, retinopathy, chorioretinopathy, detachment of retinal pigment epithelium, detachment of macular retinal pigment epithelium, macular detachment, serous retinal detachment, subretinal fluid, retinal thickening, chorioretinitis, serous retinopathy, maculopathy, choroidal effusion.
Source: 2023 Clinical Study Report for the THOR study, cohort 1.47
Critical Appraisal
Internal Validity
Overall, the THOR study is a well-designed RCT comparing erdafitinib to chemotherapy in patients with la/mUC harbouring FGFR alterations who have been previously treated with anti-PD-1 or anti-PD-L1 therapies.
Although randomization and allocation concealment were properly conducted, some baseline imbalances were observed, including the number of patients who declined chemotherapy (1 in the erdafitinib group versus 18 in the chemotherapy group) and the number of previous lines of chemotherapy received. Although these imbalances may introduce bias into the results, sensitivity analyses that excluded patients who did not initiate chemotherapy (1 versus 18) supported the robustness of the main study findings, minimizing concerns about potential bias that originated from the randomization process.
As an open-label trial, the absence of blinding presents potential bias risks, particularly for subjective outcomes like PROs and AEs. Notably, there were significant differences in the use of concomitant therapies, such as antibiotics, steroids, and gastrointestinal drugs, which could have been influenced by the open-label design. These concomitant treatments might have affected both the reporting and actual event rates of AEs, such as a potential reduction in gastrointestinal events in the treatment arm related to increased gastrointestinal drug use. Even for more objective outcomes, such as OS, the lack of blinding and these treatment imbalances might introduce bias, although the full impact is likely small. It is also important to acknowledge that the open-label design was necessary because of the nature of drug administration, making blinding difficult to implement.
The PRO measures (i.e., FACT-Bl, PGI-S, EQ-5D-5L) were considered valid, reliable, and responsive in this specific population; only the measurement for the time to urinary bladder cancer symptom deterioration lacked specific details on validity, reliability, and responsiveness.
The trial also included an interim analysis that led to early stopping because of demonstrated efficacy. Although this decision is ethically sound, early termination can sometimes result in an overestimation of treatment effects due to the shorter follow-up. However, the use of a prespecified interim analysis with defined stopping rules mitigates some of these concerns.
Last, the long-term effects of erdafitinib remain unknown, owing to the reduced sample sizes and censoring of patients after 12 months, which limited the reliability of assessments conducted beyond this period. This is particularly important for estimates of PFS and OS, where the CIs become notably wide beyond 6 months.
External Validity
The study included participants from 23 countries on multiple continents, providing a diverse population. However, there was an underrepresentation of certain demographic groups, particularly Black patients. In Canada, with its multicultural population, the limited representation of certain ethnic groups in the study may affect the generalizability of the findings. The median age of participants was around 66 to 69 years, which is consistent with the typical age range for patients with UC in Canada.
The study focuses on patients with FGFR3 and/or FGFR2 alterations, which is a subset of patients with UC. The generalizability of the results depends on the availability and accessibility of molecular testing for FGFR alterations in Canada.
The study compares erdafitinib to chemotherapy, specifically docetaxel or vinflunine. In Canada, cisplatin-based chemotherapy remains the standard of care for advanced UC; alternatives depend on patient eligibility. The standard-of-care options in the study are consistent with those available in Canada, further supporting the external validity.
Overall, the clinical experts consulted by CDA-AMC considered the results of the THOR study to be applicable to most patients with la/mUC in Canada, within the submission criteria assessed.
GRADE Summary of Findings and Certainty of the Evidence
Methods for Assessing the Certainty of the Evidence
For the pivotal studies and RCTs identified in the sponsor’s systematic review, the GRADE approach was used to assess the certainty of the evidence for outcomes considered most relevant to CDA-AMC expert committee deliberations, and a final certainty rating was determined as outlined by the GRADE Working Group.
High certainty: We are very confident that the true effect lies close to that of the estimate of the effect.
Moderate certainty: We are moderately confident in the effect estimate. The true effect is likely to be close to the estimate of the effect, but there is a possibility that it is substantially different. We use the word likely for evidence of moderate certainty (e.g., X intervention likely results in Y outcome).
Low certainty: Our confidence in the effect estimate is limited. The true effect may be substantially different from the estimate of the effect. We use the word may for evidence of low certainty (e.g., X intervention may result in Y outcome).
Very low certainty: We have very little confidence in the effect estimate. The true effect is likely to be substantially different from the estimate of effect. We describe evidence of very low certainty as very uncertain.
When possible, certainty was rated in the context of the presence of an important (nontrivial) treatment effect; if this was not possible, certainty was rated in the context of the presence of any treatment effect (i.e., the clinical importance is unclear). In all cases, the target of the certainty of evidence assessment was based on the point estimate and where it was located relative to the threshold for a clinically important effect (when a threshold was available) or to the null.
The GRADE assessments are presented in Table 2.
Long-Term Extension Studies
No long-term extension studies were included in the sponsor’s submission to CDA-AMC.
Indirect Evidence
The contents of this section have been informed by materials submitted by the sponsor. The following information has been summarized and validated by the CDA-AMC review team.
Objectives for the Summary of Indirect Evidence
The indirect comparison submitted by the sponsor aimed to compare the relative efficacy and safety of erdafitinib and enfortumab vedotin in patients with la/mUC who progressed after 1 or 2 prior treatments, at least 1 of which included an anti-PD-L1 drug, with any other platinum-based, or appropriate alternative therapies.
Description of Indirect Comparison
To estimate the efficacy of erdafitinib relative to the other treatment options for patients with la/mUC who received at least 1 prior systemic therapy, 1 of which was ICI therapy, a comprehensive systematic literature review (SLR) was performed that followed the search strategy and criteria assessment described in Table 26.
Table 26: Study Selection Criteria and Methods for Indirect Comparisons
Characteristics | Indirect comparison |
|---|---|
Population | Patients (≥ 18 years) with locally advanced (T3b and T4a), surgically unresectable or metastatic urothelial cancer (stage IV disease) who have received at least 1 line of prior systemic therapy, 1 of which was an ICI therapy (e.g., PD-L1). |
Intervention | Any pharmacological treatment for the specified patient population, such as:
|
Comparator | Any intervention |
Outcome | OS PFS ORR DoR AEs PROs (FACT-Bl, PGI-S, EORTC QLQ-C30, and EQ-5D-5L orEQ-5D-3L) No restriction by time point was included. |
Study designs | All phase II, III, or IV RCTs in the patient population of interest |
Publication characteristics | Full-text articles Conference abstracts from the past 2 years (2021 to 2023) |
Exclusion criteria | Pediatric population is not eligible for inclusion Publications in other languages will be excluded, but English language abstracts of these will be included if they contain relevant information |
Databases searched | MEDLINE on PubMed Ovid Embase Cochrane Library Trial registries: Clinicaltrials.gov; WHO ICTRP; Health Canada Clinical Trial Database; European Union Clinical trials register ISPOR abstracts; ASCO meeting abstracts; ECCO meeting abstracts; ESMO meeting abstracts Database searches will be conducted from 2006 onward |
Selection process | Search results were imported into EndNote and duplicates were removed. The titles and abstracts were screened for inclusion, guided by the PICOS criteria, by 2 blinded reviewers, using the PICO Portal.59 Any discrepancies between reviewers were resolved by a third reviewer. Full texts of studies identified through title and/or abstract screening and grey literature searches were retrieved and assessed for eligibility. When full-text manuscripts were not available, abstracts were included. Full-text screening was conducted by 2 blinded reviewers using the PICO Portal. Any discrepancies between reviewers were resolved by a third reviewer. |
Data extraction process | Data from relevant publications were extracted into standardized data extraction tables in an Excel workbook. One reviewer extracted the study data into a standardized template and, for each relevant item of information (e.g., study, paper, report, website.), full bibliographic details were extracted to enable the reader to access the full-source document. A proportion of the data extraction was checked by an independent reviewer. When multiple publications were identified as reporting a single study, the publications were grouped and data were extracted first from the principal publication of the study. When data were missing or incomplete, the other publications were screened for the missing information. Publications were presented alphabetically by first author, then by date of publication, with the most recent first. Due to the scope of the SLR project, study authors were not contacted for additional or missing data. |
Quality assessment | Randomized controlled studies were quality assessed according to the risk-of-bias assessment suggested in NICE Single Technology Appraisal guidance.60 When studies were reported in 2 or more publications, study quality was assessed for the key publication that reported detailed information on study methodology. Because conference abstracts typically do not report the study methods required to assess the quality of the study, they were not assessed for quality. |
ADC = antibody-drug conjugate; AE = adverse event; ASCO = American Society of Clinical Oncology; DoR = duration of response; ECCO = European Cancer Organisation; EORTC QLQ-C30 = European Organisation for the Research and Treatment of Cancer Quality of Life Questionnaire Core 30; ESMO = European Society for Medical Oncology; FACT-Bl = Functional Assessment of Cancer Therapy–Bladder; ICI = immune checkpoint inhibitor; ICTRP = International Clinical Trials Registry Platform; ISPOR = Professional Society for Health Economics and Outcomes Research; NICE = National Institute for Health and Care Excellence; ORR = objective response rate; OS = overall survival; PFS = progression-free survival; PGI-S = Patient Global Impression of Severity; PICOS = population, intervention, comparison, outcomes, and study; PRO = patient-reported outcome; RCT = randomized controlled trial; SLR = systematic literature review.
Sources: Balversa for Treatment of Metastatic Urothelial Cancer – Clinical Systematic Literature Review Report.61
Indirect Comparison Analysis Methods
No head-to-head trial comparing erdafitinib and enfortumab vedotin was available from the results of the SLR; therefore, an ITC with a MAIC design was justified to estimate the relative efficacy and safety of these treatments, using individual patient data from 1 pivotal study (THOR) that assessed erdafitinib and aggregate data from 1 available study (EV-301 trial) that evaluated enfortumab vedotin. The validity of the comparison between groups depends on the balance of the treatment-effect modifiers (TEMs) across trials. Because there were differences in population definitions between the 2 trials, the MAIC was used to adjust for imbalances in TEMs.
To ensure that there were no systematic differences between the studies, apart from the interventions being compared, the ITC aimed to assess the homogeneity of the groups being compared. To achieve this, a comparability assessment was conducted to contrast the study characteristics, the study populations, the intervention and common comparator, and the outcomes.
The authors of the ITC assessed the characteristics of each of the 2 included studies. These were deemed to be sufficiently comparable to support an ITC analysis, as patients enrolled in the THOR trial were followed for a median of 15.9 months and patients enrolled in the EV-301 trial were followed for a median of 11.10 months at the interim analysis and 23.75 months at the final analysis. Neither trial allowed for treatment crossover during the analysis periods of interest for the base-case ITCs (randomization up to the interim analysis for both studies). No other differences were observed regarding the study design of the 2 trials.
The chemotherapy (comparator) arm in both the THOR trial and EV-301 trial were considered sufficiently similar to serve as a common comparator, which allowed for an anchored comparison using chemotherapy (i.e., an anchored MAIC). Both the THOR and EV-301 trials randomized patients to physician’s choice of chemotherapy, which was determined before trial enrolment. The option of vinflunine or docetaxel was used in both trials, and paclitaxel was an option in the EV-301 trial. Although some patients in the chemotherapy arm of the EV-301 trial received paclitaxel, docetaxel and paclitaxel were assumed to be equivalent in terms of efficacy, per individual clinician consultation.62 Therefore, physician’s choice of chemotherapy was considered to be sufficiently comparable in the 2 trials to be used as the common comparator.
Patients from the THOR study were first excluded, based on eligibility criteria, from the EV-301 trial; subsequently, their baseline characteristics were matched to those in the EV-301 trial before conducting the MAIC.
Population
There were differences in the inclusion and exclusion criteria of the THOR and EV-301 trials. The key inclusion and exclusion criteria are summarized in Table 27. The THOR trial enrolled adults with metastatic or surgically unresectable UC who had at least 1 FGFR alteration, whereas the EV-301 trial enrolled adults with metastatic UC regardless of genetic alteration status.
All patients in both trials were previously treated. In the THOR trial, patients had received up to 2 prior systemic therapies and anti-PD-L1 therapy in any setting — including neoadjuvant, adjuvant, or metastatic — without a specific requirement for platinum-based therapy. Additionally, most patients (94%) had previously undergone systemic therapy for la/mUC. Patients enrolled in the EV-301 trial were eligible to have received multiple prior lines of systemic therapy, which must have included an anti-PD-L1 drug, but no more than 1 prior chemotherapy regimen was allowed in the la/mUC setting and a platinum-based therapy was allowed in any setting. Patients in the THOR trial had an ECOG PS of 0 to 2, whereas patients in the EV-301 trial had an ECOG PS of 0 or 1.
To address the differences in the inclusion and exclusion criteria between the THOR and EV-301 trials, an additional set of restriction criteria were applied to patients in the THOR trial to better align the trial population with that in the EV-301 trial. Patients in the THOR trial who met the following criteria were excluded from the analysis:
an ECOG PS of 2
no prior platinum-based chemotherapy
more than 1 prior chemotherapy.
Table 27: Key Inclusion and Exclusion Criteria of the THOR and EV-301 Trials
Criteria | THOR (NCT03390504) | EV-301 (NCT03474107) |
|---|---|---|
Inclusion criteria | ||
Age | ≥ 18 years | ≥ 18 years |
Disease status |
|
|
Progression and prior treatment |
|
|
ECOG PS | 0 to 2 | 0 or 1 |
Baseline laboratory data |
|
|
Molecular | Tumours must have ≥ 1 of the following translocations: FGFR2-BICC1, FGFR2-CASP7, FGFR3-TACC3, FGFR3-BAIAP2L1; or 1 of the following FGFR3 gene mutations: R248C, S249C, G370C, Y373C | |
Exclusion criteria | ||
Disease status |
|
|
Prior treatment |
|
|
ADC = antibody-drug conjugate; ALP = alkaline phosphatase; ALT = alanine aminotransferase; ANC = absolute neutrophil count; AST = aspartate aminotransferase; CNS = central nervous system; CPI = checkpoint inhibitor; CrCl = creatinine clearance; CSR = central serous retinopathy; FGFR = fibroblast growth factor receptor; GFR = glomerular filtration rate; MMAE = monomethyl auristatin E; ULN = upper limit of normal.
Baseline characteristics in each arm of the THOR and EV-301 trials, before matching and exclusions, are listed in Table 28. The proportions of patients who were 75 years and older, nonsmokers, had primary disease originating in the urinary tract, and had visceral metastasis were mostly comparable between the 2 trials.
There was a lower percentage of males in the THOR trial than in the EV-301 trial (70.6% in the erdafitinib group versus 79.1% in the enfortumab vedotin group; standardized mean difference [SMD] = ████). The variable of race was not listed in the EV-301 study. The THOR trial had a lower percentage of patients from the US than the EV-301 trial (5.9% in the erdafitinib group versus 14.3% in the enfortumab vedotin group; SMD= ████).
Regarding disease characteristics, fewer patients in the THOR trial had a history of diabetes or hyperglycemia than in the EV-301 trial (8.1% in the erdafitinib group versus 18.6% in the enfortumab vedotin group; SMD = ████). A larger proportion of patients in the THOR trial had lower Bellmunt risk scores (0 to 1) than in the EV-301 trial (75.7% in the erdafitinib group versus 66.8% in the enfortumab vedotin group; SMD = ████). A smaller proportion of patients in the THOR trial had liver metastasis than in the EV-301 trial (22.8% in the erdafitinib group versus 30.9% in the enfortumab vedotin group; SMD= ████).
Because of the eligibility criteria, 9.4% of patients in the THOR trial had an ECOG PS score of 2, compared with 0.0% in the EV-301 trial, and 87.6% of patients in the THOR trial received platinum therapy, whereas all patients in the EV-301 trial had. Additionally, 12.5% of patients in the EV-301 trial received more than 3 prior lines of therapy.
Table 28: Baseline Characteristics From the THOR and EV-301 Trials
Criteria | THOR (NCT03390504) | EV-301 (NCT03474107) | ||
|---|---|---|---|---|
Erdafitinib (N = 136) | Chemotherapy (N = 130) | Enfortumab vedotin (N = 301) | Chemotherapy (N = 307) | |
Age, in years | ||||
Median (minimum to maximum) | 66.0 (32 to 85) | 69.0 (35 to 86) | 68.0 (34.0 to 85.0) | 68.0 (30.0 to 88.0) |
≥ 75, n (%) | 26 (19.1) | 30 (23.1) | 52 (17.3) | 68 (22.1) |
Sex, n (%) | ||||
Male | 96 (70.6) | 94 (72.3) | 238 (79.1) | 232 (75.6) |
Female | 40 (29.4) | 36 (27.7) | 63 (20.9) | 75 (24.4) |
Geographic region, n (%) | ||||
Europe | 82 (60.3) | 80 (61.5) | 126 (41.9) | 129 (42.0) |
North America | 8 (5.9) | 5 (3.8) | 43 (14.3) | 44 (14.3) |
Rest of the world | 46 (33.8) | 45 (34.6) | 132 (43.9) | 134 (43.6) |
Race, n (%) | ||||
Asian | 37 (27.2) | 40 (30.8) | — | — |
Black or African American | 0 | 1 (0.8) | — | — |
Multiple | 0 | 1 (0.8) | — | — |
White | 81 (59.6) | 63 (48.5) | — | — |
Not reported | 18 (13.2) | 25 (19.2) | — | — |
Tobacco use, n (%) | ||||
Former user | — | — | 167 (55.5) | 164 (53.4) |
Current user | — | — | 29 (9.6) | 31 (10.1) |
Never used | 44 (32.4) | 47 (36.2) | 91 (30.2) | 102 (33.2) |
Not reported or unknown | — | — | 14 (4.7) | 10 (3.3) |
History of diabetes or hyperglycemia, n (%) | ||||
Yes | 11 (8.1) | 22 (16.9) | 56 (18.6) | 58 (18.9) |
ECOG PS, n (%) | ||||
0 | 63 (46.3) | 51 (39.2) | 120 (39.9) | 124 (40.4) |
1 | 61 (44.9) | 66 (50.8) | 181 (60.1) | 183 (59.6) |
2 | 12 (8.8) | 13 (10.0) | — | — |
Bellmunt risk score, n (%) | ||||
0 to 1 | 103 (75.7) | 95 (73.1) | 201 (66.8) | 208 (67.8) |
≥ 2 | 33 (24.3) | 35 (26.9) | 90 (29.9) | 96 (31.3) |
Not reported | — | — | 10 (3.3) | 3 (1.0) |
Origin site of primary disease, n (%) | ||||
Upper urinary tract | 41 (30.1) | 48 (36.9) | 98 (32.6) | 107 (34.9) |
Bladder or another site | 95 (69.9) | 82 (63.1) | 203 (67.4) | 200 (65.1) |
Site of metastasis, n of total (%) | ||||
Lymph node only | — | — | 34 of 301 (11.3) | 28 of 306 (9.2) |
Visceral site | 101 of 136 (74.3) | 97 of 130 (74.6) | 234 of 301 (77.7) | 250 of 306 (81.7) |
Liver | 31 of 136 (22.8) | 38 of 130 (29.2) | 93 of 301 (30.9) | 95 of 307 (30.9) |
PD-L1 status | ||||
Low expression (CPS < 10), n (%) | 89 (65.4) | 68 (52.3) | — | — |
FGFR, n of total (%) | ||||
Mutations | 108 of 135 (79.4) | 107 of 129 (82.3) | — | — |
Fusions | 25 of 135 (18.4) | 19 of 129 (14.6) | — | — |
Mutations and fusions | 2 of 135 (1.5) | 3 of 129 (2.3) | — | — |
Histologic type at baseline, n (%)a | ||||
Transitional cell carcinoma | 128 (94.1) | 124 (95.4) | — | — |
Transitional cell carcinoma with minor components (< 50% overall) of variant histology | 8 (5.9) | 6 (4.6) | — | — |
Previous systemic therapies, n (%) | ||||
1 or 2 | 135 (99.3) | 130 (100.0) | 262 (87.0) | 270 (87.9) |
≥ 3 | 1 (0.7) | — | 39 (13.0) | 37 (12.1) |
Prior platinum-based chemotherapy, n (%) | ||||
None | 14 (10.3) | 19 (14.6) | 0 | 0 |
Best response among patients who previously received checkpoint inhibitor treatment, n (%)b | ||||
Response | — | — | 61 (20.3) | 50 (16.3) |
No response | — | — | 207 (68.8) | 215 (70.0) |
Time since diagnosis of metastatic or locally advanced disease, in months | ||||
Median (minimum to maximum) | — | — | 14.8 (0.2 to 114.1) | 13.2 (0.3 to 118.4) |
Time from diagnosis of surgically unresectable or metastatic disease to randomization, in months | ||||
Median (minimum to maximum) | 12.9 (0.6 to 74.6) | 11.7 (1.8 to 63.5) | — | — |
CPS = combined positive score; ECOG PS = Eastern Cooperative Oncology Group Performance Status; FGFR = fibroblast growth factor receptor.
Note: These baseline characteristics depict values before matching procedures. Percentages may not total 100 because of rounding.
aOther histologic types include adenocarcinoma, squamous cell carcinoma, and pseudosarcomatous differentiation.
bThe best response among patients who had a response was defined as a confirmed complete response or partial response; among patients who did not have a response, the best response was defined as stable disease or progressive disease.
Treatment-Effect Modifiers
Given the differences in the baseline characteristics, potential effect modifiers were identified to adjust for them in the analysis. Potential effect modifiers for patients with la/mUC were selected based on the literature and expert clinician consultations.62 These include risk factors, ECOG PS, liver metastases, hemoglobin level, visceral disease, primary site (bladder or urethra), smoking status, time since prior therapy, previous treatments, age, sex, and transitional cell type.
This list of variables was limited to those available for comparison between the THOR and EV-301 trial populations and, therefore, the covariates noted in Table 29 were adjusted for in the MAIC. The EV-301 trial also reported additional variables, but these were not considered when comparing populations for the reasons outlined in Table 30.
Variables were ranked by importance for the indication, which was determined by clinicians. The MAIC results were reported for scenarios that ranged from including only the most important variable to including all variables.
Table 29: Variables Available for Trial Population Comparison, Prioritized by Clinical Relevance
Ranka | Variable |
|---|---|
1 | Belmunt risk score (0 or 1, ≥ 2) |
2 | ECOG PS (0, 1) |
3 | Presence of liver metastases (yes, no) |
4 | Presence of visceral metastases (yes, no) |
5 | Origin of primary disease (upper urinary tract, bladder or another site) |
6 | Smoking status (never smoked,b other) |
7 | History of diabetes or hypoglycemia (yes, no) |
8 | Geographic region (Western Europe, US, rest of the world) |
9 | Age (median; ≥ 75 years, < 75 years) |
10 | Male (yes, no) |
ECOG PS = Eastern Cooperative Oncology Group performance status.
aRanked as 1, indicating the most likely to be a treatment-effect modifier, to 10, indicating the least likely to be a treatment-effect modifier.
bOther includes former user, current user, and not reported or unknown.
Table 30: Variables Reported in the EV-301 Trial That Could Not Be Appropriately Matched
Variable | Reason for exclusion |
|---|---|
Histologic type at initial diagnosis (urothelial or transitional cell carcinoma, urothelial carcinoma mixed types, other) | Categories not comparable to those recorded in the THOR trial |
Presence of lymph node only metastases (yes, no) | Presence of lymph node metastases was recorded in the THOR trial, but the data do not indicate whether this was the only type of metastases |
Prior systemic therapies (≥ 3) | The THOR trial was limited to 1 or 2 prior therapies |
Best response among patients who previously received CPI (response, no response) | Not recorded in the THOR trial |
Median time since the diagnosis of metastatic or locally advanced disease | The THOR trial only recorded time since diagnosis (not time since metastatic diagnosis) |
CPI = checkpoint inhibitor.
After harmonizing the eligibility criteria of the THOR trial to the EV-301 trial, balancing weights were derived so that the average baseline characteristics after the reweighting of patients in the THOR trial matched the published aggregate characteristics of patients in the EV-301 trial. These weights were estimated using a propensity-score-type logistic regression equation that predicted whether a given type of patient originated from the THOR trial or the EV-301 trial as a function of baseline characteristics. The weights ♪(𝑤𝑖)♪ were estimated using the method of moments, rather than by maximum likelihood (as might otherwise be the case), because only aggregate data (averages and percentages) for the selected covariates were available for the EV-301 trial population.63 These weights were then used to calculate the ESS achieved after weighting patients. After the individual patient weights were computed, the distribution of weights was assessed to identify any overly influential observations. In an MAIC, the ESS is used to assess how much information is effectively being used after adjustment for differences between the study populations. A very low ESS, compared to the original sample size, may indicate that the matching and weighting have significantly reduced the usable information, which could impact the robustness of the indirect comparison. Evaluation of the ESS and patient weights serves as an additional assessment of heterogeneity; if the ESS is markedly reduced or the weights are highly variable, then this may demonstrate heterogeneity between the included trials.64
The individual patient weights were employed to compute adjusted relative effects for patients in the THOR trial, reflecting the estimated impact of erdafitinib versus physician’s choice of chemotherapy in the patient population of the EV-301 trial. Binary outcomes in the THOR trial were quantified as odds ratios (ORs) using weighted logistic regression, whereas time-to-event outcomes were quantified as HRs using weighted Cox PH models, with the treatment included as a covariate. The standard errors of the relative effects were computed using a robust sandwich estimator.65 Subsequently, these adjusted relative effects were compared with the observed relative effects of enfortumab vedotin versus chemotherapy in the EV-301 trial to estimate the comparative effectiveness of erdafitinib versus enfortumab vedotin, using an anchored MAIC (Bayesian analysis). A Bucher analysis was also conducted.
Fixed-effects models were fitted in a Bayesian framework using Markov chain Monte Carlo simulation methods implemented using WinBUGS.66 Model-fit statistics were therefore not applicable. The weighted relative effects of erdafitinib versus physician’s choice of chemotherapy and the observed relative effects of enfortumab vedotin versus physician’s choice of chemotherapy were synthesized in the Bayesian model (e.g., log-HRs for PFS and OS, log-ORs for ORR, CR, and safety outcomes), where a normal likelihood and identity link were used, following the methods described in the National Institute for Health and Care Excellence (NICE) Decision Support Unit Technical Support Document 2.67 Noninformative normal (0, 1002) priors were assigned to the basic relative effect parameters. All models were run using 3 chains, with a burn-in period of 50,000 iterations. Convergence was assessed using Brooks-Gelman-Rubin diagnostic plots and history plots.68,69 A further simulation sample of 50,000 iterations for each chain was used to inform the results.
As noted previously, a Bucher analysis was conducted using the methods reported in the study by Bucher et al.70 The Bucher method uses a standard meta-analysis to measure the effect of erdafitinib versus enfortumab vedotin as the weighted average of the individual effect measures of the included studies.70 Within-trial and between-trial HRs were generated for OS and PFS outcomes, and ORs and RRs were generated for ORR, CR, AEs, and AE outcomes employing this method.
Assessment of Proportional Hazards
The MAIC of erdafitinib versus enfortumab vedotin for time-to-event outcomes assumes that PH holds for the erdafitinib versus chemotherapy comparison within the matched THOR data, as well as the enfortumab vedotin versus chemotherapy comparison within the observed EV-301 data. To assess this assumption, the log-cumulative hazards for each treatment group were visually compared within these trial datasets. Schoenfeld residuals plots were also visually inspected, and the Grambsch and Therneau test was conducted to quantitatively assess whether there was evidence suggesting a violation of the PH assumption.71
Outcomes Assessed
OS, PFS, ORR, and CR were deemed comparable between the 2 trials. While both trials relied on RECIST 1.1 to determine disease progression, there was a difference in the timing of progression assessment. The EV-301 trial conducted PFS and response assessments every 8 weeks (± 7 days) throughout the study, whereas the THOR trial did so every 6 weeks (± 7 days) for the first year, and the assessments were performed as clinically indicated after the first year. AEs in the THOR trial were reported by patients, whereas AEs were investigator-assessed in the EV-301 trial. However, the process remains fundamentally the same: patients report their symptoms or other health-related issues to the investigator, who then records them in the clinical database as AEs and reports them to the sponsor.
For all outcomes, the relative effects and the 95% CrIs of erdafitinib versus enfortumab vedotin were estimated. In addition, to aid the interpretation of binary outcomes, RRs were derived from the logistic regression models and included in the report. For time-to-event outcomes, the KM curves for the adjusted THOR trial population were displayed for visual comparison, alongside the original KM curves from both the THOR and EV-301 trials.
The analyses for response outcomes (ORR and CR) were restricted to the response-evaluable populations from both trials. Criteria validated by clinical experts were used to select response-evaluable patients in the THOR trial.62 Patients who were not evaluable at baseline (defined in the THOR trial as patients without target lesions at baseline) or at follow-up were excluded from these analyses. The underlying assumption of the MAIC analyses for these outcomes is that the distributions of baseline characteristics in the EV-301 ITT population are like those in the response-evaluable population. Assessment of the baseline characteristics of both populations, evaluation of the balance after adjustment (after reweighting), and examination of the covariate overlap indicate that the assumption was reasonably upheld.
Sensitivity Analyses
Several sensitivity analyses were conducted with both the Bayesian and Bucher approaches to assess the robustness of the results.
Impact of Covariates Included in Adjustment
To assess the impact of adjustment for each covariate on the results, several sensitivity analyses were conducted, where each covariate was cumulatively adjusted for, one-by-one, in the order of their clinical relevance, as ranked in Table 29.
Impact of Population Differences in Terms of Prior Lines of Therapy
It was not possible to match the patients who had received 3 or more lines of therapy in the EV-301 ITT population, as all but 1 patient in the THOR trial received no more than 2 therapies. Therefore, a sensitivity analysis was carried out using data from the subgroup in the EV-301 trial who had received only 1 or 2 prior lines of treatment. This MAIC is only valid if the distribution of the baseline characteristics is similar in the subgroup with 1 or 2 prior lines and in the ITT population with respect to any TEMs. As such, this sensitivity analysis should be interpreted with caution. These subgroup data were only publicly available for PFS, OS, and ORR in the ITT population (not in the response-evaluable population). The sensitivity analyses were, thus, limited to PFS and OS.
Impact of Long-Term Follow-Up in the EV-301 Trial
A sensitivity analysis was conducted using data from the longer follow-up time in the EV-301 trial,72 which had a median follow-up time of 23.75 months. These longer-term data were only publicly available for PFS, OS, ORR, CR, and AE, so this sensitivity analysis was limited to these outcomes.
Methods for the indirect comparison are presented in Table 31.
Table 31: Indirect Comparison Analysis Methods
Methods | THOR vs. EVT-301 Anchored MAIC (Bayesian analysis) and Bucher analysis |
|---|---|
Analysis methods | Bayesian analysis: An anchored MAIC was used, in which the adjusted relative effects were compared to the observed relative effects of enfortumab vedotin vs. chemotherapy in the EV-301 trial to estimate the comparative effectiveness of erdafitinib vs. enfortumab vedotin. Bucher analysis: A standard meta-analysis was used to measure the effect of erdafitinib vs. enfortumab vedotin as a weighted average of the individual effect measures of the included studies. |
Priors | Noninformative normal (0, 1002) priors |
Assessment of model fit | PH model: Log-cumulative hazards for the EV-301 and THOR trials were visually compared, Schoenfeld residuals plots were visually inspected, Grambsch and Therneau test was conducted.71 Because this analysis was conducted with a fixed model, model-fit statistics were not applicable. |
Assessment of distribution or overlap in propensity score or patient weights | Anchored MAIC Bayesian analysis: Balancing weights were derived so that the average baseline characteristics after the reweighting of patients in the THOR trial matched the published aggregate characteristics of patients in the EV-301 trial. These weights were estimated using a propensity-score-type logistic regression equation that predicted whether a given type of patient originated from the THOR trial or the EV-301 trial as a function of baseline characteristics. The weights (𝑤𝑖) were estimated using the method of moments, rather than by maximum likelihood (as might otherwise be the case), because only aggregate data (averages and percentages) for the selected covariates were available for the EV-301 trial population.63 These weights were then used to calculate the ESS achieved after weighting patients. The ESS was calculated as (∑𝑤𝑖)2/(∑ 𝑤𝑖2). After the individual patient weights were computed, the distribution of weights was assessed to identify any overly influential observations. |
Assessment of balance | Anchored MAIC Bayesian analysis: Balance was assessed with a comparison of the baseline characteristics after matching. |
Assessment of consistency | No network meta-analysis was required, as the analyses were based on a comparison of only 2 treatments. As a result, evaluation of the consistency assumption is not applicable. |
Assessment of convergence | Brooks-Gelman-Rubin diagnostic plots and history plots.68,69 |
Outcomes | OS, PFS, ORR, CR, AEs, TEAEs |
Follow-up time points | Erdafitinib median follow-up time was 15.9 months. Enfortumab vedotin median follow-up time was 11.1 months (a longer follow-up time of 23.75 months was available for OS, PFS, ORR, CR, and AEs, which informed the sensitivity analysis). |
Construction of nodes | Not applicable |
Sensitivity analyses | Impact of covariates included in the adjustment. Impact of population differences in terms of prior lines of therapy. Impact of long-term follow-up in the EV-301 trial. |
AE = adverse event; CR = complete response; ESS = effective sample size; MAIC = matching-adjusted indirect comparison; ORR = objective response rate; OS = overall survival; PFS = progression-free survival; PH = proportional hazards; TEAE = treatment-emergent adverse event; vs. = versus.
Results of ITC
Summary of Included Studies
The SLR identified 15 reports for inclusion in the review that reported on 2 relevant studies. The 2 studies, the EV-301 and RANGE studies, presented efficacy and safety outcomes for patients who had received prior ICI therapy.73,74 Because the focus of this SLR was to identify the relevant efficacy and safety data of potential competitors to erdafitinib, the THOR trial was not identified for inclusion. However, it is included in the ITC as the primary source of evidence informing the safety and efficacy of erdafitinib.
The EV-301 study73 was an open-label, multicentre, phase III RCT conducted in 19 countries from January 2013 to July 2020. The key objective of the study was to confirm the clinical benefit of enfortumab vedotin over standard chemotherapy in patients with previously treated, advanced UC. Participants were required to have received 1 or more prior lines of therapy for la/mUC, which must have included at least 1 prior line of PD-1 or PD-L1 inhibitor therapy, although this did not need to be the most recent line of therapy. At least 1 line of prior platinum-based chemotherapy (cisplatin or carboplatin) was also required. For patients who received platinum-based chemotherapy as neoadjuvant or adjuvant therapy, progression must have occurred in the 12 months after completion of the platinum-based chemotherapy treatment in order for patients to be eligible for the trial. The primary outcome of the study was OS, and secondary outcomes included PFS, clinical response, and safety. Tumour response was assessed every 8 weeks until disease progression. The median follow-up period of the study was 11.1 months.
The RANGE study74 was a double-blind, multicentre, phase III RCT conducted in 23 countries from July 2015 to March 2018. The study aimed to confirm the results of a previous phase II study in which ramucirumab plus docetaxel showed a significant improvement in PFS over docetaxel alone. The RANGE study included fewer than 50 patients with prior ICI therapy, and this prior ICI subgroup was not balanced with respect to prognostic factors. At time of enrolment, only 2 ICI therapies were approved for use in the US — atezolizumab and nivolumab — so recruitment was limited to just the US and resulted in a small sample size of patients who had progressed after receiving prior ICI therapy. Statistical analysis was hampered by the small sample size in the subgroup. Thus, the EV-301 trial was determined to be the only viable trial to be compared with the THOR trial through an ITC.
Given the results of the SLR and the assessment of the RANGE study, the 2 trials included in the ITC were the THOR trial and the EV-301 trial; the summary of the characteristics of these trials is presented in Table 32. Briefly, the THOR trial was a global, phase III trial that compared erdafitinib versus chemotherapy in 266 patients with advanced UC harbouring select FGFR alterations who progressed after 1 or 2 prior treatments, at least 1 of which was an anti-PD-L1 drug. The EV-301 trial was a global, phase III trial that evaluated enfortumab vedotin versus standard chemotherapy in 608 patients with previously treated advanced UC who received 1 or more prior lines of therapy, which included at least 1 prior line of PD-L1 inhibitor therapy.
Table 32: Characteristics of the THOR and EV-301 Trials
Characteristic | Loriot et al. (2023)75 THOR (NCT03390504) | Powles et al. (2021)73 EV-301 (NCT03474107) |
|---|---|---|
Objective | To evaluate the efficacy of erdafitinib vs. chemotherapy in participants with advanced UC harbouring selected FGFR alterations who have progressed after 1 or 2 prior treatments, at least 1 of which was an PD-L1 drug. | To confirm the clinical benefit of enfortumab vedotin over standard chemotherapy in patients with previously treated advanced UC. |
Trial design, study size | Global, open-label, phase III study N = 266 | Global, open-label, phase III study N = 608 |
Location | 121 sites in 23 countries | 191 sites in 19 countries |
Follow-up period | Median of 15.9 months | Median of 11.1 months |
Primary and secondary outcomes | Primary outcome: OS Secondary outcomes: PFS, ORR, DoR, PROs, and safety | Primary outcome: OS Secondary outcomes: PFS, clinical response, and safety |
Data collection time points | Disease assessments were performed every 6 weeks for the first 6 months after randomization, then every 12 weeks for the next 6 months. | Radiographic imaging was performed every 8 weeks. Bone scintigraphy was repeated at least every 8 weeks. Brain scans were done throughout the trial. Patients discontinuing treatment before disease progression continued with imaging assessments every 8 weeks until documented disease progression or initiation of another anticancer treatment. After progression, patients entered the long-term follow-up phase and were followed for no less than every 3 months until death, loss to follow-up, withdrawal from trial, or trial termination. |
Number of prior systemic therapies permitted | No more than 2 prior lines of systemic treatment. | 1 or more prior lines of therapy. |
Details of previous chemotherapy | Permitted. | Patients must have received a platinum-based regimen (cisplatin or carboplatin) in the metastatic and/or locally advanced, neoadjuvant, or adjuvant setting. If it was administered in the adjuvant and/or neoadjuvant setting, patients must have progressed in the 12 months after completion of treatment. |
Details of prior ICI therapy | Eligible patients must have undergone prior treatment with an anti-PD-L1 drug as monotherapy or as a combination therapy. Prior treatment with an anti-PD-L1 drug could have been given as frontline or maintenance therapy in a neoadjuvant, adjuvant, or metastatic setting. | Eligible patients must have experienced radiographic progression or relapse during or after a checkpoint inhibitor (PD-1 or PD-L1) for mUC. Patients who discontinued treatment due to toxicity were eligible, provided that the patient had evidence of disease progression after discontinuation. The ICI did not have to be the most recent therapy. |
DoR = duration of response; ICI = immune checkpoint inhibitor; FGFR = fibroblast growth factor receptor; mUC = metastatic urothelial carcinoma; ORR = objective response rate; OS = overall survival; PFS = progression-free survival; PRO = patient-reported outcome; UC = urothelial carcinoma; vs. = versus.
Sources: Powles et al.73,and Loriot et al.75
The characteristics of the 2 trials’ designs, common comparators, and outcome measurements were considered sufficiently comparable to facilitate an ITC. The chemotherapy arm in both trials was considered sufficiently similar to serve as a common comparator. Therefore, it was possible to anchor the ITCs between erdafitinib and enfortumab vedotin using chemotherapy. As such, the validity of the ITCs depends on the balance of TEMs across trials. To adjust for differences in potential TEMs, an MAIC was performed. Nevertheless, the validity and reliability of an MAIC is contingent on the ability to adjust for all imbalances in TEMs, as well as a sufficient sample size after population adjustment. There were differences in population characteristics that could not be adjusted with the MAIC. For example, patients in the THOR trial harboured FGFR gene alterations, whereas patients in the EV-301 trial represented an all-comer population. In addition, all but 1 patient in the THOR trial received no more than 2 prior lines of systemic therapy, whereas a small proportion of patients in the EV-301 trial (13%) received at least 3 prior systemic therapies, meaning it was not possible to match THOR patients to EV-301 patients with at least 3 prior lines of therapy. Despite variations in study characteristics, the trials were deemed sufficiently comparable to support an ITC analysis.
Additional considerations in the assessment of homogeneity between the EV-301 and THOR trials are listed in Table 33.
Table 33: Assessment of Homogeneity in the THOR and EV-301 Trials
Characteristics | Description and handling of potential effect modifiers |
|---|---|
Study design | The THOR and EV-301 trials are both open-label, international, phase III, RCTs that stratified patients by geographic region, ECOG PS, and the presence of metastasis (visceral metastasis in the THOR trial and liver metastasis in the EV-301 trial) at the time of randomization. |
Dosing of comparators | In the THOR trial, erdafitinib was taken orally once daily for 21 days in a 21-day cycle. Patients took an 8 mg dose with a pharmacodynamically guided increase in the dose to 9 mg on day 14. Vinflunine (320 mg/m2) and docetaxel (75 mg/m2) were administered once every 3 weeks through an IV. All treatments were administered until the occurrence of disease progression or unacceptable toxic effects. The median extent of exposure in the erdafitinib group was 146 days (range, 5 to 1,162 days) and in the chemotherapy group was 43 days (range, 1 to 820 days). In the EV-301 trial, enfortumab vedotin (1.25 mg/kg) was administered through an IV on day 1, day 8, and day 15 of a 28-day cycle. Vinflunine (320 mg/m2), docetaxel (75 mg/m2), and paclitaxel (175 mg/m2) were administered through an IV on day 1 of a 21-day cycle. All treatments were administered until radiological disease progression, determined by investigator assessment, until other discontinuation criteria were met, upon study termination, or upon study completion, whichever occurred first. At the date of data cut-off, the median duration of treatment was 5.0 months (range, 0.5 to 19.4) in the enfortumab vedotin group and 3.5 months (range, 0.2 to 15.0) in the chemotherapy group. Vinflunine or docetaxel were used in both trials, and paclitaxel was an option in the EV-301 trial. Although some patients in the chemotherapy arm of the EV-301 trial received paclitaxel, docetaxel and paclitaxel are assumed to be equivalent in terms of efficacy, per individual clinician consultation.62 Therefore, physician’s choice of chemotherapy in both trials is considered sufficiently comparable to be considered a common comparator. |
Definitions of end points | The THOR trial defined OS as the time from the date of randomization until the documented date of death, and PFS as the time from the date of randomization to the date of disease progression or relapse from CR or death, whichever is reported first. ORR was defined as the proportion of participants who achieved a CR or PR, and CR was not defined. The EV-301 trial defined OS as the time from the date of randomization until the documented date of death from any cause, and PFS as the time from date of randomization until date of documented radiological disease progression or death from any cause, whichever occurred first. ORR was defined as the proportion of participants with a CR or PR, and CR was defined as the disappearance of all target and nontarget lesions. The outcome definitions were deemed comparable for the analysis; however, the analyses for response outcomes (ORR and CR) were restricted to the response-evaluable populations from both trials. Patients who were not evaluable at baseline or at follow-up were excluded from these analyses. |
Timing of end point evaluation | In the THOR trial, OS, PFS, ORR, and CR were evaluated every 6 weeks (± 7 days). The median follow-up time for all these end points was 15.9 months. AEs were evaluated from the date of informed consent was signed up to 30 days after last dose. In the EV-301 trial, OS, PFS, ORR, and CR were evaluated every 8 weeks (± 7 days). The median follow-up time for all these end points was 11.1 months. AEs were evaluated from the date of signed informed consent up to 30 days after last dose. A longer follow-up time of 23.75 months is available for OS, PFS, ORR, CR and AEs. This discrepancy between the timing of response assessments is a limitation of the analysis. |
Disease severity | The THOR and EV-301 trials both reported the origin site of disease (upper urinary tract, bladder, or other), as well as visceral and liver sites of metastasis, and were comparable between trials. The EV-301 trial also reported sites of metastasis, including lymph nodes only. Time since the diagnosis of metastatic or locally advanced disease (median [minimum to maximum]) was reported in the EV-301 trial as 14.8 months (0.2 to 114.1) for the enfortumab vedotin group and 13.2 months (0.3 to 118.4) for the chemotherapy group. Time from the diagnosis of surgically unresectable or metastatic disease to randomization (median [minimum to maximum]) was reported in the THOR trial as 12.9 months (0.6 to 74.6) for the erdafitinib group and 11.7 months (1.8 to 63.5) for the chemotherapy group. Because of the eligibility criteria, 9.4% of patients in the THOR trial had an ECOG PS of 2, compared with 0% in the EV-301 trial. Patients were similar between the 2 trials with regard to Bellmunt score, as ███ of patients in the THOR trial had a Bellmunt risk score of 2 compared with 32% in the EV-301 trial. To adjust for any differences in baseline disease characteristics, the MAIC adjusted for ECOG PS (0, 1), Bellmunt risk score (0 or 1, ≥ 2), the presence of liver or visceral metastases, and the origin of primary disease. Patients in the THOR trial with an ECOG PS of 2 were excluded from the analysis to harmonize the trial population with that of the EV-301 trial. |
Treatment history | In the THOR trial, 99.3% of the erdafitinib group and 100.0% of the chemotherapy group had received 1 or 2 prior systemic therapies; 1 patient in the erdafitinib group (0.7%) had received 3 or more prior systemic therapies. Only 10.3% of patients in the erdafitinib group and 14.6% of patients in the chemotherapy group had received no prior platinum-based therapy. In the EV-301 trial, 87.0% of the enfortumab vedotin group and 87.9% of the chemotherapy group had received 1 or 2 previous systemic therapies, whereas 13% of patients in the enfortumab vedotin group and 12.1% of patients in the chemotherapy group had received 3 or more previous systemic therapies. All patients in both arms had received prior platinum-based therapy. It was, therefore, not possible to match THOR patients to EV-301 patients with ≥ 3 prior therapies. To address this limitation, a sensitivity analysis was carried out using data from the subgroup of patients in the EV-301 trial who had received only 1 or 2 prior lines of treatment. Patients in the THOR trial who had received no prior platinum-based chemotherapy or more than 1 prior line of chemotherapy were excluded to better align the trial population with that of the EV-301 trial. |
Trial eligibility criteria | The THOR trial enrolled adults with metastatic or surgically unresectable UC who had at least 1 FGFR alteration; the EV-301 trial enrolled adults with la/mUC regardless of genetic alteration status. It was not possible to adjust for differences in the distribution of patients with FGFR alterations, which is a limitation of the analysis. |
AE = adverse event; CR = complete response; DoR = duration of response; ECOG PS = Eastern Cooperative Oncology Group Performance Status; FGFR = fibroblast growth factor receptor; la/mUC = locally advanced unresectable or metastatic urothelial carcinoma; MAIC = matching-adjusted indirect comparison; ORR = objective response rate; OS = overall survival; PFS = progression-free survival; PR = partial response; UC = urothelial carcinoma ; vs. = versus.
Efficacy
Baseline summaries of the covariates considered for adjustment are presented in Table 34 for patients in the THOR and EV-301 trials. Baseline characteristics for the THOR trial were summarized across 3 distinct datasets:
Observed Dataset
This refers to the initial, unmodified dataset.
Exclusion Criteria Applied Dataset
Th exclusion criteria applied dataset was derived after aligning eligibility criteria in the THOR trial with those in the EV-301 trial. A total of 69 of 266 patients (25.9%) were excluded from the THOR trial because they had an ECOG PS of 2 (n = 25), had received no prior platinum-based chemotherapy (n = 33), had received more than 1 prior line of chemotherapy (n = 11), or because the distribution of baseline characteristics slightly changed, most notably for ECOG PS, which was to be expected.
Matched Dataset
The matched dataset involves an additional level of refinement, in which patients in the exclusion criteria applied dataset were weighted to adjust for differences in baseline covariates between the THOR and EV-301 trials. After applying the individual patient weights to the remaining THOR patients, the average baseline characteristics matched those observed in the EV-301 trial. The ESS decreased from 197 to 126, marking a 36% reduction.
Table 34: Baseline Characteristics for the EV-301 and THOR Trials Before and After Matching Patients
Variable | EV-301, observed (N = 608) | THOR, observed (N = 266) | THOR, exclusion criteria applied (n = 197) | THOR, matched (ESS = 126) |
|---|---|---|---|---|
Bellmunt risk score, % | ||||
0 or 1 | 68 | 74 | 78 | 68 |
2 | 32 | 26 | 22 | 32 |
ECOG PS, % | ||||
0 | 40 | 43 | 48 | 40 |
1 | 60 | 48 | 52 | 60 |
Presence of liver metastasis, % | ||||
Yes | 25 | 26 | 26 | 25 |
Presence of visceral metastasis, % | ||||
Yes | 66 | 74 | 76 | 66 |
Origin of primary disease, % | ||||
Upper urinary tract | 34 | 33 | 35 | 34 |
Bladder or other site | 66 | 67 | 65 | 66 |
Smoking status, % | ||||
Never smoked | 33 | 34 | 31 | 33 |
History of diabetes or hyperglycemia, % | ||||
Yes | 19 | 12 | 12 | 19 |
Region, % | ||||
US | 14 | 5 | 5 | 14 |
Western Europe | 42 | 61 | 60 | 42 |
Other | 44 | 34 | 36 | 44 |
Age in years | ||||
Median < 75, % | 68 | 67 | 67 | 68 |
Median ≥ 75, % | 20 | 21 | 20 | 20 |
Sex | ||||
Female, % | 23 | 29 | 29 | 23 |
Male, % | 77 | 71 | 71 | 77 |
ECOG PS = Eastern Cooperative Oncology Group performance score; ESS = effective sample size.
Overall Survival
In terms of OS, the matching adjustment had limited impact on the relative effectiveness, as the HRs for erdafitinib versus enfortumab vedotin were consistent before and after matching (refer to Table 35 and Figure 18). Erdafitinib had a postadjustment HR of 0.92 (95% CrI, 0.54 to 1.57).
The width of the corresponding CrIs increased after the matching of THOR patients, which was in line with the reduction in ESS.
The Bucher method within-trial and between-trial HRs are presented in Table 36.
Table 35: Within-Trial and Between-Trial HRs for OS (Bayesian Method)
Indirect comparison | HRs (95% CI) | HRs (95% CrI) | |
|---|---|---|---|
EV-301, enfortumab vedotin vs. chemotherapy | THOR, erdafitinib vs. chemotherapy | Erdafitinib vs. enfortumab vedotin | |
Observed | 0.70 (0.56 to 0.89) | 0.64 (0.47 to 0.88) | 0.91 (0.62 to 1.35) |
Exclusion criteria applied | — | 0.65 (0.44 to 0.94) | 0.92 (0.59 to 1.43) |
Matched | — | 0.65 (0.40 to 1.05) | 0.92 (0.54 to 1.57) |
CI = confidence interval; CrI = credible interval; HR = hazard ratio; OS = overall survival; vs. = versus.
Progression-Free Survival
In terms of PFS, the HRs for erdafitinib versus enfortumab vedotin were consistent before and after matching of the THOR patients to the EV-301 population (Table 37)
Erdafitinib, when compared to enfortumab vedotin, had a postadjustment HR of 0.93 (95% CrI, 0.55, 1.56). The CrIs widened after matching the THOR patients, which was in line with the decrease in ESS. There was evidence suggesting a slight deviation from the PH assumption for PFS in the THOR trial, both before and after matching.
The Bucher method within-trial and between-trial HRs are presented in Table 38.
Figure 18: OS Base Case — KM Curves
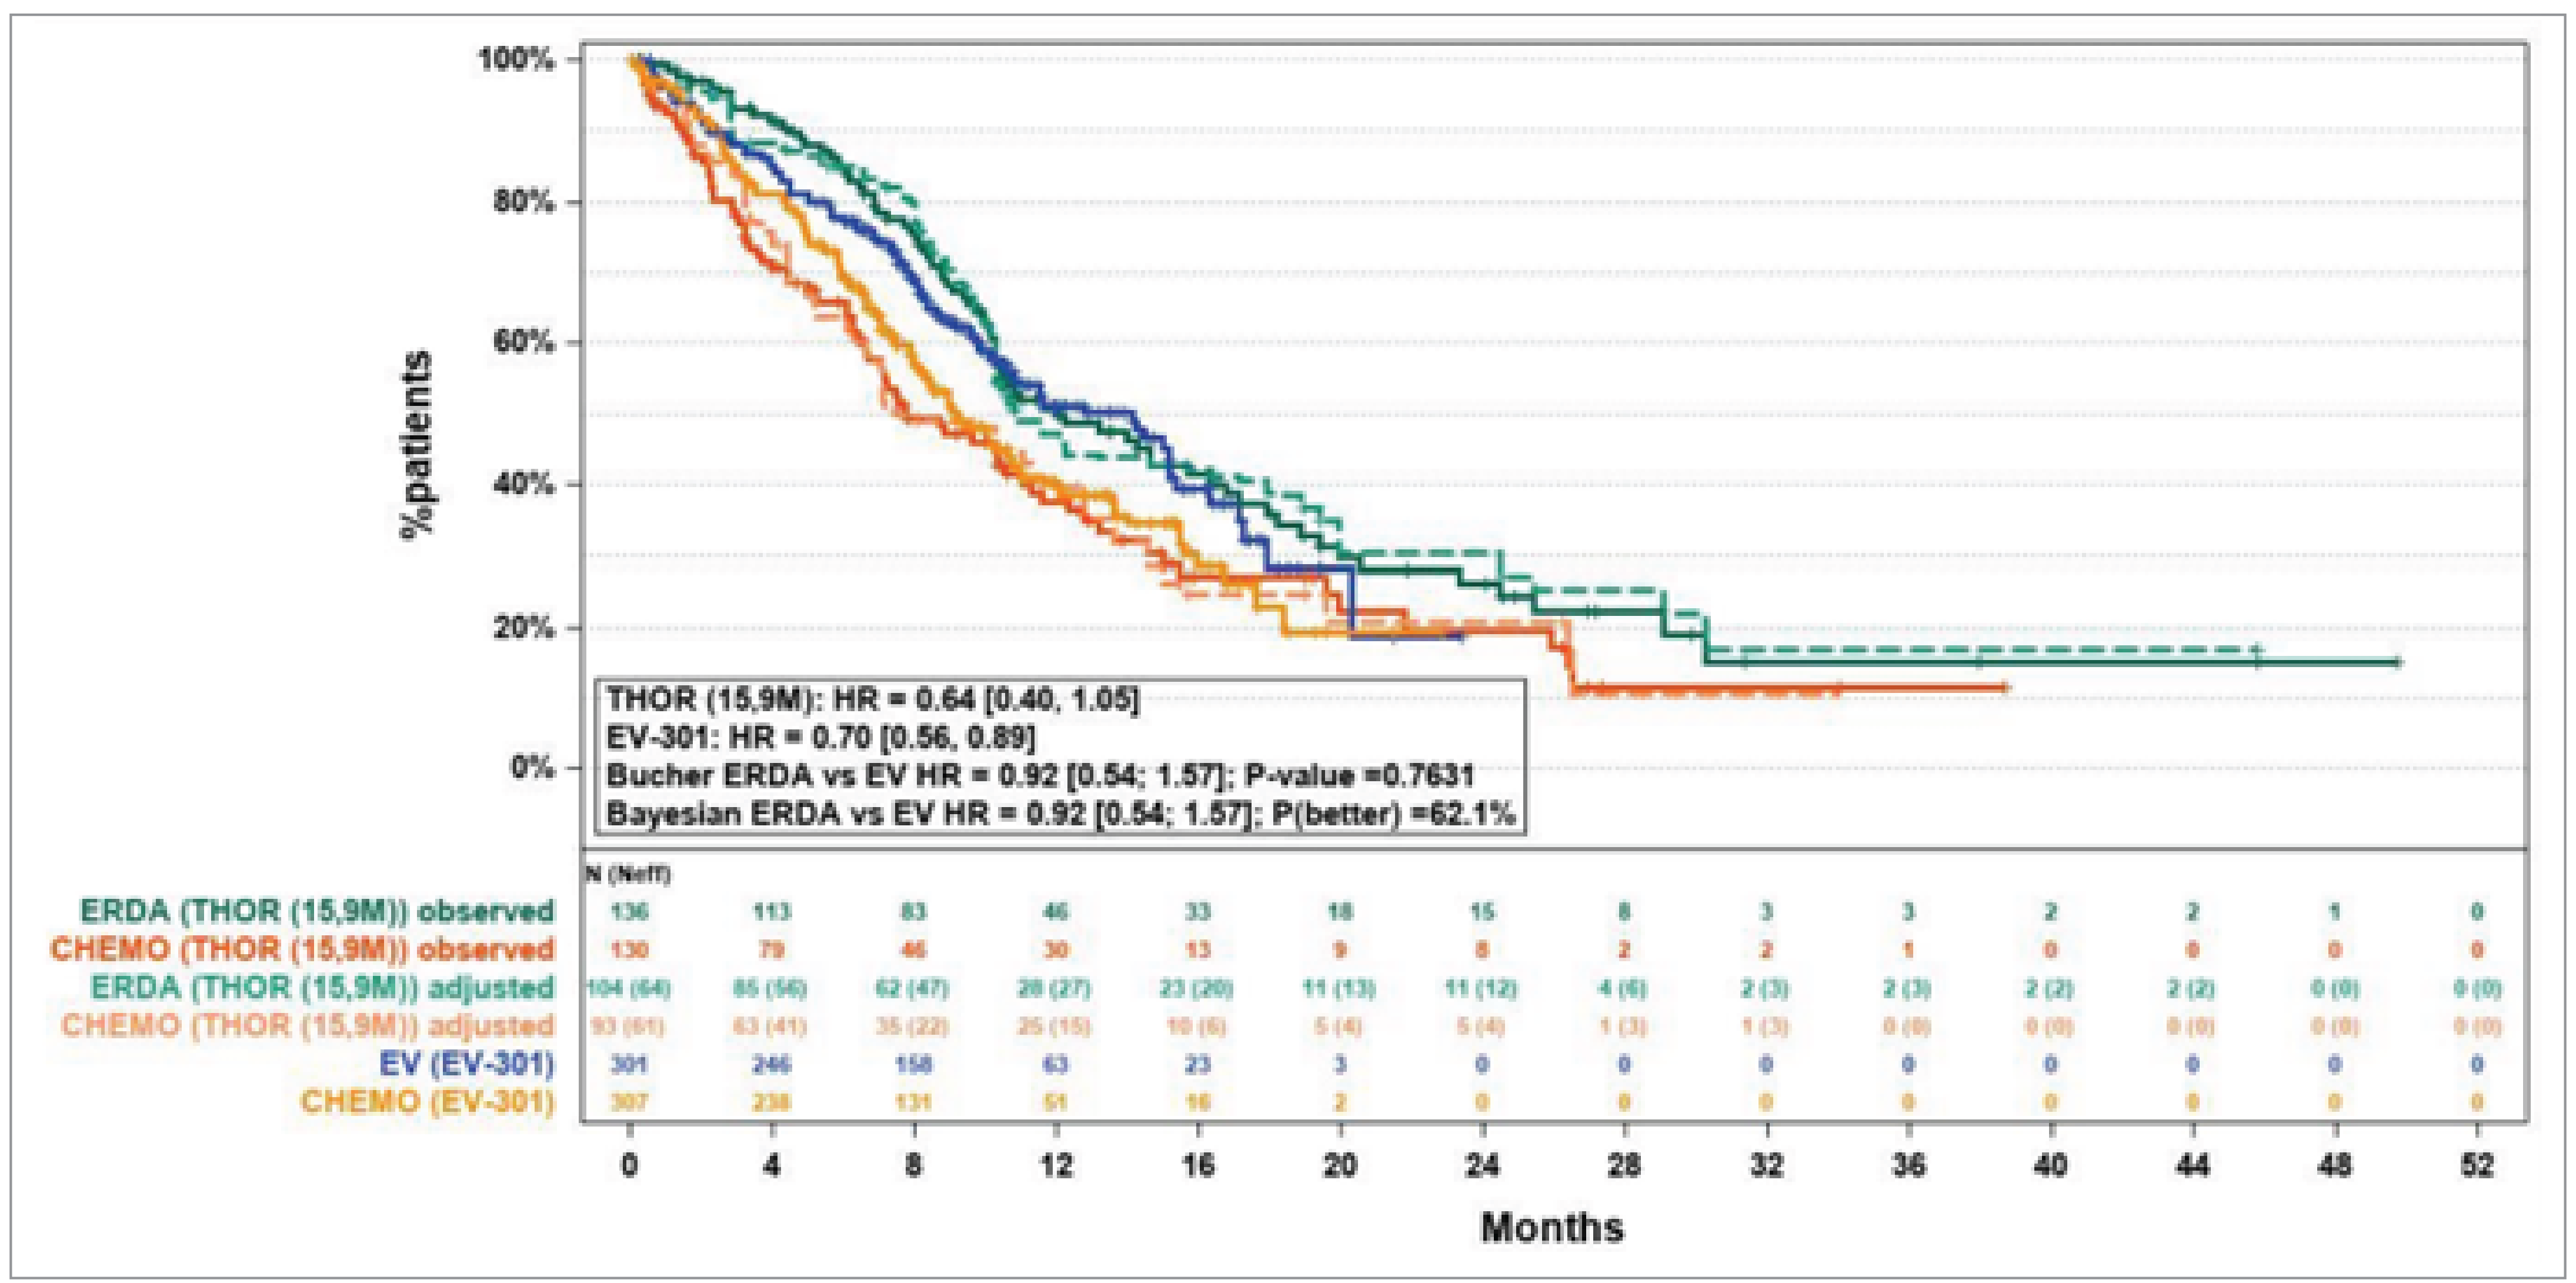
15.9M = 15.9 months of the follow-up period; CHEMO = chemotherapy; ERDA = erdafitinib; EV = enfortumab vedotin; HR = hazard ratio; KM = Kaplan-Meier; OS = overall survival.
Table 36: Within-Trial and Between-Trial HRs for OS (Bucher Method)
Indirect comparison | HRs (95% CI) | ||
|---|---|---|---|
EV-301, enfortumab vedotin vs. chemotherapy | THOR, erdafitinib vs. chemotherapy | Erdafitinib vs. enfortumab vedotin | |
Observed | ████ ██████ ██ | ████ ██████ ██ | ████ ██████ ██ |
Exclusion criteria applied | — | ████ ██████ ██ | ████ ██████ ██ |
Matched | — | ████ ██████ ██ | ████ ██████ ██ |
CI = confidence interval; HR = hazard ratio; OS = overall survival; vs. = versus.
Table 37: Within-Trial and Between-Trial HRs for PFS (Bayesian Method)
Indirect comparison | HRs (95% CI) | HRs (95% CrI) | |
|---|---|---|---|
EV-301, enfortumab vedotin vs. chemotherapy | THOR, erdafitinib vs. chemotherapy | Erdafitinib vs. enfortumab vedotin | |
Observed | 0.62 (0.51 to 0.75) | 0.58 (0.44 to 0.78) | 0.94 (0.67 to 1.33) |
Exclusion criteria applied | — | 0.54 (0.38 to 0.75) | 0.87 (0.59 to 1.28) |
Matched | — | 0.58 (0.36 to 0.94) | 0.93 (0.55 to 1.56) |
CI = confidence interval; CrI = credible interval; HR = hazard ratio; PFS = progression-free survival; vs. = versus.
Table 38: Within-Trial and Between-Trial HRs for PFS (Bucher Method)
Indirect comparison | HRs (95% CI) | ||
|---|---|---|---|
EV-301, enfortumab vedotin vs. chemotherapy | THOR, erdafitinib vs. chemotherapy | Erdafitinib vs. enfortumab vedotin | |
Observed | ████ ██████ ██ | ████ ██████ ██ | ████ █████ |
Exclusion criteria applied | — | ████ ██████ ██ | ████ ██████ |
Matched | — | ████ ██████ ██ | ████ ██████ |
CI = confidence interval; HR = hazard ratio; PFS = progression-free survival; vs. = versus.
ORR (Response-Evaluable Population)
In terms of ORR, the relative effects of erdafitinib versus enfortumab vedotin increased after matching the THOR patients to the EV-301 population (Table 39). Erdafitinib compared to enfortumab vedotin had a postadjustment RR of 1.49 (95% CrI, 0.56 to 3.90). The Bucher method ORs and RRs for erdafitinib versus enfortumab vedotin for ORR are presented in Table 40.
Table 39: ORs and RRs for Erdafitinib vs. Enfortumab Vedotin ORR (Bayesian Method)
Erdafitinib vs. enfortumab vedotin ORR | |||
|---|---|---|---|
OR (95% CrI) | Probability erdafitinib is better (based on OR) | RR (95% CrI) | |
Observed | 1.27 (0.55 to 2.91) | ██████ | 1.32 (0.68 to 2.54) |
Exclusion criteria applied | 1.58 (0.61 to 4.01) | ██████ | 1.55 (0.73 to 3.26) |
Matched | 1.43 (0.44 to 4.56) | ██████ | 1.49 (0.56 to 3.90) |
CrI = credible interval; OR = odds ratio; ORR = objective response rate; RR = risk ratio; vs. = versus.
Table 40: ORs and RRs for Erdafitinib vs. Enfortumab Vedotin ORR (Bucher Method)
Erdafitinib vs. enfortumab vedotin ORR | Erdafitinib vs. enfortumab vedotin | |
|---|---|---|
OR (95% CI) | RR (95% CI) | |
Observed | ████ ██████ █████ | ████ ██████ █████ |
Exclusion criteria applied | ████ ██████ █████ | ████ ██████ █████ |
Matched | ████ ██████ █████ | ████ ██████ █████ |
CI = confidence interval; OR = odds ratio; ORR = objective response rate; RR = risk ratio; vs. = versus.
CR (Response-Evaluable Population)
In terms of CR, the relative effects of erdafitinib versus enfortumab vedotin increased after matching the THOR patients to the EV-301 population (Table 41). Erdafitinib compared to enfortumab vedotin had a postadjustment RR of 2.89 (95% CrI, 0.27 to 30.33). The Bucher method ORs and RRs for erdafitinib versus enfortumab vedotin for CR are presented in Table 42.
Table 41: ORs and RRs for Erdafitinib vs. Enfortumab Vedotin for CR (Bayesian Method)
Erdafitinib vs. enfortumab vedotin CR | OR (95% CrI) | RR (95% CrI) |
|---|---|---|
Observed | 1.62 (0.15 to 17.24) | 1.62 (0.15 to 16.66) |
Exclusion criteria applied | 3.88 (0.36 to 40.33) | 3.80 (0.37 to 38.36) |
Matched | 2.91 (0.27 to 30.57) | 2.89 (0.27 to 30.33) |
CR = complete response; CrI = credible interval; OR = odds ratio; RR = risk ratio; vs. = versus.
Table 42: ORs and RRs for Erdafitinib vs. Enfortumab Vedotin for CR (Bucher Method)
Erdafitinib vs. enfortumab vedotin CR | OR (95% CrI) | RR (95% CrI) |
|---|---|---|
Observed | ████ ██████ ██████ | ████ ██████ ██████ |
Exclusion criteria applied | ████ ██████ ██████ | ████ ██████ ██████ |
Matched | ████ ██████ ██████ | ████ ██████ ██████ |
CR = complete response; CrI = credible interval; OR = odds ratio; RR = risk ratio; vs. = versus.
Sensitivity Analyses
In the sensitivity analysis, where each covariate was cumulatively adjusted, the Bayesian and Bucher estimates for the HR for erdafitinib versus enfortumab vedotin were consistent across all covariates for OS, PFS, ORR, and CR.
Similar results were observed when comparing OS and PFS of the matched THOR patients to the outcomes of the ITT patients and to patients in the subgroup who received 1 or 2 prior lines of therapy in the EV-301 trial.
The longer-term results in the EV-301 trial for OS and PFS were similar to the interim results, so had negligible impact on the HR for erdafitinib versus enfortumab vedotin estimated in the Bayesian and Bucher analyses. Similarly, the longer-term ORR and CR results in the EV-301 trial closely resembled the interim findings, so had minimal influence on the estimated relative efficacy of erdafitinib compared with enfortumab vedotin estimated in the Bayesian and Bucher analyses.
Harms
Adverse Events
The comparative safety of erdafitinib and enfortumab vedotin in terms of AEs are summarized in Table 43. For any AE, an RR of 1.02 (95% CrI, 0.98 to 1.06) was observed. For the remaining AEs, erdafitinib demonstrated a safety profile comparable to that of enfortumab vedotin, with an RR close to 1 in most cases. The Bucher method ORs and RRs for erdafitinib versus enfortumab vedotin for AEs are presented in Table 44.
Table 43: ORs and RRs for Erdafitinib vs. Enfortumab Vedotin for Various AE Outcomes (Bayesian Method)
Erdafitinib vs. enfortumab vedotin | OR (95% CrI) | RR (95% CrI) |
|---|---|---|
Any AE | 3.83 (0.37 to 39.69) | 1.02 (0.98 to 1.06) |
Any SAE | 1.16 (0.52 to 2.55) | 1.09 (0.69 to 1.74) |
AE leading to treatment withdrawal | 0.94 (0.32 to 2.78) | 0.96 (0.38 to 2.38) |
AE leading to death | 1.11 (0.21 to 5.69) | 1.11 (0.23 to 5.23) |
Any AE of grade 3+ | 0.98 (0.43 to 2.22) | 1.00 (0.75 to 1.34) |
AE = adverse event; CrI = credible interval; OR = odds ratio; RR = risk ratio; SAE = serious adverse event; vs. = versus.
Table 44: ORs and RRs for Erdafitinib vs. Enfortumab Vedotin for Various AE Outcomes (Bucher Method)
Erdafitinib vs. enfortumab vedotin | OR (95% CI) | RR (95% CI) |
|---|---|---|
Any AE | ████ ██████ ██████ | ████ ██████ █████ |
Any SAE | ████ ██████ █████ | ████ ██████ █████ |
AE leading to treatment withdrawal | ████ ██████ █████ | ████ ██████ █████ |
AE leading to death | ████ ██████ █████ | ████ ██████ █████ |
Any AE of grade 3+ | ████ ██████ █████ | ████ ██████ █████ |
AE = adverse event; CI = confidence interval; OR = odds ratio; RR = risk ratio; SAE = serious adverse event; vs. = versus.
Critical Appraisal of the ITC
Given the lack of direct head-to-head comparisons, it is important to acknowledge that the MAIC approach was justified and appropriately anchored in this context. Despite the justifications for using this methodology, the results of this ITC analysis should be interpreted with caution, considering several limitations.
The timelines for the end points and the end point assessments were generally consistent in the included trials, which provided a solid foundation for comparison. However, a systematic identification of TEMs was not fully completed; instead, a pragmatic approach was employed by consulting clinical experts in UC. Although the experts identified appropriate TEMs and found no other critical effect modifiers to include, the potential for residual confounding due to unmeasured or unknown TEMs remains a key limitation inherent in any MAIC. For example, it was not possible to adjust for covariates such as FGFR alterations, as the EV-301 trial did not assess FGFR status during enrolment. The impact of this unmeasured factor on the MAIC results is unclear, and introduces further uncertainty.
Furthermore, it was not possible to include some variables in the main analysis, such as ECOG PS, which could limit the generalizability of the results for patients with specific characteristics. This exclusion may lead to uncertainty regarding the applicability of the findings to broader patient populations. Additionally, there was evidence suggesting a slight deviation from the PH assumption for PFS in the THOR trial, both before and after matching, which could affect the validity of the results.
Despite conducting sensitivity analyses, these too were subject to limitations. For instance, the sensitivity analysis based on the baseline characteristics of patients who had received 1 or 2 prior lines of therapy was constrained by the inability to match patients who had received 3 or more lines of therapy in the ITT population of the EV-301 trial. This limitation may introduce bias related to differences in participant characteristics and potential imbalances between the groups.
Moreover, only fixed-effects models were employed within the Bayesian framework. The use of random-effects models could have provided additional insights by exploring the impact of heterogeneity in the data and assessing the robustness of the Bayesian inference in the results.
There were notable discrepancies between the ORs and RRs in terms of estimated effects and the precision of the estimates for some end points (e.g., AEs). The exact reason for these discrepancies is unclear. Additionally, for most end points, wide CrIs were observed, likely due to the reduced ESS after matching. These wide intervals create considerable uncertainty related to the imprecision of the true estimates, which must be considered when interpreting the results.
Finally, as a post hoc analysis of trials, the MAIC design is not powered to detect differences in treatment effects with high certainty. The ESS is inherently limited by the original size of the trials, and further reductions occurred because of harmonization and matching of the trial populations. This reduction makes it challenging to determine the degree of uncertainty added to the effect estimates, particularly in cases where meaningful differences in efficacy between the treatments are suspected. The 36% reduction in ESS was deemed to be appropriate for conducting the analyses, yet it underscores limitations in the power of the MAIC.
Studies Addressing Gaps in the Systematic Review Evidence
No studies addressing gaps in the evidence from the systematic review were included in the sponsor’s submission to CDA-AMC.
Discussion
Summary of Available Evidence
The body of evidence informing this submission consists of 1 pivotal study that compared erdafitinib with chemotherapy in patients with la/mUC. The THOR study was a RCT of adult patients (N = 266) with FGFR3-altered and/or FGFR2-altered UC who randomly received erdafitinib (n = 136) or chemotherapy (n = 130). The trial was conducted in 23 countries, including multiple sites in Canada, and enrolled a population that mostly reflected patients currently seen in clinical practice in Canada and relevant to this submission.
A supplemental body of evidence was submitted in the form of an ITC that contrasted the clinical effects of erdafitinib with those of enfortumab vedotin, using a MAIC in the population of patients with la/mUC harbouring FGFR genetic alterations.
No long-term extension studies or other studies addressing gaps in the evidence were submitted.
Interpretation of Results
Efficacy
For patients with la/mUC, the end points evaluated in this study, such as OS, PFS, ORR, DoR, and HRQoL, were all considered significant by the clinical experts consulted by CDA-AMC. The experts concur that most patients will prioritize survival and PFS over AEs that are manageable when making treatment decisions, especially given the poor prognosis associated with this condition. According to the experts, even modest improvements in survival time will potentially influence a patient's daily life and decision-making processes.
OS was one of the main outcomes in the THOR study and was considered critical for decision-making by the clinical experts consulted by CDA-AMC and other parties of interest. The body of evidence from the pivotal study showed that erdafitinib, compared with chemotherapy, results in a clinically important increase in the number of patients who survive at 6 months. When assessing median OS, patients treated with erdafitinib lived about 12.1 months, compared to 7.8 months for those treated with chemotherapy. The clinical experts emphasized that an additional 4.3 months of life can be highly significant for patients facing a serious condition with a poor prognosis. However, it is important to note that the long-term effects of erdafitinib are less certain, especially beyond 12 months. There were fewer patients available for evaluation at later time points because of deaths and loss to follow-up, which reduces the robustness of the long-term results. The survival advantage of erdafitinib over chemotherapy appeared to diminish by the 24-month follow-up. However, it was still maintained. Currently, uncertainty remains because of imprecision in the effect estimates, driven by the low number of events and patients.
The effects on PFS were also present, indicating that erdafitinib may result in an increase in median PFS with an advantage of almost 2 months over chemotherapy (5.55 months versus 2.7); however, as with OS, the effect estimates evaluated at the specific time points of 6 months, 12 months, and 24 months become increasingly uncertain over time because of imprecision (widening CIs) due to the low number of patients evaluated at these time points.
Estimates of clinical response based on the ORR suggest that erdafitinib likely results in clinically important improvements in the number of patients meeting the ORR criteria (CR + PR) with more precise estimates, both as relative (RR = 3.94; 95% CI, 2.3 to 6.5) and absolute effects (███ ████ ████████ ███ ████ ████████ ███ ██ ████ ███ ████ ██ ███ ████ ███ ████). The effects on DoR were uncertain because of the wide CI on differences at 6 months and 12 months, indicating imprecision at both times this end point was evaluated.
In the THOR study, HRQoL was assessed to gauge the impact of treatment on the overall well-being of patients. The tools to measure PROs had adequate measures of validity, reliability, and responsiveness. However, the estimates across various assessment points showed imprecision in the effects observed between the groups. This implies that although erdafitinib and chemotherapy differ in their survival outcomes, their impact on a patient's quality of life remains uncertain.
The sponsor's submitted ITC aimed to assess the efficacy and safety of erdafitinib relative to enfortumab vedotin in patients with UC who had progressed after 1 or 2 prior treatments, including at least 1 anti-PD-L1 drug. Enfortumab vedotin, the only relevant comparator in this setting, has been primarily evaluated in the EV-301 trial. Because of the lack of direct head-to-head evidence between erdafitinib and enfortumab vedotin, an anchored MAIC was performed. The population-matching process reduced the ESS from 197 to 126, a 36% reduction, which was deemed to be adequate to support comparisons across all efficacy and safety outcomes.
In the base-case analyses, the effect estimates for OS, PFS, ORR, and CR showed wide CrIs, reflecting an inability to determine whether one treatment is superior to the other for any of these end points.
Overall, the results from the ITC suggest substantial uncertainty regarding whether erdafitinib and enfortumab vedotin differ meaningfully in terms of survival, response outcomes, or harms. This uncertainty is primarily attributed to the imprecision observed in the CrIs of the effect estimates.
Harms
In the THOR study, the safety profiles of erdafitinib and chemotherapy demonstrated significant toxicity in both treatment arms. AEs occurred in nearly all patients, with 98.5% of the erdafitinib group and 97.3% of the chemotherapy group experiencing AEs. SAEs were similarly frequent, affecting 41.5% of patients in the erdafitinib group and 42.0% of patients in the chemotherapy group, indicating that both treatments pose a comparable risk of severe toxicity. Common AEs for erdafitinib included hyperphosphatemia, stomatitis, and diarrhea, with hyperphosphatemia being particularly notable, affecting 80% of patients and necessitating ongoing monitoring. Eye-related AEs, specifically CSR, were also a significant concern with erdafitinib, impacting 17.0% of patients and requiring close ophthalmologic follow-up.
The rates of treatment discontinuation due to AEs were slightly lower in the erdafitinib group than in the chemotherapy group (14.1% versus 17.9%), and both groups frequently required dose reductions and interruptions to manage toxicity. Although erdafitinib offers a survival benefit over chemotherapy, there is a high incidence of AEs that are unique to erdafitinib — such as hyperphosphatemia and CSR— which may require individual considerations and monitoring. The clinical experts consulted by CDA-AMC emphasized that patients will likely value the effects on survival more than manageable AEs.
Based on the information obtained from the ITC (MAIC) submitted by the sponsor, the comparison of safety profiles between erdafitinib and enfortumab vedotin showed wide CrIs for many important safety end points, including SAEs and death. As a result, the estimates for these outcomes are highly uncertain, making it difficult to determine whether one treatment is superior to the other in terms of safety. The wide CrIs highlight the inability of the ITC to provide definitive conclusions regarding clinically meaningful differences in harms between the 2 interventions.
Conclusion
Evidence from the pivotal THOR study shows that in patients with la/mUC harbouring FGFR3 and/or FGFR2 alterations, erdafitinib improves OS, PFS, and the overall response rate, compared with chemotherapy. These benefits come with specific, although clinically manageable, AEs, such as hyperphosphatemia and CSR. Although the study provides robust evidence of efficacy, there are gaps in the available data, particularly regarding long-term safety and the effects in specific populations, such as those with a poorer performance status or extensive prior chemotherapy exposure. From a clinical perspective, the benefits of erdafitinib align with patient needs and expectations for new treatments that prolong survival.
There is a lack of direct comparative data on the clinical effects and position of erdafitinib against other emerging relevant comparators in the treatment landscape of la/mUC in Canada. The sponsor-submitted ITC, which used a MAIC, assessed the efficacy and safety of erdafitinib relative to enfortumab vedotin using data from the THOR and EV-301 trials. The results showed adjusted HRs for OS and PFS with wide CrIs, indicating substantial imprecision, making it difficult to determine whether erdafitinib or enfortumab vedotin offers a superior outcome. Although a potential increase in ORR and CR rates is suggested with erdafitinib, the wide CrIs again reflect a high level of uncertainty. In terms of safety, risk ratios for AEs also showed wide CrIs, which contribute to the uncertainty and make it difficult to draw definitive conclusions.
Overall, erdafitinib offers a significant clinical benefit over chemotherapy by extending survival and inducing responses for a targeted group of patients with la/mUC, but more certainty is needed to assess the effects erdafitinib against other emerging relevant comparator therapies in the clinical landscape of Canada.
References
1.Cleveland Clinic. Urothelial Carcinoma (Transitional Carcinoma). https://my.clevelandclinic.org/health/diseases/6239-transitional-cell-cancer. Accessed 2023 Nov 01.
2.National Cancer Institute. What Is Bladder Cancer? https://www.cancer.gov/types/bladder. Accessed 2024 Jul 15.
3.Locally Advanced/Metastatic Bladder Cancer Clinical Practice Guideline. Edmonton (AB): Cancer Care Alberta; 2023: https://www.albertahealthservices.ca/assets/info/hp/cancer/if-hp-cancer-guide-gu014-ambc.pdf. Accessed 2023 Dec 01.
4.Al-Husseini MJ, Kunbaz A, Saad AM, et al. Trends in the incidence and mortality of transitional cell carcinoma of the bladder for the last four decades in the USA: a SEER-based analysis. BMC Cancer. 2019;19(1):46. PubMed
5.Canadian Cancer Society. What is bladder cancer? https://cancer.ca/en/cancer-information/cancer-types/bladder/what-is-bladder-cancer. Accessed 2023 Nov 01.
6.Canadian Cancer Statistics Advisory Committee. Canadian Cancer Statistics 2023. Toronto (ON): Canadian Cancer Society: https://cdn.cancer.ca/-/media/files/research/cancer-statistics/2023-statistics/2023_PDF_EN.pdf. Accessed 2024 Jul 14.
7.Canadian Cancer Society. Bladder cancer statistics. 2023; https://cancer.ca/en/cancer-information/cancer-types/bladder/statistics. Accessed 2023 Dec 01.
8.International Agency for Research on Cancer. Cancer Today. Population Factsheets - Canada. Geneva (CH): World Health Organization; 2024: https://gco.iarc.who.int/media/globocan/factsheets/populations/124-canada-fact-sheet.pdf. Accessed 2024 May 01.
9.Flaig TW, Spiess PE, Agarwal N, et al. Bladder Cancer, Version 3.2020, NCCN Clinical Practice Guidelines in Oncology. J Natl Compr Canc Netw. 2020;18(3):329-354. PubMed
10.National Cancer Institute. Bladder Cancer Symptoms. https://www.cancer.gov/types/bladder/symptoms. Accessed 2023 Dec 06.
11.Cancer Research UK. Symptoms of metastatic bladder cancer. 2023; https://www.cancerresearchuk.org/about-cancer/bladder-cancer/metastatic/symptoms. Accessed 2023 Dec 01.
12.Lotan Y, Choueiri TK. Clinical presentation, diagnosis, and staging of bladder cancer. In: Post TW, ed. UpToDate. Waltham (MA): UpToDate; 2024: http://www.uptodate.com. Accessed 2024 Aug 13.
13.Lerner SP. Overview of the initial approach and management of urothelial bladder cancer. In: Post TW, ed. UpToDate. Waltham (MA): UpToDate; 2024: http://www.uptodate.com. Accessed 2024 Aug 13.
14.Government of Canada. Bladder cancer in Canada. 2021; https://www.canada.ca/en/public-health/services/publications/diseases-conditions/bladder-cancer-canada.html. Accessed 2023 Dec 01.
15.Bukhari N, Al-Shamsi HO, Azam F. Update on the Treatment of Metastatic Urothelial Carcinoma. Sci World J. 2018;2018:5682078. PubMed
16.Daneshmand S. Epidemiology and risk factors of urothelial carcinoma of the bladder. In: Post TW, ed. UpToDate Waltham (MA): UpToDate 2024: http://www.uptodate.com. Accessed 2024 Aug 13.
17.Canadian Cancer Society. Diagnosis of bladder cancer. https://cancer.ca/en/cancer-information/cancer-types/bladder/diagnosis. Accessed 2023 Dec 07.
18.Bladder Cancer Diagnosis and Treatment Pathway Version 2023.09. Toronto (ON): Cancer Care Ontario: https://www.cancercareontario.ca/sites/ccocancercare/files/assets/CCOBladderPathwayMap.pdf. Accessed 2024 Mar 08.
19.National Cancer Institute. Bladder Cancer Diagnosis. https://www.cancer.gov/types/bladder/diagnosis. Accessed 2023 Dec 06.
20.Canadian Cancer Society. Cystoscopy and ureteroscopy. https://cancer.ca/en/treatments/tests-and-procedures/cystoscopy-and-ureteroscopy#ci_cystoscopy_and_ureteroscopy_89_11131_00. Accessed 2024 Jul 14.
21.Cancer Research UK. What is metastatic bladder cancer? 2022; https://www.cancerresearchuk.org/about-cancer/bladder-cancer/metastatic/what-is. Accessed 2023 Dec 01.
22.Cancer Research UK. Non muscle invasive bladder cancer staging. https://www.cancerresearchuk.org/about-cancer/bladder-cancer/types-stages-grades/non-muscle-invasive. Accessed 2024 Jul 15.
23.Canadian Urological Association. Patient Guide to Metastatic Urothelial Carcinoma. 2022; https://www.cua.org/sites/default/files/Flipbooks/CPD/BladderCancerPatientTool22/mobile/index.html. Accessed 2023 Dec 01.
24.Cancer Research UK. Muscle invasive bladder cancer staging. https://www.cancerresearchuk.org/about-cancer/bladder-cancer/types-stages-grades/muscle-invasive. Accessed 2024 Jul 15.
25.National Cancer Institute. Bladder Cancer Stages. https://www.cancer.gov/types/bladder/stages. Accessed 2024 Aug 10.
26.Canadian Cancer Society. Survival statistics for bladder cancer. https://cancer.ca/en/cancer-information/cancer-types/bladder/prognosis-and-survival/survival-statistics. Accessed 2023 Dec 01.
27.National Cancer Institute. Cancer Stat Facts: Bladder Cancer. https://seer.cancer.gov/statfacts/html/urinb.html. Accessed 2023 Dec 06.
28.Dai S, Zhou Z, Chen Z, Xu G, Chen Y. Fibroblast Growth Factor Receptors (FGFRs): Structures and Small Molecule Inhibitors. Cells. 2019;8(6). PubMed
29.Touat M, Ileana E, Postel-Vinay S, André F, Soria JC. Targeting FGFR Signaling in Cancer. Clin Cancer Res. 2015;21(12):2684-2694. PubMed
30.Helsten T, Elkin S, Arthur E, Tomson BN, Carter J, Kurzrock R. The FGFR Landscape in Cancer: Analysis of 4,853 Tumors by Next-Generation Sequencing. Clin Cancer Res. 2016;22(1):259-267. PubMed
31.Janssen Inc. BALVERSA® (erdafitinib) draft product monograph (Data on File). 2023 [sponsor submitted reference].
32.Erdafitinib: Drug information. In: Post TW, ed. UptoDate. Waltham (MA): UptoDate: http://www.uptodate.com. Accessed 2024 Aug 13.
33.Sternberg CN, Petrylak DP, Bellmunt J, et al. FORT-1: Phase II/III Study of Rogaratinib Versus Chemotherapy in Patients With Locally Advanced or Metastatic Urothelial Carcinoma Selected Based on FGFR1/3 mRNA Expression. J Clin Oncol. 2023;41(3):629-639. PubMed
34.Canadian Cancer Society. Treatments for metastatic bladder cancer. https://cancer.ca/en/cancer-information/cancer-types/bladder/treatment/metastatic. Accessed 2023 Nov 01.
35.Cancer.Net. Bladder Cancer: Treatments by Stage. 2021; https://www.cancer.net/cancer-types/bladder-cancer/treatments-stage. Accessed 2023 Dec 01.
36.Warren M, Kolinsky M, Canil CM, et al. Canadian Urological Association/Genitourinary Medical Oncologists of Canada consensus statement: Management of unresectable locally advanced and metastatic urothelial carcinoma. Can Urol Assoc J. 2019;13(10):318-327. PubMed
37.Systemic Therapy for Metastatic Urothelial Cancer: An Endorsement of a Portion of the European Association of Urology Guideline on Muscle-Invasive and Metastatic Bladder Cancer. Toronto (ON): Cancer Care Ontario; 2022: https://www.cancercareontario.ca/en/file/67526/download?token=yRinrhFz. Accessed 2023 Dec 01.
38.Provisional Funding Algorithm for Metastatic Urothelial Carcinoma. Ottawa (ON): CADTH; 2023: https://www.cadth.ca/sites/default/files/pdf/PH0017-mUC-CAPCA-Endorsement.pdf. Accessed 2023 Nov 01.
39.Erdafitinib for the Treatment of Adult Patients with Locally Advanced Unresectable or Metastatic Urothelial Carcinoma Harboring Susceptible Fibroblast Growth Factor Receptor (FGFR)3 Genetic Alterations, with Disease Progression During or Following At Least One Line of a Programmed Death Receptor-1 (PD-1) or Programmed Death-Ligand 1 (PD-L1) Inhibitor Therapy Including within 12 months of Neoadjuvant or Adjuvant Therapy [internal sponsor's report]. In: Drug Reimbursement Review sponsor submission: Erdafitinib 3 mg, 4 mg, and 5 mg tablets for oral administration. Toronto (ON): Janssen Inc.; 2024 Jun 14.
40.Center for Drug Evaluation Research. Balversa Prescribing Information. Silver Spring (MD): U.S. Food & Drug Administration; 2024: https://www.accessdata.fda.gov/drugsatfda_docs/label/2024/212018s007s008s009lbl.pdf. Accessed 2024 Jun 29.
41.U.S. Food & Drug Administration. FDA approves erdafitinib for locally advanced or metastatic urothelial carcinoma. 2024; https://www.fda.gov/drugs/resources-information-approved-drugs/fda-approves-erdafitinib-locally-advanced-or-metastatic-urothelial-carcinoma#:~:text=On%20January%2019%2C%202024%2C%20the,whose%20disease%20has%20progressed%20on. Accessed 2024 Jun 29.
42.EMA Summary of opinion Balversa erdafitinib. Amsterdam (NL): European Medicines Agency; 2024: https://www.ema.europa.eu/en/documents/smop-initial/chmp-summary-positive-opinion-balversa_en.pdf. Accessed 2024 Aug 11.
43.Docetaxel injection USP (docetaxel): sterile solution: 10 mg/ml, for intravenous infusion: [product monograph]. Kirkland (QC): Pfizer Canada ULC; 2023: https://pdf.hres.ca/dpd_pm/00071345.PDF. Accessed 2024 Aug 13.
44.Paclitaxel injection USP (paclitaxel for injection): paclitaxel 6 mg/ml [product monograph]. Boucherville (QC): Sandoz Canada Inc.; 2021: https://pdf.hres.ca/dpd_pm/00063296.PDF. Accessed 2024 Aug 13.
45.Padcev® (enfortumab vedotin for injection): lyophilized powder for solution for intravenous infusion only 20 mg and 30 mg single-use vials [product monograph]. Mississauga (ON): Seagen Canada Inc.; 2023: https://pdf.hres.ca/dpd_pm/00071559.PDF. Accessed 2024 Aug 13.
46.National Institute for Health. Paclitaxel. StatPearls 2023; https://www.ncbi.nlm.nih.gov/books/NBK536917/. Accessed 2024 Aug 09.
47.Clinical Study Report - Cohort 1: A Phase 3 Study of Erdafitinib Compared with Vinflunine or Docetaxel or Pembrolizumab in Subjects with Advanced Urothelial Cancer and Selected FGFR Gene Aberrations (August 7, 2023) (Data on File). Rariton (NJ): Janssen Research & Development; 2023.
48.Ko YJ, Abdelsalam M, Kavan P, et al. What is a clinically meaningful survival benefit in refractory metastatic colorectal cancer? Curr Oncol. 2019;26(2):e255-e259. PubMed
49.Moon DH, Chen RC. Defining a Clinically Meaningful Benefit in Cancer Clinical Trials: From the Perspectives of the Clinical Trialist, Patient, and Society. JNCI Cancer Spectrum. 2018;2(4):pky039. PubMed
50.Villaruz LC, Socinski MA. The clinical viewpoint: definitions, limitations of RECIST, practical considerations of measurement. Clin Cancer Res. 2013;19(10):2629-2636. PubMed
51.Herdman M, Gudex C, Lloyd A, et al. Development and preliminary testing of the new five-level version of EQ-5D (EQ-5D-5L). Qual Life Res. 2011;20(10):1727-1736. PubMed
52.McClure NS, Sayah FA, Xie F, Luo N, Johnson JA. Instrument-Defined Estimates of the Minimally Important Difference for EQ-5D-5L Index Scores. Value Health. 2017;20(4):644-650. PubMed
53.Degboe A, Ivanescu C, Rohay JM, Turner RR, Cella D. Validity and performance of the Functional Assessment of Cancer Therapy-Bladder (FACT-Bl) among advanced urothelial cancer patients. Support Care Cancer. 2019;27(11):4189-4198. PubMed
54.Yalcin I, Bump RC. Validation of two global impression questionnaires for incontinence. Am J Obstet Gynecol. 2003;189(1):98-101. PubMed
55.Viktrup L, Hayes RP, Wang P, Shen W. Construct validation of patient global impression of severity (PGI-S) and improvement (PGI-I) questionnaires in the treatment of men with lower urinary tract symptoms secondary to benign prostatic hyperplasia. BMC Urol. 2012;12:30. PubMed
56.Janssen MF, Pickard AS, Golicki D, et al. Measurement properties of the EQ-5D-5L compared to the EQ-5D-3L across eight patient groups: a multi-country study. Qual Life Res. 2013;22(7):1717-1727. PubMed
57.Henry EB, Barry LE, Hobbins AP, McClure NS, O'Neill C. Estimation of an Instrument-Defined Minimally Important Difference in EQ-5D-5L Index Scores Based on Scoring Algorithms Derived Using the EQ-VT Version 2 Valuation Protocols. Value Health. 2020;23(7):936-944. PubMed
58.Statistical Analysis Plan: A Phase 3 Study of Erdafitinib Compared With Vinflunine or Docetaxel or Pembrolizumab in Subjects with Advanced Urothelial Cancer and Selected FGFR Gene Aberrations (Data on File). In: Drug Reimbursement Review sponsor submission: Balversa (erdafitinib), tablet, 3 mg, 4 mg and 5 mg, oral. Toronto (ON): Janssen Inc.; 2024 Jun 14.
59.PICO Portal. 2022; www.picoportal.org. Accessed 2024 Mar 22.
60.National Institute for Health and Care Excellence. Single technology appraisal: User guide for company evidence submission template. (NICE process and methods)2015: https://www.nice.org.uk/process/pmg24/resources/single-technology-appraisal-and-highly-specialised-technologies-evaluation-user-guide-for-company-evidence-submission-template-pdf-72286715419333. Accessed 2025 Jan 03.
61.Genesis Research. Balversa for Treatment of Metastatic Urothelial Cancer – Clinical Systematic Literature Review Report (Data on File). In: Drug Reimbursement Review sponsor submission: Balversa (erdafitinib), tablet, 3 mg, 4 mg and 5 mg, oral. Toronto (ON): Janssen Inc.; 2024 Jun 14. 2023.
62.Yuan Z, Daly C, S VB. Matching-adjusted indirect comparison of erdafitinib (Balversa) in locally advanced unresectable or metastatic urothelial carcinoma. Technical report - Data on File. In: Drug Reimbursement Review sponsor submission: Balversa (erdafitinib), tablet, 3 mg, 4 mg and 5 mg, oral. Toronto (ON): Janssen Inc.; 2024 Jun 14. February 12, 2024.
63.Signorovitch JE WE, Yu AP, Gerrits CM, Kantor E, Bao Y, et al, Comparative effectiveness without head-to-head trials. Pharmacoeconomics. 2010;28(10):935-945. PubMed
64.Phillippo DM AA, Dias S, Palmer S, Abrams KR, Welton NJ, NICE DSU Technical Support Document 18: Methods for population-adjusted indirect comparisons in submission to NICE. Bristol (UK): NICE Decision Support Unit; 2016: https://research-information.bris.ac.uk/ws/portalfiles/portal/94868463/Population_adjustment_TSD_FINAL.pdf. Accessed 2025 Jan 03.
65.White H. A heteroskedasticity-consistent covariance matrix estimator and a direct test for heteroskedasticity. Econometrica. 1980:817-838.
66.Sturtz S, Ligges U, Gelman A. R2WinBUGS: A Package for Running WinBUGS from R. J Stat Softw. 2005;12(3):1-16.
67.Dias S WN, Sutton AJ, Ades AE, NICE DSU Technical Support Document 2: A generalised linear modelling framework for pairwise and network meta-analysis of randomised controlled trials. Sheffield (UK): NICE Decision Support Unit; 2011: https://www.ncbi.nlm.nih.gov/books/NBK310366/pdf/Bookshelf_NBK310366.pdf. Accessed 2025 Jan 03.
68.Brooks Sp GA. General Methods for Monitoring Convergence of Iterative Simulations. J Comput Graph Stat. 1998;7(4):434-455.
69.Gelman A RD. Inference from Iterative Simulation Using Multiple Sequences. Stat Sci. 1992;7(4):457-472.
70.Bucher HC, Guyatt GH, Griffith LE, Walter SD. The results of direct and indirect treatment comparisons in meta-analysis of randomized controlled trials. J Clin Epidemiol. 1997;50(6):683-691. PubMed
71.Grambsch PM TT. Proportional hazards tests and diagnostics based on weighted residuals. Biometrika. 1994;81(3):515-526.
72.Rosenberg JE PT, Sonpavde GP, Loriot Y, Duran I, Lee J-L, et al., Long-term outcomes in EV-301: 24-month findings from the phase 3 trial of enfortumab vedotin versus chemotherapy in patients with previously treated advanced urothelial carcinoma. J Clin Oncol. 2022;40(16 supplemental):4516-.
73.Powles T, Rosenberg JE, Sonpavde GP, et al. Enfortumab Vedotin in Previously Treated Advanced Urothelial Carcinoma. N Engl J Med. 2021;384(12):1125-1135. PubMed
74.Petrylak D, de Wit R, Chi KN, et al. Ramucirumab plus docetaxel versus placebo plus docetaxel in patients with locally advanced or metastatic urothelial carcinoma after platinum-based therapy (RANGE): a randomised, double-blind, phase 3 trial. The Lancet. 2017;390(1):2266-2277. PubMed
75.Loriot Y, Matsubara N, Park SH, et al. Erdafitinib or Chemotherapy in Advanced or Metastatic Urothelial Carcinoma. N Engl J Med. 2023;389(21):1961-1971. PubMed
TPA Review
Abbreviations
CI
confidence interval
ctDNA
circulating tumour DNA
la/mUC
locally advanced unresectable or metastatic urothelial carcinoma
NGS
next-generation sequencing
PCR
polymerase chain reaction
RT-PCR
reverse transcriptase polymerase chain reaction
UC
urothelial carcinoma
Objective
The objective of this Testing Procedure Assessment is to identify and describe important health system implications of testing for FGFR3 genetic alterations in adult patients with locally advanced unresectable or metastatic urothelial carcinoma (la/mUC) and disease progression during or after at least 1 line of a PD-1 or PD-L1 inhibitor therapy, including in the 12 months after neoadjuvant or adjuvant therapy, to determine eligibility for erdafitinib.
Methods
The contents within this section have been informed by materials submitted by the sponsor, a literature search, and clinical expert input. Materials submitted by the sponsor related to the diagnostic test were validated, when possible, and summarized by the review team. The clinical expert input was provided by 2 clinical specialists with expertise in the diagnosis and management of la/mUC.
An information specialist conducted a literature search of key resources, which included MEDLINE, the Cochrane Database of Systematic Reviews, the international HTA DATABASE, and websites of Canadian and major international health technology agencies, as well as a focused internet search. The search approach was customized to retrieve a limited set of results, balancing comprehensiveness with relevancy. The search strategy comprised both controlled vocabulary, such as the National Library of Medicine’s MeSH (Medical Subject Headings), and keywords. The main search concepts were next-generation sequencing (NGS) testing, polymerase chain reaction (PCR) testing, and urothelial carcinoma (UC). Secondary searches were conducted with search filters applied to limit the retrieval to citations related to economics and equity considerations. The search was completed on July 12, 2024, and was limited to English-language documents published since January 1, 2019.
Context
What Are FGFR Genetic Alterations?
FGFRs are transmembrane tyrosine kinase receptors that are involved in cell development, differentiation, survival, and migration.1 FGFR genetic alterations are associated with carcinogenesis and have been implicated in UC.1 There are 4 FGFRs that are typical tyrosine kinase receptors (FGFR1 to FGFR4). FGFR3 alterations are present in up to 42% of all patients with UC and up to 15% to 20% of patients with metastatic UC.2,3 FGFR3 genetic alterations are most closely associated with the inception and recurrence of UC.1,4 Additionally, FGFR1 and FGFR3 amplifications, which activate somatic mutations in FGFR3, and gene fusions that involve FGFR1, FGFR2, or FGFR3 have all been identified in UC.1 Local and international guidelines recommend that FGFR mutation status be determined before treatment decisions are finalized and may inform recommendations for therapy.5-7
How Are FGFR3 Genetic Alterations Identified?
FGFR3 genetic alterations are identified using DNA-based or RNA-based assay testing, using samples primarily taken from tumour tissue at the time of diagnosis. Although DNA-based assay testing may be used for the detection of selected introns known to be involved in common gene fusions,8 RNA-based assay testing has been shown to be a more reliable source for detecting novel gene fusions than DNA-based approaches.8,9
RNA-based PCR assays typically use reverse transcriptase-PCR (RT-PCR) testing techniques.9 PCR testing is a laboratory test used to amplify individual gene segments to determine the single-gene mutation status of known FGFR3 mutations or fusions.8,10 In RNA-based RT-PCR testing, RNA is first prepared from urothelial tumour samples and then reverse transcribed, using a reverse transcriptase enzyme, to create a complementary DNA sample for PCR amplification.10,11 The QIAGEN therascreen FGFR rotor-gene Q real-time RT-PCR test is a kit specifically for detecting FGFR alterations and is the primary companion diagnostic test used in clinical trials of erdafitinib.9,10,12 According to the company product website, the QIAGEN therascreen FGFR rotor-gene Q real-time RT-PCR test is the only FGFR alteration assay on the market licensed for sale by Health Canada and the FDA.10,12,13 This RT-PCR test is capable of detecting 4 mutations (R248C, S249C, G370C, Y373C) and 2 fusions (FGFR3-TACC3v1 and FGFR3-TACC3v3) during FGFR3 alteration testing, using RNA tissue samples from tumour sites.8,9
FGFR3 genetic alterations can also be identified using both DNA-based and RNA-based NGS panel testing. NGS panel testing is a parallel-sequencing technology that allows for the rapid, precise, and cost-effective sequencing of multiple genes, whole exomes, and genomes.14 In Canada, NGS testing strategies for FGFR genetic alterations use pan-cancer NGS panels that analyze both DNA- based and RNA-based tissue samples to detect sequencing changes, rearrangements, and fusions that involve FGFR1 to FGFR4.15 NGS testing for FGFR3 genetic alterations typically use archived cystectomy specimens, if available, or transurethral resection or tumour-based biopsy specimens.16 Circulating tumour DNA (ctDNA) from plasma samples has shown potential use in NGS testing as a noninvasive alternative to traditional tissue-based samples.16,17 Despite the promising use of ctDNA samples, tissue-based samples remain the gold standard for FGFR3 genetic alteration identification.18
What Is the Current Testing Practice for UC in Canada?
UC is characterized as a malignant transformation and growth of cells that form the urothelial lining of the urinary system, which includes the renal pelvis, ureters, prostate, bladder, and urethra.6 According to sponsor-submitted information, the diagnosis of UC is typically initiated with a urinalysis to detect blood, abnormal cells, or infection in the urine.19 A cystoscopy may be required to visually examine the bladder and urethra to detect the presence of tumours.19 The diagnosis of UC typically relies on a transurethral resection of bladder tumour biopsy sample to determine the level of cancer invasiveness.16,19 The National Comprehensive Cancer Network guidelines recommend that biomarker testing be included in the initial laboratory investigation to prevent delays in later-line therapy.6 Similarly, Cancer Care Alberta recommends FGFR genetic testing, which includes FGFR3, to determine FGFR mutation status before the initiation of first-line therapy.5
Additional testing to evaluate UC prognosis includes a complete blood count for anemia, kidney tests to assess kidney function, an alkaline phosphatase test that assesses cancer invasiveness to the bone and liver, and general blood tests to assess electrolytes, creatinine, calcium, and magnesium levels.19 Additional imaging testing, such as IV pyelogram, CT, ultrasound imaging, and MRI, may all be used to detect tumour presence and measure cancer advancement.16
Testing Procedure Considerations
What Are Some Health System Considerations?
What Is the Availability of FGFR3 Genetic Alteration Testing in Canada?
According to sponsor-submitted information, all essential diagnostic testing for UC is available in Canada, and can be done in either the inpatient or outpatient setting. The product monograph states that treatment with erdafitinib in patients with la/mUC should be initiated after the confirmation of susceptible FGFR3 genetic alterations with a validated test, which includes RT-PCR single-gene testing and DNA-based or RNA-based NGS panel testing.20
In Canada, both DNA-based and RNA-based NGS testing for FGFR3 genetic alterations in newly diagnosed tumours in patients with la/mUC are currently available at 10 testing sites in Ontario and 1 testing site in Quebec.15,21 FGFR3 genetic alteration testing sites are outlined in Table 1. Testing-availability information from the University Health Network in Ontario indicates that the University Health Network testing site in Toronto is responsible for testing patients from Alberta, Manitoba, Newfoundland and Labrador, and Ontario, whereas the CIUSSS Centre-Ouest and Jewish General Hospital in Montreal are responsible for testing patients from British Columbia, New Brunswick, Nova Scotia, Prince Edward Island, Quebec, and Saskatchewan.15 One clinical expert indicated that Manitoba conducts FGFR testing as part of a larger molecular panel test. No testing-availability information could be obtained for the Northwest Territories, Nunavut, or Yukon.
How Is FGFR3 Genetic Alteration Testing Funded?
For people living in Ontario, all testing indications are publicly funded through the Comprehensive Cancer Biomarker Testing Program, which includes FGFR3 genetic alteration testing for UC.21 No funding information related to the FGFR3 testing site in Quebec was found. Additionally, it is unclear how testing is funded in jurisdictions that rely on out-of-province testing facilities.
How Many Individuals in Canada Would Be Expected to Require the Testing Procedure?
In Canada, approximately 13,400 people were diagnosed with UC in 2023, and approximately 12,300 people were expected to be diagnosed in 2024.22,23 Sponsor-submitted information indicated that, presently, approximately 50% of patients with UC receive testing for FGFR3 genetic alterations each year;24 however, according to 1 clinical expert, the estimate of patients who receive FGFR3 genetic alteration testing is likely closer to 40% each year. One clinical expert indicated that if erdafitinib becomes funded, the volume of testing for FGFR3 genetic alterations will increase in congruence with the likelihood of increased jurisdictional testing capacity across Canada.
Table 1: FGFR3 Testing Sites Across Canada
Jurisdiction | Testing site(s) |
|---|---|
Ontario |
|
Quebec |
|
CIUSSS = Centre intégré universitaire de santé et de services sociaux du Centre-Ouest-de-I’lle-de-Montréal.
What Is the Expected Timing and Frequency of Testing for FGFR3 Genetic Alterations?
According to the clinical experts consulted by the review team, FGFR3 testing is typically done as a reflex test based on the initiation of first-line therapy (i.e., platinum-based chemotherapy) in Ontario, or at the time of diagnosis for patients with suspected metastatic UC in Ontario and Manitoba. Additionally, 1 clinical expert indicated that testing may also be carried out during progression from first-line therapy in Manitoba. No additional information for other provinces or territories was available from clinical expert input. The clinical experts emphasized the importance of testing for FGFR3 early, especially for patients under investigation for advanced or metastatic UC, to minimize treatment delay. The Canadian Urological Association recommends against performing FGFR gene alteration testing on a reflex basis for patients whose cystectomy specimen shows adverse pathological features, because these patients will likely progress to second-line therapy, allowing adequate time to test if it is ordered at the time of initiation of first-line therapy.16 The Canadian Urological Association identified the initiation of first-line therapy as a clinical trigger point to test for FGFR gene alterations, which is similar to reflex testing, but emphasizes the use of a clinical point as a trigger for testing, rather than a specific test result.16
One clinical expert indicated that repeat FGFR3 testing is not needed once FGFR3 genetic alteration status is determined. Another clinical expert indicated that the expected turnaround time for NGS testing is approximately 2 to 4 weeks, which is in line with the standard benchmark outlined by the Canadian Urological Association.16 It is reported that RT-PCR testing using the QIAGEN therascreen FGFR rotor-gene Q real-time testing kit takes approximately 12 hours to process and show results,10 although the total turnaround time might be longer.
What Are the Expected Impacts of Testing for FGFR3 Genetic Alterations in Patients With Locally Advanced or Metastatic UC on Human Health Resources?
One clinical expert indicated that if erdafitinib becomes funded, FGFR3 genetic alteration testing will likely be expanded across Canada. For jurisdictions that do not currently test for FGFR3 genetic alterations within their jurisdiction, the implementation of routine FGFR3 testing for people with UC may have an impact on health system infrastructure and patient-related treatment decision-making. Implementing routine DNA-based or RNA-based testing with NGS would potentially require the upscaling of current UC-related testing infrastructure, including personnel, lab equipment, and genetic counselling services for clinical decision-making.25 One clinical expert indicated that upscaling routine FGFR3 testing would require additional pathologist support because FGFR3 genetic alteration testing requires DNA-based or RNA-based biopsy samples.
What Are Some Patient-Related Considerations?
Genetic testing that uses tumour-based or tissue-based biopsies, which is currently the gold standard for sampling, can involve invasive procedures.26 Patient harm may be reduced by minimizing the need for repetitive tissue biopsies or by using less-invasive, emerging testing techniques, such as ctDNA sample NGS testing.26 According to 1 clinical expert, the testing turnaround time for NGS testing of approximately 2 to 4 weeks may have physical and psychological impacts on patients, particularly those who are under investigation for muscle-invasive or metastatic UC. Long testing turnaround times for patients with advanced UC may delay treatment and impact patient-related outcomes.16 As indicated by sponsor-submitted information, diagnosing UC and determining appropriate treatment pathways may include many different testing strategies.19 Patient-related considerations for those undergoing genetic testing should include informed decision-making regarding diagnostic testing and confirmation testing, possible testing for psychological impacts related to cancer, adequate communication of testing procedures and possible outcomes, timing considerations of testing, and other barriers to testing, such as access to testing.27,28
What Are the Clinical Considerations?
Clinical Utility
According to the clinical experts and identified literature, the intention of either DNA-based or RNA-based assay testing using PCR or NGS procedures is to identify patients with FGFR3 genetic alterations who are likely to be eligible for FGFR inhibitor therapy, such as erdafitinib.9,10,16 Additionally, 1 clinical expert indicated that FGFR3 testing in patients with UC may determine eligibility for future clinical trials.
Diagnostic Accuracy
According to the company product website, the QIAGEN therascreen FGFR rotor-gene Q real-time RT-PCR testing kit was evaluated to determine concordance with the clinical trial assay used to identify patients for recruitment to the phase II clinical trial for erdafitinib.10,29 Samples from the RT-PCR testing kit and the clinical trial assay were analyzed to assess the positive percent agreement, negative percent agreement, and overall percent agreement for FGFR gene alteration status. The RT-PCR testing kit showed an 87.2% (95% confidence interval [CI], 79.0% to 92.5%) positive percent agreement, a 97% (95% CI, 93.5% to 98.6%) negative percent agreement, and a 93.8% (95% CI, 90.5% to 96.1%) overall percent agreement with the clinical trial assay.12 Additionally, analysis of NGS testing for FGFR3 genetic alterations, using either the Thermo Fisher Oncomine Dx test or the Illumina TruSight Oncology 500 test, showed 100% concordance with the QIAGEN therascreen FGFR rotor-gene Q real-time RT-PCR testing kit.9,30
What Are the Cost Considerations?
According to sponsor-submitted information, the cost of validated tests for FGFR3 genetic alterations is estimated to be less than $200 for PCR testing and approximately $1,000 for NGS testing.31 For reference, according to the company product website, the QIAGEN therascreen FGFR rotor-gene Q real-time RT-PCR testing kit costs $5,821 (for 24 tests).12
References
1.Helsten T, Elkin S, Arthur E, Tomson BN, Carter J, Kurzrock R. The FGFR Landscape in Cancer: Analysis of 4,853 Tumors by Next-Generation Sequencing. Clin Cancer Res. 2016;22(1):259-67. doi:10.1158/1078-0432.Ccr-14-3212 PubMed
2.Sternberg CN, Petrylak DP, Bellmunt J, et al. FORT-1: Phase II/III Study of Rogaratinib Versus Chemotherapy in Patients With Locally Advanced or Metastatic Urothelial Carcinoma Selected Based on FGFR1/3 mRNA Expression. J Clin Oncol. 2023;41(3):629-639. doi:10.1200/jco.21.02303 PubMed
3.Tomlinson DC, Baldo O, Harnden P, Knowles MA. FGFR3 protein expression and its relationship to mutation status and prognostic variables in bladder cancer. J Pathol. Sep 2007;213(1):91-8. doi:10.1002/path.2207 PubMed
4.Solomon JP, Hansel DE. The Emerging Molecular Landscape of Urothelial Carcinoma. Surg Pathol Clin. Sep 2016;9(3):391-404. doi:10.1016/j.path.2016.04.004 PubMed
5.Cancer Care Alberta. Locally Advanced/Metastatic Bladder Cancer. 2023. Accessed August 12, 2024. https://www.albertahealthservices.ca/assets/info/hp/cancer/if-hp-cancer-guide-gu014-ambc.pdf
6.Flaig TW, Spiess PE, Agarwal N, et al. Bladder Cancer, Version 3.2020, NCCN Clinical Practice Guidelines in Oncology. J Natl Compr Canc Netw. Mar 2020;18(3):329-354. doi:10.6004/jnccn.2020.0011 PubMed
7.Bellmunt J, Orsola A, Leow JJ, Wiegel T, De Santis M, Horwich A. Bladder cancer: ESMO Practice Guidelines for diagnosis, treatment and follow-up. Ann Oncol. Sep 2014;25 Suppl 3:iii40-8. doi:10.1093/annonc/mdu223 PubMed
8.Krook MA, Reeser JW, Ernst G, et al. Fibroblast growth factor receptors in cancer: genetic alterations, diagnostics, therapeutic targets and mechanisms of resistance. Br J Cancer. Mar 2021;124(5):880-892. doi:10.1038/s41416-020-01157-0 PubMed
9.Peng J, Sridhar S, Siefker-Radtke AO, Selvarajah S, Jiang DM. Targeting the FGFR Pathway in Urothelial Carcinoma: the Future Is Now. Curr Treat Options Oncol. 2022;23(9):1269-1287. doi:10.1007/s11864-022-01009-4 PubMed
10.QIAGEN. therascreen FGFR RGQ RT-PCR Kit version 2. 2024. Accessed April 30, 2025. https://www.qiagen.com/kr/products/diagnostics-and-clinical-research/oncology/therascreen-solid-tumor/therascreen-fgfr-rgq-rt-pcr-kit-v2?catno=874721
11.National Cancer Institute. NCI Dictionary of Cancer Terms. 2024. Accessed August 19, 2024. https://www.cancer.gov/publications/dictionaries/cancer-terms/def/reverse-transcription
12.QIAGEN. therascreen FGFR RGQ RT-PCR Kit (CA). 2024. Accessed September 23, 2024. https://www.qiagen.com/ca/products/diagnostics-and-clinical-research/oncology/therascreen-fgfr-rgq-rt-pcr-kit-ca
13.Health Canada. Medical Devices Licence Listing: THERASCREEN FGFR RGQ RT-PCR KIT. 2024. Accessed September 23, 2024. https://health-products.canada.ca/mdall-limh/information?deviceId=1012234&deviceName=THERASCREEN%20FGFR%20RGQ%20RT-PCR%20KIT&licenceId=103814&type=active&lang=eng
14.Mardis ER. The Impact of Next-Generation Sequencing on Cancer Genomics: From Discovery to Clinic. Cold Spring Harb Perspect Med. Sep 3 2019;9(9)doi:10.1101/cshperspect.a036269 PubMed
15.Toronto General Hospital. BALVERSATM (erdafitinib) Diagnostic FGFR Genetic Testing – Specimen Requirements and Shipping Guidelines. Updated May 27, 2020. Accessed August 13, 2024, https://www.uhn.ca/Labs/Documents/FGFR%20Testing_UHN%20Specimen%20Requirements.pdf
16.Black PC, Alimohamed NS, Berman D, et al. Optimizing management of advanced urothelial carcinoma: A review of emerging therapies and biomarker-driven patient selection. Can Urol Assoc J. Aug 2020;14(8):E373-e382. doi:10.5489/cuaj.6458 PubMed
17.Tripathi A, Grivas P. The utility of next generation sequencing in advanced urothelial carcinoma. Eur Urol Focus. 2020;6(1):41-44. doi:10.1016/j.euf.2019.08.016 PubMed
18.Vandekerkhove G, Lavoie JM, Annala M, et al. Plasma ctDNA is a tumor tissue surrogate and enables clinical-genomic stratification of metastatic bladder cancer. Nat Commun. 2021;12(1):184. doi:10.1038/s41467-020-20493-6 PubMed
19.Canadian Cancer Society. Diagnosis of bladder cancer. 2024. Accessed August 14, 2024. https://cancer.ca/en/cancer-information/cancer-types/bladder/diagnosis
20.Janssen Inc. Product Monograph: BALVERSA. 2024. Accessed August 15, 2024. https://pdf.hres.ca/dpd_pm/00074496.PDF
21.Cancer Care Ontario. Comprehensive Cancer Biomarker Testing Program. 2024. Accessed August 14, 2024. https://www.cancercareontario.ca/en/guidelines-advice/treatment-modality/pathology-laboratory-testing/genetic-testing-resources/comprehensive-cancer-biomarker-testing-program#Bladder-Urothelial
22.Brenner DR, Gillis J, Demers AA, et al. Projected estimates of cancer in Canada in 2024. Can Med Assoc J. 2024;196(18):E615-E623. doi:10.1503/cmaj.240095 PubMed
23.Canadian Cancer Society. Bladder cancer statistics. 2024. Accessed August 14, 2024. https://cancer.ca/en/cancer-information/cancer-types/bladder/statistics
24.Moria FA, Park CL, Eigl BJ, Macfarlane R, Pavic M, Saleh RR. A Real-World Retrospective Analysis of the Management of Advanced Urothelial Carcinoma in Canada. Curr Oncol. 2024;31(2):704-722. doi:10.3390/curroncol31020052 PubMed
25.Borle K, Kopac N, Dragojlovic N, et al. Where is genetic medicine headed? Exploring the perspectives of Canadian genetic professionals on future trends using the Delphi method. Eur J Hum Genet. 2022;30(5):496-504. doi:10.1038/s41431-021-01017-2 PubMed
26.De Keukeleire S, De Maeseneer D, Jacobs C, Rottey S. Targeting FGFR in bladder cancer: ready for clinical practice? Acta Clin Belg. Feb 2020;75(1):49-56. doi:10.1080/17843286.2019.1685738 PubMed
27.Samuel GN, Dheensa S, Farsides B, Fenwick A, Lucassen A. Healthcare professionals' and patients' perspectives on consent to clinical genetic testing: moving towards a more relational approach. BMC Med Ethics. Aug 8 2017;18(1):47. doi:10.1186/s12910-017-0207-8 PubMed
28.Roundtable on Translating Genomic-Based Research for Health, Board on Health Sciences Policy, Institute of Medicine. Assessing Genomic Sequencing Information for Health Care Decision Making: Workshop Summary. National Academies Press (US); 2014.
29.Loriot Y, Necchi A, Park SH, et al. Erdafitinib in Locally Advanced or Metastatic Urothelial Carcinoma. N Engl J Med. Jul 25 2019;381(4):338-348. doi:10.1056/NEJMoa1817323 PubMed
30.Major C, Wang S. Abstract 4010: Analytical concordance of 3 independent diagnostic assays for the detection of FGFR alterations in urothelial carcinoma tumor tissue. Cancer Res. 2022;82(12_Supplement):4010-4010. doi:10.1158/1538-7445.Am2022-4010
31.Makarem M, Ezeife DA, Smith AC, et al. Reflex ROS1 IHC Screening with FISH Confirmation for Advanced Non-Small Cell Lung Cancer-A Cost-Efficient Strategy in a Public Healthcare System. Curr Oncol. Aug 25 2021;28(5):3268-3279. doi:10.3390/curroncol28050284 PubMed
Pharmacoeconomic Review
Abbreviations
AE
adverse event
BIA
budget impact analysis
CDA-AMC
Canada's Drug Agency
FGFR
fibroblast growth factor receptor
GU DAC
Genitourinary Cancer Drug Advisory Committee
ICER
incremental cost-effectiveness ratio
ITC
indirect treatment comparison
la/mUC
locally advanced unresectable or metastatic urothelial carcinoma
LY
life-year
MIBC
muscle-invasive bladder cancer
NMIBC
non–muscle-invasive bladder cancer
OS
overall survival
PFS
progression-free survival
PSM
partitioned survival model
QALY
quality-adjusted life-year
RDI
relative dose intensity
TTD
time to discontinuation
UC
urothelial carcinoma
Executive Summary
The executive summary comprises 2 tables (Table 1 and Table 2) and a conclusion.
Item | Description |
|---|---|
Drug product | Erdafitinib (Balversa) oral tablets |
Indication | Proposed: for the treatment of adult patients with locally advanced unresectable or metastatic UC harbouring susceptible FGFR3 genetic alterations who have disease progression during or following at least 1 line of prior therapy, including within 12 months of neoadjuvant or adjuvant therapy. Erdafitinib should not be used for the treatment of patients who are eligible for and have not received prior PD-1 or PD-L1 inhibitor therapy. Treatment with erdafitinib should be initiated following confirmation of a susceptible FGFR genetic alteration using a validated test. |
Health Canada approval status | NOC |
Health Canada review pathway | Standard pathway |
NOC date | September 25, 2024 |
Reimbursement request | As per indication |
Sponsor | Janssen Inc., a Johnson & Johnson Company |
Submission history | Previously reviewed: No |
NOC = Notice of Compliance; UC = urothelial carcinoma.
Table 2: Summary of Economic Evaluation
Component | Description |
|---|---|
Type of economic evaluation | Cost-utility analysis PSM |
Target population | Adult patients with locally advanced unresectable or metastatic UC harbouring susceptible FGFR3 genetic alterations, with disease progression during or following at least 1 line of a PD-1 or PD-L1 inhibitor therapy, including within 12 months of neoadjuvant or adjuvant therapy |
Treatment | Erdafitinib |
Dose regimen | The recommended starting dose is 8 mg once daily. Patients can receive a dose increase to 9 mg once daily based on serum phosphate level and tolerability, assessed between 14 and 21 days after initiation. |
Submitted price | Erdafitinib 3 mg tablet: $158.31 4 mg tablet: $211.08 5 mg tablet: $263.85 |
Submitted treatment cost | Using dosage information from the THOR trial, the sponsor estimated the cost per 21-day treatment cycle of erdafitinib to be $6,705.87. |
Comparators |
|
Perspective | Canadian publicly funded health care payer |
Outcomes | QALYs, LYs |
Time horizon | Lifetime (10 years) |
Key data sources | THOR trial: erdafitinib and physician’s-choice chemotherapy (comprising docetaxel and vinflunine)a EV-301 trial: enfortumab vedotin |
Submitted results |
|
Key limitations |
|
CDA-AMC reanalysis results |
|
CDA-AMC = Canada’s Drug Agency; FGFR = fibroblast growth factor receptor; ICER = incremental cost-effectiveness ratio; LY = life-year; OS = overall survival; PSM = partitioned survival model; QALY = quality-adjusted life-year, RDI = relative dose intensity; UC = urothelial carcinoma; vs. = versus.
aVinflunine is not approved for use in Canada. As such, the sponsor assumed the proportion of patients that received vinflunine in the THOR trial would be assigned to paclitaxel in the economic evaluation, based on consultations with clinical experts in Canada, who deemed it appropriate to assume similar efficacy between the treatments.
Conclusions
Based on the Clinical Review by Canada's Drug Agency (CDA-AMC), erdafitinib may be associated with a significant improvement in progression-free survival (PFS) and overall survival (OS) compared to physician’s-choice chemotherapy, albeit with a worse side-effect profile for patients with locally advanced unresectable or metastatic urothelial carcinoma (UC). Given the absence of head-to-head comparisons between erdafitinib and enfortumab vedotin, the sponsor-commissioned an indirect treatment comparison (ITC). The results from this ITC showed that there is uncertainty about whether there is a meaningful difference between erdafitinib and enfortumab vedotin in survival, response outcomes, or harms. The sponsor used a naive comparison to inform its economic evaluation because of the limitations they identified with the ITC.
The results of the CDA-AMC base case were similar to those of the sponsor’s base case. In the CDA-AMC base case, erdafitinib was associated with a cost-effectiveness ratio of $305,091 per quality-adjusted life-year (QALY) gained, compared to physician’s-choice chemotherapy. Erdafitinib was associated with a small incremental QALY benefit and lower costs than enfortumab vedotin (i.e., dominant). This difference was mainly driven by the change in relative dose intensity (RDI) associated with erdafitinib. For erdafitinib to be considered cost-effective at a $50,000 per QALY gained threshold, the price would need to be reduced by 76%. This would reduce per-patient maintenance therapy costs of erdafitinib, which range from $11,820 to $13,298 per 28-day cycle, to a range of $2,896 to $3,258.
CDA-AMC was unable to address concerns regarding the postprogression benefit attributed to erdafitinib, which may underestimate the incremental cost-effectiveness ratio (ICER) of erdafitinib compared to physician’s-choice chemotherapy. CDA-AMC noted that the modelled results indicate that enfortumab vedotin is associated with more QALYs in the preprogression period, so postprogression benefits are driving the incremental QALYs estimated in the economic model. The comparison between erdafitinib and enfortumab vedotin remains highly uncertain, given the absence of head-to-head comparisons or a robust ITC. As a result, it is not possible to determine whether any efficacy differences between therapies estimated by the sponsor’s model are due to the treatment, bias, or unobserved confounding factors. As a result, there is no robust evidence for a price premium for erdafitinib compared with enfortumab vedotin.
Patient, Clinician, and Drug Plan Input Relevant to the Economic Review
This section is a summary of the feedback received from the patient groups, clinician groups, and drug plans that participated in the CDA-AMC review process.
No patient-group input was received for this review.
Clinician group input was received from the Ontario Health (Cancer Care Ontario) Genitourinary Cancer Drug Advisory Committee (GU DAC). When considering currently available treatments for locally advanced unresectable or metastatic urothelial carcinoma (la/mUC), the GU DAC noted that patients who have previously received an immune checkpoint inhibitor, chemotherapy, or both, would be eligible for treatment with enfortumab vedotin, with the goal of improving OS. The GU DAC indicated that treatments are needed for patients with genomic alterations, noting that erdafitinib is effective for fibroblast growth factor receptor (FGFR) gene alterations and would be the first targeted therapy identified for this patient population based on molecular testing. The GU DAC stated that patients who have already received an immune checkpoint inhibitor, or who have a contraindication to immune checkpoint inhibitors, and who have FGFR gene alterations would be best suited to treatment with erdafitinib, and that unacceptable toxicity or clinically significant disease progression would be factors to consider for discontinuation. The GU DAC noted that FGFR testing is already reimbursed in Ontario.
The public drug plans requested clarity on the discontinuation criteria for erdafitinib, given that the THOR clinical trial allowed erdafitinib to be continued beyond disease progression at the discretion of the investigator. Their input noted that FGFR testing is not available or routinely tested in some jurisdictions. The plans also requested clarification on whether patients who have previously been treated with either PD-1 or PD-L1 inhibitor therapy and who remain sensitive despite disease progression (e.g., relapse occurred more than 6 to 12 months after stopping PD-1 or PD-L1 inhibitor therapy) should receive erdafitinib at any time, or only if the patient has been re-treated with PD-1 or PD-L1 inhibitor therapy and subsequently is considered resistant. Finally, the drug plans noted that a confidential price exists for enfortumab vedotin.
Several of these concerns were addressed in the sponsor’s model:
The sponsor’s model incorporated discontinuation due to progression or toxicity, based on the THOR trial’s time-to-discontinuation (TTD) data for erdafitinib and chemotherapy (docetaxel or paclitaxel). The sponsor assumed that patients who received enfortumab vedotin would discontinue treatment at progression. For erdafitinib, it was assumed that at each cycle, the probability of continuing treatment could not exceed the probability of remaining progression-free. In instances where the probability of TTD was greater than that of PFS, the probability of TTD was adjusted to match the probability of PFS.
In addition, CDA-AMC addressed some of these concerns, as follows:
Although the sponsor’s model assumed that the cost of FGFR testing would apply to both erdafitinib and its comparators, CDA-AMC conducted a scenario analysis that incorporated testing costs only for patients receiving erdafitinib to account for the fact that FGFR testing is not routinely conducted in patients with UC.
CDA-AMC could not address the following issue:
Although drug-plan input noted that a confidential negotiated price exists for enfortumab vedotin, CDA-AMC is not privy to this price information. As a result, CDA-AMC was unable to undertake analyses that accurately reflect the price paid by public drug plans.
Economic Review
Economic Evaluation
Summary of Sponsor’s Economic Evaluation
Overview
The sponsor submitted a cost-utility analysis of erdafitinib compared with physician’s-choice chemotherapy (a weighted average of docetaxel and paclitaxel, based on the THOR trial intention-to-treat population) and enfortumab vedotin.1 The modelled population comprised adult patients with la/mUC harbouring susceptible FGFR3 genetic alterations (confirmed with a validated test) who experienced disease progression during or after at least 1 line of PD-1 or PD-L1 inhibitor therapy, including in the 12 months after neoadjuvant or adjuvant therapy. The modelled population generally aligns with the proposed Health Canada population.
The recommended dosage of erdafitinib is 8 mg daily, although patients may be titrated up to 9 mg if treatment is assessed to be well tolerated (based on serum phosphate levels, measured between 14 and 21 days after initial treatment). Erdafitinib is provided as 3 mg, 4 mg, and 5 mg tablets. The sponsor’s submitted cost for erdafitinib was $158.31 per 3 mg tablet, $211.08 per 4 mg tablet, and $263.85 per 5 mg tablet. Based on the THOR trial,2 in which 77% of patients were up-titrated to 9 mg once daily (applied after 2 weeks) and a RDI of 69%, the sponsor estimated the cost per 21-day treatment cycle to be $6,705.87 for erdafitinib.
The sponsor considered physician’s-choice chemotherapy to be derived from a weighted combination of docetaxel and paclitaxel. The weights were based on the proportion of patients receiving each chemotherapy in the THOR trial, with the additional assumption of equivalence between vinflunine and paclitaxel. Based on an RDI of 98.8%, the sponsor estimated the cost per 21-day treatment cycle to be $1,089.74 for docetaxel and $3,310.19 for paclitaxel. Based on the EV-301 trial3 and the study by Tsingas et al.,4 the sponsor assumed an RDI of 90.4% for enfortumab vedotin and a cost per 21-day treatment cycle of $15,390. According to the sponsor, wastage was taken into consideration.
The clinical outcomes measured were life-years (LYs) and QALYs over a lifetime horizon (assumed to be 10 years). The base-case analysis was undertaken from a Canadian public health care payer perspective, and a 1.5% discount rate was applied to both costs and health-related outcomes.
Model Structure
The sponsor submitted a partitioned survival model (PSM) with 3 mutually exclusive health states (preprogression, postprogression, and death). The cohort of patients enters the model in the preprogression health state, where it is assumed that the full cohort receives erdafitinib or a comparator. During each modelled cycle, a proportion of the cohort may transition to the other health states or remain in the current health state. Once a portion of the cohort experiences progression, it cannot return to the preprogression health state and must remain in the postprogression health state or transition to the death state, which is an absorbing health state (refer to Figure 1 in Appendix 3).
Model Inputs
Evidence related to the patients’ baseline characteristics, the effectiveness of erdafitinib and physician’s-choice chemotherapy, and health-related quality of life originated primarily from the THOR trial,2 which was conducted in 23 countries and/or territories, including 6 sites in Canada, with 266 adult patients who had FGFR-altered la/mUC and who experienced progression after 1 or 2 prior lines of systemic treatment, at least 1 of which included an anti-PD-1 or anti-PD-L1 drug (mean age = 66 years; 71.4% male; mean body surface area (████ m2) in the model.2
Key clinical efficacy inputs (i.e., OS and PFS) for erdafitinib and physician’s-choice chemotherapy were based on the results of the THOR trial, whereas for enfortumab vedotin, the evidence of effectiveness was sourced from the EV-301 trial.3 The sponsor independently modelled PFS and OS for erdafitinib and physician’s-choice chemotherapy from the THOR trial and for enfortumab vedotin from EV-301 trial, and extrapolated the curves according to parametric distributions. Several parametric survival functions were fitted to the PFS and OS data to determine the best-fitting distribution, based on the Akaike information criterion, the Bayesian information criterion, and visual inspection. The sponsor selected exponential distribution for all the OS curves, log-logistic for PFS for erdafitinib and physician’s-choice chemotherapy, and generalized gamma for enfortumab vedotin. No treatment waning was explored by the sponsor. The sponsor also fitted parametric curves to the TTD data from the THOR trial for erdafitinib and physician’s-choice chemotherapy and assumed a log-logistic distribution for both therapies. For enfortumab vedotin, the sponsor assumed that TTD would be equivalent to time to progression. For erdafitinib, it was assumed that at each cycle, the probability of continuing treatment could not exceed the probability of remaining progression-free. In instances where the probability of TTD was greater than that of PFS, the probability of TTD was adjusted to match the probability of PFS. The median TTD for erdafitinib was approximately ███ months, for physician’s-choice chemotherapy was ███ months, and for enfortumab vedotin was 5.5 months.
Health utilities were derived from the THOR trial, using the 5-Level EQ-5D indirect elicitation method, in which the UK-based value dataset was used to translate questionnaire responses to health utilities.1 A crosswalk mapping algorithm was used to translate 5-Level EQ-5D data to 3-Level EQ-5D.5 Disutilities associated with grade 3 or 4 adverse events (AEs) were derived for all comparators from UK-based values sourced from the literature. Disutilities were multiplied by the proportion and duration of each AE and applied to every cycle of the model. The sponsor further adjusted the health-state utility values for age.6
Costs in the base case analysis included the costs of treatment acquisition, premedication, administration, subsequent therapies, diagnostic testing, disease management (i.e., physician visit, CT scan, and laboratory tests), AE management, and end-of-life costs. Acquisition costs for erdafitinib were based on the sponsor’s submitted price, whereas other drug-acquisition costs were obtained from the IQVIA DeltaPA and previous CDA-AMC Reimbursement Reviews.7,8 Premedication was assumed for patients receiving docetaxel or paclitaxel. In addition, treatment administration was assumed for all IV drugs, based on the Ontario Schedule of Benefits.9 The sponsor assumed that 34.7% of patients who progressed would receive subsequent therapy in the third line, and among those who progressed after the third line of treatment, 16.7% would seek an additional line of therapy. The distribution for subsequent treatment differed by initial treatments and was based on expert opinion obtained by the sponsor. Where applicable, costs were based on mean patient body weight (72.88 kg) and body surface area (████ m2) from the THOR trial.2,10 FGFR testing was applied to all treatments in the model, with a weighted cost derived from published literature, assuming that 80% of patients would receive next-generation sequencing, while the remainder would receive reverse transcription polymerase chain reaction.11,12 Diagnostic testing costs were divided by the expected prevalence of FGFR3 in patients in Canada with la/mUC (15%) to capture the expected costs of identifying eligible patients for treatment. Erdafitinib requires more frequent monitoring for ocular AEs, and the frequency of ophthalmology visits was informed by the draft product monograph. The cost of managing AEs was obtained from the Ontario Case Costing Initiative and assumed to be managed in an outpatient setting, with the exception of febrile neutropenia, which was assumed to be managed in an inpatient setting.13 The cost of end-of-life care was obtained from the literature.9,14,15
Summary of Sponsor’s Economic Evaluation Results
All analyses were run probabilistically (2000 iterations for the base case and scenario analyses). The sponsor reported both probabilistic and deterministic results, and the results aligned in the 2 approaches. The probabilistic findings are presented here. The submitted analysis was based on the submitted price for erdafitinib and the publicly available prices for comparators.
Base-Case Results
In the sponsor’s base case, erdafitinib was associated with an incremental QALY gained of 0.36 and an incremental cost of $71,699 compared with physician’s-choice chemotherapy, resulting in an ICER of $201,914 per QALY gained. Erdafitinib was associated with an incremental QALY gained of 0.05, and was less costly ($54,359) than enfortumab vedotin. Based on a sequential probabilistic analysis, physician’s-choice chemotherapy and erdafitinib are on the cost-effectiveness frontier, whereas enfortumab vedotin is dominated by erdafitinib. Erdafitinib was more costly and more effective than physician’s-choice chemotherapy in 99.90% of the probabilistic iterations, and was both less costly and more effective than enfortumab vedotin in 62% of probabilistic iterations. In the sponsor’s analysis, erdafitinib had a 0% chance of being cost-effective at a $50,000 per QALY willingness-to-pay threshold.
Disaggregated results indicated that the majority of the incremental LYs and QALYs associated with erdafitinib were accrued in the postprogression stage (refer to Table 10). Conversely, when compared with physician’s-choice chemotherapy, the majority of the incremental costs were accrued in the preprogression health state. When compared with enfortumab, erdafitinib was associated with lower costs in the preprogression health state, but higher costs in the postprogression health state. At 2 years, 30.4% of the cohort receiving erdafitinib was alive, as was 15.5% receiving physician’s-choice chemotherapy and 28.6% receiving enfortumab vedotin; at the end of the modelled time horizon, less than 1% of the cohort was alive in any of the studied treatment groups. The median follow-up period observed in the THOR trial was 15.9 months. For the comparison of erdafitinib and physician’s-choice chemotherapy, 70% of the incremental QALYs and 17% of the incremental costs were observed beyond follow-up period in the THOR trial, whereas for the comparison of erdafitinib and enfortumab vedotin, 87% of incremental QALYs and 11% of cost savings were observed beyond the follow-up period in the THOR trial.
The key drivers of cost differences in the sponsor’s base case were drug-acquisition costs, administration costs, and subsequent treatment costs (refer to Table 10).
Table 3: Summary of the Sponsor’s Economic Evaluation Results
Drug | Total costs ($) | Total QALYs | Sequential ICER ($/QALY) |
|---|---|---|---|
Physician’s-choice chemotherapy (docetaxel and paclitaxel) | 60,368 | 0.66 | Reference |
Erdafitinib | 132,067 | 1.02 | 201,914 |
Dominated treatments | |||
Enfortumab vedotin | 186,426 | 0.97 | Dominated by erdafitinib |
ICER = incremental cost-effectiveness ratio; QALY = quality-adjusted life-year.
Source: Sponsor’s pharmacoeconomic submission.1
Additional results from the sponsor’s submitted economic evaluation base case are presented in Appendix 3.
Sensitivity and Scenario Analyses Results
Multiple sensitivity and scenario analyses were submitted by the sponsor. The sponsor assessed 2 scenario analyses in which the comparison was made against the 2 chemotherapy regimens separately. Under the scenario in which erdafitinib was compared with docetaxel, the ICER increased to $218,974 per QALY gained, whereas when erdafitinib was compared with paclitaxel, the ICER decreased to $172,128 per QALY gained. None of the other assessed scenarios had a marked effect on the ICER (> 10%).
It should be noted that the sponsor assessed some of the scenario analyses using deterministic analyses, as opposed to the CDA-AMC recommended probabilistic analysis, and the scenarios reported herein were deterministic. A scenario analysis that adopted the societal perspective resulted in an ICER for erdafitinib versus physician’s-choice chemotherapy that was only marginally different from the base-case results ($206,762 per QALY gained under a societal perspective versus $201,677 per QALY gained under a health care perspective). Under a societal perspective, the sponsor took into consideration indirect costs associated with patient and caregiver lost productivity, travel, and parking costs.
CDA-AMC Appraisal of the Sponsor’s Economic Evaluation
CDA-AMC identified several key limitations to the sponsor’s analysis that have notable implications for the economic analysis.
The comparison between erdafitinib and enfortumab vedotin is uncertain. In the sponsor’s economic evaluation, this comparison was informed by a naive indirect comparison, as there is no direct comparison of these treatments. The sponsor undertook an indirect comparison using the matching-adjusted indirect comparison (MAIC) approach to compare erdafitinib with enfortumab vedotin. Although the results of the MAIC suggested that there may be a benefit for erdafitinib compared with enfortumab vedotin, CDA-AMC identified limitations with the MAIC that resulted in considerable uncertainty associated with these findings. The sponsor acknowledged the limitations of their MAIC in their pharmacoeconomic report, specifically the heterogeneity in the patient populations. Therefore, to estimate PFS and OS for enfortumab vedotin, the sponsor used data from the EV-301 trial, and conducted a naive comparison with the OS and PFS estimates for erdafitinib from the THOR trial. This naive indirect comparison introduces considerable uncertainty. In the sponsor’s base case, all of the incremental benefits for erdafitinib compared with enfortumab vedotin were observed in the postprogression state; there is no robust evidence to support a biological rationale for such an effect. The CDA-AMC clinical report noted that there is uncertainty about whether there is a meaningful difference between erdafitinib and enfortumab vedotin in survival, response outcomes, or harms. Therefore, although clinical expert input received by CDA-AMC considered enfortumab vedotin to be the most relevant comparator for erdafitinib, given the limitations with the available evidence, the comparative cost-effectiveness of erdafitinib and enfortumab vedotin should be interpreted cautiously.
CDA-AMC was unable to address this limitation, given the paucity of comparative clinical evidence.
The model structure fails to capture causal relationships appropriately: The sponsor employed a PSM to estimate the costs and outcomes for each treatment. Although the PSM approach is widely used in the economic evaluation of oncology treatments, the approach does not explicitly account for the causal relationship between PFS and OS, nor does it explicitly model the transitions to progression or the impact of receiving subsequent treatments as health states. This omission could result in inaccurate estimates of the long-term effects of the interventions. Specifically, the sponsor modelled a postprogression survival benefit for patients receiving erdafitinib in which patients receiving erdafitinib were expected to live 0.074 years longer after they experienced progression than patients receiving enfortumab vedotin who experienced disease progression. Similar findings were identified for erdafitinib and chemotherapy, with erdafitinib being associated with an even larger postprogression survival benefit (0.338 LYs). Clinical expert input received by CDA-AMC noted that there is no evidence of a clear mechanism by which erdafitinib would provide clinical benefit to patients with progressive disease. Rather, the sponsor’s use of the PSM introduced structural assumptions about the relationship between PFS and OS that likely do not accurately reflect casual relationships within the disease pathway, but are, rather, an artifact of the way OS and PFS have been modelled, favouring erdafitinib. Although the THOR and EV-301 trials had long follow-up periods, relative to the patient population’s life expectancy (median follow-up times were 15.9 months and 11.0 months, respectively), and although the data on PFS are considered mature, the life expectancy for these patients is relatively short (generally less than 5 years), and differences in life expectancy can have a large impact on the overall ICER estimate.
CDA-AMC was unable to evaluate the concerns related to this limitation, although this approach is likely to bias the results in favour of erdafitinib.
The sponsor’s extrapolation of THOR trial data was inappropriate. The sponsor’s choice of an exponential parametric distribution for the OS curve for erdafitinib is not statistically or clinically justified. By selecting an exponential distribution for all treatment arms, the sponsor assumed a constant risk of death. Even though this was in line with statistical estimates in the physician’s-choice chemotherapy arm, it was not the case in the erdafitinib arm, where the hazard of death was lower early in the trial and increased thereafter. This modelling approach is a contributor to the observed postprogression survival, which was overestimated, according to clinical expert feedback sought by CDA-AMC. The other parametric distributions provided by the sponsor offered a better fit to the observed data, with the best statistical fit (also validated by the clinical experts) being a log-logistic distribution.
The CDA-AMC base-case analysis assumed a log-logistic distribution for OS with erdafitinib. This reduced the postprogression benefit estimated for erdafitinib compared to enfortumab vedotin, but did not account for all of it.
Because a smaller postprogression benefit remained for erdafitinib compared to enfortumab vedotin, CDA-AMC conducted a scenario analysis that restricted the modelled time horizon to 5 years, based on clinical expert input received by CDA-AMC, which stated that the majority of patients do not survive more than 5 years after diagnosis.
The incorporation of an RDI is inappropriate: The sponsor’s base case incorporated a weighted dose of erdafitinib, given the potential increase in dose (from 8 mg) after the first 2 weeks of treatment to a maximum of 9 mg. In addition, the sponsor assumed that an RDI would apply to erdafitinib, as well as to the comparator treatments, with erdafitinib having a lower RDI (69%) than physician’s-choice chemotherapy (98%) and enfortumab vedotin (90%). A reduction in RDI can be derived from a delayed dose, a missed dose, or a reduction in dose. In the context of erdafitinib, which is orally administered, it is possible that there will be missed or delayed doses, but these are unlikely to impact drug costs, as those are likely to be incurred regardless of changes in dosing. In addition, the sponsor has assumed a differential RDI between treatments, but there is no evidence to suggest that erdafitinib should have a different RDI than the other regimens. The sponsor’s assumption is expected to have underestimated the costs associated with erdafitinib compared with the rest of the therapies.
CDA-AMC maintained the RDI for enfortumab vedotin because of the route of administration, small vial sizes, and the similarity in cost per mg between the vial sizes. Furthermore, the study identified by the sponsor aligns with other observed evidence for enfortumab vedotin, in which the RDI ranges from 79% to 90%.4,16,17 Given the route of administration, the clinical experts agreed that it is likely that some patients will miss a treatment administration with enfortumab vedotin for various reasons. As a result, it is reasonable to assume that the RDI is less than 100% for enfortumab vedotin.
The CDA-AMC base-case analysis assumed an RDI of 100% for erdafitinib.
Testing costs were applied inappropriately. The sponsor assumed that FGFR testing would be performed in all patients before first-line therapy, citing guidance from Alberta. The clinical experts consulted by CDA-AMC clarified that this is not standard practice in all regions of Canada. In particular, FGFR testing may not be available or routinely used as a test in earlier lines of therapy for patients with la/mUC in some jurisdictions. As such, it would be more appropriate if FGFR testing were applied only to the erdafitinib arm, as no other comparator treatments require FGFR testing before use. However, the submitted model produced errors when the testing costs were applied to a subset of treatments.
CDA-AMC was unable to apply FGFR testing costs to the erdafitinib arm only as part of the CDA-AMC base case, given the structural limitations of the sponsor’s model. The submitted model produced errors when attempts were made to apply testing costs to the erdafitinib arm only.
CDA-AMC undertook a scenario analysis in which the cost of FGFR testing was initially removed from all treatments, and then retrospectively and deterministically applied it only to erdafitinib.
TTD was capped at PFS for erdafitinib. The sponsor assumed that the proportion of patients receiving treatment could not exceed the proportion of patients who are progression-free. This does not align with the design of the THOR trial, in which patients were permitted to receive erdafitinib after progression. Based on the proportion of patients receiving treatment, as informed by the TTD curve from the THOR trial, the inputs for the economic analysis indicated that patients tended to be on treatment beyond progression for the majority of the trial period. Clinical expert input noted that clinically significant disease progression (or symptomatic progression) and issues of toxicity and tolerability would be considered part of the criteria to determine whether to continue treatment. The consequence of the sponsor’s assumption is that the model likely underestimates the true duration of treatment.
CDA-AMC undertook a scenario analysis in which the TTD curve was not restricted to always being below the PFS curve.
Additionally, the following key assumptions were made by the sponsor and have been appraised by CDA-AMC (Table 4).
Table 4: Key Assumptions of the Submitted Economic Evaluation (Not Noted as Limitations to the Submission)
Sponsor’s key assumption | CDA-AMC comment |
|---|---|
The UK EQ-5D value sets are applicable to a Canadian setting. In addition, a crosswalk algorithm was applied to map EQ-5D-5L to EQ-5D-3L. | Inappropriate, but unlikely to affect outcomes because the differences are expected to be small. The use of the crosswalk algorithm is likely to increase uncertainty and may bias utility estimates, although the direction of bias is unclear. |
Paclitaxel and vinflunine have comparable efficacy. | Reasonable. The sponsor used paclitaxel in this economic evaluation as one of the physician’s-choice chemotherapy regimens because vinflunine, a chemotherapy option in the THOR trial, is not approved in Canada. The sponsor assumed that paclitaxel and vinflunine would have comparable efficacy, which is reasonable, according to clinical expert input obtained by CDA-AMC. |
Upon progression, most patients received either enfortumab vedotin or erdafitinib, depending on their treatment history. | Reasonable. According to clinical expert input received by CDA-AMC, subsequent treatment would include 1 of the 2 studied regimens (enfortumab vedotin or erdafitinib) before chemotherapy or palliative care. |
CDA-AMC = Canada's Drug Agency.
CDA-AMC Reanalyses of the Economic Evaluation
Base-Case Results
The CDA-AMC base case was derived after making changes that addressed several limitations of the economic model. CDA-AMC made changes to model parameter values and assumptions, in consultation with clinical experts (summarized in Table 5).
Table 5: CDA-AMC Revisions to the Submitted Economic Evaluation
Stepped analysis | Sponsor’s value or assumption | CDA-AMC value or assumption |
|---|---|---|
Changes to derive the CDA-AMC base case | ||
1. Parametric distribution assumed for the OS curve for erdafitinib | Exponential distribution | Log-logistic distribution |
2. RDI for erdafitinib | 69% | 100% |
CDA-AMC base case | — | 1 + 2 |
CDA-AMC = Canada's Drug Agency; OS = overall survival; RDI = relative dose intensity.
The CDA-AMC probabilistic base-case reanalysis demonstrated that erdafitinib is more expensive than physician’s-choice chemotherapy (incremental costs = $108,013) and more effective (incremental QALY gains = 0.34) than physician’s-choice chemotherapy. This produced an ICER of $305,091 per QALY gained. Erdafitinib was found to remain dominant over enfortumab vedotin (cost savings of $24,260 and a marginally higher QALY of 0.03). Enfortumab vedotin was dominated by erdafitinib and did not appear on the cost-effectiveness efficiency frontier. At a willingness-to-pay threshold of $50,000 per QALY gained, erdafitinib had a 0% probability of being cost-effective. Results of the stepped reanalysis are available in Table 6, with full disaggregated results available in Table 12 in Appendix 4).
However, the differences in QALYs between enfortumab vedotin and the rest of the comparators were also associated with a large degree of methodological uncertainty, primarily because of the lack of direct comparisons for survival and progression outcomes. Erdafitinib produced an incremental postprogression benefit of 0.34 LYs (0.19 QALYs) compared to physician’s-choice chemotherapy, and of 0.08 LYs (0.04 QALYs) compared to enfortumab vedotin. Approximately 61% of the incremental QALYs and 17% of the incremental costs associated with erdafitinib, compared with physician’s-choice chemotherapy, were accrued after 15.9 months, whereas 6% of the incremental QALYs and 3% of the incremental costs for the comparison between erdafitinib and enfortumab vedotin were accrued beyond 15.9 months. The CDA-AMC base-case change that resulted in the largest change in the ICER of erdafitinib versus physician’s-choice chemotherapy was the assumption that the RDI was 100%.
It should be noted that the CDA-AMC reanalysis is based on publicly available prices of the comparator treatments.
Table 6: Summary of the CDA-AMC Reanalysis Results
Drug | Total costs ($) | Total QALYs | Sequential ICER ($/QALY) |
|---|---|---|---|
Sponsor base case (probabilistic) | |||
Physician’s-choice chemotherapy | 60,368 | 0.66 | Reference |
Erdafitinib | 132,067 | 1.02 | 201,914 |
Enfortumab vedotin | 186,426 | 0.97 | Dominated by erdafitinib |
CDA-AMC base case (probabilistic) | |||
Physician’s-choice chemotherapy | 63,678 | 0.66 | Reference |
Erdafitinib | 168,416 | 1.01 | 305,091 |
Enfortumab vedotin | 192,675 | 0.97 | Dominated by erdafitinib |
CDA-AMC = Canada's Drug Agency; ICER = incremental cost-effectiveness ratio; QALY = quality-adjusted life-year.
Scenario Analysis Results
To address uncertainty regarding postprogression benefit, TTD, and the inclusion of the FGFR testing costs on the model outcomes, CDA-AMC conducted 3 scenario analyses (Table 16). For uncertainty regarding postprogression benefit, the model’s time horizon was shortened to 5 years; for TTD, this was not capped by PFS for erdafitinib; and for FGFR testing costs, cost were applied only to the erdafitinib arm. In all scenario analyses, the results remained consistent to the CDA-AMC reanalysis base case, although the ICERs increased for erdafitinib relative to physician’s-choice chemotherapy.
CDA-AMC undertook price-reduction analyses based on the sponsor’s base case and the CDA-AMC base case. As reported in Table 7, a 68% price reduction is required for erdafitinib to be considered cost-effective at a threshold of $50,000 per QALY gained compared with physician’s-choice chemotherapy. In the CDA-AMC base case, a price reduction of 76% (i.e., erdafitinib prices of $38.79 per 3 mg tablet, $51.71 per 4 mg tablet, and $64.64 per 5 mg tablet) is needed for erdafitinib to be considered cost-effective at a threshold of $50,000 per QALY gained compared with physician’s-choice chemotherapy.
Table 7: CDA-AMC Price-Reduction Analyses
Analysis | Drug cost per | ICERs for erdafitinib vs. physician’s-choice chemotherapyb ($/QALY) | |
|---|---|---|---|
Price reduction | Sponsor base case | CDA-AMC reanalysis | |
No price reduction | 211.08 | 201,914 | 305,091 |
10% | 189.97 | 179,421 | 271,286 |
20% | 168.86 | 156,929 | 237,482 |
30% | 147.76 | 134,436 | 203,678 |
40% | 126.65 | 111,944 | 169,874 |
50% | 105.54 | 89,451 | 136,070 |
60% | 84.43 | 66,959 | 102,266 |
70% | 63.32 | 44,467 | 68,462 |
80% | 42.22 | 21,974 | 34,658 |
90% | 21.11 | Dominant | 853 |
CDA-AMC = Canada's Drug Agency; ICER = incremental cost-effectiveness ratio; QALY = quality-adjusted life-year; vs. = versus.
aAlthough only the price of the 4 mg tablet is reported because of space constraints, price reductions were applied to the 3 mg and 5 mg tablet strengths as well.
bEnfortumab vedotin remains dominated by (more costly and fewer QALYs than) erdafitinib in these analyses.
Issues for Consideration
At the time of this review, enfortumab vedotin, in combination with pembrolizumab, is under review for the treatment of adult patients with la/mUC. According to clinical expert input obtained by CDA-AMC, if funded as indicated, enfortumab vedotin plus pembrolizumab will likely become the new standard of care for the first-line systemic treatment of patients with la/mUC. As such, patients eligible for erdafitinib will be more likely to have already received enfortumab vedotin, so it will be less relevant as a comparator. Patients requiring therapy beyond the first line will also be more likely to have received a PD-1 inhibitor (i.e., pembrolizumab), so more likely to be eligible for erdafitinib. Finally, under the current provisional funding algorithm for la/mUC,18 all patients who have exposure to a PD-1 or PD-L1 inhibitor will also have received platinum-based chemotherapy; however, should enfortumab vedotin plus pembrolizumab be funded as first-line systemic therapy, this may no longer be the case. As such, patients may become eligible for erdafitinib who have not previously received platinum-based chemotherapy (with or without avelumab maintenance), so platinum-based chemotherapy may become a relevant comparator to erdafitinib.
Enfortumab vedotin received a positive recommendation from the pan-Canadian Oncology Drug Review Expert Review Committee for the treatment of adult patients with unresectable la/mUC who have previously received PD-1 or PD-L1 inhibitor therapy, conditional on a price reduction,19 and successfully concluded negotiations with the pan-Canadian Pharmaceutical Alliance.20 Input from the public plans indicated that a confidential price exists for enfortumab vedotin (refer to Patient, Clinician, and Drug Plan Input section), so the price of enfortumab vedotin is likely less than estimated in this review.
The sponsor’s submission suggests that FGFR testing is currently in place, with sites in Ontario and Quebec. Currently, the Ontario sites are responsible for testing patients from Alberta, Manitoba, Newfoundland and Labrador, and Ontario, whereas the Quebec site is responsible for testing patients from British Columbia, New Brunswick, Nova Scotia, Prince Edward Island, and Saskatchewan. It is unclear how testing is obtained for individuals covered by the Non-Insured Health Benefits Program (NIHB). Although testing in Ontario is publicly funded through the Comprehensive Cancer Biomarker Testing Program, it is unclear how testing is funded in jurisdictions that rely on out-of-province testing facilities.
Overall Conclusions
Based on the CDA-AMC clinical review, erdafitinib may be associated with a significant improvement in PFS and OS compared to physician’s-choice chemotherapy, albeit with a worse side-effect profile for patients with la/mUC. Given the absence of head-to-head comparisons between erdafitinib and enfortumab vedotin, the sponsor submitted an ITC. The results from this ITC showed that there is uncertainty about whether there is a meaningful difference between erdafitinib and enfortumab vedotin in survival, response outcomes, or harms. The sponsor used a naive comparison to inform its economic evaluation because of the limitations they identified with the ITC.
CDA-AMC undertook a reanalysis in which the following changes were made: RDI was set to 100% for erdafitinib, and the distribution used to extrapolate OS for erdafitinib was revised from exponential to log-logistic. In the CDA-AMC base case, erdafitinib was associated with a cost-effectiveness ratio of $305,091 per QALY gained compared to physician’s-choice chemotherapy. Erdafitinib was associated with a small incremental QALY benefit and fewer costs than enfortumab vedotin (i.e., dominant). The estimated ICER of erdafitinib versus physician-choice chemotherapy was higher than the sponsor-submitted ICER. This difference was mainly driven by a change in the RDI associated with erdafitinib. For erdafitinib to be considered cost-effective at a $50,000 per QALY gained threshold, its price would need to be reduced by 76%. This would reduce the per-patient costs of erdafitinib, from a range of $11,820 to $13,298 per 28-day cycle to a range of $2,896 to $3,258 (maintenance therapy).
These estimates may underestimate the ICER because CDA-AMC was unable to remove the long-term postprogression benefit associated with erdafitinib, and predicted by the economic model, and because the TTD curve for erdafitinib was restricted to being below the PFS curve in the model. Furthermore, it should be noted that the comparison between erdafitinib and enfortumab vedotin remains highly uncertain, given the absence of head-to-head comparisons. As a result, it is not possible to determine whether any efficacy differences between the therapies estimated by the model are due to the treatment, bias, or unobserved confounding factors. As a result, there is no robust evidence for a price premium for erdafitinib compared with enfortumab vedotin. All costs and incremental savings are based on publicly available list prices and may not reflect actual prices paid by Canadian public drug plans.
References
1.Pharmacoeconomic evaluation [internal sponsor's report]. In: Drug Reimbursement Review sponsor submission: Balversa (erdafitinib), tablet, 3 mg, 4 mg and 5 mg, oral. Toronto (ON): Janssen Inc.; 2024 Jun 14.
2.Loriot Y, Matsubara N, Park SH, et al. Erdafitinib or Chemotherapy in Advanced or Metastatic Urothelial Carcinoma. N Engl J Med. 2023;389(21):1961-1971. PubMed
3.Powles T, Rosenberg JE, Sonpavde GP, et al. Enfortumab Vedotin in Previously Treated Advanced Urothelial Carcinoma. N Engl J Med. 2021;384(12):1125-1135. PubMed
4.Tsingas K, Parikh RB, Elsouda D, et al. Real-world use, dose intensity, and adherence to enfortumab vedotin (EV) in locally advanced or metastatic urothelial cancer (la/mUC). J Clin Oncol. 2023;41(16_suppl):e16567-e16567.
5.van Hout BA, Shaw JW. Mapping EQ-5D-3L to EQ-5D-5L. Value Health. 2021;24(9):1285-1293. PubMed
6.Hernández Alava M, Pudney S, Wailoo A. Estimating the Relationship Between EQ-5D-5L and EQ-5D-3L: Results from a UK Population Study. Pharmacoeconomics. 2023;41(2):199-207. PubMed
7.Enfortumab vedotin (Padcev) - Clinical & Pharmacoeconomic Review Report. Can J Health Technol. 2022;2(5). https://www.cadth.ca/sites/default/files/DRR/2022/PC0251-Padcev.pdf. Accessed 2024 Apr 01.
8.Iqvia. Delta PA Ontario Costs - February 2024. 2024 [sponsor submitted reference].
9.Ontario Ministry of Health. Ontario Schedule of Benefits Physician Services Under the Health Insurance Act. 2023: https://www.ontario.ca/files/2024-01/moh-ohip-schedule-of-benefits-2024-01-24.pdf. Accessed 2024 Mar 01.
10.Clinical Study Report: JNJ-42756493. A Phase 3 Study of Erdafitinib Compared with Vinflunine or Docetaxel or Pembrolizumab in Subjects with Advanced Urothelial Cancer and Selected FGFR Gene Aberrations [internal sponsor's report]. Raritan (NJ): Janssen Research & Development LLC; 2023 Aug 7.
11.Makarem M, Ezeife DA, Smith AC, et al. Reflex ROS1 IHC Screening with FISH Confirmation for Advanced Non-Small Cell Lung Cancer-A Cost-Efficient Strategy in a Public Healthcare System. Curr Oncol. 2021;28(5):3268-3279. PubMed
12.Qiagen Diagnostics. Therascreen FGFR RGQ RT-PCR Kit (24). https://www.qiagen.com/ca/products/diagnostics-and-clinical-research/oncology/therascreen-fgfr-rgq-rt-pcr-kit-ca. Accessed 2024 Mar 01.
13.Ontario Ministry of Health Long Term Care. Ontario Case Costing Initiative. Costing Analysis Tool. 2017: https://hsimi.ca/occp/occpreports/. Accessed 2022 Oct 26.
14.Garaszczuk R, Yong JHE, Sun Z, de Oliveira C. The Economic Burden of Cancer in Canada from a Societal Perspective. Curr Oncol. 2022;29(4):2735-2748. PubMed
15.Ontario Ministry of Health. Ontario Schedule of Benefits for Laboratory Services. 2023; https://www.ontario.ca/files/2024-01/moh-ohip-schedule-of-benefits-laboratory-services-2024-01-24.pdf. Accessed 2024 Mar 01.
16.Clennon A, Hinkley M, Nymberg K, et al. Effect of Enfortumab Vedotin Dose Adjustment on Efficacy in Metastatic Urothelial Carcinoma: A Retrospective Single-Center Experience Cancer Manag Res. 2023;15(1179-1322 (Print)):1245-1250.
17.Tang M, Garg A, Bonate PL, et al. Clinical Pharmacology of the Antibody–Drug Conjugate Enfortumab Vedotin in Advanced Urothelial Carcinoma and Other Malignant Solid Tumors. Clin Pharmacokinet. 2024;63(4):423-438. PubMed
18.CADTH Provisional Funding Alogrithm. Metastatic urothelial carcinoma. Ottawa (ON): CADTH; 2023: https://www.cadth.ca/sites/default/files/pdf/PH0017-mUC-CAPCA-Endorsement.pdf. Accessed 2024 Jul 08.
19.Enfortumab Vedotin (Padcev) - CADTH Reimbursement Recommendation. Can J Health Technol. 2022;2(1). https://www.cadth.ca/sites/default/files/DRR/2022/PC0251REC-Padcev%20Final-meta.pdf. Accessed 2023 Nov 01.
20.pan-Canadian Pharmaceutical Alliance. Padcev (enfortumab vedotin). 2022; https://www.pcpacanada.ca/negotiation/21705. Accessed 2024 Aug 28.
21.Balversa (erdafitinib): tablet, 3 mg, 4 mg and 5 mg, oral [product monograph]. Toronto (ON): Janssen Inc.; 2023 Oct 25.
22.Cancer Care Ontario: funded evidence-informed regimens. 2024; https://www.cancercareontario.ca/en/drugformulary/regimens. Accessed 2024 Jul 08.
23.DeltaPA. Ottawa (ON): IQVIA; 2023: https://www.iqvia.com/. Accessed 2024 Jul 08.
24.Budget Impact Analysis [internal sponsor's report]. In: Drug Reimbursement Review sponsor submission: Balversa (erdafitinib), tablet, 3 mg, 4 mg and 5 mg, oral. Toronto (ON): Janssen Inc.; 2024 Jun 14.
25.Locally Advanced/Metastatic Bladder Cancer Clinical Practice Guideline. Edmonton (AB): Cancer Care Alberta; 2023: https://www.albertahealthservices.ca/assets/info/hp/cancer/if-hp-cancer-guide-gu014-ambc.pdf. Accessed 2024 Jul 08.
26.Isharwal S, Konety B. Non-muscle invasive bladder cancer risk stratification. Indian J Urol. 2015;31(4):289-296. PubMed
27.Tian J, Sun J, Fu G, et al. Population-based outcome of muscle-invasive bladder cancer following radical cystectomy: who can benefit from adjuvant chemotherapy? Transl Androl Urol. 2021;10(1):356-373. PubMed
28.Warren M, Kolinsky M, Canil CM, et al. Canadian Urological Association/Genitourinary Medical Oncologists of Canada consensus statement: Management of unresectable locally advanced and metastatic urothelial carcinoma. Can Urol Assoc J. 2019;13(10):318-327. PubMed
29.Kulkarni GS, Black PC, Sridhar SS, et al. Canadian Urological Association guideline: Muscle-invasive bladder cancer. Can Urol Assoc J. 2019;13(8):230-238. PubMed
30.CADTH Reimbursement Review. Enfortumab Vedotin (Padcev). Clinical and Pharmacoeconomic combined Report. Can J Health Technol. 2023;2(5). https://www.cadth.ca/sites/default/files/DRR/2022/PC0251-Padcev.pdf. Accessed 2024 Jul 08.
31.Moria FA, Park CL, Eigl BJ, Macfarlane R, Pavic M, Saleh RR. A Real-World Retrospective Analysis of the Management of Advanced Urothelial Carcinoma in Canada. Curr Oncol. 2024;31(2):704-722. PubMed
32.Morgans AK, Grewal S, Hepp Z, et al. Clinical and Patient-Reported Outcomes of Advanced Urothelial Carcinoma Following Discontinuation of PD-1/L1 Inhibitor Therapy. Clin Genitourin Cancer. 2022;20(6):543-552. PubMed
33.Tomlinson DC, Baldo O, Harnden P, Knowles MA. FGFR3 protein expression and its relationship to mutation status and prognostic variables in bladder cancer. J Pathol. 2007;213(1):91-98. PubMed
34.Sternberg CN, Petrylak DP, Bellmunt J, et al. FORT-1: Phase II/III Study of Rogaratinib Versus Chemotherapy in Patients With Locally Advanced or Metastatic Urothelial Carcinoma Selected Based on FGFR1/3 mRNA Expression. J Clin Oncol. 2023;41(3):629-639. PubMed
35.Ferlay J, Ervik M, Lam F, et al. Global Cancer Observatory: Cancer Today. Lyon, France: International Agency for Research on Cancer. Lyon (FR): Global Cancer Observatory; 2024: https://gco.iarc.who.int/media/globocan/factsheets/populations/124-canada-fact-sheet.pdf. Accessed 2024 Jun 14.
36.Canadian Cancer Statistics Advisory Committee. Canadian Cancer Statistics 2018. 2018; https://cdn.cancer.ca/-/media/files/research/cancer-statistics/2018-statistics/canadian-cancer-statistics-2018-en.pdf, 2024 Aug 22.
37.Bhindi B, Kool R, Kulkarni GS, et al. Canadian Urological Association guideline on the management of non-muscle-invasive bladder cancer. Can Urol Assoc J. 2021;15(8):E424-457. PubMed
38.European Association of Urology. Non-muscle-invasive Bladder Cancer: epidemiology and aetiology. 2024; https://uroweb.org/guidelines/non-muscle-invasive-bladder-cancer/chapter/epidemiology-aetiology-and-pathology. Accessed 2024 Aug 02.
39.Ghandour R, Singla N, Lotan Y. Treatment Options and Outcomes in Nonmetastatic Muscle Invasive Bladder Cancer. Trends in Cancer. 2019;5(7):426-439. PubMed
40.Canadian Cancer Society. Survival statistics for bladder cancer. 2024; https://cancer.ca/en/cancer-information/cancer-types/bladder/prognosis-and-survival/survival-statistics. Accessed 2024 Aug 21.
41.Sylvester RJ, van der Meijden AP, Oosterlinck W, et al. Predicting recurrence and progression in individual patients with stage Ta T1 bladder cancer using EORTC risk tables: a combined analysis of 2596 patients from seven EORTC trials. Eur Urol. 2006;49(3):466-465; discussion 475-467. PubMed
42.Grabe-Heyne K, Henne C, Mariappan P, Geiges G, Pohlmann J, Pollock RF. Intermediate and high-risk non-muscle-invasive bladder cancer: an overview of epidemiology, burden, and unmet needs. Front Oncol. 2023;13(2234-943X (Print)):1170124.
43.Bavencio, Carcinome urothélial. Avis transmis au ministre en février 2021. Quebec (QC): INESSS; 2021: https://www.inesss.qc.ca/fileadmin/doc/INESSS/Inscription_medicaments/Avis_au_ministre/Mars_2021/Bavencio_2021_02.pdf. Accessed 2024 Aug 22.
44.Padcev, Carcinome urothélial. Avis transmis au ministre en février 2022. Quebec (QC): INESSS; 2022: https://www.inesss.qc.ca/fileadmin/doc/INESSS/Inscription_medicaments/Avis_au_ministre/Mars_2022/Padcev_2022_02.pdf. Accessed 2024 Aug 22.
Appendix 1: Cost Comparison Table
Please note that this appendix has not been copy-edited.
The comparators presented in the following table have been deemed to be appropriate based on feedback from clinical experts. Comparators may be recommended (appropriate) practice or actual practice. Existing Product Listing Agreements are not reflected in the table and as such, the table may not represent the actual costs to public drug plans.
Table 8: CDA-AMC Cost Comparison for the Treatment of Locally Advanced or Metastatic Urothelial Cancer After PD-1 Inhibitor Therapy
Treatment | Strength / concentration | Form | Price | Recommended dosage | Daily cost ($) | Cost per 28 days ($) |
|---|---|---|---|---|---|---|
Erdafitinib (Balversa) | 3 mg 4 mg 5 mg | Tablet | 158.3100 211.0800 263.8500 | 8 mg orally once daily, increasing to 9 mg daily based on serum phosphate levels and tolerability, assessed at 14 to 21 days after initiating treatment21 | Initial: 422.16 Maintenance: 422.16 to 474.93 | Maintenance: 11,820 to 13,298 |
Antibody-drug conjugate | ||||||
Enfortumab vedotin (PADCEV) | 10 mg/mL | 20 mg / 2 mL 30 mg / 3 mL Powder for IV solution | 1,181.0000 1,772.0000 | 1.25 mg/kg on days 1, 8, and 15 every 28 days22 | 632.68 | 17,715 |
Taxanes | ||||||
Docetaxel (generics) | 20 mg/mL | 80 mg / 4 mL 160 mg / 8 mL | 495.0000 990.0000 | 75 mg/m2 every 21 days until progression or unacceptable toxicity22 | 36.83 | 1,031 |
Paclitaxel (generics) | 6 mg/mL | 30 mg / 5 mL Solution for IV injection | 300.0000 | 175 mg/m2 every 21 days until progression or unacceptable toxicity22 | 158.33 | 4,433 |
CDA-AMC = Canada’s Drug Agency.
Note: All prices are from IQVIA Delta PA (accessed July 2024),23 unless otherwise indicated, and do not include dispensing fees. Dosing assumes a patient weight of 75 kg, a body surface area of 1.9 m2, and wastage of excess medication in vials for enfortumab vedotin. As taxanes are used for many indications, CDA-AMC assumed vials would be shared between patients for these products.
Appendix 2: Submission Quality
Please note that this appendix has not been copy-edited.
Description | Yes or no | Comments |
|---|---|---|
Population is relevant, with no critical intervention missing, and no relevant outcome missing | Yes | No comment |
Model has been adequately programmed and has sufficient face validity | Yes | No comment |
Model structure is adequate for decision problem | No | Refer to key limitations. The use of a PSM results in components of the model (e.g., postprogression survival) not meeting face validity. |
Data incorporation into the model has been done adequately (e.g., parameters for probabilistic analysis) | No | Refer to key limitations. The cost of diagnostic testing has been assigned to all treatment options. |
Parameter and structural uncertainty were adequately assessed; analyses were adequate to inform the decision problem | Yes | No comment |
The submission was well organized and complete; the information was easy to locate (clear and transparent reporting; technical documentation available in enough details) | Yes | No comment |
PSM = partitioned survival model.
Appendix 3: Additional Information on the Submitted Economic Evaluation
Please note that this appendix has not been copy-edited.
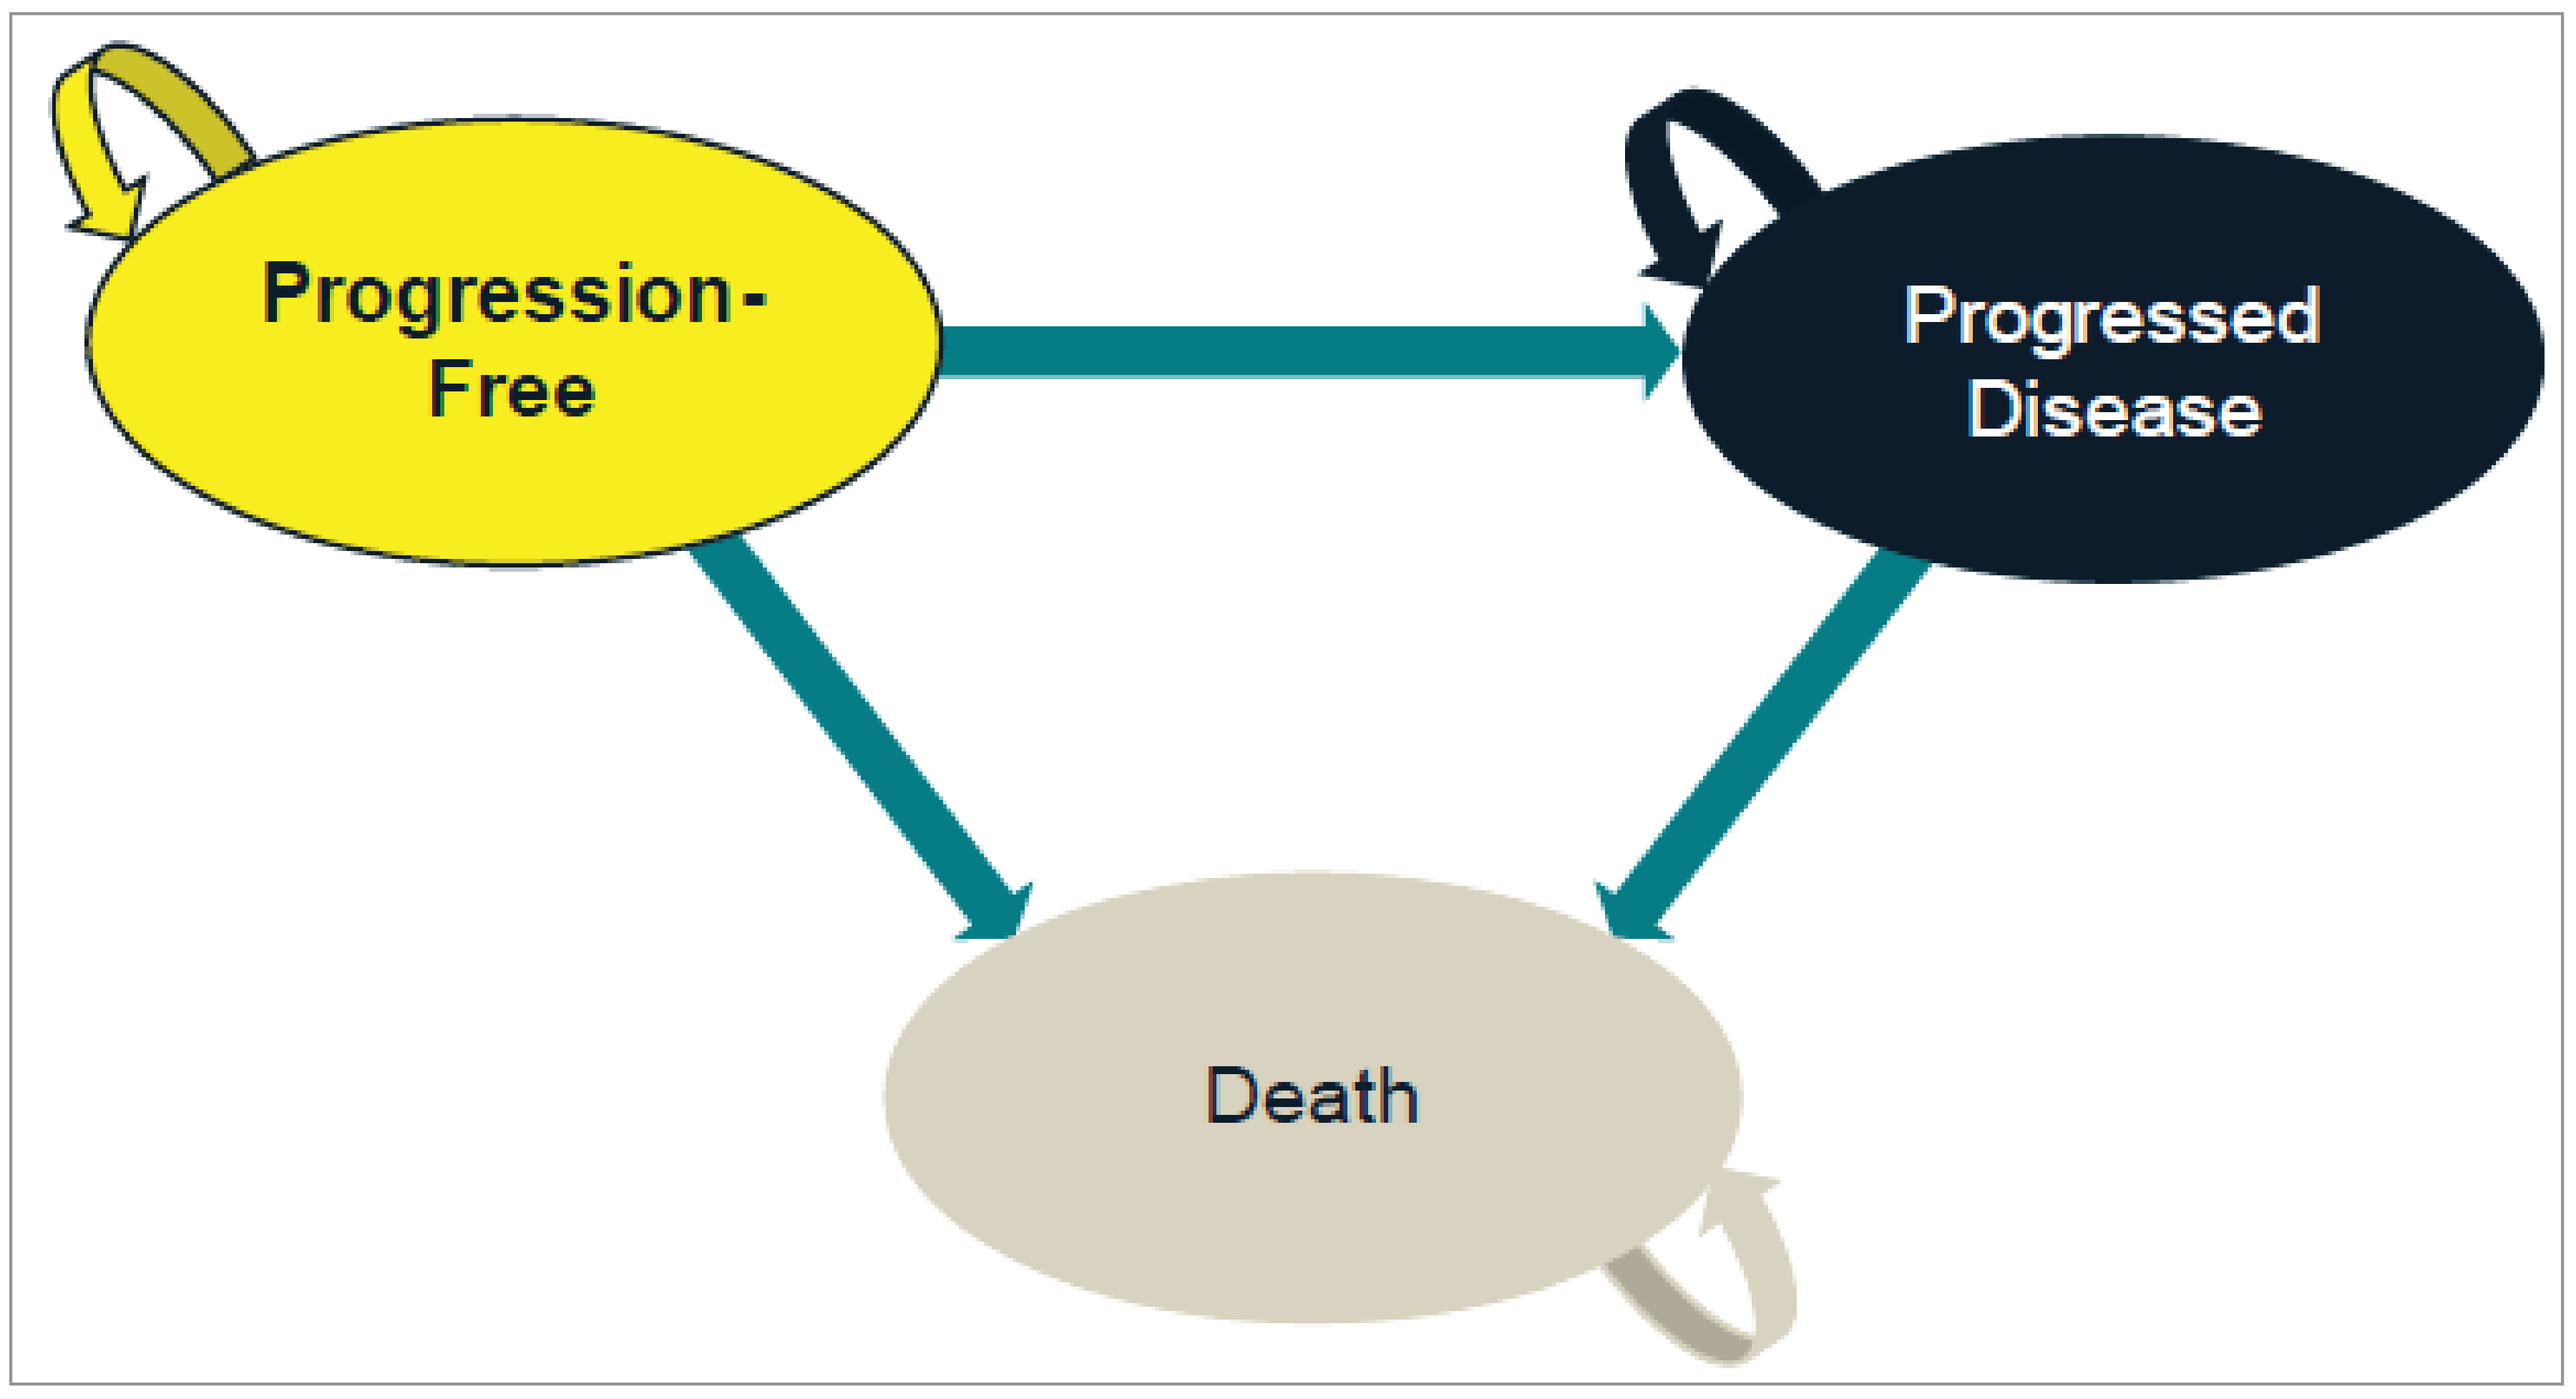
Detailed Results of the Sponsor’s Base Case
Table 10: Disaggregated Summary of the Sponsor’s Economic Evaluation Results
Parameter | Erdafitinib | Physician’s choice chemotherapy | Enfortumab vedotin |
|---|---|---|---|
Discounted LYs | |||
Progression-free | 0.66 | 0.44 | 0.68 |
Progressed | 0.99 | 0.63 | 0.89 |
Total LYs | 1.65 | 1.07 | 1.57 |
Discounted QALYs | |||
Progression-free | 0.45 | 0.30 | 0.46 |
Progressed | 0.57 | 0.36 | 0.51 |
Total QALYs | 1.02 | 0.66 | 0.97 |
Discounted costs ($) | |||
Total costs | 132,067 | 60,368 | 186,426 |
Based on timing of cost | |||
Progression-free | 89,218 | 23,844 | 157,279 |
Progressed | 29,061 | 22,574 | 15,328 |
End-of-life | 13,788 | 13,949 | 13,818 |
Based on cost category | |||
Drug-acquisition costs | 80,317 | 14,014 | 146,179 |
Drug administration costs | 0 | 767 | 2,110 |
Subsequent treatment acquisition costs | 27,996 | 21,838 | 14,745 |
Subsequent treatment administration costs | 439 | 211 | 42 |
Subsequent treatment HCRU costs | 625 | 524 | 541 |
Adverse event costs | 217 | 1,483 | 336 |
Health care resource costsa | 8,685 | 7,580 | 8,655 |
End-of-life costs | 13,788 | 13,949 | 13,818 |
HCRU = health care resource use; LY = life-year; QALY = quality-adjusted life-year.
aIncludes testing costs ($5,657 for each treatment).
Source: Sponsor’s pharmacoeconomic submission.1
Appendix 4: Additional Details on CDA-AMC Reanalyses and Sensitivity Analyses of the Economic Evaluation
Please note that this appendix has not been copy-edited.
Detailed Results of CDA-AMC Base Case
Table 11: Summary of the Stepped Analysis of the CDA-AMC Base-Case Results
Stepped analysis | Drug | Total costs ($) | Total QALYs | Sequential ICER ($/QALY) |
|---|---|---|---|---|
Sponsor base case (probabilistic) | Physician’s choice chemotherapya | 60,368 | 0.66 | Reference |
Erdafitinib | 132,067 | 1.02 | 201,914 | |
Dominated treatments | ||||
Enfortumab vedotin | 186,426 | 0.97 | Dominated by erdafitinib | |
1. CDA-AMC reanalysis 1 | Physician’s choice chemotherapya | 59,961 | 0.66 | Reference |
Erdafitinib | 131,591 | 1.00 | 211,238 | |
Dominated treatments | ||||
Enfortumab vedotin | 184,055 | 0.97 | Dominated by erdafitinib | |
2. CDA-AMC reanalysis 2 | Physician’s choice chemotherapya | 63,256 | 0.66 | Reference |
Erdafitinib | 167,407 | 1.01 | 298,022 | |
Dominated treatments | ||||
Enfortumab vedotin | 190,289 | 0.97 | Dominated by erdafitinib | |
CDA-AMC base case (deterministic) (reanalyses 1 + 2) | Physician’s choice chemotherapya | 63,256 | 0.66 | Reference |
Erdafitinib | 167,567 | 1.00 | 307,619 | |
Dominated treatments | ||||
Enfortumab vedotin | 190,289 | 0.97 | Dominated by erdafitinib | |
CDA-AMC base case (probabilistic) (reanalyses 1 + 2) | Physician’s choice chemotherapya | 63,678 | 0.66 | Reference |
Erdafitinib | 168,416 | 1.01 | 305,091 | |
Dominated treatments | ||||
Enfortumab vedotin | 192,675 | 0.97 | Dominated by Erdafitinib | |
CDA-AMC = Canada’s Drug Agency; ICER = incremental cost-effectiveness ratio; QALY = quality-adjusted life-year; vs. = versus.
Note: The CDA-AMC reanalysis is based on publicly available prices of the comparator treatments. The results of all steps are presented deterministically unless otherwise indicated, while the cumulative CDA-AMC base case is always presented both deterministically and probabilistically.
aDocetaxel and paclitaxel.
Table 12: Disaggregated Summary of the CDA-AMC Economic Evaluation Results
Parameter | Erdafitinib | Physician’s choice chemotherapy | Enfortumab vedotin |
|---|---|---|---|
Discounted LYs | |||
Progression-free | 0.667 | 0.444 | 0.680 |
Progressed | 0.967 | 0.629 | 0.892 |
Total LYs | 1.634 | 1.073 | 1.572 |
Discounted QALYs | |||
Progression-free | 0.455 | 0.303 | 0.464 |
Progressed | 0.552 | 0.361 | 0.509 |
Total QALYs | 1.007 | 0.663 | 0.973 |
Discounted costs ($) | |||
Total costs | 168,416 | 63,678 | 192,675 |
Based on timing of cost | |||
Progression-free | 125,731 | 23,844 | 157,279 |
Progressed | 29,052 | 25,884 | 21,578 |
End-of-life | 13,633 | 13,949 | 13,818 |
Based on cost category | |||
Drug-acquisition costs | 116,817 | 14,014 | 146,179 |
Drug administration costs | 0 | 767 | 2,110 |
Subsequent treatment acquisition costs | 27,989 | 25,148 | 20,995 |
Subsequent treatment administration costs | 439 | 211 | 42 |
Subsequent treatment HCRU costs | 625 | 524 | 541 |
Adverse event costs | 218 | 1,483 | 336 |
Health care resource costsa | 8,696 | 7,580 | 8,655 |
End-of-life costs | 13,633 | 13,949 | 13,818 |
HCRU = health care resource use; LY = life-year; QALY = quality-adjusted life-year.
Note: Key differences between the sponsor’s analysis and CDA-AMC analysis have been bolded.
aIncludes testing costs ($5,657 for each treatment).
Source: Sponsor’s pharmacoeconomic submission.1
Table 13: CDA-AMC Scenario Analyses
Scenario analysis | Drug | Total costs ($) | Total QALYs | Sequential ICER ($/QALY) |
|---|---|---|---|---|
CDA-AMC base case | Physician’s choice chemotherapya | 63,256 | 0.66 | Reference |
Erdafitinib | 167,567 | 1.00 | 307,619 | |
Dominated treatments | ||||
Enfortumab vedotin | 190,289 | 0.97 | Dominated by erdafitinib | |
CDA-AMC base case with FGFR testing costs assigned only to erdafitinib | Physician’s choice of chemotherapy | 57,599 | 0.66 | Reference |
Erdafitinib | 167,567 | 1.01 | 324,301 | |
Dominated treatments | ||||
Enfortumab vedotin | 178,398 | 0.97 | Dominated by erdafitinib | |
CDA-AMC base case with 5-year time horizon | Physician’s choice of chemotherapy | 62,581 | 0.66 | Reference |
Erdafitinib | 164,313 | 0.93 | 373,296 | |
Enfortumab vedotin | 189,326 | 0.94 | 3,366,932 | |
CDA-AMC base case with TTD curve not restricted to always be under PFS for erdafitinib | Physician’s choice of chemotherapy | 64,060 | 0.97 | Reference |
Erdafitinib | 186,003 | 0.66 | 355,212 | |
Enfortumab vedotin | 192,735 | 1.01 | Dominated by erdafitinib | |
FGFR = fibroblast growth factor receptor; ICER = incremental cost-effectiveness ratio; PFS = progression-free survival; QALY = quality-adjusted life-year; TTD = time to discontinuation.
Note: The CDA-AMC reanalysis is based on publicly available prices of the comparator treatments. The results of scenarios are presented deterministically unless otherwise indicated.
Appendix 5: Submitted Budget Impact Analysis and CDA-AMC Appraisal
Please note that this appendix has not been copy-edited.
Table 14: Summary of Key Take-Aways
Key take-aways of the budget impact analysis |
|---|
|
la/mUC = locally advanced unresectable or metastatic urothelial carcinoma; NIHB = Non-Insured Health Benefits; UC = urothelial carcinoma.
Summary of Sponsor’s Budget Impact Analysis
The sponsor submitted a budget impact analysis (BIA) estimating the expect incremental budgetary impact of reimbursing erdafitinib for the treatment of adult patients la/mUC harbouring susceptible FGFR3 genetic alterations, with disease progression during or following at least 1 line of a PD-1 or PD-L1 inhibitor therapy including within 12 months of neoadjuvant or adjuvant therapy.24 The submitted population was generally aligned with the proposed indication, though proposed indication may be slightly more broad as it includes patients who are not eligible for a PD-1 or PD-L1 and thus have not had one. The BIA was conducted from the perspective of the pan-Canadian public drug plans over a 3-year time horizon (time frame unreported).24 The sponsor’s pan-Canadian estimates reflect expected results for the population of Canada, subtracting the population of Quebec. As erdafitinib is an oral oncology product, the NIHB was included, however the NIHB population was not separately considered within the pan-Canadian estimate. The sponsor’s base case included drug-acquisition and FGFR3 alteration testing costs; cost of subsequent therapies were not included. Key inputs to the BIA are documented in Table 15.
Table 15: Summary of Key Model Parameters
Parameter | Sponsor’s estimate (reported as year 1 / year 2 / year 3 if appropriate) |
|---|---|
Target population (base year) | |
Number of patients with bladder cancer (excluding Quebec) | 40,277a |
Proportion patients with UC | 95%25 |
Proportion of UC patients diagnosed with NMIBC | 60%b |
Proportion NMIBC that will develop MIBC | 20%26 |
Proportion MIBC that will develop la/mUC | |
Proportion of patients diagnosed with MIBC | 25%29 |
Proportion MIBC that will develop la/mUC | |
Proportion of patient diagnosed with la/mUC | 15%28 |
Total patients diagnosed with or progressing to la/mUC | 12,818 |
Proportion of patients with la/mUC receiving 1L treatment | 65%30 |
Proportion of patients receiving PD-1 or PD-1L treatment | 58.2%31 |
Proportion of patients eligible for treatment after PD-1 or PD-1L treatment | 32.7%32 |
Proportion of patients who are publicly funded | 91.2%c |
Population growth rate | 3.96% / 3.09% / 2.99% |
Proportion of eligible patients tested for FGFR (assumed 50%31 in reference case) | 50% / 60% / 70% |
Proportion of patients who are FGFR3 positive | |
Number of patients eligible for drug under review | 113 / 139 / 168 |
Market share (3 years, reference scenario)30 | |
Erdafitinib | 0% / 0% / 0% |
Docetaxel | 12% / 12% / 12% |
Paclitaxel | 8% / 8% / 8% |
Enfortumab vedotin | 80% / 80% / 80% |
Market share (3 years, new drug scenario)d | |
Erdafitinib | 55% / 65% / 70% |
Docetaxel | 5% / 5% / 5% |
Paclitaxel | 5% / 5% / 5% |
Enfortumab vedotin | 35% / 25% / 20% |
Cost of treatment (per patient) | |
Erdafitinib (median duration: 6.8 months) | $95,706 |
Docetaxel (median duration: 2.8 months) | $4,021 |
Paclitaxel (median duration: 2.8 months) | $13,404 |
Enfortumab vedotin (median duration: 5.4 months) | $103,165 |
FGFR = fibroblast growth factor receptor; la/mUC = locally advanced unresectable or /metastatic urothelial carcinoma; MIBC = muscle invasive bladder cancer; NMIBC = non–muscle invasive bladder cancer; UC = urothelial carcinoma.
aBased on 5-year prevalence rate reported for Canada35 with proportion equal to the population of Quebec removed.
bCalculation based on 15% diagnosed with la/mUC and 25% with MIBC.
cAssumes 100% coverage for all patients aged 60 years and older, and 100% coverage for patients in Manitoba, Saskatchewan, Alberta, and British Columbia.24
dSponsor’s internal projections, data not provided.24
Summary of the Sponsor’s BIA Results
Results of the sponsor’s analysis suggest that for the treatment of adult patients la/mUC harbouring susceptible FGFR3 genetic alterations, who have disease progression during or following at least 1 line of prior therapy, including within 12 months of neoadjuvant or adjuvant therapy, but not including those who are eligible for and have not received prior PD-1 or PD-L1 inhibitor therapy, the reimbursement of erdafitinib will be associated with an incremental 3-year cost of $2,431,522 (year 1: $623,271, year 2: $798,467, year 3: $1,009,784). Of this 3-year incremental cost, the incremental cost of genetic testing was estimated to be $402,251 (year 1: $0, year 2: $131,459, year 3: $270,792). Of note, the sponsor’s budget impact estimates did not consider subsequent therapies within the analysis.
CDA-AMC Appraisal of the Sponsor’s BIA
CDA-AMC identified several key limitations to the sponsor’s analysis that have notable implications on the results of the BIA:
The exclusion of subsequent therapies was inappropriate and underestimates the budget impact of erdafitinib: The sponsor’s analysis groups all patients who could be eligible for erdafitinib together, regardless of line of therapy or previous treatment history. In doing so, the sponsor does not consider the likelihood that erdafitinib will constitute an additional line of therapy for some patients, rather than a replacement. According to clinical expert input obtained by CDA-AMC, while the optimal sequencing of erdafitinib and enfortumab vedotin is unknown, it is likely 1 will be used and then the other upon disease progression. For example, according to the current provisional funding algorithm for la/mUC,18 a patient could be diagnosed with de novo la/mUC, receive 1L platinum-based chemotherapy with avelumab maintenance (or 2L pembrolizumab), then receive enfortumab vedotin and then a taxane. If erdafitinib is funded, this patient could then access erdafitinib after avelumab or pembrolizumab, followed by enfortumab vedotin (or vice versa), and then a taxane. In cases such as this, erdafitinib would not be replacing enfortumab vedotin but delaying it, increasing total treatment costs.
CDA-AMC was unable to reliably adjust for this limitation in its reanalysis due to the structure of the model. While each line of therapy would have fewer patients accessing it than the previous line, the exclusion of subsequent therapies and the assumption that erdafitinib will replace its comparators rather than being used in sequence likely substantially underestimates its budget impact. A scenario was conducted in which subsequent therapy assumptions from the pharmacoeconomic analysis were applied to patients within the BIA.
The pan-Canadian and NIHB populations were inappropriately calculated: The sponsor estimated the pan-Canadian drug program population of prevalent bladder cancer patients by subtracting the number of patients within Quebec from the total of all of Canada. However, the pan-Canadian drug program perspective should be derived from summing the individual drug program analyses of the 9 provinces (i.e., all provinces except Quebec) and the NIHB. As such, the populations of the 3 territories (Northwest Territories, Nunavut, and Yukon) should not have been included in the size of the pan-Canadian population. Additionally, the sponsor’s model allows for reporting from the NIHB perspective, where the number of bladder cancer patients who are NIHB clients is derived by assuming the same prevalence as that of Canada as a whole. However, the provinces of Saskatchewan and Alberta fund all oncology products for patients residing within their borders, including those who would otherwise be reimbursed by the NIHB, as does Ontario for patients aged < 25 years or ≥ 65 years. NIHB clients of the appropriate ages who are living within the borders of these 3 jurisdictions should therefore be considered clients of the provincial plan for the purposes of modelling the budget impact of reimbursing erdafitinib.
CDA-AMC did not adjust for this limitation in reanalysis. The impact on pan-Canadian model results is expected to be minimal. The impact on the model results when considering the jurisdictional perspectives of Alberta, Ontario, Saskatchewan, and the NIHB is expected to be more substantial.
The proportion of prevalent patients in each stage is uncertain: The sponsor assumed that 60% of UC patients are diagnosed with NMIBC, 25% with MIBC, and 15% with la/mUC. While 15% for la/mUC is reasonably consistent with the 13% of bladder cancer patients reported by the Canadian Cancer Society to have been diagnosed in stages III or IV,36 the estimate that only 60% of patients have NMIBC is lower than the 78% of patients diagnosed in stages 0 or 1,36 as well as estimates in the literature that approximately 75% of bladder cancer patients are diagnosed with noninvasive disease.37-39 As the sponsor’s analysis considers the 5-year prevalent population rather than the incident population, it is likely that the proportion of patients with NMIBC is even higher than at diagnosis, given the higher mortality rates associated with having MIBC or la/mUC relative to NMIBC.40
CDA-AMC assumed that 75% of prevalent patients have NMIBC, 10% have la/mUC, and the remaining 15% have MIBC.
The number of patients progressing to la/mUC per year is overestimated: The sponsor estimated the proportion of patients who would progress to la/mUC from earlier stages using probabilities from the literature (20% of patients with NMIBC develop MIBC,26 50% of patients with MIBC develop la/mUC27). However, the sponsor’s analysis effectively assumes these are the probabilities of progression each year, which is not consistent with the cited studies. For patients with NMIBC, annual probabilities of progression have been reported as ranging from less than 1% to 17%,26,41 depending on risk level. These figures are consistent with 5-year progression-free survival rates reported for high-risk NMIBC of 58% to 89%, which convert to annual probabilities of progression or death of 2% to 10%.42 For patients with MIBC, the 50% estimate refers to the proportion of patients with MIBC who will develop metastasis in the first 2 to 3 years after diagnosis. As such, the 1-year probability of progression from MIBC would be closer to 20% to 24% (albeit with an assumption that the rate is constant) and would more appropriately be applied to the incident population of patients with MIBC rather than the prevalent population.27 Previous reimbursement reviews for la/mUC treatments in Canada have assumed 2% prevalent patients with NMIBC and 6.7% of prevalent patients with MIBC will progress to la/mUC per year.30,43,44
In reanalysis, CDA-AMC assumed that 6.7% of patients with MIBC and 2% of patients with NMIBC will progress to la/mUC each year.
The proportion of patients receiving additional therapy after a PD-1 or PD-L1 inhibitor may be underestimated: The sponsor estimated that 32.7% of patients who discontinue a PD-1 or PD-L1 inhibitor go on to receive another line of therapy, based on the proportion of patients in a US chart review study who received additional therapy after a first- or second-line PD-1 or PD-L1. As noted within this study, the time period studied (2016 to 2018) predates the use of avelumab as first-line maintenance therapy, and also predates the availability of enfortumab vedotin and erdafitinib as 2L+ therapies. According to clinical expert input obtained by CDA-AMC, these additional treatment options have increased the use of multiple lines of therapy since they became available, with an estimated 50% to 60% of patients now receiving further therapy after a PD-1 or PD-L1.
In reanalysis, CDA-AMC assumed 50% of patients would be eligible for further therapy after discontinuing a PD-1 or PD-L1 inhibitor.
Proportion of eligible population that undergoes FGFR testing is uncertain: The sponsor assumed that only patients whose UC treatment is publicly funded will have their genetic testing publicly funded. However, it is likely that 100% of testing will be publicly funded. Additionally, the sponsor assumed that 50% of patients in Canada are currently tested for FGFR alterations based on a chart review of 17 Canadian oncologists, most of whom practised in Ontario, Quebec, and British Columbia, and that this proportion would remain the same in the first year of erdafitinib funding, rising to 60% and 70% in years 2 and 3. Clinical expert input obtained by CDA-AMC indicated that due to regional differences in funding of genetic testing for FGFR3 alterations, the proportion of patients currently tested in Canada may be closer to 40%.
In reanalysis, CDA-AMC assumed that 100% of FGFR3 testing is publicly funded and that 40% of patients in the reference scenario are tested.
CDA-AMC Reanalyses of the BIA
CDA-AMC revised the sponsor’s base case by adjusting the proportion of patients diagnosed with each stage of UC, adjusting the proportion of patients progressing to la/mUC annually, assuming 100% of genetic testing is publicly funded, adjusting the proportion of patients who will receive additional therapy after a PD-1 or PD-L1 inhibitor, and adjusting the proportion of potentially eligible patients undergoing testing in the reference case. The changes are described in Table 16.
Table 16: CDA-AMC Revisions to the Submitted Budget Impact Analysis
Stepped analysis | Sponsor’s value or assumption | CDA-AMC value or assumption |
|---|---|---|
Changes to derive the CDA-AMC combined reanalysis | ||
1. Proportion of patients in UC stages | NMIBC: 60% MIBC: 25% la/mUC: 15% | NMIBC: 75% MIBC: 15% la/mUC: 10% |
2. Annual probability of progression to la/mUC | NMIBC to MIBC: 20% MIBC to la/mUC: 50% | NMIBC to la/mUC: 2% MIBC to la/mUC: 6.7% |
3. Proportion of genetic testing that is publicly funded | 91.2% | 100% |
4. Proportion of patients eligible for further therapy after PD-(L)1 inhibitor | 32.7% | 50% |
5. Proportion of patients currently tested for FGFR3 alterations | 50% | 40% |
CDA-AMC combined reanalysis | Reanalyses 1 through 5 | |
CDA-AMC = Canada’s Drug Agency; FGFR = fibroblast growth factor receptor; la/mUC = locally advanced untestable or metastatic urothelial carcinoma; MIBC = muscle invasive bladder cancer; NMIBC = non–muscle invasive bladder cancer; UC = urothelial carcinoma.
The results of the CDA-AMC step-wise reanalysis are presented in summary format in Table 17 and a more detailed breakdown is presented in Table 18.
Based on the CDA-AMC combined reanalysis, the size of the population eligible for erdafitinib is estimated to be 64 patients in year 1, 80 in year 2, and 96 in year 3, and the budget impact associated with the reimbursement of erdafitinib is expected to be $1,657,002 (year 1: $435,584, year 2: $545,317, year 3: $676,101). Of this 3-year incremental cost, the incremental cost of genetic testing was estimated to be $498,755 (year 1: $79,840, year 2: $164,609, year 3: $254,306).
As the structure of the sponsor’s model pools together all lines of therapy in which a patient would be eligible for erdafitinib, CDA-AMC was unable to reliably adjust for the likelihood that, for some patients, erdafitinib will become an additional line of therapy used in sequence with enfortumab vedotin and/or taxanes rather than displacing them. As such, it is likely that both the sponsor’s and CDA-AMC’s main analyses substantially underestimate the budgetary impact of funding erdafitinib. Additionally, all analyses are based on wholesale prices for comparators and do not reflect confidential, negotiated pricing. Of note, a confidential price exists for enfortumab vedotin (refer to Patient, Clinician, and Drug Plan Input section).20
Table 17: Summary of the CDA-AMC Reanalyses of the Budget Impact Analysis
Stepped analysis | Three-year total ($) |
|---|---|
Submitted base case | $2,431,522 |
CDA-AMC reanalysis 1: Proportions of patients in UC stages | $1,814,569 |
CDA-AMC reanalysis 2: Lower probability of progression to la/mUC | $1,297,417 |
CDA-AMC reanalysis 3: All genetic testing is publicly funded | $2,470,503 |
CDA-AMC reanalysis 4: 50% receive therapy after PD-(L)1 | $3,717,924 |
CDA-AMC reanalysis 5: 40% of reference case patients FGFR3 tested | $2,825,900 |
CDA-AMC combined reanalysis (1 through 5) | $1,657,002 |
CDA-AMC = Canada’s Drug Agency; FGFR = fibroblast growth factor receptor; la/mUC = locally advanced unresectable or metastatic urothelial carcinoma; UC = urothelial carcinoma.
CDA-AMC conducted the following scenario analyses to address remaining uncertainty, using the CDA-AMC combined reanalysis (results are provided in Table 18):
Assuming that in the reference case, 34.7% of patients initially receiving enfortumab vedotin would subsequently receive a taxane (50% docetaxel, 50% paclitaxel), the cost of which was added to the cost of enfortumab vedotin. In the new drug scenario, 34.7% of patients receiving either enfortumab vedotin or erdafitinib would receive a subsequent therapy (95% would receive the opposite novel therapy, 2.5% would receive each of docetaxel and paclitaxel). After the initial subsequent therapy, 16.7% would receive a further line of taxane therapy (50% docetaxel, 50% paclitaxel).
Table 18: Detailed Breakdown of the CDA-AMC Reanalyses of the Budget Impact Analysis
Stepped analysis | Scenario | Year 0 (current situation) ($) | Year 1 ($) | Year 2 ($) | Year 3 ($) | Three-year total ($) |
|---|---|---|---|---|---|---|
Submitted base case | Reference | $9,729,882 | $10,114,721 | $12,380,879 | $14,764,055 | $37,259,654 |
New drug | $9,729,882 | $10,737,992 | $13,179,346 | $15,773,838 | $39,691,176 | |
Budget impact | $0 | $623,271 | $798,467 | $1,009,784 | $2,431,522 | |
CDA-AMC combined reanalysis | Reference | $4,469,960 | $5,728,607 | $7,020,686 | $8,379,556 | $21,128,849 |
New drug | $4,469,960 | $6,164,191 | $7,566,003 | $9,055,657 | $22,785,851 | |
Budget impact | $0 | $435,584 | $545,317 | $676,101 | $1,657,002 | |
CDA-AMC scenario 1: subsequent therapies considered | Reference | $4,531,493 | $5,808,564 | $7,119,597 | $8,498,407 | $21,426,568 |
New drug | $4,531,493 | $7,502,569 | $9,329,354 | $11,239,220 | $28,071,143 | |
Budget impact | $0 | $1,694,005 | $2,209,757 | $2,740,813 | $6,644,575 |
CDA-AMC = Canada’s Drug Agency.
ISSN: 2563-6596
Canada’s Drug Agency (CDA-AMC) is a pan-Canadian health organization. Created and funded by Canada’s federal, provincial, and territorial governments, we’re responsible for driving better coordination, alignment, and public value within Canada’s drug and health technology landscape. We provide Canada’s health system leaders with independent evidence and advice so they can make informed drug, health technology, and health system decisions, and we collaborate with national and international partners to enhance our collective impact.
Disclaimer: CDA-AMC has taken care to ensure that the information in this document was accurate, complete, and up to date when it was published, but does not make any guarantee to that effect. Your use of this information is subject to this disclaimer and the Terms of Use at cda-amc.ca.
The information in this document is made available for informational and educational purposes only and should not be used as a substitute for professional medical advice, the application of clinical judgment in respect of the care of a particular patient, or other professional judgments in any decision-making process. You assume full responsibility for the use of the information and rely on it at your own risk.
CDA-AMC does not endorse any information, drugs, therapies, treatments, products, processes, or services. The views and opinions of third parties published in this document do not necessarily reflect those of CDA-AMC. The copyright and other intellectual property rights in this document are owned by the Canadian Agency for Drugs and Technologies in Health (operating as CDA-AMC) and its licensors.
Questions or requests for information about this report can be directed to Requests@CDA-AMC.ca.