Drugs, Health Technologies, Health Systems
Reimbursement Review
Pembrolizumab (Keytruda)
Sponsor: Merck Canada Inc.
Therapeutic area: Gastric or gastroesophageal junction adenocarcinoma
This multi-part report includes:
Clinical Review
Pharmacoeconomic Review
Clinical Review
Abbreviations
5-FU
5-fluorouracil
AE
adverse event
BICR
blinded independent central review
CAPOX
capecitabine plus oxaliplatin
CDA-AMC
Canada's Drug Agency
CI
confidence interval
CPS
combined positive score
CR
complete response
CrI
credible interval
DIC
deviance information criterion
EORTC QLQ-C30
European Organisation for Research and Treatment of Cancer Quality of Life Questionnaire Core 30
EORTC QLQ-STO22
European Organization for Research and Treatment of Cancer Quality of Life Questionnaire Stomach Cancer Module
FISH
fluorescence in situ hybridization
FOLFIRI
5-fluorouracil plus leucovorin plus irinotecan
FOLFOX
5-fluorouracil plus leucovorin plus oxaliplatin
FP
5-fluorouracil plus cisplatin
GEJ
gastroesophageal junction
GI
gastrointestinal
GRADE
Grading of Recommendations Assessment, Development, and Evaluation
HR
hazard ratio
HRQoL
health-related quality of life
IA1
first interim analysis
IHC
immunohistochemistry
ITC
indirect treatment comparison
MID
minimally important difference
MMR
mismatch repair
MSI
microsatellite instability
MSI-H
microsatellite instability-high
NMA
network meta-analysis
NOC
Notice of Compliance
OH-CCO
Ontario Health – Cancer Care Ontario
ORR
overall response rate
OS
overall survival
PD-1
programmed cell death 1 protein 1
PD-L1
programmed cell death 1 ligand 1
PD-L2
programmed cell death 1 ligand 2
PFS
progression-free survival
PICOS
population, intervention, comparators, outcomes, and study design
QoL
quality of life
RCT
randomized controlled trial
RECIST 1.1
Response Evaluation Criteria in Solid Tumours Version 1.1
SAE
serious adverse event
SD
standard deviation
SOC
standard of care
Executive Summary
An overview of the submission details for the drug under review is provided in Table 1.
Table 1: Background Information of Application Submitted for Review
Item | Description |
|---|---|
Drug product | Pembrolizumab (Keytruda), 100 mg/4 mL, vial solution for infusion |
Sponsor | Merck Canada Inc. |
Indication | In combination with fluoropyrimidine and platinum–containing chemotherapy, is indicated for the first-line treatment of adult patients with locally advanced, unresectable, or metastatic HER2-negative gastric or gastroesophageal junction adenocarcinoma |
Reimbursement request | Per indication |
Health Canada approval status | NOC |
Health Canada review pathway | Standard review |
NOC date | March 21, 2024 |
Recommended dose | Recommended dose and dosage adjustments for notable subpopulations per the product monograph |
NOC = Notice of Compliance.
Introduction
Gastric cancer is a growth of abnormal cells that starts in the stomach. In 2023, an estimated 4,100 Canadians were projected to be diagnosed with gastric cancer.1,2 Gastric cancers are generally classified into 2 topographical subsites. Cardia gastric cancers affect the upper part of the stomach adjoining the esophagus. Noncardia gastric cancers occur in the more distal regions of the stomach.3 Gastroesophageal junction (GEJ) cancer develops in the area where the esophagus meets the gastric cardia.4 The risk of developing gastric and GEJ cancer increases with age, is greatest after 50 years of age,5 and occurs more frequently among men than women.1,2,5 Approximately 90% of noncardia cancers are attributable to Helicobacter pylori infection.6 Early-stage gastric and GEJ cancers are potentially curable. However, most patients present with symptoms that are usually nonspecific,7 and the early diagnosis of gastric and GEJ cancers is challenging.7 As a result, most patients present with advanced stage III or stage IV disease at the time of diagnosis, when curative treatments may not possible.7,8 Patients with unresectable advanced or metastatic disease typically experience a high symptom burden, impaired quality of life (QoL), and frequent bouts of anxiety and depression.9 The 5-year survival rate for patients diagnosed with gastric and GEJ cancer living in Canada is 29%, reflecting the fact that the majority of patients are diagnosed with advanced-stage disease that is associated with a poor prognosis.1,2,10 Among those with metastatic gastric or GEJ cancer, the 5-year survival rate is 6.6%.11
Approximately 90% to 95% of gastric and GEJ cancers are histologically classified as adenocarcinoma.12 Gastric cancers may contain oncogenic driver mutations that lead to uncontrolled cell growth and proliferation. The most common driver mutation is human epidermal growth factor receptor 2 (HER2), a transmembrane tyrosine kinase receptor. HER2 has been found to be overexpressed or amplified in approximately 20% of patients with gastric or GEJ cancers,13-15 so most patients living in Canada have HER2-negative disease.16 Based on projections from the Canadian Cancer Statistics Advisory Committee, an estimated 3,060 new cases of gastric or GEJ cancers are expected in 2025, of which 81% will be classified as HER2-negative.2,13 Despite currently available treatments, the prognosis for patients with advanced unresectable or metastatic gastric or GEJ adenocarcinoma remains poor, with a 5-year survival rate of 10% or less.11,17 Although the prognostic significance of HER2 status is not as well established in gastric cancer as in other cancers (i.e., breast cancer),18 its presence or absence is a predictive biomarker for the choice of first-line systemic therapy in the advanced and metastatic setting.
In patients with HER2-negative disease, the standard first-line treatment is nivolumab in combination with a platinum-fluoropyrimidine doublet, based on the results of the CheckMate 649 study, which demonstrated that the addition of nivolumab to chemotherapy improved overall survival (OS) and progression-free survival (PFS).19-21 In addition, the combination of pembrolizumab and platinum-fluoropyrimidine doublet therapy is recommended as a standard first-line treatment for patients with advanced or metastatic HER2-negative Siewert 1 GEJ adenocarcinoma and esophageal adenocarcinoma based on the double-blind, phase III KEYNOTE-590 study.20,22 The standard first-line platinum-fluoropyrimidine doublet chemotherapy options in Canada include FOLFOX (5-fluorouracil [5-FU] plus leucovorin plus oxaliplatin), CAPOX (capecitabine plus oxaliplatin; also known as XELOX), FP (5-FU plus cisplatin), and capecitabine plus cisplatin.
Pembrolizumab is a high-affinity antibody against programmed cell death 1 protein (PD-1), which exerts dual ligand blockade of the PD-1 pathway, including programmed cell death 1 ligand 1 (PD-L1) and programmed cell death 1 ligand 2 (PD-L2), on antigen-presenting or tumour cells. Pembrolizumab reactivates tumour-specific cytotoxic T lymphocytes in the tumour microenvironment by inhibiting the PD-1 receptors from blinding to their ligands.23 Pembrolizumab received a Notice of Compliance (NOC) on March 21, 2024, through the standard review pathway. The Health Canada indication for pembrolizumab, in combination with fluoropyrimidine and platinum–containing chemotherapy, is for the first-line treatment of adult patients with locally advanced, unresectable, or metastatic HER2-negative gastric or GEJ adenocarcinoma.
The product-monograph recommended dosage of pembrolizumab for adults with locally advanced, unresectable, or metastatic HER2-negative gastric or GEJ adenocarcinoma, in combination with fluoropyrimidine and platinum–containing chemotherapy, is 200 mg every 3 weeks or 400 mg every 6 weeks by IV infusion until disease progression, unacceptable toxicity, or up to 24 months or 18 doses of 400 mg, whichever is longer.24 The product monograph specifies that pembrolizumab should be administered before chemotherapy when both are given on the same day.24
The objective of this Clinical Review Report is to review and critically appraise the clinical evidence submitted by the sponsor on the beneficial and harmful effects of pembrolizumab 100 mg/4 mL solution for infusion in combination with fluoropyrimidine and platinum–containing chemotherapy in the first-line treatment of locally advanced, unresectable, or metastatic HER2-negative gastric or GEJ adenocarcinoma in adult patients.
Perspectives of Patients, Clinicians, and Drug Programs
The information in this section is a summary of input provided by the patient and clinician groups that responded to our call for input and from clinical experts consulted for the purpose of this review.
Patient Input
Patient group input was submitted by 1 patient advocacy group: My Gut Feeling – Stomach Cancer Foundation of Canada. Patient input was collected with an international online survey (conducted from March 12 to March 25, 2024) and included responses from 49 patients (79.6%) and caregivers (20.4%). Overall, 69.4% of responders were residing in Canada, 29.6% were residing in the US, and 1.0% were residing outside of North America. However, the patient group submission did not include a distinct breakdown of data from participants living in Canada. All patients who responded to the survey experienced at least 1 symptom before diagnosis, with the most common being changes in weight loss (61.2%), changes in appetite (59.2%), pain (46.9%), reflux (42.9%), nausea or vomiting (36.7%), and difficulty swallowing (34.7%). Most patients (95%) reported that their cancer diagnosis had a significant impact on their QoL, including physical and mental health, ability to eat and work, finances, social life, identity, and personal image. Both patient and caregiver respondents, specifically those with metastatic disease, reported a significant decline in their mental health related to the cancer diagnosis and its treatment. In addition, changes in identity and family dynamics due to the cancer diagnosis were reported to have a further impact on psychosocial well-being, and exacerbated any preexisting mental health conditions, such as depression and anxiety, in both patients and caregivers. Respondents also indicated that the cancer and its treatments had financial implications on the patient and caregiver. All patients who completed the survey experienced at least 1 treatment-related side effect. The most commonly reported treatment-related side effects included fatigue (89.8%), weight loss (83.7%), appetite changes (79.6%), nausea or vomiting (75.5%), chemo brain (73.5%), taste changes (69.4%), neuropathy (67.3%), hair loss (65.3%), diarrhea (61.2%), abdominal pain (51%), and insomnia (46.9%). Overall, 8.2% of respondents reported discontinuing treatment due to an adverse event (AE) that resulted in hospitalization, 16.4% reported receiving a dose reduction in treatment, and 16.4% reported delaying or skipping a treatment cycle. Patients and caregivers who completed the survey indicated that the following outcomes were important when considering treatment options: QoL, treatment-related side effects, cost of treatment, convenience of treatment, duration of treatment, and survival benefit. Patients and caregivers added that equitable access, convenience of administration (e.g., oral versus IV, less frequent travel to hospital, shorter chair time to receive treatment), and more options from which to choose, based on their values and preferences, were important. Input from the patient group emphasized the need for biomarker testing to be accessible to patients in Canada at the onset of their disease across all centres and provinces.
Clinician Input
Input From Clinical Experts Consulted on This Review
The clinical experts consulted for the purpose of this review emphasized that locally advanced and metastatic HER2-negative gastric or GEJ cancer is associated with considerable unmet needs. Treatment with nivolumab in combination with chemotherapy is the only available first-line option for locally advanced, metastatic HER2-negative gastric or GEJ cancer; however, OS outcome remains poor (median OS is 13 to 15 months). The clinical experts suggested that the addition of pembrolizumab to chemotherapy would represent an alternative to combination therapy with nivolumab plus chemotherapy in the first-line setting for patients with locally advanced and metastatic HER2-negative gastric or GEJ cancer. The clinical experts noted that, if approved for funding, the addition of pembrolizumab to chemotherapy offers patients an alternative treatment schedule of every 6 weeks, compared with every 2 to 4 weeks with nivolumab. Per the Health Canada indication, the clinical experts agreed that patients who have HER2-negative gastric or GEJ adenocarcinoma that is metastatic or not amenable to curable resection should be considered for first-line treatment with pembrolizumab in combination with fluoropyrimidine and platinum–containing chemotherapy. Currently, combined positive score (CPS) testing for PD-L1 expression is not required for patients with HER2-negative disease. The clinical experts noted that the following factors should be used to determine response to treatment: patient-reported symptoms and side effects; and response on cross-sectional imaging detected with CT scans or MRI. The clinical experts suggested that patients should be assessed by a clinician after every 2 to 3 cycles of treatment. Clinician assessment may occur more frequently if the patients report the occurrence of bothersome symptoms or side effects. The clinical experts suggested that patients should undergo CT scans every 2 to 3 months. Tumour markers can be used, per clinical judgment, to supplement a fulsome patient assessment. The clinical expert stressed, however, that the only truly clinically meaningful end points across all oncology types are OS and QoL. The clinical experts suggested that the decision to discontinue treatment with pembrolizumab should be based on patient-reported symptoms, patient preference, side effects, and well-being, in combination with assessment of treatment response and disease progression, either radiologic or clinical. The clinical experts suggested that pembrolizumab should only be prescribed by or under the supervision of a practitioner in medical oncology with expertise in the management of immunotherapy side effects.
Clinician Group Input
One clinician group input was submitted by the Ontario Health – Cancer Care Ontario (OH-CCO) Gastrointestinal Drug Advisory Committee. A total of 4 clinicians provided input for this review on behalf of the OH-CCO Gastrointestinal Drug Advisory Committee.
The clinician group pointed out that patients with advanced HER2-negative gastric cancer are offered chemotherapy (e.g., FOLFOX or CAPOX]) plus nivolumab as the currently available standard-of-care combination therapy in Canada. The clinician group mentioned that the goals of treatment in the palliative setting include improvements of QoL and OS. The clinician group indicated that the addition of pembrolizumab would give clinicians an alternative option to nivolumab, which is currently approved. The clinician group providing input added that patients with HER2-negative advanced gastric cancer would be best suited for treatment with pembrolizumab. Referring to the CheckMate 649 and KEYNOTE-859 studies, the clinician group suggested that patients with a PD-L1 CPS of greater than 5% or 10% may derive most benefit from pembrolizumab, whereas patients with a PD-L1 CPS of less than 1% may derive little benefit. The clinician group indicated that clinical response and symptoms are used to determine whether a patient is responding to treatment in clinical practice. The input further suggested that CT scans should be done regularly, per clinician discretion. The clinician group indicated that the decision to continue or discontinue treatment with pembrolizumab should be based on disease response, immune-related toxicities, and functional status.
Drug Program Input
Input was obtained from the drug programs that participate in the reimbursement review process. The following were identified as key factors that could potentially impact the implementation of a reimbursement recommendation for pembrolizumab:
relevant comparators
considerations for initiation of therapy
considerations for discontinuation of therapy
considerations for prescribing therapy
generalizability
funding algorithm
care provision issues
system and economic issues.
Clinical Evidence
Systematic Review
Description of Studies
One study was included in the sponsor-conducted systematic review: the KEYNOTE-859 trial.
The KEYNOTE-859 trial (NCT03675737) is an ongoing, multicentre (207 sites in 22 countries), placebo-controlled, randomized (1:1) double-blind, phase III trial evaluating the efficacy and safety of adding pembrolizumab to fluoropyrimidine and platinum–containing chemotherapy as first-line therapy in adult patients with HER2-negative advanced gastric or GEJ adenocarcinoma. Patients were randomly allocated to receive either pembrolizumab 200 mg every 3 weeks (N = 790) or saline placebo (N = 789), each in combination with chemotherapy (FP or CAPOX). Randomization was stratified by geographic region (Australia, Israel, North America, and Western Europe versus Asia versus the rest of the world), investigator’s choice of chemotherapy regimen (FP versus CAPOX), and PD-L1 expression at baseline (CPS ≥ 1 versus CPS < 1). PD-L1 expression was determined at a central laboratory using the Agilent PD-L1 IHC 22C3 pharmDx kit.25 The primary efficacy end point in the KEYNOTE-859 trial was OS. Secondary end points were PFS, overall response rate (ORR), and duration of response, per Response Evaluation Criteria in Solid Tumours Version 1.1 (RECIST 1.1) assessed by blinded independent central review (BICR), and harms outcomes. Exploratory end points included in the following health-related quality of life (HRQoL) measures: the European Organisation for Research and Treatment of Cancer Quality of Life Questionnaire Core 30 (EORTC QLQ-C30), European Organisation for Research and Treatment of Cancer Quality of Life Questionnaire Stomach Cancer Module(EORTC QLQ-STO22), and the 5 Level EQ-5D (EQ-5D-5L).
The mean age of patients randomized to the pembrolizumab plus chemotherapy group and to the placebo plus chemotherapy group was 59.5 years (standard deviation [SD] = 11.9 years) and 60.0 (SD = 11.8 years), respectively. In terms of disease characteristics, 18.9% of patients in the pembrolizumab plus chemotherapy group presented with adenocarcinoma of the GEJ and 81.0% presented with adenocarcinoma of the stomach. In the placebo plus chemotherapy group, 23.4% and 76.4% of patients presented with adenocarcinomas of the GEJ and stomach, respectively. Approximately 78% of patients in both treatment groups had a documented PD-L1 CPS of 1 or more.
Efficacy Results
Results presented are based on the planned interim analysis 1 (IA1), which had a data cut-off date of October 3, 2022. At the time of IA1, the primary and secondary end points met the prespecified criteria for the superiority of pembrolizumab plus chemotherapy relative to placebo plus chemotherapy, and the null hypotheses were rejected. No further hypothesis testing will be performed at the final analysis.
Overall Survival
At the time of the data cut-off, patients were followed for a median of 12.0 months (range, 0.1 to 24.9 months). The median follow-up duration was 12.9 months (range, 0.2 to 45.9 months) in the pembrolizumab plus chemotherapy group, and 11.6 months (range, 0.1 to 45.5 months) in the placebo plus chemotherapy group.
The proportion of observed deaths at the time of IA1 was 76.5% in the pembrolizumab plus chemotherapy group and 84.4% in the placebo plus chemotherapy group. The median OS was 12.9 months (95% confidence interval [CI], 11.9 to 14.0 months) in the pembrolizumab plus chemotherapy group and 11.5 months (95% CI, 10.6 to 12.1 months) in the placebo plus chemotherapy group. The stratified hazard ratio (HR) for OS was 0.78 (95% CI, 0.70 to 0.87; P < 0.0001) in favour of pembrolizumab plus chemotherapy compared with placebo plus chemotherapy. Risk differences in OS between the pembrolizumab plus chemotherapy and placebo plus chemotherapy groups were ████ ████ ███ ███ ██ ██████ at 12 months ████ ████ ███ ███ ██ ██████ at 24 months, and ████ ████ ███ ███ ██ ██████ at 30 months.
The subgroup analyses of OS were indicative of a differential treatment effect among subgroups of patients based on PD-L1 status. Specifically, no difference in OS was observed among patients with a PD-L1 CPS of less than 1 (HR, 0.92; 95% CI, 0.73 to 1.17), indicating that the difference in OS observed in the overall study was driven primarily by patients with a PD-L1 CPS of 1 or greater (HR, 0.73; 95% CI, 0.65 to 0.83). The treatment effect on OS was more pronounced among patients with a PD-L1 CPS of 10 or greater (HR, 0.64; 95% CI, 0.52 to 0.79) than among patients with a PD-L1 CPS of less than 10 (HR, 0.86; 95% CI, 0.75 to 0.98). The subgroup analyses also showed that the treatment effect on OS was likely more pronounced among patients who had microsatellite stable-high (MSI-H) tumours (HR, 0.35; 95% CI, 0.18 to 0.66) than among patients whose tumours were non-MSI-H (HR, 0.79; 95% CI, 0.7 to 0.89).
Progression-Free Survival
Disease progression or death on or before the IA1 data cut-off date was observed in 72.4% of patients in the pembrolizumab plus chemotherapy group and 77.1% of patients in the placebo plus chemotherapy group. The median PFS was 6.9 months (95% CI, 6.3 to 7.2 months) in the pembrolizumab plus chemotherapy group and 5.6 months (95% CI, 5.6 to 5.7 months) in the placebo plus chemotherapy group. The HR for PFS was 0.76 (95% CI, 0.67 to 0.85; P < 0.0001) in favour of pembrolizumab plus chemotherapy compared with placebo plus chemotherapy. Risk differences in PFS between the pembrolizumab plus chemotherapy and placebo plus chemotherapy groups were █████ ████ ███ ███ ██ ██████ at 6 months, ████ ████ ███ ███ ██ ██████ at 12 months, ████ ████ ███ ███ ██ ██████ at 24 months, and ████ ████ ███ ███ ██ ██████ at 30 months.
Health-Related Quality of Life
European Organisation for Research and Treatment of Cancer Quality of Life Questionnaire Core 30
The EORTC QLQ-C30 is a cancer-specific HRQoL tool that consists of 30 items to assess 5 functional dimensions (physical function, role function, emotional function, cognitive function, and social function), 3 symptom items (fatigue, nausea or vomiting, and pain), 5 single-item measures to assess additional symptoms commonly experienced by patients with cancer (dyspnea, loss of appetite, insomnia, constipation, and diarrhea), and 1 scale to assess global health status/QoL.26,27 Based on input from the clinical experts consulted on this review, the global health status/QoL and the nausea/ vomiting scales assessed in the KEYNOTE-859 trial were most relevant to patients with GEJ cancers. Scores for each scale and item ranged from 0 to 100, with higher scores indicating a better QoL or a greater degree of symptoms. Improvement and deterioration were defined as a change of 10 or more points in the relevant direction.
The EORTC QLQ-C30 was completed at baseline by 743 patients (96.2%) in the in the pembrolizumab plus chemotherapy group and 749 patients (97.1%) in the placebo plus chemotherapy group. By week 18, 608 patients (78.8% of randomized patients) were available in the pembrolizumab plus chemotherapy group; of whom, 504 patients (65.3% of randomized patients) completed the questionnaire for a compliance rate of 82.9%. In the placebo plus chemotherapy group, 592 patients (76.8% of the randomized patients) were available; of whom, 506 patients (65.6% of the randomized patients) completed the questionnaire for a compliance rate of 85.5%.
For global health status/QoL, the between-group difference in least squares change from baseline to week 18 was 1 ███ ████ ███ █████ ██ █████ after treatment with pembrolizumab plus chemotherapy versus placebo plus chemotherapy. Improvement in global health status/QoL was reported in 35.4% of patients in the pembrolizumab plus chemotherapy group and 30.9% of patients in the placebo plus chemotherapy group. The between-group difference in global health improvement was ████ █████ ██ █████ after treatment with pembrolizumab plus chemotherapy versus placebo plus chemotherapy. Improvement or stability in global health status/QoL was reported in 73.4% of patients in the pembrolizumab plus chemotherapy group and 72.9% of patients in the placebo plus chemotherapy group. The between-group difference in improvement or stability was ████ ████ ███ ████ ██ █████ after treatment with pembrolizumab plus chemotherapy versus placebo plus chemotherapy. The stratified HR for time to deterioration on the global health status/QoL scale at 12 months was 0.87 (95% CI, 0.72 to 1.04; P = 0.1337) for pembrolizumab plus chemotherapy relative to placebo plus chemotherapy.
For nausea and vomiting symptoms, the between-group difference in least squares change from baseline to week 18 was –████ ████ ███ █████ ██ █████ after treatment with pembrolizumab plus chemotherapy versus placebo plus chemotherapy. Improvement in nausea and vomiting symptoms was reported in 24.5% of patients in the pembrolizumab plus chemotherapy group and 24.4% of patients in the placebo plus chemotherapy group. The between-group difference in improvement of nausea and vomiting symptoms was ████ ████ ███ ████ ██ █████ after treatment with pembrolizumab plus chemotherapy versus placebo plus chemotherapy. Improvement or stability in nausea and vomiting symptoms was reported in 71.4% of patients in the pembrolizumab plus chemotherapy group and 74.2% of patients in the placebo plus chemotherapy group. The between-group difference in improvement or stability was ████ ████ ███ ████ ██ ████ after treatment with pembrolizumab plus chemotherapy versus placebo plus chemotherapy. The stratified HR for time to deterioration on the nausea and vomiting symptom scale at 12 months was 0.95 (95% CI, 0.9 to 1.14; P = 0.5698) for pembrolizumab plus chemotherapy relative to placebo plus chemotherapy.
European Organisation for Research and Treatment of Cancer Quality of Life Questionnaire Stomach Cancer Module
The EORTC QLQ-STO22 is an HRQoL measure specific to gastric cancer that consists of 22 items to assess symptoms of dysphagia (4 items), pain or discomfort (3 items), upper gastrointestinal (GI) symptoms (3 items), eating restrictions (5 items), emotional function (3 items), and dry mouth, hair loss, body image, and problems with taste (1 item each).28 Scores for each symptom scale range from 0 to 100, with higher scores indicating worsening symptoms. Improvement and deterioration were defined as a decrease or increase of 10 or more points, respectively. Results from the EORTC QLQ-STO22 pain scale were assessed in the KEYNOTE-859 trial. Scores for each scale and item ranged from 0 to 100, with higher scores indicating a more severe symptoms. Improvement and deterioration were defined as a change of 10 or more points in the relevant direction.
The EORTC QLQ-STO22 was completed at baseline by 701 (91.4%) patients in the pembrolizumab plus chemotherapy group and 696 (91.5%) in the placebo plus chemotherapy group. By week 18, 595 patients (77.6% of the randomized patients) were available in the pembrolizumab plus chemotherapy group; of whom, 488 patients (63.6% of the randomized patients) completed the questionnaire, for a compliance rate of 82.0%. In the placebo plus chemotherapy group, 577 patients (75.8% of the randomized patients) were available, 489 of whom (64.3% of the randomized patients) completed the questionnaire, for a compliance rate of 84.7%.
For pain symptoms, the between-group difference in least squares change from baseline to week 18 was █████ ████ ███ █████ ██ ██████ | | ███████ favouring treatment with pembrolizumab plus chemotherapy over placebo plus chemotherapy. Improvement in pain symptoms was reported in 36.5% of patients in the pembrolizumab plus chemotherapy group and 31.1% of patients in the placebo plus chemotherapy group. The between-group difference in improvement in pain symptoms was ████ ████ ███ ███ ██ █████ | | ███████ favouring treatment with pembrolizumab plus chemotherapy over placebo plus chemotherapy. Improvement or stability in pain symptoms was reported in 77.8% of patients in the pembrolizumab plus chemotherapy group and 76.1% of patients in the placebo plus chemotherapy group. The between-group difference in improvement or stability was ███ ████ ███ ████ ██ █████ after treatment with pembrolizumab plus chemotherapy versus placebo plus chemotherapy. The stratified HR for time to deterioration on the pain symptom scale at 12 months was 0.76 (95% CI, 0.58 to 0.98; P = 0.0378) favouring pembrolizumab plus chemotherapy over placebo plus chemotherapy.
Harms Results
Adverse Events
The proportion of patients with at least 1 AE was reported to be 98.9% in the pembrolizumab plus chemotherapy group and 98.0% in the placebo plus chemotherapy group. The 5 most frequently reported AEs in the pembrolizumab plus chemotherapy group were nausea (46.4%), anemia (41.9%), diarrhea (35.7%), vomiting (33.6%), and decreased appetite (29.4%). In the placebo plus chemotherapy group, the 5 most reported AEs were nausea (46.3%), anemia (36.3%), diarrhea (32.3%), decreased appetite (28.6%), and vomiting (26.7%).
Grade 3 or worse AEs were reported in 75.3% of patients in the pembrolizumab plus chemotherapy group and 69.6% of patients in the placebo plus chemotherapy group. The most common grade 3 or worse AEs reported in the pembrolizumab plus chemotherapy group were anemia (12.1%), decreased neutrophil count (9.8%), neutropenia (7.4%), decreased platelet count (7.1%), diarrhea (6.4%), hypokalemia (6.4%), vomiting (5.2%), and fatigue (5.0%). The most common grade 3 or worse AEs reported in the placebo plus chemotherapy group were anemia (9.1%), decreased neutrophil count (8.1%), neutropenia (8.6%), decreased platelet count (5.0%), diarrhea (5.1%), vomiting (5.3%), and fatigue (5.1%).
Serious Adverse Events
Serious adverse events (SAEs) were AEs that resulted in death or were life-threatening, those that required inpatient hospitalization or prolonged existing hospitalization, and those that resulted in persistent or significant disability and/or incapacity, congenital anomaly and/or birth defect, or other important medical events.
The proportion of patients with at least 1 SAE was reported to be 45.2% in the pembrolizumab plus chemotherapy group and 40.2% in the placebo plus chemotherapy group. SAEs reported by 2% or more of patients in the pembrolizumab plus chemotherapy group were diarrhea (3.9%), pneumonia (3.8%), vomiting (2.4), and colitis (2.0%). SAEs reported by 2% or more of patients in the placebo plus chemotherapy group were diarrhea (3.2%) and vomiting (2.9%).
Withdrawal of Treatment Due to Adverse Events
Discontinuation of treatment due to AEs occurred in 32.7% of patients in the pembrolizumab plus chemotherapy group and 25.9% of patients in the placebo plus chemotherapy group.
In the pembrolizumab plus chemotherapy group, 14.8% of patients discontinued treatment with pembrolizumab, 30.2% discontinued treatment with any backbone chemotherapy, and 8.5% discontinued treatment with all therapy in the regimen. AEs leading to treatment discontinuation in 1% or more of patients in the pembrolizumab plus chemotherapy group included peripheral sensory neuropathy (3.6%), peripheral neuropathy (3.3%), diarrhea (1.9%), palmar-plantar erythrodysesthesia syndrome (1.7%), decreased neutrophil count (1.5%), decreased platelet count (1.5%), neutropenia (1.4%), vomiting (1.1%), and fatigue (1.0%).
In the placebo plus chemotherapy group, 10.9% of patients discontinued treatment with placebo, 25.0% discontinued treatment with any backbone chemotherapy, and 7.5% discontinued all therapies in their treatment regimen. AEs leading to treatment discontinuation in 1% or more of patients in the placebo plus chemotherapy group were neuropathy peripheral (4.1%), peripheral sensory neuropathy (2.7%), decreased platelet count (1.8%), palmar-plantar erythrodysesthesia syndrome (1.1%), and neutropenia (1.0%).
Mortality
Death due to AEs was documented in 8.2% of patients in the pembrolizumab plus chemotherapy group and 7.4% of patients in the placebo plus chemotherapy group.
Notable Harms
Immune-mediated AEs were of interest to the clinical review team. At least 1 immune-mediated AE was documented in █████ of patients in the pembrolizumab plus chemotherapy group and ████ of patients in the placebo group plus chemotherapy group. Grade 3 or worse immune-mediated AEs were reported in ████ of patients in the pembrolizumab plus chemotherapy group and ████ of patients in the placebo plus chemotherapy group.
Critical Appraisal
The KEYNOTE-859 trial is a randomized, placebo-controlled, parallel-group, multicentre, double-blinded, phase III study. The stratification factors for randomization appeared to be appropriate, as they addressed important prognostic factors identified by the clinical experts consulted on this review; and the baseline characteristics between the treatment groups were generally well balanced. The use of concomitant and subsequent therapies was comparable between the treatment groups. A greater proportion of patients in the placebo plus chemotherapy group than in the pembrolizumab plus chemotherapy group discontinued the study (85.8% versus 77.1%) or discontinued the study medication during the treatment period (94.3% versus 87.3%). The duration of exposure to chemotherapy was consistently longer in the pembrolizumab plus chemotherapy group than in the placebo plus chemotherapy group (3,666.2 person-months versus 2,093.2 person-months). A relatively longer treatment exposure to chemotherapy could introduce bias to the study results in favour of pembrolizumab. However, the observed difference in chemotherapy exposure may have also been due to earlier dropouts (e.g., due to death) in the placebo plus chemotherapy group than in the pembrolizumab plus chemotherapy group. Although re-treatment was permitted, it is unknown how many patients had received re-treatment, which also could have biased the results in favour of pembrolizumab.
Risk of bias due to missing outcome data for OS and PFS appeared to be low, as losses to follow-up for reasons other than death were low and sensitivity analyses with different censoring rules for PFS in the overall population were consistent. HRQoL was assessed as an exploratory outcome using the EORTC QLQ-C30 and EROTC QLQ-STO22. Despite no notable differences between the 2 groups, the HRQoL results were compromised by the sizable proportion of patients with incomplete data from the questionnaires.
Analysis of efficacy results followed a defined statistical plan and employed appropriate censoring criteria. The efficacy end points of OS and PFS were addressed using a multiplicity hierarchical testing procedure that controlled for type I error across multiple end points and interim analyses. Both PFS and OS were modelled using a proportional hazards assumption. Although the hazards assumption underlying the HRs for OS and PFS was not tested, based on visual inspection, the curves appeared to be relatively parallel. Of note, OS and PFS results were based on interim analyses, which may have overestimated the treatment-effect estimates.29,30 Given the relatively large sample size and number of events, the effect estimate and CI are not likely to be highly unstable. Although reassuring, overestimation of the treatment effects cannot be completely excluded.29,30
GRADE Summary of Findings and Certainty of the Evidence
The selection of outcomes for Grading of Recommendations Assessment, Development and Evaluation (GRADE) was based on the sponsor’s summary of clinical evidence,31 consultation with clinical experts, and input received from patient and clinician groups and public drug plans. The following list of outcomes was finalized in consultation with expert committee members:
probability of OS at month 12 and month 30
probability of PFS at month 6, month 12, and month 30
HRQoL, measured by the EORTC QLQ-C30 (global health status/QoL and nausea/vomiting scales) and EORTC QLQ-STO22 (pain symptom scale) questionnaires at week 18
notable harms, including immune-mediated AEs and grade 3 or worse immune-mediated AEs.
For pivotal studies and randomized controlled trials (RCTs) identified in the sponsor’s systematic review, GRADE was used to assess the certainty of the evidence for outcomes considered most relevant to the expert committee deliberations, and a final certainty rating was determined as outlined by the GRADE Working Group.32,33
Following the GRADE approach, evidence from RCTs started as high-certainty evidence and could be rated down for concerns related to study limitations (which refer to internal validity or risk of bias), inconsistency across studies, indirectness, imprecision of effects, and publication bias.
When possible, certainty was rated in the context of the presence of an important (nontrivial) treatment effect; if this was not possible, certainty was rated in the context of the presence of any treatment effect (i.e., the clinical importance is unclear). In all cases, the target of the certainty-of-evidence assessment was based on the point estimate and where it was located relative to the threshold for a clinically important effect (when a threshold was available) or to the null. The presence or absence of an important effect on OS was based on a threshold informed by the clinical experts consulted for the purpose of this review, whereas the presence or absence of an important effect on HRQoL was based on minimally important difference (MID) estimates identified in the literature. For all other outcomes, the presence or absence of an important effect was based on the non-null effect.
Table 2 presents the GRADE summary of findings for pembrolizumab plus chemotherapy and for saline placebo plus chemotherapy.
Table 2: Summary of Findings for Pembrolizumab Plus Chemotherapy and Placebo Plus Chemotherapy in Adult Patients With HER2-Negative, Locally Advanced or Metastatic Gastric or GEJ Adenocarcinoma
Outcome and follow-up | Patients (studies), N | Relative effect (95% CI) | Absolute effects (95% CI) | Certainty | What happens | ||
|---|---|---|---|---|---|---|---|
Placebo plus chemo | Pembro plus chemo | Difference | |||||
OS | |||||||
Probability of survival at 12 monthsa Median follow-up: 12.9 and 11.6 monthsb | 1,579 (1 RCT) | NR | 46.7 per 100 (43.2 to 50.2 per 100) | 52.7 per 100 (49.1 to 56.1 per 100) | ███ ███ ████████ ██ ████ ████ ███ ████ | Moderatec | The addition of pembrolizumab to chemotherapy likely results in a clinically important increase in OS when compared to placebo plus chemotherapy at 12 months. |
Probability of survival at 30 monthsa Median follow-up: 12.9 and 11.6 monthsb | 1,579 (1 RCT) | NR | 13.1 per 100 (10.6 to 15.9 per 100) | 22.8 per 100 (19.6 to 26.1 per 100) | ███ ███ ████████ ██ ████ ████ ███ ████ | Highd | The addition of pembrolizumab to chemotherapy results in a clinically important increase in OS when compared to placebo plus chemotherapy at 30 months. |
PFS per RECIST 1.1 by BICR | |||||||
Probability of PFS at 6 monthsa Median follow-up: 12.9 and 11.6 monthsb | 1,579 (1 RCT) | NR | 44.8 per 100 (41.1 to 48.4 per 100) | 55.3 per 100 (51.6 to 58.9 per 100) | ████ ████ ███ ███ █████ ██ ████ ████ ███ ████ | Highe | The addition of pembrolizumab to chemotherapy results in an increase in PFS when compared to placebo plus chemotherapy at 6 months. The clinical importance of the increase is unclear. |
Probability of PFS at 12 monthsa Median follow-up: 12.9 and 11.6 monthsb | 1,579 (1 RCT) | NR | 19.3 per 100 (16.3 to 22.4 per 100) | 28.9 per 100 (25.5 to 32.4 per 100) | ███ ████ ████████ ██ ████ ████ ███ ████ | Highe | The addition of pembrolizumab to chemotherapy results in an increase in PFS when compared to placebo plus chemotherapy at 12 months. The clinical importance of the increase is unclear. |
Probability of PFS at 30 monthsa Median follow-up: 12.9 and 11.6 monthsb | 1,579 (1 RCT) | NR | 9.0 per 100 (6.5 to 11.8 per 100) | 15.3 per 100 (12.4 to 18.6 per 100) | ███ ████ ████████ ██ ████ ████ ███ ████ | Highe | The addition of pembrolizumab to chemotherapy results in an increase in PFS when compared to placebo plus chemotherapy at 30 months. The clinical importance of the increase is unclear. |
HRQoL (on a scale of 0 to 100, with a higher score indicating better QoL, greater functioning, or more severe symptoms) | |||||||
Change in LS mean EORTC QLQ-C30 global health status/QoL scale from baseline to week 18, points Median follow-up: 12.9 and 11.6 monthsb | 1,492 (1 RCT) | NR | –0.85 (–2.62 to 0.93) | 0.40 (–1.37 to 2.18) | ████ ██████ █████ | Lowf | The addition of pembrolizumab to chemotherapy may result in little to no clinically important difference in HRQoL global health at week 18 compared to placebo plus chemotherapy. |
Change in LS mean EORTC QLQ-C30 nausea/vomiting item from baseline to week 18, points Median follow-up: 12.9 and 11.6 monthsb | 1,492 (1 RCT) | NR | 1.36 (–0.45 to 3.16) | 1.06 (–0.75 to 2.87) | ███████ █ █████ | Lowg | The addition of pembrolizumab to chemotherapy may result in little to no clinically important difference in nausea/vomiting at week 18 compared to placebo plus chemotherapy. |
Change in LS mean EORTC QLQ-STO22 pain symptom scale from baseline to week 18, points Median follow-up: 12.9 and 11.6 monthsb | 1,492 (1 RCT) | NR | –5.64 (–7.34 to –3.94 | –8.21 (–9.91 to –6.51) | █████ █████ ██████ | Moderateh | The addition of pembrolizumab to chemotherapy likely results in decreased (improved) pain symptoms when compared to placebo plus chemotherapy at 18 months. The clinical importance of the increase is unclear. |
Harms | |||||||
Immune-mediated AEsa Median follow-up: 12.9 and 11.6 monthsb | 1,572 (1 RCT) | NR | ██ ████ ████ | ███ ████ ████ | ████ ██ ████████ ████ ███ ████ | Highi | The addition of pembrolizumab to chemotherapy results in an increase in immune-mediated AEs compared to placebo plus chemotherapy. |
Grade 3 or worse immune-mediated AEsa Median follow-up: 12.9 and 11.6 monthsb | 1,572 (1 RCT) | NR | ██ ███ ███ ████ | ██ ███ ███ ████ | ███ ████████ ████ ███ ████ | Highi | The addition of pembrolizumab to chemotherapy results in an increase in grade 3 or worse immune-mediated AEs compared to placebo plus chemotherapy. |
AE = adverse event; BICR = blinded independent central review; chemo = chemotherapy; CI = confidence interval; EORTC QLQ-C30 = European Organisation for Research and Treatment of Cancer Quality of Life Questionnaire Core 30; EORTC QLQ-STO22 = European Organisation for Research and Treatment of Cancer Quality of Life Questionnaire Stomach Cancer Module; GEJ = gastroesophageal junction; HRQoL = health-related quality of life; LS = least squares; MID = minimally important difference; NR = not reported; OS = overall survival; Pembro = pembrolizumab; PFS = progression-free survival; QoL = quality of life; RCT = randomized controlled trial; RECIST 1.1 = Response Evaluation Criteria in Solid Tumours Version 1.1; SD = standard deviation.
Notes: Data cut-off date was October 3, 2022.
Study limitations (which refer to internal validity or risk of bias), inconsistency across studies, indirectness, imprecision of effects, and publication bias were considered when assessing the certainty of the evidence. All serious concerns in these domains that led to the rating down of the level of certainty are documented in the table footnotes.
aBetween-group differences were requested from the sponsor to aid in interpretation and were not part of the sponsor’s analysis plan.
bMedian follow-up time at the time of data cut-off (October 3, 2022) was 12.9 months (range, 0.2 to 45.9 months) in the pembrolizumab plus chemotherapy group and 11.8 months (range, 0.1 to 45.5 months) in the placebo and chemotherapy group.
cRated down 1 level for serious imprecision. Although the point estimate suggests a clinically important benefit (exceeding the 5% to 10% threshold suggested by the clinical experts consulted on this review), the lower bound of the 95% CI is compatible with little to no difference in clinical benefit.
dThe point estimate and 95% CI exceeded the threshold of a clinically important benefit (5% to 10%) suggested by the clinical experts consulted on this review.
eThe clinical experts consulted on this review indicated a lack of clarity about a threshold of clinical importance; therefore, the null was used. Although the certainty of evidence was not rated down for serious indirectness, there were concerns about the clinical importance of PFS.
fRated down 1 level for serious study limitation because the risk of bias due to missing data, as results were available for 65.3% of patients by week 18. Rated down 1 level for serious imprecision. There was no MID estimate specific to patients with advanced gastric or GEJ adenocarcinoma that was identified or provided by the sponsor. Between-group differences in MID ranged from 3 to 9 points for improvement, and from –4 to –13 points for deterioration on the global health status/QoL scale across various cancer types. Using the MID established for other cancer types, the treatment effect and the 95% CI included the possibility of no difference in global health status and QoL, and the lower bound of the 95% CI included the potential for decreasing (worsening) global health status and QoL.
gRated down 1 level for serious study limitation because of risk of bias due to missing data, as results were available for 65.3% of patients by week 18. Rated down 1 level for serious imprecision. There was no MID estimate specific to patients with advanced gastric or GEJ adenocarcinoma that was identified or provided by the sponsor. Between-group differences in MID ranged from 5 to 7 points for improvement, and from –5 to –8 points for deterioration on the nausea/vomiting scale across various cancer types. Using the MID established for other cancer types, the 95% CI included the possibility of no difference in nausea or vomiting, and the upper bound of the 95% CI included the potential for increasing (worsening) nausea and/or vomiting.
hRated down1 level for serious study limitation because of risk of bias due to missing data, as results were available for 65.3% of patients by week 18. No MID estimate specific to patients with advanced gastric or GEJ adenocarcinoma was identified; therefore, the null was used. Although the certainty of evidence was not rated down for serious indirectness, there were concerns about the clinical importance of between-group differences on the pain symptom scale.
iThe clinical experts consulted on this review indicated a lack of clarity about a threshold for clinical importance; therefore, the null was employed.
Sources: Clinical Study Report for KEYNOTE-859,34 additional information request,35 sponsor’s summary of clinical evidence.36
Long-Term Extension Studies
No long-term extension studies were included in this submission.
Indirect Comparisons
In the absence of direct head-to-head trials evaluating the comparative efficacy of pembrolizumab and relevant comparators for the first-line treatment of locally advanced, unresectable, or metastatic HER2-negative gastric and GEJ adenocarcinoma, the sponsor submitted 1 indirect treatment comparison (ITC) in the form of a network meta-analysis (NMA), which indirectly compared the treatment effect of first-line pembrolizumab in combination with fluoropyrimidine- and platinum–containing chemotherapy with other first-line therapies.
Description of Studies
For the purpose of this review, the sponsor’s summary of the clinical evidence focused on the comparators relevant to the practice setting in Canada. The Canadian adaptation of the NMA consisted of 2 trials that evaluated 2 interventions — pembrolizumab in combination with fluoropyrimidine-platinum doublet chemotherapy (KEYNOTE-85937) and nivolumab in combination with fluoropyrimidine-platinum doublet chemotherapy (CheckMate 64938) — connected by the comparison to fluoropyrimidine-platinum doublet combination chemotherapy alone.
Efficacy Results
Overall Survival
The NMA for OS was constructed using a fixed-effects model (deviance information criterion [DIC], 7.36; deviance, 3.35). For OS, the treatment responses to pembrolizumab or nivolumab added to chemotherapy were favoured over chemotherapy alone. The credible intervals (CrIs) for the comparison between pembrolizumab plus chemotherapy and nivolumab plus chemotherapy presented little to no difference in OS between the treatments (HR, 0.99; 95% CrI, 0.85 to 1.15).
Progression-Free Survival
The NMA for PFS was constructed using a fixed model (DIC, 5.37; deviance, 2.36). For PFS, the treatment responses to pembrolizumab or nivolumab added to chemotherapy were favoured over chemotherapy alone. The credible intervals (Crls) for the comparison between pembrolizumab plus chemotherapy and nivolumab plus chemotherapy presented little to no difference in PFS between the treatments (HR, 0.96; 95% Crl, 0.82 to 1.13).
Critical Appraisal
The sponsor-submitted NMA was based on studies identified from a systematic literature review of relevant evidence. The systematic literature review was based on population, intervention, control, and outcomes (PICO) that were defined a priori. The systematic literature review involved multiple searches in electronic databases, clinical registries, and supplementary sources. As the search and selection of relevant studies were restricted to trials published in English, relevant non-English publications may have been excluded. Funnel plot assessment for publication bias was not conducted and, thus, publication bias cannot be fully ruled out. Although the risk of bias in the comparator trials was assessed, risk of bias was not assessed by outcome. Several sources of clinical and methodological heterogeneity were identified. Most notable were differences in the primary analysis population, the distribution of PD-L1 expression, and the study design. The primary analysis populations were different between the trials. The analysis populations in the KEYNOTE-859 trial consisted of patients with a PD-L1 CPS of 1 or more, patients with a PD-L1 CPS of 10 or more, and all enrolled patients, regardless of PD-L1 expression. In CheckMate 649, the analysis populations consisted of patients with a PD-L1 CPS of 5 or more and all enrolled patients, regardless of PD-L1 expression. To mitigate the differences in analysis populations between the trials, the NMA was conducted using all enrolled patients, regardless of PD-L1 expression. However, a greater proportion of patients in the CheckMate 649 trial had a PD-L1 CPS of 10 or more than in the KEYNOTE-859 trial (49% versus 35%). The lack of stratified results for a PD-L1 CPS of 5 or more or a PD-L1 CPS of 10 or more in both trials precluded a sensitivity analysis to explore this potential bias or adjustment for this difference. In terms of study design, KEYNOTE-859 was a double-blinded trial, whereas CheckMate 649 was an open-label trial. To minimize any bias inherent in open-label trials, the efficacy results were based on BICR. Finally, the NMA results were based on the final analysis of the CheckMate 649 trial (completion date of May 2020) and the interim analysis in the KEYNOTE-859 trial (data cut-off date of October 3, 2022). Accordingly, the review team was not able to rule out the possibility that final analysis results from the KEYNOTE-859 trial, if available, would have impacted the indirect comparison of pembrolizumab and nivolumab differently. The aforementioned sources of clinical and methodological heterogeneity may have introduced intransitivity, which may have biased the effect estimates. To account for changes in the HR over time, the sponsor provided both constant HR and time-varying HR methods for the NMA. The time-varying HRs for pembrolizumab plus chemotherapy versus nivolumab plus chemotherapy remained consistent over time and were concordant with the results of the constant NMA for OS and PFS. Accordingly, the assumption of proportional hazards was likely met. The Canadian adaptation of the NMA was limited by the available data. With only 1 trial informing each comparison, a random-effects analysis was not feasible, and results from the fixed-effects analysis were predicated on the assumption of minimal between-study heterogeneity. NMA results were presented only for OS and PFS; harms outcomes and other outcomes of relevance to patients (e.g., HRQoL) were not reported.
Studies Addressing Gaps in the Evidence From the Systematic Review
No studies addressing gaps in the evidence from the systematic review were included in this submission.
Conclusions
One randomized, double-blind, placebo-controlled, phase III trial of adult patients with locally advanced, unresectable, or metastatic HER2-negative gastric or GEJ adenocarcinoma shows that first-line treatment with pembrolizumab plus chemotherapy compared to placebo plus chemotherapy (FP or CAPOX) resulted in a clinically important improvement in OS. Subgroup analyses revealed a potential inconsistency in treatment effects across different subgroups, namely for patients with a PD-L1 CPS of less than 1 and/or a non-MSI-H status who may not benefit from treatment at the same magnitude as their counterparts. The observed treatment effect of pembrolizumab plus chemotherapy was most likely driven by patients with a PD-L1 CPS of 1 or greater. Further evidence is needed to establish whether pembrolizumab plus chemotherapy would be of equal benefit for patients with any MSI-H status. Data were insufficient to enable long-term outcome assessment beyond 30 months. Evidence of high certainty from the pivotal trial suggested that adding pembrolizumab to chemotherapy results in a clinically important increase in OS at 30 months. Consistently, evidence of high certainty suggested that first-line treatment with pembrolizumab plus chemotherapy results in improved PFS, but with little to no difference in HRQoL measured by the EORTC QLQ-C30 global health status/QoL scale and nausea/vomiting scale, despite a likely improvement in pain-related symptoms measured by the EORTC QLQ-STO22. Immunotherapy-mediated AEs and any grade 3 or worse AEs were more frequently reported in the pembrolizumab plus chemotherapy group than in the placebo plus chemotherapy group. even though SAEs were likely comparable between the groups. Based on indirect evidence, there appeared to be little to no difference in OS and PFS between pembrolizumab in combination with chemotherapy and nivolumab in combination with chemotherapy in patients with locally advanced, unresectable, or metastatic HER2-negative gastric or GEJ adenocarcinoma. The indirect evidence, however, is associated with uncertainty due to the clinical and methodological heterogeneity between the studies included in the network, which has the potential to introduce bias to the ITC results.
Introduction
The objective of this report is to review and critically appraise the evidence submitted by the sponsor on the beneficial and harmful effects of pembrolizumab, 200 mg or 400 mg IV infusion, in combination with fluoropyrimidine and platinum–containing chemotherapy in the treatment of HER2-negative gastric or GEJ adenocarcinoma in adult patients.
Disease Background
The contents of this section have been informed by materials submitted by the sponsor and clinical expert input. The following information has been summarized and validated by the review team.
Gastric cancer is a growth of abnormal cells that starts in the stomach. In 2022, an estimated 4,100 Canadians are projected to be diagnosed with gastric cancer.1,2 Gastric cancers are generally classified into 2 topographical subsites. Cardia gastric cancers affect the upper part of the stomach adjoining the esophagus. Noncardia gastric cancers occur in the more distal regions of the stomach.3 GEJ cancer develops in the area where the esophagus meets the gastric cardia.4 The risk of developing gastric cancer and GEJ cancer increases with age, and is greatest after the age of 50 years.5 The lifetime probability of developing gastric cancer is higher among men (12 per 100,000 persons) than women (5.6 per 100,000 persons).1,2,5 Approximately 90% of noncardia cancers are attributable to Helicobacter pylori infection.6 Other risk factors for gastric cancers include smoking, heavy alcohol consumption, and foods preserved by nitrates and/or nitrites.39-42 Although early-stage gastric and GEJ cancer is potentially curable, locally advanced, unresectable, or metastatic diseases are considered incurable. When patients with gastric or GEJ adenocarcinoma present with symptoms, they are usually nonspecific,7 so the early diagnosis of gastric and GEJ cancers is challenging.7 As a result, most patients have advanced stage III or stage IV (34%) disease at the time of diagnosis, when curative treatments may not be possible.7,8 Advanced gastric and GEJ cancer is associated with a higher prevalence and intensity of symptoms, such as unexplained weight loss, dyspepsia, abdominal pain, early satiety, reflux, dysphagia, asthenia, nausea and vomiting, shortness of breath, bleeding and/or anemia, ascites, and dumping syndrome.9,21,43 Patients with unresectable advanced or metastatic disease typically experience a high symptom burden, an impaired QoL, and frequent bouts of anxiety and depression.9 The 5-year survival rate for patients diagnosed with gastric and GEJ cancer living in Canada is 29%, reflecting the fact that the majority of patients are diagnosed with advanced-stage disease, which is associated with a poor prognosis.1,2,10 Among those with metastatic gastric or GEJ cancer, the 5-year survival rate is 6.6%.11
Gastric cancers most often start in the gland cells that line the inside of the stomach, which is indicative of adenocarcinoma. Approximately 90% to 95% of gastric and GEJ cancers are histologically classified as adenocarcinoma.3,8,39,41 Gastric cancers may contain oncogenic driver mutations that lead to uncontrolled cell growth and proliferation. The most common driver mutation is HER2, a transmembrane tyrosine kinase receptor. HER2 has been found to be overexpressed or amplified in approximately 20% of patients with gastric or GEJ cancers,13-15 so most patients living in Canada have HER2-negative disease.16 Based on projections from the Canadian Cancer Statistics Advisory Committee, an estimated 3,060 new cases of gastric or GEJ cancers are expected in 2025, of which 81% will be classified as HER2-negative.2,13 Despite currently available treatments, the prognosis for patients with advanced unresectable or metastatic gastric or GEJ adenocarcinoma remains poor, with a 5-year survival rate of 10% or less.11,17 Although the prognostic significance of HER2 status is not as well established in gastric cancer as it is in other cancers (i.e., breast cancer),18 its presence or absence is a predictive biomarker for the selection of first-line systemic therapy in the advanced and metastatic settings.
When gastric or GEJ cancer is suspected, diagnostic procedures include imaging with upper GI endoscopy, endoscopic ultrasound, CT, PET, and/or MRI scans, and tissue biopsy. Pathologic testing of biomarkers on lung biopsy specimens assists in the determination of treatment options and risk stratification. The American Society of Clinical Oncology (ASCO), European Society for Medical Oncology (ESMO), and National Comprehensive Cancer Network (NCCN) guidelines recommend evaluating HER2 status, PD-L1 expression, as well as microsatellite instability (MSI) or mismatch repair (MMR) for patients with advanced or metastatic-stage gastric cancer.18,44,45 In clinical practice, both the HER2 status and PD-L1 expression testing are done on a biopsy sample taken from the primary tumour or from metastases. HER2 status can be determined with immunohistochemistry (IHC), which measures the amount of HER2 protein in the cancer cells, or with fluorescence in situ hybridization (FISH), which examines the number of copies of the HER2 gene in the cancer cells. PD-L1 expression can be determined using a semiquantitative IHC approach. Both IHC and FISH are performed by pathologists.
Standards of Therapy
The contents of this section have been informed by materials submitted by the sponsor and clinical expert input. The following information has been summarized and validated by the review team.
The treatment algorithm for locally advanced, unresectable, or metastatic HER2-negative gastric or GEJ adenocarcinoma as reflected by International and Canadian guidelines, and by clinical practice in Canada is presented in Figure 1.
Early-stage gastric and GEJ cancer are potentially curable with surgical treatment, either alone (stage IA) or with perioperative systemic therapy (stage IB to stage III). However, recurrences are frequent and associated with a poor prognosis.11 Patients with locally advanced, unresectable, or metastatic gastric or GEJ adenocarcinoma may not be curable. The median survival rate for such patients ranges from 4 months, when treatment consists of only best supportive care, to less than 12 months, when treatment consists of systemic chemotherapy.7 Survival beyond 12 months may be achieved with combinations of PD-1 inhibitors and platinum-fluoropyrimidine-based chemotherapy for patients with HER2-negative disease.19,46 Based on input from the clinical expert consulted for the purpose of this review, most patients with locally advanced, unresectable, or metastatic HER2-negative gastric or GEJ cancers are treated with palliative intent. The main goals of treatment in this setting are to help patients live longer (improve OS) and live better (improve QoL). The cornerstone of treatment for patients with locally advanced or metastatic HER2-negative gastric or gastroesophageal cancers involves sequential use of the best available systemic therapies. As noted by the clinical expert, the selection of systematic therapy depends on the patient’s performance status, symptoms and values, and preferences across all lines of therapies. The clinical expert also added that in the future, biomarker analysis (e.g., MMR-deficient status, HER2 status, CPS, and Claudin 18.2) will affect the selection of therapy.
The addition of nivolumab to standard first-line platinum-fluoropyrimidine doublet is recommended for all patients with HER2-negative advanced or metastatic unresectable gastric or GEJ adenocarcinomas, regardless of PD-L1 expression, based on the open-label, phase III CheckMate 649 trial.19-21 CheckMate 649 demonstrated improvement in OS and PFS with nivolumab plus chemotherapy compared with chemotherapy alone. In addition, the combination of pembrolizumab and platinum-fluoropyrimidine doublet therapy is recommended for patients with advanced or metastatic HER2-negative Siewert 1 GEJ adenocarcinoma and esophageal adenocarcinoma, based on the double-blind, phase III KEYNOTE-590 study.20,22 The standard first-line platinum-fluoropyrimidine doublet chemotherapy options in Canada include FOLFOX, CAPOX, FP, and capecitabine plus cisplatin. The clinical experts consulted on this review noted that the most used chemotherapy backbones in Canada include FOLFOX, CAPOX, and cisplatin plus capecitabine. In an RCT, oxaliplatin resulted in significantly better PFS and OS,47-49 with a safety profile that was superior to that with cisplatin.48-51 Thus, Canadian guidelines have recommended oxaliplatin as the preferred platinum drug,52,53 even though oxaliplatin and cisplatin are generally considered equally effective.49-51 The fluoropyrimidines include IV 5-FU and oral capecitabine,43 which are equally effective. However, 5-FU IV infusion is preferred for patients with dysphagia.43 Leucovorin, a reduced form of folic acid, is used to enhance the activity of 5-FU in certain regimens. For patients who are unfit for or intolerant of platinum-based regimens, the combination of 5-FU, leucovorin, and irinotecan (FOLFIRI) or irinotecan monotherapy may be considered as alternative options, but are less frequently used in the first-line setting.43 In the second-line setting, patients can receive ramucirumab plus paclitaxel (preferred) or, if not eligible for that, a chemotherapy, usually a single drug (the standards are paclitaxel, docetaxel, or irinotecan) not previously used.43,52,53 After disease progression on second-line therapy, trifluridine-tipiracil is the standard third-line treatment when oral therapy is still possible.43,52,53 Fourth-line therapy may include 5-FU plus irinotecan or a taxane if it was not administered as second-line therapy.
The clinical experts noted that across all lines of therapies, patients with advanced gastroesophageal cancer benefit from nutritional support, emotional support, exercise, and symptom management in conjunction with palliative care. The clinical experts added that in some specific settings, local therapies (such as surgery, radiation, or interventional radiology) may be used.
Figure 1: Treatment Algorithm for Locally Advanced and Unresectable or Metastatic HER2-Negative Gastric or GEJ Adenocarcinoma
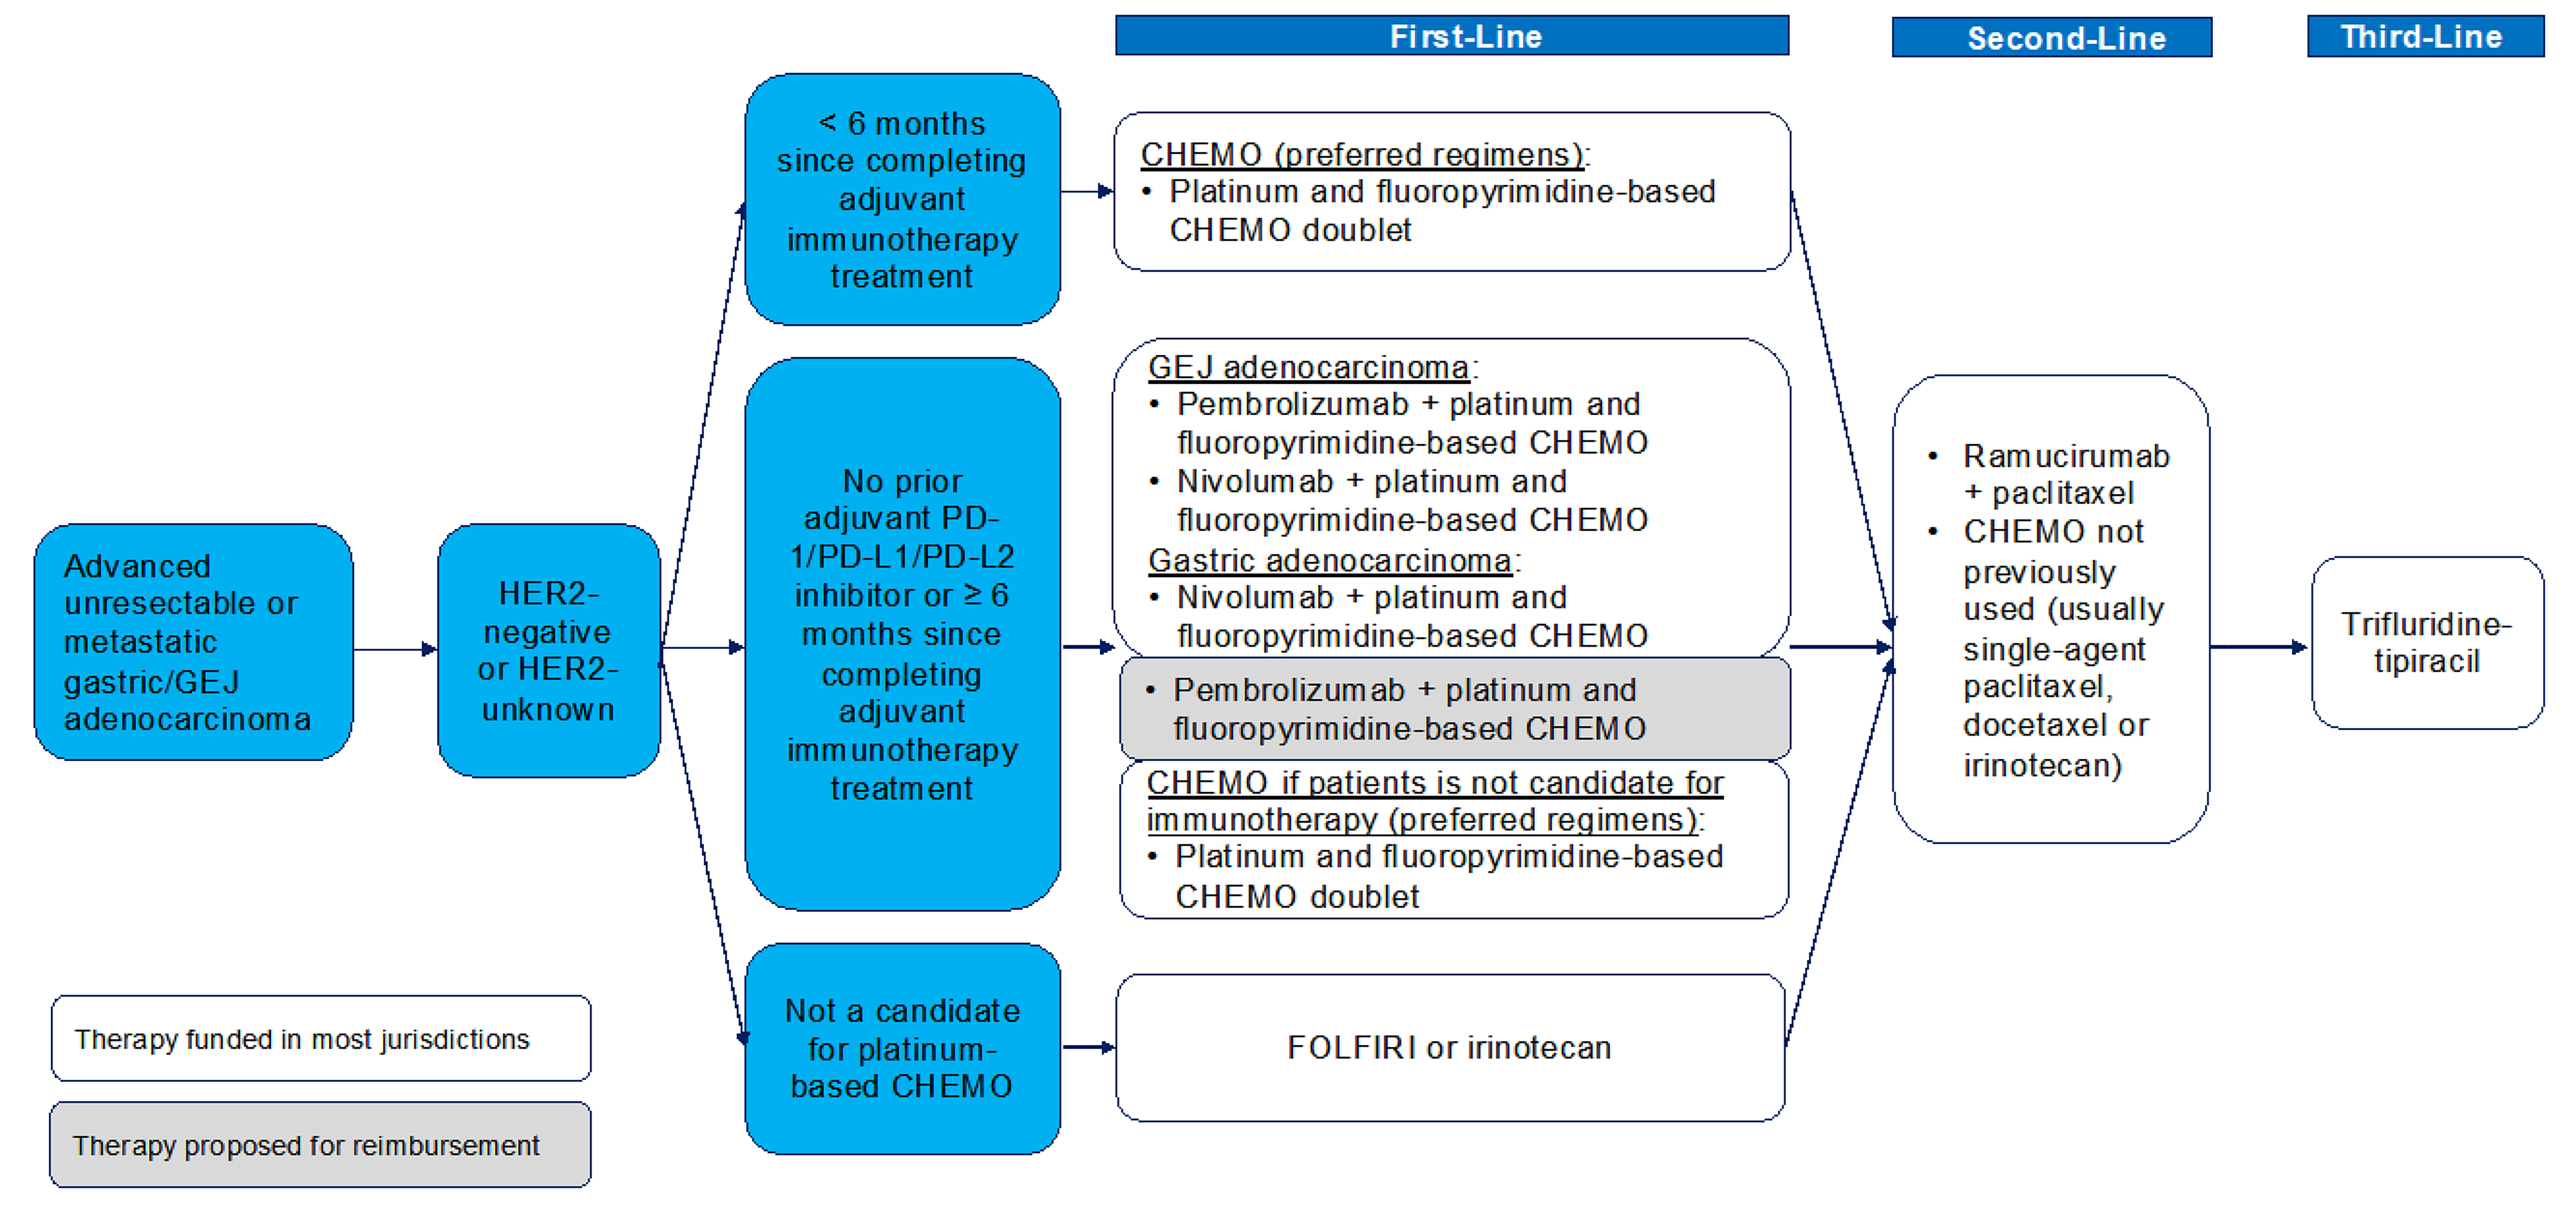
CHEMO = chemotherapy; FOLFIRI = 5-fluorouracil plus leucovorin plus irinotecan; GEJ = gastroesophageal junction; PD-1 = programmed cell death 1 protein; PD-L1 = programmed cell death 1 ligand 1; PD-L2 = programmed cell death 1 ligand 2.
Sources: Adapted by CDA-AMC,20 AHS,54 CCO,55 sponsor’s summary of clinical evidence.36
Drug Under Review
Key characteristics of pembrolizumab and other treatments available for HER2-negative gastric or GEJ adenocarcinoma are summarized in Table 3.
Pembrolizumab is a high-affinity antibody against PD-1, which exerts dual ligand blockade of the PD-1 pathway, which includes PD-L1 and PD-L2, on antigen-presenting or tumour cells. Pembrolizumab reactivates tumour-specific cytotoxic T lymphocytes in the tumour microenvironment by inhibiting the PD-1 receptors from blinding to their ligands.23
Pembrolizumab received an NOC on March 21, 2024, through the standard review pathway. The Health Canada indication for pembrolizumab, in combination with fluoropyrimidine and platinum–containing chemotherapy, is for the first-line treatment of adult patients with locally advanced, unresectable, or metastatic HER2-negative gastric or GEJ adenocarcinoma.
Health Canada issued an NOC for the use of pembrolizumab in patients with gastrointestinal cancers in the following cases:
first-line treatment, as monotherapy, for adult patients with metastatic MSI-H or MMR-deficient colorectal cancer
first-line treatment for adult patients with locally advanced, unresectable, or metastatic carcinoma of the esophagus or HER2-negative adenocarcinoma of the esophagogastric junction (with a tumour centre 1 to 5 cm above the gastric cardia) in combination with platinum-fluoropyrimidine-based chemotherapy
first-line treatment, in combination with trastuzumab and fluoropyrimidine and platinum–containing chemotherapy, for adult patients with locally advanced, unresectable, or metastatic HER2-positive gastric or GEJ adenocarcinoma whose tumours express PD-L1 (CPS ≥ 1), determined by a validated test.
Health Canada has issued an NOC with conditions for the use pembrolizumab in the following:
adult patients with unresectable or metastatic MSI-H or MMR-deficient colorectal cancer whose tumours have progressed after treatment with a fluoropyrimidine, oxaliplatin, and irinotecan, as monotherapy, and adult patients with endometrial cancer whose tumours have progressed after prior therapy and who have no satisfactory alternative treatment options, as monotherapy.
On November 16, 2023, the FDA approved pembrolizumab in combination with fluoropyrimidine and platinum–containing chemotherapy for the first-line treatment of adults with locally advanced, unresectable, or metastatic HER2-negative gastric or GEJ adenocarcinoma.56 The review was conducted as part of Project Orbis, in collaboration with Australia’s Therapeutic Goods Administration, Health Canada, and Swissmedic. Of note, the European Medicines Agency (EMA) approved pembrolizumab in combination with fluoropyrimidine-platinum-based chemotherapy for the first-line treatment of adult patients with HER2-negative advanced or metastatic gastric or GEJ adenocarcinoma whose tumours express PD-L1 and who have a CPS of 1 or more.57
The product-monograph recommended dosage of pembrolizumab for adults with locally advanced, unresectable, or metastatic HER2-negative gastric or GEJ adenocarcinoma, in combination with fluoropyrimidine and platinum–containing chemotherapy, is 200 mg every 3 weeks or 400 mg every 6 weeks by IV infusion until disease progression, unacceptable toxicity, or up to 24 months or 18 doses of 400 mg, whichever is longer.24 The product monograph specifies that pembrolizumab should be administered before chemotherapy when both are given on the same day.24
According to the product label, pembrolizumab is associated with the following warnings: immune-mediated adverse reactions, infusion-related reactions, complications of allogenic hematopoietic stem cell transplant, and embryo-fetal toxicity.58 Common adverse reactions associated with pembrolizumab when used as a single drug include fatigue, musculoskeletal pain, rash, diarrhea, pyrexia, cough, decreased appetite, pruritus, dyspnea, constipation, pain, abdominal pain, nausea, and hypothyroidism. Common adverse reactions associated with pembrolizumab in combination with chemotherapy include fatigue or asthenia, nausea, constipation, diarrhea, decreased appetite, rash, vomiting, cough, dyspnea, pyrexia, alopecia, peripheral neuropathy, mucosal inflammation, stomatitis, headache, weight loss, abdominal pain, arthralgia, myalgia, insomnia, and palmar-plantar erythrodysesthesia.58 In the event of adverse reactions, no dose reductions of pembrolizumab are recommended in the product monograph.24 Instead, the product monograph recommends that pembrolizumab be withheld or discontinued to manage adverse reactions.
Table 3: Key Characteristics of Pembrolizumab Plus Chemotherapy and Placebo Plus Chemotherapy
Characteristic | Pembrolizumab plus platinum-fluoropyrimidine doublet chemotherapy | Platinum-fluoropyrimidine doublet chemotherapy | Nivolumab plus platinum-fluoropyrimidine doublet chemotherapy |
|---|---|---|---|
Mechanism of action | Pembrolizumab: Releases PD-1 pathway-mediated inhibition of the immune response and restores T-cell proliferation and cytokine production Chemotherapy: Antineoplastic (i.e., slows cancer growth or stops the growth of tumours [neoplasms]) or cytotoxic (i.e., kills tumour cells) | Chemotherapy: Antineoplastic (i.e., slows cancer growth or stops the growth of tumours [neoplasms]) or cytotoxic (i.e., kills tumour cells) | Nivolumab: Blockade of PD-1 and PD-L1 and/or PD-L2 interaction and release of antitumour T-cell responses Chemotherapy: Antineoplastic (i.e., slows cancer growth or stops the growth of tumours [neoplasms]) or cytotoxic (i.e., kills tumour cells) |
Indicationa | Proposed indication: First-line treatment, in combination with fluoropyrimidine and platinum–containing chemotherapy, for adult patients with locally advanced, unresectable, or metastatic HER2-negative gastric or GEJ adenocarcinoma23 | These indications were not reviewed by Health Canada but are the standard of care in clinical practice in Canada | HER2-negative advanced or metastatic gastric cancer, GEJ cancer, or esophageal adenocarcinoma, in combination with fluoropyrimidine- and platinum–containing chemotherapy59 |
Recommended dose and route of administration | Pembrolizumab: 200 mg IV over 30 minutes every 3 weeks or 400 mg IV every 6 weeks49 AND Fluoropyrimidine and platinum–containing chemotherapy:b FP — Cisplatin 80 mg/m2 IV over 60 minutes on day 1 of each 21-day treatment cycle (every 3 weeks) plus 5-FU 800 mg/m2 per day IV continuously from day 1 to day 5 of each 21-day treatment cycle48 OR CAPOX — Oxaliplatin 130 mg/m2 IV over 120 minutes on day 1 of each 21-day treatment cycle (every 3 weeks) plus capecitabine 1,000 mg/m2 orally twice daily on day 1 to day 14 of each 21-day treatment cycle48 Alternative regimens that may be used in clinical practice: FOLFOX — Oxaliplatin 85 mg/m2 IV, leucovorin 400 mg/m2 IV plus 5-FU 400 mg/m2 IV bolus on Day 1, then 5-FU 2,400 mg/m2 over 46 hours every 2 weeks.2 OR CAPECISP — Cisplatin 80 mg/m2 IV over 60 minutes on day 1 plus capecitabine 1,000 mg/m2 orally twice daily on day 1 to day 14 of each 21-day treatment cycle60 | Fluoropyrimidine and platinum–containing chemotherapy Regimens frequently used in clinical practice:b FP — Cisplatin 80 mg/m2 IV over 60 minutes on day 1 of each 21-day treatment cycle (every 3 weeks) plus 5-FU 800 mg/m2 per day IV continuously from day 1 to day 5 of each 21-day treatment cycle48 OR CAPOX — Oxaliplatin 130 mg/m2 IV over 120 minutes on day 1 of each 21-day treatment cycle (every 3 weeks) plus capecitabine 1,000 mg/m2 orally twice daily on day 1 to day 14 of each 21-day treatment cycle48 OR FOLFOX — Oxaliplatin 85 mg/m2 IV, leucovorin 400 mg/m2 IV, plus 5-FU 400 mg/m2 IV bolus on day 1, then 5-FU 2,400 mg/m2 over 46 hours every 2 weeks2 OR CAPECISP — Cisplatin 80 mg/m2 IV over 60 minutes on day 1 plus capecitabine 1,000 mg/m2 orally twice daily of day 1 to day 14 of each 21-day treatment cycle60 | Nivolumab: 360 mg IV over 30 minutes (every 3 weeks) or 240 mg IV (every 2 weeks) AND Fluoropyrimidine and platinum–containing chemotherapy Regimens frequently used in clinical practice:b FP — Cisplatin 80 mg/m2 IV over 60 minutes on day 1 of each 21-day treatment cycle (every 3 weeks) plus 5-FU 800 mg/m2 per day IV continuously from day 1 to day 5 of each 21-day treatment cycle61 OR CAPOX — Oxaliplatin 130 mg/m2 IV over 120 minutes on day 1 of each 21-day treatment cycle (every 3 weeks) plus capecitabine 1,000 mg/m2 orally daily on day 1 to day 14 of each 21-day treatment cycle62 OR FOLFOX — Oxaliplatin 85 mg/m2 IV, leucovorin 400 mg/m2 IV, plus 5-FU 400 mg/m2 IV bolus on day 1, then 5-FU 2,400 mg/m2 over 46 hours every 2 weeks2 OR CAPECISP — Cisplatin 80 mg/m2 IV over 60 minutes on day 1, capecitabine 1,000 mg/m2 orally twice daily on day 1 to day 14 of each 21-day treatment cycle60 |
Serious adverse effects or safety issues | Pembrolizumab in combination with chemotherapy: Fatigue and/or asthenia, nausea, constipation, diarrhea, decreased appetite, rash, vomiting, cough, dyspnea, pyrexia, alopecia, peripheral neuropathy, mucosal inflammation, stomatitis, headache, weight loss, abdominal pain, arthralgia, myalgia, and insomnia Chemotherapy: Hair loss, nausea, vomiting, anemia, bone loss, constipation, diarrhea, fatigue, depression, anxiety, hand-foot syndrome, low platelets, low WBCs, mouth problems | Chemotherapy: Hair loss, nausea, vomiting, anemia, bone loss, constipation, diarrhea, fatigue, depression, anxiety, hand-foot syndrome, low platelets, low WBCs, mouth problems | Nivolumab: Severe and/or fatal immune-mediated adverse reactions Chemotherapy: Hair loss, nausea, vomiting, anemia, bone loss, constipation, diarrhea, fatigue, depression, anxiety, hand-foot syndrome, low platelets, low WBCs, mouth problems |
Other | Pembrolizumab: Warnings and precautions for immune-mediated adverse reactions and infusion-related reactions | NA | Nivolumab: Warnings and precautions for immune-mediated adverse reactions |
5-FU = 5-fluorouracil; CAPECISP = capecitabine plus cisplatin; CAPOX = capecitabine plus oxaliplatin; FOLFOX = 5-fluorouracil plus leucovorin plus oxaliplatin; FP = 5-fluorouracil plus cisplatin; GEJ = gastroesophageal junction; NA = not applicable; PD-1 = program cell death 1 protein; PD-L1 = programmed cell death 1 ligand 1; PD-L2 = programmed cell death 1 ligand 2; WBC = white blood cell.
aHealth Canada–approved indication.
bThe FOLFOX and CAPECISP regimens were assumed by the sponsor to have the same efficacy and safety as CAPOX and FP.
Sources: Sponsor’s summary of clinical evidence,31 Cancer Care Ontario,2,60-62 product monographs for pembrolizumab (draft)23 and nivolumab.59
Perspectives of Patients, Clinicians, and Drug Programs
Patient Group Input
This section was prepared by the clinical review team based on the input provided by patient groups. The full original patient input(s) received for the current review have been included in this section of this report.
Patient group input was submitted by 1 patient advocacy group — My Gut Feeling – Stomach Cancer Foundation of Canada — which is a nonprofit organization that provides support, awareness, education, information, and advocacy to patients living with gastric, GEJ, and esophageal cancer, as well as to survivors and caregivers. Patient input was collected from an international online survey conducted between March 12 and March 25, 2024, and included responses from 49 patients (79.6%) and caregivers (20.4%). Among the patient respondents, 46.9% identified themselves as a patient who had completed treatment and 32.7% as a patient in current treatment. Most respondents (86.7%) had gastric cancer, and the remainder had either esophageal and/or GEJ cancer. Of those who responded, 69.4% were from Canada. Of note, the patient group submission did not include a distinct breakdown of data from participants living in Canada. Most patients (85.7%) reported having adenocarcinoma and HER2-negative disease; only 12.0% of respondents reported having HER2-positive disease. A total of 9 respondents from the patient group survey had experience with the drug under review. At the time of the survey, 75% of patients reported to be actively on this drug and had been on it for at least 1 month; the remainder reported discontinuing the drug after disease progression.
All patients who responded to the survey experienced at least 1 symptom before diagnosis, with the most common being changes in weight loss (61.2%), changes in appetite (59.2%), pain (46.9%), reflux (42.9%), nausea or vomiting (36.7%), and difficulty swallowing (34.7%). Most patients (95.0%) reported that their cancer diagnosis had a significant impact on their QoL, including on their physical and mental health, ability to eat and work, finances, social life, identity, and personal image. Both patient and caregiver respondents, specifically those with metastatic disease, reported a significant decline in their mental health due to the cancer diagnosis and its treatment. In addition, respondents reported that changes in identity and family dynamics due to the cancer diagnosis further effected their psychosocial well-being and exacerbated any preexisting mental health conditions, such as depression and anxiety, in both patients and caregivers. Respondents also indicated that cancer and its treatments had financial implications on the patient and caregiver. All patients who completed the survey experienced at least 1 treatment-related side effect. The most commonly reported treatment-related side effects included fatigue (89.8%), weight loss (83.7%), appetite changes (79.6%), nausea and/or vomiting (75.5%), chemo brain (73.5%), taste changes (69.4%), neuropathy (67.3%), hair loss (65.3%), diarrhea (61.2%), abdominal pain (51%), and insomnia (46.9%). Among those who responded, 8.2% reported discontinuing treatment due to an AE that resulted in hospitalization, 16.4% reported receiving a dose reduction in treatment, and 16.4% reported delaying or skipping a treatment cycle. Patients and caregivers who completed the survey indicated that the following outcomes were important when considering treatment options: QoL, treatment side effects, cost of treatment, convenience of treatment, duration of treatment, and the survival benefit. Patients and caregivers added that equitable access, convenience of administration (e.g., oral versus IV, less frequent travel to hospital, shorter chair time to receive treatment), and more options from which to choose based on their values and preferences were important. Input from the patient group emphasized the patients’ desire for biomarker testing to be accessible at the onset of their disease across all centres and provinces.
Clinician Input
Input From Clinical Experts Consulted on This Review
All review teams include at least 1 clinical specialist with expertise in the diagnosis and management of the condition for which the drug is indicated. Clinical experts are a critical part of the review team and are involved in all phases of the review process (e.g., providing guidance on the development of the review protocol, assisting in the critical appraisal of clinical evidence, interpreting the clinical relevance of the results, and providing guidance on the potential place in therapy). The following input was provided by 2 clinical specialists with expertise in the diagnosis and management of gastric and GEJ adenocarcinoma.
Unmet Needs
The clinical experts consulted for the purpose of this review emphasized that locally advanced and metastatic HER2-negative gastric or GEJ cancer is associated with considerable unmet needs. Based on input from the clinical experts, treatment with nivolumab in combination with chemotherapy is the only available first-line option for locally advanced, metastatic HER2-negative gastric or GEJ adenocarcinomas; however, OS outcomes remain poor (median OS is 13 to 15 months). The clinical experts added that there is a need for new treatments that improve OS while providing a QoL benefit, as many patients are symptomatic.
Place in Therapy
The clinical experts suggested that the addition of pembrolizumab to chemotherapy would represent an alternative to combination therapy with nivolumab and chemotherapy in the first-line setting for patients with locally advanced and metastatic HER2-negative gastric or GEJ adenocarcinoma. The clinical experts noted that if approved for funding, the addition of pembrolizumab to chemotherapy would offer patients an alternative treatment schedule of every 6 weeks; the schedule with nivolumab is every 2 to 4 weeks. The clinical experts added that the dosing regimen is usually based on the background chemotherapy chosen to be coadministered with pembrolizumab.
Patient Population
Per the Health Canada indication, the clinical experts agreed that patients who have HER2-negative gastric or GEJ adenocarcinoma that is metastatic or not amenable to curable resection should be considered for first-line treatment with pembrolizumab in combination with chemotherapy. The clinical experts noted than, currently, CPS testing for PD-L1 expression status is not required for patients with HER2-negative disease.
Assessing the Response Treatment
The clinical experts noted that the following factors should be used to determine response to treatment: patient-reported symptoms and side effects, and response on cross-sectional imaging with CT scans or MRI. The clinical experts suggested that patients be assessed by a clinician after every 2 to 3 cycles of treatment. Clinician assessment may occur more frequently if patients report the occurrence of bothersome symptoms or side effects. The clinical experts suggested that patients undergo CT scans every 2 to 3 months. Tumour markers can be used, per clinical judgment, to supplement a fulsome patient assessment. The clinical experts stressed, however, that the only truly clinically meaningful end points for all types of cancer are OS and QoL.
Discontinuing Treatment
The clinical experts suggested that the decision to discontinue treatment with pembrolizumab be based on patient-reported symptoms, patient preference, side effects, and well-being, in combination with the assessment of treatment response and disease progression, either radiological or clinical.
Prescribing Considerations
The clinical experts suggested that pembrolizumab only be prescribed by or under the supervision of a medical oncologist with expertise in the management of immunotherapy side effects. The clinical experts noted that immunotherapy and chemotherapy are currently delivered as the standard of care (SOC) in all oncology centres. Accordingly, these therapies, with the addition of pembrolizumab, can be safely administered in all centres approved for oncology care.
Clinician Group Input
This section was prepared by the clinical review team based on the input provided by clinician groups. The full original clinician group input(s) received for the current review have been included in this section of this report.
Clinician group input was submitted by the OH-CCO Gastrointestinal Drug Advisory Committee. The OH-CCO Gastrointestinal Drug Advisory Committee provides guidance on drug-related issues in support of CCO’s mandate, which includes Provincial Drug Reimbursement Programs (PDRP) and the Systemic Treatment Program. Four clinicians provided input for this review on behalf of the OH-CCO Gastrointestinal Drug Advisory Committee.
The clinician group pointed out that patients with advanced HER2-negative gastric cancer are being offered chemotherapy (e.g., FOLFOX, CAPOX) plus nivolumab as the currently available SOC combination therapy in Canada. The clinician group mentioned that the goals of treatment in the palliative setting include improvements in QoL and OS. The clinician group indicated that the addition of pembrolizumab would give clinicians an alternative option to nivolumab, which is currently approved. The clinician group providing input added that patients with HER2-negative advanced gastric cancer would be best suited for treatment with pembrolizumab. Referring to the CheckMate 649 and KEYNOTE-859 studies, the clinician group suggested that patients with a PD-L1 CPS of greater than 5% or 10% may derive most benefit from pembrolizumab, whereas patients with a PD-L1 CPS of less than 1% may derive little benefit. The clinician group indicated that clinical response and symptoms are used to determine whether a patient is responding to treatment in clinical practice. The input further suggested that CT scans be done regularly, per clinician discretion. The clinician group indicated that the decision to continue or discontinue treatment with pembrolizumab should be based on disease response, immune-related toxicities, and functional status.
Drug Program Input
The drug programs provide input on each drug being reviewed through our reimbursement review processes by identifying issues that may impact their ability to implement a recommendation. The implementation questions and corresponding responses from the clinical experts consulted for the purpose of this review are summarized in Table 4.
Table 4: Summary of Drug Plan Input and Clinical Expert Response
Drug program implementation questions | Clinical expert response |
|---|---|
Relevant comparators | |
For patients who are unable to receive or tolerate fluoropyrimidine-platinum-based chemotherapy, is it reasonable to combine pembrolizumab with alternative chemotherapy? | The clinical experts consulted on this review noted that fluoropyrimidines, capecitabine, and 5-fluorouracil are the backbones of all the chemotherapies used in clinical practice in Canada for the patient population under review. In patients with a contraindication to fluoropyrimidine chemotherapy (e.g., coronary vasospasm after fluoropyrimidine exposure), alternative treatment with raltitrexed may be considered. The clinical experts stated that in patients who are unable to receive or tolerate platinum-based chemotherapy, it would be reasonable to combine pembrolizumab with an alternative chemotherapy, such as FOLFIRI. |
Considerations for initiation of therapy | |
Patients eligible for inclusion in the KEYNOTE-859 trial had adenocarcinoma histology. Should patients with squamous cell or undifferentiated gastric cancer be considered eligible for pembrolizumab with chemotherapy? | Patients with squamous cell or undifferentiated gastric cancer were excluded from the KEYNOTE-859 trial. The clinical experts indicated that although it is relatively rare for patients with gastric cancers to present with squamous cell and undifferentiated histology, it would be reasonable for these patients to be considered eligible for treatment with pembrolizumab. This would also be consistent with the CDA-AMC recommendation and the drug plans’ funding for pembrolizumab plus chemotherapy for esophageal or GEJ squamous cell cancer. |
Should eligibility to receive pembrolizumab plus chemotherapy be determined by the PD-L1 CPS and/or dMMR or MSI-H? | The clinical experts indicated that eligibility to receive pembrolizumab plus chemotherapy should not be tied to a patient’s PD-L1 CPS or dMMR or MSI-H status. The clinical experts noted that this would be aligned with the eligibility criteria for combination therapy with nivolumab in the patient population under review. |
The duration of treatment for pembrolizumab is until disease progression, unacceptable toxicity, or up to 24 months (35 cycles administered every 3 weeks). If pembrolizumab is discontinued for reasons other than progression or intolerance after the initial 24 months, are patients eligible for an additional 12 months (17 cycles every 3 weeks) at the time of disease progression, in alignment to other indications for pembrolizumab? | The clinical experts noted that it would be reasonable to readminister pembrolizumab at the time of disease progression in patients who discontinued treatment for reasons other than progression or intolerance. To account for the different dosing schedules of pembrolizumab (every 3 weeks vs. every 6 weeks), re-treatment should be based on total duration of exposure (i.e., 12 months), not number of cycles of pembrolizumab. |
Should re-treatment consist of pembrolizumab monotherapy or pembrolizumab in combination with chemotherapy? | The clinical experts suggested that re-treatment with pembrolizumab as monotherapy or in combination with chemotherapy should be based on clinical judgment that takes into account when patients last received the chemotherapy component of treatment, residual side effects, and the overall status of the patient. For patients who are relatively well, re-treatment with pembrolizumab in combination with chemotherapy may be considered. However, for patients who are frail, treatment with pembrolizumab alone may be more appropriate. |
PAG notes that nivolumab in combination with chemotherapy was reviewed by CDA-AMC for the treatment of adult patients with advanced or metastatic gastric, GEJ, or esophageal adenocarcinoma | Comment from the drug program to inform pERC deliberations. |
Considerations for discontinuation of therapy | |
If there is disease progression during a treatment break, can pembrolizumab with or without chemotherapy be resumed? | The clinical experts suggested that pembrolizumab with or without chemotherapy can be resumed, at the treating physician’s discretion, for patients who stopped pembrolizumab before any disease progression and if disease progression occurred during the treatment break. |
Considerations for prescribing therapy | |
For consistency, jurisdictions would plan on implementing pembrolizumab as weight-based dosing up to a cap (e.g., 2 mg/kg every 3 weeks to a maximum dose of 200 mg, or 4 mg/kg every 6 weeks to a maximum of 400 mg), similar to other indications. | Comment from the drug program to inform pERC deliberations. |
The trial allowed pembrolizumab to be continued if 1 or more chemotherapy drugs was discontinued. Is there a minimum number of chemotherapy cycles that must be given concurrently with pembrolizumab? | The clinical experts noted that, in alignment with other immunotherapies, at least 1 cycle of chemotherapy should be administered concurrently with pembrolizumab. |
Generalizability | |
Can the results from the KEYNOTE-859 trial be generalizable to patients with the following, thereby allowing them to be eligible for treatment with pembrolizumab with chemotherapy?
| Patients with untreated CNS metastases and those with an ECOG PS of more than 1 were excluded from the KEYNOTE-859 trial. According to the clinical experts consulted for this review, results from the KEYNOTE-859 trial may be generalized to patients with an ECOG PS of more than 1, and to patients with controlled CNS metastases. |
Funding algorithm (oncology only) | |
How does pembrolizumab plus chemotherapy compare with nivolumab plus chemotherapy? | The sponsor-submitted indirect treatment comparisons suggested that there may to be little to no difference in efficacy outcomes between pembrolizumab plus chemotherapy and nivolumab plus chemotherapy in the patient population under review. The clinical experts stated that they would use both pembrolizumab plus chemotherapy and nivolumab plus chemotherapy in their clinical practice. They noted that factors such as the cost of treatment and alignment with the chosen backbone chemotherapy scheduling may influence a clinician’s decision to use pembrolizumab over nivolumab. |
Care provision issues | |
Are PD-L1 CPS testing and MSI testing required to determine eligibility for treatment with pembrolizumab plus chemotherapy? | The clinical experts indicated that PD-L1 CPS and MSI testing should not be required to determine eligibility for treatment with pembrolizumab in plus chemotherapy in this patient population. |
CDA-AMC = Canada's Drug Agency; CNS = central nervous system; CPS = combined positive score; dMMR = mismatch repair deficiency; ECOG PS = Eastern Cooperative Oncology Group Performance Status; FOLFIRI = 5-fluorouracil plus leucovorin plus irinotecan; GEJ = gastroesophageal junction; MSI = microsatellite instability; MSI-H = microsatellite instability-high; PAG = Provincial Advisory Group; PD-L1 = programmed death 1 ligand 1; pERC = pan-Canadian Oncology Drug Review expert review committee.
Clinical Evidence
The objective of this Clinical Review Report is to review and critically appraise the clinical evidence submitted by the sponsor on the beneficial and harmful effects of pembrolizumab 100 mg/4 mL solution for infusion in combination with fluoropyrimidine and platinum–containing chemotherapy in the first-line treatment of locally advanced, unresectable, or metastatic HER2-negative gastric or GEJ adenocarcinoma in adult patients. The focus will be placed on comparing pembrolizumab in combination with fluoropyrimidine and platinum–containing chemotherapy to relevant comparators and on identifying gaps in the current evidence.
A summary of the clinical evidence included by the sponsor in the review of pembrolizumab is presented in 4 sections, with the review team’s critical appraisal of the evidence included at the end of each section. The first section, the Systematic Review, includes pivotal studies and RCTs that were selected in accordance with the sponsor’s systematic review protocol. The review team’s assessment of the certainty of the evidence in this first section, using the GRADE approach, follows the critical appraisal of the evidence. Section 3 includes the sponsor’s ITC of pembrolizumab and other fluoropyrimidine and platinum–containing chemotherapies used in Canada. There were no long-term extension studies (Section 2) nor additional studies to address important gaps in the systematic review evidence (Section 4) submitted by the sponsor.
Included Studies
Clinical evidence from the following are included in the review and appraised in this document:
Systematic Review
The contents of this section have been informed by materials submitted by the sponsor. The following information has been summarized and validated by the clinical review team.
Description of Studies
Characteristics of the included study are summarized in Table 5.
Table 5: Details of the Study Included in the Systematic Review
Detail | KEYNOTE-859 |
|---|---|
Designs and populations | |
Study design | Multicentre, parallel-group, double-blind, placebo-controlled and active-controlled, phase III RCT |
Locations | 215 sites in 33 countries in Asia, Australia, Europe, North America (including Canada), Oceania, and South America |
Patient enrolment dates | Start date: November 8, 2018 End date: June 11, 2021 |
Randomized (N) | N = 1,579
|
Inclusion criteria |
|
Exclusion criteria |
|
Drugs | |
Intervention | Pembrolizumab: 200 mg IV on day 1 of each 3-week cycle for up to 35 cycles In combination with: 5-Fluorouracil: 800 mg/m2 IV on day 1 to day 5 of each 3-week cycle for up to 35 cycles AND Cisplatin: 80 mg/m2 IV on day 1 of each 3-week cycle for up to 35 cycles (may be capped at 6 cycles, per local country guidelines) OR Capecitabine: 1,000 mg/m2 orally twice daily on day 1 to day 14 of each 3-week cycle for up to 35 cycles AND Oxaliplatin: 130 mg/m2 IV on day 1 of each 3-week cycle for up to 35 cycles (may be capped at 6 cycles, per local country guidelines) |
Comparator(s) | Placebo: 200 mg IV on day 1 of each 3-week cycle for up to 35 cycles In combination with the same combination of drugs as in the intervention group |
Study duration | |
Screening phase | Approximately 28 days. |
Treatment phase | Up to 35 cycles or until disease progression, unacceptable toxicity, investigator decision, withdrawal of consent, or other reasons (noncompliance with study treatment or procedure requirements, prohibited concomitant medication requiring withdrawal, interruption of pembrolizumab treatment lasting more than 12 consecutive weeks, confirmed positive serum pregnancy test, or recurrent grade 2 pneumonitis). |
Follow-up phase | Every 6 weeks (± 7 days) by imaging until the start of a new anticancer therapy, disease progression, death, withdrawal of consent, pregnancy, the end of the study, or the participant begins re-treatment with pembrolizumab, to monitor disease status. |
Survival follow-up | Every 12 weeks to assess for survival status until death, explicit withdrawal of consent for survival follow-up, or the end of the study, whichever occurs first. |
Safety follow-up | Approximately 30 days after the last dose of the study intervention or before the initiation of a new anticancer treatment, whichever comes first. |
PRO follow-up | Before dosing at cycle 1, cycle 2, cycle 3, cycle 4, cycle 5, and every 2 cycles thereafter (e.g., cycle 7, cycle 9, cycle 11), at the treatment discontinuation visit, and at the 30-day safety follow-up visit. |
Outcomes | |
Primary end point | Overall survival |
Secondary and exploratory end points | Secondary:
Exploratory:
|
Data cut-off dates | |
IA1 | October 3, 2022 |
Final analysis | To be conducted |
Publication status | |
Publications | Lowery et al. (2023)64 Rha et al. (2023)65 Clinicaltrials.gov: NCT0367573766 |
BICR = blinded independent central review; ECOG PS = Eastern Cooperative Oncology Group Performance Status; EORTC QLQ-C30 = European Organisation for Research and Treatment of Cancer Quality of Life Questionnaire Core 30; EORTC QLQ-STO22 = European Organisation for Research and Treatment of Cancer Quality of Life Questionnaire Stomach Cancer Module; EQ-5D-5L = 5 Level EQ-5D; GEJ = gastroesophageal junction; HRQoL = health-related quality of life; IA1 = first interim analysis; iRECIST = Response Evaluation Criteria in Solid Tumours Version 1.1 for immune-based therapeutics; MSI = microsatellite instability; ORR = objective response rate; PD-1 = program cell death 1 protein; PD-L1 = programmed cell death 1 ligand 1; PD-L2 = programmed cell death 1 ligand 2; PFS = progression-free survival; PRO = patient-reported outcome; RECIST = Response Evaluation Criteria in Solid Tumours Version 1.1.
Note: One additional report was included.67
Sources: Clinical Study Report for KEYNOTE-859,34 sponsor’s summary of clinical evidence.36
One sponsor-conducted trial was included in the systematic review: KEYNOTE-859.34,37 The KEYNOTE-859 study (NCT03675737) is an ongoing multicentre, placebo-controlled, double-blind, phase III RCT evaluating the efficacy and safety of adding pembrolizumab to chemotherapy for first-line therapy in adult patients with HER2-negative advanced gastric or GEJ adenocarcinoma.
A total of 1,579 patients with previously untreated, local advanced unresectable or metastatic HER2-negative (by central review), histologically or cytologically confirmed adenocarcinoma of the stomach or GEJ across 207 sites in 22 countries (North America, South America, Europe, Asia, Africa, and Oceania) were included in the trial. The KEYNOTE-859 trial included 18 (1.1%) patients at 4 study sites in Canada. HER2 status was confirmed at a central laboratory using the FDA-approved Dako (Agilent) HercepTest (IHC) and Dako (Agilent) HER2 IQFISH pharmDx Kit (Reflex FISH testing for HER2 IHC 2+ samples).2 Patients were randomly allocated, in a 1:1 ratio, to receive treatment with either pembrolizumab (200 mg every 3 weeks) or placebo, each in combination with the investigator’s choice of chemotherapy (FP or CAPOX). Randomization was performed centrally using an interactive response technology system, and patients were stratified by geographic region (Australia, Israel, North America, and Western Europe versus Asia versus the rest of the world), investigator’s choice of chemotherapy regimen (FP versus CAPOX), and PD-L1 expression at baseline (CPS ≥ 1 versus < 1). PD-L1 expression was determined at a central laboratory using the Agilent PD-L1 IHC 22C3 pharmDx kit.25 Pembrolizumab and placebo were prepared and dispensed in a blinded fashion by an unblinded pharmacist or by unblinded qualified study-site personnel. All patients and investigators who were involved in the administration or evaluation of the study treatment were unaware of group assignments. The expected study completion date is October 2024.
A schematic of the KEYNOTE-859 study design is presented in Figure 2. The results presented in this report are based on IA1, which had a data cut-off date of October 3, 2022.
Figure 2: Schematic of the KEYNOTE-859 Clinical Trial Design
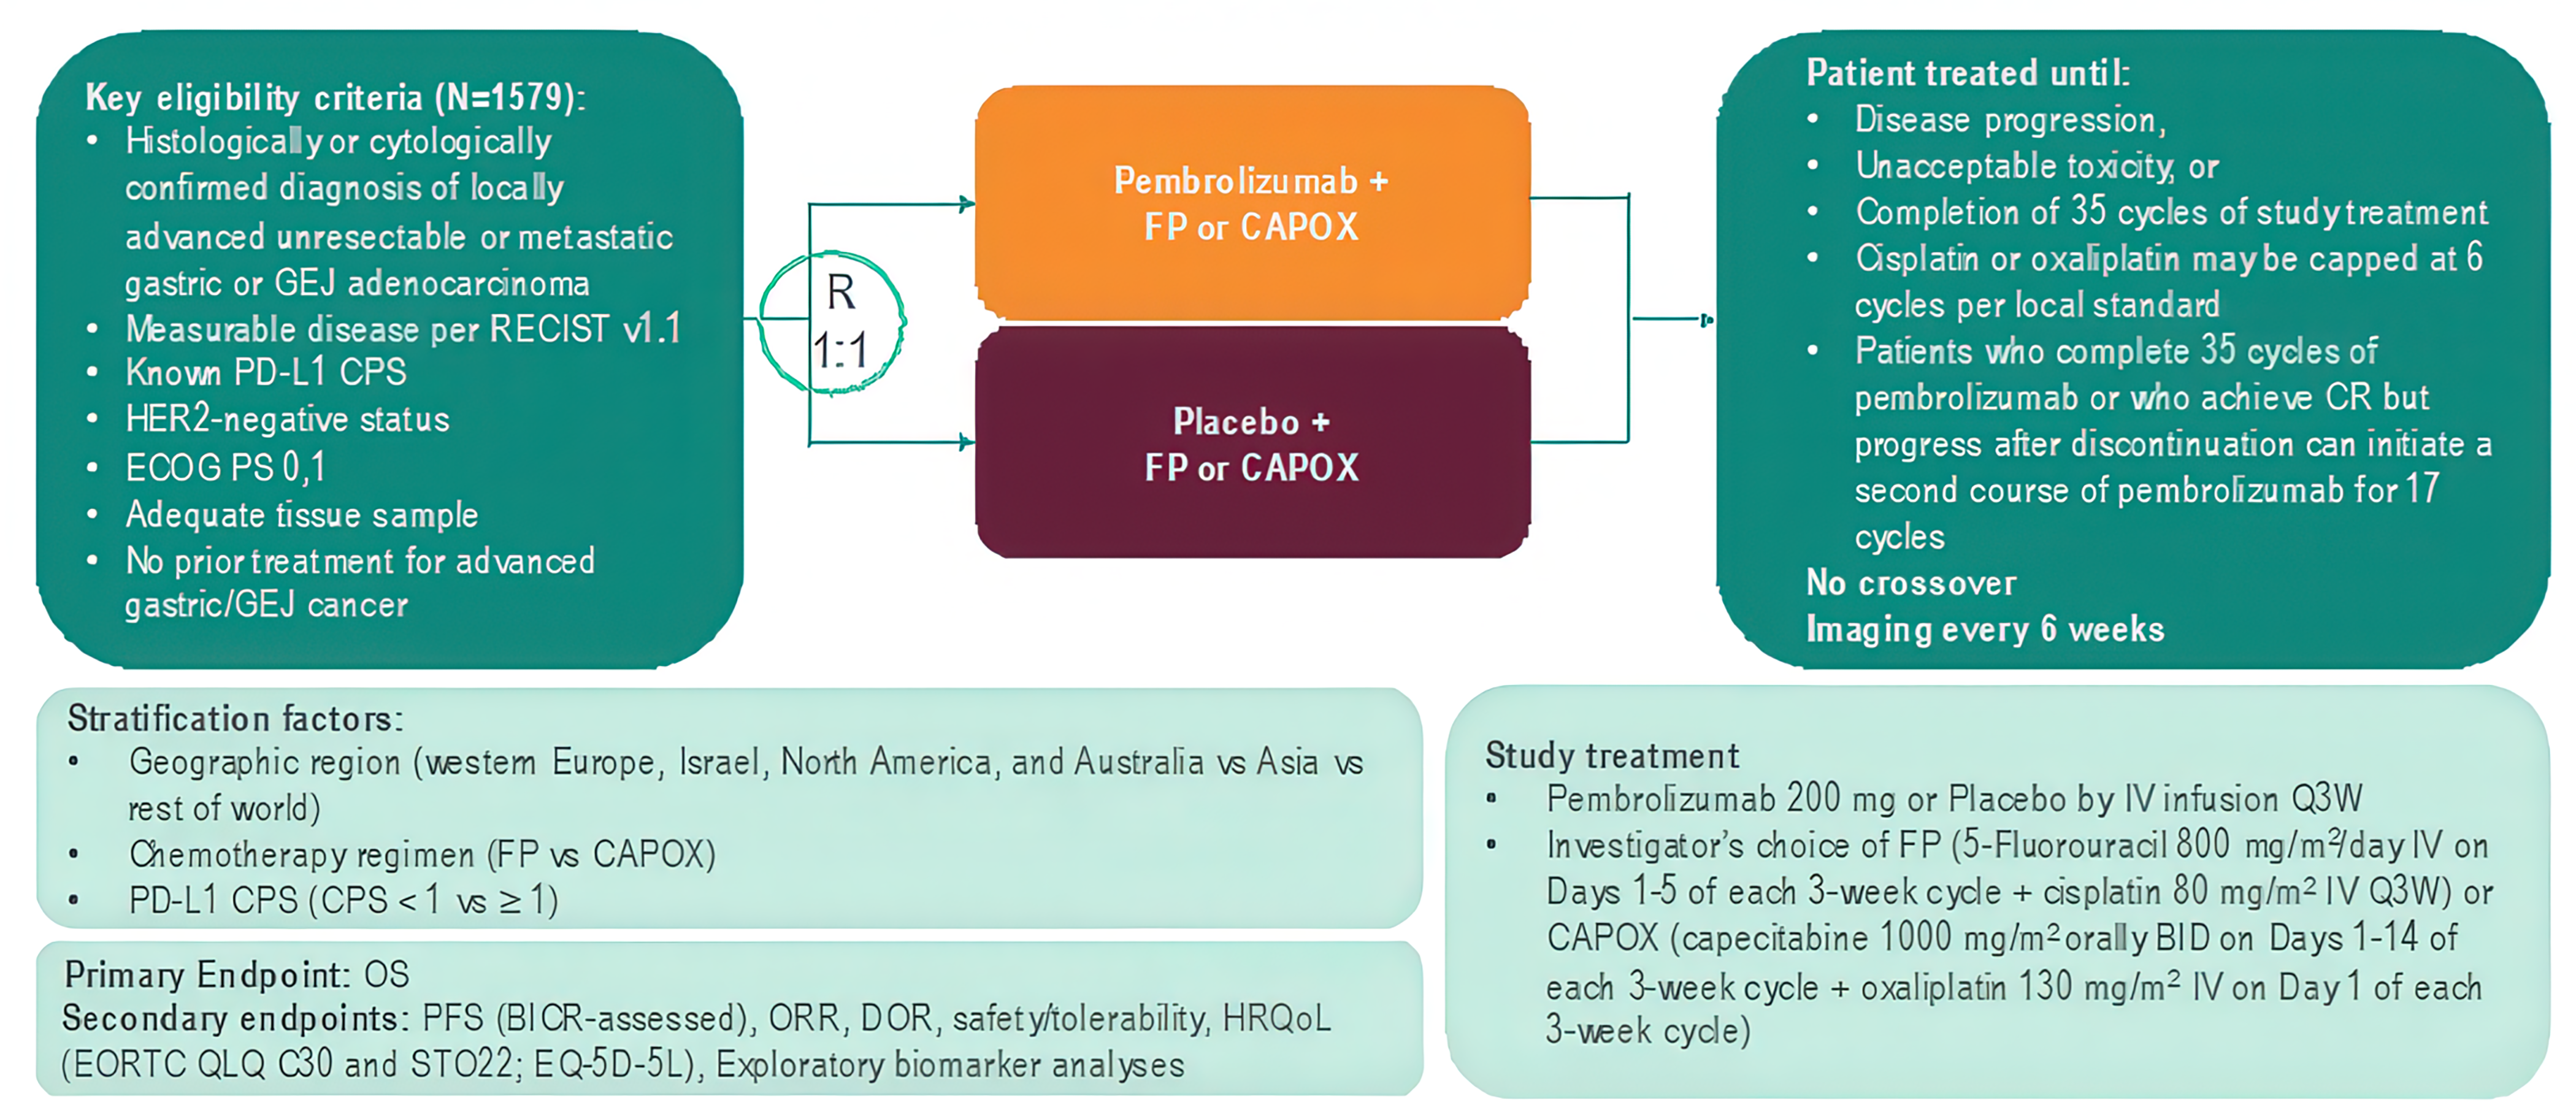
BICR = blinded independent central review; BID = twice daily; CAPOX = capecitabine plus oxaliplatin; CPS = combined positive score; CR = complete response; DOR = duration of response; ECOG PS = Eastern Cooperative Oncology Group Performance Status; EORTC QLQ C30 = European Organisation for Research and Treatment of Cancer Quality of Life Questionnaire Core 30; EQ-5D-5L = 5 Level EQ-5D; FP = 5-fluorouracil plus cisplatin; GEJ = gastroesophageal junction; HRQoL = health-related quality of life; ORR = overall response rate; OS = overall survival; PD-L1 = programmed cell death 1 ligand 1; PFS = progression-free survival; Q3W = every 3 weeks; RECIST v1.1 = Response Evaluation Criteria in Solid Tumours Version 1.1; STO22 = European Organisation for Research and Treatment of Cancer Quality of Life Questionnaire Stomach Cancer Module.
Sources: Study Protocol for KEYNOTE-859,68 additional information request.69
Protocol Amendments
The protocol for the KEYNOTE-859 trial was amended 6 times. At the time of Protocol Amendment 2 (Protocol 3475 to 859 to 02), the statistical analysis plan for the trial was updated to include PFS, OS, and ORR in patients with PD-L1 expression with a CPS of 10 or more, based on results with another trial of pembrolizumab.70 As a result, the target enrolment and duration of the study were updated. Protocol Amendment 3 (Protocol 3475 to 859 to 03) then updated the statistical analysis plan to move PFS objectives and hypotheses from the primary hypotheses to the secondary objectives, based on the CheckMate 64919 and ATTRACTION-471 studies. In addition, the target enrolment was increased to merge the population of mainland China into the global study. Other amendments were mostly administrative changes and clarifications and responses to regulatory input regarding safety monitoring procedures.
Populations
Inclusion and Exclusion Criteria
The key inclusion and exclusion criteria for the KEYNOTE-859 trial are summarized in Table 5. Briefly, patients eligible for inclusion were adults 18 years or older with previously untreated, locally advanced, unresectable, or metastatic HER2-negative gastric or GEJ adenocarcinoma. HER2 status was determined by IHC or in situ hybridization, assessed by central review on the primary or metastatic tumour. Additional eligibility criteria included having measurable disease in accordance with RECIST 1.1; an ECOG PS of 0 or 1; and a tumour sample for PD-L1 and MIS testing.
Interventions
Pembrolizumab
Patients randomized to the active treatment group received pembrolizumab 200 mg by IV infusion on day 1 of each 3-week cycle in combination with the physician’s choice of fluoropyrimidine and platinum–containing chemotherapy backbone of either:
FP — cisplatin 80 mg/m2 IV over 60 minutes on day 1 of each 21-day treatment cycle (every 3 weeks) plus 5-FU 800 mg/m2 per day IV over 120 hours from day 1 to day 5 of each 21-day treatment cycle
OR
CAPOX — oxaliplatin 130 mg/m2 IV over 120 minutes on day 1 of each 21-day treatment cycle (every 3 weeks) plus capecitabine 1,000 mg/m2 by oral administration twice a day on day 1 to day 14 of each 21-day treatment cycle.
Pembrolizumab was administered with chemotherapy when both were given on the same day.
Pembrolizumab was administered until disease progression, completion of 2 years of therapy (35 cycles of every 3 weeks), or intolerance developed. Participants who had evidence of disease progression on imaging and were clinically stable could continue to be treated at the discretion of the investigator. If toxicity occurred and was clearly attributed to 1 drug, that drug alone may be discontinued.
Placebo
Patients randomized to the control group received a saline placebo infusion day 1 of each 3-week cycle in combination with the physician’s choice of fluoropyrimidine and platinum–containing chemotherapy backbone, as described in the preceding section.
Dose Modification and Interruption
Dose reductions of pembrolizumab were not permitted; however, treatment with both pembrolizumab and chemotherapy could be interrupted or discontinued due to toxicity. In the event that a pembrolizumab interruption or discontinuation was warranted, the process was conducted in accordance with the procedures for recommended dose modifications outlined in the product monograph.
Dose modification of the other combination drugs was permitted under the following conditions:
Treatment for each new cycle may be delayed if the scheduled off-drug periods are not adequate to allow for recovery to the guideline threshold for restarting each study treatment.
If a dose reduction for toxicity occurs with any drug, the dose may not be re-escalated.
Patients can have a maximum of 3 dose modifications to oxaliplatin, 5-FU, and cisplatin throughout the course of the study. If a patient experiences several toxicities and there are conflicting recommendations, the most conservative dose adjustment recommended (dose reduction appropriate to the most severe toxicity) is followed.
Reduction of 1 chemotherapy drug and not the other drug is appropriate if, in the opinion of the investigator, the toxicity is clearly related to 1 of the treatments. If, in the opinion of the investigator, the toxicity is related to the combination of both chemotherapy drugs, both drugs may be reduced according to recommended dose modifications. If the toxicity is related to the combination of 3 drugs, chemotherapy may be reduced, interrupted, or discontinued.
Patients in both study groups may have their chemotherapy discontinued and continue to receive pembrolizumab or saline placebo.
Discontinuation
Patients might discontinue 1 or more of the study treatments for any of the following reasons but continue to be monitored in the study:
the patient or patients’ legally acceptable representative asks that the study intervention be discontinued
unacceptable AEs
interruption of pembrolizumab administration for more than 12 consecutive weeks
a medical condition or personal circumstance, which, in the opinion of the investigator and/or sponsor, places the patient at unnecessary risk from continued administration of the study intervention
the patient has a confirmed positive serum pregnancy test
the use of a concomitant medication requires withdrawal
confirmed radiographic disease progression
any progression or recurrence of any malignancy, or the occurrence of another malignancy that requires active treatment
recurrent grade 2 pneumonitis
the discontinuation of treatment can be considered for patients who attain a confirmed complete response (CR) and have been treated for at least 8 cycles (at least 24 weeks), receiving 2 cycles of the combination (including 2 doses of pembrolizumab or matching placebo) and at least 80% of the planned doses of combination chemotherapy beyond the date when the initial CR was declared
completion of 35 treatments (approximately 2 years) with pembrolizumab.
Discontinuation from any study intervention was considered permanent. Once treatment was discontinued, restarting the study intervention was not permitted.
Concomitant Medications and Therapies
All treatments that the investigator considered necessary for a patient’s welfare were administered at the discretion of the investigator, in keeping with the community standards of medical care.
Prohibited Concomitant Medications
The following concomitant medications were prohibited during the study period:
anticancer immunotherapy, chemotherapy, or biological therapy not specified in this protocol.
investigational drugs other than pembrolizumab.
radiation therapy.
live vaccines administered in the 30 days before the first dose of the study treatment or any time during the study.
systemic glucocorticoids for any purpose other than to modulate symptoms from an event of clinical interest that is suspected to have an immunologic etiology. Inhaled or topical steroids were allowed, and systemic steroids at doses equal to or less than 10 mg/day of prednisone or equivalent were allowed.
for patients receiving 5-FU, S-1 or capecitabine, brivudine, sorivudine analogues, or other inhibitors of the enzyme dihydropyrimidine dehydrogenase.
for patients receiving cisplatin, phenytoin was not to be started.
Patients who, in the assessment of the investigator, required the use of any of the concomitant treatments for clinical management were removed from the study, unless otherwise specified.
Concomitant Medications to Be Used With Caution
Cimetidine, metronidazole, and interferons were permitted to be used with caution, as these may increase levels of 5-FU. Patients receiving phenytoin in conjunction with 5-FU were examined regularly to monitor for a potential elevation in phenytoin plasma levels. Hepatotoxic effects (rises in alkaline phosphatase, transaminase, or bilirubin levels) are commonly observed in patients being treated with 5-FU and levamisole.
Rescue Medications and Supportive Care
Patients were instructed to stay well hydrated while taking cisplatin. Prevention and the treatment of nausea in patients taking cisplatin were managed with fosaprepitant 150 mg IV or an oral aprepitant 3-day regimen (125 mg day 1, 80 mg day 2, and 80 mg day 3), in combination with palonosetron 0.25 mg IV. In addition, nausea could be managed with ondansetron 8 mg twice a day, or with prochlorperazine 10 mg 3 to 4 times per day.
The use of steroids for cisplatin-associated antiemetic support was allowed in accordance with National Comprehensive Cancer Network or institutional guidelines. However, caution was taken to prevent the overuse of steroids.
All patients received the supportive care measures deemed necessary by the treatment investigator. Supportive care with trastuzumab, 5-FU, capecitabine, and oxaliplatin was in accordance with the product label or local SOC.
Subsequent Therapy
There was no per-protocol crossover and no study-specific treatment after the end-of-study treatment. However, second-course treatment was permitted under specific circumstance. Patients who stopped pembrolizumab treatment after 35 administrations with stable disease or better and those who achieved a CR and stopped pembrolizumab treatment after receiving at least 8 cycles in total (including a minimum of 2 cycles beyond the date when the initial CR was declared) could be eligible for up to 1 year of pembrolizumab re-treatment (17 cycles of 200 mg 3 times a week) upon experiencing disease progression, if they had been randomized to the pembrolizumab arm.
Outcomes
The primary efficacy end point in the KEYNOTE-859 trial was OS. Secondary end points were PFS, ORR and duration of response per RECIST 1.1 by BICR, and harms outcomes. Exploratory end points included in the following HRQoL measures: EORTC QLQ-C30, EORTC QLQ-STO22, and the EQ-5D-5L.
A list of efficacy end points assessed in this Clinical Review Report is provided in Table 6. The summarized end points are based on outcomes included in the sponsor’s summary of clinical evidence, as are any outcomes identified as important to this review by the clinical experts consulted for the purpose of this review and the input from patient and clinician groups and public drug plans. Using the same considerations, the review team selected end points that were considered to be most relevant to CDA-AMC expert committee deliberations and finalized this list of end points in consultation with members of the expert committee. All summarized efficacy end points were assessed using GRADE. Based on input from the clinical experts consulted for the purpose of this review, OS was deemed to be the most clinically meaningful outcome for this patient population. PFS was a key input in the sponsor’s pharmacoeconomic model. Accordingly, PFS was included in the clinical report. Patient-reported outcomes that reflected a patient’s HRQoL were considered to be the second most important outcome by the clinical experts consulted on this review, and were considered important by both the patient and clinician groups. Based on input from the clinical experts, of the multiple domains captured by the EORTC QLQ-C30 and EORTC QLQ-STO22, the global health status/QoL scale, the nausea/vomiting symptom scale, and the pain scale were most relevant to patients with GEJ adenocarcinoma and were assessed using GRADE. The following notable harms were recognized as important based on the product monograph and by the clinical experts consulted on this review: immune-mediated AEs, and grade 3 or higher immune-mediated AEs.
Table 6: Outcomes Summarized From the KEYNOTE-859 Study
Outcome measure | Time point | Type |
|---|---|---|
OS | At month 12 and month 30 | Primarya |
PFS per RECIST 1.1 by BICR | At month 12 and month 30 | Secondarya |
Harms outcome (AEs, SAEs, WDAEs, mortality, notable harms) | At the time of data cut-off | Secondary |
EORTC QLQ-C30
| At week 18 | Exploratory |
EORTC QLQ-STO22
| At week 18 | Exploratory |
AE = adverse event; BICR = blinded independent central review; EORTC QLQ C30 = European Organisation for Research and Treatment of Cancer Quality of Life Questionnaire Core 30; EORTC QLQ-STO22 = European Organisation for Research and Treatment of Cancer Quality of Life Questionnaire Stomach Cancer Module; OS = overall survival; PFS = progression-free survival; RECIST 1.1 = Response Evaluation Criteria in Solid Tumours Version 1.1; SAE = serious adverse event; WDAE = withdrawal due to adverse event.
Note: The data cut-off date was October 3, 2022.
aStatistical testing for these end points was adjusted for multiple comparisons (e.g., hierarchal testing).
Sources: Clinical Study Report for KEYNOTE-859,34 protocol for KEYNOTE-859,68 Rha et al. (2023),65 sponsor’s summary of clinical evidence.36
Overall Survival
OS was the primary efficacy end point in the KEYNOTE-859 trial. OS was assessed from the time of randomization to death due to any cause. Participants without documented death at the time of analysis were censored at the date of last contact. Based on input from the clinical experts consulted on this review, a 5% to 10% improvement in survival at any time point would be considered clinically meaningful.
Progression-Free Survival
PFS was a secondary efficacy end point in the KEYNOTE-859 trial. PFS was assessed from the time of randomization until the first documented disease progression per RECIST 1.1 assessed by BICR, or death due to any cause, whichever occurred first. The date of progressive disease was approximated as the date of the first assessment at which progressive disease was objectively documented per RECIST 1.1 by BICR. The censoring rules for the primary analysis were applied under specific situations, as follows:
In the event of progressive disease or death documented after no or 1 missed disease assessment and before new anticancer therapy, censoring occurred at the date of documented progressive disease or death.
In the event of progressive disease documented immediately after 2 or more consecutive missed disease assessments or after anticancer therapy, censoring occurred at the last disease assessment before the earlier date of 2 or more consecutive missed disease assessments and new anticancer therapy, if any.
In the event of no progressive disease, no death, and no initiation of new anticancer treatment, censoring occurred at the last disease assessment.
The clinical experts consulted on this review viewed OS as the most important outcome and were not able to suggest what between-group difference in PFS would be considered clinically important.
Health-Related Quality of Life
The psychometric properties of the EORTC QLQ-C30 and EORTC QLQ-STO22 are summarized in Table 7.
The EORTC QLQ-C30 is a cancer-specific HRQoL tool that uses a 1-week recall period to assess self-reported function and symptoms. The tool consists of 30 items, assessing 5 functional dimensions (physical function, role function, emotional function, cognitive function, and social function), 3 symptom item (fatigue, nausea or vomiting, and pain), a global health status/QoL scale, and 5 single-item measures assessing additional symptoms commonly experienced by patients with cancer (i.e., dyspnea, loss of appetite, insomnia, constipation, and diarrhea).26,27 Patients have 4 response options to choose from on the scales (not at all, a little, quite a bit, very much), with scores ranging from 1 to 4. For the 2 items that form the global health status/QoL scale, responses were recorded on 7-point Likert-type scales, with anchors of 1 (very poor) and 7 (excellent).27 Higher scores were indicative of better functioning on the function scales, more severe symptoms on the symptom scales, and better QoL. An MID in patients with esophageal or gastric cancer was not identified. Between-group differences in MID for improvement and deterioration ranged from 5 to 10 points among patients with various other cancer types (i.e., brain, colorectal, advanced breast, head and/or neck, lung, mesothelioma, melanoma, ovarian, and prostate).72 Based on input from the clinical experts consulted for the purpose of this review, the global QoL scale, physical functioning, and appetite loss scale were most relevant to this patient population. Ranges estimated to represent MIDs for improvement and deterioration in these scores were as follows: 3 to 9 points for improvement and –4 to –13 points for deterioration on the global QoL scale; 4 to 7 points and –4 to –10 points, respectively, on the physical functioning scale; and 6 to 13 points and –5 to –9 points, respectively, on the appetite loss scale.72
The EORTC QLQ-STO22 is an HRQoL measure that is specific to gastric cancer.28 The questionnaire consists of 22 items that address symptoms of dysphagia (4 items), pain or discomfort (3 item), upper GI symptoms (3 items), eating restrictions (5 items), emotional function (3 items), and dry mouth, hair loss, body image, and problems with taste. During a 1-week recall period, patients rate each item on a scale of 1 (not at all) to 4 (very much). Scale items are scored and interpreted as described for EORTC QLQ-C30. An MID for patients with esophageal or gastric cancer was not identified.
All HRQoL questionnaires were administered by trained site personnel and were completed electronically by patients at each 3-week treatment cycle up to cycle 5, every 2 cycles thereafter up to a year or the end of treatment, whichever comes first, and then at the 30-day posttreatment discontinuation follow-up visit. At each assessment, the HRQoL questionnaires were administered in the following order: EQ-5D-5L first, then EORTC QLQ-C30 and EORTC QLQ-STO22 before drug administration, AE evaluation, and disease status notification.
The sponsor defined overall improvement as a 10-point or more increase in score (in the positive direction) from baseline at any time during the study, confirmed with a 10-point or more improvement at a visit scheduled at least 6 weeks later. When the criteria for improvement were not met, the sponsor defined stability as a less than 10-point worsening in score from baseline at any time during the study, confirmed with a less than 10-point worsening at a visit scheduled at least 6 weeks later. The sponsor used the composite of improvement and stability to denote overall improvement and stability. For time to deterioration in HRQoL, patients without deterioration on the date of the last evaluation (ongoing or discontinued) were censored at the time of the last assessment. Patients without baseline assessments were censored at the treatment start date.
Harms
An AE, irrespective of cause, was recorded from the time of treatment randomization through 30 days after the last dose of the study treatment or before the initiation of a new anticancer treatment, whichever occurred first. SAEs were recorded from the time of treatment randomization through 90 days after the last dose of the study treatment or 30 days after discontinuation of the study if the patient initiated a new anticancer treatment, whichever occurred first. SAEs were AEs that resulted in death or were life-threatening, those that required inpatient hospitalization or prolongation of existing hospitalization, and those that resulted in persistent or significant disability and/or incapacity, congenital anomaly and/or birth defect, or other important medical events. The intensity of AEs and SAEs was assessed by the investigator, in accordance with the National Cancer Institute Common Terminology Criteria for Adverse Events (CTCAE), version 4.03. Withdrawals due to adverse events were withdrawals from study treatment (permanent discontinuation of the study treatment) due to any study-intervention-related toxicity that were specified as a reason for permanent discontinuation, as defined in the guidelines for dose modification due to AEs. Mortality included grade 5 AEs leading to death. The following notable harms were of interest to the clinical review team: immune-mediated AEs, and grade 3 or higher immune-mediated AEs.
Table 7: Summary of Outcome Measures and Their Measurement Properties
Outcome measure | Type | Conclusions about measurement properties | MID |
|---|---|---|---|
EORTC QLQ-C30 | EORTC QLQ-C30 is an instrument designed to measure the self-reported HRQoL of patients with cancer. The EORTC QLQ-C30 consists of 30 items that measures 5 functional dimensions (physical, role, emotional, cognitive, and social), 3 symptom items (fatigue, nausea/vomiting, and pain), 6 single items (dyspnea, sleep disturbance, appetite loss, constipation, diarrhea, and financial impact), and a global health and QOL scale.73,74 For each scale, the final scores are transformed to range from 0 to 100, with higher scores indicating greater functioning, better QoL, or more severe symptoms. | Validity: In 98 patients with esophageal cancer receiving palliative treatment, the EORTC QLQ-C30 was shown to have moderate item-scale convergent validity (r > 0.40) for all items.75 In 98 patients with esophageal, esophagogastric junction, or gastric cancer, the Polish version of the EORTC QLQ-C30 was shown to have acceptable item-scale convergent (r > 0.40) and divergent (r < 0.4) validity in items related and unrelated to their scales, respectively.76 It was shown that the EORTC QLQ-C30 and EORTC QLQ-OG25 (Esophago-Gastric Module) had low correlations, except for items with clinical overlap (data not reported). In subgroups of patients (esophagus vs. stomach cancers), the following scales and single items of the EORTC QLQ-C30 were distinguished by different clinical status: global health status/QoL, physical functioning scale, fatigue, pain, dyspnea, insomnia, and appetite loss. In the subgroup of different treatment types (curative vs. palliative), no such difference was noted.77 Reliability: In patients with esophageal or gastric cancer, the EORTC QLQ-C30 was shown to have acceptable internal consistency (Cronback alpha ranged from 0.61 [cognitive scale] to 0.86 [fatigue scale]) and acceptable reliability based on test-retest conducted 2 weeks apart (ICC range, 0.82 to 0.91).75,77 Responsiveness: Measures of responsiveness in patients with esophageal and esophagogastric cancers were not identified. | MID was not identified for patients with esophageal or gastric cancer. Various cancers72 Between-group differences in MID for improvement and deterioration ranged from 5 to 10 points on most scales:
|
EORTC QLQ-STO22 | The EORTC QLQ-STO22 module supplements the EORTC QLQ-C30 assessment of disease-specific HRQoL and specific symptoms that may occur during chemotherapy or radiation treatment in patients with gastric cancers.78 The EORTC QLQ-STO22 consists of 22 items:
Patients are asked to rate each item on a scale of 1 (not at all) to 4 (very much) during a 1-week recall period. All scales and single-item measures are transformed to a range from 0 to 100, with higher scores indicating a more severe impact on HRQoL.78,79 | The psychometric properties of the EORTC QLQ-STO22 module were assessed in an international study of 219 patients with gastric cancer undergoing a variety of curative and/or palliative treatment modalities, as well as best supportive care.78 Validity: Most items were weakly correlated with the EORTC QLQ-C30 scales, except for the dysphagia, eating restrictions, and gastric pain scales, which were moderately correlated with the EORTC QLQ-C30 (data not reported). Items within their own scale demonstrated convergent validity (r = 0.6 to 0.88), whereas they showed divergent validity with other scales (r = 0.22 to 0.70). Clinically distinct groups based on Karnofsky score and treatment intent (curative vs. palliative) are differentiated using the dysphagia, pain, eating scales, as well as the dry mouth, taste, and body image items (P < 0.05). Reliability: Acceptable internal consistency has been demonstrated (Cronbach alpha > 0.7). Test-retest study showed higher reproducibility (ICC > 0.7) for the pain, eating restrictions, and anxiety scales and other single items related to the dysphagia (ICC = 0.6) and reflux (ICC = 0.63) scales.78 Responsiveness: Responsiveness to treatment over time has been demonstrated on the eating scale, as well as on the taste and body image items in a surgery cohort, whereas responsiveness was noted in taste and hair loss items in a palliative cohort (P < 0.05).78 | MID was not identified for patients with esophageal or gastric cancer. |
EORTC QLQ C30 = European Organisation for Research and Treatment of Cancer Quality of Life Questionnaire Core 30; EORTC QLQ-STO22 = European Organisation for Research and Treatment of Cancer Quality of Life Questionnaire Stomach Cancer Module; HRQoL = health-related quality of life; ICC = interclass coefficient; MID = minimal important difference; QoL = quality of life; vs. = versus.
Statistical Analysis
Sample Size Determination
The plan in the KEYNOTE-859 trial was to randomize 1,579 patients, in a 1:1 ratio, to 1 of the 2 treatment groups.
For the OS efficacy analysis, with 1,358 OS events expected at the time of final analysis (approximately 45 months), the study is powered at approximately 84% to detect an HR of 0.83 in all patients at an initially assigned 0.008 (1-sided) significance level.
For the OS efficacy analysis, the following applied to each of the PD-L1 expression subgroups of interest:
With 1,057 OS events expected, the study is powered at approximately 90% to detect an HR of 0.81 in patients whose tumours have a PD-L1 CPS of 1 or more at an initially assigned 0.017 (1-sided) significance level.
With 463 OS events expected, the study is powered at approximately 87% to detect an HR of 0.73 in patients whose tumours have a PD-L1 CPS of 10 at a an initially assigned 0.017 (1-sided) significance level.
For the PFS efficacy analysis, with 1,407 PFS events expected at the time of final analysis, the study is powered at approximately 98% to detect an HR of 0.80 in all patients at an initially assigned 0.025 (1-sided) significance level.
For the PFS efficacy analysis, the following applied to each of the PD-L1 expression subgroups of interest:
With 1,095 PFS events expected, the study is powered at approximately 99% to detect an HR of 0.78 in patients whose tumours have a PD-L1 CPS of 1 or more at an initially assigned 0.025 (1-sided) significance level.
With 478 PFS events expected, the study is powered at approximately 99% to detect an HR of 0.68 in patients whose tumours have a PD-L1 CPS of 10 at a an initially assigned 0.025 (1-sided) significance level.
Planned Analyses
Interim and Final Analyses
The statistical plan specified the performance of 1 interim analysis (IA1) and a final analysis:
For IA1, an interim efficacy analysis was performed for OS in patients with a PD-L1 CPS of 10 or more, a PD-L1 CPS of 1 or more, and in all patients.
For the final efficacy analysis, PFS and objective response rate were assessed.
IA1 was to be performed when approximately 403 OS events had occurred in patients with a PD-L1 tumour expression CPS of 10 or more and approximately 12 months had passed after the last patient was randomized. If OS events accrued slower than expected (fewer than 1,187 OS events in all patients), then IA1 could be delayed up to 2 months or until the targeted OS events were reached, whichever occurred first.
The purpose of the final efficacy analysis was to assess OS in patients with a PD-L1 CPS of 10 or more, PD-L1 CPS of 1 or more, and in all patients.
The final analysis is expected to be performed after approximately 463 events had occurred in patients with a PD-L1 tumour expression CPS of 10 or more and approximately 23 months had passed after the last patient was randomized. If OS events accrued slower than expected (fewer than 1,358 OS events in all patients), the final analysis could be delayed for up to 2 months of additional follow-up or until the targeted OS events were reached, which occurred first, per protocol.
Control of Type I Error
An extension of the Maurer and Bretz80 approach was used to control for multiple hypotheses. The overall type I error across all hypotheses, IA1, and the final analysis were controlled at 2.5% (1-sided). Study hypotheses were tested in sequential order, and when a particular null hypothesis was rejected, the unused alpha allocated to that hypothesis was reallocated to the other hypothesis tests. OS was tested at IA1. If the null hypotheses of OS in the intention-to-treat population, the subgroup with a PD-L1 CPS of 1 or more, and the subgroup with a PD-L1 CPS of 10 or more were rejected, then PFS and objective response rate were tested. The testing order and initial 1-sided alpha allocation for each hypothesis are illustrated in Figure 3.
Figure 3: Multiplicity Graph for Type I Error Control of the Study Hypotheses
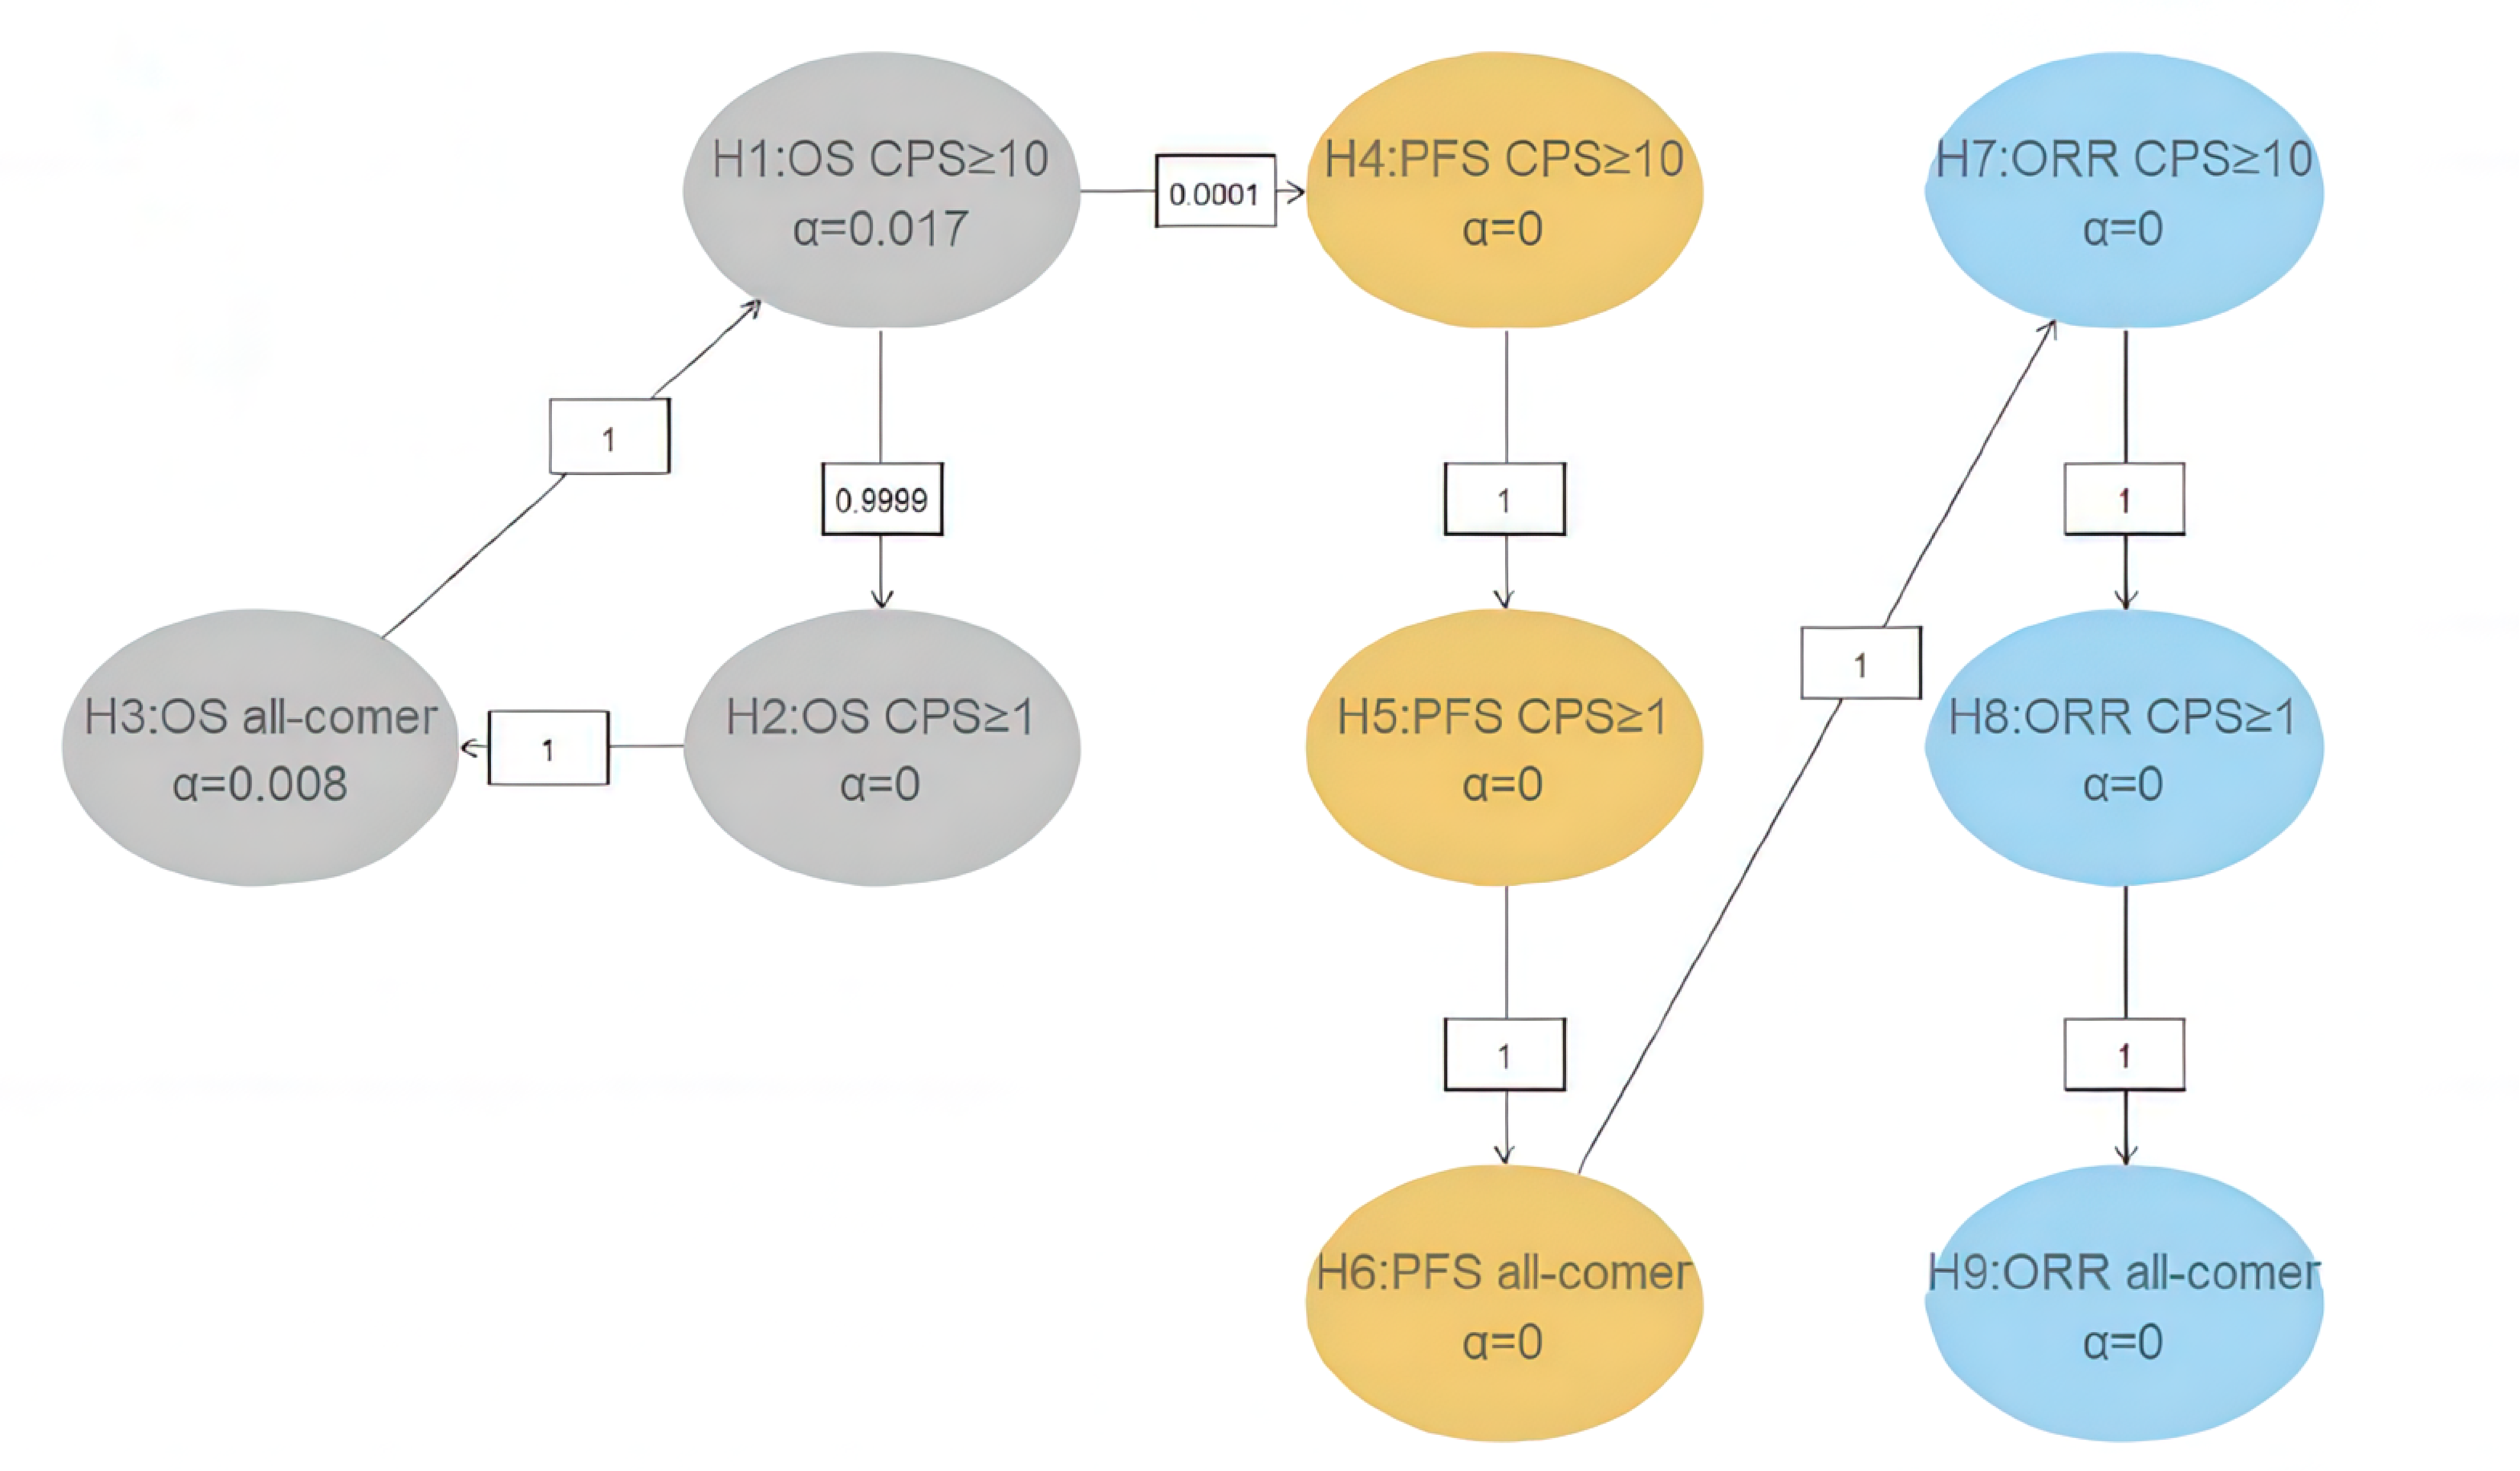
CPS = combined positive score; ITT = intention to treat; ORR = objective response rate; OS = overall survival; PD-L1 = programmed cell death 1 ligand 1; PFS = progression-free survival.
Note: If all OS (H1, H2, and H3) and 2 null hypotheses are rejected at the final analysis, the relocation strategy allows the testing of PFS and ORR at an alpha level of 0.025, based on the P value at interim analysis.
Source: Protocol for KEYNOTE-859.68
Statistical Methods
A summary of the statistical analyses employed in the KEYNOTE-859 trial is presented in Table 8.
OS and PFS
OS and PFS were estimated and plotted using a nonparametric Kaplan-Meier method. The treatment difference was assessed with a stratified log-rank test, and a stratified Cox proportional hazards model with the Efron method of tie handling was used to assess the magnitude of the treatment difference. Geographic region, PD-L1 status, and chemotherapy regimen were used as stratification factors. The HR and 95% CI from the Cox model, with the Efron method of tie handling and with a single covariate, was reported. An examination of the plausibility of the proportional hazards assumption of the Cox model was planned using the Cox regression model with treatment and treatment by time interaction.
Health-Related Quality of Life
Compliance and completion rates were reported for all assessment time points from baseline up to week 18 for the HRQoL measures.
The completion rate of patients treated at a specific point of time was defined as the number of treatment patients who completed at least 1 item divided by the number of treatment patients in the patient-reported outcome population. Additionally, the compliance rate of eligible patients was defined as the number of patients treated who completed at least 1 item divided by the number of eligible patients who were expected to complete the assessment, not including patients missing by design (such as death, discontinuation, or translations not available).
To assess the treatment effects on the change in HRQoL score from baseline, a constrained longitudinal data analysis model described by Liang and Zeger81 was applied, with HRQoL score as the response variable, and treatment, time, treatment by time interaction, and stratification factors used for randomization as covariates. The treatment difference in terms of least squares mean change from baseline is estimated from this model, together with the 95% CI.
The number and proportion of patients who experienced deterioration, stability, or improvement in HRQoL from baseline to week 18, the time to deterioration, and the overall improvement rate were documented for the EORTC QLQ-C30 global health status/QoL scale, functioning scale, nausea/vomiting symptom scale, and the single item of appetite loss, and for the EORTC QLQ-STO22 symptom scale for pain.
Time to deterioration was estimated and plotted using the Kaplan-Meier method for each treatment group. The median time to deterioration and its 95% CI were determined from the Kaplan-Meier estimates, and the difference in time to deterioration was determined with the stratified log-rank test. A stratified Cox proportional hazards model with the Efron method of tie handling and with a single treatment covariate was used to assess the magnitude of the treatment difference (the HR). Geographic region, PD-L1 status, and chemotherapy regimen were used as stratification factors. The approach for time to deterioration assumed noninformative censoring. Patients who did not have deterioration on the last date of evaluation were censored.
The stratified Miettinen and Nurminen method was used for comparison of the overall improvement rate and the overall improvement and/or stability rate between the treatment groups. The difference in the overall improvement rate and its 95% CI from the stratified Miettinen and Nurminen method, with strata weighting by sample size, were reported. The stratification factors used for randomization were applied to the analysis. The point estimates of the overall improvement rate were determined for each treatment group, together with the 95% CI in which the exact binomial was calculated using the Clopper and Pearson method.
Subgroup Analysis
Unstratified subgroup analyses of OS were included in the KEYNOTE-859 trial to determine whether the treatment effect was consistent across groups. The following subgroups analyzed in the trial were of interest in this review:
MSI status (nonhigh versus other)
PD-1 tumour expression status (CPS < 1 versus CPS ≥ 1).
Table 8: Statistical Analysis of Efficacy End Points in the KEYNOTE-859 Trial
End point | Statistical model | Adjustment factors | Handling of missing data | Sensitivity analyses |
|---|---|---|---|---|
OS | Test: Stratified log-rank test Estimation: Stratified Cox proportional hazards model with the Efron method of tie handling | Cox regression model with the Efron method of tie handling, with treatment as a covariate stratified by:
| Censored at the last known alive date | None |
PFS per RECIST 1.1 as assessed by BICR | Test: Stratified log-rank test Estimation: Stratified Cox proportional hazards model with the Efron method of tie handling | Cox regression model with the Efron method of tie handling, with treatment as a covariate stratified by:
| Situation 1 PD or death documented after ≤ 1 missed disease assessments, and before new anticancer therapy, if any Primary analysis: Progressed at date of documented PD or death Situation 2 PD or death documented immediately after ≥ 2 consecutive missed disease assessments or after new anticancer therapy, if any Primary analysis: Censored at last disease assessment before the earlier date of ≥ 2 consecutive missed disease assessments or new anticancer therapy, if any Situation 3 No PD and no death; new anticancer treatment is not initiated Primary analysis: Censored at last disease assessment Situation 4 No PD and no death; new anticancer treatment is initiated Primary analysis: Censored at last disease assessment before new anticancer treatment | Situation 1 Sensitivity analysis 1: Progressed at date of documented PD or death Sensitivity analysis 2: Progressed at date of documented PD or death Situation 2 Sensitivity analysis 1: Progressed at date of documented PD or death Sensitivity analysis 2: Progressed at date of documented PD or death Situation 3 Sensitivity analysis 1: Censored at last disease assessment Sensitivity analysis 2: Progressed at treatment discontinuation for reasons other than complete response; otherwise censored at last disease assessment if still on study intervention or if study intervention was complete Situation 4 Sensitivity analysis 1: Censored at last disease assessment Sensitivity analysis 2: Progressed at date of new anticancer treatment |
Mean change from baseline across HRQoL outcomes | cLDA model | Covariates:
| Implicit in the model, with missing data treated as missing at random | None |
Time to deterioration in HRQoL | Stratified log-rank test and HR estimation using stratified Cox model with the Efron method of tie handling |
| Right censoring at the time of last assessment when ongoing or discontinued from study without deterioration, and right censoring at treatment start date when no baseline assessment available | None |
Overall improvement rate, overall improvement rate, and stability rate across HRQoL outcomes | Stratified Miettinen and Nurminen method |
| Patients with missing data were considered to have not achieved improvement or stability | None |
BICR = blinded independent central review; CAPOX = capecitabine plus oxaliplatin; cLDA = constrained longitudinal data analysis; CPS = combined positive score; FP = FP = 5-fluorouracil plus cisplatin; HR = hazard ratio; HRQoL = health-related quality of life; OS = overall survival; PD = progressive disease; PD-L1 = programmed cell death 1 ligand 1; PFS = progression-free survival; RECIST 1.1 = Response Evaluation Criteria in Solid Tumours Version 1.1
Sources: Clinical Study Report for KEYNOTE-859,34 protocol for KEYNOTE-859,68 Rha et al. (2023),65 sponsor’s summary of clinical evidence.36
Analysis Populations
A summary of the analysis sets used in the KEYNOTE-859 trial is presented in Table 9.
Table 9: Analysis Populations of the KEYNOTE-859 Trial
Population | Definition | Application |
|---|---|---|
ITT | All patients who were randomized, whether or not IMP was administered. Patient data were analyzed according to the treatment group to which they were randomized. | All efficacy analyses |
Safety population | All patients who were randomized participants and received at least 1 dose of study IMP. Patient data were analyzed according to the IMP they received. | All safety analyses |
PRO FAS | All patients who had completed at least 1 PRO assessment and received at least 1 dose of IMP. | All PRO analyses |
FAS = full analysis set; IMP = investigational medicinal product; ITT = Intention to treat; PRO = patient-reported outcome.
Sources: Clinical Study Report for KEYNOTE-859,34 sponsor’s summary of clinical evidence.36
Results
Patient Disposition
Patient disposition in the KEYNOTE-859 trial is summarized in Table 10.
Of the 2,409 patients screened, 34.4% were not randomized into the KEYNOTE-859 trial, mostly for not meeting the trial’s inclusion criteria (99.5%). Of the 1,579 patients enrolled in the KEYNOTE-859 trial, 790 (50.03%) were randomized to receive pembrolizumab in combination with chemotherapy and 789 (49.97%) were randomized to received placebo plus chemotherapy. Overall, 77.1% of patients in the pembrolizumab plus chemotherapy group and 85% of patients in the placebo plus chemotherapy group discontinued the trial. The main reason for trial discontinuation was death in both groups.
Table 10: Summary of Patient Disposition in the KEYNOTE-859 Trial
Patient disposition | Full study population | |
|---|---|---|
Pembrolizumab plus chemotherapy | Placebo plus chemotherapy | |
Screened, N | 2,409 | |
Screen failure, n (%) | 828 (34.4) | |
Reason for screening failure, n (%) | ||
Did not meet inclusion criteria or did meet exclusion criteriaa | 826 (99.5) | |
Randomized, N | 790 | 789 |
Randomized and treated, n (%) | 785 (99.4) | 787 (99.8) |
Discontinued from study, n (%) | 609 (77.1) | 677 (85.8) |
Reason for discontinuation from study, n (%) | ||
Death | 593 (75.1) | 660 (83.7) |
Withdrawal by patient | 14 (1.8) | 12 (1.5) |
COVID-19 associated unspecified, subsequent death | 10 (1.3) | 6 (0.8) |
Lost to follow-up | 1 (0.1) | 5 (0.6) |
Physician decision | 1 (0.1) | 0 (0.0) |
Death associated with COVID-19 | 7 (0.9) | 8 (1.0) |
Discontinued from study medication in trial segment treatment, n (%) | 685 (87.3) | 742 (94.3) |
Reason for discontinuation from study medication in trial segment treatment, n (%) | ||
Progressive disease | 421 (53.6) | 474 (60.2) |
Adverse event | 103 (13.1) | 89 (11.3) |
Clinical progression | 94 (12.0) | 100 (12.7) |
Withdrawal by patient | 39 (5.0) | 51 (6.5) |
Physician decision | 13 (1.7) | 14 (1.8) |
Nonstudy anticancer therapy | 10 (1.3) | 11 (1.4) |
Complete response | 3 (0.4) | 1 (0.1) |
Adverse event associated with COVID-19 | 1 (0.1) | 1 (0.1) |
Lost to follow-up | 1 (0.1) | 1 (0.1) |
Protocol violation | 1 (0.1) | 0 (0.0) |
Withdrawal by patient associated with COVID-19 | 1 (0.1) | 0 (0.0) |
Excluded medication | 0 (0.0) | 1 (0.1) |
Ongoing study treatment, N (%) | 40 (5.1) | 21 (2.7) |
Completed all study treatment, N (%) | 60 (7.6) | 24 (3.0) |
FAS and ITT, N | 790 | 789 |
PP, N | 785 | 787 |
Safety, N | 785 | 787 |
FAS = full analysis set; ITT = intention to treat PP = per protocol.
aMost prevalent reason for screen failure was related to the inclusion criterion of having adequate organ function, defined per protocol and through the collection of specimens in the 10 days before the start of the study intervention.
Sources: Clinical Study Report for KEYNOTE-859,34 sponsor’s summary of clinical evidence.36
Protocol Deviation
Protocol deviations in the KEYNOTE-859 trial are summarized in Appendix 1 (Table 26).
Overall, at least 1 important protocol deviation was documented in 57 (7.2%) patients in the pembrolizumab plus chemotherapy group and 43 (5.4%) patients in the placebo plus chemotherapy group. In both groups, the most reported protocol deviations were related to safety events not reported per the timeline outlined in the protocol.
Baseline Characteristics
The baseline characteristics outlined in Table 11 are limited to those that are most relevant to this review or were felt to affect the outcomes or interpretation of the study results.
The mean age of patients randomized to the pembrolizumab plus chemotherapy group was 59.3 years (SD = 11.9 years) and to the placebo plus chemotherapy group was 60.0 years (SD = 11.8 years). In terms of disease characteristics, 18.9% of patients in the pembrolizumab plus chemotherapy group presented with adenocarcinoma of the GEJ and 81.0% presented with adenocarcinoma of the stomach; in the placebo plus chemotherapy group, 23.4% and 76.4% of patients presented with adenocarcinoma of the GEJ and stomach, respectively. Approximately 78% of patients in both treatment groups were documented to have a PD-L1 CPS of 1 or more.
Table 11: Summary of Baseline Characteristics From KEYNOTE-859 Trial (ITT Population)
Characteristic | Pembrolizumab plus chemotherapy (N = 790) | Placebo plus chemotherapy (N = 789) |
|---|---|---|
Demographics | ||
Age, years | ||
Mean (SD) | 59.3 (11.9) | 60.0 (11.8) |
Median (range) | 61.0 (23 to 86) | 62.0 (21 to 85) |
Age category, years, n (%) | ||
< 65 | 486 (61.5) | 479 (60.7) |
≥ 65 | 304 (38.5) | 310 (39.3) |
Sex, n (%) | ||
Male | 527 (66.7) | 544 (68.9) |
Female | 263 (33.3) | 245 (31.1) |
Race, n (%) | ||
American Indian or Alaska Native | 31 (3.9) | 36 (4.6) |
Asian | 270 (34.2) | 269 (34.1) |
Black or African American | 12 (1.5) | 9 (1.1) |
Multiple | 43 (5.4) | 30 (3.8) |
Native Hawaiian or Other Pacific Islander | 1 (0.1) | 2 (0.3) |
White | 426 (53.9) | 435 (55.1) |
Missing | 7 (0.9) | 8 (1.0) |
Geographic region of enrolling site, n (%) | ||
Australia, Israel, North America, Western Europea | 201 (25.4) | 202 (25.6) |
Asia | 263 (33.3) | 262 (33.2) |
Rest of the world | 326 (41.3) | 325 (41.2) |
Disease characteristics | ||
ECOG PS, n (%) | ||
0 | 281 (35.6) | 301 (38.1) |
1 | 509 (64.4) | 488 (61.9) |
Primary location at diagnosis, n (%) | ||
Adenocarcinoma of the gastroesophageal junction | 149 (18.9) | 185 (23.4) |
Adenocarcinoma of the stomach | 640 (81.0) | 603 (76.4) |
Other | 0 (0.0) | 1 (0.1) |
Missing | 1 (0.1) | 0 (0.0) |
Current disease overall stage, n (%) | ||
IIA | 0 (0.0) | 1 (0.1) |
IIB | 0 (0.0) | 2 (0.3) |
IIIA | 2 (0.3) | 9 (1.1) |
IIIB | 11 (1.4) | 10 (1.3) |
IIIC | 9 (1.1) | 5 (0.6) |
IV | 767 (97.1) | 762 (96.6) |
Missing | 1 (0.1) | 0 (0.0) |
Disease status, n (%) | ||
Locally advanced | 28 (3.5) | 30 (3.8) |
Metastatic | 761 (96.3) | 759 (96.2) |
Missing | 1 (0.1) | 0 (0.0) |
Number of metastatic sites, n (%) | ||
0 to 2 | 438 (55.4) | 421 (53.4) |
≥ 3 | 351 (44.4) | 368 (46.6) |
Missing | 1 (0.1) | 0 (0.0) |
Liver metastases, n (%) | ||
Yes | 314 (39.7) | 311 (39.4) |
No | 475 (60.1) | 478 (60.6) |
Missing | 1 (0.1) | 0 (0.0) |
Tumour burden, n (%) | ||
≥ median | 387 (49.0) | 357 (45.2) |
< median | 358 (45.3) | 384 (48.7) |
Missing | 45 (5.7) | 48 (6.1) |
Histological subtype (Lauren classification), n (%) | ||
Diffuse | 318 (40.3) | 301 (38.1) |
Intestinal | 284 (35.9) | 273 (34.6) |
Indeterminate | 186 (23.5) | 215 (27.2) |
Unknown | 1 (0.1) | 0 (0.0) |
Missing | 1 (0.1) | 0 (0.0) |
PD-L1 status, n (%) | ||
CPS ≥ 1 | 619 (78.4) | 616 (78.1) |
CPS < 1 | 171 (21.6) | 173 (21.9) |
MSI status, n (%) | ||
MSI-high | 39 (4.9) | 35 (4.4) |
Non-MSI-high | 641 (81.1) | 639 (81.0) |
Unknown | 0 (0.0) | 1 (0.1) |
Missing | 110 (13.9) | 114 (14.4) |
Treatment | ||
Prior gastrectomy and/or esophagectomy, n (%) | ||
Yes | 172 (21.8) | 162 (20.5) |
No | 613 (77.6) | 622 (78.8) |
Missing | 5 (0.6) | 5 (0.6) |
Chemotherapy regimen, n (%) | ||
CAPOX | 682 (86.3) | 681 (86.3) |
FP | 108 (13.7) | 108 (13.7) |
CAPOX = capecitabine plus oxaliplatin; CPS = combined positive score; ECOG PS = Eastern Cooperative Oncology Group Performance Status; FP = 5-fluorouracil plus cisplatin; ITT = intention to treat; MSI = microsatellite instability; PD-L1 = programmed cell death 1 ligand 1; SD = standard deviation.
aWestern Europe includes France, Germany, Spain, Italy, UK, Ireland, Switzerland, Czech Republic, Denmark, and Hungary, which is consistent with the Europe region defined in the protocol for stratification.
Sources: Clinical Study Report for KEYNOTE-859,34 sponsor’s summary of clinical evidence.36
Exposure to Study Treatments
Exposure to study treatments is summarized in Table 12. Duration of exposure is summarized by backbone therapy in Table 13.
At the time of the data cut-off (October 3, 2022), the median duration of therapy was 6.7 months (range, 0.0 to 33.7 months) in the pembrolizumab plus placebo group and 5.6 months (range, 0.0 to 29.7 months) in the placebo plus chemotherapy group. Duration of exposure by backbone therapy was relatively consistent up to 6 months. Patients receiving backbone therapy spent consistently more time in pembrolizumab plus chemotherapy group than in the placebo plus chemotherapy group. Patients receiving CAPOX as backbone therapy had longer exposure to therapy than patients receiving backbone therapy with FP.
Table 12: Summary of Patient Exposure to Study Treatment in the KEYNOTE-859 Trial (Safety Population)
Exposure | Pembrolizumab plus chemotherapy (N = 785) | Placebo plus chemotherapy (N = 787) |
|---|---|---|
Duration of therapy | ||
Mean (SD) | 9.1 (7.5) | 7.2 (6.0) |
Median (range) | 6.7 (0.0 to 33.7) | 5.6 (0.0 to 29.7) |
Months of treatment duration, n (%) | ||
> 0 | 785 (100.0) | 787 (100.0) |
≥ 1 | 720 (91.7) | 731 (92.9) |
≥ 3 | 619 (78.9) | 592 (75.2) |
≥ 6 | 426 (54.3) | 362 (46.0) |
≥ 12 | 203 (25.9) | 128 16.3) |
≥ 18 | 130 (16.6) | 60 (7.6) |
Number of cycles | ||
Mean (SD) | 12.6 (10.3) | 10.1 (8.0) |
Median (range) | 9.0 (1.0 to 36.0) | 8.0 (1.0 to 35.0) |
SD = standard deviation.
Note: Data cut-off date was October 3, 2022.
Sources: Clinical Study Report for KEYNOTE-859,34 sponsor’s summary of clinical evidence.36
Table 13: Summary of Duration of Exposure by Backbone Therapy (Safety Population)
Exposure | Pembrolizumab plus CAPOX (n = 674) | Pembrolizumab plus FP (n = 106) | CAPOX (n = 679) | FP (n = 107) | ||||
|---|---|---|---|---|---|---|---|---|
n (%) | Person-months | n (%) | Person-months | n (%) | Person-months | n (%) | Person-months | |
Months of treatment duration | ||||||||
> 0 | 674 (100.0) | 6,201.4 | 106 (100.0) | 828.2 | 679 (100.0) | 5,001.5 | 107 (100.0) | 672.2 |
≥ 1 | 621 (92.1) | 6,178.8 | 94 (88.7) | 821.5 | 638 (94.0) | 4,983.4 | 93 (86.9) | 665.3 |
≥ 3 | 531 (78.8) | 6,000.0 | 83 (78.3) | 799.4 | 521 (76.7) | 4,748.6 | 71 (66.4) | 614.1 |
≥ 6 | 369 (54.7) | 5,262.3 | 52 (49.1) | 652.7 | 322 (47.4) | 3,826.9 | 40 (37.4) | 476.1 |
≥ 12 | 182 (27.0) | 3,666.2 | 18 (17.0) | 374.6 | 114 (16.8) | 2,093.2 | 14 (13.1) | 267.9 |
≥ 18 | 114 (16.9) | 2,655.6 | 13 (12.3) | 303.2 | 53 (7.8) | 1,206.3 | 7 (6.5) | 161.7 |
CAPOX = capecitabine plus oxaliplatin; FP = 5-fluorouracil plus cisplatin.
Notes: Each patient is counted once on each applicable duration category row.
Data cut-off date was October 3, 2022.
Sources: Clinical Study Report for KEYNOTE-859,34 sponsor’s summary of clinical evidence.36
Concomitant Medications, Cointerventions, and Subsequent Treatment
Concomitant Medications
Concomitant mediations used by at least 15% of patients in any treatment group in the KEYNOTE-859 trial are summarized in Table 14.
Overall, 1,568 (99.3%) patients reported the use of at least 1 concomitant medication. The most concomitant medications used in the pembrolizumab plus chemotherapy and placebo plus chemotherapy groups were dexamethasone (54.7% versus 55.3%), ondansetron (49.9% versus 47.9%), and palonosetron hydrochloride (33.2% versus 31.1%). A greater proportion of patients in the pembrolizumab plus chemotherapy group than in the placebo and chemotherapy group reported using levothyroxine sodium (16.7% versus 5.7%).
Subsequent Treatments
Subsequent treatments received by at least 5% of patients in the KEYNOTE-859 trial are summarized in Table 15.
A total of 355 (44.9%) patients in the pembrolizumab plus chemotherapy group and 369 (46.8%) patients in the placebo plus chemotherapy group received subsequent anticancer therapies. The 2 most common subsequent therapies received in the pembrolizumab plus chemotherapy and placebo plus chemotherapy groups were paclitaxel (24.4% versus 25.1%) and irinotecan (12.0% versus 14.1%).
Table 14: Summary of Concomitant Medications Used by at Least 15% of Patients in Any Treatment Group in the KEYNOTE-859 Trial (ITT Population)
Medication | Pembrolizumab plus chemotherapy (N = 790) | Placebo plus chemotherapy (N = 789) |
|---|---|---|
Patients taking 1 or more concomitant medication, n (%) | 782 (99.0) | 786 (99.6) |
Dexamethasone | 432 (54.7) | 436 (55.3) |
Ondansetron | 394 (49.9) | 378 (47.9) |
Palonosetron hydrochloride | 262 (33.2) | 247 (31.1) |
Paracetamol | 260 (32.9) | 239 (30.3) |
Sodium chloride | 221 (28.0) | 190 (24.1) |
Aprepitant | 205 (25.9) | 205 (26.0) |
Omeprazole | 183 (23.2) | 184 (23.3) |
Metoclopramide | 178 (22.5) | 157 (19.9) |
Metoclopramide hydrochloride | 204 (25.8) | 179 (22.7) |
Dexamethasone sodium phosphate | 164 (20.8) | 158 (20.0) |
Potassium chloride | 156 (19.7) | 141 (17.9) |
Levothyroxine sodium | 132 (16.7) | 45 (5.7) |
Tramadol hydrochloride | 119 (15.1) | 123 (15.6) |
Ondansetron hydrochloride | 111 (14.1) | 122 (15.5) |
Notes: Every participant is counted a single time for each applicable specific concomitant medication. A patient with multiple concomitant medications within a medication category is counted a single time for that category.
Data cut-off date was October 3, 2022.
Source: Clinical Study Report for KEYNOTE-859.34
Table 15: Summary of Subsequent Treatments Used by at Least 5% of Patients in Any Treatment Group in the KEYNOTE-859 Trial (ITT Population)
Medication | Pembrolizumab plus chemotherapy (N = 790) | Placebo plus chemotherapy (N = 789) |
|---|---|---|
Received subsequent systemic anticancer therapy, n (%) | 355 (44.9) | 369 (46.8) |
Chemotherapy | 339 (42.9) | 346 (43.9) |
Paclitaxel | 193 (24.4) | 198 (25.1) |
Irinotecan | 95 (12.0) | 111 (14.1) |
Fluorouracil | 77 (9.7) | 102 (12.9) |
Docetaxel | 41 (5.2) | 42 (5.3) |
Any PD-1 or PD-L1 checkpoint inhibitor | 66 (8.4) | 72 (9.1) |
Any VEGF or VEGFR inhibitor | 137 (17.3) | 138 (17.5) |
Ramucirumab | 107 (13.5) | 112 (14.2) |
Other | 92 (11.6) | 96 (12.2) |
Subsequent systemic therapy by lines, n (%) | ||
1 subsequent line | 352 (44.6) | 364 (46.1) |
2 subsequent lines | 145 (18.4) | 138 (17.5) |
> 3 subsequent lines | 66 (8.4) | 58 (7.4) |
PD-1 = programmed cell death 1 protein; PD-L1 = programmed cell death 1 ligand 1; VEGF = vascular endothelial growth factor; VEGFR = vascular endothelial growth factor receptor.
Notes: Every patient is counted once for each applicable specific anticancer treatment. A patient with multiple anticancer treatments within a therapy category was counted a single time for that category.
Data cut-off date was October 3, 2022.
Source: Clinical Study Report for KEYNOTE-859.34
Efficacy
Results presented are based on the planned IA1 (data cut-off date: October 3, 2022). At the time of IA1, the primary and secondary end points met the prespecified criteria for the superiority of pembrolizumab plus chemotherapy over placebo plus chemotherapy, and the null hypotheses were rejected. No further hypothesis testing will be performed at the final analysis. A summary of OS and PFS efficacy results and EORTC QLQ-C30 scores from the KEYNOTE-859 trial is presented in Table 16. The Kaplan-Meier curves for OS and PFS are presented in Figure 4 and Figure 5, respectively.
Overall Survival
At the time of the data cut-off, patients were followed for a median of 12.0 months (range, 0.1 to 24.9 months). The median follow-up duration was 12.9 months (range, 0.2 to 45.9 months) in the pembrolizumab plus chemotherapy group and 11.6 months (range, 0.1 to 45.5 months) in the placebo plus chemotherapy group.
The proportion of observed deaths at the time of IA1 (October 2, 2022) was 76.3% in the pembrolizumab plus chemotherapy group and 84.4% in the placebo plus chemotherapy group. The median OS was 12.9 months (95% CI, 11.9 to 14.0 months) in the pembrolizumab plus chemotherapy group and 11.5 months (95% CI, 10.6 to 12.1 months) in the placebo and chemotherapy group. The stratified HR for OS was 0.78 (95% CI, 0.70 to 0.87; P < 0.0001) in favour of pembrolizumab plus chemotherapy versus placebo plus chemotherapy. The risk difference in OS after treatment with pembrolizumab plus chemotherapy compared to placebo plus chemotherapy was ████ ████ ███ ███ ██ ██████ at 12 months, ████ ████ ███ ███ ██ ██████ at 24 months, and ████ ████ ██ ██████ at 30 months.
Figure 4: Kaplan-Meier Estimates of OS (ITT Population)
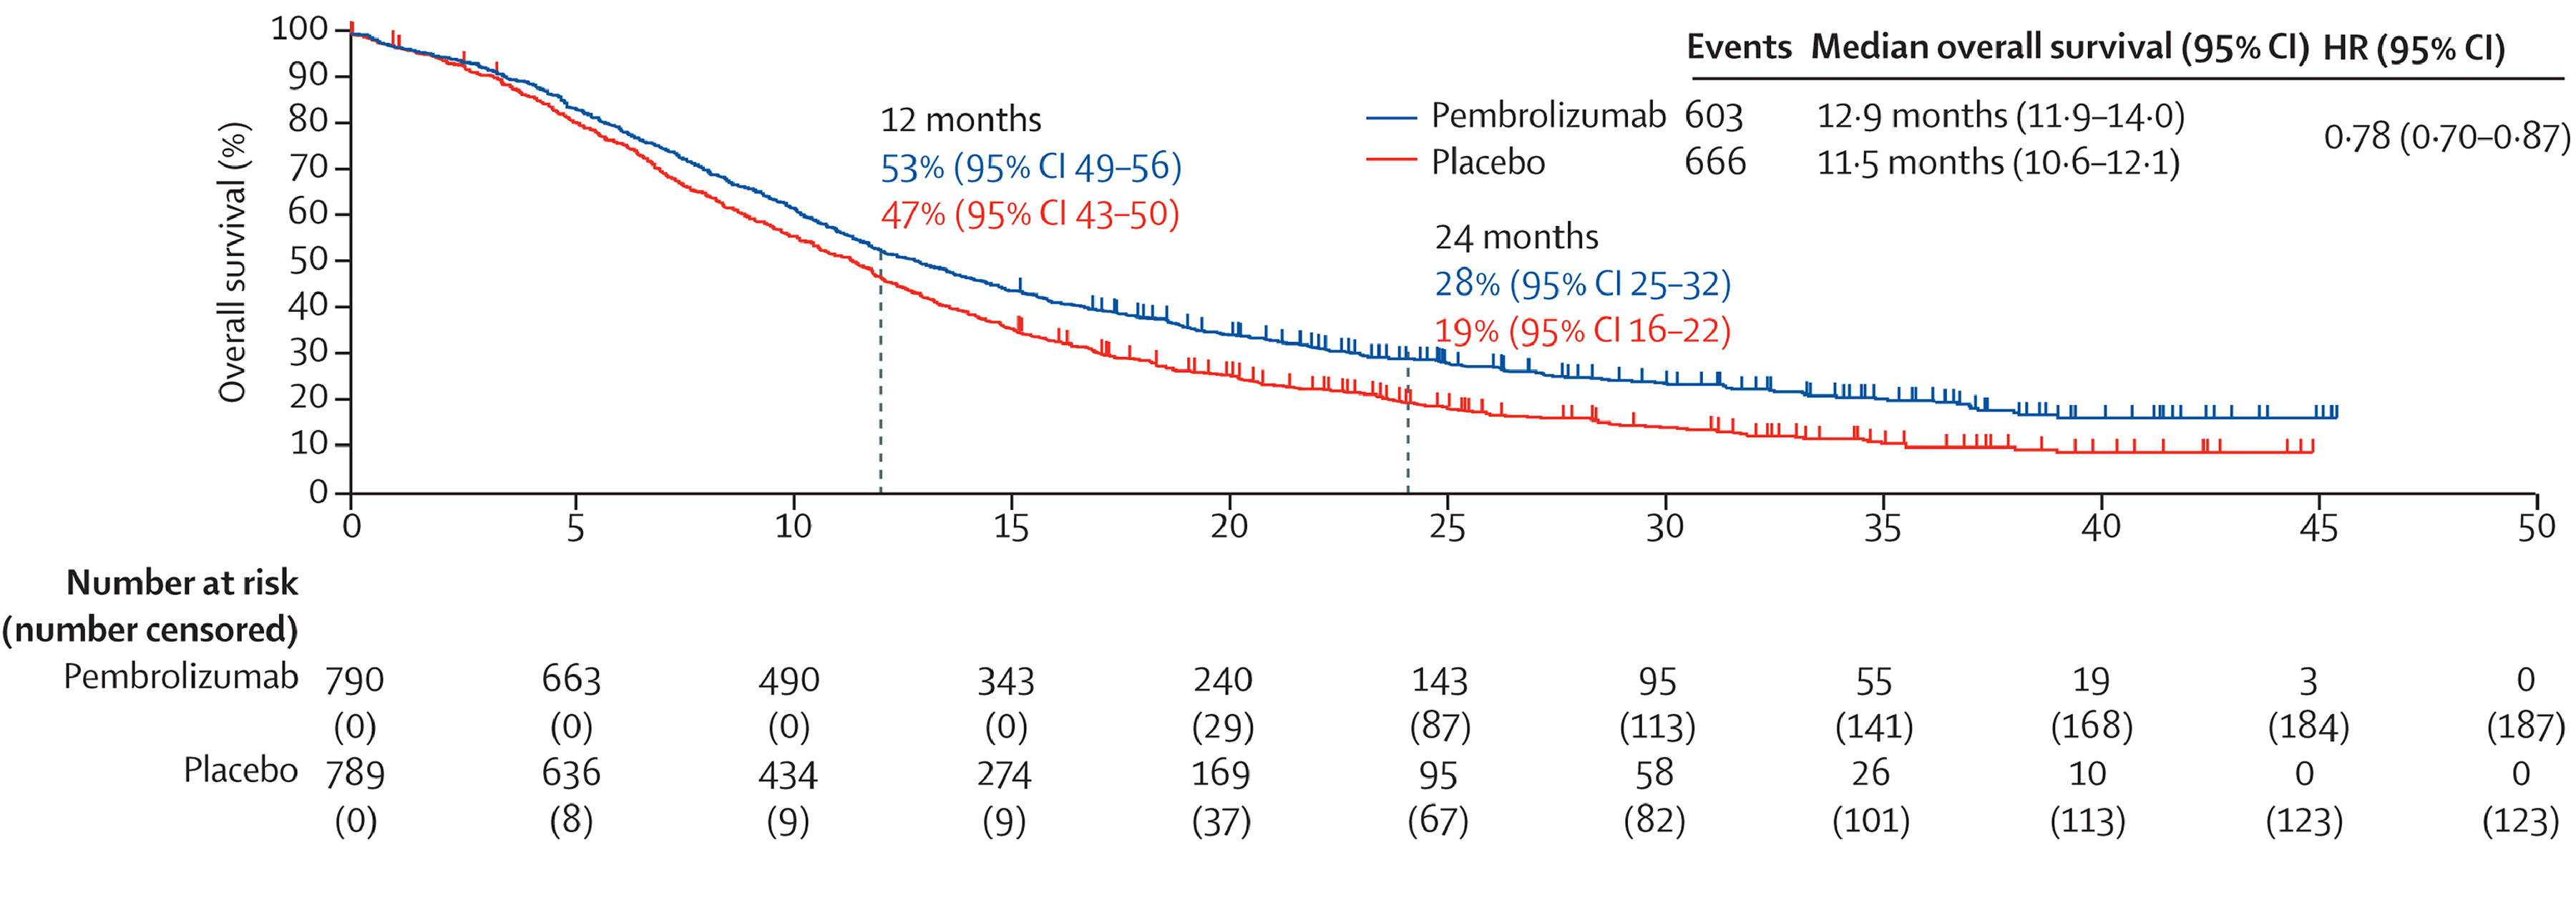
CI = confidence interval; GEJ = gastroesophageal junction; HR = hazard ratio; ITT = intention to treat; OS = overall survival.
Reprinted from J Clin Oncol., 41(16_suppl), Rha et al., KEYNOTE-859 study of pembrolizumab plus chemotherapy for advanced HER2-negative gastric or gastroesophageal junction (G/GEJ) cancer: Outcomes in the protocol-specified PD-L1–selected populations 4014 to 4014, Copyright (2023), with permission from Elsevier.
Source: Rha et al. (2023).65
Subgroup Analysis
The subgroup analyses were indicative of a differential treatment effect among subgroups of patients based on PD-L1 status. No difference in OS was observed among patients with a PD-L1 CPS of less than 1 (HR, 0.92; 95% CI, 0.73 to 1.17), indicating that the difference in OS observed in the overall study was driven primarily by patients with a PD-L1 CPS of 1 or greater (HR, 0.73; 95% CI, 0.65 to 0.83). The treatment effect on OS was more pronounced among patients with a PD-L1 CPS of 10 or greater (HR, 0.64; 95% CI, 0.52 to 0.7) than among patients with a PD-L1 CPS of less than 10 (HR, 0.86; 95% CI, 0.75 to 0.98). The subgroup analyses also showed that the treatment effect on OS was likely more pronounced among patients who had MSI-H tumours (HR, 0.35; 95% CI, 0.18 to 0.66) than among patients whose tumours were non-MSI-H (HR, 0.79; 95% CI, 0.7 to 0.89) (Appendix 1, Table 27).
Figure 5: Kaplan-Meier Estimates of PFS (ITT Population)
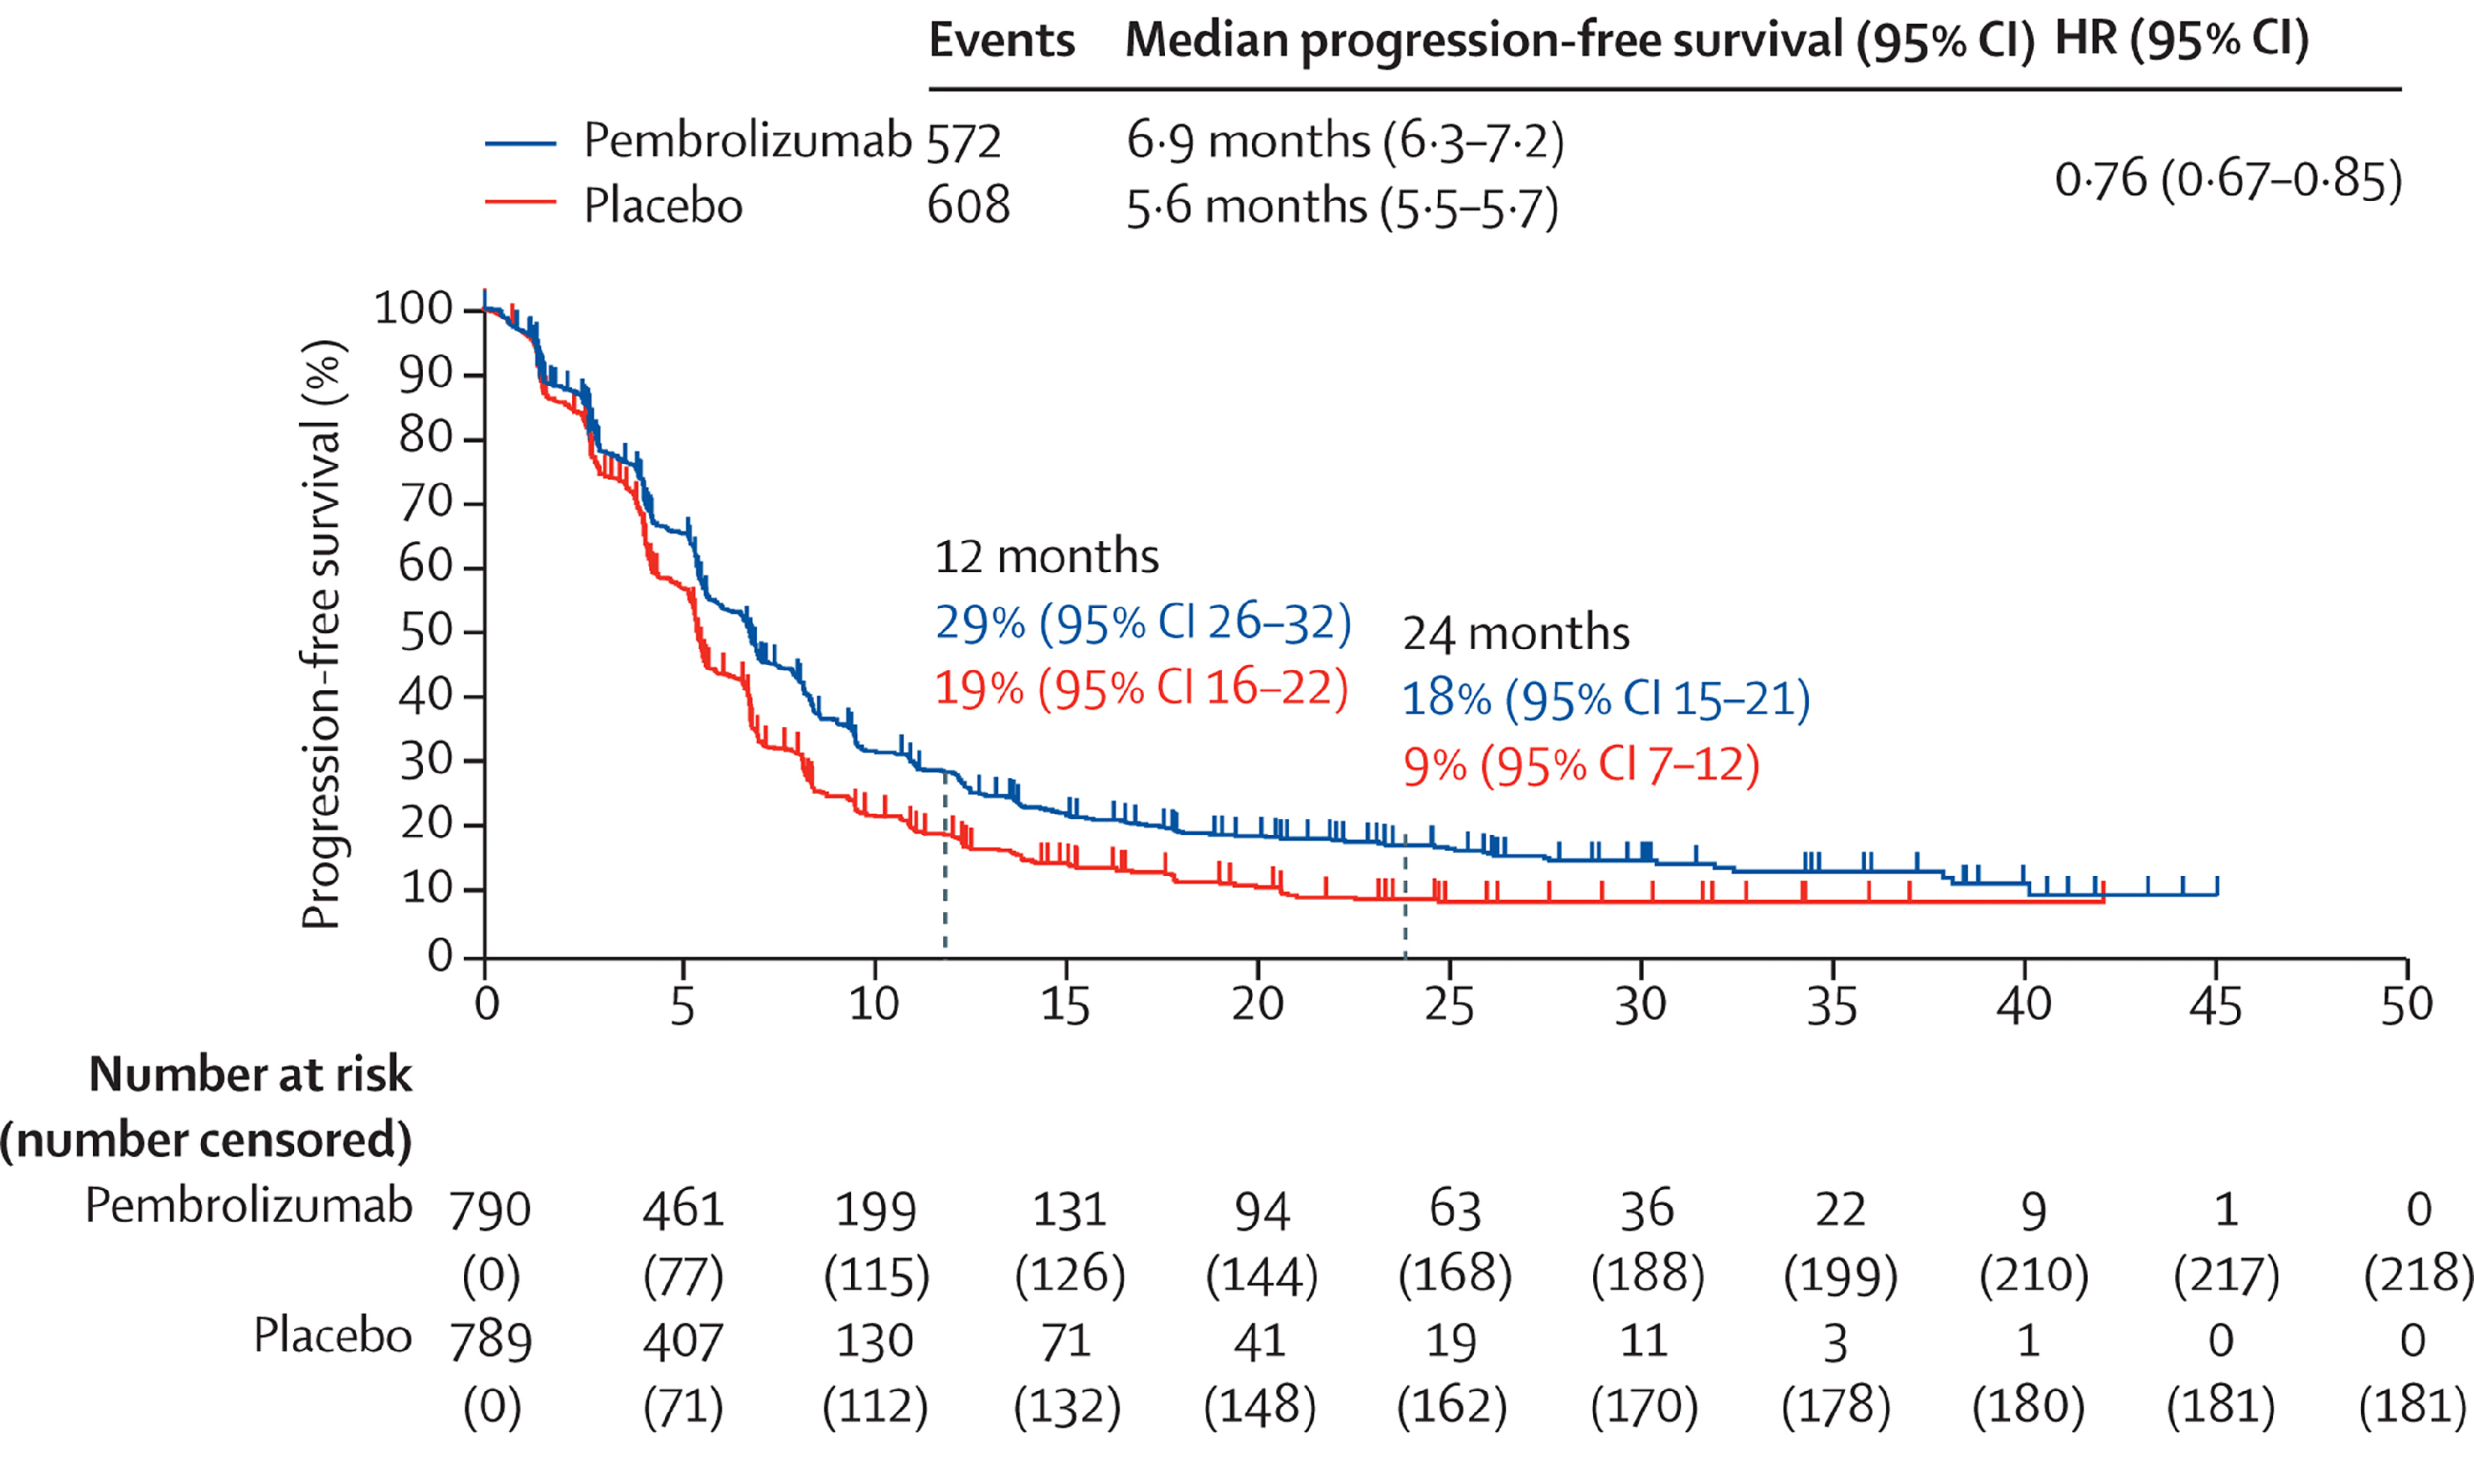
CI = confidence interval; HR = hazard ratio; ITT = intention to treat; PFS = progression-free survival.
Reprinted from J Clin Oncol., 41(16_suppl), Rha et al., KEYNOTE-859 study of pembrolizumab plus chemotherapy for advanced HER2-negative gastric or gastroesophageal junction (G/GEJ) cancer: Outcomes in the protocol-specified PD-L1–selected populations 4014 to 4014, Copyright (2023), with permission from Elsevier.
Source: Rha et al. (2023).65
Progression-Free Survival
Disease progression or death on or before the IA1 data cut-off date (October 2, 2022) was observed in 72.4% of patients in the pembrolizumab plus chemotherapy group and 77.1% of patients in the placebo plus chemotherapy group. The median PFS was 6.9 months (95% CI, 6.3 to 7.2 months) in the pembrolizumab plus chemotherapy group and 5.6 months (95% CI, 5.5 to 5.7 months) in the placebo plus chemotherapy group. The HR for PFS was 0.76 (95% CI, 0.67 to 0.85; P < 0.0001) in favour of pembrolizumab plus chemotherapy over placebo plus chemotherapy. Risk differences in PFS between the pembrolizumab plus chemotherapy and placebo plus chemotherapy groups were █████ ████ ███ ███ ██ ██████ at 6 months, ████ ████ ███ ███ ██ ██████ at 12 months, ████ ████ ███ ███ ██ ██████ at 24 months, and ████ ████ ███ ███ ██ ██████ at 30 months.
Health-Related Quality of Life
European Organisation for Research and Treatment of Cancer Quality of Life Questionnaire Core 30
The EORTC QLQ-C30 was completed at baseline by 743 (96.2%) patients in the pembrolizumab plus chemotherapy group and 749 (97.1%) patients in the placebo plus chemotherapy group. By week 18, 608 patients (78.8% of randomized patients) were available in the pembrolizumab plus chemotherapy group; of those, 504 patients (65.3% of randomized patients) completed the questionnaire, for a compliance rate of 82.9%. In the placebo plus chemotherapy group, 592 patients (76.8% of the randomized patients) were available; of those, 506 patients (65.6% of the randomized patients) completed the questionnaire, for a compliance rate of 85.5%.
For global health status, the between-group difference in least squares change from baseline to week 18 was ████ ████ ███ █████ ██ █████ after treatment with pembrolizumab plus chemotherapy versus placebo plus chemotherapy. Improvement in global health status was reported in 35.4% of patients in the pembrolizumab plus chemotherapy group and 30.9% of patients in the placebo plus chemotherapy group. The between-group difference in improvement in global health was ████ █████ ██ █████ after treatment with pembrolizumab plus chemotherapy versus placebo plus chemotherapy. Improvement or stability in global health status was reported in 73.4% of patients in the pembrolizumab plus chemotherapy group and 72.9% of patients in the placebo plus chemotherapy group. The between-group difference in improvement or stability was ████ ████ ███ ████ ██ █████ after treatment with pembrolizumab plus chemotherapy versus placebo plus chemotherapy. The stratified HR for time to deterioration on the global health status/QoL scale at 12 months was 0.87 (95% CI, 0.72 to 1.04; P = 0.1337) for pembrolizumab plus chemotherapy relative to placebo plus chemotherapy.
For nausea and vomiting symptoms, the between-group difference in least squares change from baseline to week 18 was █████ ████ ███ █████ ██ █████ after treatment with pembrolizumab plus chemotherapy versus placebo plus chemotherapy. Improvement in nausea and vomiting symptoms was reported in 24.5% of patients in the pembrolizumab plus chemotherapy group and 24.4% of patients in the placebo plus chemotherapy group. The between-group difference in improvement of nausea and vomiting symptoms was ████ ████ ███ ████ ██ █████ after treatment with pembrolizumab plus chemotherapy versus placebo plus chemotherapy. Improvement or stability in nausea and vomiting symptoms was reported in 71.4% of patients in the pembrolizumab plus chemotherapy group and 74.2% of patients in the placebo plus chemotherapy group. The between-group difference in improvement or stability was █████ ████ ███ ████ ██ ████ after treatment with pembrolizumab plus chemotherapy versus placebo plus chemotherapy. The stratified HR for time to deterioration on the nausea and vomiting symptoms scale at 12 months was 0.95 (95% CI, 0.79 to 1.14; P = 0.5698) for pembrolizumab plus chemotherapy relative to placebo plus chemotherapy.
European Organisation for Research and Treatment of Cancer Quality of Life Questionnaire Stomach Cancer Module
The EORTC QLQ-STO22 was completed at baseline by 701 (91.4%) patients in the pembrolizumab plus chemotherapy group and 696 (91.5%) patients in the placebo and chemotherapy group. By week 18, 595 patients (77.6% of the randomized patients) were available in the pembrolizumab plus placebo group; of those, 488 patients (63.6% of the randomized patients) completed the questionnaire, for a compliance rate of 82.0%. In the placebo plus chemotherapy group, 577 patients (75.8% of the randomized patients) were available; of those, 489 patients (64.3% of the randomized patients) completed the questionnaire, for a compliance rate of 84.7%.
For pain symptoms, the between-group difference in least squares change from baseline to week 18 was █████ ████ ███ █████ ██ ██████ | | ███████ favouring treatment with pembrolizumab plus chemotherapy over placebo plus chemotherapy. Improvement in pain symptoms was reported in 36.5% of patients in the pembrolizumab plus chemotherapy group and 31.1% of patients in the placebo plus chemotherapy group. The between-group difference in improvement in pain symptoms was ███ ████ ████ ███ ███ ██ █████ | | ███████ favouring treatment with pembrolizumab plus chemotherapy over placebo plus chemotherapy. Improvement or stability in pain symptoms was reported in 77.8% of patients in the pembrolizumab plus chemotherapy group and 76.1% of patients in the placebo plus chemotherapy group. The between-group difference in improvement or stability was ███ ████ ███ ████ ██ █████ after treatment with pembrolizumab plus chemotherapy versus placebo plus chemotherapy. The stratified HR for time to deterioration on the pain symptom scale at 12 months was 0.76 (95% CI, 0.58 to 0.98; P = 0.0378), favouring pembrolizumab plus chemotherapy over placebo plus chemotherapy.
Table 16: Summary of Key Efficacy Results From the KEYNOTE-859 Trial (ITT Population)
Outcomes | Pembrolizumab plus chemotherapy (N = 790) | Placebo plus chemotherapy (N = 789) |
|---|---|---|
Efficacy outcomes (ITT population) | ||
OS | ||
Number of events (%) | ||
Death | 603 (76.3) | 666 (84.4) |
Kaplan-Meier estimates (months) | ||
Median (95% CI)a | 12.9 (11.9 to 14.0) | 11.5 (10.6 to 12.1) |
Treatment difference | ||
HR (95% CI)b | 0.78 (0.70 to 0.87) | Reference |
P valuec | < 0.0001 | Reference |
OS probability, % (95% CI)a | ||
At month 6 | 79.9 (76.9 to 82.5) | 76.6 (73.5 to 79.4) |
At month 12 | 52.7 (49.1 to 56.1) | 46.7 (43.2 to 50.2) |
Risk difference, % (95% CI)d | ███ ████ ██ █████ | Reference |
At month 18 | 37.5 (34.1 to 40.9) | 28.1 (25.0 to 31.4) |
At month 24 | 28.2 (25.0 to 31.5) | 18.9 (16.1 to 21.9) |
Risk difference, % (95% CI)d | ███ ████ ██ █████ | Reference |
At month 30 | 22.8 (19.6 to 26.1) | 13.1 (10.6 to 15.9) |
Risk difference, % (95% CI)d | ███ ████ ██ █████ | Reference |
PFS per RECIST 1.1 by BICR | ||
Number of events (%) | 572 (72.4) | 608 (77.1) |
Death | 109 (13.8) | 114 (14.4) |
Documented progression | 463 (58.6) | 494 (62.6) |
Kaplan-Meier estimates (months) | ||
Median (95% CI)a | 6.9 (6.3 to 7.2) | 5.6 (5.5 to 5.7) |
Treatment difference | ||
HR (95% CI)b | 0.76 (0.67 to 0.85) | Reference |
P valuec | < 0.0001 | Reference |
PSF probability, % (95% CI)a | ||
At month 6 | 55.3 (51.6 to 58.9) | 44.8 (41.1 to 48.4) |
Risk difference, % (95% CI)d | ████ ████ ██ █████ | Reference |
At month 12 | 28.9 (25.5 to 32.4) | 19.3 (16.3 to 22.4) |
Risk difference, % (95% CI)d | ███ ████ ██ █████ | Reference |
At month 18 | 20.1 (17.1 to 23.4) | 12.3 (9.7 to 15.2) |
At month 24 | 17.8 (14.8 to 20.9) | 9.4 (7.0 to 12.2) |
Risk difference, % (95% CI)d | ███ ████ ██ █████ | Reference |
At month 30 | 15.3 (12.4 to 18.6) | 9.0 (6.5 to 11.8) |
Risk difference, % (95% CI)d | ███ ████ ██ █████ | Reference |
HRQoL outcomes (PRO FAS population) | ||
EORTC QLQ-C30 | ||
Global health status/QoL | ||
Baseline | ||
n | 743 | 749 |
Mean (SD) | 65.51 (20.74) | 66.48 (21.00) |
Week 18 | ||
n | 504 | 506 |
Mean (SD) | 67.99 (19.57) | 67.37 (21.44) |
Change from baseline to week 18 | ||
LS mean (95% CI) | 0.40 (–1.37 to 2.18) | –0.85 (–2.62 to 0.93) |
LS mean difference (95% CI) | ████ █████ ██ ██ | Reference |
P valuee | 0.2896 | Reference |
Improvement and stability, n (%) | ||
Improved or stable | 567 (73.4) | 562 (72.9) |
Improved | 273 (35.4) | 238 (30.9) |
Stable | 294 (38.1) | 324 (42.0) |
Deteriorated | 120 (15.5) | 135 (17.5) |
Unconfirmed | 19 (2.5) | 17 (2.2) |
No assessment | 66 (8.5) | 57 (7.4) |
Difference in improved, % | ||
Estimate (95% CI)f | ███ █████ ██ ████ | Reference |
P value | 0.0320 | Reference |
Difference in improved and stable, % | ||
Estimate (95% CI) | ███ █████ ██ ████ | Reference |
P valueg | 0.4064 | Reference |
Deterioration, months | ||
Patients with true deterioration, n (%) | 213 (28.7) | 227 (30.3) |
Time to true deterioration, median | NR (NR to NR) | NR (13.8 to NR) |
True deterioration rate at 12 months, % (95% CI) | 63.8 (59.2 to 68.0) | 58.2 (52.7 to 63.3) |
Pairwise comparisons | ||
HR (95% CI)b | 0.87 (0.72 to 1.04) | Reference |
P valueh | 0.1337c | Reference |
Nausea/vomiting symptom scale | ||
Baseline | ||
n | 743 | 749 |
Mean (SD) | 14.00 (21.30) | 14.73 (22.15) |
Week 18 | ||
n | 504 | 506 |
Mean (SD) | 13.79 (21.61) | 13.83 (20.14) |
Change from baseline to week 18 | ||
LS mean (95% CI) | 1.06 (–0.75 to 2.87) | 1.36 (–0.45 to 3.16) |
LS mean difference (95% CI) | ████ ██████ ██ ██ | Reference |
P valuee | 0.8060 | Reference |
Improvement and stability, n (%) | ||
Improved or stable | 551 (71.4) | 572 (74.2) |
Improved | 189 (24.5) | 188 (24.4) |
Stable | 362 (46.9) | 384 (49.8) |
Deteriorated | 135 (17.5) | 128 (16.6) |
Unconfirmed | 20 (2.6) | 14 (1.8) |
No assessment | 66 (8.5) | 57 (7.4) |
Difference in improved, % | ||
Estimate (95% CI)f | ███ █████ ██ ████ | Reference |
P value | 0.4981 | Reference |
Difference in improved and stable, % | ||
Estimate (95% CI) | ████ █████ ██ ████ | Reference |
P valueg | 0.8960 | Reference |
Deterioration, months | ||
Patients with true deterioration, n (%) | 229 (30.8) | 234 (31.2) |
Time to true deterioration, median | NR (NR to NR) | NR (19.9 to NR) |
True deterioration rate at 12 months, % (95% CI) | 64.5 (60.3 to 68.3) | 61.7 (56.9 to 66.2) |
Pairwise comparisons | ||
HR (95% CI)b | 0.95 (0.79 to 1.14) | Reference |
P valueh | 0.5698 | Reference |
EORTC QLQ-STO22 | ||
Pain symptom scale | ||
Baseline | ||
n | 701 | 696 |
Mean (SD) | 27.35 (22.70) | 25.87 (21.97) |
Week 18 | ||
n | 488 | 489 |
Mean (SD) | 17.49 (18.57) | 18.73 (19.47) |
Change from baseline to week 18 | ||
LS mean (95% CI) | –8.21 (–9.91 to –6.51) | –5.64 (–7.34 to –3.94) |
LS mean difference (95% CI) | ||
P valuee | ████ ██████ ██ ████ | Reference |
Improvement and stability, n (%) | 0.0197 | Reference |
Improved or stable | ||
Improved | 597 (77.8) | 579 (76.1) |
Stable | 280 (36.5) | 237 (31.1) |
Deteriorated | 317 (41.3) | 342 (44.9) |
Unconfirmed | 49 (6.4) | 66 (8.7) |
No assessment | 20 (2.6) | 18 (2.4) |
Difference in improved, % | 101 (13.2) | 98 (12.9) |
Estimate (95% CI)f | ||
P value | ███ ████ ██ █████ | Reference |
Difference in improved and stable, % | 0.0139 | Reference |
Estimate (95% CI) | ||
P valueg | ███ █████ ██ ████ | Reference |
Deterioration, months | 0.2124 | Reference |
Patients with true deterioration, n (%) | ||
Time to true deterioration, median | 107 (15.3) | 124 (17.8) |
True deterioration rate at 12 months, % (95% CI) | NR (NR to NR) | NR (NR to NR) |
Pairwise comparisons | 80.6 (76.4 to 84.1) | 76.4 (71.9 to 80.3) |
HR (95% CI)b | ||
P valueh | 0.76 (0.58 to 0.98) | Reference |
Baseline | 0.0378 | Reference |
BICR = blinded independent central review; CI = confidence interval; EORTC QLQ C30 = European Organisation for Research and Treatment of Cancer Quality of Life Questionnaire Core 30; EORTC QLQ-STO22 = European Organisation for Research and Treatment of Cancer Quality of Life Questionnaire Stomach Cancer Module; FAS = full analysis set; HR = hazard ratio; HRQoL = health-related quality of life; ITT = intention to treat; LS = least squares; NR = not reached; OS = overall survival; PFS = progression-free survival; PRO = patient-reported outcome; QoL = quality of life; RECIST 1.1 = Response Evaluation Criteria in Solid Tumours Version 1.1; SD = standard deviation.
Notes: Data cut-off date was October 3, 2022.
Western Europe includes France, Germany, Spain, Italy, UK, Ireland, Switzerland, Czech Republic, Denmark, and Hungary, which is consistent with the Europe region defined in the protocol for stratification.
Improved is defined as a 10-point or more increase in score (in the positive direction) from baseline at any time during the trial and confirmed with a 10-point or more increase in score at the next consecutive visit. For participants who do not achieve improved scores, stable scores are defined as an improved score or less than a 10-point change in score from baseline and confirmed with a less than 10-point change in score at the next consecutive visit; or a less than 10-point change in score and an improved score at the next consecutive visit. Deterioration is defined as a 10-point worsening in score from baseline at any time during the trial when the criteria for improvement or stable are not met. Unconfirmed is when the criteria for improved or stable status, with confirmation or deterioration, are not met. No assessment is defined as participants who do not have baseline or postbaseline assessments available.
aFrom product-limit (Kaplan-Meier) method for censored data.
bBased on Cox regression model with the Efron method of tie handling, with treatment as a covariate stratified by geographic region (Australia, Israel, North America, Western Europe; Asia; and the rest of the world), PD-L1 status (CPS < 1 vs. CPS ≥ 1), and chemotherapy regimen (FP or CAPOX) with small strata collapsed.
cOne-sided P value based on a log-rank test stratified by geographic region (Australia, Israel, North America, Western Europe; Asia; and the rest of the world), PD-L1 status (CPS < 1 vs. CPS ≥ 1), and chemotherapy regimen (FP or CAPOX) with small strata collapsed.
dBased on the pooled standard error from both treatment arms.
eBased on a constrained longitudinal data analysis (cLDA) model, with the PRO scores as the response variable, covariates for treatment by study visit interaction, and stratification factors (geographic region [Australia, Israel, North America, Western Europe; Asia; and the rest of the world], PD-L1 status [CPS < 1 vs. CPS ≥ 1], and chemotherapy regimen [FP or CAPOX]) with small strata collapsed, as prespecified in the statistical analysis plan.
fBased on the Miettinen and Nurminen method stratified by geographic region (Australia, Israel, North America, Western Europe; Asia; and the rest of the world), PDL1 status (CPS = 1), and chemotherapy regimen (FP or CAPOX) with small strata collapsed, as prespecified in the SAP.
gOne-sided P value for testing (H0: difference in % = 0 vs. H1: difference in % > 0).
hTwo-sided P value based on a log-rank test stratified by geographic region (Australia, Israel, North America, Western Europe; Asia; and the rest of the world), PDL1 status (CPS < 1 vs. CPS ≥ 1), and chemotherapy regimen (FP or CAPOX) with small strata collapsed, as prespecified in the statistical analysis plan.
Sources: Clinical Study Report for KEYNOTE-859,34 additional information request,35 sponsor’s summary of clinical evidence.36
Harms
Only the harms identified in the review protocol were reported. Harms and tolerability from the KEYNOTE-859 trial are summarized in Table 17.
Adverse Events
The proportion of patients with at least 1 AE was reported to be 98.9% in the pembrolizumab plus chemotherapy group and 98.0% in the placebo plus chemotherapy group. The 5 most reported AEs in the pembrolizumab plus chemotherapy group were nausea (46.4%), anemia (41.9%), diarrhea (35.7%), vomiting (33.6%), and decreased appetite (29.4%), and in the placebo plus chemotherapy group were nausea (46.3%), anemia (36.3%), diarrhea (32.3%), decreased appetite (28.6%), and vomiting (26.7%).
Grade 3 or worse AEs were reported in 75.3% of patients in the pembrolizumab plus chemotherapy group and 69.6% of patients in the placebo plus chemotherapy group. The most common grade 3 or worse AEs reported in the pembrolizumab plus chemotherapy group were anemia (12.1%), decreased neutrophil count (9.8%), neutropenia (7.4%), decreased platelet count (7.1%), diarrhea (6.4%), hypokalemia (6.4%), vomiting (5.2%), and fatigue (5.0%). The most common grade 3 or worse AEs reported in the placebo plus chemotherapy group were anemia (9.7%), decreased neutrophil count (8.1%), neutropenia (8.6%), decreased platelet count (5.0%), diarrhea (5.1%), vomiting (5.3%), and fatigue (5.1%).
Serious Adverse Events
SAEs were AEs that resulted in death or were life-threatening, those that required inpatient hospitalization or prolongation of existing hospitalization, and those that resulted in persistent or significant disability and/or incapacity, congenital anomaly and/or birth defect, or other important medical events.
The proportion of patients with at least 1 SAE was reported to be 45.2% in the pembrolizumab plus chemotherapy group and 40.2% in the placebo plus chemotherapy group. SAEs reported by 2% or more of patients in the pembrolizumab plus chemotherapy group were diarrhea (3.9%), pneumonia (3.8%), vomiting (2.4%) and colitis (2.0%). SAEs reported by 2% or more of patients in the placebo plus chemotherapy group were diarrhea (3.2%) and vomiting (2.9%).
Withdrawal Due to Adverse Events
The discontinuation of treatment due to AEs occurred in 32.7% of patients in the pembrolizumab plus chemotherapy group and 25.9% of patients in the placebo plus chemotherapy group.
In the pembrolizumab plus chemotherapy group, 14.8% of patients discontinued treatment with pembrolizumab, 30.2% discontinued treatment with any backbone chemotherapy, and 8.5% discontinued treatment with all therapy in the regimen. AEs leading to treatment discontinuation in 1% or more of patients in the pembrolizumab plus chemotherapy group included peripheral sensory neuropathy (3.6%), peripheral neuropathy (3.3%), diarrhea (1.9%), palmar-plantar erythrodysesthesia syndrome (1.7%), decreased neutrophil count (1.5%), decreased platelet count (1.5%), neutropenia (1.4%), vomiting (1.1%), and fatigue (1.0%).
In the placebo plus chemotherapy group, 10.9% of patients discontinued treatment with placebo, 25.0% discontinued treatment with any backbone chemotherapy, and 7.5% discontinued treatment with all therapy in the regimen. AEs leading to treatment discontinuation in 1% or more of patients in the placebo plus chemotherapy group were peripheral neuropathy (4.1%), peripheral sensory neuropathy (2.7%), decreased platelet count (1.8%), palmar-plantar erythrodysesthesia syndrome (1.1%), and neutropenia (1.0%).
Mortality
Death due to AEs was documented in 8.2% of patients in the pembrolizumab plus chemotherapy group and 7.4% of patients in the placebo plus chemotherapy group.
Notable Harms
Immune-mediated AEs were of interest to the clinical review team. At least 1 immune-mediated AE was documented in █████ of patients in the pembrolizumab plus chemotherapy group and ████ of patients in the placebo group plus chemotherapy group. Grade 3 or worse immune-mediated AEs were reported in ████ of patients in the pembrolizumab plus chemotherapy group and ████ of patients in the placebo plus chemotherapy group.
Table 17: Summary of Harms Results From the KEYNOTE-859 Trial (Safety Population)
Adverse events | Pembrolizumab plus chemotherapy (N = 785) | Placebo plus chemotherapy (N = 787) |
|---|---|---|
Patients with ≥ 1 AE, n (%) | 776 (98.9) | 771 (98.0) |
AEs reported in ≥ 10% of patients in any treatment group | ||
Nausea | 364 (46.4) | 364 (46.3) |
Anemia | 329 (41.9) | 286 (36.3) |
Diarrhea | 280 (35.7) | 254 (32.3) |
Vomiting | 264 (33.6) | 210 (26.7) |
Decreased appetite | 231 (29.4) | 225 (28.6) |
Decreased platelet count | 209 (26.6) | 188 (23.9) |
Decreased neutrophil count | 198 (25.2) | 175 (22.2) |
Fatigue | 197 (25.1) | 194 (24.7) |
Palmar-plantar erythrodysesthesia syndrome | 195 (24.8) | 171 (21.7) |
Increased aspartate aminotransferase | 184 (23.4) | 137 (17.4) |
Constipation | 170 (21.7) | 165 (21.0) |
Peripheral neuropathy | 157 (20.0) | 175 (22.2) |
Decreased weight | 157 (20.0) | 146 (18.6) |
Hypoalbuminemia | 147 (18.7) | 106 (13.5) |
Neutropenia | 147 (18.7) | 142 (18.0) |
Peripheral sensory neuropathy | 140 (17.8) | 136 (17.3) |
Abdominal pain | 139 (17.7) | 118 (15.0) |
Increased alanine aminotransferase | 132 (16.8) | 96 (12.2) |
Asthenia | 129 (16.4) | 124 (15.8) |
Hypothyroidism | 120 (15.3) | 34 (4.3) |
Hypokalemia | 117 (14.9) | 87 (11.1) |
Increased blood bilirubin | 106 (13.5) | 71 (9.0) |
Decreased white blood cell count | 106 (13.5) | 93 (11.8) |
Thrombocytopenia | 93 (11.8) | 84 (10.7) |
Pyrexia | 89 (11.3) | 59 (7.5) |
Increased blood alkaline phosphatase | 81 (10.3) | 69 (8.8) |
Patients with ≥ 1 AEs of grade 3 to grade 5 | 591 (75.3) | 548 (69.6) |
AEs of grade 3 to grade 5 reported in ≥ 5% of patients in any treatment group | ||
Anemia | 95 (12.1) | 76 (9.7) |
Decreased neutrophil count | 77 (9.8) | 64 (8.1) |
Neutropenia | 58 (7.4) | 68 (8.6) |
Decreased platelet count | 56 (7.1) | 39 (5.0) |
Diarrhea | 50 (6.4) | 40 (5.1) |
Hypokalemia | 50 (6.4) | 31 (3.9) |
Vomiting | 41 (5.2) | 42 (5.3) |
Fatigue | 39 (5.0) | 40 (5.1) |
SAEs, n (%) | ||
Patients with ≥ 1 SAE | 355 (45.2) | 316 (40.2) |
SAEs reported in ≥ 2% of patients in any treatment group | ||
Diarrhea | 31 (3.9) | 25 (3.2) |
Pneumonia | 30 (3.8) | 14 (1.8) |
Vomiting | 19 (2.4) | 23 (2.9) |
Colitis | 16 (2.0) | 4 (0.5) |
Treatment discontinuation due to AEs, n (%) | ||
Patients who stopped any drug | 257 (32.7) | 204 (25.9) |
Discontinued pembrolizumab or placebo | 116 (14.8) | 86 (10.9) |
Discontinued any chemotherapy | 237 (30.2) | 197 (25.0) |
Discontinued all drugs in the regimen | 67 (8.5) | 59 (7.5) |
AEs leading to treatment discontinuation in ≥ 1% of patients in any treatment group | ||
Peripheral sensory neuropathy | 28 (3.6) | 21 (2.7) |
Peripheral neuropathy | 26 (3.3) | 32 (4.1) |
Diarrhea | 15 (1.9) | 2 (0.3) |
Palmar-plantar erythrodysesthesia syndrome | 13 (1.7) | 9 (1.1) |
Decreased neutrophil count | 12 (1.5) | 6 (0.8) |
Decreased platelet count | 12 (1.5) | 14 (1.8) |
Neutropenia | 11 (1.4) | 8 (1.0) |
Vomiting | 9 (1.1) | 5 (0.6) |
Fatigue | 8 (1.0) | 2 (0.3) |
Deaths, n (%) | ||
Death due to AEs | 64 (8.2) | 58 (7.4) |
Notable harms, n (%) | ||
Immune-mediated AEs | ███ ██████ | ██ █████ |
Immune-mediated AEs of grade 3 or worse | ██ █████ | ██ █████ |
AE = adverse event; SAE = serious adverse event.
Note: Data cut-off date was October 3, 2022.
Sources: Clinical Study Report for KEYNOTE-859,34 additional information request,35 sponsor’s summary of clinical evidence.36
Critical Appraisal
Internal Validity
The KEYNOTE-859 trial is a randomized, placebo-controlled, parallel-group, multicentre, double-blind, phase III study. Patients were randomized centrally using interactive response technology, which is typically adequate for concealing allocation until treatment assignment. The stratification factors for randomization appeared to be appropriate, as they addressed important prognostic factors identified by the clinical experts consulted on this review, and the baseline characteristics between the treatment groups were generally well balanced. Between-group imbalances were noted in the concomitant use of levothyroxine sodium. However, according to the clinical experts consulted for the purpose of this review, the use of levothyroxine sodium is not likely to have any meaningful impact on treatment response. The use of subsequent therapy was comparable between the treatment groups (44.9% versus 46.8%). The proportion of patients who underwent re-treatment with pembrolizumab was not reported.
A greater proportion of patients in the placebo plus chemotherapy group discontinued the study than in the pembrolizumab plus chemotherapy group (85.8% versus 77.1%), and a greater proportion discontinued the study medication during the treatment period of the trial (94.3% versus 87.3%). The duration of exposure to backbone CAPOX was consistently longer among patients in the pembrolizumab plus chemotherapy group than in the placebo plus chemotherapy group (3,666.2 and 2,093.2 person-months). A relatively longer treatment exposure to chemotherapy could introduce bias into the trial results in favour of pembrolizumab. The reason for the differences in the duration of exposure to backbone chemotherapy between the treatment groups was not reported. It is possible that the observed differences in treatment duration were due to earlier dropouts (e.g., due to death) occurring in the placebo plus chemotherapy group than in the pembrolizumab plus chemotherapy group. At the time of the data cut-off, there were 593 deaths in pembrolizumab plus chemotherapy group and 660 deaths in the placebo plus chemotherapy group, representing a 10% difference in death events between the groups. However, whether this difference could account for the higher duration of treatment exposure (i.e., person-months) in the pembrolizumab plus chemotherapy group than in the placebo plus chemotherapy group is uncertain.
Primary and secondary outcomes in the KEYNOTE-859 trial were OS and PFS, respectively. An appropriate analysis set (intention to treat) for OS and PFS was used to measure the effect of assignment to intervention. OS is considered an objective outcome because it is not prone to bias from the knowledge of group assignment. To minimize the risk of measurement bias in PFS, patients’ responses to treatment were blinded to the study investigators, and tumour responses were confirmed by radiologic evidence and based on BICR per RECIST 1.1. The sensitivity analysis of PFS demonstrated consistency between the BICR and investigator assessment of tumour response, suggesting that the procedures employed to minimize bias associated with the knowledge of group assignment were adequate. The risk of bias due to missing outcome data for OS and PFS appeared to be low, as losses to follow-up for reasons other than death were low and sensitivity analyses with different censoring rules for PFS in the overall population were consistent.
The KEYNOTE-859 trial assessed HRQoL outcomes, which were deemed to be important by patients and clinicians, as exploratory study end points. The double-blind nature of the trial minimized the risk of bias in the measurement of the subjective items on the EORTC QLQ-30 and EROTC QLQ-STO22. However, comparative efficacy conclusions based on HRQoL outcomes were subject to potential bias due to the diminishing number of patients available to complete the questionnaires. By week 18, data on EORTC QLQ-C30 scores were available for 65% of patients in both groups. Thus, the assessment of HRQoL outcomes was compromised by the sizable proportion of patients who had left the trial at week 18, and among those still in the trial, a considerable proportion of patients did not complete the questionnaire. Similarly, EORTC QLQ-STO22 scores were available for 64% of patients in both groups at week 18. Consequently, the assessment of HRQoL is at risk of attrition bias; the extent and direction of the bias, however, cannot be determined because it is not clear whether the patients who completed the questionnaires were systematically different from those who did not (i.e., patients who remained in the trial at week 18 might have been, on average, healthier than those who had dropped out of the trial). Of note, the model used to analyze HRQoL outcomes implicitly imputed data based on the missing-at-random assumption. However, no sensitivity analyses were performed using different imputation approaches (e.g., considering the potential for data to be missing not at random), and no additional information was provided to determine if the missing-at-random assumption was appropriate. Overall, the treatment effect of pembrolizumab plus chemotherapy on HRQoL is uncertain, despite the considerable benefit on OS and PFS.
The analysis of efficacy results followed a defined statistical plan and employed appropriate censoring criteria. The efficacy end points of OS and PFS were tested by applying a multiplicity hierarchical testing procedure to account for the potential for inflated type I error rates across multiple end points and interim analyses. Both PFS and OS were modelled using a proportional hazards assumption. Although the hazards assumption underlying the HRs for OS and PFS was not evaluated, based on visual inspection, the curves appeared to be relatively parallel. Of note, OS and PFS results were based on interim analyses, which may have overestimated the treatment-effect estimates.29,30 Given the relatively large sample size and the number of events with an information fraction of 102.3% for OS and 83.6% for PFS, the effect estimate and CI are not likely to be highly unstable. Although reassuring, overestimation of the treatment effect cannot be completely excluded.29,30
External Validity
Overall, the clinical experts consulted on this review agreed that the results of the KEYNOTE-859 trial were most likely applicable to the clinical setting in Canada; however, it remains uncertain whether the observed treatment effects can be extrapolated to patient populations (e.g., patients with an ECOG PS of 2 or above) that were excluded from the trial. Subgroup analyses revealed potential inconsistencies in the treatment effect across different subgroups, including, for example, patients with a PD-L1 CPS of less than 1 and/or a non-MSI status, who may not receive as much benefit as their counterparts.
The generalizability of the evidence, including the clinical expert input, is summarized in Table 18.
Table 18: Assessment of the Generalizability of Evidence for Pembrolizumab Plus Chemotherapy
Domain | Factor | Evidence | Assessment of generalizability |
|---|---|---|---|
Population | ECOG PS | To be eligible for inclusion in the KEYNOTE-859 trial, patients must have a ECOG PS of 0 or 1. | The clinical experts noted that in clinical practice, patients with an ECOG PS of 2 are usually managed in the same manner as patients with an ECOG PS of 1. Thus, the clinical experts agreed that they would treat patients with an ECOG PS of 2 with pembrolizumab plus chemotherapy. |
CNS metastases | Patients with active CNS metastases were excluded from the KEYNOTE-859 trial. Patients with previously treated brain metastases could participate in the trial, provided they were radiologically stable, clinically stable, and did not require steroid treatment for at least 14 days before the first dose of the study treatment. | Although patients with active brain metastases were not included in the KEYNOTE-859 trial, the clinical experts agreed that they would treat patients with treated or stable asymptomatic CNS metastases with pembrolizumab. | |
PD-L1 and MSI-H status | In the KEYNOTE-859 trial, subgroup analysis suggests that patients with a PD-L1 CPS of 1 or more and an MSI-H status may derive greater clinical benefit from treatment with pembrolizumab combined with platinum-containing chemotherapy. | Although subgroup analysis suggests the potential for a differential treatment effect, the clinical exerts agreed that eligibility to receive pembrolizumab plus chemotherapy should not be tied to a patient’s PD-L1 CPS or MSI-H status. | |
Intervention | Pembrolizumab in combination with chemotherapy | In the KEYNOTE-859 trial, pembrolizumab was combined with fluoropyrimidine and platinum–containing chemotherapy. | The clinical experts agreed that the chemotherapy regimen used in the KEYNOTE-859 trial is reflective of current chemotherapy practice in Canada. |
Comparator | Placebo in combination with chemotherapy | In the KEYNOTE-859 trial, placebo was combined with fluoropyrimidine and platinum–containing chemotherapy. | The clinical experts noted that treatment with nivolumab in combination with chemotherapy is the correct standard of care for patients with HER2-negative gastric or GEJ adenocarcinoma. Currently, there is no direct head-to-head comparison of pembrolizumab plus chemotherapy and nivolumab plus chemotherapy for the indicated population. |
Outcome | OS, PFS | The primary and secondary outcomes in the KEYNOTE-859 trial were OS and PFS, respectively. | According to the clinical experts, OS is the main goal of treatment in patients with gastric or GEJ adenocarcinoma. The clinical experts added that PFS is only of relevance if it is an established surrogate for OS or QoL. |
HRQoL | HRQoL was assessed in the KEYNOTE-859 trial as an exploratory outcome using EORTC QLQ-C30 and EROTC QLQ-STO22 scores. | The clinical experts stressed that after OS, HRQoL outcomes are the second most important outcome used to measure treatment success in this patient population. |
CNS = central nervous system; CPS = combined positive score; ECOG PS = Eastern Cooperative Oncology Group Performance Status; EORTC QLQ C30 = European Organisation for Research and Treatment of Cancer Quality of Life Questionnaire Core 30; EORTC QLQ-STO22 = European Organisation for Research and Treatment of Cancer Quality of Life Questionnaire Stomach Cancer Module; GEJ = gastroesophageal junction; HRQoL = health-related quality of life; MSI-H = microsatellite instability-high; OS = overall survival; PD-L1 = programmed cell death 1 ligand 1; PFS = progression-free survival; QoL = quality of life.
GRADE Summary of Findings and Certainty of the Evidence
Methods for Assessing the Certainty of the Evidence
For pivotal studies and RCTs identified in the sponsor’s systematic review, GRADE was used to assess the certainty of the evidence for outcomes considered most relevant to CDA-AMC expert committee deliberations, and a final certainty rating was determined as outlined by the GRADE Working Group:32,33
High certainty — We are very confident that the true effect lies close to that of the estimate of the effect.
Moderate certainty — We are moderately confident in the effect estimate. The true effect is likely to be close to the estimate of the effect, but there is a possibility that it is substantially different. We use the word likely for evidence of moderate certainty (e.g., X intervention likely results in Y outcome).
Low certainty — Our confidence in the effect estimate is limited. The true effect may be substantially different from the estimate of the effect. We use the word may for evidence of low certainty (e.g., X intervention may result in Y outcome).
Very low certainty — We have very little confidence in the effect estimate. The true effect is likely to be substantially different from the estimate of the effect. We describe evidence of very low certainty as very uncertain.
Following the GRADE approach, evidence from RCTs started as high-certainty evidence and could be rated down for concerns related to study limitations (which refer to internal validity or risk of bias), inconsistency across studies, indirectness, imprecision of effects, and publication bias.
When possible, certainty was rated in the context of the presence of an important (nontrivial) treatment effect; if this was not possible, certainty was rated in the context of the presence of any treatment effect (i.e., the clinical importance is unclear). In all cases, the target of the certainty-of-evidence assessment was based on the point estimate and where it was located relative to the threshold for a clinically important effect (when a threshold was available) or to the null. The presence or absence of an important effect for OS was based on a threshold informed by the clinical experts consulted for the purpose of this review; for HRQoL measured by the EORTC QLQ-C30, this was based on MID estimates from the literature. For all other outcomes (i.e., PFS, EORTC QLQ-STO22, immune-mediated AEs), the presence or absence for an important effect was based on the non-null effect.
Results of GRADE Assessments
Table 2 presents the GRADE summary of findings for pembrolizumab plus chemotherapy and placebo plus chemotherapy.
Long-Term Extension Studies
No long-term extension studies were included in this submission.
Indirect Evidence
The contents of this section have been informed by materials submitted by the sponsor. The following information has been summarized and validated by the clinical review team.
Objectives for the Summary of Indirect Evidence
In the absence of direct head-to-head trials evaluating the comparative efficacy of pembrolizumab versus relevant comparators for the first-line treatment of locally advanced, unresectable, or metastatic HER2-negative gastric and GEJ adenocarcinoma in the practice setting in Canada, 1 sponsor-conducted ITC, in the form of an NMA, was submitted. The sponsor-conducted NMA was used to inform the sponsor-submitted economic model for pembrolizumab in combination with fluoropyrimidine and platinum–containing chemotherapy.
ITC Design
Objectives
The objective of the sponsor-submitted NMA was to evaluate the comparative efficacy of pembrolizumab in combination with fluoropyrimidine and platinum–containing chemotherapy versus alternative treatments used in Canada, namely nivolumab, for the first-line treatment of locally advanced, unresectable, or metastatic HER2-negative gastric and GEJ adenocarcinoma.
Study Selection Methods
The studies eligible for inclusion in the sponsor-submitted NMA were selected according to a sponsor-conducted systematic literature review.63 The sponsor’s systematic literature review was defined by the relevant population, intervention, comparators, outcomes, and study design (PICOS) described in Table 19. The scope of the systematic literature review included RCT evidence of adult patients who have received no prior systematic therapy for the treatment of HER2-negative advanced unresectable or metastatic gastric or GEJ adenocarcinoma.
Table 19: PICOS for the Sponsor-Conducted Systematic Literature Review
PICOS component | Inclusion criteria |
|---|---|
Population | Adult patients 18 years or older with HER2-negative locally advanced, unresectable, or metastatic gastric and/or GEJ adenocarcinoma who received no prior systemic therapy for advanced or metastatic disease. Subgroups
|
Intervention |
|
Comparator |
|
Outcome | Efficacy outcomes:
Safety outcomes:
Generic PRO measures:
Disease-specific PRO measures:
|
5-FU = 5-fluorouracil; AE = adverse event; BPI = Brief Pain Inventory; CPS = combined positive score; DOR = duration of response; ECOG PS = Eastern Cooperative Oncology Group Performance Status; EORTC QLQ-C30 = European Organisation for Research and Treatment of Cancer Quality of Life Questionnaire Core 30; EORTC QLQ-STO22 = European Organisation for Research and Treatment of Cancer Quality of Life Questionnaire Stomach Cancer Module; FACT-G = Functional Assessment of Cancer Therapy-General; FACT-Ga = Functional Assessment of Cancer Therapy-Gastric Cancer; OS = overall survival; PD-L1 = programmed cell death 1 ligand 1; PFS = progression-free survival; PICOS = population, intervention, comparison, outcomes, and study; PRO = patient-reported outcome; SAE = severe adverse events; SF-12 = 12-Item Short Form Health Survey; SF-36 = 36-Item Short Form Health Survey; TREA = treatment-related adverse event.
Sources: NMA Study Report,63 sponsor’s summary of clinical evidence.36
Clinical evidence for the systematic literature review was identified using multiple electronic databases, as listed in Table 20, along with hand-searched conference proceedings. Manual searching of several trial registries was conducted to identify clinical trials that may not have been published but were eligible for inclusion based on the PICOS selection criteria. The literature review is current to October 12, 2023. Study selection followed a 2-stage screening process: first, titles and abstracts were reviewed against the PICOS section criteria; and second, publications identified in the first step underwent a full-text review. Articles were screened by 2 independent reviewers; disagreements were resolved by discussion and, if required, a third senior researcher was consulted. Data extraction was conducted by 2 independent reviewers. An assessment of the risk of bias of included articles was conducted using the Cochrane Collaboration risk of bias tool version 2.12 Study quality was assessed by 2 independent reviewers. A third investigator was included to reach a consensus in the case of any discrepancies. No studies were excluded based on the risk of bias assessment.
The study selection and methods for inclusion in the NMA are summarized in Table 20. The population of interest was adult patients 18 years or older with HER2-negative locally advanced, unresectable, or metastatic gastric or GEJ adenocarcinoma who had received no prior systemic therapy. For the purpose of this submission, a Canadian adaptation from the global systematic literature review was conducted. The main adjustments made to the global systematic literature review were not considering PD-L1 CPS subgroups, considering only treatments applicable to the Canadian setting (i.e., fluoropyrimidine and platinum–containing chemotherapy regimens alone or in combination with pembrolizumab or nivolumab), and considering only the OS and PFS efficacy outcomes.
Feasibility Assessment
The sponsor conducted a feasibility assessment to determine the appropriateness of proceeding with an NMA. The feasibility assessment process aligned with the guidelines set forth by the International Society for Pharmacoeconomics and Outcome Research (ISPOR), National Institute for Health and Care Excellence (NICE), and PRISMA, and involved the following steps:82-85
A determination of whether the RCT evidence for the interventions of interest formed 1 connected network for the overall population and each outcome of interest, and an assessment of the distribution of trial characteristics across the network.
An assessment of the distribution of treatments.
An exploration of the distribution of baseline patient characteristics both within and between comparisons to identify factors that may bias indirect estimates (i.e., comparability of different fluoropyrimidine-platinum doublet therapies; geographic location of the trial; the proportion of patients who are Asian, HER2 status, and PD-L1 CPS).
An assessment of outcome definitions, the time points at which outcomes were reported, and the crossover adjustment methods used.
An exploration of the observed treatment effects to assess variability in outcome reporting.
Table 20: Study Selection Criteria and Methods for the NMA Submitted by the Sponsor
Characteristics | Indirect comparison |
|---|---|
Population | Adult patients 18 years or older with HER2-negative locally advanced, unresectable, or metastatic gastric and/or GEJ adenocarcinoma who had received no prior systemic therapy for treatment of advanced or metastatic disease Subgroups: None |
Intervention |
|
Outcome |
|
Publication characteristics | Published studies |
Exclusion criteria |
|
Databases searched | Full publications from databases:
Conference proceeding:
Ongoing trial registries:
|
Selection process | Title-abstract and full-text screening conducted by 2 independent reviewers. Disagreements were resolved by consensus, with a third senior reviewer consulted if needed. |
Data extraction process | Independent extraction by 2 reviewers. Discrepancies were resolved by consensus, with a third senior reviewer consulted if needed. |
Quality assessment | The Cochrane Collaboration’s Risk of Bias tool version 2 was used to assess risk of bias in included clinical trials.12 Quality was assessed by 2 independent reviewers. Discrepancies were resolved by consensus, with a third senior reviewer consulted if needed |
CAPECISP = capecitabine plus cisplatin; CAPOX = capecitabine plus oxaliplatin; ECOG PS = Eastern Cooperative Oncology Group Performance Status; FOLFOX = 5-fluorouracil plus leucovorin plus oxaliplatin; FP = 5-fluorouracil plus cisplatin; GEJ = gastroesophageal junction; OS = overall survival; PFS = progression-free survival
Sources: NMA Study Report,63 sponsor’s summary of clinical evidence.36
ITC Analysis Methods
Methods of the ITC analysis are summarized in Table 21.
Indirect comparison of pembrolizumab plus chemotherapy, nivolumab plus chemotherapy, and chemotherapy alone were made using a Bayesian NMA, with a noninformative prior distribution for both the mean hazards and treatment effects. OS and PFS were analyzed as time-to-event outcomes using both constant and time-varying HRs.
Constant HR: Assuming proportional hazards between treatments, a regression model with a contrast-based normal likelihood for the log HR (and corresponding standard error) of each trial (or comparison) in the network was used to perform the NMA of reported HRs for OS and PFS. The proportional hazards assumption regarding time-to-event outcomes for each individual trial was assessed using the Grambsch and Therneau test,86 whereas the NMA of time-to-event outcomes using HRs was performed according to Dias et al. (2014).87
Time-varying HR: Using a multidimensional treatment effect as an alternative to the synthesis of constant HRs, the hazard functions of the interventions in the trials were modelled with known parametric survival functions or fractional polynomials, and the differences in the parameters were considered to be the multidimensional treatment effect, which was synthesized and indirectly compared across studies. Using this approach, developed by Jansen, the treatment effects were represented by multiple parameters rather than a single parameter.88,89
The primary model was based on the constant HR.
The reported Kaplan-Meier curve for each treatment in the studies included in the NMA were digitized. The Kaplan-Meier curves were divided into consecutive intervals over the follow-up period. Extracted survival proportions for each time interval were used to calculate the patients at risk at the beginning of that interval and the incident number of deaths. A binomial likelihood distribution of the incident events for every interval was employed.
Both random-effects and fixed-effects models were explored. However, due to insufficient evidence to estimate between-study heterogeneity for the random-effect models, the NMA was conducted using the fixed-effects model. The goodness-of-fit for the model was evaluated using the DIC. Convergence was assessed using the Markov chain Monte Carlo method.
Only the analysis for the primary model was reported. No information was given on the details of the assessment of statistical heterogeneity or the clinical and methodological similarity across studies. Because the evidence network for the Canadian adaptation of the NMA did not include any closed loops, no assessment of consistency was performed. The Canadian adaptation of the NMA did not include any sensitivity or subgroup analyses.
Table 21: Analysis Methods for ITC
Methods | Description |
|---|---|
Analysis methods | NMA powered by a Bayesian model; fixed-effects model; constant HR |
Priors | Normal noninformative prior distributions for both mean hazards and treatment effects (mean = 0; variance = 10,000) |
Assessment of model fit | DIC |
Assessment of consistency | No consistency assumption to test |
Assessment of convergence | MCMC |
Outcomes |
|
Follow-up time points | 12 to 48 months |
Construction of nodes | Each treatment was a node in the NMA |
Sensitivity analyses | None conducted in the Canadian adapted NMA |
Subgroup analysis | None conducted |
DIC = deviance information criterion; HR = hazard ratio; MCMC = Markov chain Monte Carlo; NMA = network meta-analysis; OS = overall survival; PFS = progression-free survival.
Sources: NMA Study Report,63 sponsor’s summary of clinical evidence.36
Results of the NMA
Summary of Included Studies
Overall, 66 publications reporting on 17 RCTs, including the KEYNOTE-859 trial, were included in the sponsor’s global systematic literature review. Risk of bias was assessed as low in 14 trials. Some concerns of bias, mostly related to the randomization process, were noted in 3 trials.
From the 17 RCTS included in the global systematic review, 3 met the parameters for eligibility for inclusion (i.e., fluoropyrimidine and platinum–containing chemotherapy regimens alone or in combination with pembrolizumab or nivolumab) in the Canadian adaptation of the systematic review: KEYNOTE-859, KEYNOTE-062, and CheckMate 649. All 3 trials were assessed to be at low risk of bias. The KEYNOTE-062 trial, a phase III RCT comparing pembrolizumab alone or pembrolizumab plus chemotherapy with chemotherapy alone in patients with untreated, locally advanced, unresectable, or metastatic gastric or GEJ cancer with a PD-L1 CPS of 1 or more, was excluded for failing to meet its primary efficacy end point of OS and PFS. The Canadian adaptation of the sponsor’s systematic literature review informing the NMA included 2 trials: KEYNOTE-859 and CheckMate 649.
KEYNOTE-859 is an ongoing multicentre (207 sites in 22 countries), placebo-controlled, randomized (1:1), double-blind, phase III trial evaluating the efficacy and safety of adding pembrolizumab to fluoropyrimidine and platinum–containing chemotherapy as a first-line therapy for HER2-negative advanced gastric or GEJ adenocarcinoma in adult patients.37 Patients were randomly allocated to receive either pembrolizumab 200 mg every 3 weeks (n = 790) or saline placebo (n = 789), each in combination with the physician’s choice of chemotherapy. The primary efficacy end point in the KEYNOTE-859 trial was OS. At the time of data cut-off (October 3, 2022), the median follow-up time was 12.9 months (range, 0.2 to 45.9 months) in the pembrolizumab plus chemotherapy group and 11.8 months (range, 0.1 to 45.5 months) in the placebo and chemotherapy group.
CheckMate 649 was a multicentre (175 sites across 29 countries), randomized (1:1:1), open-label, phase III trial evaluating the efficacy and safety of adding nivolumab to chemotherapy as a first-line therapy for HER2-negative advanced gastric of GEJ adenocarcinoma in adult patients.38 Patients were randomly allocated to receive 1 of 3 treatments: nivolumab 360 mg every 3 weeks or 240 mg every 2 weeks (n = 789) in combination with the physician’s choice of chemotherapy; nivolumab in combination with ipilimumab; or chemotherapy alone (n = 792). The nivolumab plus ipilimumab arm was closed to recruitment on June 5, 2018, due to concerns of the data monitoring committee regarding increased early death rates and high toxicity rates. The dual primary efficacy end point in CheckMate 649 was OS and PFS per RECIST 1.1 by BICR in patients whose tumours had a PD-L1 CPS of 5 or more. The median follow-up for OS was 13.1 months (interquartile range [IQR], 6.7 to 19.1 months) for the nivolumab plus chemotherapy group and 11.1 months (IQR, 5.8 to 16.1 months) for the chemotherapy-alone group.
An overview of the KEYNOTE-859 ad CheckMate 649 trials is presented in Table 22. Several sources of heterogeneity between the 2 trials were identified and summarized in Table 23.
Table 22: Overview of the KEYNOTE-859 and CheckMate 640 Trials
Details | KEYNOTE-859 | CheckMate 649 |
|---|---|---|
Design and population | ||
Study design | Multinational, randomized, double-blind, phase III trial | Multinational, randomized, open-label, phase III trial |
Primary completion date | Expected date: September 2024 | May 2020 |
Randomization (N) | N = 1,579
| N = 1,581
|
Inclusion criteria |
|
|
Patients baseline characteristics, n (%) | ||
Sex | ||
Male | 1,071 (67.8) | 1,100 (69.6) |
Race | ||
White | 861 (54.5) | 1,097 (69.4) |
Asian | 539 (34.1) | 375 (23.7) |
ECOG PS = 1 | 991 (62.8) | 914 (57.8) |
Disease stage IV | 1,520 (96.3) | 1,513 (95.7) |
Diffuse histology | 619 (39.2) | 527 (33.3) |
Primary cancer site, stomach | 1,243 (78.7) | 1,110 (70.2) |
MSI-H | 71 (4.5) | 44 (2.8) |
Drugs | ||
Intervention | Pembrolizumab: 200 mg IV on day 1 of each 3-week cycle for up to 35 cycles In combination with: 5-fluorouracil — 800 mg/m2 IV on day 1 to day 5 of each 3-week cycle for up to 35 cycles AND Cisplatin — 80 mg/m2 IV on day 1 of each 3-week cycle for up to 35 cycles (may be capped at 6 cycles, per local country guidelines) OR In combination with: Capecitabine — 1,000 mg/m2 orally twice daily on day 1 to day 14 of each 3-week cycle for up to 35 cycles AND Oxaliplatin — 130 mg/m2 IV on day 1 of each 3-week cycle for up to 35 cycles (may be capped at 6 cycles, per local country guidelines) | Nivolumab: 360 mg administered by IV infusion over 30 minutes on day 1 of each 3- week cycle In combination with: Capecitabine —1,000 mg/m2 orally twice daily on day 1 to day 14 of each 3-week cycle AND Oxaliplatin — 130 mg/m2 IV on day 1 of each 3-week cycle OR Nivolumab — 240 mg administered by IV infusion over 30 minutes on day 1 of every 2-week cycle In combination with: FOLFOX — oxaliplatin 85 mg/m2, leucovorin 400 mg/m2 AND 5-FU — 400 mg/m2 IV on day 1; 5-FU 1,200 mg/m2 administered by continuous IV infusion over 24 hours on day 1 and day 2 of a 14-day treatment cycle |
Control | Placebo: 200 mg IV on day 1 of each 3-week cycle for up to 35 cycles In combination with the same combination of drugs as the intervention group | Chemotherapy alone in the combination drugs, as in the intervention group |
ECOG PS = Eastern Cooperative Oncology Group Performance Status; GEJ = gastroesophageal junction; MSI-H = microsatellite instability-high.
Source: Sponsor’s summary of clinical evidence.36
Table 23: Assessment of Homogeneity in the KEYNOTE-859 and CheckMate 640 Trials
Characteristics | Description and handling of potential effect modifiers |
|---|---|
HER2 status | The KEYNOTE-859 trial only included patients who were documented as having HER2-negative disease. The CheckMate 649 trial excluded patients with known HER2-positive tumours, allowing patients with unknown HER2 status to be enrolled in the trial. The sponsor noted that the occurrence of HER2-positive tumours is infrequent enough to assume that patients with unknown HER2 status were likely to have HER2-negative disease. The clinical experts consulted for the purpose of this review agreed with the sponsor’s assessment. |
PD-L1 expression |
|
ECOG PS | The KEYNOTE-859 trial included patients with an ECOG PS of 0 or 1, whereas the CheckMate 649 trial also included patients with an ECOG PS of 2. The proportion of patients with an ECOG PS of 2 in the CheckMate 649 trial was less than 1%; therefore, it was not considered to be a meaningful effect modifier. |
Other patient characteristics |
|
Comparator | Both the KEYNOTE-859 and CheckMate 649 trials evaluated specific fluoropyrimidine-platinum doublets alone and in combination with pembrolizumab and nivolumab, respectively. In the KEYNOTE-859 trial, patients received CAPOX or FP with or without pembrolizumab. In the CheckMate 649 trial, patients received CAPOX or FOLFOX with or without nivolumab. Although there was some overlap in the specific fluoropyrimidine-platinum doublets administered (86.3% and 46.5% of patients in the KEYNOTE-859 and CheckMate 649 trials, respectively, received CAPOX), FP was used in 13.7% of patients in the KEYNOTE-859 trial and FOLFOX was used in 53.4% of patients in the CheckMate 649 trial. Although the trials did not use the same chemotherapy doublet regimen, the doublets are considered equivalent. |
Dosing of comparators | Dosing of the different chemotherapies was relatively consistent between the KEYNOTE-859 and CheckMate 649 trials. However, a lack of information about the frequency of administration in the CheckMate 649 trial precluded the review team from assessing comparability in dosing between the trials. |
Definitions of end points | The definitions for OS and PFS were relatively consistent between the KEYNOTE-859 and CheckMate 649 trials.
|
Analysis population | The analysis population in the KEYNOTE-859 trial consisted of patients with a PD-L1 CPS of 1 or more, a PD-L1 CPS of 10 or more, and all enrolled patients regardless of PD-L1 expression. In the CheckMate 649 trial, the analysis population consisted of patients with a PD-L1 CPS of 5 or more and all enrolled patients regardless of PD-L1 expression. To mitigate differences in the analysis population, the NMA was based on all enrolled patients regardless of PD-L1 expression. |
Follow-up time | In the KEYNOTE-859 trial, the median follow-up time was 12.9 months (range, 0.2 to 45.9 months) in the pembrolizumab plus chemotherapy group and 11.8 months (range, 0.1 to 45.5 months) in the placebo and chemotherapy group; in the CheckMate 649 trial, the median follow-up time was 13.1 months (IQR, 6.7 to 19.1 months) for the nivolumab plus chemotherapy group and 11.1 months (IQR, 5.8 to 16.1 months) for the chemotherapy alone group. Based on clinical expert input, the duration of follow-up time in the 2 trials was considered comparable. |
Study design |
|
BICR = blinded independent central review; CAPOX = capecitabine plus oxaliplatin; CPS = combined positive score; ECOG PS = Eastern Cooperative Oncology Group Performance Status; FOLFOX = 5-FU plus leucovorin plus and oxaliplatin; FP = 5-FU plus cisplatin; GEJ = gastroesophageal junction; IQR = interquartile range; NMA = network meta-analysis; OS = overall survival; PD-L1 = programmed cell death 1 ligand 1; PFS = progression-free survival; RECIST 1.1 = Response Evaluation Criteria in Solid Tumours Version 1.1; vs. = versus.
Sources: NMA Study Report,63 sponsor’s summary of clinical evidence.36
Evidence Networks
Global Network
Of the 17 RCTs identified in the global systematic literature, 3 were excluded from the network for not meeting the assumption of equivalence among the various fluoropyrimidine-platinum doublets, leaving 14 trials to form the connected evidence network of the global NMA. The evidence network for the global NMA is presented in Appendix 1 (Figure 8).
Of the 14 trials that formed the connected evidence network of the global NMA, 10 were excluded from the base-case analysis, per the feasibility assessment. Studies excluded from the base-case NMA had evaluated unapproved treatments, monotherapy, or triplet chemotherapy, or were conducted exclusively in an Asian country (Appendix 1, Table 29). Although the KEYNOTE-062 trial was excluded from global base-case NMA for not meeting its primary efficacy end points of OS and PFS, it was included in the sensitivity analysis that considered failed trials of approved treatments. The feasibility of the inclusion of trials in the base-case analysis and the sensitivity analyses is summarized in Appendix 1. Figure 6 depicts the final network of evidence of the global base case. The global base case included 4 trials: KEYNOTE-859, CheckMate 649, RATIONALE-305, and GASTFOX-PRODIGE 5. No closed loops were formed. The nivolumab plus ipilimumab arm of the CheckMate 649 trial was excluded from the network, as ipilimumab was classified as an unapproved treatment.
Canadian Adapted Network
For the purpose of this review, the sponsor’s summary of the clinical evidence focuses on the networks relevant to the Canadian setting. The Canadian network of evidence is presented in Figure 7. The Canadian adaptation of the NMA consists of 2 trials evaluating 2 interventions — pembrolizumab in combination with fluoropyrimidine-platinum doublet chemotherapy, and nivolumab in combination with fluoropyrimidine-platinum doublet chemotherapy — connected by the comparison to fluoropyrimidine-platinum doublet combination chemotherapy alone. No closed loops were formed. The NMA was conducted assuming constant HRs. Because the reimbursement request is for all patients, regardless of PD-L1 expression, the sensitivity analysis was not considered in the Canadian adaptation of the NMA.
Figure 6: Base-Case Network of Evidence
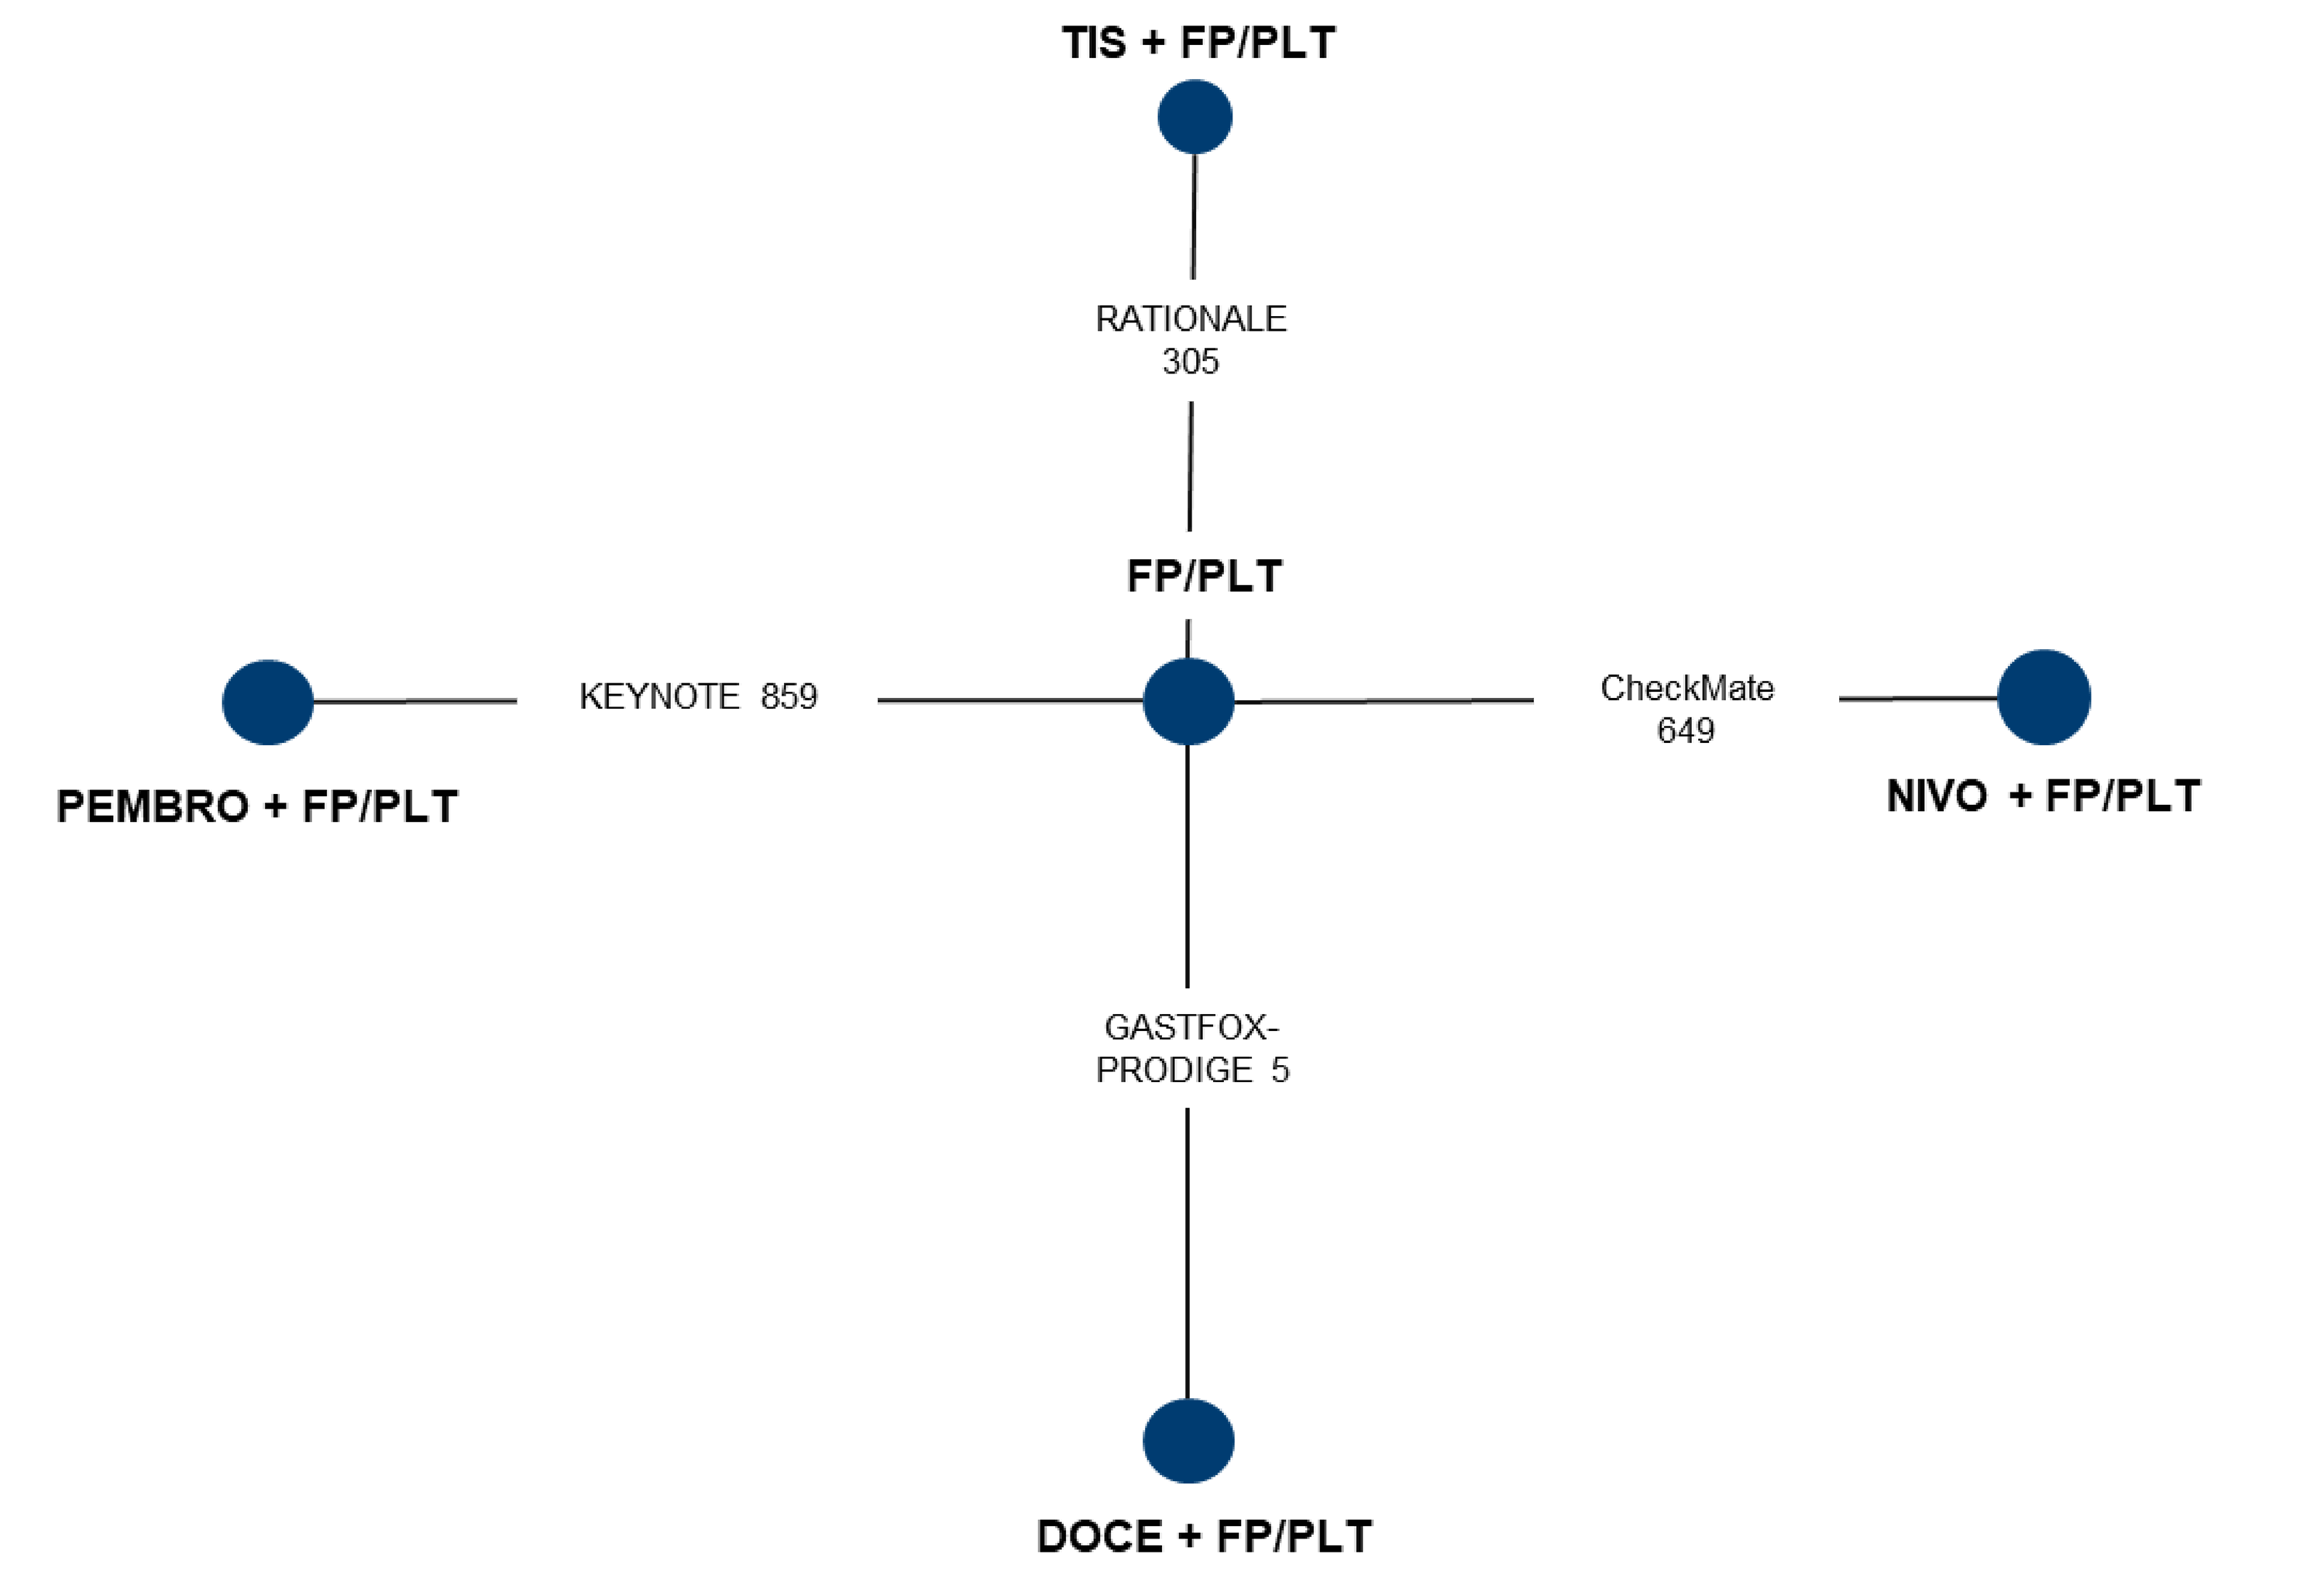
DOCE = docetaxel; FP/PLT = fluoropyrimidine-platinum doublet; GEJ = gastroesophageal junction; NIVO = nivolumab; PEMBRO = pembrolizumab; TIS = tislelizumab.
Source: NMA Study Report.63
Figure 7: Canadian Network of Evidence

FP/PLT = fluoropyrimidine-platinum doublet; GEJ = gastroesophageal junction; NIVO = nivolumab; PEMBRO = pembrolizumab.
Sources: NMA Study Report,63 sponsor’s summary of clinical evidence.36
Results
Overall Survival
The HRs and the 95% Crls across various comparisons for OS are summarized in Table 24. The NMA was constructed using a fixed-effects model (DIC = 7.36; deviance = 3.35). For the treatment response on OS, pembrolizumab or nivolumab added to chemotherapy was favoured over chemotherapy alone. The CrIs for the comparisons between pembrolizumab plus chemotherapy and nivolumab plus chemotherapy showed little to no difference in OS between the treatments (HR, 0.99; 95% CrI, 0.85 to 1.15).
The time-varying hazard NMA for OS is presented in Appendix 1 (Table 30).
Table 24: Fixed-Effects NMA for OS, Constant HR (95% Crl)
Treatment | Pembro plus FP/PLT | Nivo plus FP/PLT | FP/PLT |
|---|---|---|---|
Pembro plus FP/PLT | — | 0.99 (0.85 to 1.15) | 0.78 (0.70 to 0.87) |
Nivo plus FP/PLT | 1.01 (0.87 to 1.18) | — | 0.79 (0.71 to 0.88) |
FP/PLT | 1.28 (1.15 to 1.43) | 1.27 (1.14 to 1.41) | — |
CrI = credible interval; FP/PLT = fluoropyrimidine-platinum doublet; HR = hazard ratio; NMA = network meta-analysis; Nivo = nivolumab; OS = overall survival, Pembro = pembrolizumab.
Note: Each cell represents the comparison (HR and 95% Crl) of the row-defined treatment vs. the column-defined treatment.
Sources: NMA Study Report,63 sponsor’s summary of clinical evidence.36
Progression-Free Survival
The HR and 95% Crl across various comparisons for PFS are summarized in Table 25. The NMA was constructed using a fixed model (DIC = 5.37; deviance = 2.36). For the treatment response on PFS, pembrolizumab or nivolumab added to chemotherapy was favoured over chemotherapy alone. The Crls for the comparisons between pembrolizumab plus chemotherapy and nivolumab plus chemotherapy showed little to no difference in PFS between the treatments (HR, 0.96; 95% Crl, 0.82 to 1.13).
The time-varying hazard NMA for PFS is presented in Appendix 1 (Table 31).
Table 25: Fixed-Effects NMA for PFS, Constant HR (95% Crl)
Treatment | Pembro plus FP/PLT | Nivo plus FP/PLT | FP/PLT |
|---|---|---|---|
Pembro plus FP/PLT | — | 0.96 (0.82 to 1.13) | 0.76(0.68 to 0.85) |
Nivo plus FP/PLT | 1.04 (0.88 to 1.23) | — | 0.79 (0.71 to 0.88) |
FP/PLT | 1.32 (1.17 to 1.48) | 1.27 (1.13 to 1.42) | — |
CrI = credible interval; FP/PLT = fluoropyrimidine-platinum doublet; HR = hazard ratio; NMA = network meta-analysis; Nivo = nivolumab; Pembro = pembrolizumab; PFS = progression-free survival.
Note: Each cell represents the comparison (HR and 95% Crl) of the row-defined treatment versus the column-defined treatment.
Sources: NMA Study Report,63 sponsor’s summary of clinical evidence.36
Critical Appraisal
The sponsor-submitted NMA was based on studies identified from a systematic literature review of relevant evidence. The systematic literature review was based on population, intervention, control, and outcomes (PICO) defined a priori. The systematic literature review involved searches in multiple electronic databases, clinical registries, and supplementary sources. Because the search and selection of relevant studies were restricted to trials published in English, relevant non-English publications may have been excluded. It is unknown if there were any unpublished studies missed in the network. The reasons for study exclusions were reported and the selection and data extraction processes were defined. Data extraction was conducted by 2 reviewers in a double-blinded fashion. Although the risk of bias in the comparator trials was assessed, risk of bias was not assessed by outcome.
The assumption of transitivity — that there are no systemic differences between the available comparisons other than the treatment being compared — is integral for ensuring an NMA is valid.96 Of the trials included in the Canadian adaptation of the NMA, several sources of clinical and methodological heterogeneity were identified. The most notable were differences in the primary analysis population, PD-L1 expression, and study design. The primary analysis population was different between the trials. The analysis population in the KEYNOTE-859 trial consisted of patients with a PD-L1 CPS of 1 or more, a PD-L1 CPS of 10 or more, and all enrolled patients regardless of PD-L1 expression. In the CheckMate 649 trial, the analysis population consisted of patients with a PD-L1 CPS of 5 or more and all enrolled patients regardless of PD-L1 expression. To mitigate the differences in analysis populations between the trials, an NMA was conducted using all enrolled patients, regardless of PD-L1 expression. However, a greater proportion of patients in the CheckMate 649 trial than in the KEYNOTE-859 trial had a PD-L1 CPS of 10 or more (49% versus 35%) The lack of stratified results for a PD-L1 CPS of 5 or more and a PD-L1 CPS of 10 or more in both trials precluded a sensitivity analysis to explore this potential bias or adjust for this difference. In terms of study design, the KEYNOTE-859 trial employed a double-blinded study design, whereas the CheckMate 649 trial was an open-label trial. To minimize any bias inherent in open-label trials, efficacy results were based on BICR. Finally, the NMA results were based on the final analysis from the CheckMate 649 trial (completion date, May 2020) and the interim analysis from the KEYNOTE-859 trial (data cut-off date, October 3, 2023). Accordingly, the review team was not able to rule out the possibility that final analysis results from the KEYNOTE-859 trial, if available, would have impacted the indirect comparison of pembrolizumab versus nivolumab differently. The sources of clinical and methodological heterogeneity may have biased effect estimates of the ITC.
The NMA of time-to-event outcomes based on constant HRs — such as OS and PFS — may bias the results when the proportional hazards assumption does not hold. To account for changes in HRs over time, the sponsor provided both constant HR and time-varying HR methods for the NMA. The time-varying HRs for pembrolizumab plus chemotherapy and nivolumab versus nivolumab remained consistent over time, and were concordant with the results of the constant NMA for OS and PFS. Accordingly, the assumption of proportional hazards was likely met.
The Canadian adaptation of the NMA was limited by the available data; with only 1 trial informing each comparison, analysis using a random-effects model was not feasible and results from the fixed-effects analysis were predicated on an assumption of minimal between-study heterogeneity. Of concern is the exclusion of the KEYNOTE-062 trial from the Canadian adaptation of the NMA. Although the trial met the eligibility criteria for inclusion, it was excluded for not meeting its primary end point. Sensitivity analyses that included unproven trials in the global NMA were consistent with the base analysis. However, it is uncertain whether results of the sensitivity analyses for the global NMA can be applied to the Canadian adapted NMA.
NMA results were presented only for OS and PFS; harms outcomes and other outcomes of relevance to patients (e.g., HRQoL) were not reported.
Studies Addressing Gaps in the Systematic Review Evidence
No studies addressing gaps in the evidence from the systematic review were included in this submission.
Discussion
Summary of Available Evidence
The evidence summarized for pembrolizumab in combination with fluoropyrimidine-platinum doublet chemotherapy in the treatment of HER2-negative locally advanced or metastatic gastric or GEJ adenocarcinoma was based on 1 sponsor-conducted phase III RCT (KEYNOTE-859) and 1 sponsor-conducted ITC.
The KEYNOTE-859 trial is an ongoing multicentre, placebo-controlled, double-blind, phase III RCT evaluating the efficacy and safety of adding pembrolizumab to fluoropyrimidine-platinum doublet chemotherapy as a first-line therapy for HER2-negative advanced gastric or GEJ cancer in adult patients.34 Patients were randomly allocated to receive treatment with either pembrolizumab 200 mg every 3 weeks (n = 790) or placebo (n = 789), each in combination with chemotherapy. The primary efficacy outcome for the KEYNOTE-859 trial was OS; HRQoL and harms were also assessed.
The mean age of patients was 59.5 years (SD = 11.9 years) in the pembrolizumab plus chemotherapy group and 60.0 years (SD = 11.8 years) in the placebo plus chemotherapy group. In terms of disease characteristics, 18.9% of patients in the pembrolizumab plus chemotherapy group presented with adenocarcinoma of the GEJ and 81.0% presented with adenocarcinoma of the stomach; in the placebo plus chemotherapy group, 23.4% and 76.4% of patients presented with adenocarcinoma of the GEJ and stomach, respectively. Approximately 78% of patients in both treatment groups were documented with a PD-L1 CPS of 1 or more. A greater proportion of patients in the pembrolizumab plus chemotherapy group than in the placebo and chemotherapy group reported using levothyroxine sodium (16.7% versus 5.7%). The administration of subsequent anticancer treatments was relatively consistent between the pembrolizumab plus chemotherapy and placebo plus chemotherapy groups (44.9% versus 46.8%). Overall, the clinical experts consulted on this review agreed that the results of the KEYNOTE-859 trial were applicable to the patients seen the practice setting in Canada.
In the absence of head-to-head evidence comparing pembrolizumab with other relevant advanced therapies used in the treatment of HER2-negative locally advanced or metastatic gastric or GEJ adenocarcinoma, the sponsor submitted 1 ITC, in the form of an NMA.63 The NMA indirectly evaluated the relative efficacy of pembrolizumab in combination with fluoropyrimidine-platinum doublet chemotherapy against nivolumab in combination with fluoropyrimidine-platinum doublet chemotherapy, and was used to inform the sponsor-submitted economic model.
There were no long-term extension studies or studies addressing gaps in the evidence included in this submission.
Interpretation of Results
Efficacy
Evidence from the pivotal phase III trial, KEYNOTE-859, showed that first-line treatment with pembrolizumab plus fluoropyrimidine and platinum–containing chemotherapy in adult patients with locally advanced, unresectable, or metastatic HER2-negative of GEJ adenocarcinoma resulted in improved OS and PFS compared to saline placebo plus with fluoropyrimidine- and platinum–containing chemotherapy.
Based on input from the clinical experts consulted by for the purpose of this review, improved OS is the main clinical outcome of importance for any treatment in oncology. The clinical experts noted that an increase of 5% to 10% in the proportion of patients alive at month 12 and month 30 is clinically meaningful. Although the observed probability of increased survival at 12 months met the threshold for a clinically meaningful improvement in OS, the lower bound of the 95% CI was compatible with little to no clinically important difference. The GRADE standard suggests with moderate certainty the benefit at 12 months. At 30 months, however, there is high certainty that the addition of pembrolizumab to chemotherapy resulted in a clinically important improvement in OS.
Subgroup analysis of OS suggested the potential for differential treatment effects, both from PD-L1 CPS (< 1 or ≥ 1) and MSI status (yes or no). In fact, no difference in OS was observed among patients with a PD-L1 CPS of less than 1 (HR, 0.92; 95% CI, 0.73 to 1.17), indicating that the difference in OS observed in the overall study was driven primarily by patients with a PD-L1 CPS of 1 or greater (HR, 0.73; 95% CI, 0.65 to 0.83). The treatment effect on OS was more pronounced among patients with a PD-L1 CPS of 10 or greater (HR, 0.64; 95% CI, 0.52 to 0.7) than among patients with a PD-L1 CPS of less than 10 (HR, 0.86; 95% CI, 0.75 to 0.98). As shown in the KEYNOTE-062 trial, the treatment effect of pembrolizumab was more evident among patients with a PD-L1 CPS of 10 or greater. The treatment effect on OS was likely more pronounced among patients with an MSI-H status (HR, 0.35; 95% CI, 0.18 to 0.66) than among patients with a non-MSI status (HR, 0.79; 95% CI, 0.7 to 0.89). Of note, OS data were based on the interim analysis. As OS continues to the final analysis, the use of subsequent therapies may change the context when interpreting final OS. In the context of subsequent therapies, the between-group difference in OS is often attenuated by the use of subsequent treatment. However, it might be argued that the impact of the adding pembrolizumab to chemotherapy on OS, when followed by subsequent therapy, is a relevant clinical question if the subsequent treatments provided are aligned with clinical practice. Of note, although re-treatment was allowed in patients who were randomized to receive pembrolizumab if prespecified criteria were met, which could affect the interpretation of the treatment effect, it is unknown what proportion of patients received re-treatment.
In the assessment of PFS by the CDA-AMC review team, there is high certainty that the addition of pembrolizumab to chemotherapy resulted in an increase in PFS compared with placebo plus chemotherapy. In the KEYNOTE-859 trial, improved PFS was consistent with an improvement in OS; however, the trial demonstrated little to no difference in HRQoL.
HRQoL was considered an important and meaningful outcome to both patients and clinicians. The EORTC QLQ-C30 and EORTC QLQ-STO22 captured domains considered important to the patient group and clinical experts, including global QoL, nausea and vomiting, and pain. The addition of pembrolizumab to chemotherapy may result in little to no clinically important difference in global health status/QoL scale or in nausea and vomiting at week 18, as measured by the EORTC QLQ-30. The addition of pembrolizumab to chemotherapy likely resulted in decreased pain, as measured by the EORTC QLQ-STO22. However, the clinical importance of the group difference is unclear. The assessment of HRQoL outcomes by both questionnaires was subject to the risk of attrition bias, as data were available only for approximately 65% of patients at week 18. Using a range of between-group MID estimates for various other cancer types,72 the effect estimates and both the upper and lower bounds of the 95% CI suggested little to no clinically important difference.
No direct comparative evidence between pembrolizumab and relevant comparators used in the practice setting in Canada were identified. To address this gap, a sponsor-conducted NMA was submitted that indirectly compared pembrolizumab plus fluoropyrimidine and platinum–containing chemotherapy with nivolumab plus fluoropyrimidine and platinum–containing chemotherapy for the first-line treatment of locally advanced, unresectable, or metastatic HER2-negative gastric and GEJ adenocarcinoma. The indirect comparative evidence from the NMA suggested that there was little to no difference in treatment effect on OS or PFS between pembrolizumab plus chemotherapy and nivolumab plus chemotherapy groups. The NMA results, however, are associated with uncertainty due to the potential for intransitivity and the exclusion of the KEYNOTE-062 trial from the evidence network.
Several evidence gaps were identified. First, the long-term effects of adding pembrolizumab to chemotherapy are uncertain. No long-term extension studies were included in the submission. Second, due to the lack of evidence on weight-based testing, the direct assumption that weight-based dosing will lead to the same outcomes as a fixed dose cannot be made. Finally, because dose-effect interactions were not reported, there is uncertainty about the impact of different dosing schedules on treatment efficacy.
As previously described, the patient and clinician groups and the clinical experts consulted on this review emphasized the unmet need for more treatment options associated with improved survival and improved QoL for patients with locally advanced and metastatic HER2-negative gastric and GEJ adenocarcinoma. The addition of pembrolizumab to chemotherapy would represent an additional first-line SOC treatment for this patient population that is likely to result in a clinically important OS benefit. There is uncertainty about whether the unmet need of improved QoL would be met.
Finally, it is unknown whether the treatment effect on OS would be generalizable to patients excluded from the trial, especially patients with an ECOG PS of 2 who, in clinical practice, are managed in a manner similar to patients with an ECOG PS of 0 or 1. In addition, with limited data presented in the trial, further evidence is needed on whether pembrolizumab plus chemotherapy will be of the same benefit regardless of a patient’s PD-L1 CPS and/or MSI status.
Harms
The addition of pembrolizumab to chemotherapy resulted in an increase in immunotherapy-mediated AEs and grade or 3 worse immunotherapy-mediated AEs compared to placebo plus chemotherapy.
Although any grade 3 or worse AEs were more frequently reported in the pembrolizumab plus chemotherapy group than in the placebo plus chemotherapy group (75.3% versus 69.6%), SAEs were comparable between the 2 groups (45.2% versus 40.2%). Based on input from the patient group, treatment tolerability is important when considering a new treatment option. The proportion of patients who discontinued any of the investigational medicinal treatments due to an AE was higher in the pembrolizumab plus chemotherapy group than in the placebo plus chemotherapy group (37.7% versus 25.9%). A greater proportion of patients discontinued pembrolizumab than placebo (14.8% versus 10.9%). Deaths due to an AE were comparable between the treatment groups (8.2% versus 7.4%). The clinical experts consulted for the purpose of this review did not observe any new safety concerns in the KEYNOTE-859 trial.
The product monograph for pembrolizumab includes warnings and precautions about immune-mediated adverse reactions, infusion-related reactions, complications of allogeneic hematopoietic stem cell transplant, and embryo-fetal toxicity. Per the product label, common adverse reactions (reported in at least 20% of patients) to pembrolizumab when used in combination with chemotherapy included fatigue, nausea, constipation, diarrhea, decreased appetite, rash, vomiting, cough, dyspnea, pyrexia, alopecia, peripheral neuropathy, mucosal inflammation, stomatitis, headache, and weight loss.58
Conclusion
One randomized, double-blind, placebo-controlled phase III trial in adult patients with locally advanced, unresectable, or metastatic HER2-negative gastric or GEJ adenocarcinoma shows that first-line treatment with pembrolizumab in combination with chemotherapy compared to chemotherapy alone (FP or CAPOX) resulted in a clinically important improvement in OS. Subgroup analyses revealed a potential inconsistency in treatment effects across different subgroups, particularly for patients with a PD-L1 CPS of less than 1 and/or non-MSI-H status, who may not benefit from treatment to the same degree as their counterparts. The observed treatment effect of pembrolizumab plus chemotherapy was most likely driven by patients with a PD-L1 CPS of 1 or greater. Further evidence is needed to determine whether pembrolizumab plus chemotherapy would be of same benefit regardless of a patient’s MSI-H status. There were insufficient data to enable a long-term outcome assessment beyond 30 months. Evidence of high certainty from the pivotal trial suggested that, at 30 months, adding pembrolizumab to chemotherapy results in a clinically important increase in OS. Consistently, evidence of high certainty suggested that first-line treatment with pembrolizumab plus chemotherapy results in improved PFS, but with little to no difference in HRQoL, measured with the EORTC QLQ-C30 global health scale/QoL and nausea/vomiting scales, despite a likely improvement in pain-related symptoms measured with the EORTC QLQ-STO22. Immunotherapy-mediated AEs and any grade 3 or worse AEs were more frequently reported in the pembrolizumab plus chemotherapy group than in the placebo plus chemotherapy group, even though SAEs were likely comparable between the 2 groups. Based on indirect evidence, there appeared to be little to no difference in OS or PFS between pembrolizumab plus chemotherapy and nivolumab plus chemotherapy in patients with locally advanced, unresectable, or metastatic HER2-negative gastric or GEJ adenocarcinoma. The indirect evidence, however, is associated with uncertainty due to clinical and methodological heterogeneities between the studies included in ITC, which could potentially introduce bias into the reported effect estimates if the assumption of transitivity is not met.
References
1.Brenner DR, Poirier A, Woods RR, et al. Projected estimates of cancer in Canada in 2022. CMAJ. 2022;194(17):E601-E607. PubMed
2.Canadian Cancer Statistics Advisory Committee in collaboration with the Canadian Cancer Society, Statistics Canada, and the Public Health Agency of Canada. Canadian Cancer Statistics 2023. Toronto (ON): Canadian Cancer Society; 2023: https://cdn.cancer.ca/-/media/files/research/cancer-statistics/2023-statistics/2023_PDF_EN.pdf. Accessed 2024 Jan 30.
3.Arnold M, Ferlay J, van Berge Henegouwen MI, Soerjomataram I. Global burden of oesophageal and gastric cancer by histology and subsite in 2018. Gut. 2020;69(9):1564-1571. PubMed
4.National Cancer Institute. What is stomach cancer? https://www.cancer.gov/types/stomach. Accessed 2023 Dec 20.
5.Society CC. Risks for stomach cancer. Stomach cancer https://cancer.ca/en/cancer-information/cancer-types/stomach/risks. Accessed 2023 Dec 20.
6.Moss SF. The Clinical Evidence Linking Helicobacter pylori to Gastric Cancer. Cell Mol Gastroenterol Hepatol. 2017;3(2):183-191. PubMed
7.Van Cutsem E, Sagaert X, Topal B, Haustermans K, Prenen H. Gastric cancer. Lancet. 2016;388(10060):2654-2664. PubMed
8.Canadian Cancer Statistics Advisory Committee. Canadian Cancer Statistics: A 2018 special report of cancer incidence by stage. Toronto (ON): Canadian Cancer Society; 2018: https://cdn.cancer.ca/-/media/files/research/cancer-statistics/2018-statistics/canadian-cancer-statistics-2018-en.pdf. Accessed 2022 Jan 20.
9.Rupp SK, Stengel A. Influencing Factors and Effects of Treatment on Quality of Life in Patients With Gastric Cancer-A Systematic Review. Front Psychiatry. 2021;12:656929. PubMed
10.CADTH Reimbursement Review: Nivolumab (Opdivo). Can J Health Technol. 2022;2(7). https://www.cadth.ca/sites/default/files/DRR/2022/PC0259-Opdivo-combinedReport.pdf. Accessed 2023 Oct 30.
11.National Cancer Institute. Surveillance, Epidemiology, and End Results Program. Cancer Stat Facts: Stomach Cancer. https://seer.cancer.gov/statfacts/html/stomach.html. Accessed 2023 Dec 11.
12.Higgins JPT, Thomas J, Chandler J, et al. Cochrane handbook for systematic reviews of interventions [accessed by sponsor]. Hoboken (NJ): John Wiley & Sons Inc; 2019.
13.Ding PQ, Dolley A, Cheung WY. Trifluridine/Tipiracil in the Real-World Management of Metastatic Gastric and Gastroesophageal Junction Cancers in Canada. Curr Oncol. 2022;30(1):130-144. PubMed
14.pan-Canadian Oncology Drug Review Final Clinical Guidance Report: Trifluridine-Tipiracil (Lonsurf) for Gastric Cancer. Toronto (ON): CADTH; 2020: https://www.cda-amc.ca/sites/default/files/pcodr/Reviews2020/10197TrifluridineTipiracilGC_fnCGR_NOREDACT_EC24Mar2020_final.pdf. Accessed 2024 Apr 4.
15.Colquhoun A, Arnold M, Ferlay J, Goodman KJ, Forman D, Soerjomataram I. Global patterns of cardia and non-cardia gastric cancer incidence in 2012. Gut. 2015;64(12):1881-1888. PubMed
16.Stellato D, Thabane M, Eichten C, Delea TE. Preferences of Canadian Patients and Physicians for Treatment of HR+/HER2- Advanced Breast Cancer. Curr Oncol. 2021;28(1):491-508. PubMed
17.Li Y, Feng A, Zheng S, Chen C, Lyu J. Recent Estimates and Predictions of 5-Year Survival in Patients with Gastric Cancer: A Model-Based Period Analysis. Cancer Control. 2022;29:10732748221099227. PubMed
18.National Comprehensive Cancer Network. NCCN Guidelines: Gastric Cancer (Version 1.2023). 2023; https://www.nccn.org/guidelines/guidelines-detail?category=1&id=1434. Accessed 2023 Jul 10.
19.Janjigian YY, Shitara K, Moehler M, et al. First-line nivolumab plus chemotherapy versus chemotherapy alone for advanced gastric, gastro-oesophageal junction, and oesophageal adenocarcinoma (CheckMate 649): a randomised, open-label, phase 3 trial. Lancet. 2021;398(10294):27-40. PubMed
20.CADTH Provisional Funding Algorithm for HER2-Negative Gastric, Gastroesophageal Junction (GEJ), or Esophageal Cancer. Ottawa (ON): CADTH; 2022: https://www.cadth.ca/sites/default/files/pdf/PH0010-EC%20GEJC%20GC-Final-Report.pdf. Accessed 2024 Feb 7.
21.CADTH Reimbursement Recommendation: Nivolumab (Opdivo) [accessed by sponsor]. Can J Health Technol. 2022;2(3). https://www.cda-amc.ca/sites/default/files/DRR/2022/PC0259%20Opdivo%20-%20Final%20CADTH%20Rec.pdf.
22.Sun JM, Shen L, Shah MA, et al. Pembrolizumab plus chemotherapy versus chemotherapy alone for first-line treatment of advanced oesophageal cancer (KEYNOTE-590): a randomised, placebo-controlled, phase 3 study. Lancet. 2021;398(10302):759-771. PubMed
23.Keytruda (pembrolizumab): 100 mg/4 mL vial solutions for infusion [draft product monograph]. Kirkland, QC: Mecrk Canada Inc.; 2023 Mar 20.
24.Keytruda (pembrolizumab): 100 mg/4ml solution for infusion [product monograph]. Kirkland (QC): Merck Canada Inc.; 2024 Mar 21.
25.Cancer Care Ontario. Drug Formulary: CISPFU+TRAS. https://www.cancercareontario.ca/en/drugformulary/regimens/monograph/45161. Accessed 2023 Nov 3.
26.European Organisation for Research Treatment of Cancer. EORTC Quality of Life Questionnaires. https://qol.eortc.org/questionnaires/. Accessed 2024 Jan 25.
27.EORTC QLQ-C30 scoring manual. Brussels (BE): EORTC; 2001: https://www.eortc.org/app/uploads/sites/2/2018/02/SCmanual.pdf. Accessed 2024 Jan 25.
28.Vickery CW, Blazeby JM, Conroy T, et al. Development of an EORTC disease-specific quality of life module for use in patients with gastric cancer. Eur J Cancer. 2001;37(8):966-971. PubMed
29.Guyatt GH, Briel M, Glasziou P, Bassler D, Montori VM. Problems of stopping trials early. BMJ. 2012;344:e3863. PubMed
30.Bassler D, Briel M, Montori VM, et al. Stopping randomized trials early for benefit and estimation of treatment effects: systematic review and meta-regression analysis. JAMA. 2010;303(12):1180-1187. PubMed
31.Sponsor's clinical summary report title [internal sponsor's report]. In: Drug Reimbursement Review sponsor submission: pembrolizumab, 200 mg and 400 mg, IV infusion. Kirkland (QC): Merck Canada Inc.; 2024 Mar 13.
32.Balshem H, Helfand M, Schunemann HJ, et al. GRADE guidelines: 3. Rating the quality of evidence. J Clin Epidemiol. 2011;64(4):401-406. PubMed
33.Santesso N, Glenton C, Dahm P, et al. GRADE guidelines 26: informative statements to communicate the findings of systematic reviews of interventions. J Clin Epidemiol. 2020;119:126-135. PubMed
34.Clinical Study Report: P859V01MK3475. A phase 3 randomized, double-blind clinical study of pembrolizuamab (MK-3475) plus chemotherapy versus placebo plus chemotherapy as first-line treatment in participants wit HER2 negative, previously untreated, unresectable or metastatic gastric or gastroesophageal junction adenocarcinoma (KEYNOTE-859) [internal sponsor's report]. Whitehouse Station (NJ): Merck Sharp & Dohme Corp.; 2023 Feb 13.
35.Merck Canada Inc. response to April 29, 2024 CADTH request for additional information regarding pembrolizumab CADTH review: Absolute effects for GRADE rating of efficacy and adverse events outcomes [internal additional sponsor's information]. Kirkland (QC): Merck Canada Inc.; 2024 May 6.
36.Sponsor Summary of Clinical Evidence [internal sponsor's report]. In: Drug Reimbursement Review sponsor submission: Pembrolizumab, 100 mg/4 mL vial, solution for infusion Kirkland (QC): Merck Canada Inc.; 2024 Mar 27.
37.Rha SY, Oh DY, Yanez P, et al. Pembrolizumab plus chemotherapy versus placebo plus chemotherapy for HER2-negative advanced gastric cancer (KEYNOTE-859): a multicentre, randomised, double-blind, phase 3 trial. Lancet Oncol. 2023;24(11):1181-1195. PubMed
38.Janjigian YY, Shitara K, Moehler MH, et al. Nivolumab (NIVO) plus chemotherapy (chemo) vs chemo as first-line (1L) treatment for advanced gastric cancer/gastroesophageal junction cancer/esophageal adenocarcinoma (GC/GEJC/EAC): 3-year follow-up from CheckMate 649. J Clin Oncol. 2023;41(4_suppl):291-291.
39.Joshi SS, Badgwell BD. Current treatment and recent progress in gastric cancer. CA Cancer J Clin. 2021;71(3):264-279. PubMed
40.Morgan E, Arnold M, Camargo MC, et al. The current and future incidence and mortality of gastric cancer in 185 countries, 2020-40: A population-based modelling study. EClinicalMedicine. 2022;47:101404. PubMed
41.Mukaisho K, Nakayama T, Hagiwara T, Hattori T, Sugihara H. Two distinct etiologies of gastric cardia adenocarcinoma: interactions among pH, Helicobacter pylori, and bile acids. Front Microbiol. 2015;6:412. PubMed
42.Plummer M, de Martel C, Vignat J, Ferlay J, Bray F, Franceschi S. Global burden of cancers attributable to infections in 2012: a synthetic analysis. Lancet Glob Health. 2016;4(9):e609-616. PubMed
43.Lordick F, Carneiro F, Cascinu S, et al. Gastric cancer: ESMO Clinical Practice Guideline for diagnosis, treatment and follow-up. Ann Oncol. 2022;33(10):1005-1020. PubMed
44.European Society for Medical Oncology. ESMO Gastric Cancer Living Guideline: Metastatic Disease - First Line [accessed by sponsor]. 2023; https://www.esmo.org/living-guidelines/esmo-gastric-cancer-living-guideline/metastatic-disease/metastatic-disease/first-line. Accessed 2024 Feb 12.
45.Shah MA, Kennedy EB, Alarcon-Rozas AE, et al. Immunotherapy and Targeted Therapy for Advanced Gastroesophageal Cancer: ASCO Guideline. J Clin Oncol. 2023;41(7):1470-1491. PubMed
46.Shitara K, Moehler MH, Ajani JA, et al. Nivolumab (NIVO) + chemotherapy (chemo) vs chemo as first-line (1L) treatment for advanced gastric cancer/gastroesophageal junction cancer/esophageal adenocarcinoma (GC/GEJC/EAC): 4 year (yr) follow-up of CheckMate 649. J Clin Oncol. 2024;42(3_suppl):306-306.
47.Ter Veer E, Haj Mohammad N, van Valkenhoef G, et al. The Efficacy and Safety of First-line Chemotherapy in Advanced Esophagogastric Cancer: A Network Meta-analysis. J Natl Cancer Inst. 2016;108(10). PubMed
48.Montagnani F, Turrisi G, Marinozzi C, Aliberti C, Fiorentini G. Effectiveness and safety of oxaliplatin compared to cisplatin for advanced, unresectable gastric cancer: a systematic review and meta-analysis. Gastric Cancer. 2011;14(1):50-55. PubMed
49.Al-Batran SE, Hartmann JT, Probst S, et al. Phase III trial in metastatic gastroesophageal adenocarcinoma with fluorouracil, leucovorin plus either oxaliplatin or cisplatin: a study of the Arbeitsgemeinschaft Internistische Onkologie. J Clin Oncol. 2008;26(9):1435-1442. PubMed
50.Cunningham D, Starling N, Rao S, et al. Capecitabine and oxaliplatin for advanced esophagogastric cancer. N Engl J Med. 2008;358(1):36-46. PubMed
51.Yamada Y, Higuchi K, Nishikawa K, et al. Phase III study comparing oxaliplatin plus S-1 with cisplatin plus S-1 in chemotherapy-naive patients with advanced gastric cancer. Ann Oncol. 2015;26(1):141-148. PubMed
52.Clinical Practice Guidelines GI-008-Version 6. Gastric Cancer. April, 2021 [accessed by sponsor]. Edmonton (AB): Alberta Health Services; 2021: https://www.albertahealthservices.ca/assets/info/hp/cancer/if-hp-cancer-guide-gi008-gastric.pdf.
53.Cancer Care Ontario. Guideline 2-26 version 3: Summary. 2022; https://www.cancercareontario.ca/sites/ccocancercare/files/guidelines/summary/pebc2-26V3s.pdf. Accessed 2023 Dec 13.
54.Outpatient Cancer Drug Benefit Program. Edmonton (AB): Alberta Health Services: https://www.albertahealthservices.ca/assets/programs/ps-1025651-drug-benefit-list.pdf. Accessed 2024 Feb 7.
55.Cancer Care Ontario. Guideline 2-26 version 3. 2022; https://www.cancercareontario.ca/sites/ccocancercare/files/guidelines/full/pebc2-26V3f.pdf. Accessed 2023 Dec 13.
56.U. S. Food and Drug Administration. FDA approves pembrolizumab with chemotherapy for HER2-negative gastric or gastroesophageal junction adenocarcinoma. 2023; https://www.fda.gov/drugs/resources-information-approved-drugs/fda-approves-pembrolizumab-chemotherapy-her2-negative-gastric-or-gastroesophageal-junction. Accessed 2024 Jan 8.
57.Product Information: Keytruda (pembrolizumab). (European public assessment report). Amsterdam (NL) European Medicines Agency; 2024: https://www.ema.europa.eu/en/documents/product-information/keytruda-epar-product-information_en.pdf.
58.Merck. Prescribing information: Keytruda (pembrolizumab) injection, for IV use. Silver Spring (MD): U.S. Food and Drug Administration; 2023: https://www.accessdata.fda.gov/drugsatfda_docs/label/2023/125514s148lbl.pdf. Accessed 2023 Dec 12.
59.Opdivo (nivolumab): Intravenous Infusion, 10 mg nivolumab /mL, 40 mg and 100 mg single-use vials [product monograph]. Montreal (QC): Bristol-Myers Squibb Canada; 2023 Dec 29: https://pdf.hres.ca/dpd_pm/00073986.PDF.
60.Ajani JA, D'Amico TA, Bentrem DJ, et al. Gastric Cancer, Version 2.2022, NCCN Clinical Practice Guidelines in Oncology. J Natl Compr Canc Netw. 2022;20(2):167-192. PubMed
61.Ter Veer E, Creemers A, de Waal L, van Oijen MGH, van Laarhoven HWM. Comparing cytotoxic backbones for first-line trastuzumab-containing regimens in human epidermal growth factor receptor 2-positive advanced oesophagogastric cancer: A meta-analysis. Int J Cancer. 2018;143(2):438-448. PubMed
62.Tabernero J, Hoff PM, Shen L, et al. Pertuzumab plus trastuzumab and chemotherapy for HER2-positive metastatic gastric or gastro-oesophageal junction cancer (JACOB): final analysis of a double-blind, randomised, placebo-controlled phase 3 study. Lancet Oncol. 2018;19(10):1372-1384. PubMed
63.Network Meta-analysis Report. Systematic literature review and network meta-analyses of first-line treatments for HER2 negative locally advanced unresectable or metastatic gastric and gastroesophageal junction adenocarcinoma [internal sponsor's report]. In: Drug Reimbursement Review sponsor submission: Pembrolizumab, 100 mg/4 mL vial, solution for infusion. Whitehouse Station (NJ): Merck & Co, Inc.; 2024.
64.Lowery M, Wyrwicz L, Oh DY, et al. 1516P Health-related quality of life (hrqol) analysis from KEYNOTE-859: First-line (1L) pembrolizumab (pembro) + chemotherapy (chemo) for advanced HER2-negative gastric or gastroesophageal junction (G/GEJ) adenocarcinoma. Ann Oncol. 2023;34:S854-S855.
65.Rha SY, Wyrwicz L, Yanez Weber PE, et al. KEYNOTE-859 study of pembrolizumab plus chemotherapy for advanced HER2-negative gastric or gastroesophageal junction (G/GEJ) cancer: Outcomes in the protocol-specified PD-L1–selected populations. J Clin Oncol. 2023;41(16_suppl):4014-4014.
66.Merck Sharp & Dohme LLC. NCT03675737: Pembrolizumab (MK-3475) Plus Chemotherapy Versus Placebo Plus Chemotherapy in Participants Gastric or Gastroesophageal Junction (GEJ) Adenocarcinoma (MK-3475-859/KEYNOTE-859). ClinicalTrials.gov. Bethesda (MD): U.S. National Library of Medicine: https://clinicaltrials.gov/study/NCT03675737. Accessed 2024 Mar 27.
67.Health Canada reviewer's report: Keytruda (pembrolizumab) [internal sponsor's report]. In: Drug Reimbursement Review sponsor submission: Pembrolizumab, 100 mg/4 mL vial, solution for infusion. Kirkland (QC): Mecrk Canada Inc.; 2024 May 21.
68.Protocol and Protocol Amendments: 16.1.1.1. A phase 3 randomized, double-blind clinical study of pembrolizuamab (MK-3475) plus chemotherapy versus placebo plus chemotherapy as first-line treatment in participants with HER2 negative, previously untreated, unresectable or metastatic gastric or gastroesophageal junction adenocarcinoma (KEYNOTE-859) [internal sponsor's report]. Whitehouse Station (NJ): Merck Sharp & Dohme Corp; 2023.
69.Merck Canada Inc. response to April 29, 2024 CADTH request for additional information regarding pembrolizumab CADTH review: Request for clarification regarding study design [internal additional sponsor's information]. Kirkland (QC): Merck Canada Inc.; 2024 May 6.
70.Shitara K, Van Cutsem E, Bang YJ, et al. Efficacy and Safety of Pembrolizumab or Pembrolizumab Plus Chemotherapy vs Chemotherapy Alone for Patients With First-line, Advanced Gastric Cancer: The KEYNOTE-062 Phase 3 Randomized Clinical Trial. JAMA Oncol. 2020;6(10):1571-1580. PubMed
71.Kang YK, Chen LT, Ryu MH, et al. Nivolumab plus chemotherapy versus placebo plus chemotherapy in patients with HER2-negative, untreated, unresectable advanced or recurrent gastric or gastro-oesophageal junction cancer (ATTRACTION-4): a randomised, multicentre, double-blind, placebo-controlled, phase 3 trial. Lancet Oncol. 2022;23(2):234-247. PubMed
72.Musoro JZ, Coens C, Sprangers MAG, et al. Minimally important differences for interpreting EORTC QLQ-C30 change scores over time: A synthesis across 21 clinical trials involving nine different cancer types. Eur J Cancer. 2023;188:171-182. PubMed
73.European Organisation for Research Treatment of Cancer. EORTC Quality of Life FAQ. 2023; https://qol.eortc.org/faq/. Accessed 2024 Jan 15.
74.Braun DP, Gupta D, Grutsch JF, Staren ED. Can changes in health related quality of life scores predict survival in stages III and IV colorectal cancer? Health Qual Life Outcomes. 2011;9:62. PubMed
75.Brunelli C, Mosconi P, Boeri P, et al. Evaluation of quality of life in patients with malignant dysphagia. Tumori. 2000;86(2):134-138. PubMed
76.Peter M. Fayers DM. Quality of Life: The Assessment, Analysis and Interpretation of Patient‐Reported Outcomes, 2nd edition. Chichester (GB): John Wiley & Sons, Ltd; 2007.
77.Tomaszewski KA, Puskulluoglu M, Biesiada K, Bochenek J, Nieckula J, Krzemieniecki K. Validation of the polish version of the eortc QLQ-C30 and the QLQ-OG25 for the assessment of health-related quality of life in patients with esophagi-gastric cancer. J Psychosoc Oncol. 2013;31(2):191-203. PubMed
78.Blazeby JM, Conroy T, Bottomley A, et al. Clinical and psychometric validation of a questionnaire module, the EORTC QLQ-STO 22, to assess quality of life in patients with gastric cancer. Eur J Cancer. 2004;40(15):2260-2268. PubMed
79.European Organisation for Research Treatment of Cancer. Gastric Cancer (update of QLQ-STO22). 2024; https://qol.eortc.org/questionnaire/gastric-cancer-update-of-qlq-sto22/. Accessed 2024 Jan 15.
80.Maurer W BF. Multiple testing in group sequential trials using graphical approaches. Stat Biopharm Res. 2012;5(4):9.
81.Liang Ky ZSL. Longitudinal data analysis of continuous and discrete responses for pre-post designs. Sankhyā Indian J Stat. 2000;62(Series B).
82.Dias S, Welton NJ, Sutton AJ, Caldwell DM, Lu G, Ades AE. Evidence synthesis for decision making 4: inconsistency in networks of evidence based on randomized controlled trials. Med Decis Making. 2013;33(5):641-656. PubMed
83.Hutton B, Salanti G, Caldwell DM, et al. The PRISMA extension statement for reporting of systematic reviews incorporating network meta-analyses of health care interventions: checklist and explanations. Ann Intern Med. 2015;162(11):777-784. PubMed
84.Jansen JP, Fleurence R, Devine B, et al. Interpreting indirect treatment comparisons and network meta-analysis for health-care decision making: report of the ISPOR Task Force on Indirect Treatment Comparisons Good Research Practices: part 1. Value Health. 2011;14(4):417-428. PubMed
85.Hoaglin DC, Hawkins N, Jansen JP, et al. Conducting indirect-treatment-comparison and network-meta-analysis studies: report of the ISPOR Task Force on Indirect Treatment Comparisons Good Research Practices: part 2. Value Health. 2011;14(4):429-437. PubMed
86.Grambsch PM, Therneau TM. Proportional hazards tests and diagnostics based on weighted residuals. Biometrika. 1994;81(3):515-526.
87.Dias S, Welton NJ, Sutton AJ, Ades AE. Decision Support Unit Technical Support Documents. NICE DSU Technical Support Document 2: A Generalised Linear Modelling Framework for Pairwise and Network Meta-Analysis of Randomised Controlled Trials. National Institute for Health and Care Excellence (NICE) [accessed by sponsor]. Accessed 2023 Sep 11.
88.Ouwens MJ, Philips Z, Jansen JP. Network meta-analysis of parametric survival curves. Res Synth Methods. 2010;1(3-4):258-271. PubMed
89.Dempster AP. The direct use of likelihood for significance testing. Statistics and Computing. 1997;7(4):247-252.
90.Narita Y, Sasaki E, Masuishi T, et al. PD-L1 immunohistochemistry comparison of 22C3 and 28-8 assays for gastric cancer. J Gastrointest Oncol. 2021;12(6):2696-2705. PubMed
91.Krigsfeld GS, Prince EA, Pratt J, et al. Analysis of real-world PD-L1 IHC 28-8 and 22C3 pharmDx assay utilisation, turnaround times and analytical concordance across multiple tumour types. J Clin Pathol. 2020;73(10):656-664. PubMed
92.Ahn S, Kim KM. PD-L1 expression in gastric cancer: interchangeability of 22C3 and 28-8 pharmDx assays for responses to immunotherapy. Mod Pathol. 2021;34(9):1719-1727. PubMed
93.Honório MX, Suzuki C, Espin-Garcia O, et al. 1464P Asian-ethnicity related differences among patients with metastatic gastroesophageal junction (GEJ) and gastric adenocarcinoma. Ann Oncol. 2020;31.
94.Peng L, Wu YL. Immunotherapy in the Asiatic population: any differences from Caucasian population? J Thorac Dis. 2018;10(Suppl 13):S1482-S1493. PubMed
95.Rahman R, Asombang AW, Ibdah JA. Characteristics of gastric cancer in Asia. World J Gastroenterol. 2014;20(16):4483-4490. PubMed
96.Salanti G. Indirect and mixed-treatment comparison, network, or multiple-treatments meta-analysis: many names, many benefits, many concerns for the next generation evidence synthesis tool. Res Synth Methods. 2012;3(2):80-97. PubMed
Appendix 1: Detailed Outcome Data
Please note that this appendix has not been copy-edited.
Table 26: Protocol Deviations in the KEYNOTE-859 Trial (ITT Population)
Protocol deviation | Pembrolizumab plus chemotherapy (N = 790) | Placebo plus chemotherapy (N = 789) |
|---|---|---|
Patients with at least 1 clinically important protocol deviation, N (%) | 0 (0) | 2 (0.3) a |
Patients with at least 1 important protocol deviation, N (%) | 57 (7.2) | 43 (5.4) |
Types of protocol deviations, N (%) | ||
Discontinuation criteria | ||
Developed study intervention discontinuation criteria but was not discontinued from study intervention | 2 (0.3) | 1 (0.1) |
Developed trial specific discontinuation criteria but was not discontinued from the trial | 1 (0.1) | 2 (0.3) |
Inclusion/Exclusion criteriab | 2 (0.3) | 4 (0.5) |
Informed consent | ||
No documented informed consent | 3 (0.4) | 1 (0.1) |
Prohibited medicationsc | 3 (0.4) | 1 (0.1) |
Safety reportingd | 41 (5.2) | 32 (4.1) |
Study intervention | ||
Administered improperly stored study intervention that was deemed unacceptable for use | 1 (0.1) | 2 (0.3) |
Dispensed study intervention other than what was assigned in the allocation schedule | 4 (0.5) | 3 (0.4) |
I/E = inclusion/exclusion.
aPatients entered into the trial without having the correct tumour histology per I/E criteria, including the correct presence or absence of molecular aberrations/mutations and the correct tumour stage.
bEntered into the trial who did not have the correct tumour histology per the I/E criteria, including the correct presence/absence of molecular aberrations/mutations and the correct tumour stage.
cAntineoplastic systemic chemotherapy, biologic therapy, immunotherapy, other investigational drugs given while on treatment or before study entry during screening.
dPatient had a reportable safety event and/or follow-up safety event information that was not reported per the timelines outlined in the protocol.
Notes: Every patient was counted a single time for each applicable row and column; data cut-off date October 3, 2022.
Source: Clinical Study Report for KEYNOTE-859.34
Table 27: Subgroup Analysis of OS (ITT Population)
Subgroup | Pembrolizumab plus chemotherapy | Placebo plus chemotherapy | Pembrolizumab plus chemotherapy vs. placebo plus chemotherapy | ||
|---|---|---|---|---|---|
N | Events, n (%) | N | Events, n (%) | HR (95% CI) | |
Baseline PD-L1 Status (CPS cut point: 1) | |||||
CPS ≥ 1 | 618 | 464 (75.1) | 617 | 526 (85.3) | 0.73 (0.65 to 0.83) |
CPS < 1 | 172 | 139 (80.8) | 172 | 140 (81.4) | 0.92 (0.73 to 1.17) |
Baseline PD-L1 Status (CPS cut point: 10) | |||||
CPS ≥ 10 | 279 | 188 (67.4) | 272 | 226 (83.1) | 0.64 (0.52 to 0.77) |
CPS < 10 | 509 | 413 (81.1) | 517 | 440 (85.1) | 0.86 (0.75 to 0.98) |
MSI Status | |||||
MSI-H | 39 | 14 (35.9) | 35 | 25 (71.4) | 0.34 (0.18 to 0.66) |
Non MSI-H | 641 | 497 (77.5) | 639 | 540 (84.5) | 0.79 (0.7 to 0.89) |
CI = confidence interval; CPS = combined positive score; HR = Hazard ratio; PD-L1 = programmed death ligand 1.
Note: Data cut-off date October 3, 2022.
Source: Clinical Study Report for KEYNOTE-859.34 Details included in the table are from the sponsor’s summary of clinical evidence.36
Table 28: HRQoL Outcomes in the KEYNOTE-859 Trial Not Assessed Using GRADE (PRO FAS Population)
Outcome | Pembrolizumab plus chemotherapy (N = 790) | Placebo plus chemotherapy (N = 789) |
|---|---|---|
EQ-5D-5L VAS, points | ||
Baseline | ||
n | 748 | 750 |
Mean (SD) | 75.16 (17.57) | 74.95 (18.27) |
Week 18 | ||
n | 504 | 506 |
Mean (SD) | 76.13 (16.49) | 74.86 (17.49) |
Change from baseline to 18 weeks | ||
LS mean (95% CI) | −0.69 (−2.12 to 0.73) | −1.91 (−3.33 to −0.49) |
Difference between groups | ||
LS means (95% CI) | 1.22 (−0.65 to 3.08) | Reference |
P valuea | 0.2000 | Reference |
EORTC QLQ-C30 | ||
Physical Functioning | ||
Baseline | ||
N | 743 | 749 |
Mean (SD) | 82.59 (18.51) | 83.16 (18.22) |
Week 18 | ||
N | 504 | 506 |
Mean (SD) | 79.97 (20.97) | 78.96 (20.95) |
Change from baseline to week 18 | ||
LS mean (95% CI)a | −5.87 (−7.53 to −4.22) | −7.53 (−9.18 to −5.88) |
LS mean difference (95% CI)a | 1.65 (−0.64 to 3.94) | Reference |
P valuea | 0.1567 | Reference |
Deterioration, months | ||
Patients with true deterioration, n (%) | 249 (33.5) | 254 (33.9) |
Time to true deterioration, medianb | 21.2 (13.2 to NR) | 19.9 (13.8 to NR) |
True deterioration rate at 12 months, % (95% CI)b | 56.9 (52.1 to 61.4) | 56.8 (52.1 to 61.1) |
HR (95% CI)c | 0.91 (0.76 to 1.08) | Reference |
P valued | 0.2805 | Reference |
Improvement and stability | ||
Improved or stable | 556 (72.0) | 542 (70.3) |
Improved | 139 (18.0) | 128 (16.6) |
Stable | 417 (54.0) | 414 (53.7) |
Deteriorated | 137 (17.7) | 158 (20.5) |
Unconfirmed | 13 (1.7) | 14 (1.8) |
No assessment | 66 (8.5) | 57 (7.4) |
Difference in improved, % | ||
Estimate (95% CI)e | 1.4 (−2.4 to 5.1) | Reference |
P valuee | 0.2355f | Reference |
Difference in improved and stable, % | ||
Estimate (95% CI)e | 1.7 (−2.8 to 6.2) | Reference |
P valuee | 0.2320f | Reference |
Role Functioning | ||
Baseline | ||
n | 743 | 749 |
Mean (SD) | 80.35 (25.38) | 81.35 (24.70) |
Week 18 | ||
n | 504 | 506 |
Mean (SD) | 78.80 (26.44) | 76.12 (26.56) |
Change from baseline to week 24 | ||
LS mean (95% CI)a | −5.41 (−7.59 to −3.22) | −7.97 (−10.15 to −5.79) |
Group difference groups (95% CI)a | 2.57 (−0.38 to 5.52) | Reference |
P valuea | 0.0882 | Reference |
Deterioration, months | ||
Patients with true deterioration, n (%) | 269 (36.2) | 282 (37.7) |
Time to true deterioration, medianb | NR (13.1 to NR) | 11.8 (9.4 to NR) |
True deterioration rate at 12 months, % (95% CI)b | 56.6 (52.1 to 60.8) | 49.7 (44.3 to 54.8) |
HR (95% CI)c | 0.90 (0.76 to 1.06) | Reference |
P valued | 0.2156 | Reference |
Improvement and stability | ||
Improved or stable | 533 (69.0) | 517 (67.1) |
Improved | 185 (24.0) | 165 (21.4) |
Stable | 348 (45.1) | 352 (45.7) |
Deteriorated | 159 (20.6) | 179 (23.2) |
Unconfirmed | 14 (1.8) | 18 (2.3) |
No assessment | 66 (8.5) | 57 (7.4) |
Difference in improved, % | ||
Estimate (95%)e | 2.5 (−1.7 to 6.6) | Reference |
P value e | 0.1226f | Reference |
Difference in improved and stable, % | ||
Estimate (95%)e | 1.9 (−2.7 to 6.5) | Reference |
P valuee | 0.2074f | Reference |
Single-item appetite loss | ||
Baseline | ||
N | 743 | 749 |
Mean (SD) | 30.87 (32.03) | 29.95 (31.51) |
Week 18 | ||
N | 504 | 506 |
Mean (SD) | 24.87 (28.65) | 22.66 (27.68) |
Change from baseline to week 18 | ||
LS mean (95% CI)a | −3.43 (−6.10 to −0.76) | −4.85 (−7.51 to −2.19) |
LS mean difference (95% CI)a | 1.42 (−1.93 to 4.77) | Reference |
P valuea | 0.4061 | Reference |
Deterioration, months | ||
Patients with true deterioration, n (%) | 203 (27.3) | 192 (25.6) |
Time to true deterioration, medianb | NR (NR to NR) | NR (NR to NR) |
True deterioration rate at 12 months, % (95% CI)b | 67.8 (63.6 to 71.6) | 67.6 (62.8 to 71.9) |
HR (95% CI)c | 1.00 (0.82 to 1.22) | |
P valued | 0.9948 | |
Improvement and stability | ||
Improved or stable | 587 (76.0) | 580 (75.2) |
Improved | 256 (33.1) | 257 (33.3) |
Stable | 331 (42.9) | 323 (41.9) |
Deteriorated | 100 (13.0) | 118 (15.3) |
Unconfirmed | 19 (2.5) | 16 (2.1) |
No assessment | 66 (8.5) | 57 (7.4) |
Difference in improved, % | ||
Estimate (95% CI)e | −0.2 (−4.9 to 4.4) | Reference |
P valuee | 0.5411f | Reference |
Difference in improved and stable, % | ||
Estimate (95% CI)e | 0.7 (−3.5 to 5.0) | Reference |
P valuee | 0.3664f | Reference |
CI = confidence interval; CPS = combined positive score; EORTC QLQ-STO22 = European Organization for Research and Treatment of Cancer Quality of Life Questionnaire-STO22; HR = Hazard ratio; HRQoL = health-related quality of life; LS = Least squares; NA = no assessment; NE = not evaluable; NP = not provided; NR = not reported; PD-L1 = programmed death ligand 1; QoL = quality of life.
aBased on a constrained longitudinal data analysis (cLDA) model with the PRO scores as the response variable with covariates for treatment by study visit interaction and stratification factors (geographic region [Western Europe/Israel/North America/Australia, Asia and rest of the world], PD-L1 status [CPS < 1 vs. CPS > 1], and chemotherapy regimen [FP or CAPOX]) with small strata collapsed as prespecified in the statistical analysis plan.
bFrom product-limit (Kaplan-Meier) method for censored data.
cBased on Cox regression model with Efron’s method of tie handling with treatment as a covariate stratified by (Geographic region (Western Europe/Israel/North America/Australia, Asia and rest of the world), PD-L1 status (CPS = 1), and Chemotherapy regimen (FP or CAPOX)) with small strata collapsed as prespecified in the SAP.
dTwo-sided p value based on log-rank test stratified by geographic region (Western Europe/Israel/North America/Australia, Asia and rest of the world), PDL1 status (CPS < 1 vs. CPS > 1), and chemotherapy regimen (FP or CAPOX) with small strata collapsed as prespecified in the statistical analysis plan.
eBased on Miettinen and Nurminen method stratified by Geographic region (Western Europe /Israel/North America/Australia, Asia and rest of the world), PDL1 status (CPS = 1), and Chemotherapy regimen (FP or CAPOX) with small strata collapsed as prespecified in the SAP.
fOne-sided p value for testing. H0: difference in % = 0 vs. H1: difference in % > 0.
Note: Data cut-off date October 3, 2022.
Source: Clinical Study Report for KEYNOTE-859.34 Details included in the table are from the sponsor’s summary of clinical evidence.36
Figure 8: Global Network of Evidence
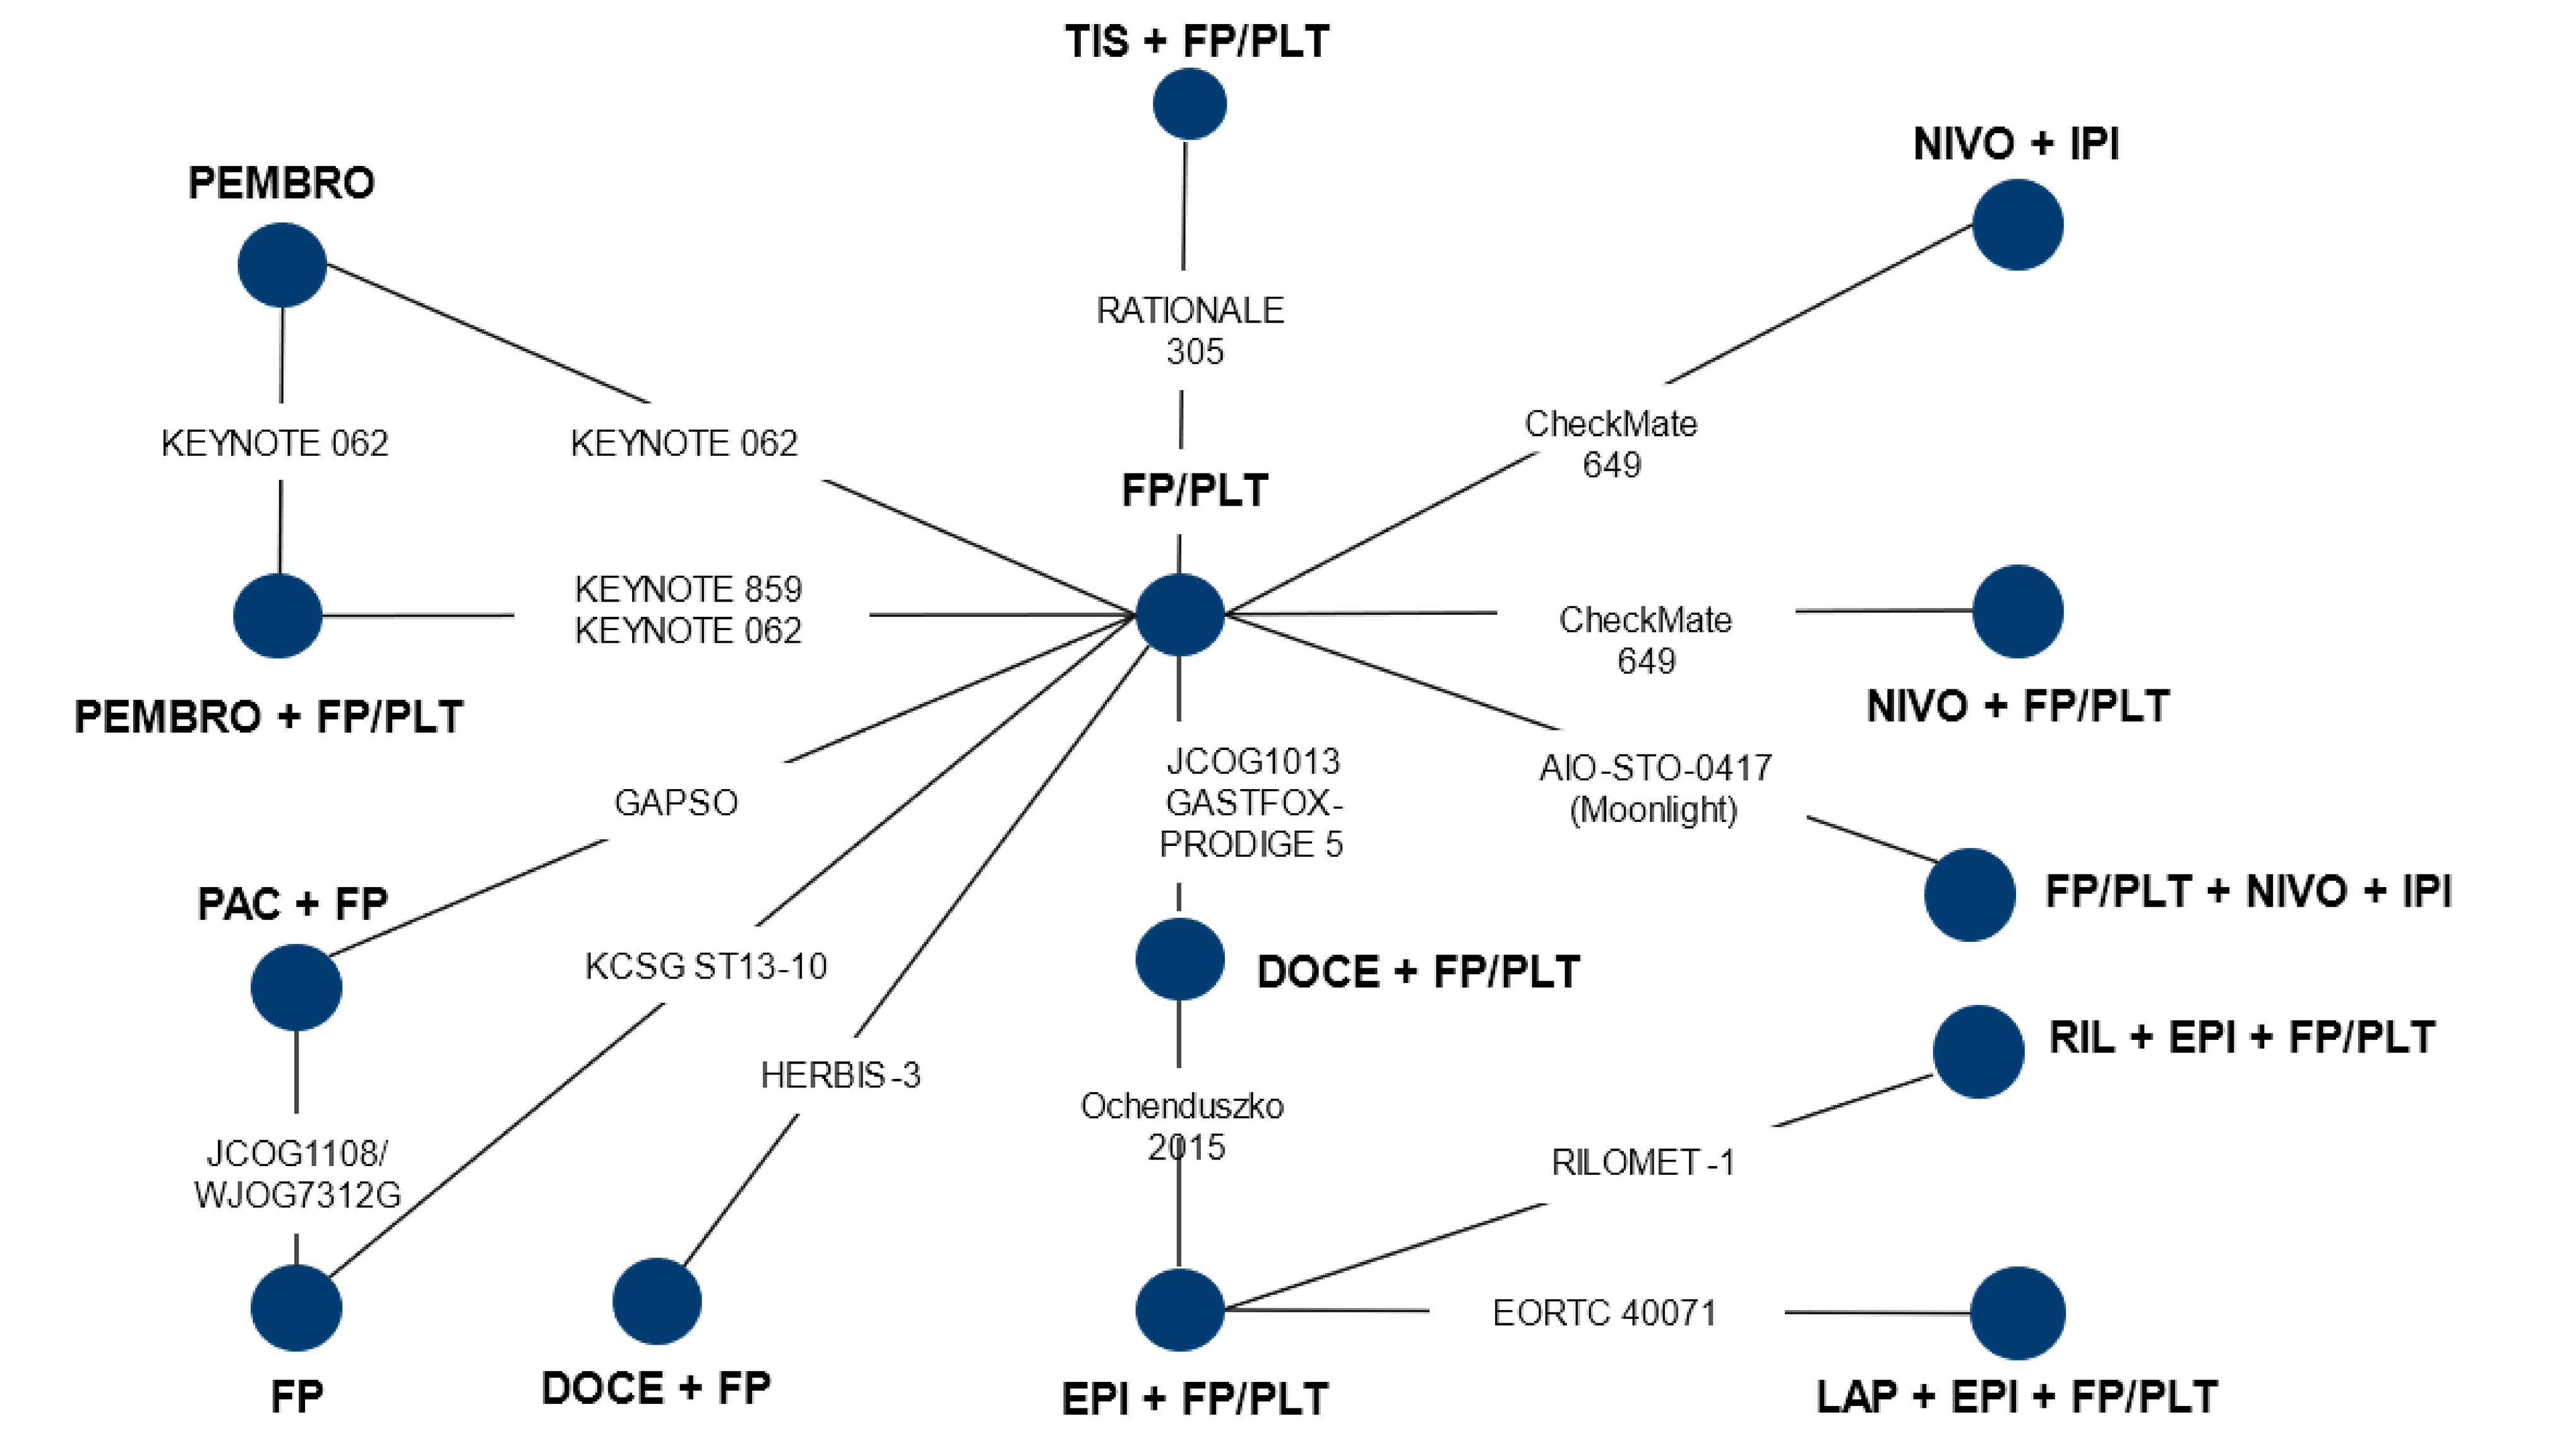
DOCE = docetaxel; EPI = epirubicin; FP = FLUOROPYRIMIDINE; FP/PLT = fluoropyrimidine plus platinum doublet; IPI = ipilimumab; LAP = lapatinib; NIVO = nivolumab; PAC = paclitaxel; PEMBRO = pembrolizumab; RIL = rilotumumab; TIS = tislelizumab.
Source: NMA Study Report.63 Details included are from the sponsor’s summary of clinical evidence.36
Table 29: Feasibility of Inclusion of Trials Connected in the Overall Evidence Network
Trial | Base case | Sensitivity analysis 1a | Sensitivity analysis 2b |
|---|---|---|---|
Yes or no (with reason) | |||
KEYNOTE-859 | Yes | Yes | Yes |
CheckMate 649 | Yes (Except NIVO plus IPI arm; unapproved treatment) | Yes (Except NIVO plus IPI arm; unapproved treatment) | Yes (Except NIVO plus IPI arm; unapproved treatment) |
RATIONALE-305 | Yes | Yes | Yes |
GASTFOX-PRODIGE 5 | Yes | Yes | No (Asian region subgroup data not available) |
AIO-STO-0417 (Moonlight) | No (Unapproved treatment) | No (Unapproved treatment) | No (Not an exclusive Asian country trial) |
KEYNOTE-062 | No (Unapproved treatment/Failed trial) | Yes | No (Not an exclusive Asian country trial) |
GAPSO | No (Exclusive Asian country trial) | No (Exclusive Asian country trial) | Yes |
JCOG1013 | No (Exclusive Asian country trial) | No (Exclusive Asian country trial) | Yes |
HERBIS-3 | No (Exclusive Asian country trial) | No (Exclusive Asian country trial) | Yes |
JCOG1108/WJOG7312G | No (Evaluated chemo monotherapy, not deemed a relevant comparator for the NMA; an exclusive Asian country trial) | No (Evaluated chemo monotherapy, not deemed a relevant comparator for the NMA; an exclusive Asian country trial) | No (Even though an exclusive Asian country trial; evaluated monotherapy which was not deemed a relevant comparator for the NMA) |
Ochenduszko 2015 | No (Evaluated triplet chemotherapy, not deemed a relevant comparator for the NMA; evaluated unapproved treatments) | No (Evaluated triplet chemotherapy, not deemed a relevant comparator for the NMA) | No (Not an exclusive Asian country trial) |
RILOMET-1 | No (Evaluated triplet chemotherapy, not deemed a relevant comparator for the NMA; evaluated unapproved treatments) | No (Evaluated triplet chemotherapy, not deemed a relevant comparator for the NMA) | No (Not an exclusive Asian country trial) |
EORTC 40071 | No (Evaluated triplet chemotherapy, not deemed a relevant comparator for the NMA; evaluated unapproved treatments) | No (Evaluated triplet chemotherapy, not deemed a relevant comparator for the NMA) | No (Not an exclusive Asian country trial) |
KCSG ST13 to 10 | No (Evaluated chemo monotherapy, not deemed a relevant comparator for the NMA; an exclusive Asian country trial) | No (Evaluated chemo monotherapy, not deemed a relevant comparator for the NMA; an exclusive Asian country trial) | No (Even though an exclusive Asian country trial; evaluated monotherapy which was not deemed a relevant comparator for the NMA) |
aIncluded failed trials of approved treatments.
bIncluded trails conducted in Asian countries.
Source: NMA Study Report.63
Table 30: Estimated HRs for OS of Pembrolizumab with FP and PLT Versus Nivolumab with FP and PLT or FP and PLT Alone at Select Time Points Based on Second Order FP Model (P1 = 1, P2 = 0.5) With Treatment Effects on Scale and Second Shape Parameters; Fixed Effects
PEMBRO plus FP/PLT vs. | Time-varying HR (95% Crl) time point | |||||||||
|---|---|---|---|---|---|---|---|---|---|---|
3 months | 6 months | 9 months | 12 months | 18 months | 24 months | 30 months | 36 months | 42 months | 48 months | |
NIVO plus FP and PLT | 1.05 | 1.01 | 0.98 | 0.96 | 0.92 | 0.90 | 0.87 | 0.85 | 0.83 | 0.81 |
FP and PLT | 0.86 | 0.81 | 0.78 | 0.76 | 0.71 | 0.68 | 0.65 | 0.63 | 0.60 | 0.58 |
CrI = credible interval; FP/PLT = fluoropyrimidine plus platinum doublet; HR = hazard ratio; NIVO = nivolumab; OS = overall survival; PEMBRO = pembrolizumab.
Note: model presented is P1 = 1, P2 = 0.5, scale and second shape, fixed effect.
Source: NMA Study Report.63 Details included are from the sponsor’s Summary of Clinical Evidence.36
Table 31: Estimated HRs for PFS of Pembrolizumab With FP and PLT Versus Nivolumab with FP and PLT or FP and PLT Alone at Select Time Points Based on Second Order FP Model (P1 = 1, P2 = 0.5) With Treatment Effects on Scale and Second Shape Parameters; Fixed Effects
PEMBRO plus FP/PLT vs. | Time-varying HR (95% Crl) time point | |||||||||
|---|---|---|---|---|---|---|---|---|---|---|
3 months | 6 months | 9 months | 12 months | 18 months | 24 months | 30 months | 36 months | 42 months | 48 months | |
NIVO plus FP and PLT | 0.98 | 0.97 | 0.95 | 0.94 | 0.92 | 0.91 | 0.89 | 0.88 | 0.87 | 0.86 |
FP and PLT | 0.75 | 0.76 | 0.76 | 0.76 | 0.77 | 0.78 | 0.78 | 0.78 | 0.79 | 0.79 |
CrI = credible interval; FP/PLT = fluoropyrimidine plus platinum doublet; HR = hazard ratio; NIVO = nivolumab; PEMBRO = Pembrolizumab; PFS = progression-free survival.
Note: model presented is P1 = 1, P2 = 0.5, scale and second shape, fixed effect.
Source: NMA Study Report.63 Details included are from the sponsor’s Summary of Clinical Evidence.36
Pharmacoeconomic Review
Abbreviations
AE
adverse event
BIA
budget impact analysis
CAPOX
oxaliplatin plus capecitabine
CDA-AMC
Canada's Drug Agency
CISPFU
cisplatin plus 5-fluorouracil
FOLFOX
folinic acid (leucovorin) plus 5-fluorouracil plus oxaliplatin
GEJ
gastroesophageal junction
ICER
incremental cost-effectiveness ratio
OS
overall survival
PD-L1
programmed cell death 1 ligand 1
PFS
progression-free survival
QALY
quality-adjusted life-year
RDI
relative dosing intensity
ToT
time on treatment
Executive Summary
The executive summary comprises 2 tables (Table 1 and Table 2) and a conclusion.
Item | Description |
|---|---|
Drug product | Pembrolizumab (Keytruda), IV solution |
Indication | In combination with chemotherapy, is indicated for the first-line treatment of adult patients with locally advanced, unresectable, or metastatic HER2-negative gastric or gastroesophageal junction adenocarcinoma. |
Health Canada approval status | NOC |
Health Canada review pathway | Standard |
NOC date | March 21, 2024 |
Reimbursement request | Per indication |
Sponsor | Merck Canada Inc. |
Submission history | Pembrolizumab (Keytruda) has been reviewed for numerous indications at CDA-AMC. Pembrolizumab was reviewed for esophageal carcinoma and gastroesophageal junction adenocarcinoma on December 2, 2021, with a recommendation to reimburse with conditions. |
CDA-AMC = Canada's Drug Agency; NOC = Notice of Compliance.
Table 2: Summary of Economic Evaluation
Component | Description |
|---|---|
Type of economic evaluation | Cost-utility analysis PSM |
Target populations | Adults with locally advanced, unresectable, or metastatic HER2-negative gastric or gastroesophageal junction adenocarcinoma |
Treatment | Pembrolizumab plus chemotherapya |
Dose regimen | Pembrolizumab: 200 mg IV administered every 3 weeks for up to 35 cycles |
Submitted price | Pembrolizumab: 100 mg/4 mL; $4,400 per vial |
Submitted treatment cost | Pembrolizumab: $5,638 every 3 weeksb |
Comparators |
|
Perspective | Canadian publicly funded health care payer |
Outcomes | QALYs, LYs |
Time horizon | Lifetime (25 years) |
Key data source | The KEYNOTE-859 trial informed PFS, OS, time on treatment, and health state utility values. The sponsor-submitted network meta-analysis was used to inform the OS and PFS comparison between pembrolizumab and nivolumab. |
Submitted results |
|
Key limitations |
|
CDA-AMC reanalysis results |
|
CDA-AMC = Canada's Drug Agency; chemotherapy alone = fluoropyrimidine-containing and platinum-containing chemotherapy alone; ICER = incremental cost-effectiveness ratio; LY = life-year; nivolumab plus chemotherapy = nivolumab plus fluoropyrimidine-containing and platinum-containing chemotherapy; OS = overall survival; PFS = progression-free survival; pembrolizumab plus chemotherapy = pembrolizumab plus fluoropyrimidine-containing and platinum-containing chemotherapy; PSM = partitioned survival model; QALY = quality-adjusted life-year; RDI = relative dose intensity; vs. = versus.
aChemotherapy was assumed by the sponsor to comprise capecitabine and oxaliplatin (CAPOX) or 5-fluorouracil and cisplatin (CISPFU) for the pembrolizumab plus chemotherapy and chemotherapy only arms, and CAPOX or leucovorin plus 5-fluorouracil plus oxaliplatin (FOLFOX) for the nivolumab plus chemotherapy arm.
bA weight-based dose, assuming 2 mg/kg, a 65.5 kg patient, vial sharing, and ████% RDI.
Conclusions
Canada's Drug Agency (CDA-AMC) clinical review showed that the addition of pembrolizumab to fluoropyrimidine-containing and platinum-containing chemotherapy (hereafter referred to as pembrolizumab plus chemotherapy) results in a clinically important increase in overall survival (OS) and progression-free survival (PFS) at 30 months compared to chemotherapy alone with a high degree of certainty. Indirect comparison of pembrolizumab plus chemotherapy and nivolumab plus fluoropyrimidine-containing and platinum-containing chemotherapy (hereafter referred to as nivolumab plus chemotherapy suggested that there was little to no difference in OS or PFS between these 2 regimens, although clinical and methodological heterogeneity added uncertainty to the comparison. The similarity between the 2 combination-therapy regimens was supported by feedback from clinical experts consulted by CDA-AMC for this review, who viewed the 2 regimens as being fundamentally equivalent in terms of efficacy.
CDA-AMC undertook reanalyses to address several limitations in the sponsor’s analysis. Results of the CDA-AMC base case suggest that pembrolizumab plus chemotherapy was more costly ($75,318) and produced more QALYs (0.49) than chemotherapy alone, resulting in an incremental cost-effectiveness ratio (ICER) of $153,773 per quality-adjusted life-year (QALY) gained. Additionally, pembrolizumab plus chemotherapy is slightly more costly than nivolumab plus chemotherapy, but with similar QALYs. Both the incremental cost and effectiveness are small relative to the total cost of treatment. The small magnitude of the incremental cost and incremental QALYs and the overall uncertainty contributed by the identified heterogeneity in the indirect treatment comparison (ITC) suggest that the expected costs and outcomes may not be meaningfully different between the 2 combination regimens. The economic evidence suggests that pembrolizumab plus chemotherapy would require a price reduction to be cost-effective at a willingness-to-pay threshold of $50,000 per QALY gained compared to chemotherapy alone. Pembrolizumab plus chemotherapy provides a benefit similar to that of nivolumab plus chemotherapy, and a price premium for either combination is not supported.
Input Relevant to the Economic Review
This section is a summary of the feedback received from the patient groups, clinician groups, and drug plans that participated in the CDA-AMC review process.
Patient input was received from My Gut Feeling – Stomach Cancer Foundation of Canada, which collected the perspectives of caregivers and patients with gastric, esophageal, and/or gastroesophageal (GEJ) cancer through patient surveys and interviews (69.4% of respondents were from Canada, and most had human epidermal growth factor receptor 2 (HER2)-positive disease). Patients described experiencing at least 1 symptom before diagnosis, including weight loss, appetite changes, pain, reflux, nausea or vomiting, difficulty swallowing, and a negative impact on mental health. Respondents described their experiences with a variety of treatments, including immunotherapy plus chemotherapy, chemotherapy alone, surgery, and other treatments (such as radiation). Patients noted side effects with current treatments options, including fatigue, appetite and taste changes, weight loss, neuropathy, diarrhea, abdominal pain, and insomnia. Some patients reported stopping treatment after being admitted to hospital for an adverse event (AE). Treatment goals described by respondents included prolonged survival, reduced recurrence, tumour shrinkage, improved symptoms and quality of life, and improved treatment tolerability. Among patients who had experience with pembrolizumab, almost two-thirds reported experiencing fatigue as an AE of treatment.
Clinician input was received from the Ontario Health – Cancer Care Ontario Gastrointestinal Drug Advisory Committee. Clinician input indicated that nivolumab plus chemotherapy, such as 5-fluorouracil plus leucovorin plus oxaliplatin (FOLFOX) and CAPOX, also known as XELOX), is currently available for patients with HER2-negative disease. Input noted that patients best suited to receive pembrolizumab would be those with a programmed cell death 1 ligand 1 (PD-L1) combined positive score of more than 5% or 10% and that response to treatment would be assessed using CT scans performed regularly or at the clinician’s discretion. The decision to discontinue treatment should be based on disease response and immune-related toxicities.
Drug plan input received by CDA-AMC for this review noted the intention to adopt weight-based dosing for pembrolizumab (e.g., 2 mg/kg every 3 weeks, capped at 200 mg, or 4 mg/kg every 6 weeks, with a maximum dose of 400 mg). The plans also noted that the treatment duration for pembrolizumab is until disease progression, unacceptable toxicity, or up to 24 months (35 cycles of 2 mg/kg every 3 weeks). The drug plan input also sought clarification about extended treatment duration if pembrolizumab is discontinued for reasons other than progression or intolerance after the initial 24 months.
Several of these concerns were addressed in the sponsor’s model:
Treatment goals of PFS and OS, as well as AEs, were modelled.
Nivolumab plus chemotherapy was modelled as a comparator.
The cost of resource use (e.g., CT scans) was included.
Weight-based dosing for pembrolizumab was used.
CDA-AMC addressed some of these concerns, as follows:
CDA-AMC aligned the percent use of chemotherapy regimens and with Canadian clinical practice.
CDA-AMC aligned the dosing frequency for pembrolizumab and nivolumab with Canadian clinical practice.
CDA-AMC examined the implications of extending treatment duration to 36 months (52 cycles) for pembrolizumab and nivolumab in a scenario analysis.
CDA-AMC examined the implications of a per-cycle disutility from AEs in a scenario analysis.
CDA-AMC was unable to address the following concerns raised from input:
The cost of PD-L1 testing was not included.
Economic Review
Economic Evaluation
Summary of Sponsor’s Economic Evaluation
Overview
The sponsor submitted a cost-utility analysis comparing costs and outcomes for pembrolizumab plus chemotherapy (assumed by the sponsor to be CAPOX or cisplatin plus 5-fluorouracil [CISPFU]) with chemotherapy alone (CAPOX or CISPFU) and with nivolumab plus chemotherapy (CAPOX or FOLFOX).1 The modelled population comprised adult patients with locally advanced, unresectable, or metastatic HER2-negative gastric or GEJ adenocarcinoma, based on the KEYNOTE-859 trial population, and was in line with the Health Canada indication and reimbursement request.2
Pembrolizumab is available as a solution for infusion (100 mg/4 mL vial).3 The recommended dosage of pembrolizumab is 200 mg every 3 weeks or 400 mg every 6 weeks, in combination with CISPFU or CAPOX every 3 weeks. At the submitted price of $4,400 per 4 mL vial, the cost of pembrolizumab per 3-week cycle was estimated by the sponsor to be $5,375 (assuming a 2 mg/kg dose and ████% relative dose intensity [RDI]). When used in combination CISPFU or CAPOX at the sponsor’s assumed dose intensities for each drug, the total regimen cost per cycle ranged from $5,795 to $6,038. Similarly, the cost of nivolumab for a 3-week cycle was estimated to be $5,762, assuming a 4.5 mg/kg dose and ██% RDI. The total regimen cost per 21-day cycle for nivolumab plus chemotherapy ranged from $5,638 to $6,543. The sponsor incorporated vial sharing, 5% estimated waste, and RDI in the calculation of drug costs.
The clinical outcomes were QALYs and life-years. The economic analysis was undertaken over a time horizon of 25 years from the perspective of a Canadian publicly funded health care system. Costs and QALYs were discounted at a rate of 1.5% per annum.
Model Structure
The sponsor submitted a partitioned survival model with 3 health states: progression-free, progressed disease, and death (Appendix 3, Figure 1). The proportion of patients in the progression-free, progressed-disease, or death health state at any time over the model horizon was derived from nonmutually exclusive survival curves. All patients entered the model in the progression-free state and were assumed to receive treatment until disease progression and/or the development of treatment-limiting or treatment-related AEs. Patients could discontinue treatment but remain in the progression-free health state based on the time-on-treatment (ToT) curve and, upon discontinuation, the cost of first-line treatment would no longer be incurred. At the end of each weekly cycle, the proportion of patients in the progressed-disease or death state was derived based on the area under the survival curves. Specifically, OS was partitioned to estimate the proportion of patients in the death state, whereas the PFS curve was used to estimate the proportion of patients in the progression-free health state. The difference between the OS curve and the PFS curve was partitioned at each time point to estimate the proportion of patients in the progressed-disease health state. Disease progression was determined by investigator assessment according to the Response Evaluation Criteria in Solid Tumours Version 1.1 (RECIST 1.1). Patients who transitioned to the progressed-disease state incurred costs associated with subsequent treatment.
Model Inputs
The modelled population reflected the baseline characteristics of the intention-to-treat population of the KEYNOTE-859 trial.4 In that trial, adult participants with HER2-negative advanced gastric or GEJ adenocarcinoma were randomly assigned to receive pembrolizumab plus chemotherapy or placebo plus chemotherapy as a first-line treatment. The mean age of patients in the model was 59.6 years, mean body surface area was 1.7 m2, and mean weight was 65.5 kg.
Key clinical efficacy inputs (PFS, OS, ToT) for pembrolizumab plus chemotherapy were derived from the KEYNOTE-859 trial (data cut-off date: October 3, 2022) and for nivolumab plus chemotherapy were derived from the CheckMate 649 trial.4,5 The sponsor used spline models (hazards with 2 knots) to fit patient-level data from the KEYNOTE-859 and the CheckMate 649 trials, and estimated PFS and OS during and after the end of the trial follow-up period; survival models were selected based on clinical validity and statistical fit. Kaplan-Meier data for ToT from the KEYNOTE-859 and CheckMate 649 trials are mature, and no data extrapolation was required. The proportion of patients receiving subsequent treatments after discontinuation in each treatment arm was based on data from the KEYNOTE-859 and CheckMate 649 trials.
The safety data for the trial components was sourced from the KEYNOTE-859 safety reports, whereas the safety data for the nivolumab plus chemotherapy arm was sourced from the CheckMate 649 trial.
The model accounted for grade 3 or higher all-cause AEs reported in at least 5% of participants and treatment-related AEs that were reported in at least 3% of participants.
Health state utility values were based on 5-Level EQ-5D data collected in the KEYNOTE-859 trial, which were valued using a mapping developed by Ara et al.6 The same utility values were applied to all treatment arms in the model. Disutility due to AEs was calculated in each treatment arm as a function of the mean duration of AEs and the estimated disutility associated with grade 3 or higher AEs and the proportion of AEs.
The model included costs related to drug acquisition and administration, disease management, AEs, terminal care, and PD-L1 testing. Drug acquisition costs were calculated by the sponsor as a function of unit drug costs, dosing schedules, RDI reported in the KEYNOTE-859 trial, and the proportion of patients on treatment based on ToT curves. Acquisition costs were based on the sponsor’s submitted price for pembrolizumab and were sourced from CDA-AMC final economic guidance reports and the Ontario Drug Formulary for chemotherapies and comparators.7-12 The sponsor assumed that all patients would receive pembrolizumab at a dosage of 200 mg every 3 weeks; for nivolumab, the sponsor assumed that 51% of patients would receive 240 mg every other week and the remainder would receive 360 mg every 3 weeks. The dosing schedules for pembrolizumab and CAPOX or CISPFU were based on the KEYNOTE-859 trial, whereas the dosing schedules for nivolumab and CAPOX or FOLFOX were based on the CheckMate 649 trial. The sponsor’s model applied a maximum treatment duration of 35 cycles (104 weeks) for pembrolizumab, 52 cycles (104 weeks) for nivolumab, and 18 weeks for chemotherapy, and assumed that CAPOX and FOLFOX chemotherapy were administered until disease progression. The duration of subsequent treatment was obtained from the KEYNOTE-859 trial. Drug-administration costs included costs associated with the infusion time required to administer the drug. Disease management costs included CT scans, full blood counts, renal function tests, hepatic function tests, and medical consultations; unit costs for resources were obtained from local estimates. Costs for the management of AEs were obtained from the 2019 Canadian Institute for Health Information Patient Cost Estimator.13 Terminal care costs were applied to patients who transitioned to the death health state; the cost estimate was obtained from the literature.14
Summary of the Sponsor’s Economic Evaluation Results
All analyses in the CDA-AMC base case were run probabilistically (2,000 iterations), and the deterministic and probabilistic results were similar, as subsequently described. The submitted analyses were based on the submitted price for pembrolizumab and publicly available prices for the other drugs. Additional results from the sponsor’s submitted economic evaluation base case are presented in Appendix 3.
Base-Case Results
In the sponsor’s submitted base case, pembrolizumab plus chemotherapy was associated with an incremental cost of $71,912 and 0.50 incremental QALYs over the lifetime horizon (25 years), resulting in an ICER of $144,318 per QALY compared to chemotherapy alone (Table 3). Nivolumab plus chemotherapy was dominated (more costly, less effective) by pembrolizumab. At a willingness-to-pay threshold of $50,000 per QALY gained, the probability of pembrolizumab plus chemotherapy being cost-effective was 2%. The majority (76%) of the incremental QALYs associated with pembrolizumab plus chemotherapy were accrued during the trial period.
In the sponsor’s submitted base case, pembrolizumab plus chemotherapy was slightly less costly and more effective than nivolumab plus chemotherapy (incremental cost = –$2,810, and incremental QALY = 0.018).The main treatment-related cost drivers were drug acquisition costs, which were influenced by RDI and the duration of subsequent treatment; however, the difference in drug acquisition costs between the 2 combination-therapy strategies was relatively small (incremental cost = –$576). Most of the difference (83%) in total treatment cost was accrued during the trial period (24.9 months) and can be attributed to a lower drug acquisition cost for pembrolizumab than for nivolumab (–$576), a lower administration cost (–$582), and a lower disease management cost after progression (–$1,601). At the end of the model horizon (i.e., 25 years), approximately 2% of patients treated with either nivolumab plus chemotherapy or pembrolizumab plus chemotherapy were predicted to remain alive.
Table 3: Summary of the Sponsor’s Economic Evaluation Results
Drug | Total costs ($) | Incremental costs ($) | Total QALYs | Incremental QALYs | ICER ($/QALY) |
|---|---|---|---|---|---|
Chemotherapy alone | 185,181 | Reference | 1.166 | Reference | Reference |
Pembrolizumab plus chemotherapy | 257,093 | 71,912 | 1.665 | 0.498 | $144,318 |
Nivolumab plus chemotherapy | 259,903 | 2,810 | 1.647 | –0.018 | Dominated by pembrolizumab plus chemotherapy |
ICER = incremental cost-effectiveness ratio; QALY = quality-adjusted life-year.
Note: Chemotherapy was assumed by the sponsor to comprise CAPOX or 5-fluorouracil plus cisplatin (CISPFU) for the pembrolizumab plus chemotherapy and chemotherapy-alone arms, and CAPOX or leucovorin plus 5-fluorouracil plus oxaliplatin (FOLFOX) for the nivolumab plus chemotherapy arm.
Source: Sponsor’s pharmacoeconomic submission.1
Sensitivity and Scenario Analysis Results
The sponsor provided deterministic scenario analyses to explore the impact of adopting alternative parametric survival models, incorporating alternative treatment waning assumptions, using a different approach to derive health utility values, assuming 100% RDI, using different costs for pembrolizumab and nivolumab, and using alterative time horizons or discount rates. Cost-effectiveness results were robust to changes in most parameters and assumptions.
CDA-AMC Appraisal of the Sponsor’s Economic Evaluation
CDA-AMC identified several key limitations to the sponsor’s analysis that have notable implications for the economic analysis:
The relative effectiveness of pembrolizumab plus chemotherapy compared to nivolumab plus chemotherapy was uncertain. The sponsor’s economic analysis was informed by a partitioned survival model, in which treatment efficacy is represented by PFS and OS curves, informed by observations from the KEYNOTE-859 trial and extrapolated over the model’s horizon (25 years). In the pharmacoeconomic analysis, OS and PFS for pembrolizumab plus chemotherapy were based on statistical fitting to the OS and PFS curves from the KEYNOTE-859 clinical trial. The relative effectiveness of nivolumab plus chemotherapy was based on the results of a network meta-analysis that estimated hazard ratios for pembrolizumab plus chemotherapy and nivolumab plus chemotherapy at ████ (95% credible interval = █████████) and ████ (95% credible interval = █████████) for PFS and OS, respectively. The CDA-AMC Clinical Review Report concluded that there was little to no difference in the estimated PFS or OS between these 2 therapies. This was further supported by clinical expert feedback received by CDA-AMC for this review, suggesting that the comparative efficacy of the 2 combination-therapy approaches was considered to be equivalent in clinical practice.
In the CDA-AMC base case, CDA-AMC adopted a hazard ratio of 1.00 for both OS and PFS for pembrolizumab plus chemotherapy compared to nivolumab plus chemotherapy.
The percentages for the chemotherapy regimens were not reflective of clinical practice in Canada. In the base case, the sponsor assumed that the percent of patients receiving the chemotherapy regimens in the model would be equal to the percent of patients who received those regimens in the KEYNOTE-859 and CheckMate 649 trials. The model assumes that in the pembrolizumab plus chemotherapy group and in the chemotherapy comparator groups, 86.3% of patients would receive CAPOX and 13.7% would receive CISPFU, based on the KEYNOTE-859 trial. The model assumes that in the nivolumab plus chemotherapy group, 49.0% of patients would receive CAPOX and 51.0% would receive FOLFOX, based the CheckMate649 trial. The clinical experts consulted by CDA-AMC indicated that the treatment distributions adopted in the sponsor’s base case do not reflect clinical practice in Canada. The sponsor’s assumption introduced a potential bias that favours pembrolizumab.
In the CDA-AMC base case, CDA-AMC adopted an alternate distribution of chemotherapy treatments based on input from clinical experts, using a proportion of 40% for CAPOX and 60% for FOLFOX in both the pembrolizumab plus chemotherapy and nivolumab plus chemotherapy groups.
The dosing frequency of immunotherapy regimens was not reflective of clinical practice in Canada. In the base case, the sponsor estimated the frequency and dosing of immunotherapy based on the pembrolizumab plus chemotherapy group in the KEYNOTE-859 trial for. In the model, 100% of patients were assumed to receive pembrolizumab 2 mg/kg every 3 weeks plus CAPOX (100%), 0% of patients were assumed to receive pembrolizumab 4 mg/kg every 6 weeks, 51% of patients were assumed to receive nivolumab 3 mg/kg every 2 weeks, and 49% of patients were assumed to receive nivolumab 4.5 mg/kg every 3 weeks. Feedback from clinical experts consulted by CDA-AMC indicated that the treatment distributions adopted by the sponsor did not reflect clinical practice in Canada. This assumption introduced a potential bias that favoured pembrolizumab.
In the CDA-AMC base case, CDA-AMC adopted an alternate dosage frequency for immunotherapy based on input from clinical experts. In the model, 40% of patients treated with pembrolizumab plus chemotherapy received pembrolizumab 2 mg/kg every 3 weeks and 60% received pembrolizumab 4 mg/kg every 6 weeks, whereas 60% of patients treated with nivolumab plus chemotherapy received nivolumab 3 mg/kg every 2 weeks and 40% received nivolumab 4.5 mg/kg every 3 weeks.
The unit price of oxaliplatin was outdated: The sponsor obtained the unit price for oxaliplatin from a previous CADTH review of nivolumab dated 2022, which does not reflect current publicly available prices.
CDA-AMC corrected the sponsor’s base case using an updated wholesale unit price for oxaliplatin from the IQVIA Delta PA database.
Health state utility values lacked face validity. In the sponsor's base case, health state utility values were estimated based on 5-Level EQ-5D observations from the KEYNOTE-859 trial. CDA-AMC noted that the utility value adopted by the sponsor for patients in the progression-free health state was greater than the Canadian population averages for the same age group (i.e., █████ versus 0.839) and was comparable to the utility value adopted for progressed disease (█████).15 As a result, the utility value adopted by the sponsor for the progressed-disease state lacks face validity and likely overestimates patients' quality of life after progression, which biases the results in favour of pembrolizumab. The degree of bias in favour of pembrolizumab is unknown, which adds uncertainty to the impact of health state utility values on the ICER.
CDA-AMC additionally noted concerns regarding the sponsor's omission of baseline utility values in its health utility analysis. Although economic evaluations from randomized controlled trials often presume that baseline characteristics are balanced across treatment groups, a difference in mean baseline utility among trial arms can occur. Such imbalances can significantly skew ICERs, given that ICERs are highly sensitive to slight variations in QALYs stemming from differences in baseline utility.16
In the CDA-AMC reanalysis, CDA-AMC applied age-based utility decrements, which was provided as an option in the sponsor’s model.
The use of RDIs may underestimate actual drug costs. The sponsor's base case reduced dose intensities for pembrolizumab, nivolumab, and chemotherapy drugs using RDIs observed in the KEYNOTE-859 and CHECKMATE 649 trials, and the literature. CDA-AMC noted that changes in RDIs can result from numerous factors, including clinical judgment, dose delays, missed doses, and dose reductions, and such adjustments impact drug costs differently, especially when drug wastage is considered. Consistent with prior pembrolizumab reviews and due to the challenge of correlating specific dose intensities with patient outcomes, the CDA-AMC reanalysis did not include RDI.
In the CDA-AMC base case, an RDI of 100% was assumed for pembrolizumab, nivolumab, and chemotherapy. CDA-AMC explored the impact of assuming the sponsor’s adopted RDIs on the CDA-AMC base case in a scenario analysis.
Additionally, the key assumptions outlined in Table 4 were made by the sponsor and have been appraised by CDA-AMC.
Table 4: Key Assumptions of the Submitted Economic Evaluation (Not Noted as Limitations to the Submission)
Sponsor’s key assumption | CDA-AMC comment |
|---|---|
The modelled population reflects the intention-to-treat population of the KEYNOTE-859 trial. | Appropriate. The Health Canada–approved indication is for locally advanced, unresectable, or metastatic HER2-negative gastric or gastroesophageal junction adenocarcinoma, which is aligned with the modelled population. |
Chemotherapy was assumed by the sponsor to be comprised of CAPOX and CISPFU, based on the KEYNOTE-859 trial. | The clinical experts consulted by CDA-AMC for this review indicated that FOLFOX, CAPOX, and CAPECISP are the most commonly used chemotherapy backbones in Canada; however, the standard first-line platinum-fluoropyrimidine doublet options are FOLFOX, CAPOX, CISPFU, and CAPECISP. Because the costs and QALYs for pembrolizumab plus chemotherapy and nivolumab plus chemotherapy were similar, CDA-AMC used the recommended dosages provided by the clinical experts. |
Costs and disutilities incorporated were for treatment-related AEs of grade 3 or higher reported by at least 3% of patients in any treatment arm of the KEYNOTE-859 trial. | Uncertain. The inclusion of only treatment-related AEs is problematic, given that this relies on investigator judgment of the cause of the AE. Instead, all AEs that have a clinical or cost consequence should be included in the model.17 Further, the inclusion of only AEs of grade 3 or higher experienced by at least 3% of trial participants may not capture the costs and consequences of rare AEs. |
Drug wastage was assumed. | Uncertain. The sponsor assumed that vial sharing would occur, with 5% of the vial contents wasted. Vial sharing is common in large centres; however, there are no data on the percentage of excess drug wasted when vial sharing is allowed. As such, the sponsor’s assumption of a 5% drug wastage when vial sharing is allowed is uncertain. CDA-AMC noted that assuming vial sharing and 0% drug wastage is expected to have minimal impact on the results. |
AE = adverse event; CDA-AMC = Canada's Drug Agency; CAPECISP = cisplatin plus capecitabine; CAPOX = oxaliplatin plus capecitabine; CISPFU = cisplatin plus 5-fluorouracil; FOLFOX = folinic acid (leucovorin) plus 5-fluorouracil plus oxaliplatin; QALY = quality-adjusted life-year.
CDA-AMC Reanalyses of the Economic Evaluation
Base-Case Results
CDA-AMC undertook reanalyses that addressed some of the key limitations of the submitted model, as summarized in Table 5. The CDA-AMC base case was derived by making changes to model-parameter values and assumptions, in consultation with clinical experts.
Table 5: CDA-AMC Revisions to the Submitted Economic Evaluation
Stepped analysis | Sponsor’s value or assumption | CDA-AMC value or assumption |
|---|---|---|
Correction to sponsor’s base case | ||
1. Unit price of oxaliplatin | 50 mg/unit: $36.27 100 mg/unit: $72.54 200 mg/unit: $145.08 | 50 mg/unit: $45.00 100 mg/unit: $90.00 200 mg/unit: $180.00 |
Changes to derive the CDA-AMC base case | ||
1a. Hazard ratio of OS for nivolumab plus chemotherapy | Hazard ratio of OS for nivolumab plus chemotherapy relative to pembrolizumab plus chemotherapy = ████ | Hazard ratio of OS for nivolumab plus chemotherapy relative to pembrolizumab plus chemotherapy = 1.00 |
1b. Hazard ratio of PFS for nivolumab plus chemotherapy | Hazard ratio of PFS for nivolumab plus chemotherapy relative to pembrolizumab plus chemotherapy = ████ | Hazard ratio of PFS for nivolumab plus chemotherapy relative to pembrolizumab plus chemotherapy = 1.00 |
2. Percentage use of chemotherapy regimens | The proportion of chemotherapeutic drugs was based on data from the KEYNOTE-859 and CheckMate 649 trials.18,19 Pembrolizumab plus chemotherapy and chemotherapy alone: CAPOX: 86.3%; CISPFU: 13.7%; CAPECISP: 0%; FOLFOX: 0% Nivolumab plus chemotherapy: CAPOX: 49.0%; CISPFU: 0%; CAPECISP: 0%; FOLFOX: 51% | The proportion of the chemotherapeutic drugs were updated to reflect clinical expert opinion of the proportion of these drugs used in Canadian clinical practice. All treatment regimens: CAPOX: 40%, CISPFU: 0%, CAPECISP: 0%, FOLFOX: 60% |
3. Dosing frequency of pembrolizumab and nivolumab | Pembrolizumab 4 mg/kg every 6 weeks: 0% Nivolumab 4.5 mg/kg every 3 weeks: 49% | Pembrolizumab 4 mg/kg every 6 weeks: 60% Nivolumab 4.5 mg/kg every 3 weeks: 40% |
4. RDI | RDI < 100% (varied by drug) | 100% for all drugs |
5. Utilities | Age-based utility decrements not applied | Age-related utility decrements applied |
CDA-AMC base case | ― | 1 + 2 + 3 + 4 + 5 |
CAPECISP = cisplatin plus capecitabine; CAPOX = oxaliplatin plus capecitabine; CDA-AMC = Canada's Drug Agency; CISPFU = cisplatin plus 5-fluorouracil; FOLFOX = folinic acid (leucovorin) plus 5-fluorouracil plus oxaliplatin; OS = overall survival; PFS = progression-free survival; RDI = relative dose intensity.
Note: Chemotherapy was assumed by the sponsor to comprise CAPOX or 5-fluorouracil plus cisplatin (CISPFU) for the pembrolizumab plus chemotherapy and chemotherapy only arms, and CAPOX or leucovorin plus 5-fluorouracil plus oxaliplatin (FOLFOX) for the nivolumab plus chemotherapy arm.
In the CDA-AMC base case, pembrolizumab plus chemotherapy and nivolumab plus chemotherapy were both more cost-effective than chemotherapy alone, but there was a relatively small difference between the 2 combination therapies in terms of total cost and QALYs. Pembrolizumab plus chemotherapy was more costly ($75,318) and produced more QALYs (0.489) than chemotherapy alone, resulting in an ICER of $153,773 per QALY gained. Similarly, nivolumab plus chemotherapy was more expensive ($72,151) and more effective (0.491 QALYs) than chemotherapy alone, with an ICER of $146,827 per QALY gained. However, in sequential cost-effectiveness analysis, pembrolizumab plus chemotherapy was associated with slightly higher costs than nivolumab plus chemotherapy, but with similar QALYs (incremental cost = $3,167; incremental QALYs = −0.0016).
Table 6: Summary of the Stepped Analysis of the CDA-AMC Reanalysis Results
Stepped analysis | Druga | Total costs ($) | Total QALYs | ICER ($/QALY) |
|---|---|---|---|---|
Sponsor’s base case (deterministic) | Chemotherapy alone | 185,205 | 1.17 | Reference |
Pembrolizumab plus chemotherapy | 255,732 | 1.64 | 147,205 | |
Nivolumab plus chemotherapy | 257,801 | 1.62 | Dominatedb | |
Sponsor’s base case, corrected | Chemotherapy alone | 185,048 | 1.17 | Reference |
Pembrolizumab plus chemotherapy | 256,941 | 1.66 | 145,371 | |
Nivolumab plus chemotherapy | 259,203 | 1.65 | Dominated | |
CDA-AMC reanalysis 1a: OS HR | Chemotherapy alone | 186,164 | 1.17 | Reference |
Pembrolizumab plus chemotherapy | 257,835 | 1.66 | 145,023 | |
Nivolumab plus chemotherapy | 260,523 | 1.66 | Dominated | |
CDA-AMC reanalysis 1b: PFS HR | Chemotherapy alone | 185,634 | 1.17 | Reference |
Pembrolizumab plus chemotherapy | 257,459 | 1.66 | 144,747 | |
Nivolumab plus chemotherapy | 258,095 | 1.65 | Dominated | |
CDA-AMC reanalysis 2: Percentage use of chemotherapy regimens | Chemotherapy alone | 190,368 | 1.17 | Reference |
Nivolumab plus chemotherapy | 260,875 | 1.65 | Extendedly dominated | |
Pembrolizumab plus chemotherapy | 262,062 | 1.66 | 144,576 | |
CDA-AMC reanalysis 3: Dosing frequency of pembrolizumab and nivolumab | Chemotherapy alone | 185,679 | 1.17 | Reference |
Pembrolizumab plus chemotherapy | 257,751 | 1.66 | 146,397 | |
Nivolumab plus chemotherapy | 259,564 | 1.65 | Dominated | |
CDA-AMC reanalysis 4: 100% RDI | Chemotherapy alone | 185,439 | 1.17 | Reference |
Pembrolizumab plus chemotherapy | 260,604 | 1.66 | 151,958 | |
Nivolumab plus chemotherapy | 263,684 | 1.65 | Dominated | |
CDA-AMC reanalysis 5: Age-based utility decrements | Chemotherapy alone | 185,716 | 1.16 | Reference |
Pembrolizumab plus chemotherapy | 256,171 | 1.64 | 145,188 | |
Nivolumab plus chemotherapy | 259,355 | 1.62 | Dominated | |
CDA-AMC base case (1 + 2 + 3 + 4 + 5) | Chemotherapy alone | 190,830 | 1.16 | Reference |
Nivolumab plus chemotherapy | 262,981 | 1.65 | 72,151 | |
Pembrolizumab plus chemotherapy | 266,148 | 1.65 | Dominated |
CDA-AMC = Canada's Drug Agency; HR = hazard ratio; ICER = incremental cost-effectiveness ratio; OS = overall survival; PFS = progression-free survival; QALY = quality-adjusted life-year; RDI = relative dose intensity.
aChemotherapy was assumed by the sponsor to comprise CAPOX or 5-fluorouracil plus cisplatin (CISPFU) for the pembrolizumab plus chemotherapy and chemotherapy only arms, and CAPOX or leucovorin plus 5-fluorouracil plus oxaliplatin (FOLFOX) for the nivolumab plus chemotherapy arm.
bThe finding of dominance in the sponsor’s analysis and the CDA-AMC reanalysis are produced by QALY differences that are so small and associated with so much uncertainty that they are best understood as being equivalent (i.e., incremental QALY ≈ 0).
Scenario Analysis Results
The economic analyses are based on publicly available prices of the comparator treatments and on a weight-based regimen for pembrolizumab and nivolumab. Additional scenario analyses conducted by CDA-AMC to explore uncertainty about the cost-effectiveness of pembrolizumab are provided in Table 12. Because the cost of pembrolizumab plus chemotherapy was similar to that of nivolumab plus chemotherapy, CDA-AMC did not analyze a pembrolizumab price reduction.
Issues for Consideration
Feedback from the drug plans indicates a need for operationalization and funding of PD-L1 combined positive score testing in specific jurisdictions to identify patients eligible for pembrolizumab treatment. Although the cost of testing was not included in the sponsor or CDA-AMC base cases, testing costs had minimal impact on the overall conclusions in previous submissions of PD-L1 inhibitor drugs.
As in all CDA-AMC pharmacoeconomic reports, the economic evaluation presented here is based on publicly available list prices for all comparators, including pembrolizumab, nivolumab, and chemotherapy. Negotiated prices are in place for all drugs in this evaluation. The finding of similar QALYs for pembrolizumab plus chemotherapy and nivolumab plus chemotherapy is not affected by changes in drug prices; however, it is possible that the conclusion of similar costs would not hold if negotiated prices had been used in the analysis.
Overall Conclusions
The CDA-AMC clinical review showed that the addition of pembrolizumab to chemotherapy results in a clinically important increase in OS and PFS at 30 months compared to chemotherapy alone, with a high degree of certainty. Indirect comparison of pembrolizumab plus chemotherapy and nivolumab plus chemotherapy suggested that there was little to no difference in OS or PFS between these 2 regimens, although clinical and methodological heterogeneity added uncertainty to the comparison. This similarity between the 2 combination-therapy regimens was supported by feedback from clinical experts consulted by CDA-AMC for this review, who viewed the 2 approaches as being fundamentally equivalent in terms of efficacy.
CDA-AMC undertook reanalyses to address several limitations of the sponsor’s analysis, which included correcting the price of oxaliplatin, using similar OS and PFS efficacies for pembrolizumab and nivolumab, using alternative percentages for chemotherapy regimens, using alternative dosing and frequency for pembrolizumab and nivolumab, using 100% RDI for all treatments, and making age-based utility adjustments.
Results of the CDA-AMC base case suggest that pembrolizumab plus chemotherapy is slightly more costly than nivolumab plus chemotherapy but is similarly effective. Treatment with pembrolizumab plus chemotherapy is associated with higher costs and improved QALYs compared with chemotherapy alone and is not cost-effective at a threshold of $50,000 per QALY gained (ICER = $153,773 per QALY gained) compared to the ICER of $146,827 for nivolumab plus chemotherapy compared to chemotherapy alone. The CDA-AMC base case showed equivalent effectiveness for pembrolizumab plus chemotherapy and nivolumab plus chemotherapy, but pembrolizumab plus chemotherapy was more costly than nivolumab plus chemotherapy. In the absence of direct comparative evidence for pembrolizumab and nivolumab, the incremental cost-effectiveness of pembrolizumab plus chemotherapy compared to nivolumab plus chemotherapy predicted in the CDA-AMC base case is highly uncertain and may be overestimated. The analysis was based on public list prices, even though negotiated prices exist for all drugs included in this economic evaluation. The economic evidence does not support a price premium for pembrolizumab plus chemotherapy over nivolumab plus chemotherapy, and a reduction in the price of pembrolizumab may be required to ensure cost-effectiveness.
References
1.Pharmacoeconomic evaluation [internal sponsor's report]. In: Drug Reimbursement Review sponsor submission: Keytruda (pembrolizumab), solution for infusion 100 mg/4 mL vial. Kirkland (QC): Merck Canada Inc.; 2024 Mar 13.
2.ClinicalTrials.gov. Pembrolizumab (MK-3475) Plus Chemotherapy Versus Placebo Plus Chemotherapy in Participants Gastric or Gastroesophageal Junction (GEJ) Adenocarcinoma (MK-3475-859/KEYNOTE-859). Accessed April, 2023. https://clinicaltrials.gov/ct2/show/NCT03675737
3.Keytruda (pembrolizumab), solution for infusion 100 mg/4 mL vial [product monograph]. Sponsor name; 2024.
4.Tabernero J, Bang YJ, Van Cutsem E, et al. KEYNOTE-859: a Phase III study of pembrolizumab plus chemotherapy in gastric/gastroesophageal junction adenocarcinoma. Future Oncol. Aug 2021;17(22):2847-2855. doi:10.2217/fon-2021-0176 PubMed
5.Janjigian YY, Shitara K, Moehler MH, et al. Nivolumab (NIVO) plus chemotherapy (chemo) vs chemo as first-line (1L) treatment for advanced gastric cancer/gastroesophageal junction cancer/esophageal adenocarcinoma (GC/GEJC/EAC): 3-year follow-up from CheckMate 649. J Clin Oncol. 2023;41(4_suppl):291-291. doi:10.1200/JCO.2023.41.4_suppl.291
6.Ara R, Brazier J, Zouraq IA. The use of health state utility values in decision models. Pharmacoeconomics. 2017;35(Suppl 1):77-88. PubMed
7.Ontario Drug Benefit F. Ontario Formulary Search. Accessed June, 2023. https://www.formulary.health.gov.on.ca/formulary/
8.Review CR. CADTH Reimbursement Review, Nivolumab (Opdivo). Accessed December, 2023. https://www.cadth.ca/sites/default/files/DRR/2022/PC0259-Opdivo-combinedReport.pdf
9.Reimbursement Review-Entrectinib for extracranial solid tumours with NTRK gene fusion. 2023. Accessed October 10, 2023. https://www.cadth.ca/sites/default/files/DRR/2023/PC0278-Rozlytrek.pdf
10.CADTH Reimbursement Review-Pembrolizumab (Keytruda) for metastatic triple-negative breast cancer. 2023. Accessed October 10, 2023. https://www.cadth.ca/sites/default/files/DRR/2023/PC0295-Keytruda-mTNBC_combined.pdf
11.CADTH Reimbursement Review – Nivolumab for Non-small Cell Lung Cancer. 2023. Accessed July 17, 2023. https://www.cadth.ca/sites/default/files/DRR/2023/PC0303-Opdivo-NSCLC.pdf
12.Ontario Ministry of H, Ontario Ministry of Long-Term C. Ontario drug benefit formulary/comparative drug index. Accessed 1800 Jan 1, https://www.formulary.health.gov.on.ca/formulary/
13.Canadian Institute for Health I. Patient Cost Estimator. Accessed July, 2023. https://www.cihi.ca/en/patient-cost-estimator
14.De Oliveira C, Pataky R, Bremner KE, et al. Estimating the cost of cancer care in British Columbia and Ontario: a Canadian inter-provincial comparison. Healthcare Policy. 2017;12(3):95. PubMed
15.Yan J XS, Johnson JA, et al. Canada population norms for the EQ-5D-5L. The European Journal of Health Economics. 2024; PubMed
16.Manca A HN, Sculpher MJ. Estimating mean QALYs in trial‐based cost‐effectiveness analysis: the importance of controlling for baseline utility. Health Econ. 2005; PubMed
17.Canada's D, Health Technology A. Guidelines for the Economic Evaluation of Health Technologies: Canada. Accessed October, 2023. https://www.cadth.ca/guidelines-economic-evaluation-health-technologies-canada-0
18.Rha SY, Oh DY, Yanez P, et al. Pembrolizumab plus chemotherapy versus placebo plus chemotherapy for HER2-negative advanced gastric cancer (KEYNOTE-859): a multicentre, randomised, double-blind, phase 3 trial. Lancet Oncol. Nov 2023;24(11):1181-1195. doi:10.1016/S1470-2045(23)00515-6 PubMed
19.Janjigian YY, Shitara K, Moehler M, et al. First-line nivolumab plus chemotherapy versus chemotherapy alone for advanced gastric, gastro-oesophageal junction, and oesophageal adenocarcinoma (CheckMate 649): a randomised, open-label, phase 3 trial. Lancet. Jul 3 2021;398(10294):27-40. doi:10.1016/S0140-6736(21)00797-2 PubMed
20.DeltaPA. IQVIA; 2023. Accessed 1800 Jan 1. https://www.iqvia.com/
21.Cancer Care O. XELOX+PEMB - Regimen Monograph. Accessed April 15, 2024. https://www.cancercareontario.ca/en/drugformulary/regimens/monograph/70491#DrugRegimen
22.Cancer Care O. CAPECISP+NIVL - Regimen Monograph. Accessed April 15, 2024. https://www.cancercareontario.ca/en/drugformulary/regimens/monograph/70536#DrugRegimen
23.Cancer Care O. XELOX+NIVL - Regimen Monograph. Accessed April 15, 2024. https://www.cancercareontario.ca/en/drugformulary/regimens/monograph/70336#DrugRegimen
24.Cancer Care O. MFOLFOX6+NIVL - Regimen Monograph. Accessed April 15, 2024. https://www.cancercareontario.ca/en/drugformulary/regimens/monograph/70331#DrugRegimen
25.Cancer Care O. CISPFU+NIVL - Regimen Monograph. Accessed April 15, 2024. https://www.cancercareontario.ca/en/drugformulary/regimens/monograph/70526#DrugRegimen
26.Cancer Care O. CAPECISP - Regimen Monograph. Accessed April 15, 2024. https://www.cancercareontario.ca/en/drugformulary/regimens/monograph/46591#DrugRegimen
27.Cancer Care O. XELOX - Regimen Monograph. Accessed April 15, 2024. https://www.cancercareontario.ca/en/drugformulary/regimens/monograph/47936#DrugRegimen
28.Ontario Drug Formulary. Accessed July 17, 2023. https://www.formulary.health.gov.on.ca/formulary/
29.Budget Impact Analysis [internal sponsor's report]. In: Drug Reimbursement Review sponsor submission: Keytruda (pembrolizumab), solution for infusion 100 mg/4 mL vial. Kirkland (QC): Merck Canada Inc.; 2024 Mar 13.
30.Canadian Cancer Statistics Advisory Committee, Canadian Cancer Society, Statistics Canada and the Public Health Agency of Canada. Canadian Cancer Statistics 2023. https://cdn.cancer.ca/-/media/files/research/cancer-statistics/2023-statistics/2023_pdf_en
31.Ding PQ, Dolley A, Cheung WY. Trifluridine/Tipiracil in the Real-World Management of Metastatic Gastric and Gastroesophageal Junction Cancers in Canada. Curr Oncol. 2022/12/22/ 2022;30(1):130-144. doi:10.3390/curroncol30010011
32.Canadian Agency for D, Technologies in H. CADTH Reimbursement Review – Nivolumab for gastric, gastroesophageal junction, or esophageal adenocarcinoma. 2022. Accessed July 17, 2023. https://www.cadth.ca/sites/default/files/DRR/2022/PC0259-Opdivo-combinedReport.pdf
33.Canadian Agency for D, Technologies in H. CADTH Reimbursement Review-Pembrolizumab for esophageal carcinoma, gastroesophageal junction adenocarcinoma. 2022. Accessed Oct 30, 2023. https://www.cadth.ca/sites/default/files/DRR/2022/PC0250CL-Keytruda.pdf
34.Public Health Agency of Canada. Cancer in Canada - An Epidemiologic Overview. A report based on the Cancer Incidence Atlas. Vol. 2. 2014. https://www.canada.ca/en/public-health/services/chronic-diseases/cancer/cancer-canada-epidemiologic-overview.html#s4c
35.Ryu MH, Kang YK. ML17032 trial: capecitabine/cisplatin versus 5-fluorouracil/cisplatin as first-line therapy in advanced gastric cancer. Expert Rev Anticancer Ther. Dec 2009;9(12):1745-51. doi:10.1586/era.09.149 PubMed
36.Shitara K, Ajani JA, Moehler M, et al. Nivolumab plus chemotherapy or ipilimumab in gastro-oesophageal cancer. Nature. Mar 2022;603(7903):942-948. doi:10.1038/s41586-022-04508-4 PubMed
37.Cancer Care Ontario: funded evidence-informed regimens. Accessed 1800 Jan 1, https://www.cancercareontario.ca/en/drugformulary/regimens
38.Canadian Agency for D, Technologies in H. Reimbursement Review-Entrectinib for extracranial solid tumours with NTRK gene fusion. 2023. Accessed October 10, 2023. https://www.cadth.ca/sites/default/files/DRR/2023/PC0278-Rozlytrek.pdf
39.Ontario Ministry of H, Ontario Ministry of Long-Term C. Ontario drug benefit formulary/comparative drug index. Accessed 1800 Jan 1, https://www.formulary.health.gov.on.ca/formulary/
Appendix 1: Cost Comparison Table
Please note that this appendix has not been copy-edited.
The comparators presented in the following table have been deemed to be appropriate based on feedback from clinical expert(s) and drug plan. Comparators may be recommended (appropriate) practice or actual practice. Existing Product Listing Agreements are not reflected in the table and as such, the table may not represent the actual costs to public drug plans.
Table 7: CDA-AMC Cost Comparison for Locally Advanced, Unresectable, or Metastatic HER2-Negative Gastric or GEJ Adenocarcinoma
Treatment | Strength / concentration | Form | Price | Recommended dosage | Daily cost | Average 28-day cost |
|---|---|---|---|---|---|---|
Pembrolizumab (Keytruda) | 100 mg/4mL | 4 mL vial | $4,400.0000a | 200 mg Q3W, or 400 mg Q6Wb | $419.05 | $11,733 |
Pembrolizumab plus CISPFU | $448.60 | $12,561 | ||||
Pembrolizumab plus CAPECISP | $444.88 | $12,457 | ||||
Pembrolizumab plus CAPOX | $436.40 | $12,219 | ||||
Pembrolizumab plus FOLFOX | $511.34 | $14,317 | ||||
Immunotherapy | ||||||
Nivolumab | 10 mg/mL | 40 mg vial 100 mg vial | $782.2200 $1,955.5600 | 240 mg Q2W or 360 mg Q3Wc | $335.24 | $9,387 |
Nivolumab plus CISPFU | $364.79 | $10,214 | ||||
Nivolumab plus CAPECISP | $361.07 | $10,110 | ||||
Nivolumab plus CAPOX | $352.59 | $9,872 | ||||
Nivolumab plus FOLFOX | $427.53 | $11,971 | ||||
Cisplatin-5-fluorouracil (CISPFU) | ||||||
Cisplatin (generic) | 1 mg/mL | 50 mL vial 100 mL vial | $135.0000 $270.0000 | 80 mg/m2 Q3W | $18.51 | $518 |
5-Fluorouracil infusion | 50 mg/mL | 100 mL vial | $160.9000 | 800 mg/m2 days 1 to 5 Q3W | $11.03 | $309 |
CISPFU | $29.55 | $827 | ||||
Cisplatin-capecitabine (CAPECISP) | ||||||
Cisplatin (generic) | 1 mg/mL | 50 mL vial 100 mL vial | $135.0000 $270.0000 | 80 mg/m2 Q3W | $18.51 | $518 |
Capecitabine (generic) | 150 mg 500 mg | Tab | $0.4575b $1.5250b | 1,000 mg/m2 twice daily from days 1 to 14 of Q3W | $7.32 | $205 |
CAPECISP | $25.83 | $723 | ||||
Capecitabine-oxaliplatin (CAPOX) | ||||||
Oxaliplatin (generic) | 5 mg/mL | 10 mL vial 20 mL vial 40 mL vial | $45.0000 $90.0000 $180.0000 | 130 mg/m2 Q3W | $10.03 | $281 |
Capecitabine (generic) | 150 mg 500 mg | Tab | $0.4575d $1.5250d | 1,000 mg/m2 twice daily from days 1 to 14 Q3W | $7.32 | $205 |
CAPOX | $17.35 | $486 | ||||
Folinic acid (leucovorin)-fluorouracil-oxaliplatin (FOLFOX) | ||||||
Oxaliplatin (generic) | 5 mg/mL | 10 mL vial 20 mL vial 40 mL vial | $45.0000 $90.0000 $180.0000 | 85 mg/m2 Q2W | $9.84 | $275 |
Folinic acid (Leucovorin) | 10 mg/mL | 5 mL vial 50 mL vial | $68.9400 $689.000 | 400 mg/m2 Q2W | $70.87 | $1,984 |
5-Fluorouracil bolus | 50 mg/mL | 100 mL vial | $160.9000 | 400 mg/m2 bolus Q2W | $1.65 | $46 |
5-Fluorouracil infusion | 50 mg/mL | 100 mL vial | $160.9000 | 2,400 mg/m2 Q2W | $9.93 | $278 |
FOLFOX | $92.29 | $2,584 | ||||
CAPECISP = Cisplatin-capecitabine; CAPOX = Oxaliplatin-capecitabine; CISPFU = Cisplatin-5-Fluorouracil; FOLFOX = Folinic Acid (Leucovorin)-Fluorouracil-Oxaliplatin; Q2W = every 2 weeks; Q3W = every 3 weeks, Q6W = every 6 weeks.
Note: All prices are IQVIA Delta PA wholesale list prices (accessed May 6, 2024),20 unless otherwise indicated, and do not include dispensing fees or markups. Wastage was included. Recommended dosages are based on Cancer Care Ontario monographs,21-27 unless otherwise indicated. For dosing that depended on weight or body surface area, CDA-AMC assumed a mean body weight of 75 kg and a mean body surface area of 1.8m2. Total cost estimates per regimen are based on the cheapest combination of the component drugs. Costs have been prorated to a 28-day period.a Sponsor’s submitted price.1
bAlternative weight-based dosing of pembrolizumab is 2 mg/kg Q3W or 4 mg/kg Q6W.21
cAlternative weight-based dosing of nivolumab is 3 mg/kg Q2W or 4.5 mg/kg Q3W.23
dOntario Drug Benefit Formulary (accessed May 5, 2024).28
Appendix 2: Submission Quality
Please note that this appendix has not been copy-edited.
Description | Yes or No | Comments |
|---|---|---|
Population is relevant, with no critical intervention missing, and no relevant outcome missing | Yes | No comment |
Model has been adequately programmed and has sufficient face validity | Yes | Overall acceptable. However, there is an issue with the results changing when using copy and paste functionality |
Model structure is adequate for decision problem | Yes | Acceptable. A partitioned survival model is commonly used in oncology submissions |
Data incorporation into the model has been done adequately (e.g., parameters for probabilistic analysis) | Yes | No comment |
Parameter and structural uncertainty were adequately assessed; analyses were adequate to inform the decision problem | No | The sponsor conducted limited probabilistic scenario analyses. Consequently, the submitted scenario analysis results may not accurately represent the potential range of outcomes and uncertainties |
The submission was well organized and complete; the information was easy to locate (clear and transparent reporting; technical documentation available in enough details) | Yes | No comment |
Appendix 3: Additional Information on the Submitted Economic Evaluation
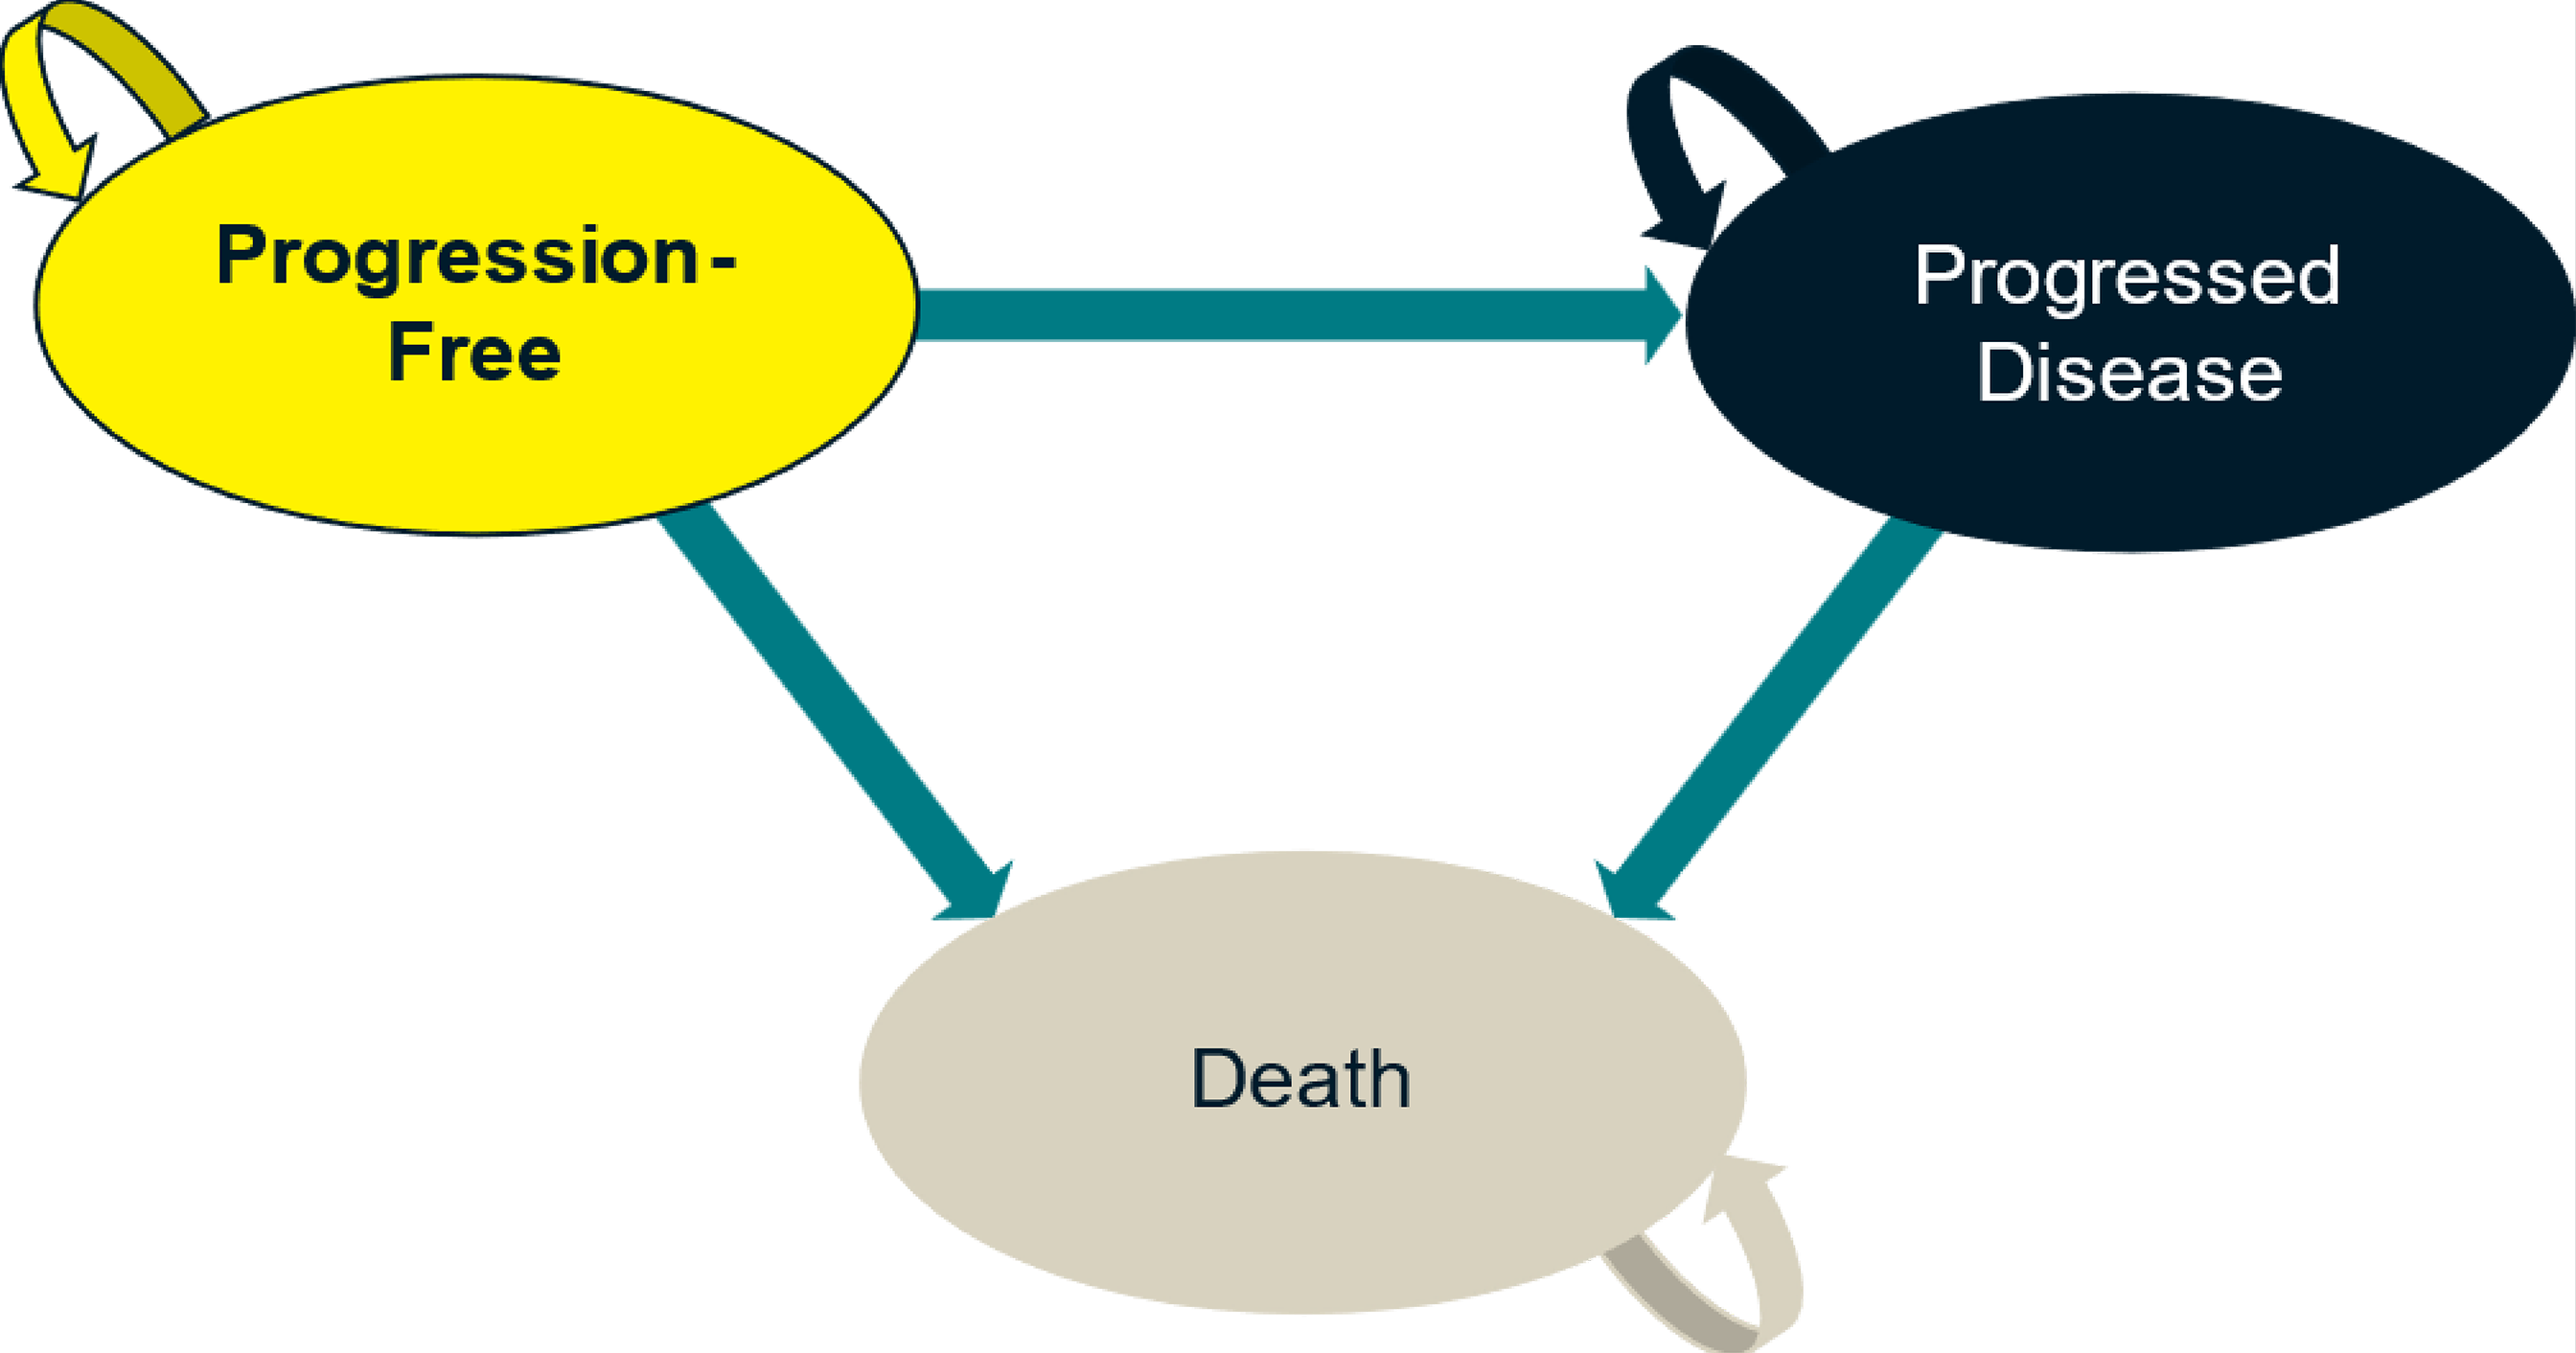
Detailed Results of the Sponsor’s Base Case
Table 9: Disaggregated Summary of the Sponsor’s Economic Evaluation Results
Parameter | Pembrolizumab + chemotherapy | Nivolumab + chemotherapy | Chemotherapy | Incremental (pembrolizumab + chemotherapy vs. nivolumab + chemotherapy) |
|---|---|---|---|---|
Discounted LYs | ||||
Total LYs | 2.00 | 1.99 | 1.41 | 0.02 |
Total, within trial period | 1.53 | 1.52 | 1.24 | 0.01 |
Total, after trial period | 0.47 | 0.47 | 0.17 | 0.01 |
Progression-free | 1.41 | 1.33 | 0.92 | 0.08 |
Progressed | 0.59 | 0.65 | 0.48 | −0.06 |
Discounted QALYs | ||||
Total | 1.66 | 1.65 | 1.17 | 0.02 |
Total, within trial period | 1.27 | 1.26 | 1.02 | 0.01 |
Total, after trial period | 0.40 | 0.39 | 0.14 | 0.01 |
Progression-free | 1.20 | 1.14 | 0.79 | 0.07 |
Progressed | 0.47 | 0.52 | 0.38 | −0.05 |
AE disutility | −0.01 | −0.01 | −0.01 | 0.001 |
Discounted costs ($) | ||||
Total costs | 257,093 | 259,903 | 185,181 | −2,809 |
Total, within trial period | 236,679 | 239,500 | 176,905 | −2,821 |
Total, after trial period | 20,415 | 20,402 | 8,276 | 12 |
Acquisition | 75,279 | 75,855 | 2,405 | −576 |
Administration costs | 799 | 1,381 | 374 | −582 |
Disease management | 1,917 | 1,812 | 1,258 | 105 |
Adverse events | 3,671 | 3,383 | 3,523 | 287 |
Subsequent treatment | 92,256 | 92,683 | 96,586 | −427 |
End of life | 67,881 | 67,897 | 68,523 | −15 |
LY = life-year; QALY = quality-adjusted life-year.
Note: Chemotherapy was assumed by the sponsor to comprise CAPOX or 5-fluorouracil and cisplatin (CISPFU) for the pembrolizumab plus chemotherapy and chemotherapy only arms and CAPOX or leucovorin, 5-fluorouracil and oxaliplatin (FOLFOX) for the nivolumab plus chemotherapy arm.
Source: Sponsor’s pharmacoeconomic submission.1
Appendix 4: Additional Details on the CDA-AMC Reanalyses and Sensitivity Analyses of the Economic Evaluation
Please note that this appendix has not been copy-edited.
Detailed Results of CDA-AMC Base Case
Table 10: Disaggregated Summary of the CDA-AMC Economic Evaluation Results
Parameter | Pembrolizumab + chemotherapy | Nivolumab + chemotherapy | Chemotherapy |
|---|---|---|---|
Discounted LYs | |||
Total | 2.008 | 2.013 | 1.410 |
Profession-free | 1.410 | 1.401 | 0.924 |
Progressed | 0.598 | 0.612 | 0.486 |
Within the trial period | 1.525 | 1.523 | 1.241 |
After the trial period | 0.483 | 0.489 | 0.170 |
Discounted QALYs | |||
Total | 1.646 | 1.647 | 1.156 |
Profession-free | 1.187 | 1.179 | 0.781 |
Progressed | 0.465 | 0.476 | 0.381 |
Adverse events disutility | −0.007 | −0.008 | −0.007 |
Within the trial period | 1.259 | 1.256 | 1.018 |
After the trial period | 0.387 | 0.391 | 0.138 |
Discounted costs | |||
Acquisition | 83,601 | 80,226 | 6,774 |
Administration costs | 1,236 | 1,464 | 1,092 |
Disease management | 1,920 | 1,907 | 1,258 |
Adverse events | 3,674 | 3,364 | 3,520 |
Subsequent treatment | 92,236 | 92,192 | 96,937 |
End of life | 68,036 | 68,025 | 68,694 |
Total costs | 266,148 | 262,981 | 190,830 |
Total, within trial period | 245,551 | 242,019 | 182,516 |
Total, after trial period | 20,597 | 20,963 | 8,314 |
LY = life-year; QALY = quality-adjusted life-year.
Note: Chemotherapy was assumed by the sponsor to comprise CAPOX or 5-fluorouracil and cisplatin (CISPFU) for the pembrolizumab plus chemotherapy and chemotherapy only arms and CAPOX or leucovorin, 5-fluorouracil and oxaliplatin (FOLFOX) for the nivolumab plus chemotherapy arm.
Scenario Analyses
Table 11: Summary of the CDA-AMC Scenario Analyses
Scenario analysis | Drug | Total costs ($) | Total QALYs | ICER ($/QALY) |
|---|---|---|---|---|
CDA-AMC base case | Chemotherapy | 190,830 | 1.16 | Reference |
Nivolumab plus chemotherapy | 262,981 | 1.65 | 72,151 | |
Pembrolizumab plus chemotherapy | 266,148 | 1.65 | Dominated | |
Scenario 1: Extending treatment cycles for pembrolizumab and nivolumab to 52 cycles (156 weeks) from 104 (35 cycles) | Chemotherapy | 190,543 | 1.16 | Reference |
Nivolumab plus chemotherapy | 265,047 | 1.65 | 155,279 | |
Pembrolizumab plus chemotherapy | 268,638 | 1.64 | Dominated | |
Scenario 2: Per-cycle disutility and cost from adverse events applied changed from one-off assumption | Chemotherapy | 189,233 | 1.16 | Reference |
Nivolumab plus chemotherapy | 260,449 | 1.65 | 149,408 | |
Pembrolizumab plus chemotherapy | 264,156 | 1.64 | Dominated | |
Scenario 3: fixed treatment cost instead of weight-based costs and utilization | Chemotherapy | 190,543 | 1.16 | Reference |
Nivolumab plus chemotherapy | 277,573 | 1.65 | 182,035 | |
Pembrolizumab plus chemotherapy | 303,996 | 1.64 | Dominated |
ICER = incremental cost-effectiveness ratio; QALY = quality-adjusted life-year; RDI = relative dose intensity.
Note: Chemotherapy was assumed by the sponsor to comprise CAPOX or 5-fluorouracil and cisplatin (CISPFU) for the pembrolizumab plus chemotherapy and chemotherapy only arms and CAPOX or leucovorin, 5-fluorouracil and oxaliplatin (FOLFOX) for the nivolumab plus chemotherapy arm.
Appendix 5: Submitted BIA and CDA-AMC Appraisal
Please note that this appendix has not been copy-edited.
Table 12: Summary of Key Take Aways
Key take aways of the budget impact analysis |
|---|
|
Summary of Sponsor’s Budget Impact Analysis
The sponsor submitted a budget impact analysis (BIA) assessing the expected budgetary impact of the introduction of pembrolizumab, in combination with fluoropyrimidine- and platinum-containing chemotherapy for the first-line treatment of adult patients with locally advanced unresectable or metastatic HER2-negative gastric or gastroesophageal junction (GEJ) adenocarcinoma.29 The BIA was undertaken from the perspective of the pan-Canadian public drug plans over a 3-year time horizon (2025 to 2027).
The sponsor estimated the size of the eligible population using an epidemiologic approach, with data obtained from publications, previous CDA-AMC submissions, and assumptions informed by expert opinion.30-34 The sponsor assumed that 5% of patients will be enrolled in clinical trials and that pembrolizumab will not capture any market share from clinical trials. The sponsor assumed an average patient weight of 65.5 kg and a mean body surface area of 1.70 m2 in the calculation of drug costs, as reported in the KEYNOTE-859 trial.4 Drug acquisition costs for pembrolizumab and comparators were adjusted by relative dose intensity (RDI) as observed in KEYNOTE-859, CHECKMATE 649, and literature.4,35,36 The sponsor adopted weight-based dosing for pembrolizumab (2 mg/kg every 3 weeks) and nivolumab (3 mg/kg every 2 weeks or 4.5 mg/kg evert 3 weeks). The sponsor modelled treatment duration based on time-on-treatment data from the KEYNOTE-859 trial.4 The sponsor assumed that the duration of nivolumab therapy would be the same as pembrolizumab. The sponsor adopted a coverage rate of 73.4% for oral treatments. Costs associated with subsequent treatment were not included as a simplifying approach. Dosing was obtained from Cancer Care Ontario Drug formulary.37 Drug prices for comparators were obtained from previous CDA-AMC reviews and Ontario Drug Benefit Formulary.32,38,39 Key inputs to the BIA are documented in Table 13.
Figure 2: Sponsor’s Estimation of the Size of the Eligible Population
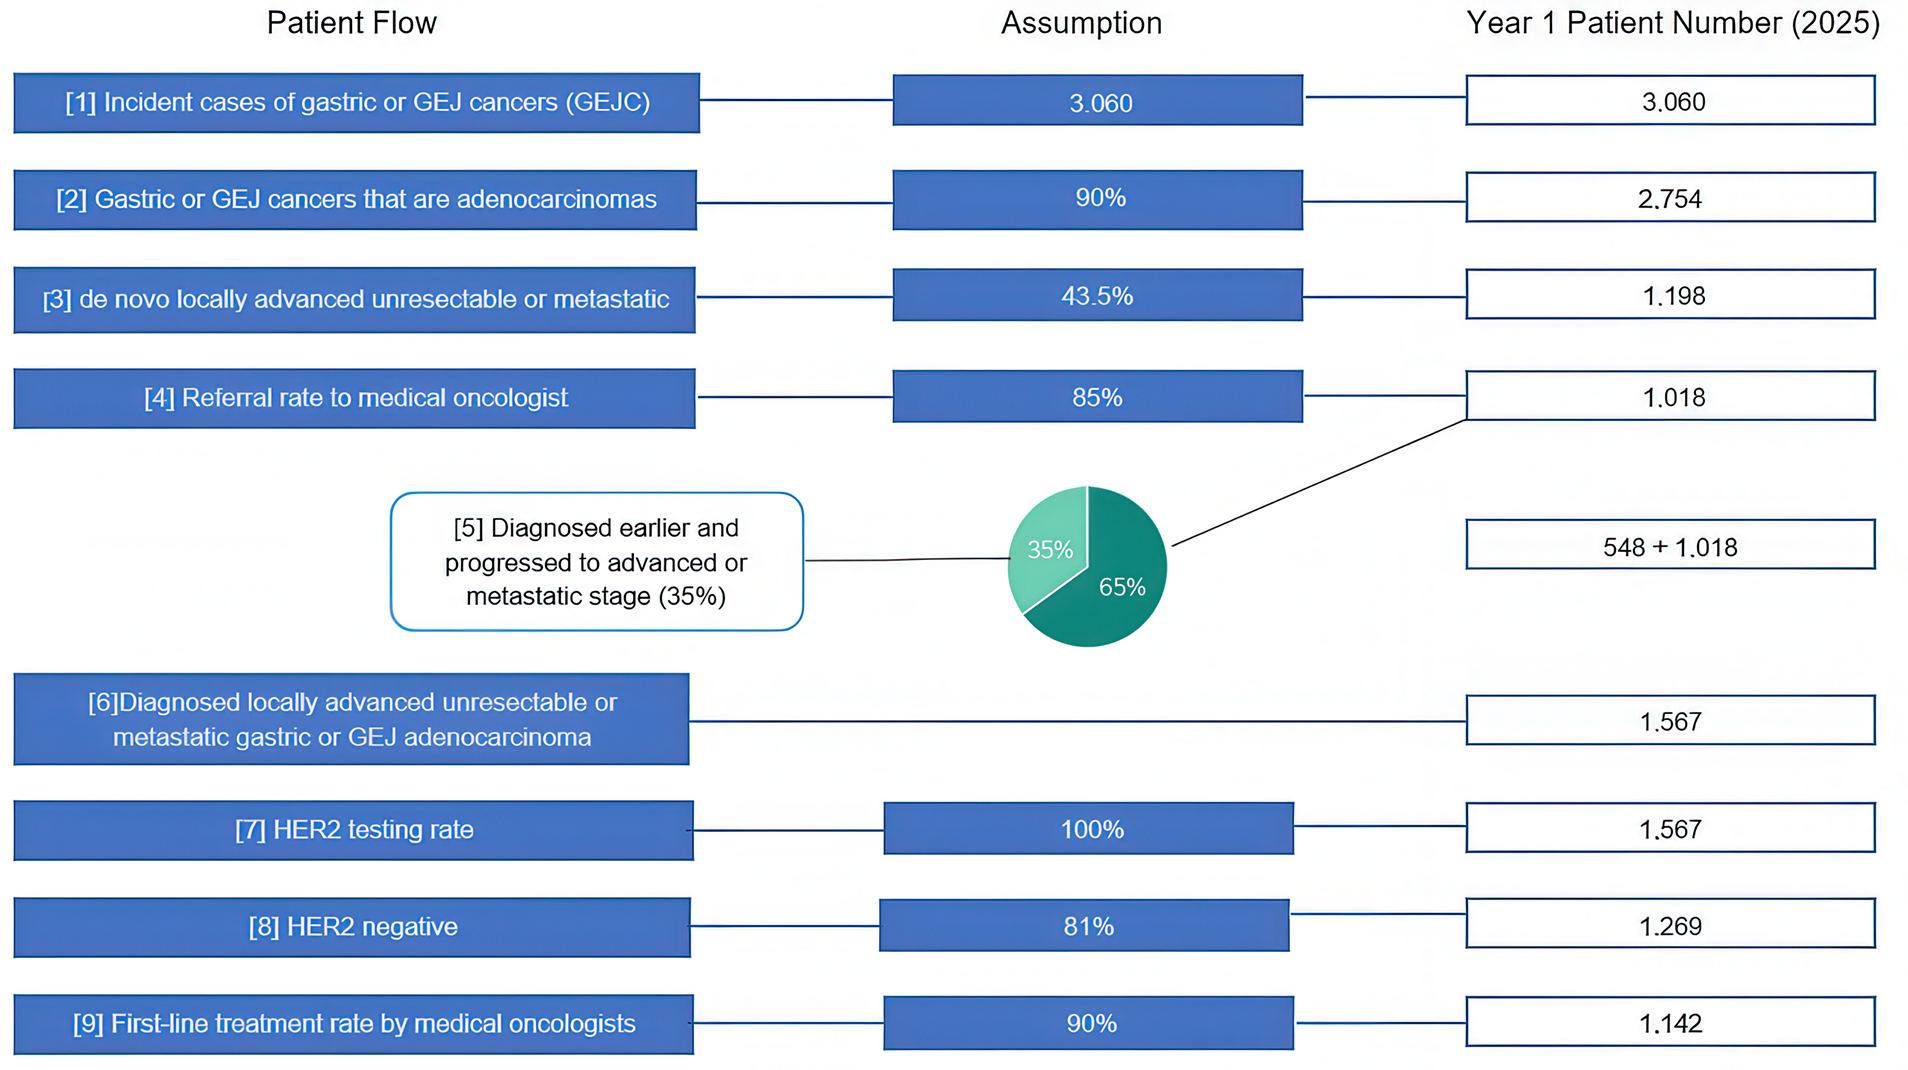
GEJ = gastroesophageal junction; HER2 = human epidermal growth factor receptor 2.
Source: Sponsor’s pharmacoeconomic submission.29
Table 13: Summary of Key Model Parameters
Parameter | Sponsor’s estimate (reported as year 1 / year 2 / year 3 if appropriate) |
|---|---|
Target population | |
Incident cases of gastric or GEJ cancers | 3,060 / 3,060 / 3,060 |
Gastric or GEJ cancers that are adenocarcinomas | 90% |
De novo locally advanced unresectable or metastatic | 43.5% |
Proportion of patients referred to a medical oncologist | 85% |
Proportion diagnosed earlier that progressed to advanced or metastatic stage | 35% |
HER2 testing rate | 100% |
Proportion HER2-negative | 81% |
Proportion treated by medical oncologists | 90% |
Number of patients eligible for drug under review | 1,142 / 1,142 / 1,142 |
Market Uptake (3 years) | |
Uptake (reference scenario) Nivolumab plus chemotherapy Chemotherapy Clinical trials | 65% / 65% / 65% 30% / 30% / 30% 5% / 5% / 5% |
Uptake (new drug scenario) Pembrolizumab plus chemotherapy Nivolumab plus chemotherapy Chemotherapy Clinical trials | 11% / 30% / 33% 54% / 35% / 33% 30% / 30% / 30% 5% / 5% / 5% |
Cost of treatment (per patient, per cycle) | |
Pembrolizumab Nivolumab CAPOX CISPFU CAPECISP FOLFOX | $5,493.09 $4,550.78 $248.50 $565.16 $412.21 $1,060.35 |
CAPECISP = Cisplatin-capecitabine; CAPOX = Oxaliplatin-capecitabine; CISPFU = Cisplatin-5-Fluorouracil; FOLFOX = Folinic Acid (Leucovorin)-Fluorouracil-Oxaliplatin; GEJ = gastroesophageal junction; HER2 = human epidermal growth factor receptor 2.
Note: Total cost of treatment was adjusted in the sponsor submission by relative dose intensity based on the KEYNOTE-859 trial.4
Summary of the Sponsor’s BIA Results
The sponsor estimated the 3-year budget impact of reimbursing pembrolizumab, in combination with platinum and fluoropyrimidine based chemotherapy for the first-line treatment of adult patients with locally advanced unresectable or metastatic HER2-negative gastric or GEJ adenocarcinoma to produce cost savings of $2,210,652 (year 1: $225,808; year 2: $890,603; year 3: $1,094,242).
CDA-AMC Appraisal of the Sponsor’s BIA
CDA-AMC identified several key limitations to the sponsor’s analysis that have notable implications on the results of the BIA:
Unit price of oxaliplatin was outdated: The sponsor obtained unit prices of oxaliplatin using previous CDA-AMC review of nivolumab dated 2022 and does not reflect current publicly available prices.
CDA-AMC corrected sponsor’s base case uses an updated wholesale unit price of oxaliplatin from the IQVIA Delta PA database.
Use of RDI to estimate actual drug costs was inappropriate: The sponsor’s base-case analysis incorporated relative dose intensities for pembrolizumab, nivolumab, and platinum and fluoropyrimidine based chemotherapy using data from the KEYNOTE-859 trial.4 The consideration of RDI is problematic because the drug dose received by a patient may differ from the full planned dose due to several reasons such dose delays, missed doses and dose reduction. Each of these factors have differing impacts on drug costs, which were not adequately captured in the sponsor’s RDI estimates.
In the CDA-AMC reanalysis, 100% RDI was adopted for pembrolizumab and comparators.
The distribution of chemotherapy regimens was not aligned with Canadian clinical practice: In the BIA, the sponsor assumed that 86.3% of patients would receive CAPOX and 13.7% would receive CISPFU as the chemotherapy backbone, based on treatments received in KEYNOTE-859. Feedback from clinical experts consulted by CDA-AMC for this review indicated that the sponsor’s estimates do not reflect clinical practice where most patients with the indication of interest receive FOLFOX. The clinical experts also noted that the proportion of patients receiving CAPOX may have been overestimated.
In the CDA-AMC reanalysis, 60% of patients were assumed to receive FOLFOX and 40% were assumed to receive CAPOX based on expert opinion.
Dosing frequency of pembrolizumab and nivolumab was not aligned with the backbone chemotherapy: The sponsor assumed that all patients on pembrolizumab receive 2 mg/kg every 3 weeks. In comparison, the sponsor assumed that 51% of patients on nivolumab receive 3 mg/kg of nivolumab every 2 weeks and 49% receive 4.5 mg/kg of nivolumab every 3 weeks. The sponsor’s assumptions underestimate the treatment cost of pembrolizumab and overestimate the treatment cost of the comparator, nivolumab. Consequently, the results of the BIA are skewed in favour of pembrolizumab. Clinical experts consulted for this review noted that the patients on FOLFOX regimen are likely to receive pembrolizumab dose every 6 weeks and nivolumab dose every 2 weeks because these dose frequencies facilitate the administration of backbone chemotherapy with pembrolizumab or nivolumab dose during the same visit.
In the CDA-AMC reanalysis, 60% of patients receive pembrolizumab 4 mg/kg every 6 weeks and 40% receive nivolumab 4.5 mg/kg of nivolumab every 3 weeks based on feedback from clinical experts.
Market share of comparators does not reflect clinical practice: The sponsor assumed that the market share is 65% for nivolumab plus chemotherapy and 30% for chemotherapy, however, the sponsor’s market share assumptions were not supported with evidence. The clinical experts consulted for this review noted that the market share of nivolumab may have been underestimated and the proportion of patients receiving chemotherapy is lower than the sponsor’s estimate. The sponsor also assumed that 5% of patients eligible for pembrolizumab plus chemotherapy would receive medications through the clinical trial and thus, do not result in any treatment or drug costs to the public drug plans. The inclusion of clinical trials as a comparator in the sponsor’s BIA was inappropriate, as these patients are not receiving approved therapies for the treatment, and this artificially decreases the estimated market size. Further, the inclusion of clinical trials as a comparator does not align with the sponsor’s submitted economic evaluation of pembrolizumab plus chemotherapy, which did not consider investigative clinical trials as a comparator.
In the CDA-AMC base case, the market share of chemotherapy was decreased to 15% and the proportion of patients assigned to clinical trials were instead proportionally allocated to comparators in the reference scenario.
The number of patients eligible to receive pembrolizumab is uncertain: The sponsor made several assumptions in estimating the number of eligible patients and some of these assumptions did not meet face validity. The sponsor assumed a growth rate of 0%, indicating that the number of new gastric and GEJ cancer cases remain constant over time. The sponsor’s assumption failed to meet face validity during consultations with the clinical experts, who noted that this assumption may have underestimated the number of new gastric and GEJ cancer cases.
The sponsor also assumed that approximately 85% of diagnosed patients are referred to a medical oncologist and 90% of patients with HER2-negative status receive first-line treatment, based on clinical expert input obtained in a previous CDA-AMC review.33 The clinical expert consulted for this review found these estimates to be uncertain. It was noted that the proportion of patients in Canada who would be referred to a medical oncologist is likely higher than 85% and the proportion of HER2-negative patients receiving first-line treatment may have been overestimated.
CDA-AMC explored the impact of uncertainty around input parameters by assuming 90% of patients are referred to a medical oncologist and 80% of HER2-negative patients receive first-line treatment in scenario analysis.
Submitted BIA model lacked transparency: The sponsor’s submitted BIA model was overly complex, which made validating the sponsor’s methodology and assumptions challenging. For example, the model tracked incident (new) cases on a weekly basis, but it was unclear whether patients who survived the first year of treatment continued treatment into the second year. This ambiguity hindered the ability to validate that the maximum duration of pembrolizumab or nivolumab therapy was 2 years for patients starting in year 1 and aligned with recommendations in respective product monographs. The lack of transparency about duration of therapy is expected to have minimal impact on the estimated budget impact because the sponsor assumed equal treatment durations for pembrolizumab and nivolumab in this review.
CDA-AMC could not address this limitation.
CDA-AMC Reanalyses of the BIA
CDA-AMC corrected the sponsor’s base case by updating the unit price of oxaliplatin. CDA-AMC revised the sponsor’s submitted analyses by assuming RDI of 100%, aligning the distribution of chemotherapy backbones with clinical practice, revising the percentage of patients on pembrolizumab and nivolumab dosages and market share of comparators based on feedback from clinical experts (Table 14).
Table 14: CDA-AMC Revisions to the Submitted BIA
Stepped analysis | Sponsor’s value or assumption | CDA-AMC value or assumption |
|---|---|---|
Corrections to sponsor’s base case | ||
1. Unit price of oxaliplatin | 50 mg/unit: $36.2700 | 50 mg/unit: $45.0000 |
Changes to derive the CDA-AMC base case | ||
1. RDI | < 100% (varied by drug) | 100% for all drugs |
2. Percentage use of chemotherapy regimens | CAPOX: 86.3% CISPFU: 13.7% CAPECISP: 0% FOLFOX: 0% | CAPOX: 40% CISPFU: 0% CAPECISP: 0% FOLFOX: 60% |
3. Dosing frequency of pembrolizumab and nivolumab | Pembrolizumab 4 mg/kg Q6W: 0% Nivolumab 4.5 mg/kg Q3W: 49% | Pembrolizumab 4 mg/kg Q6W: 60% Nivolumab 4.5 mg/kg Q3W: 40% |
4. Market share of comparators | Nivolumab plus chemotherapy: 65% / 65% / 65% Chemotherapy: 30% / 30% / 30% Clinical Trials: 5% / 5% / 5% | Nivolumab plus chemotherapy: 84% / 84% / 84% Chemotherapy: 16% / 16% / 16% Clinical Trials: 0% / 0% / 0% |
CDA-AMC base case | CDA-AMC reanalysis 1 + 2 + 3 + 4 | |
CAPECISP = Cisplatin-capecitabine; CAPOX = Oxaliplatin-capecitabine; CISPFU = Cisplatin-5-Fluorouracil; FOLFOX = Folinic Acid (Leucovorin)-Fluorouracil-Oxaliplatin; RDI = relative dose intensity.
The results of the CDA-AMC stepwise reanalysis are presented in summary format in Table 15 and a more detailed breakdown is presented in Table 16.
Based on the CDA-AMC base case, the budget impact associated with the reimbursement of pembrolizumab in combination with fluoropyrimidine- and platinum-containing chemotherapy for the first-line treatment of adult patients with locally advanced unresectable or metastatic HER2-negative gastric or GEJ adenocarcinoma is expected to be $324,871 in year 1, $847,679 in year 2, $935,765 in year 3, for a three-year total budgetary impact of $2,108,315.
Table 15: Summary of the CDA-AMC Reanalyses of the BIA
Stepped analysis | Three-year total ($) |
|---|---|
Submitted base case | −2,210,652 |
Submitted base case, corrected | −2,230,195 |
CDA-AMC reanalysis 1 | −2,645,089 |
CDA-AMC reanalysis 2 | 485,591 |
CDA-AMC reanalysis 3 | −738,768 |
CDA-AMC reanalysis 4 | −2,230,195 |
CDA-AMC base case | 2,108,315 |
BIA = budget impact analysis.
CDA-AMC conducted the following scenario analysis to address remaining uncertainty, using the CDA-AMC base case (results are provided in Table 16:
Increasing the proportion of patients diagnosed with locally advanced unresectable or metastatic GEJ cancer who are referred to a medical oncologist (to 90%) and decreasing the proportion of patients with locally advanced unresectable or metastatic HER2-negative gastric or GEJ adenocarcinoma who would receive first-line treatment (to 80%).
Table 16: Detailed Breakdown of the CDA-AMC Reanalyses of the BIA
Stepped analysis | Scenario | Year 0 (current situation) ($) | Year 1 ($) | Year 2 ($) | Year 3 ($) | Three-year total ($) |
|---|---|---|---|---|---|---|
Submitted base case | Reference | 28,697,877 | 52,512,936 | 56,892,865 | 56,901,241 | 166,307,042 |
New drug | 28,697,877 | 52,287,129 | 56,002,262 | 55,807,000 | 164,096,390 | |
Budget impact | 0 | −225,808 | −890,603 | −1,094,242 | −2,210,652 | |
Submitted base case, corrected | Reference | 28,877,067 | 52,753,695 | 57,134,126 | 57,142,503 | 167,030,324 |
New drug | 28,877,067 | 52,525,987 | 56,235,756 | 56,038,386 | 164,800,129 | |
Budget impact | 0 | −227,708 | −898,370 | −1,104,117 | −2,230,195 | |
CDA-AMC base case | Reference | 40,153,523 | 72,751,790 | 78,690,484 | 78,701,486 | 230,143,759 |
New drug | 40,153,523 | 73,076,661 | 79,538,163 | 79,637,250 | 232,252,074 | |
Budget impact | 0 | 324,871 | 847,679 | 935,765 | 2,108,315 | |
CDA-AMC scenario analysis 1: revising target population proportions | Reference | 37,791,551 | 68,472,273 | 74,061,632 | 74,071,986 | 216,605,891 |
New drug | 37,791,551 | 68,778,034 | 74,859,447 | 74,952,706 | 218,590,187 | |
Budget impact | 0 | 305,761 | 797,816 | 880,720 | 1,984,296 |
BIA = budget impact analysis.
ISSN: 2563-6596
Canada’s Drug Agency (CDA-AMC) is a pan-Canadian health organization. Created and funded by Canada’s federal, provincial, and territorial governments, we’re responsible for driving better coordination, alignment, and public value within Canada’s drug and health technology landscape. We provide Canada’s health system leaders with independent evidence and advice so they can make informed drug, health technology, and health system decisions, and we collaborate with national and international partners to enhance our collective impact.
Disclaimer: CDA-AMC has taken care to ensure that the information in this document was accurate, complete, and up to date when it was published, but does not make any guarantee to that effect. Your use of this information is subject to this disclaimer and the Terms of Use at cda-amc.ca.
The information in this document is made available for informational and educational purposes only and should not be used as a substitute for professional medical advice, the application of clinical judgment in respect of the care of a particular patient, or other professional judgments in any decision-making process. You assume full responsibility for the use of the information and rely on it at your own risk.
CDA-AMC does not endorse any information, drugs, therapies, treatments, products, processes, or services. The views and opinions of third parties published in this document do not necessarily reflect those of CDA-AMC. The copyright and other intellectual property rights in this document are owned by the Canadian Agency for Drugs and Technologies in Health (operating as CDA-AMC) and its licensors.
Questions or requests for information about this report can be directed to Requests@CDA-AMC.ca.