Drugs, Health Technologies, Health Systems
Reimbursement Review
Pembrolizumab (Keytruda)
Sponsor: Merck Canada Inc.
Therapeutic area: Gastric or gastroesophageal junction adenocarcinoma
This multi-part report includes:
Clinical_Review
Pharmacoeconomic_Review
Clinical_Review
Abbreviations
5-FU
fluorouracil
AE
adverse event
BICR
blinded independent central review
CAPOX
capecitabine and oxaliplatin
CCO
Cancer Care Ontario
CDA-AMC
Canada’s Drug Agency
CEA
carcinoembryonic antigen
CI
confidence interval
CISPFU
cisplatin and 5-fluorouracil
CPS
combined positive score
EORTC QLQ-C30
European Organisation for Research and Treatment of Cancer Quality of Life Questionnaire Core 30
EORTC QLQ-STO22
European Organisation for Research and Treatment of Cancer Quality of Life Questionnaire Stomach Cancer Module
EQ-5D-5L
5-Level EQ-5D
ESMO
European Society for Medical Oncology
FISH
fluorescence in situ hybridization
FOLFIRI
leucovorin calcium (folinic acid), fluorouracil, and irinotecan hydrochloride
FOLFOX
leucovorin calcium (folinic acid), fluorouracil, and oxaliplatin
GEJ
gastroesophageal junction
GI
gastrointestinal
GI DAC
Gastrointestinal Drug Advisory Committee
GRADE
Grading of Recommendations Assessment, Development, and Evaluation
HR
hazard ratio
HRQoL
health-related quality of life
IA
interim analysis
IHC
immunohistochemistry
IQR
interquartile range
MID
minimally important difference
MMR
mismatch repair
MSI
microsatellite instability
NCCN
National Comprehensive Cancer Network
NR
not reported
OH-CCO
Ontario Health–Cancer Care Ontario
ORR
overall response rate
OS
overall survival
PD-1
programmed cell death 1 protein
PD-L1
programmed cell death 1 ligand 1
PFS
progression-free survival
QoL
quality of life
RCT
randomized controlled trial
RECIST 1.1
Response Evaluation Criteria in Solid Tumours Version 1.1
SAE
serious adverse event
SD
standard deviation
SOC
standard of care
Executive Summary
An overview of the submission details for the drug under review is provided in Table 1.
Table 1: Background Information of Application Submitted for Review
Item | Description |
|---|---|
Drug product | Pembrolizumab (Keytruda), 100 mg/4 mL vial, solution for infusion |
Sponsor | Merck Canada Inc. |
Indication | Pembrolizumab, in combination with trastuzumab, fluoropyrimidine- and platinum-containing chemotherapy, is indicated for the first-line treatment of adult patients with locally advanced unresectable or metastatic HER2-positive gastric or GEJ adenocarcinoma, whose tumours express PD-L1 (CPS ≥ 1), as determined by a validated test. |
Reimbursement request | As per indication |
Health Canada approval status | NOC |
Health Canada review pathway | Standard review |
NOC date | February 6, 2024 |
Recommended dose | Recommended dose and dosage adjustments for notable subpopulations per the product monograph |
CPS = combined positive score; GEJ = gastroesophageal junction; NOC = Notice of Compliance; PD-L1 = programmed cell death 1 ligand 1.
Introduction
Gastric cancer is a growth of abnormal cells that starts in the stomach. In 2023, an estimated 4,100 Canadians were projected to be diagnosed with gastric cancer.1,2 Gastric cancers are generally classified into 2 topographical subsites. Cardia gastric cancers include the upper part of the stomach adjoining the esophagus. Noncardia gastric cancers occur in the more distal regions of the stomach.3 Gastroesophageal junction (GEJ) cancer develops in the area where the esophagus meets the gastric cardia.4 The risk of developing gastric or GEJ cancer increases with age, is greatest after 50 years of age,5 and occurs more frequently among men than women.1,2,5 Approximately 90% of noncardia cancers are attributable to Helicobacter pylori infection.6 Early-stage gastric and GEJ cancers are potentially curable. However, most patients present with symptoms that are usually nonspecific.7 As a result, the early diagnosis of gastric and GEJ cancers is a challenge.7 Instead, most patients have advanced-stage III or stage IV disease at the time of diagnosis, when curative treatments are not possible.7,8 Patients with unresectable advanced or metastatic disease typically experience a high symptom burden, impaired quality of life (QoL), and frequent bouts of anxiety and depression.9 The 5-year survival rate for patients diagnosed with gastric or GEJ cancer living in Canada is 29%, reflecting that the majority of patients are diagnosed with advanced-stage disease that is associated with a poor prognosis.1,2,10 Among those with metastatic gastric or GEJ cancer, the 5-year survival rate is 6.6%.11
Approximately 90% to 95% of gastric and GEJ cancers are histologically classified as adenocarcinoma.12 Gastric cancers may contain oncogenic driver mutations that lead to uncontrolled cell growth and proliferation. The most common driver mutation is human epidermal growth factor receptor 2 (HER2). HER2 is overexpressed or amplified in 25% to 32% of patients with GEJ and between 9.5% and 18% of patients with gastric cancers.7,13-24 HER2 overexpression in patients with gastric cancer is associated with poor outcomes and more aggressive disease.25 In clinical practice, both HER2 status and programmed cell death 1 ligand 1 (PD-L1) expression testing are done on a biopsy sample taken from the primary tumour or from metastases. HER2 status can be determined with immunohistochemistry (IHC), which measures the amount of HER2 protein in the cancer cells; or with fluorescence in situ hybridization (FISH), which examines the number of copies of the HER2 gene in cancer cells. PD-L1 expression can be determined using a semiquantitative IHC approach.
In patients with HER2-positive disease, the addition of trastuzumab to the standard first-line platinum and fluoropyrimidine doublet is recommended for all patients based on the results from the phase III ToGA trial, which demonstrated improvements in response rates, progression-free survival (PFS), and overall survival (OS) with trastuzumab compared with chemotherapy alone.13,16-18,26,27 This regimen is supported by the National Institute for Health and Care Excellence (NICE),28 the European Society for Medical Oncology (ESMO),26 the National Comprehensive Cancer Network (NCCN),13 Cancer Care Ontario (CCO),29 and Alberta Health Services.17 In October 2023, ESMO recommended adding pembrolizumab to the trastuzumab plus chemotherapy standard of care (SOC) for patients with positive PD-L1 expression, defined as a combined positive score (CPS) of 1 or more, based on the results of the KEYNOTE-811 clinical trial.30
Pembrolizumab is a high-affinity antibody against programmed cell death 1 protein (PD-1) which exerts dual ligand blockade of the PD-1 pathway, including PD-L1 and programmed cell death 1 ligand 2 (PD-L2), on antigen-presenting or tumour cells. Pembrolizumab reactivates tumour-specific cytotoxic T lymphocytes in the tumour microenvironment by inhibiting the PD-1 receptor from binding to its ligands.31 Pembrolizumab received a Notice of Compliance on February 6, 2024, through the standard review pathway. The Health Canada indication for pembrolizumab, in combination with trastuzumab, fluoropyrimidine- and platinum-containing chemotherapy, is for the first-line treatment of adult patients with locally advanced, unresectable or metastatic HER2-positive gastric or GEJ adenocarcinoma, whose tumours express PD-L1 (CPS ≥ 1), as determined by a validated test.
The product monograph recommends a dosage of pembrolizumab for locally advanced, unresectable or metastatic HER2-positive gastric or GEJ adenocarcinoma in combination with trastuzumab, fluorouracil- and platinum-containing chemotherapy in adults of 200 mg every 3 weeks or 400 mg every 6 weeks by IV infusion until disease progression, unacceptable toxicity, or for up to 24 months.31 The product monograph specifies that pembrolizumab should be administered before trastuzumab and chemotherapy when given on the same day.31
The objective of this Clinical Review Report is to review and critically appraise the clinical evidence submitted by the sponsor on the beneficial and harmful effects of pembrolizumab 100 mg/4 mL solution for infusion in combination with trastuzumab, fluoropyrimidine and platinum-containing chemotherapy in the first-line treatment of locally advanced, unresectable or metastatic HER2-positive gastric or GEJ adenocarcinoma in adult patients whose tumours express PD-L1 (CPS ≥ 1), as determined by a validated test.
Stakeholder Perspectives
The information in this section is a summary of input provided by the patient and clinician groups that responded to our call for input and from clinical experts consulted by Canada’s Drug Agency (CDA-AMC) for the purpose of this review.
Patient Input
Patient group input was submitted by 1 patient advocacy group, My Gut Feeling – Stomach Cancer Foundation of Canada, and included input collected from an international online survey conducted between November 10 and November 24, 2023. The survey received responses from 40 patients (77.5%) and caregivers (22.5%). Of those who responded, 72.5% were from Canada and 15.5% had HER2-positive disease. All patients who responded to the survey experienced at least 1 symptom before diagnosis, with most common being weight loss (57.5%), reflux (55%), change in appetite (50%), pain (47.5%), nausea and/or vomiting (37.5%), and difficulty swallowing (25%). Most patients (95%) reported that their cancer diagnosis had a significant impact on their QoL, physical and mental health, ability to eat and work, finances, social life, identity, and personal image. Psychosocial impacts such as anxiety, depression, sleep loss, feeling crippled, anticipatory grief, and loss of control were cited by 1 patient. Caregivers and family members who responded to the survey also reported being impacted by the cancer diagnosis, which included feeling hopeless (especially with metastatic disease), stress from the impact of chemotherapy-induced side effects that caused stress to other family members, and changes to family dynamics that led to children needing counselling. Other disease-related and treatment-related concerns reported by both patients and caregivers included loss of fertility, feeling isolated, financial difficulty, as well as financial and geographical barriers to accessing treatment, health care providers, and information. All patients who completed the survey experienced at least 1 side effect. The most commonly reported treatment-related side effects included fatigue (87.5%), appetite changes (77.5%), alopecia (75%), taste changes (75%), weight loss (70%), and neuropathy (70%). Approximately 16% of patients reported discontinuing treatment because of an adverse event (AE) that resulted in hospitalization. Patients and caregivers who completed the survey indicated that the following outcomes were important when considering new treatments: improved survival, remission, shrinking of the cancer, improved symptoms, tolerability, and improved QoL. Patients and caregivers also added that equitable access, convenience of administration (e.g., oral versus IV, less frequent travel to hospital, shorter chair time when receiving treatment), more options from which to choose based on their values and preferences were important. Finally, survey responders from Canada emphasized that biomarker testing should be accessible at the onset of their disease in all centres and all provinces.
Clinician Input
Input From Clinical Experts
The clinical experts we consulted for the purpose of this review emphasized that locally advanced and metastatic HER2-positive gastroesophageal cancer is a disease associated with a considerable unmet need. The clinical experts advised that although treatment with trastuzumab combined with chemotherapy is available for patients with locally advanced, metastatic HER2-positive gastroesophageal cancer, OS outcomes remain unacceptably poor. Both clinical experts suggested that, per the KEYNOTE-811 clinical trial, pembrolizumab would be added to the current SOC first-line therapy (trastuzumab combined with platinum doublet chemotherapy) for patients with locally advanced and metastatic HER2-positive gastroesophageal cancer. This combination — pembrolizumab plus trastuzumab and platinum doublet chemotherapy — would represent a new first-line SOC treatment in this patient population. Although patients were eligible to enrol in the KEYNOTE-811 trial regardless of PD-L1 status, as measured by CPS, the prespecified subgroup analysis showed that the benefit of adding pembrolizumab to SOC was attributable to the subgroup of patients with a PD-L1 CPS of 1 or more (85% of the study population). A clear benefit was not observed in the subgroup of patients with a PD-L1 CPS of less than 1, which included a small number of patients. The clinical experts we consulted opined that the addition of pembrolizumab to first-line treatment for locally advanced and metastatic HER2-positive gastroesophageal cancer should be limited to patients with a PD-L1 CPS of 1 or more. As suggested by the clinical experts, CPS testing should be performed using a validated test. The clinical experts listed 3 factors, in descending order of clinical importance, used to determine response to treatment: patient-reported symptoms and side effects; cross-sectional imaging (CT scans or MRI); and tumour markers, such as carcinoembryonic antigen (CEA) and carbohydrate antigen 19-9 (CA 19-9). The clinical experts emphasized, however, that the only truly clinically meaningful end points across all oncology types are OS and QoL. The clinical experts added that all other end points (e.g., response rate, CEA response, PFS) should be considered surrogates and are of little relevance if they do not predict improved OS or QoL. The clinical experts suggested that patients should be assessed by a clinician after every 2 to 3 cycles of treatment, patients should undergo CT scans every 2 to 3 months, and tumour markers should be assessed at least once every 4 weeks. They also suggested that the decision to discontinue treatment with pembrolizumab should be based on patient-reported symptoms, side effects, and well-being, in combination with assessments of treatment response and disease progression, either radiologic or clinical. The clinical experts added that treatment with pembrolizumab should be discontinued in the event of a life-threatening immune-related AEs, in accordance with clinical practice guidelines.32 They also suggested that pembrolizumab should only be prescribed by or under the supervision of a specialist in medical oncology with expertise in the management of immunotherapy side effects. The clinical experts noted that immunotherapy and trastuzumab are currently delivered as SOC in all oncology centres and can be safely administered in all centres approved for oncology care.
Clinician Group Input
Clinician group input was submitted by 2 clinician groups – the Canadian Gastrointestinal Oncology Evidence Network (CGOEN) and Ontario Health — Cancer Care Ontario (OH-CCO) Gastrointestinal Drug Advisory Committee (GI DAC). Input provided by the CGOEN and the OH-CCO GI DAC collated insights from 8 and 2 clinicians, respectively. The clinical groups noted that the are currently limited treatment options for patients with HER2-positive gastric or GEJ cancers, with poor outcomes. A clinician from CGOEN noted that the treatment of HER2-positive gastric cancer has not improved in more than a decade and that immunotherapy is currently only available to patients who have HER2-negative disease. Based on the input from the OH-CCO GI DAC, prolonging OS is the main treatment goal in this patient population. According to input from the CGOEN, patients best suited for treatment with pembrolizumab are those with a PD-L1 CPS of 1 or more, as determined by a validated test. According to input from the CGOEN, response to treatment should be based on routine imaging (during timed intervals for objective assessment), as well as patient preference, tolerability, and QoL. Both clinician groups suggested that patients should be evaluated on a regular basis for clinical response and toxicity, per current treatment standards. Both clinician groups agreed that the decision to continue or discontinue treatment with pembrolizumab should be based on patient preference, side effects (including life-threatening immune-related AEs), radiologic or clinical disease progression or treatment response, and patient-reported symptoms and well-being. Although input from the CGOEN suggested that pembrolizumab should be administered in oncology centres, the clinical experts we consulted noted that pembrolizumab could be safely administered in a hospital or an outpatient clinic.
Drug Program Input
Input was obtained from the drug programs that participate in our reimbursement review process. The following were identified as key factors that could potentially impact the implementation of a CDA-AMC recommendation for pembrolizumab:
relevant comparators
considerations for initiation of therapy
considerations for discontinuation of therapy
considerations for prescribing therapy
generalizability
funding algorithm
care provision issues
system and economic issues.
Clinical Evidence
Systematic Review
Description of Studies
One study was included in the sponsor-conducted systematic review: KEYNOTE-811.
The KEYNOTE-811 trial is an ongoing, multicentre (92 sites in 19 countries), placebo-controlled, randomized (1:1 ratio), double-blind, phase III study evaluating the efficacy and safety of adding pembrolizumab (200 mg every 3 weeks) to SOC therapy with trastuzumab and platinum and fluoropyrimidine doublet chemotherapy as a first-line therapy for adult patients with HER2-positive advanced gastric or GEJ cancer. Patients were randomly allocated to receive either pembrolizumab (full study population: n = 350; PD-L1 CPS ≥ 1 subgroup: n = 298) or placebo (full study population, n = 348; PD-L1 CPS ≥ 1 subgroup, n = 296), each in combination with SOC therapy (trastuzumab in combination with cisplatin and 5-FU [CISPFU] or with capecitabine and oxaliplatin [CAPOX]). Randomization was stratified by geographic region (Australia, Europe, Israel, and North America versus Asia versus rest of the world), investigator’s choice of chemotherapy regimen (CISPFU versus CAPOX), and PD-L1 expression at baseline (CPS ≥ 1 versus < 1). HER2 status and PD-L1 expression were determined by FDA-approved assays,33,34 and were conducted at a central laboratory. The KEYNOTE-811 trial assessed PFS, per Response Evaluation Criteria in Solid Tumours Version 1.1 (RECIST 1.1) assessed by blinded independent central review (BICR), and OS as dual primary efficacy end points. Study success is defined as results that are statistically significant for at least 1 of the 2 primary end points. Secondary end points included overall response rate (ORR), duration of response (per RECIST 1.1), and harms. Exploratory end points included the following health-related quality of life (HRQoL) measures: the European Organisation for Research and Treatment of Cancer Quality of Life Questionnaire Core 30 (EORTC QLQ-C30), European Organisation for Research and Treatment of Cancer Quality of Life Questionnaire Stomach Cancer Module (EORTC QLQ-STO22), and the 5-Level EQ-5D (EQ-5D-5L).
The KEYNOTE-811 trial met the protocol-defined criterion of success (1-sided alpha-level testing of 0.0013) at the second interim analysis (IA2; data cut-off date: May 25, 2022), in which the stratified hazard ratio (HR) for PFS was 0.72 (95% confidence interval [CI], 0.60 to 0.87; P = 0.0002) in favour of pembrolizumab plus SOC (median, 10.0 months; 95% CI, 8.6 to 11.7 months) versus placebo plus SOC (median, 8.1 months; 95% CI, 7.0 to 8.5 months). In the prespecified subgroup analysis, the treatment effect of pembrolizumab plus SOC on PFS, compared to placebo plus SOC, was attributable to the PD-L1 CPS of 1 or more in 1 subgroup, which made up 85.1% of the total population. A clear benefit was not observed in the subgroup of patients with a PD-L1 CPS of less than 1, which included relatively few patients (Appendix 1, Figure 5). Among patients with a PD-L1 CPS of 1 or more (hereafter referred to as the subgroup of patients with PD-L1–positive disease), PFS was statistically longer in the pembrolizumab plus SOC group than in placebo plus SOC group (HR, 0.70; 95% CI, 0.58 to 0.85). Based on analyses conducted at IA2, the sponsor proposed that the indication population be limited to the subgroup of patients with PD-L1–positive disease. Accordingly, this review of the KEYNOTE-811 trial will present data from both the full study population and the subgroup of patients with PD-L1–positive disease, per the Health Canada indication.
The mean age of all patients enrolled in the KEYNOTE-811 trial was 60.4 years (standard deviation [SD] = 11.8 years) and 61.7 years (SD = 10.8 years) in the pembrolizumab plus SOC and placebo plus SOC groups, respectively. PD-L1–positive disease was documented in 85.1% of patients in the combined pembrolizumab plus SOC and placebo plus SOC groups. Among patients in the KEYNOTE-811 trial who had PD-L1–positive disease, the mean age of patients randomized to the pembrolizumab plus SOC group was 60.6 years (SD = not reported [NR]) and the mean age in the placebo plus SOC group was 61.4 years (SD = NR). In terms of disease characteristics of the study participants with PD-L1–positive disease, 32.6% of patients in the pembrolizumab plus SOC group presented with adenocarcinoma of the GEJ and 67.4% presented with adenocarcinoma of the stomach; in the placebo plus SOC group, 33.4% and 66.6% of patients presented with adenocarcinoma of the GEJ and of the stomach, respectively.
Efficacy Results
Overall Survival
Full study population: The median duration of follow-up in the full study population at IA2 (data cut-off of May 25, 2022) was 16.1 months (range, 0.6 to 41.6 months) and 14.8 months (range, 0.3 to 41.2 months) in the pembrolizumab plus SOC and placebo plus SOC groups, respectively. The median duration of follow-up at the time of the third interim analysis (IA3; data cut-off of March 29, 2023) was 38.5 months (interquartile range [IQR], 29.8 to 44.4) for the overall population, 38.4 months (IQR, 29.5 to 44.4) for the pembrolizumab plus SOC group, and 38.6 months (IQR, 30.2 to 44.4) for the placebo plus SOC group.35
In the KEYNOTE-811 trial, the proportion of observed deaths at IA3 (March 29, 2023) was 70.0% and 73.6% in the pembrolizumab plus SOC and placebo plus SOC groups, respectively. The median OS was 20.0 months (95% CI, 17.8 to 22.1 months) in the pembrolizumab plus SOC group and 16.8 months (95% CI, 15.0 to 18.7 months) in the placebo plus SOC group. The stratified HR for OS was 0.84 (95% CI, 0.70 to 1.01; P = 0.0292) after treatment with pembrolizumab plus SOC compared with placebo plus SOC. The risk differences in OS in the full study population after treatment with pembrolizumab plus SOC, compared with placebo plus SOC, at months 12, 18, and 36 were ████ ████ ███ ████ ██ ███████ ████ ████ ███ ███ ██ ███████ ███ ████ ████ ███ ████ ██ ███████ respectively.
PD-L1–positive subgroup: The median duration of follow-up in the PD-L1–positive subgroup at IA2 was 17.0 months (range, 0.6 to 41.6) and 13.9 months (range, 0.3 to 41.2 months) in the pembrolizumab plus SOC and placebo plus SOC groups, respectively. The median duration of follow-up at IA3 was not reported for the PD-L1–positive subgroup.
Among patients in the PD-L1–positive subgroup, the proportion of observed deaths at IA3 (March 29, 2023) was 68.5% and 73.6% in the pembrolizumab plus SOC and placebo plus SOC groups, respectively. The median OS was 20.0 months (95% CI, 17.9 to 22.7 months) in the pembrolizumab plus SOC group and 15.7 months (95% CI, 13.5 to 18.5 months) in the placebo plus SOC group. The HR for OS was 0.81 (95% CI, 0.67 to 0.98; P = 0.0142) in favour of treatment with pembrolizumab plus SOC versus placebo plus SOC. The risk differences in OS in the PD-L1–positive subgroup after treatment with pembrolizumab plus SOC, compared with placebo plus SOC, at months 12, 18, and 36 were ████ ████ ███ ███ ██ ███████ █████ ████ ██ ███████ ███ ████ ████ ███ ████ ██ ███████ respectively.
Progression-Free Survival
Full study population: In the KEYNOTE-811 trial, the protocol-defined criterion of success was met at IA2, with 80% of the total events expected for the analysis (information fraction) having accrued (data cut-off date: May 25, 2022). The stratified HR for PFS was 0.72 (95% CI, 0.60 to 0.87; P = 0.0002; 1-sided superiority boundary was P = 0.0013) in favour of pembrolizumab plus SOC. The stratified HRs for PFS, based on BICR assessment from sensitivity analyses 1, 2, and 3 using alternative censoring rules, were 0.74 (95% CI, 0.62 to 0.88; P = 0.0003), 0.74 (95% CI, 0.62 to 0.87; P = 0.0001), and 0.73 (95% CI, 0.61 to 0.87; P = 0.0003), respectively.
Disease progression or death on or before the IA3 data cut-off date (March 29, 2023) was observed in 72.3% of patients in the pembrolizumab plus SOC group and in 75.0% of patients in the placebo plus SOC group. The median PFS in the pembrolizumab plus SOC and placebo plus SOC groups was 10.0 months (95% CI, 8.6 to 12.2 months) and 8.1 months (95% CI, 7.1 to 8.6 months), respectively. The stratified HR for disease progression or death was 0.73 (95% CI, 0.61 to 0.87; P = 0.0002) in favour of pembrolizumab plus SOC versus placebo plus SOC. The risk differences in PFS in the full study population after treatment with pembrolizumab plus SOC, compared with placebo plus SOC, at months 12, 18, and 36 were █████ ████ ███ ███ ██ ███████ ████ ████ ███ ███ ██ ███████ ███ ████ ████ ███ ███ ██ ███████ respectively.
PD-L1–positive subgroup: Among patients in the PD-L1–positive subgroup, disease progression or death on or before the IA3 data cut-off date (March 29, 2023) was observed in 72.8% of patients in the pembrolizumab plus SOC group and in 76.0% of patients in the placebo plus SOC group. The median PFS in the pembrolizumab plus SOC and placebo plus SOC groups was 10.9 months (95% CI, 8.5 to 12.5 months) and 7.3 months (95% CI, 6.8 to 8.5 months), respectively. The HR for disease progression or death was 0.71 (95% CI, 0.59 to 0.86; P = 0.0002) in favour of pembrolizumab plus SOC versus placebo plus SOC. The risk differences in PFS in the PD-L1–positive subgroup after treatment with pembrolizumab plus SOC, compared to placebo plus SOC, at months 12, 18, and 36 were █████ ████ ███ ███ ██ ███████ ████ ████ ███ ███ ██ ██████ ███ ████ ████ ███ ███ ██ ███████ respectively.
Health-Related Quality of Life
European Organisation for Research and Treatment of Cancer Quality of Life Questionnaire Core 30
EORTC QLQ-C30 is a cancer-specific HRQoL tool consisting of 30 items to assess 5 functional dimensions (physical function, role function, emotional function, cognitive function, and social function), 3 symptoms items (fatigue, nausea or vomiting, and pain), 5 single-item measures to assess additional symptoms commonly experienced by patients with cancer (dyspnea, loss of appetite, insomnia, constipation, and diarrhea), and 1 scale to assess global health status and global QoL.36,37 Based on input from the clinical experts we consulted, global health, physical functioning, and appetite loss are the scale items most relevant to patients with gastroesophageal cancers. Scores for each scale and item ranged from 0 to 100, with higher scores indicative of better QoL, greater physical functioning, or a greater degree of symptoms. Improvement and deterioration were defined as a change of 10 or more points in the relevant direction.
Full study population: In the KEYNOTE-811 trial, analysis of the EORTC QLQ-C30 in the full study population conducted at IA2 (data cut-off date: May 25, 2022). Overall, baseline EORTC QLQ-C30 was completed by 320 (92.8%) patients in the pembrolizumab plus SOC group and by 339 (99.7%) patients in the placebo plus SOC group. By week 24, 231 (67.0%) of the available 265 (76.8%) patients in the pembrolizumab plus SOC group completed the questionnaire, for a compliance rate of 87.2%. In the placebo plus SOC group, 190 (55.9%) of the available 235 (69.1%) patients completed the questionnaire, for a compliance rate of 80.9%.
In the full study population, the between-group difference in least squares mean change from baseline to week 24 for global health status was █████ ██████ ████ ███ █████ ██ ████ █████████████ after treatment with pembrolizumab plus SOC versus placebo plus SOC. Improvement in global health status was reported in 31.6% and 31.8% of patients in the pembrolizumab plus SOC and placebo plus SOC groups, respectively. The between-group difference in improvement was █████ ████ ███ █████ ██ █████ after treatment with pembrolizumab plus SOC versus placebo plus SOC. Improvement or stability in global health status was reported in 71.9% and 71.5% of patients in the pembrolizumab plus SOC and placebo plus SOC groups, respectively. The between-group difference in improvement or stability was ████ ████ ███ █████ ██ █████ after treatment with pembrolizumab plus SOC compared to placebo plus SOC. The stratified HR for time to deterioration on the global health status scale at 12 months was 1.14 (95% CI, 0.84 to 1.55; P = 0.3951) for pembrolizumab plus SOC relative to placebo plus SOC.
For physical function, the between-group difference in least squares change from baseline to week 24 was █████ ██████ ████ ███ █████ ██ ████ ██████████████ after treatment with pembrolizumab plus SOC versus placebo plus SOC. Improvement in physical function was reported in 14.8% and 15.9% of patients in the pembrolizumab plus SOC and the placebo plus SOC groups, respectively. The between-group difference in improvement was █████ ████ ███ █████ ██ █████ after treatment with pembrolizumab plus SOC versus placebo plus SOC. Improvement or stability in physical function was reported in 73.0% and 72.4% of patients in the pembrolizumab plus SOC and placebo plus SOC groups, respectively. The between-group difference in improvement or stability was ████ ████ ███ ████ ██ █████ after treatment with pembrolizumab plus SOC compared to placebo plus SOC. The stratified HR for time to deterioration on the physical function scale at 12 months was 1.05 (95% CI, 0.78 to 1.47; P = 0.7663) for pembrolizumab plus SOC relative to placebo plus SOC.
For the single item appetite loss, the between-group difference in least squares change from baseline to week 24 was ████ ████ ███ █████ ██ █████████████ Improvement in appetite loss was reported in 32.5% and 26.6% of patients in the pembrolizumab plus SOC and the placebo plus SOC groups, respectively. The between-group difference in improvement was ████ ████ ███ █████ ██ ██████ after treatment with pembrolizumab plus SOC versus placebo plus SOC. Improvement or stability in appetite loss was reported in 77.4% and 72.6% of patients in the pembrolizumab plus SOC and placebo plus SOC groups, respectively. The between-group difference in improvement or stability was ████ ████ ███ ████ ██ ██████ after treatment with pembrolizumab plus SOC compared to placebo plus SOC. The stratified HR for time to deterioration on the single item appetite loss at 12 months was 1.18 (95% CI, 0.87 to 1.60; P = 0.2898) for pembrolizumab plus SOC relative to placebo plus SOC.
PD-L1–positive subgroup: Among patients in the PD-L1–positive subgroup, analysis of the EORTC QLQ-C30 was conducted at IA3 (data cut-off date: March 29, 2023). Baseline EORTC QLQ-C30 was completed by 272 (93.5%) patients in the pembrolizumab plus SOC group and by 274 (95.8%) patients in the placebo plus SOC group. The number of patients available to complete the measure diminished over time. By week 24, there were 223 (76.6%) patients in the pembrolizumab plus SOC group; of those, 196 (67.0%) patients completed the questionnaire, for a compliance rate of 87.4%. In the placebo plus SOC group, 151 (52.8%) of the available 192 (67.1%) patients completed the questionnaire, for a compliance rate of 78.6%.
In the PD-L1–positive subgroup, the between-group difference in least squares mean change from baseline to week 24 for global health status was █████ ████ ███ █████ ██ ████████████ after treatment with pembrolizumab plus SOC versus placebo plus SOC. Improvement in global health status was reported in 31.6% and 32.5% of patients in the pembrolizumab plus SOC and the placebo SOC groups, respectively. The between-group difference in improvement was █████ ████ ███ █████ ██ ████████████ after treatment with pembrolizumab plus SOC versus placebo plus SOC. Improvement or stability in global health status was reported in 71.5% and 71.0% of patients in the pembrolizumab plus SOC and the placebo plus SOC groups, respectively. The between-group difference in improvement or stability was ████ ████ ███ █████ ██ ████████████ after treatment with pembrolizumab plus SOC compared to placebo plus SOC. The HR for time to deterioration on the global health status scale at 12 months was 1.16 (95% CI, 0.83 to 1.61; P = 0.3756) for pembrolizumab plus SOC relative to placebo plus SOC.
For physical functioning, the between-group difference in least squares change from baseline to week 24 was █████ ████ ███ █████ ██ █████ ███████ █ ███████ after treatment with pembrolizumab plus SOC versus placebo plus SOC. Improvement in physical functioning was reported in 15.1% and 17.5% of patients in the pembrolizumab plus SOC and placebo plus SOC groups, respectively. The between-group difference in improvement was █████ ████ ███ █████ ██ ████████████ after treatment with pembrolizumab plus SOC versus placebo plus SOC. Improvement or stability in physical functioning was reported in 74.9% and 71.7% of patients in the pembrolizumab plus SOC and placebo plus SOC groups, respectively. The between-group difference in improvement or stability was ████ ████ ███ █████ ██ █████████████ after treatment with pembrolizumab plus SOC compared to placebo plus SOC. The HR for time to deterioration on the physical functioning scale at 12 months was 0.99 (95% CI, 0.72 to 1.38; P = 0.9615) for pembrolizumab plus SOC relative to placebo plus SOC.
For the single item appetite loss, the between-group difference in least squares change from baseline to week 24 was not reported. Improvement in appetite loss was reported in 32.6% and 28.3% of patients in the pembrolizumab plus SOC and the placebo plus SOC groups, respectively. The between-group difference in improvement was ████ ████ ███ █████ ██ ████████████ after treatment with pembrolizumab plus SOC versus placebo plus SOC. Improvement or stability in appetite loss was reported in 78.0% and 72.4% of patients in the pembrolizumab plus SOC and placebo plus SOC groups, respectively. The between-group difference in improvement or stability was ████ ████ ███ █████ ██ █████████████ after treatment with pembrolizumab plus SOC compared to placebo plus SOC. The HR for time to deterioration on the single item appetite loss at 12 months was 1.23 (95% CI, 0.88 to 1.70; P = 0.2344) for pembrolizumab plus SOC relative to placebo plus SOC.
European Organisation for Research and Treatment of Cancer Quality of Life Questionnaire Stomach Cancer Module
The EORTC QLQ-STO22 is an HRQoL measure specific to gastric cancer that consists of 22 items that assess symptoms of dysphagia (4 items), pain or discomfort (3 items), upper gastrointestinal (GI) symptoms (3 items), eating restrictions (5 items), emotional problems (3 items), dry mouth (1 item), hair loss (1 item), problems with taste, and body image (1 item).38 Scores for each symptom scale range from 0 to 100, with higher scores indicative of a worsening of symptoms. Improvement or deterioration were defined as a decrease or increase of 10 or more points, respectively. Results from the EORTC QLQ-STO22 were included in the clinical report as supportive analyses.
Full study population: In the KEYNOTE-811 trial, analysis of the EORTC QLQ-STO22 was conducted at IA2 (data cut-off date: May 25, 2022). Overall, baseline EORTC QLQ-STO22 was completed by 319 (92.5%) patients in the pembrolizumab plus SOC group and by 320 (94.1%) patients in the placebo plus SOC group. The number of patients available to complete the measure diminished over time. By week 24, 229 (66.4%) of the available 265 (76.8%) patients in the pembrolizumab plus SOC group completed the questionnaire, for a compliance rate of 86.4%. In the placebo plus SOC group, 190 (55.9%) of the available 235 (69.1%) patients completed the questionnaire for a compliance rate of 80.9%.
In the full study population, the between-group difference in least squares mean change from baseline to week 24 on the pain symptom scale of the EORTC QLQ-STO22 was █████ ██████ ████ ███ █████ ██ ████ █████████████ after treatment with pembrolizumab plus SOC versus placebo plus SOC. Improvement in pain symptoms was reported in 40.0% and 32.1% of patients in the pembrolizumab plus SOC and placebo plus SOC groups, respectively. The between-group difference in improvement was ████ ████ ███ ████ ██ ████████████, favouring treatment with pembrolizumab plus SOC versus placebo plus SOC. Improvement or stability in pain was reported in 82.0% and 78.2% of patients in the pembrolizumab plus SOC and placebo plus SOC groups, respectively. The between-group difference in improvement or stability was ████ ████ ███ ████ ██ ███████████ after treatment with pembrolizumab plus SOC compared to placebo plus SOC. Deterioration on the pain symptom scale was recorded in 11.3% and 10.6% of patients in the pembrolizumab plus SOC and placebo plus SOC groups, respectively. The stratified HR for time to deterioration on the pain symptom scale at 12 months was 0.99 (95% CI, 0.62 to 1.58; P = 0.9681) for pembrolizumab plus SOC relative to placebo plus SOC.
PD-L1–positive subgroup: Among patients in the PD-L1–positive subgroup, analysis of the EORTC QLQ-STO22 was conducted at IA3 (data cut-off date: March 29, 2023). The EORT QLQ-STO22 was completed at baseline by 271 (93.1%) patients in the pembrolizumab plus SOC group and 273 (95.5%) patients in the placebo plus SOC group. The number of patients available to complete the measure diminished over time. By week 24, 193 (66.3%) of the available 223 (76.6%) patients in the pembrolizumab plus SOC group completed the questionnaire, for a compliance rate of 86.5%. In the placebo plus SOC group, 152 (79.2%) of the available 192 (67.1%) patients completed the questionnaire, for a compliance rate of 79.2%.
In the PD-L1–positive subgroup, the between-group difference in least squares mean change from baseline to week 24 for the pain symptom scale of the EORTC QLQ-STO22 was not reported. Improvement in pain symptoms was reported in 40.2% and 32.9% of patients in the pembrolizumab plus SOC and placebo plus SOC groups, respectively. The between-group difference in improvement was ████ ████ ███ █████ ██ ████████████ after treatment with pembrolizumab plus SOC versus placebo plus SOC. Improvement or stability in pain was reported in 83.2% and 78.3% of patients in the pembrolizumab plus SOC and placebo plus SOC groups, respectively. The between-group difference in improvement or stability was ████ ████ ███ ████ ██ ████████████ after treatment with pembrolizumab plus SOC compared to placebo plus SOC. Deterioration on the pain symptom scale was recorded in 11.4% and 10.6% of patients in the pembrolizumab plus SOC and placebo plus SOC groups, respectively. The HR for time to deterioration on the pain symptom scale at 12 months was 1.00 (95% CI, 0.60 to 1.66; P = 0.9943) for pembrolizumab plus SOC relative to placebo plus SOC.
Harms Results
Adverse Events
Full study population: In the KEYNOTE-811 trial, at least 1 AE was reported by 99.4% and 100% of patients in the pembrolizumab plus SOC group and the placebo plus SOC groups, respectively. Among patients randomized to receive pembrolizumab plus SOC, the 5 most commonly reported AEs were diarrhea (52.6%), nausea (48.3%), anemia (45.4%), vomiting (33.1%), and decreased appetite (32.3%). In the placebo plus SOC group, the 5 most commonly reported AEs were nausea (48.3%), diarrhea (47.1%), anemia (46.2%), decreased appetite (32.4%), and vomiting (28.6%).
In the full study population, AEs that were classified as grade 3 or higher were reported in 71.7% of patients in the pembrolizumab plus SOC group and in 65.9% of patients in the placebo plus SOC group. The most common AEs that were classified as grade 3 or higher (reported in more than 5% of patients) in the pembrolizumab plus SOC group were anemia (12.6%), diarrhea (9.7%), decreased neutrophil count (8.3%), neutropenia (6.6%), decreased platelet count (6.3%), and hypokalemia (5.7%). The most common AEs that were classified as grade 3 or higher (reported in more than 5% of patients) in the placebo plus SOC group were anemia (10.1%), decreased neutrophil count (8.7%), diarrhea (8.4%), decreased platelet count (6.9%), hypokalemia (5.8%), nausea (5.5%), and neutropenia (5.2%),
PD-L1–positive subgroup: Among patients in the PD-L1–positive subgroup, at least 1 AE was reported by 99.3% and 100% of patients in the pembrolizumab plus SOC group and the placebo plus SOC group, respectively. Among patients who had PD-L1–positive disease and were randomized to receive pembrolizumab plus SOC, the 5 most commonly reported AEs were diarrhea (53.7%), nausea (50.7%), anemia (46.3%), vomiting (35.2%), and decreased appetite (33.2%). In the placebo plus SOC group, the 5 most commonly reported AEs were nausea (48.5%), diarrhea (46.8.1%), anemia (46.8%), vomiting (30.5%) and decreased appetite (30.2%).
In the PD-L1–positive subgroup, AEs that were classified as grade 3 or higher were reported in 73.8% of patients in the pembrolizumab plus SOC group and in 65.8% of patients in the placebo plus SOC group. The most common AEs classified as grade 3 or higher (reported in more than 5% of patients) in the pembrolizumab plus SOC group were anemia (12.8%), diarrhea (10.7%), decreased neutrophil count (8.4%), neutropenia (7.7%), decreased platelet count (7.4%), and hypokalemia (6.0%). The most common AEs that were classified as grade 3 or higher (reported in more than 5% of patients) in the placebo plus SOC group were anemia (10.2%), decreased neutrophil count (9.2%), diarrhea (8.5%), decreased platelet count (5.8%), and nausea (5.8%)
Serious Adverse Events
Serious adverse events (SAEs) were AEs that resulted in death, were life-threatening, required inpatient hospitalization or prolonged an existing hospitalization, or resulted in persistent or significant disability and/or incapacity, congenital anomaly, and/or stillbirth or other important medical event.
Full study population: In the full study population, at least 1 serious AE was reported in 46.0% of patients in both the pembrolizumab plus SOC group, and the placebo plus SOC group. In the pembrolizumab plus SOC group, the following SAEs were reported in more than 2% of patients: pneumonia (5.1%), diarrhea (4.9%), and pulmonary embolism (2.9%). In the placebo plus SOC group, the following SAEs were reported in more than 2% of patients: diarrhea (4.6%), and vomiting (2.6%).
PD-L1–positive subgroup: In the PD-L1–positive subgroup, at least 1 serious AE was reported in 48.0% and 47.8% of patients in the pembrolizumab plus SOC group and placebo plus SOC group, respectively. Details of incident SAEs were not reported by the sponsor.
Withdrawals of Treatment Due to Adverse Events
Full study population: In the full study population, treatment with any of the study drugs was stopped in 41.4% and 38.4% of patients in the pembrolizumab plus SOC and the placebo plus SOC groups, respectively. In the pembrolizumab plus SOC group, pembrolizumab, trastuzumab, and any chemotherapy were discontinued due to AEs in 13.1%, 13.1%, 38.9% of patients, respectively. In the placebo plus SOC group, placebo, trastuzumab, and chemotherapy were discontinued in 10.7%, 9.2%, and 38.2% of patients, respectively. Overall, 6.3% of patients in the pembrolizumab plus SOC group and 6.9% of patients in the placebo plus SOC group discontinued all drugs in the regimen.
PD-L1–positive subgroup: In the PD-L1–positive subgroup, treatment with any of the study drugs was stopped in 42.6% and 36.6% of patients in the pembrolizumab plus SOC and the placebo plus SOC groups, respectively. In the pembrolizumab plus SOC group, pembrolizumab, trastuzumab, and any chemotherapy were discontinued due to AEs in 14.1%, 14.1%, 40.3% of patients, respectively. In the placebo plus SOC group, placebo, trastuzumab, and chemotherapy were discontinued in 11.5%, 10.5%, and 36.3% of patients, respectively. Overall, 6.7% of patients in the pembrolizumab plus SOC group and 7.8% of patients in the placebo plus SOC group discontinued all drugs in the regimen.
Mortality
Full study population: In the full study population, death due to AEs was documented in 6.6% of patients who received pembrolizumab plus SOC and in 6.1% of patients who received placebo plus SOC.
PD-L1–positive subgroup: In the PD-L1–positive subgroup, death due to AEs was documented in 6.7% of patients who received pembrolizumab plus SOC and in 6.8% of patients who received placebo plus SOC.
Notable Harms
Immune-mediated AEs were of interest to the clinical review team at CDA-AMC.
Full study population: In the full study population, at least 1 immune-mediated AE was documented in █████ and █████ of patients who received pembrolizumab plus SOC and placebo plus SOC, respectively. Grade 3 or worse immune-mediated AEs were reported in ████ of patients in the pembrolizumab plus SOC group and in ████ of patients in the placebo plus SOC group.
PD-L1–positive subgroup: In the full study population, at least 1 immune-mediated AE was documented in █████ ███ █████ of patients in the pembrolizumab plus SOC and placebo plus SOC groups, respectively. Grade 3 or worse immune-mediated AEs were reported in ████ of patients in the pembrolizumab plus SOC group and in ████ of patients in the placebo plus SOC group.
Critical Appraisal
The KEYNOTE-811 trial is a randomized, placebo-controlled, parallel-group, multicentre, double-blind, phase III study. Patients were randomized centrally using interactive response technology, which is typically adequate for concealing allocation until treatment assignment. The stratification factors for randomization appeared to be appropriate, as they addressed important prognostic factors identified by the clinical experts we consulted, and the baseline characteristics of the treatment groups were generally well balanced. Of note, because PD-L1 status (CPS ≥ 1 versus CPS < 1) was a stratification factor, the review team at CDA-AMC assumed that the randomization and prognostic balance hold in this subgroup of interest. In both the full study population and the PD-L1–positive subgroup, between-group imbalances were noted in the concomitant use of loperamide and unspecified herbal and traditional medicine. However, according to the clinical experts we consulted for the purpose of this review, the use of loperamide or unspecified herbal and traditional medicine is not likely to have any meaningful impact on treatment response. In the PD-L1–positive subgroup, a greater proportion of patients in the placebo plus SOC group received subsequent therapy relative to the pembrolizumab plus SOC group. Given that the reasons for treatment discontinuation were primarily disease progression and AEs (which were similar in proportion in the 2 groups), the risk of unblinding driving the use of subsequent therapies appeared to be low.
The dual primary outcomes in the KEYNOTE-811 trial were PFS and OS. An appropriate analysis set (intention to treat [ITT]) for PFS and OS was used to measure the effect of assignment to intervention. To minimize the risk of measurement bias, patients’ responses to treatment were blinded to the study investigators, and tumour response was confirmed by radiologic evidence and was based on BICR as per RECIST 1.1. Sensitivity analysis of PFS demonstrated consistency between the BICR and investigator assessment of tumour response, suggesting that the procedures employed to minimize bias associated with knowledge of group assignment were adequate. OS is considered an objective outcome, and it not prone to bias due to knowledge of group assignment. The risk of bias to due to missing outcome data for OS and PFS appeared to be low, as losses to follow-up for reasons other than death were low and sensitivity analyses with different censoring rules for PFS in the overall population were consistent. The KEYNOTE-811 trial assessed HRQoL — an outcome deemed important by patients and clinicians — as an exploratory outcome. The double-blind nature of the trial minimized the risk of bias in the measurement of the subjective items on the EORTC QLQ-C30 and EROTC QLQ-STO22. However, comparative efficacy conclusions based on HRQoL outcomes are limited due to the diminishing number of patients available to complete the questionnaires. The results pertaining to HRQoL are at risk of attrition bias. Finally, because the completion rates were not balanced between the groups, there is a risk that attrition bias may favour 1 of the treatment groups over the other. The extent and direction of the bias, however, cannot be determined because it is not clear if the patients who completed the questionnaires were systematically different from those who did not.
Analysis of the efficacy results followed a defined statistical plan and employed appropriate censoring criteria. There was adequate control for multiplicity (type I error) across the dual efficacy end points of PFS and OS, and interim analyses in the full study population used a hierarchical testing procedure. Both PFS and OS were modelled using a proportional hazards assumption. Although the proportional hazards assumption underlying the HRs for OS and PFS was not tested, based on visual inspection, the curves appeared to be relatively parallel. The decision to limit treatment with pembrolizumab plus SOC to patients with PD-L1–positive disease was based on the subgroup analyses. Although the subgroup analyses were prespecified, they were absent from the statical testing hierarchy. Although this presents a risk of type I error (i.e., falsely excluding the null), the subgroup of patients with PD-L1–positive disease represented approximately 85% of the full study population. The results observed in the full study population appeared to be driven by the PD-L1–positive subgroup; qualitatively, the results of the full population and PD-L1–positive subgroup were similar. Finally, results were based on interim analyses, which may have overestimated the treatment effect estimates.39,40 However, given the relatively large sample size and number of events with a 75% information fraction, the effect estimate and confidence are not likely to be highly unstable. Although reassuring, overestimation of the treatment effect cannot be completely excluded.39,40
GRADE Summary of Findings and Certainty of the Evidence
The selection of outcomes for Grading of Recommendations, Assessment, Development, and Evaluations (GRADE) assessment was based on the sponsor’s Summary of Clinical Evidence, consultation with clinical experts, and input received from patient and clinician groups and public drug plans. The following list of outcomes was finalized in consultation with expert committee members:
probability of OS and PFS at months 12, 18, and 36
HRQoL measured by the EORTC QLQ-C30 (global QoL, physical functioning, and appetite loss) at week 24
notable harms, including immune-mediated AEs and grade 3 or worse immune-mediated AEs.
For pivotal studies and randomized controlled trials (RCTs) identified in the sponsor’s systematic review, GRADE was used to assess the certainty of the evidence for outcomes considered to be most relevant to inform our expert committee deliberations, and a final certainty rating was determined as outlined by the GRADE Working Group.41,42
Following the GRADE approach, evidence from RCTs started as high-certainty evidence and could be rated down for concerns related to study limitations (which refer to internal validity or risk of bias), inconsistency across studies, indirectness, imprecision of effects, and publication bias.
When possible, certainty was rated in the context of the presence of an important (nontrivial) treatment effect; if this was not possible, certainty was rated in the context of the presence of any treatment effect (i.e., the clinical importance is unclear). In all cases, the target of the certainty of the evidence assessment was based on the point estimate and where it was located relative to the threshold for a clinically important effect (when a threshold was available) or to the null. The presence or absence of an important effect for OS was based on a threshold informed by the clinical experts we consulted for the purpose of this review, whereas the presence of absence of an important effect for HRQoL was based on minimally important difference (MID) estimates identified in the literature. For all other outcomes, the presence or absence of an important effect was based on the nonnull effect.
Table 2 presents the GRADE summary of findings for pembrolizumab in combination with SOC versus placebo in combination with SOC.
Table 2: Summary of Findings for Pembrolizumab Plus SOC Versus Saline Placebo Plus SOC in Patients With HER2-Positive Advanced Gastric or GEJ Adenocarcinoma in the PD-L1 CPS 1 or More Subgroup
Outcome and follow-up | Patients (studies), N | Relative effect (95% CI) | Absolute effects (95% CI) | Certainty | What happens | ||
|---|---|---|---|---|---|---|---|
Placebo plus SOC | Pembrolizumab plus SOC | Difference | |||||
Overall survival | |||||||
Probability of survival at 12 monthsa Median follow-up: 38.4 and 38.6 monthsb | 594 (1 RCT) | NR | 60.8 per 100 | 69.5 per 100 (63.9 to 74.4 per 100) | ███ ████ ███ ███ ████ ██ ████ ████ ███ ████ | Moderatec | The addition of pembrolizumab to SOC likely results in a clinically important increase in OS, compared with placebo plus SOC, at 12 months. |
Probability of survival at 18 monthsa Median follow-up: 38.4 and 38.6 monthsb | 594 (1 RCT) | NR | 45.6 per 100 | 55.7 per 100 (49.9 to 61.1 per 100) | ████ ████ ███ ███ ████ ██ ████ ████ ███ ████ | Moderatec | The addition of pembrolizumab to SOC likely results in a clinically important increase in OS, compared with placebo plus SOC, at 18 months. |
Probability of survival at 36 monthsa Median follow-up: 38.4 and 38.6 monthsb | 594 (1 RCT) | NR | 24.5 per 100 | 31.3 per 100 (25.8 to 36.9 per 100) | ███ ████ ███ ███ █████████ ██ ████ ████ ███ ████ | Moderatec | The addition of pembrolizumab to SOC likely results in a clinically important increase in OS, compared with placebo plus SOC, at 36 months. |
Progression-free survival per RECIST 1.1 by BICR | |||||||
Probability of PFS at 12 monthsa Median follow-up: 38.4 and 38.6 monthsb | 594 (1 RCT) | NR | 33.2 per 100 | 46.0 per 100 (40.0 to 51.7 per 100) | ████ ████ ███ ███ ████ ██ ████ ████ ███ ████ | Highd | The addition of pembrolizumab to SOC results in an increase in PFS, compared with placebo plus SOC, at 12 months. The clinical importance of the increase is unclear. |
Probability of PFS at 18 monthsa Median follow-up: 38.4 and 38.6 monthsb | 594 (1 RCT) | NR | 20.4 per 100 | 29.5 per 100 (24.1 to 35.0 per 100) | ███ ████ ███ ███ ████ ██ ████ ████ ███ ████ | Highd | The addition of pembrolizumab to SOC results in an increase in PFS, compared with placebo plus SOC, at 18 months. The clinical importance of the increase is unclear. |
Probability of PFS at 36 monthsa Median follow-up: 38.4 and 38.6 monthsb | 594 (1 RCT) | NR | 10.3 per 100 | 18.0 per 100 (13.3 to 23.3 per 100) | ███ ████ ███ ███ ████ ██ ████ ████ ███ ███ | Highd | The addition of pembrolizumab to SOC results in an increase in PFS, compared with placebo plus SOC, at 36 months. The clinical importance of the increase is unclear. |
Health-related quality of life | |||||||
Change in LS mean on the EORTC QLQ-C30 global health status/QoL scale from baseline to week 24, points Median follow-up: 38.4 and 38.6 monthsb | 546 (1 RCT) | NA | 2.06 (–0.67 to 4.79) | 0.78 (–1.71 to 3.26) | █████ ██████ ██ █████ | Lowe | The addition of pembrolizumab to SOC may result in little to no clinically important difference in HRQoL global health at week 24, compared to placebo plus SOC. |
Change in LS mean on the EORTC QLQ-C30 physical functioning scale from baseline to week 24, points Median follow-up: 38.4 and 38.6 monthsb | 546 (1 RCT) | NA | –2.01 (–4.01 to –0.01) | –2.03 (–3.91 to –0.15) | █████ ██████ ██ █████ | Lowe | The addition of pembrolizumab to SOC may result in little to no clinically important difference in physical function at week 24, compared to placebo plus SOC. |
Change in LS mean on the EORTC QLQ-C30 single item appetite loss from baseline to week 24 | 546 (1 RCT) | NA | NR | NR | NR | NA | Outcome data were not reported by the sponsor. |
Harms | |||||||
Immune-mediated AEsa Median follow-up: 38.4 and 38.6 monthsb | 593 (1 RCT) | NR | ████ ███ ███ | ████ ███ ███ ████ | ████ ████ ███ ███ ████ ██ ████ ████ ███ ████ | Highf | The addition of pembrolizumab to SOC results in an increase in immune-mediated AEs, compared with placebo plus SOC. The clinical importance of the increase is unclear. |
Grade 3 or worse immune-mediated AEsa Median follow-up: 38.4 and 38.6 monthsb | 593 (1 RCT) | NR | ███ ███ ███ | ███ ███ ███ ████ | ███ ████ ███ ███ ████ ██ ███ ████ ███ ████ | Moderateg | The addition of pembrolizumab to SOC likely results in an increase in grade 3 or worse immune-mediated AEs, compared with placebo plus SOC. The clinical importance of the increase is unclear. |
BICR = blinded independent central review; CI = confidence interval; CPS = combined positive score; EORTC QLQ-C30 = European Organisation for Research and Treatment of Cancer Quality of Life Questionnaire Core 30; HRQoL = health-related quality of life; LS = least squares; NA = not applicable; NR = not reported; OS = overall survival; PD-L1 = programmed cell death 1 ligand 1; PFS = progression-free survival; QoL = quality of life; RCT = randomized controlled trial; RECIST 1.1 = Response Evaluation Criteria in Solid Tumours Version 1.1; SOC = standard of care.
Notes: Study limitations (which refer to internal validity or risk of bias), inconsistency across studies, indirectness, imprecision of effects, and publication bias were considered when assessing the certainty of the evidence. All serious concerns in these domains that led to the rating down of the level of certainty are documented in the table footnotes.
Results are based on IA3 (data cut-off date: March 29, 2023).
aBetween-group differences were requested from the sponsor to aid in interpretation and were not part of the sponsor's analysis plan.
bMedian follow-up at IA3 was 38.4 months (IQR, 29.5 to 44.4) in the pembrolizumab plus SOC group and 38.6 months (IQR, 30.2 to 44.4) in the placebo plus SOC group in the full study population. Median follow-up time at IA3 in the subgroup patients with PD-L1–positive disease was not reported.
cRated down 1 level for serious imprecision. The 95% CI is compatible with little to no difference and a clinically important benefit (exceeding the 5% to 10% threshold suggested by the clinical experts we consulted).
dThe clinical experts we consulted indicated a lack of clarity about a threshold of clinical importance; therefore, the null was used. Although the certainty of the evidence was not rated down for serious indirectness, there were concerns about the clinical importance of PFS.
eRated down 2 levels for very serious study limitations because of risk of bias due to missing data as results were available to less than 60% of patients by week 24.
fThe clinical experts we consulted indicated a lack of clarity about a threshold of clinical importance, therefore the null was employed.
gRated down 1 level for serious imprecision. The clinical experts we consulted indicated a lack of clarity about a threshold of clinical importance; therefore, the null was employed. No threshold was crossed but there was a small number of events contributing to the estimated treatment effect.
Sources: Clinical Study Report for KEYNOTE-811,43 Statistical Report KN811 IA3,44 and PRO Report.45 Details included in the table are from the sponsor’s Summary of Clinical Evidence.
Long-Term Extension Studies
No long-term extension studies were included in this submission.
Indirect Comparisons
No indirect treatment comparisons were included in this submission. The sponsor conducted a feasibility assessment to estimate the efficacy and safety of pembrolizumab combined with SOC therapy (trastuzumab in combination with CISPFU or CAPOX) compared with other fluoropyrimidine- and platinum-containing chemotherapies used in combination with trastuzumab in Canada, mainly leucovorin calcium (folinic acid), 5-FU, and oxaliplatin (FOLFOX) and capecitabine-cisplatin. The availability of relevant studies with which to perform an indirect comparison was informed by a systematic literature review.46 This review identified 1 trial (ToGA)18 in which some patients in 1 arm received capecitabine-cisplatin and trastuzumab. However, an indirect comparison was not possible because this arm was pooled with another arm (5-FU plus cisplatin and trastuzumab) in the analysis. Therefore, an indirect comparison was not deemed possible. A review of the feasibility appraisal by CDA-AMC is in agreement with this conclusion.
Studies Addressing Gaps in the Evidence From the Systematic Review
No studies addressing gaps in the evidence from the systematic review were included in this submission.
Conclusions
Evidence of high certainty from 1 randomized, double-blind, placebo-controlled, phase III trial (KEYNOTE-811) in adult patients with locally advanced, unresectable or metastatic HER2-positive gastric or GEJ adenocarcinoma with a positive PD-L1 expression, defined by a CPS of 1 or more, shows that over a median of 38 months of follow-up, first-line treatment with pembrolizumab in combination with SOC (trastuzumab in combination with CISPFU or CAPOX) results in improved PFS compared to placebo added to SOC. The clinical importance of the improvement is unclear, as there was uncertainty about the validity of this surrogate outcome in predicting the treatment effect on OS. Evidence of moderate certainty from the KEYNOTE-811 trial suggests that first-line treatment with pembrolizumab in combination with SOC (trastuzumab in combination with CISPFU or CAPOX) likely results in a clinically important increase in OS compared to placebo added to SOC. There were insufficient data to enable a long-term outcome assessment beyond 36 months. Evidence from the pivotal trial suggests that at 36 months, the point estimate of the effect of adding pembrolizumab to SOC on OS exceeded the lower threshold (5%) suggested by the clinical experts as a clinically important benefit. However, the difference was small and the certainty in this finding was decreased because the 95% CI included the potential for little to no difference in OS compared to placebo plus SOC. The addition of pembrolizumab to SOC may result in little to no difference in HRQoL measured by the EORTC QLQ-C30 global health scale and physical functioning scale. The ability of the KEYNOTE-811 trial to assess the treatment effect of pembrolizumab in combination with SOC on HRQoL was limited due to the diminishing number of patients available to compete the EORTC QLQ-C30 over time. Immunotherapy-mediated AEs associated with the addition of pembrolizumab to SOC were more frequent than those associated with placebo plus SOC. Although any grade 3 or worse AEs were more frequently reported in the pembrolizumab plus SOC group than in the placebo plus SOC group, SAEs were comparable between the groups. The clinical experts we consulted did not observe any new safety concerns in the KEYNOTE-811 trial. Although no indirect comparisons were possible, the clinical experts we consulted agreed that other SOC combinations could be used instead of the combination used in the KEYNOTE-811 trial, as has been done for other indications. The addition of pembrolizumab to SOC may meet the need for additional treatment options that improve OS.
Introduction
The objective of this report is to review and critically appraise the evidence submitted by the sponsor on the beneficial and harmful effects of pembrolizumab, 200 mg or 400 mg administered by IV infusion, in combination with trastuzumab, fluoropyrimidine-, and platinum-containing chemotherapy in the treatment of adult patients with gastric or GEJ adenocarcinoma that express HER2-positive and PD-L1 (CPS ≥ 1).
Disease Background
The contents of this section have been informed by materials submitted by the sponsor and clinical expert input. The following have been summarized and validated by the CDA-AMC review team.
Gastric cancer is a growth of abnormal cells that starts in the stomach. It was estimated that 4,100 Canadians would be diagnosed with gastric cancer in 2022.1,2 Gastric cancers are generally classified into 2 topographical subsites. Cardia gastric cancers occur in the upper part of the stomach adjoining the esophagus. Noncardia gastric cancers occur in the more distal regions of the stomach.3 GEJ cancer develops in the area where the esophagus meets the gastric cardia.4 The risk of developing gastric cancer or GEJ cancer increases with age and is greatest in people 50 years and older.5 The lifetime probability of developing gastric cancer is higher among men (12 per 100,000 persons) than women (5.6 per 100,000 persons).1,2,5 Approximately 90% of noncardia cancers are attributable to Helicobacter pylori infection.6 Other risk factors for gastric cancers include smoking, heavy alcohol consumption, and the consumption of foods preserved by nitrates and/or nitrites.47-50 Although early-stage gastric or GEJ cancer is potentially curable, locally advanced, unresectable or metastatic diseases are considered incurable. And when patients with gastric or GEJ adenocarcinoma present with symptoms, they are usually nonspecific.7 As a result, the early diagnosis of gastric and GEJ cancers is challenging.7 Instead, most patients have advanced-stage III or stage IV (34%) disease at the time of diagnosis, when curative treatments are not possible.7,8 Advanced gastric and GEJ cancers are associated with a higher prevalence and intensity of symptoms, such as unexplained weight loss, dyspepsia, abdominal pain, early satiety, reflux, dysphagia, asthenia, nausea and vomiting, shortness of breath, bleeding and/or anemia, ascites, and dumping syndrome.9,26,51 Patients with unresectable advanced or metastatic disease typically experience a high symptom burden, impaired QoL, frequent bouts of anxiety and depression.9 The 5-year survival rate for patients diagnosed with gastric or GEJ cancer living in Canada is 29%, reflecting the fact that the majority of patients are diagnosed with advanced-stage disease that is associated with poor prognosis.1,2,10 Among those with metastatic gastric or GEJ cancer, the 5-year survival rate is 6.6%.11
Gastric cancers most often start in the gland cells that line the inside of the stomach, indicative of adenocarcinoma. Approximately 90% to 95% of gastric and GEJ cancers are histologically classified as adenocarcinoma.3,8,47,49 Gastric cancers may contain oncogenic driver mutations that lead to uncontrolled cell growth and proliferation. The most common driver mutation is HER2, which is a transmembrane tyrosine kinase receptor. HER2 is overexpressed or amplified in 25% to 32% of patients with GEJ and between 9.5% and 18% of patients with gastric cancers.7,13-24 HER2 overexpression in patients with gastric cancer is associated with poor outcomes and more aggressive disease.25 Although the prognostic significance of HER2 status is not as well established in gastric cancer as in other cancers (i.e., breast cancer),13 it is a predictive biomarker for the choice of first-line systemic therapy in the advanced and/or metastatic setting. The relation between PD-L1 expression and response to immunotherapy in HER2-positive gastric and GEJ cancers is limited.
When gastric or GEJ cancer is suspected, diagnostic procedures include imaging with upper GI endoscopy; endoscopic ultrasound; CT, PET, and/or MRI scans; and tissue biopsy. Pathologic testing of biomarkers on lung biopsy specimens assists in the determination of treatment options and risk stratification. American Society of Clinical Oncology (ASCO), ESMO, and NCCN guidelines recommend evaluating HER2 status, PD-L1 expression, and microsatellite instability (MSI) or mismatch repair (MMR) in patients with advanced-stage or metastatic gastric cancer.13,30,52 In clinical practice, both HER2 status and PD-L1 expression are tested on a biopsy sample taken from the primary tumour or from metastases. HER2 status can be determined with IHC, which measures the amount of HER2 protein in the cancer cells; or with FISH, which examines the number of copies of the HER2 gene in the cancer cells. PD-L1 expression can be determined using a semiquantitative approach through IHC. Both IHC and FISH are performed by pathologists.
Standards of Therapy
The contents of this section have been informed by materials submitted by the sponsor and clinical expert input. The following have been summarized and validated by the CDA-AMC review team.
The treatment algorithm for locally advanced, unresectable or metastatic HER2-positive gastric or GEJ adenocarcinoma, as reflected by international and Canadian guidelines and clinical practice in Canada is presented in Figure 1.
Early-stage gastric and GEJ cancers are potentially curable by surgical treatment, either alone (stage IA) or with perioperative systemic therapy (stage IB to stage III). However, recurrences are frequent and associated with a poor prognosis.11 For patients with locally advanced, unresectable or metastatic gastric or GEJ adenocarcinoma, who are considered incurable, the median survival rate ranges from 4 months for patients treated with only best supportive care to less than 12 months for those treated with systemic chemotherapy.7 Based on input from the clinical experts we consulted for the purpose of this review, most patients with locally advanced, unresectable or metastatic HER2-positive gastroesophageal cancers are treated with palliative intent. The main goals of treatment in this setting are to help patients live longer (improve OS) and live better (improve QoL). The cornerstone of treatment for patients with locally advanced or metastatic HER2-positive gastroesophageal cancers involves the sequential use of the best available systemic therapies. As noted by the clinical experts, the selection of systematic therapy depends on the patient’s performance status, symptoms, and values and preferences across all lines of therapies.
For all patients with HER2-positive disease, the addition of trastuzumab to the standard first-line platinum-fluoropyrimidine doublet is recommended, based on the phase III ToGA study, which demonstrated improvements in response rates, PFS, and OS with trastuzumab compared with chemotherapy alone; additional toxicity was limited and manageable.13,16-18,26,27 This regimen is supported by the National Institute for Health and Care Excellence (NICE),28 ESMO,26 NCCN,13 Cancer Care Ontario (CCO),29 and Alberta Health Services.17 Of note, CCO explicitly extrapolated the benefits observed in the ToGA trial of trastuzumab added to capecitabine-cisplatin or 5-FU plus any fluoropyrimidine doublet regimen, based on a meta-analysis of observational studies and an understanding of the biological pathways being targeted by the therapy.29,53 In October 2023, ESMO recommended adding pembrolizumab to the trastuzumab plus chemotherapy SOC for patients with a PD-L1 CPS of 1 or more, based on the results of the KEYNOTE-811 clinical trial.30
The standard first-line platinum and fluoropyrimidine doublet options in Canada include FOLFOX, CAPOX, CISPFU, or capecitabine-cisplatin. The clinical experts we consulted added that the most commonly used chemotherapy backbones in Canada include FOLFOX, CAPOX, or capecitabine-cisplatin. In an RCT, oxaliplatin resulted in significantly better PFS and OS,54-56 and a better safety profile, than cisplatin.55-58 Thus, Canadian guidelines have recommended oxaliplatin as the preferred platinum drug,17,29 even though oxaliplatin and cisplatin are generally considered equally effective.56-58 The fluoropyrimidines include IV 5-FU or oral capecitabine,26 which are equally effective. However, 5-FU IV infusion is preferred in patients with dysphagia.26 Leucovorin, a reduced form of folic acid, is used to enhance the activity of 5-FU in certain regimens. For patients who are unfit for or intolerant of platinum-based regimens, the combination of leucovorin calcium (folinic acid), 5-FU, and irinotecan hydrochloride (FOLFIRI) or irinotecan monotherapy may be considered alternative options but are less frequently used in the first-line setting.26
In the second-line setting, patients can receive ramucirumab plus paclitaxel (preferred) or, if not eligible, a chemotherapy, usually as a single drug (standard: paclitaxel, docetaxel, or irinotecan) not previously used.17,26,29 The clinical experts we consulted stated that ramucirumab monotherapy, FOLFIRI chemotherapy (with no trial to support this choice), and trastuzumab deruxtecan (supported by trial data, but not reimbursed publicly anywhere in Canada) are also an options in the second-line setting.
After disease progression on second-line therapy, SOC treatments for patients with locally advanced, unresectable or metastatic HER2-positive gastric or GEJ adenocarcinoma may include trifluridine plus tipiracil hydrochloride (also known as TAS-102) or irinotecan or a taxane; if not previously used, immunotherapies can be considered but are not funded. The clinical experts noted that third-line therapy options are based on results from the TAGS,59 ATTRACTIONS 2,60 and KEYNOTE-059 trials.61 Trifluridine plus tipiracil is the standard third-line treatment when oral therapy is still possible.17,26,29
The clinical experts noted that across all lines of therapies, patients with advanced gastroesophageal cancer benefit from nutritional support, emotional support, exercise, and symptom management in conjunction with palliative care. The clinical experts added that in some specific settings, local therapies, such as surgery, radiation, and interventional radiology, may be used.
Figure 1: Treatment Algorithm for Locally Advanced Unresectable or Metastatic HER2-Positive Gastric or GEJ Adenocarcinoma
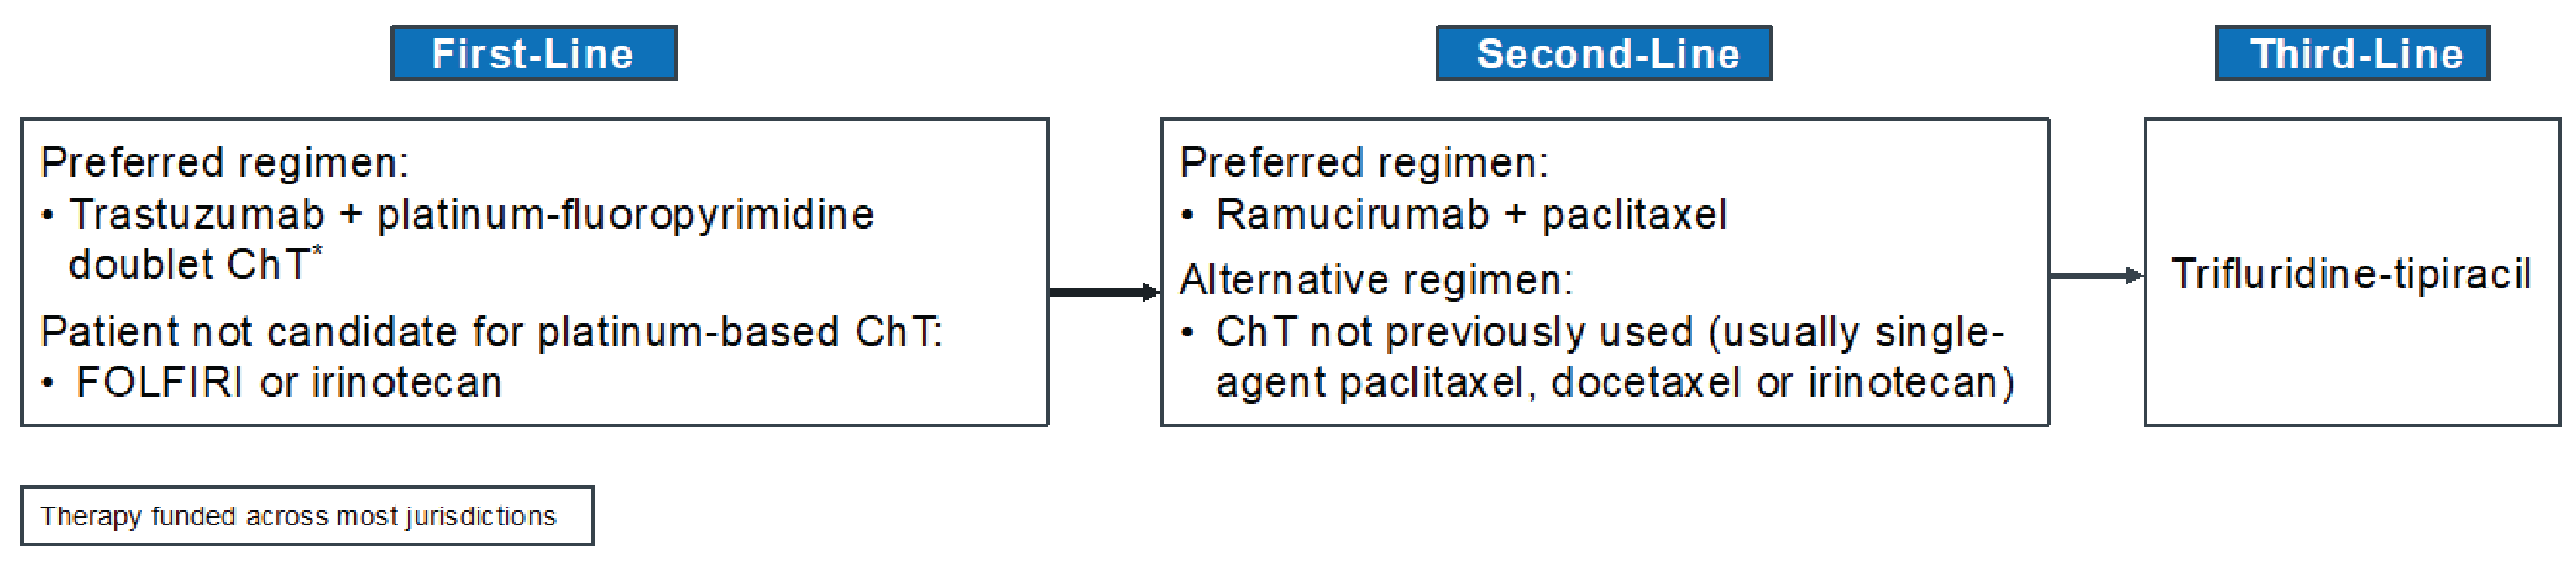
ChT = chemotherapy; FOLFIRI = leucovorin calcium (folinic acid), fluorouracil, and irinotecan hydrochloride; GEJ = gastroesophageal junction.
*The platinum and fluoropyrimidine doublet options used in Canada include FOLFOX (5-FU, leucovorin, oxaliplatin), CAPOX (capecitabine and oxaliplatin), CISPFU (5-FU and cisplatin), and capecitabine-cisplatin.
Sources: Adapted from NCCN 2022,13 ESMO 2022,26 Alberta Health Services 2021,17 CCO 2022.29 Details included in the figure are from the sponsor’s Summary of Clinical Evidence.
Drug Under Review
The key characteristics of pembrolizumab used in combination with SOC are summarized in Table 3 with other treatments available for locally advanced, resectable or metastatic HER2-positive gastric of GEJ adenocarcinoma that express PD-L1 (CPS ≥ 1).
Pembrolizumab is a high-affinity antibody against PD-1, which experts dual ligand blockade of the PD-1 pathway, including PD-L1 and programmed cell death 1 ligand 2 (PD-L2), on antigen-presenting or tumour cells. Pembrolizumab reactivates tumour-specific cytotoxic T lymphocytes in the tumour microenvironment by inhibiting the PD-1 receptors from binding to their ligands.31
Pembrolizumab received a Notice of Compliance on February 6, 2023, through the standard review pathway. The Health Canada indication for pembrolizumab, in combination with trastuzumab, fluoropyrimidine- and platinum-containing chemotherapy, is the first-line treatment of adult patients with locally advanced, unresectable or metastatic HER2-positive gastric or GEJ adenocarcinoma, whose tumours express PD-L1 (CPS ≥ 1), as determined by a validated test.
Pembrolizumab is also indicated for the following GI cancers:
For the first-line treatment, as monotherapy, of adult patients with metastatic MSI-high or deficient MMR colorectal cancer.
For the first-line treatment of adult patients with locally advanced, unresectable or metastatic carcinoma of the esophagus or HER2-negative adenocarcinoma of the esophagogastric junction (in which the tumour centre is 1 cm to 5 cm above the gastric cardia) in combination with platinum-based chemotherapy and fluoropyrimidine-based chemotherapy.
Health Canada has issued a Notice of Compliance with conditions for the use pembrolizumab in the following GI cancers for:
adult patients with unresectable or metastatic MSI-high or deficient MMR colorectal cancer whose tumours have progressed after treatment with a fluoropyrimidine, oxaliplatin, or irinotecan, as monotherapy, or for adult patients with endometrial cancer whose tumours have progressed after prior therapy and who have no satisfactory alternative treatment options, as monotherapy.
On November 7, 2023, the FDA approved pembrolizumab with fluoropyrimidine- containing chemotherapy and platinum-containing chemotherapy for the first-line treatment of adults with locally advanced, unresectable or metastatic HER2-negative gastric or GEJ adenocarcinoma; it is restricted to patients whose tumours express PD-L1 (CPS ≥ 1), as determined by an FDA-approved test.62 Agilent’s PD-L1 IHC 22C3 pharmDx was also approved by the FDA as a companion diagnostic device to identify patients with gastric or GEJ adenocarcinoma whose tumours express PD-L1 (CPS ≥ 1).62 Application reviews of pembrolizumab for the same indication are ongoing in the Australian Therapeutic Goods Administration and Switzerland’s Swissmedic.
The product monograph recommended dosage of pembrolizumab for locally advanced, unresectable or metastatic HER2-positive gastric or GEJ adenocarcinoma in combination with trastuzumab, fluoropyrimidine and platinum-containing chemotherapy in adults is 200 mg every 3 weeks or 400 mg every 6 weeks by IV infusion until disease progression, unacceptable toxicity, or for up to 24 months.31 The product monograph specifies that pembrolizumab should be administered before trastuzumab and chemotherapy when given on the same day.31
According to the product label, pembrolizumab is associated with the following warnings: immune-mediated adverse reactions, infusion-related reactions, complications of allogeneic hematopoietic stem-cell transplant, and embryo-fetal toxicity.63 Common adverse reactions associated with pembrolizumab when used as a single drug include fatigue, musculoskeletal pain, rash, diarrhea, pyrexia, cough, decreased appetite, pruritus, dyspnea, constipation, pain, abdominal pain, nausea, and hypothyroidism. Common adverse reactions associated with pembrolizumab in combination with chemotherapy include fatigue or asthenia, nausea, constipation, diarrhea, decreased appetite, rash, vomiting, cough, dyspnea, pyrexia, alopecia, peripheral neuropathy, mucosal inflammation, stomatitis, headache, weight loss, abdominal pain, arthralgia, myalgia, insomnia, and palmar-plantar erythrodysesthesia.63 In the event of adverse reactions, no dose reductions of pembrolizumab are recommended in the product monograph;31 instead, the product monographs recommends that pembrolizumab be withheld or discontinued.
Table 3: Key Characteristics of Pembrolizumab Plus SOC and Placebo Plus SOC
Characteristic | Pembrolizumab + trastuzumab + platinum-fluoropyrimidine doublet chemotherapy | Trastuzumab + platinum-fluoropyrimidine doublet chemotherapy |
|---|---|---|
Mechanism of action | Pembrolizumab: Releases PD-1 pathway-mediated inhibition of the immune response and restores T-cell proliferation and cytokine production. Trastuzumab: Inhibits the proliferation of tumour cells that overexpress HER2 and mediates antibody-dependent cell-mediated cytotoxicity on HER2 overexpressing cells. Chemotherapy: Antineoplastic (i.e., slow cancer growth or stop the growth of tumours [neoplasms]) or cytotoxic (i.e., kill tumour cells). | Trastuzumab: Inhibits the proliferation of tumour cells that overexpress HER2 and mediates antibody-dependent cell-mediated cytotoxicity on HER2 overexpressing cells. Chemotherapy: Antineoplastic (i.e., slow cancer growth or stop the growth of tumours [neoplasms]) or cytotoxic (i.e., kill tumour cells). |
Indicationa | Proposed indication: First-line treatment, in combination with trastuzumab, fluoropyrimidine- and platinum-containing chemotherapy, for adult patients with locally advanced, unresectable or metastatic HER2-positive gastric or GEJ adenocarcinoma whose tumours express PD-L1 (CPS ≥ 1) as determined by a validated test | In combination with capecitabine or IV 5-fluorouracil and cisplatin is indicated for the treatment of patients with HER2-positive metastatic adenocarcinoma of the stomach or GEJ who have not received prior anticancer treatment for their metastatic disease |
Recommended dose and route of administration | Pembrolizumab: 200 mg IV every 3 weeks or 400 mg IV every 6 weeks56 AND Trastuzumab: 8 mg/kg loading dose IV over 90 minutes and then 6 mg/kg maintenance dose IV over 30 to 60 minutes every 3 weeks55 AND Fluoropyrimidine- and platinum-containing chemotherapyc CISPFU — cisplatin 80 mg/m2 IV on day 1 of each 21-day treatment cycle (every 3 weeks) plus 5-FU 800 mg/m2 per day IV over 120 hours from day 1 to day 5 of each 21-day treatment cycle55 OR CAPOX — oxaliplatin 130 mg/m2 IV over 120 minutes on day 1 of each 21-day treatment cycle (every 3 weeks) plus capecitabine 1,000 mg/m2 orally twice daily on day 1 to day 14 of each 21-day treatment cycle.55 Alternative regimens that may be used in clinical practice: FOLFOX — oxaliplatin 85 mg/m2 IV, leucovorin 400 mg/m2 IV plus 5-FU 400 mg/m2 IV bolus on day 1, and then 5-FU 2,400 mg/m2 over 46 hours every 2 weeks.28 OR CAPECISP — cisplatin 80 mg/m2 IV on day 1 and capecitabine 1,000 mg/m2 orally twice daily on day 1 to day 14 of each 21-day treatment cycle.27 | Trastuzumab: 8 mg/kg loading dose IV over 90 minutes and then 6 mg/kg maintenance dose IV over 30 to 60 minutes every 3 weeksb,27,28,53,64 AND Fluoropyrimidine- and platinum-containing chemotherapy Regimens frequently used in clinical practice:c CISPFU — cisplatin 80 mg/m2 IV on day 1 of each 21-day treatment cycle (every 3 weeks) plus 5-FU 800 mg/m2 per day IV over 120 hours from day 1 to day 5 of each 21-day treatment cycle53 OR CAPOX — oxaliplatin 130 mg/m2 IV over 120 minutes on day 1 of each 21-day treatment cycle (every 3 weeks) plus capecitabine 1,000 mg/m2 orally daily on day 1 to day 14 of each 21-day treatment cycle64 OR FOLFOX — oxaliplatin 85 mg/m2 IV, leucovorin 400 mg/m2 IV plus 5-FU 400 mg/m2 IV bolus on day 1, and then 5-FU 2,400 mg/m2 over 46 hours every 2 weeks28 OR CAPECISP — cisplatin 80 mg/m2 IV day 1, capecitabine 1,000 mg/m2 orally twice daily on day 1 to day 14 of each 21-day treatment cycle.27 |
Serious adverse effects or safety issues | Pembrolizumab in combination with chemotherapy: Fatigue and/or asthenia, nausea, constipation, diarrhea, decreased appetite, rash, vomiting, cough, dyspnea, pyrexia, alopecia, peripheral neuropathy, mucosal inflammation, stomatitis, headache, weight loss, abdominal pain, arthralgia, myalgia, and insomnia. Trastuzumab: Life-threatening infusion-related reactions, MSK pain, hot flashes, headache, fatigue, cough, dyspnea. Chemotherapy: Hair loss, nausea, vomiting, anemia, bone loss, constipation, diarrhea, fatigue, depression, anxiety, hand-foot syndrome, low platelet count, low WBC count, mouth problems. | Trastuzumab: Life-threatening infusion-related reactions, MSK pain, hot flashes, headache, fatigue, cough, dyspnea. Chemotherapy: Hair loss, nausea, vomiting, anemia, bone loss, constipation, diarrhea, fatigue, depression, anxiety, hand-foot syndrome, low platelet count, low WBC count, mouth problems. |
Other | Pembrolizumab: Warnings and precautions for immune-mediate adverse reactions and infusion-related reactions. Trastuzumab: Caution and/or warning in patients with preexisting pulmonary disease, extensive pulmonary tumour, previous history of chemo or radiation therapies known to cause pulmonary toxicities, dyspnea at rest, (uncontrolled) hypertension. | Trastuzumab: Caution and/or warning in patients with preexisting pulmonary disease, extensive pulmonary tumour, previous history of chemo or radiation therapies known to cause pulmonary toxicities, dyspnea at rest, (uncontrolled) hypertension. |
5-FU = 5-fluorouracil; CAPECISP = capecitabine and cisplatin; CAPOX = capecitabine and oxaliplatin; CISPFU = cisplatin and fluorouracil; CPS = combined positive score; FOLFOX = fluorouracil plus leucovorin plus oxaliplatin;; GEJ = gastroesophageal junction; MSK = musculoskeletal; PD-1 = program cell death 1 protein; PD-L1 = programmed death 1 ligand 1; SOC = standard of care; WBC = white blood cell.
aHealth Canada–approved indication.
bAn alternative dosage of trastuzumab 6 mg/kg loading dose and then 4 mg/kg maintenance dose IV every 2 weeks may also be used in clinical practice.28
cFOLFOX and CAPECISP regimens were assumed by the sponsor to have the same efficacy and safety as CAPOX and CISPFU.
Sources: Sponsor’s Summary of Clinical Evidence,65 Cancer Care Ontario,27,28,53,64 and product monographs for pembrolizumab (draft)31 and trastuzumab.66
Stakeholder Perspectives
Patient Group Input
This section was prepared by the CDA-AMC review team based on the input provided by patient groups. The full original patient input(s) received by CDA-AMC have been included in the Stakeholder section of this report.
Patient group input was submitted by 1 patient advocacy group — My Gut Feeling – Stomach Cancer Foundation of Canada — which is a nonprofit organization that provides support, awareness, education, information, and advocacy to patients living with gastric, GEJ, and esophageal cancers, as well as to survivors and caregivers. Patient input was collected from an international online survey conducted from November 10 to 24, 2023, and included responses from 40 (77.5%) patients and caregivers (22.5%). Of those who responded, 72.5% were from Canada and 15.5% had HER2-positive disease.
All patients who responded to survey experienced at least 1 symptom before diagnosis, the most common being changes in weight loss (57.5%), reflux (55%), appetite changes (50%), pain (47.5%), nausea and/or vomiting (37.5%), and difficulty swallowing (25%). Most patients (95%) reported that their cancer diagnosis had a significant impact on their QoL, physical and mental health, ability to eat and work, finances, social life, identity, and personal image. Psychosocial impacts such as anxiety, depression, sleep loss, feeling crippled, anticipatory grief, and loss of control were cited by 1 patient. Caregivers and family members who responded to the survey also reported being impacted by the cancer diagnosis, and cited feelings of hopelessness (especially with metastatic disease), stress from the impact of chemotherapy-induced side effects that caused stress to other family members, and changes to family dynamics that led to children requiring counselling. Other disease-related or treatment-related concerns reported by both patients and caregivers included loss of fertility, feeling isolated, financial difficulty, as well as financial and geographical barriers to accessing treatment, health care providers, and information. All patients who completed the survey experienced at least 1 side effect. The most commonly reported treatment-related side effects included fatigue (87.5%), appetite changes (77.5%), alopecia (75.0%), taste changes (75%), weight loss (70%), and neuropathy (70%). Approximately 16% of patients reported discontinuing treatment due to an AE that resulted in hospitalization. Patients and caregivers who completed the survey indicated that the following outcomes were important when considering new treatments: improved survival, remission, shrinking of cancer, improved symptoms, tolerability, and improved QoL. Patients and caregivers added that equitable access, convenience of administration (e.g., oral versus IV, less frequent travel to hospital, shorter chair time to receive treatment), and more options from which to choose based on their values and preferences were important. Finally, survey responders from Canada emphasized that biomarker testing should be accessible at the onset of their disease in all centres and provinces.
Clinician Input
Input From Clinical Experts Consulted by CDA-AMC
All review teams include at least 1 clinical specialist with expertise regarding the diagnosis and management of the condition for which the drug is indicated. Clinical experts are a critical part of the review team and are involved in all phases of the review process (e.g., providing guidance on the development of the review protocol, assisting in the critical appraisal of clinical evidence, interpreting the clinical relevance of the results, and providing guidance on the potential place in therapy). The following input was provided by 2 clinical specialists with expertise in the diagnosis and management of gastric cancer or GEJ adenocarcinoma.
Unmet Needs
The clinical experts we consulted for the purpose of this review emphasized that locally advanced and metastatic HER2-positive gastroesophageal cancer is associated with considerable unmet needs. Based on input from the clinical experts, treatment with trastuzumab combined with chemotherapy is the only available first-line option for locally advanced, metastatic HER2-positive gastroesophageal cancer; however, OS outcomes remain unacceptably poor (median OS = 13.8 months).
Place in Therapy
Both clinical experts suggested that, per the KEYNOTE 811 clinical trial, pembrolizumab would be added to the current SOC first-line therapy (trastuzumab combined with platinum doublet chemotherapy) for patients with locally advanced and metastatic HER2-positive gastroesophageal cancer. This combination — pembrolizumab combined with trastuzumab and platinum doublet chemotherapy — would represent a new first-line SOC treatment for this patient population. The clinical experts noted that if approved for funding, the addition of pembrolizumab would represent a new and potentially effective treatment option in the management of locally advanced and metastatic HER2-positive gastroesophageal cancer, which has not occurred in more than 13 years.
Patient Population
Although patients were eligible to enrol in the KEYNOTE-811 trial regardless of PD-L1 status, as measured by CPS, the prespecified subgroup analysis showed that the benefit of adding pembrolizumab to SOC was attributable to the subgroup of patients with a PD-L1 CPS of 1 or more (85% of the population). A clear benefit was not observed in the subgroup of patients with a PD-L1 CPS of less than 1, which included a small number of patients. The clinical experts we consulted opined that the addition of pembrolizumab to first-line treatment for locally advanced and metastatic HER2-positive gastroesophageal cancer should be limited to patients with a PD-L1 CPS of 1 or more. As suggested by the clinical experts, CPS testing should be performed with a validated test. The clinical experts noted that, to the best of their knowledge, the PD-L1 1HC 22C3 pharmDx from Agilent is currently the only FDA companion diagnostic test approved to determine CPS for use with pembrolizumab in patients with advanced gastric cancer.
Assessing the Response Treatment
The clinical experts listed the 3 factors, in descending order of clinical importance, used to determine response to treatment: patient-reported symptoms and side effects; cross-sectional imaging (CT scans or MRI); and tumour markers, such as CEA and carbohydrate antigen 19-9 (CA 19-9). The clinical experts suggested that patients should be assessed by a clinician after every 2 to 3 cycles of treatment. Clinician assessment may occur more frequently if a patient reports the occurrence of bothersome symptoms or side effects. The clinical experts suggested that patients should undergo CT scans every 2 to 3 months. Tumour markers can be used, per clinical judgment, to supplement a fulsome patient assessment. The clinical experts noted that the only truly clinically meaningful end points across all oncology types are OS and QoL. The clinical experts added that all other end points (e.g., response rate, CEA response, PFS) should be considered surrogates, and are of little relevance if they do not predict improved OS or QoL.
Discontinuing Treatment
The clinical experts suggested that the decision to discontinue treatment with pembrolizumab should be based on patient-reported symptoms, patient preference, side effects, and well-being, in combination with assessment of treatment response and disease progression, either radiologic or clinical. The clinical experts added that treatment with pembrolizumab should be discontinued in the event of a life-threatening immune-related AEs (in accordance with clinical practice guidelines).32
Prescribing Considerations
The clinical experts suggested that pembrolizumab should only be prescribed by or under the supervision of a practitioner in medical oncology with expertise in the management of immunotherapy side effects. The clinical experts noted that immunotherapy and trastuzumab are currently delivered as SOC in all oncology centres. Accordingly, these therapies, with the addition of pembrolizumab, can be safely administered in all centres approved for oncology care.
Clinician Group Input
This section was prepared by the CDA-AMC review team based on the input provided by clinician groups. The full original clinician group inputs received by CDA-AMC have been included in the this of the report.
Clinician group input was submitted by the CGOEN and OH-CCO GI DAC. The CGOEN is a virtual and inclusive network of Canadian GI oncology clinicians who contribute to the knowledge base of GI cancer and its treatments. The OH-CCO GI DAC provides guidance on drug-related issues in support of CCO’s mandate, including Provincial Drug Reimbursement Programs. Input provided by the CGOEN and the OH-CCO GI DAC collated the responses of 8 and 2 clinicians, respectively.
The clinical groups noted that the are currently limited treatment options for patients with HER2-positive gastric or GEJ cancers, with poor outcomes. The clinician from CGOEN noted that the treatment of HER2-positive gastric cancer has not improved in more than a decade and that immunotherapy is currently only available for patients with HER2-negative disease. Based on the input from the OH-CCO GI DAC, prolonging OS is the main treatment goal for this patient population. According to input from the CGOEN, patients best suited for treatment with pembrolizumab are those with a PD-L1 CPS of 1 or more, as determined by a validated test. Input from the CGOEN indicates that response to treatment should be based on routine imaging (during timed intervals for objective assessment), as well as on patient preference, tolerability, and QoL. Both clinician groups suggested that patients should be evaluated on a regular basis for clinical response and toxicity, per current treatment standards. Both clinician groups agreed that the decision to continue or discontinue treatment with pembrolizumab should be based on patient preference, side effects (including life-threatening immune-related AEs), radiologic or clinical disease progression or treatment response, and patient-reported symptoms and well-being. Although input from the CGOEN suggested that pembrolizumab should be administered in oncology centres, the clinical experts we consulted noted that pembrolizumab could be safely administered in a hospital or an outpatient clinic.
Drug Program Input
The drug programs provide input on each drug being reviewed through our reimbursement review processes by identifying issues that may impact their ability to implement a recommendation. The implementation questions and corresponding responses from the clinical experts we consulted are summarized in Table 4.
Table 4: Summary of Drug Plan Input and Clinical Expert Response
Drug program implementation questions | Clinical expert response |
|---|---|
Relevant comparators | |
The most commonly used regimen for this patient population is trastuzumab in combination with cisplatin plus fluoropyrimidine (infusion with 5-FU or capecitabine). Other regimens used in combination with trastuzumab include FOLFOX, CAPOX, and carboplatin with fluoropyrimidine). The comparators in the study (trastuzumab plus cisplatin and 5-FU or trastuzumab plus CAPOX) are funded in most provinces as a first-line option.
| The clinical experts expect the results from the KEYNOTE-811 trial to be generalizable to other first-time chemotherapy combinations. |
Considerations for initiation of therapy | |
PAG would like to confirm that HER2-positive means HER2 3+ on IHC or HER2 2+ on IHC but positive on FISH. | The clinical experts confirmed that HER2-positive cancer is either:
or
as applied in the KEYNOTE-811 study. |
Currently, patients without HER2 overexpression who receive nivolumab in the adjuvant setting (esophageal or GEJ) are eligible for downstream PD-1 or PD-L1 inhibitors, provided that disease recurrence occurs more than 6 months after the last dose of adjuvant PD-1 or PD-L1 inhibitors.
| The clinical experts agreed that patients with HER2-positive gastric or GEJ adenocarcinoma who receive nivolumab in the adjuvant setting and in whom recurrence occurs more than 6 months after the last dose of adjuvant nivolumab can be eligible to receive pembrolizumab in the first-line metastatic setting. |
The requested duration of treatment for pembrolizumab is until disease progression, unacceptable toxicity, or for up to 24 months (35 cycles administered every 3 weeks), whichever is longer, in patients without disease progression.
| The clinical experts suggested that re-treatment with pembrolizumab in patients with HER2-positive gastric or GEJ adenocarcinoma should be consistent with other indications for pembrolizumab. Accordingly, the clinical experts agreed that:
|
Should patients with CNS metastases be eligible for pembrolizumab plus trastuzumab and chemotherapy? | The clinical experts agreed that patients with stable CNS metastases should be eligible for treatment with pembrolizumab in combination with trastuzumab and chemotherapy, per the KEYNOTE-811 eligibility criteria, in which patients with previously treated brain metastases were eligible to participate in the trial, provided they were radiologically stable (i.e., without evidence of progression for at least 4 weeks on repeat imaging, and the repeat imaging should be performed during study screening), clinically stable, and did not require steroid treatment for at least 14 days before the first dose of study treatment. It is also reasonable to consider the inclusion of patients with treated, stable CNS disease. |
Considerations for discontinuation of therapy | |
If there is disease progression during a treatment break, can pembrolizumab and trastuzumab therapy be resumed? | Based on the clinical expert input, therapy with pembrolizumab and trastuzumab with or without chemotherapy may be resumed in the event of diseases progression during a treatment break. |
If a patient cannot tolerate 1 of the components of the treatment (i.e., pembrolizumab, trastuzumab, or chemotherapy), are they able to continue with the remaining components? | In the event a patient cannot tolerate 1 of the components of treatment (i.e., pembrolizumab, trastuzumab, or chemotherapy), the clinical experts agree that the decision to continue treatment with the remaining components should be left to the discretion of the physician most responsible. |
Is there a minimum number of chemotherapy cycles and trastuzumab that must be given concurrently with pembrolizumab? | The clinical experts noted that patients should undergo at least 1 cycle of chemotherapy and trastuzumab concurrent with pembrolizumab. |
Considerations for prescribing of therapy | |
For consistency, jurisdictions would plan on implementing pembrolizumab as weight-based dosing up to a cap (e.g., 2 mg/kg every 3 weeks to a maximum dose of 200 mg, or 4 mg/kg every 6 weeks to a maximum of 400 mg), as with other indications. | Comment from the drug programs to inform pERC deliberations. |
Generalizability | |
The populations of interest match the indication but the data are insufficient.
| Input from the clinical experts suggest that:
|
There is a time-limited need to allow patients currently on platinum plus fluoropyrimidine-based chemotherapy, or alternate chemotherapy, to add pembrolizumab.
| The clinical experts noted that the addition of pembrolizumab to the current treatment regimen is appropriate for those who are on or who have recently discontinued chemotherapy, as along as there has been no disease progression. For patients who have already initiated chemotherapy, pembrolizumab and trastuzumab can be added to the treatment regimen once HER2-positive and PD-L1 CPS status is confirmed. |
Funding algorithm (oncology only) | |
Consideration should be given to updating the existing algorithm to include HER2-positive disease. | Comment from the drug programs to inform pERC deliberations. |
Care provision issues | |
PD-L1 CPS testing needs to be operationalized and funded in some jurisdictions on or before pembrolizumab implementation. | Comment from the drug programs to inform pERC deliberations. |
System and economic issues | |
Trastuzumab biosimilars have confidential net prices. | Comment from the drug programs to inform pERC deliberations. |
Trastuzumab in this combination will be a biosimilar trastuzumab. | Comment from the drug programs to inform pERC deliberations. |
5-FU = fluorouracil; CAPOX = capecitabine and oxaliplatin; CNS = central nervous system; CPS = combined positive score; ECOG PS = Eastern Cooperative Oncology Group Performance Status; FISH = fluorescence in situ hybridization; FOLFOX = leucovorin calcium (folinic acid), fluorouracil, and oxaliplatin; GEJ = gastroesophageal junction; IHC = immunohistochemistry; ISH = in situ hybridization; PAG = Provincial Advisory Group; PD-1 = programmed cell death 1 protein; PD-L1 = programmed cell death 1 ligand 1; pERC = pan-Canadian Oncology Drug Review Expert Review Committee.
Clinical Evidence
The objective of this Clinical Review Report is to review and critically appraise the clinical evidence submitted by the sponsor on the beneficial and harmful effects of pembrolizumab 100 mg in 4 mL solution for infusion in combination with trastuzumab, fluoropyrimidine and platinum-containing chemotherapy in the first-line treatment of locally advanced unresectable or metastatic HER2-positive gastric or GEJ adenocarcinoma in adult patients whose tumours express PD-L1 (CPS ≥ 1) as determined by a validated test. The focus will be placed on comparing pembrolizumab in combination with trastuzumab, fluoropyrimidine and platinum-containing chemotherapy to relevant comparators and identifying gaps in the current evidence.
A summary of the clinical evidence included by the sponsor in the review of pembrolizumab is presented in 4 sections, with our critical appraisal of the evidence included at the end of each section. The first section, the Systematic Review, includes pivotal studies and RCTs that were selected in accordance with the sponsor’s systematic review protocol. Our assessment of the certainty of the evidence in the first section, using the GRADE approach, follows the critical appraisal of the evidence. Section 3 includes discussion of a feasibility appraisal for an indirect comparison to other fluoropyrimidine- and platinum-containing chemotherapies used in combination with trastuzumab in Canada. There were no long-term extension studies (section 2) or additional studies that addressed important gaps in the systematic review evidence (section 4) submitted by the sponsor.
Included Studies
Clinical evidence from the following is included in the CDA-AMC review and appraised in this document:
1 pivotal study or RCT identified in the systematic review (KEYNOTE-811)43
1 feasibility appraisal for an indirect comparison.67
Systematic Review
The contents of this section have been informed by materials submitted by the sponsor. The following have been summarized and validated by the CDA-AMC review team.
Description of Study
The characteristics of the included study are summarized in Table 5.
Table 5: Details of the Study Included in the Systematic Review
Detail | KEYNOTE-811 |
|---|---|
Designs and populations | |
Study design | Multicentre, parallel-group, double-blind, placebo- and active-controlled, phase III RCT |
Locations | 192 sites in 20 countries in North American, South American, Europe, Asia, and Oceania (including Australia); there were no trial sites in Canada |
Patient enrolment dates | Start date: October 5, 2018 End date: June 17, 2020 |
Randomized (N) | N = 698
PD-L1 CPS ≥ 1 subgroup N = 558
|
Inclusion criteria |
|
Exclusion criteria |
|
Drugs | |
Intervention | Pembrolizumab: 200 mg IV on day 1 of each 3-week cycle for up to 35 cycles AND Trastuzumab: 8 mg/kg (loading dose), then 6 mg/kg IV (maintenance dose) on day 1 of each 3-week cycle for up to 35 cycles In combination with: 5-FU — 800 mg/m2 IV on day 1 to day 5 of each 3-week cycle for up to 35 cycles AND Cisplatin — 80 mg/m2 IV on day 1 of each 3-week cycle for up to 35 cycles (may be capped at 6 cycles, per local country guidelines) OR Capecitabine — 1,000 mg/m2 orally twice daily on day 1 to day 14 of each 3-week cycle for up to 35 cycles AND Oxaliplatin — 130 mg/m2 IV on day 1 of each 3-week cycle for up to 35 cycles (may be capped at 6 to 8 cycles, per local country guidelines) |
Comparators | Placebo: IV on day 1 of each 3-week cycle for up to 35 cycles AND Trastuzumab: 8 mg/kg (loading dose), then 6 mg/kg IV (maintenance dose) on day 1 of each 3-week cycle for up to 35 cycles In combination with the same combination therapies as used in the intervention group |
Study duration | |
Screening phase | Approximately 28 days |
Treatment phase | Up to 35 cycles (approximately 2 years) or until disease progression, unacceptable toxic effects, investigator decision, or participant withdrawal of consent |
Follow-up phase | Follow-up: Imaging every 6 weeks (± 7 days) until disease progression to monitor disease status. Survival follow-up: Every 12 weeks (± 14 days) to assess for survival status until death, explicit withdrawal of consent for survival follow-up, or the end of the study, whichever occurs first Safety follow-up: Approximately 30 days after the last dose of the study treatment or before the initiation of a new anticancer treatment, whichever comes first Patient-reported outcomes follow-up: At cycle 1, cycle 2, cycle 3, cycle 4, and cycle 5 and every 2 cycles thereafter (e.g., cycle 7, cycle 9, cycle 11) for up to a year or the end of treatment, whichever comes first, and during the follow-up visit 30 days after treatment discontinuation |
Outcomes | |
Primary end points |
|
Secondary and exploratory end points | Secondary:
Exploratory:
|
Data cut-off dates | |
IA1 | June 17, 2020 |
IA2 | May 25, 2022 |
IA3 | March 29, 2023 |
Final analysis | To be conducted |
Publication status | |
Publications | |
5-FU = fluorouracil; BICR = blinded independent central review; CNS = central nervous system; CPS = combined positive score; ECG = electrocardiogram; ECHO = echocardiogram; ECOG PS = Eastern Cooperative Oncology Group Performance Status; EORTC QLQ-C30 = European Organisation for Research and Treatment of Cancer Quality of Life Questionnaire Core 30; EORTC QLQ-STO22 = European Organisation for Research and Treatment of Cancer Quality of Life Questionnaire Stomach Cancer Module; EQ-5D-L = 5-Level EQ-5D; FISH = fluorescence in situ hybridization; GEJ = gastroesophageal junction; IA = interim analysis; IHC = immunohistochemistry; iRECIST = immune Response Evaluation Criteria in Solid Tumours; ISH = in situ hybridization; MUGA = multigated acquisition scan; ORR = overall response rate; PD-1 = programmed cell death 1 protein; PD-L1 = programmed cell death 1 ligand 1; PD-L2 = programmed cell death 1 ligand 2; RECIST 1.1 = Response Evaluation Criteria in Solid Tumours Version 1.1; SOC = standard of care.
Notes: Participants had the option to receive up to 1 additional year of trastuzumab and capecitabine or 5-FU beyond the 35 administrations of pembrolizumab or placebo at the discretion of the investigator and after sponsor consultation.
One additional report was included (Health Canada Reviewers Report).
Sources: Clinical Study Report for KEYNOTE 811.43 Details included in the table are from the sponsor’s Summary of Clinical Evidence.
One sponsor-conducted trial was included in the systematic review: KEYNOTE-811.43 The KEYNOTE-811 trial (NCT03615326) is an ongoing, multicentre, placebo-controlled, double-blind, phase III, RCT evaluating the efficacy and safety of pembrolizumab added to SOC therapy with trastuzumab and platinum-fluoropyrimidine doublet chemotherapy as first-line therapy for HER2-positive advanced gastric or GEJ cancer in adult patients.
A total of 698 patients with previously untreated, locally advanced, unresectable or metastatic HER2-positive (central review), histologically or cytologically confirmed adenocarcinoma of the stomach or GEJ across 92 sites in 19 countries (North America, South America, Europe, Asia, and Oceania) were included in the trial. There were no clinical trial sites in Canada. HER2 status was confirmed at a central laboratory using the FDA-approved Dako (Agilent) HercepTest (IHC) and Dako (Agilent) HER2 IQFISH pharmDx kit (reflex FISH testing for HER2 IHC 2+ samples).33 Patients were randomly allocated in a 1:1 ratio to receive treatment with either pembrolizumab (200 mg every 3 weeks) or placebo, each in combination with SOC therapy (trastuzumab plus CISPFU or CAPOX). Randomization was performed centrally, using an interactive response technology system, and was stratified by geographic region (Australia, Europe, Israel, and North America versus Asia versus rest of the world), investigator’s choice of chemotherapy regimen (CISPFU versus CAPOX), and PD-L1 expression at baseline (CPS ≥ 1 versus < 1). PD-L1 expression was determined at a central laboratory using the Agilent PD-L1 IHC 22C3 pharmDx kit.34 Pembrolizumab and placebo were prepared and dispensed in a blinded fashion by an unblinded pharmacist or by unblinded qualified study-site personnel. All patients and investigators involved in the administration or evaluation of the study treatment were unaware of group assignments. The expected study completion date is December 2024.
The KEYNOTE-811 trial met the protocol-defined criterion of success (1-sided alpha-level for testing was 0.0013) at IA2 (data cut-off date: May 25, 2022) in which the stratified HR for PFS was 0.72 (95% CI, 0.60 to 0.87; P = 0.0002) in favour of pembrolizumab plus SOC (median, 10.0 months; 95% CI, 8.6 to 11.7 months) versus placebo and SOC (median, 8.1 months; 95% CI, 7.0 to 8.5 months). A prespecified subgroup analysis noted that the treatment effect of pembrolizumab plus SOC on PFS, compared to placebo plus SOC, was attributable to the subgroup of patients with a PD-L1 CPS of 1 or more, who made up 85.1% of the population. A clear benefit was not observed in the subgroup of patients with a PD-L1 CPS of less than 1, which included relatively few patients (Appendix 1; Figure 5). Among patients with PD-L1–positive disease, PFS was statistically longer in the pembrolizumab plus SOC group than in the placebo plus SOC group (HR, 0.70; 95% CI, 0.58 to 0.85). Based on analyses conducted at IA2, the sponsor proposed that the indication population be limited to patients with PD-L1–positive disease.
A schematic of the KEYNOTE-811 study design is presented in Figure 2. The results presented here are fromIA2, with a data cut-off date of May 25, 2022, and IA3, with a data cut-off date of March 29, 2023.
Figure 2: Schematic of the KEYNOTE-811 Clinical Trial Design
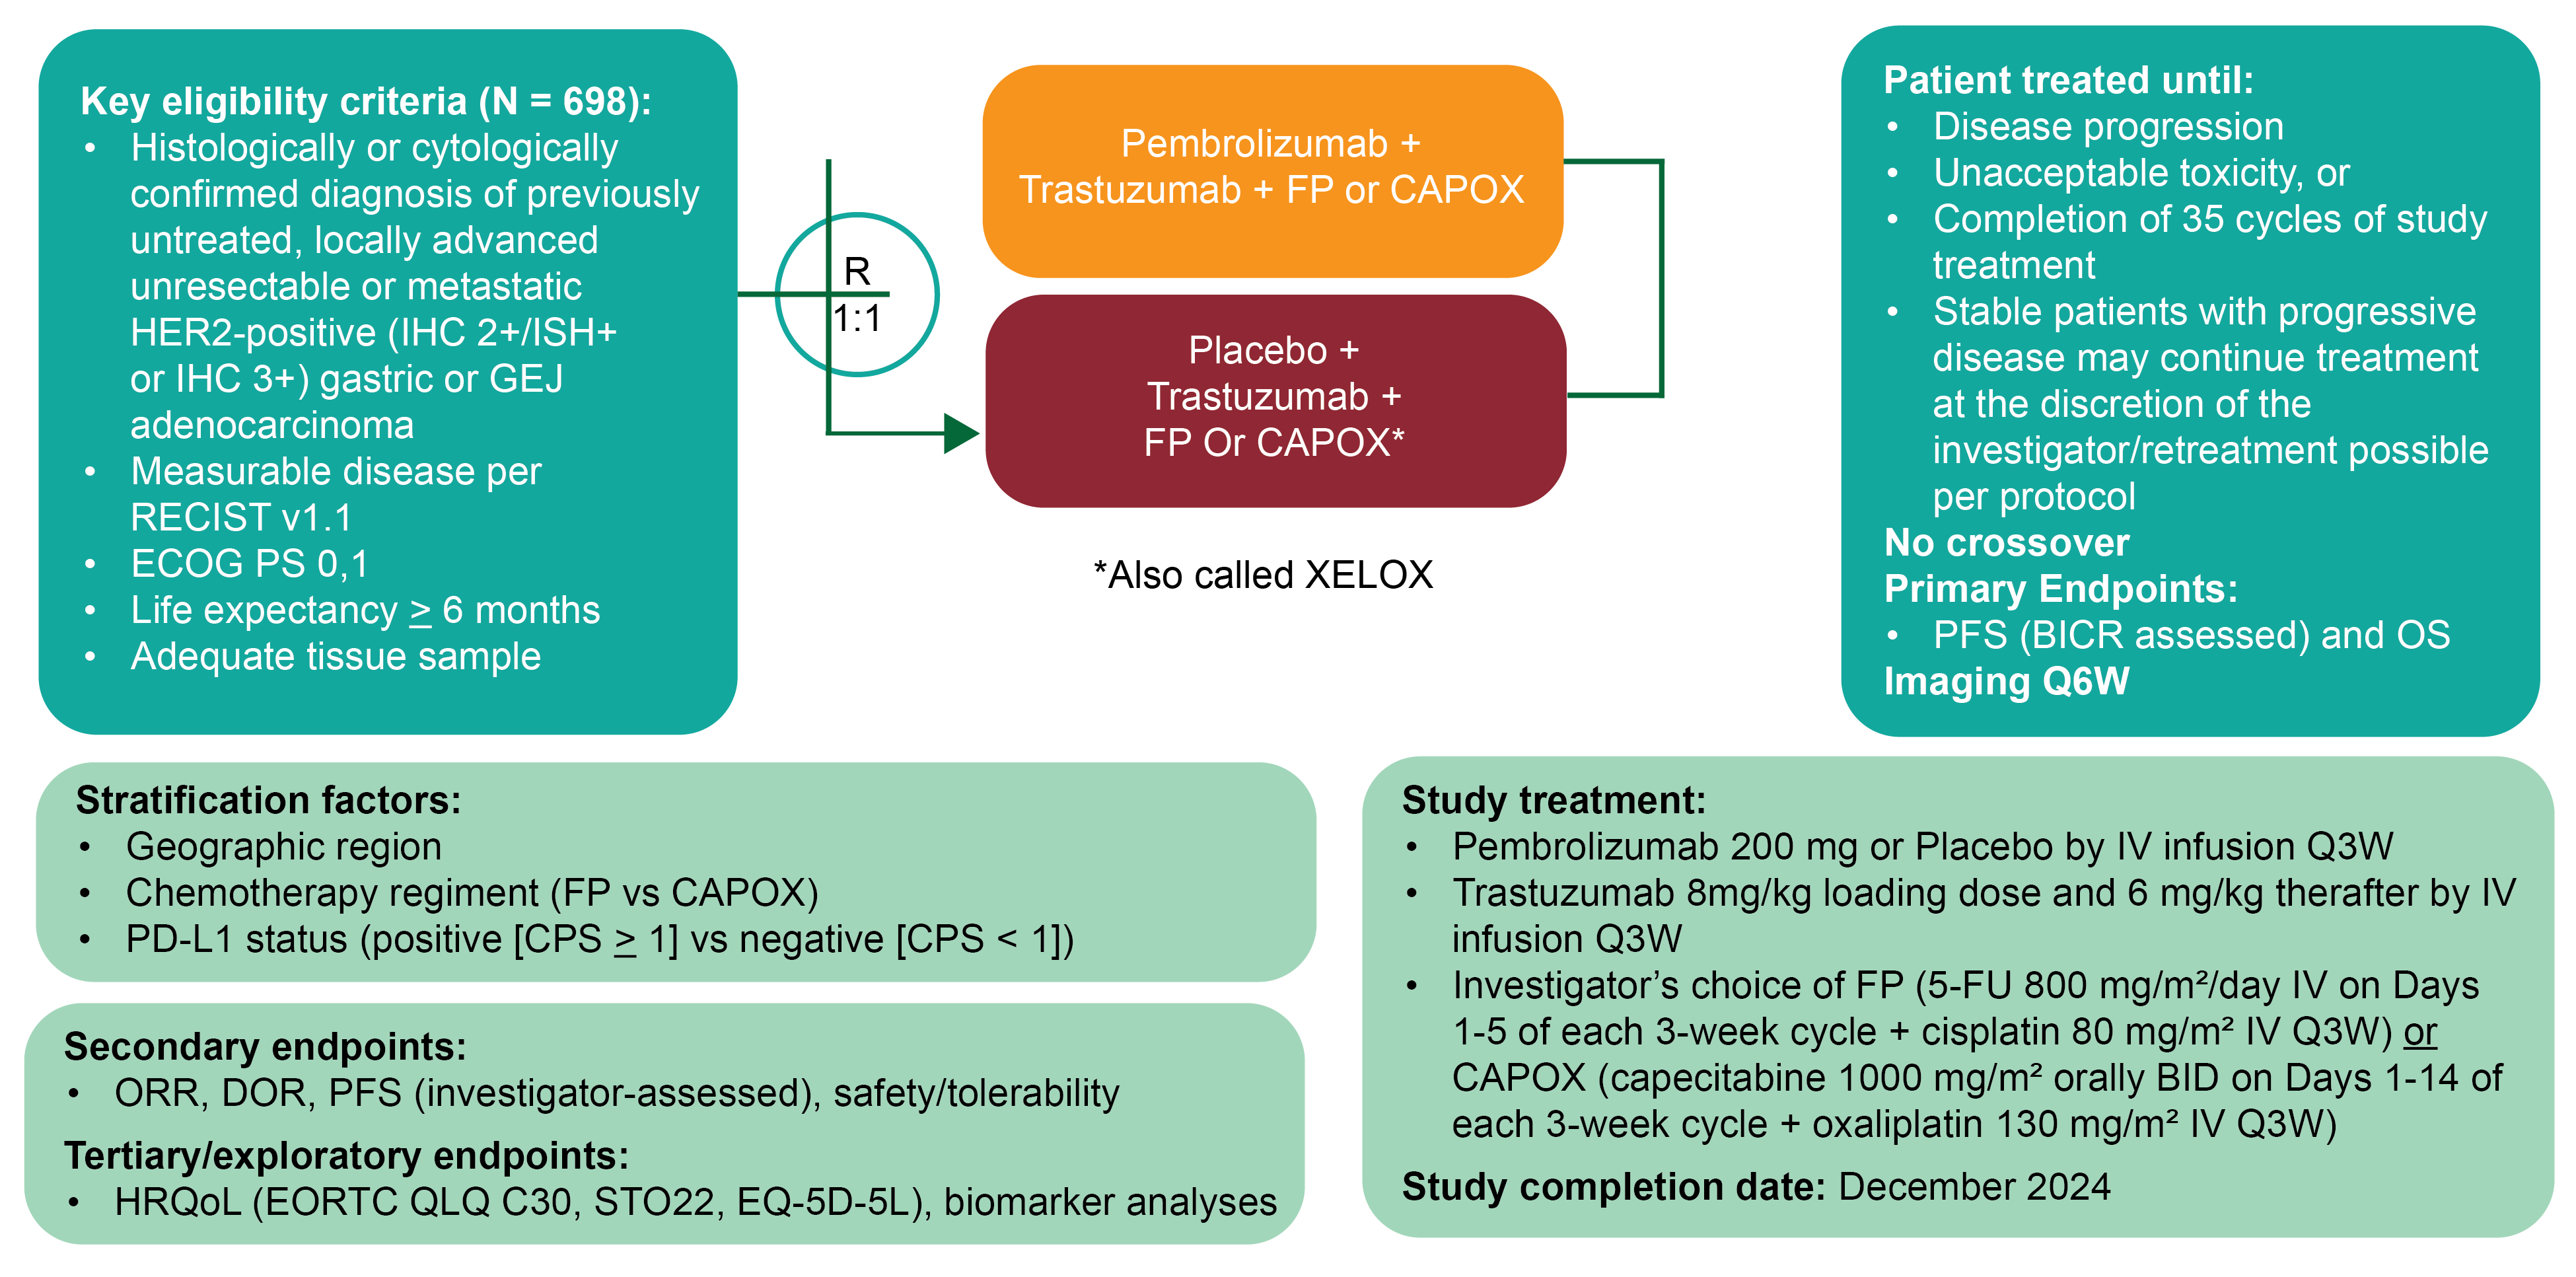
5-FU = 5-fluorouracil; BICR = blinded independent central review; BID = twice daily; CAPOX = capecitabine plus oxaliplatin; CISPFU = cisplatin and 5-FU; CPS = combined positive score; DOR = duration of response; ECOG PS = Eastern Cooperative Oncology Group Performance Status; EORTC QLQ C30 = European Organisation for Research and Treatment of Cancer Quality of Life Questionnaire Core 30; EQ-5D-5L = 5-Level EQ-5D; GEJ = gastroesophageal junction; HRQoL = health-related quality of life; IHC = immunohistochemistry; ISH = in situ hybridization; ORR = overall response rate; OS = overall survival; PD-L1 = programmed cell death 1 ligand 1; PFS = progression-free survival; Q3W = every 3 weeks; Q6W = every 6 weeks; R = randomization; RECIST v1.1 = Response Evaluation Criteria in Solid Tumours Version 1.1; STO22 = European Organisation for Research and Treatment of Cancer Quality of Life Questionnaire Quality of Life Questionnaire Stomach Cancer Module.
Source: Clinical Study Report for KEYNOTE 811.43
Protocol Amendments
The protocol for the KEYNOTE-811 trial was amended 8 times. The original trial protocol required randomization to be stratified by geographic location, ECOG PS, and chemotherapy before randomization. After discussion with the FDA, stratification by ECOG PS was removed and stratification by PD-L1 expression was added to the protocol (Amendment 1; Protocol 811-01). Protocol 811-01 was finalized on May 31, 2018, and was the initial protocol submitted to the FDA, European Union member states, and all other countries that participated in the KEYNOTE-811 trial. Subgroup analysis based on MSI status was also added to the statistical analysis plan at the time of Amendment 1. At the time of Amendment 5 (Protocol 811-05), the statistical analysis plan was amended to modify the PFS censoring rules associated with curative surgical resection and to remove the ORR futility analysis for IA1. Protocol Amendment 8 (Protocol 811-08) updated the statistical analysis plan to allow for flexibility of the timing of the interim and final efficacy analyses in the case of significantly slower than anticipated accrual of PFS and/or OS events. Other amendments included mostly administrative changes, clarifications, and response to regulatory input regarding safety monitoring procedures.
Populations
Inclusion and Exclusion Criteria
The key inclusion and exclusion criteria for the KEYNOTE-811 trial are summarized in Table 5. Briefly, patients eligible for inclusion in the trial were adult patients 18 years or older with previously untreated, locally advanced, unresectable or metastatic HER2-positive (central review), and histologically or cytologically confirmed adenocarcinoma of the stomach or GEJ. HER2-positive cancer was defined as either IHC 3+ or IHC 2+ in combination with in situ hybridization (ISH)+ (or FISH), assessed by central review of the primary or metastatic tumour. Additional eligibility criteria required patients to have measurable disease, according to RECIST 1.1, an ECOG PS of 0 or 1, an expected life expectancy of more than 6 months, and a tumour sample for PD-L1 and MSI testing.
The study population of interest for the purpose of this clinical report is the subgroup of patients with PD-L1–positive disease, per the Health Canada indication and reimbursement request.
Interventions
Investigational Product
Pembrolizumab
Patients randomized to the treatment group received pembrolizumab 200 mg by IV infusion on day 1 of each 3-week cycle in combination with SOC treatment with an IV trastuzumab 8 mg/kg loading dose administered over 90 minutes and then an IV 6 mg/kg maintenance dose administered over 30 to 60 minutes every 3 weeks; and investigator’s choice of a fluoropyrimidine- containing chemotherapy and platinum-containing chemotherapy backbone, of either:
CISPFU — cisplatin 80 mg/m2 IV over 60 minutes on day 1 of each 21-day treatment cycle (every 3 weeks) plus 5-FU 800 mg/m2 per day IV over 120 hours from day 1 to day 5 of each 21-day treatment cycle
CAPOX — oxaliplatin 130 mg/m2 IV over 120 minutes on day 1 of each 21-day treatment cycle (every 3 weeks) plus capecitabine 1,000 mg/m2 administered orally twice a day on day 1 to day 14 of each 21-day treatment cycle.
Pembrolizumab was administered before trastuzumab and chemotherapy when given on the same day.
Both pembrolizumab and trastuzumab were administered until disease progression, completion of 2 years (35 cycles administered every 3 weeks), or intolerance. Participants who had evidence of disease progression on imaging and were clinically stable could continue to be treated at the discretion of the investigator. If toxicity occurred and was clearly attributed to 1 drug, that drug alone could be discontinued.
Patients had the option of receiving up to 1 additional year of trastuzumab and capecitabine or 5-FU after 35 administrations of pembrolizumab (200 mg every 3 weeks) at the investigator’s discretion. Patients who stopped pembrolizumab treatment after 35 administrations for reasons other than disease progression or intolerability, and participants who achieved a complete response and stopped pembrolizumab treatment, could be eligible for up to 1 year of pembrolizumab re-treatment (17 cycles of 200 mg every 3 week) upon disease progression, if they had been randomized to the pembrolizumab arm (termed the second-course phase).
The duration of cisplatin treatment could be capped at 6 cycles and the duration of oxaliplatin at 6 to 8 cycles, per institutional guidelines and/or protocols.
Placebo
Patients randomized to the control group received a saline placebo infusion on day 1 of each 3-week cycle in combination with SOC treatment with trastuzumab and investigator’s choice of fluoropyrimidine- and platinum-containing chemotherapy backbone, as described in the preceding section.
Dose Modification and Interruption
Dose reductions of pembrolizumab and trastuzumab were not permitted; however, treatment with either could be interrupted or discontinued due to toxicity. In the event that pembrolizumab and/or trastuzumab interruption or discontinuation was warranted, the process was conducted in accordance with the recommended dose modification procedures outlined in the product monograph.
Dose modification of the other combination drugs was permitted under the following considerations:
Treatment for each new cycle may be delayed if the scheduled off-drug periods were not adequate to allow for recovery to the guideline criteria for restarting each study treatment.
If a dose reduction for toxicity occurs with any drug, the dose may not be re-escalated.
Patients can have a maximum of 3 dose modifications to oxaliplatin, 5-FU, and cisplatin throughout the course of the study. If a patient experiences several toxicities and there are conflicting recommendations, the most conservative dose adjustment recommended (dose reduction appropriate to the most severe toxicity) was followed.
Reduction of 1 chemotherapy drug and not the other drug is appropriate if, in the opinion of the investigator, the toxicity was clearly related to 1 of the treatments. If, in the opinion of the investigator, the toxicity was related to the combination of both chemotherapy drugs, both drugs may be reduced in accordance with recommended dose modifications. If the toxicity was related to the combination of 3 drugs, chemotherapy may be reduced, interrupted, or discontinued.
Both study groups may have trastuzumab and/or the chemotherapy discontinued and continue to receive pembrolizumab or saline placebo.
Concomitant Medications and Therapies
All treatments that the investigator considers necessary for a patient’s welfare were administered at the discretion of the investigator, in keeping with the community standards of medical care.
Prohibited Concomitant Medications
The following concomitant medications were prohibited during the study period:
anticancer immunotherapy, chemotherapy, or biological therapy not specified in this protocol
investigational drugs other than pembrolizumab
radiotherapy
live vaccines administered in the 30 days before the first dose of study treatment during study participation
systemic glucocorticoids for any purpose other than to modulate symptoms from an event of clinical interest that is suspected to have an immunologic etiology; inhaled or topical steroids were allowed, as were systemic steroids at doses equal to or less than 10 mg/day of prednisone or equivalent
brivudine, sorivudine analogues, and other inhibitors of the enzyme dihydropyrimidine dehydrogenase for patients receiving 5-FU, S-1 (oral fluoropyrimidine), or capecitabine
phenytoin for patients receiving cisplatin therapy.
Patients who, in the assessment of the investigator, required the use of any of the aforementioned treatments for clinical management were removed from the study, unless otherwise specified.
Concomitant Medications to Be Used With Caution
The use of cimetidine, metronidazole, and interferons could be considered with caution, as these may increase levels of 5-FU. Patients receiving phenytoin in conjunction with 5-FU were examined regularly to monitor for potential elevations in phenytoin plasma levels. Hepatotoxic effects (increases in alkaline phosphatase, transaminase, or bilirubin levels) are commonly observed during treatment with 5-FU and levamisole.
Rescue Medications and Supportive Care
Patients were instructed to stay well hydrated while taking cisplatin. For the prevention of nausea and for its treatment, patients taking cisplatin were managed with fosaprepitant 150 mg IV or oral aprepitant (3-day pack) 125 mg on day 1, 80 mg on day 2, and 80 mg on day 3, in combination with palonosetron 0.25 mg IV. In addition, nausea could be managed with ondansetron 8 mg twice a day, or with prochlorperazine 10 mg 3 to 4 times per day.
The use of steroids for cisplatin-associated antiemetic support was allowed in accordance with NCCN or institutional guidelines. However, caution was taken to prevent the overuse of steroids.
All patients received the supportive care measures deemed necessary by the treatment investigator. Supportive care for trastuzumab, 5-FU, capecitabine, and oxaliplatin was administered in accordance with the product label or local SOC.
Subsequent Therapy
There was no per-protocol crossover and no study-specific treatment after the end of the study treatment. However, second-course treatment was permitted under specific circumstances. Patients who had received pembrolizumab and stopped trial treatment with stable disease or better were eligible for up to an additional 17 cycles (approximately 1 year) of pembrolizumab treatment if they progressed after stopping trial treatment from the initial treatment phase. Patients who elected to continue SOC treatment with trastuzumab and chemotherapy beyond 35 cycles were eligible for second-course treatment if they met the re-treatment criteria. To be eligible for re-treatment, patients either:
stopped initial treatment with pembrolizumab after attaining an investigator-determined confirmed complete response based on RECIST 1.1, and were treated with at least 8 cycles of pembrolizumab before discontinuing treatment, and received at least 2 treatments with pembrolizumab beyond the date when the initial complete response was declared
had stable disease; achieved a partial response or complete response, and stopped trial treatment after completion of 35 administrations of pembrolizumab for reasons other than disease progression or intolerability and experienced investigator-determined radiographic disease progression after stopping initial treatment and, upon disease progression, were unblinded and found to have received pembrolizumab, and no new anticancer treatment was administered after the final dose of the trial treatment, and the participants met all of the safety parameters listed in the inclusion criteria and none of the safety parameters listed in the exclusion criteria.
Outcomes
The KEYNOTE-811 trial assessed PFS per RECIST 1.1 by BICR and OS as dual primary efficacy end points. Study success was claimed if superiority for at least 1 of these end points was demonstrated. The secondary end points were ORR and duration of response per RECIST 1.1 by BICR and harms outcomes. Exploratory end points included the following HRQoL measures: EORTC QLQ-C30, EORTC QLQ-STO22, and the EQ-5D-5L.
A list of efficacy end points assessed in this Clinical Review Report is provided in Table 6, followed by descriptions of the outcome measures. Summarized end points are based on outcomes included in the sponsor’s Summary of Clinical Evidence, as well as any outcomes identified as important to this review by the clinical experts we consulted and input from patient and clinician groups and public drug plans. Using the same considerations, the review team selected end points that were considered to be most relevant to the expert committee deliberations and finalized this list of end points in consultation with members of the expert committee. All summarized efficacy end points were assessed using GRADE. Based on input from the clinical experts we consulted, OS was deemed the most clinically meaningful outcome for this patient population. PFS was a dual primary end point in the KEYNOTE-811 trial, and a key input in the sponsor’s pharmacoeconomic model. Accordingly, PFS was included in the clinical report. Patient-reported outcomes that reflected patients’ HRQoL were considered the second most important outcome by the clinical experts we consulted and by both the patient and clinician groups. Based on input from the clinical experts, of the multiple domains captured by the EORTC QLQ-C30, the global QoL scale, the physical functioning scale, and the single-symptom item of appetite loss were most relevant to patients with gastroesophageal cancers and were assessed using GRADE. Results from the EORTC QLQ-STO22 were included in the report as supportive analyses; however, they were not assessed with GRADE. The following notable harms were recognized as important based on the product monograph and by the clinical experts we consulted: immune-mediated AEs, and grade 3 or higher immune-mediated AEs.
Table 6: Outcomes Summarized From the KEYNOTE-811 Trial
Outcome measure | Time point | KEYNOTE-811 |
|---|---|---|
OS | At months 12, 18, and 36 | Primarya |
PFS per RECIST 1.1 by BICR | At months 12, 18, and 36 | Primarya |
Harms outcome (AEs, SAEs, WDAEs, mortality, notable harms) | At the time of data cut-off | Secondary |
EORTC QLQ-C30 | At week 24 | Exploratory |
EORTC QLQ-STO22 | At week 24 | Exploratory |
AE = adverse event; BICR = Blinded Independent Central Review; EORTC QLQ-C30 = European Organisation for Research and Treatment of Cancer Quality of Life Questionnaire Core 30; EORTC QLQ-STO22 = European Organisation for Research and Treatment of Cancer Quality of Life Questionnaire Stomach Cancer Module; OS = overall survival; PFS = progression-free survival; RECIST 1.1 = Response Evaluation Criteria in Solid Tumours Version 1.1; SAE = serious adverse event; WDAE = withdrawal due to adverse event.
Note: Data cut-off date was March 29, 2023.
aStatistical testing for these end points was adjusted for multiple comparisons (e.g., hierarchal testing) for the ITT population and does not apply to the patient subgroup with a PD-L1 CPS ≥ 1.
Source: Clinical Study Report for KEYNOTE-811.43 Details included in the table are from the sponsor’s Summary of Clinical Evidence.
Overall Survival
OS was a dual primary efficacy end point in the KEYNOTE-811 trial. OS was defined as the time from randomization to death from any cause. Participants without documented death at the time of the analysis were censored at the date of last contact. Based on input from the clinical experts we consulted, a 5% to 10% improvement in survival at any time point would be considered clinically meaningful.
Progression-Free Survival
PFS was a dual primary efficacy end point in the KEYNOTE-811 trial. PFS was defined as the time from randomization until the first documented disease progression per RECIST 1.1 assessed by BICR, or death from any cause, whichever occurred first. The date of progressive disease was approximated by the date of the first assessment at which progressive disease was objectively documented per RECIST 1.1 by BICR. The censoring rules for the primary analysis under specific situations were as follows:
In the event of progressive disease or death documented after no or 1 missed disease assessment, and before new anticancer therapy, censoring occurred at the date of the documented progressive disease or death.
In the event that progressive disease was documented immediately after 2 or more consecutive missed disease assessments or after anticancer therapy, censoring occurred at the last disease assessment before the earlier date of 2 or more consecutive missed disease assessments and new anticancer therapy, if any.
In the event of no progressive disease, no death, and no initiation of new anticancer treatment, censoring occurred at the last disease assessment.
The clinical experts we consulted viewed OS as the most important outcome and were not able to suggest a between-group difference in PFS that would be considered clinically important.
Health-Related Quality of Life
The psychometric properties of the EORTC QLQ-C30 and EORTC QLQ-STO22 are summarized in Table 7.
The EORTC QLQ-C30 is a cancer-specific HRQoL tool that uses a 1-week recall period to assess self-reported function and symptoms. The tool consists of 30 items that assess 5 functional dimensions (physical function, role function, emotional function, cognitive function, and social function), 3 symptoms item (fatigue, nausea or vomiting, and pain), a global health status and a global QoL scale, and 5 single-item measures that assess additional symptoms commonly experienced by patients with cancer (i.e., dyspnea, loss of appetite, insomnia, constipation, and diarrhea).36,37 Patients have 4 response options to choose from across the scales (“not at all,” “a little,” “quite a bit,” “very much”), with scores ranging from 1 to 4. For the 2 items that form the global QoL scales, responses were recorded on a 7-point Likert-type scale, with anchors ranging from 1 (very poor) to 7 (excellent).37 Higher scores were indicative of better function on the function scales, higher symptom burden on the symptom scales, and a better QoL. An MID in patients with esophageal or gastric cancer was not identified. Between-group differences in MID for improvement and deterioration ranged from 5 to 10 points in patients with various other cancer types (i.e., brain, colorectal, advanced breast, head and/or neck, lung, mesothelioma, melanoma, ovarian, and prostate).70 Based on input from the clinical experts we consulted, the global QoL scale, physical functioning scale, and appetite loss scale were most relevant to this patient population. Ranges estimated to represent MIDs for improvement and deterioration in these scores were 3 to 9 points for improvement and –4 to –13 points for deterioration on the global QoL scale; 4 to 7 points for improvement and –4 to –10 points for deterioration; and 6 to 13 points for improvement and –5 to –9 points for deterioration on the appetite loss scale.70
The EORTC QLQ-STO22 is an HRQoL measure specific to gastric cancer.38 The questionnaire consists of 22 items that address symptoms of dysphagia (4 items), pain or discomfort (3 items), upper GI symptoms (3 items), eating restrictions (5 items), emotional problems (3 items), dry mouth, hair loss, problems with taste, and body image. Using a 1-week recall period, patients rate each item on a scale of 1 (not at all) to 4 (very much). Scale items are scored and interpreted as for the EORTC QLQ-C30. An MID in patients with esophageal or gastric cancer was not identified.
All HRQoL questionnaires were administered by a trained site personnel and completed electronically by patients at each 3-week treatment cycle up to cycle 5, and every 2 cycles thereafter up to a year or the end of treatment, whichever comes first, and then at the 30-day posttreatment discontinuation follow-up visit. At each assessment, the HRQoL questionnaires were administered in the following order: EQ-5D-5L first, followed by EORTC QLQ-C30 and EORTC QLQ-STO22 before drug administration, AE evaluation, and disease status notification.
The sponsor defined overall improvement as a 10-point or more increase in score (in the positive direction) from baseline at any time during the study and confirmed by a 10-point or more improvement at a visit scheduled at least 6 weeks later. When the criteria for improvement were not met, the sponsor defined stability as a less than 10-point worsening in score from baseline at any time during the study and confirmed by a less than 10-point worsening at a visit scheduled at least 6 weeks later. The sponsor used the composite of improvement and stability to denote overall improvement and stability. For time to deterioration in HRQoL, patients without deterioration on the date of the last evaluation (ongoing or discontinued) were censored at the time of last assessment. Patients without baseline assessments were censored at the treatment start date.
Harms
An AE, irrespective of causality, was recorded from the time of treatment randomization through 30 days after the final dose of the study treatment or before initiation of a new anticancer treatment, whichever occurred first. SAEs were recorded from the time of treatment randomization through 90 days after the last dose of the study treatment or 30 days after discontinuation of the study if the patient initiated a new anticancer treatment, whichever occurred first. SAEs were AEs that resulted in death, or those that were life-threatening, required inpatient hospitalization or a prolongation of existing hospitalization, or resulted in persistent or significant disability and/or incapacity, congenital anomaly, and/or stillbirth or other important medical events. The intensity of AEs and SAEs were assessed by the investigator, according to the National Cancer Institute (NCI) Common Terminology Criteria for Adverse Events (CTCAE), version 4.03. Withdrawal due to adverse events (WDAEs) were withdrawals from study treatment (permanent discontinuation of study treatment) in which any study intervention-related toxicity was specified as a reason for permanent discontinuation, as defined in the guidelines for dose modification due to AEs. Mortality included grade 5 AEs leading to death. The following notable harms were of interest to the CDA-AMC clinical review team: immune-mediated AEs, and grade 3 or higher immune-mediated AEs.
Table 7: Summary of Outcome Measures and Their Measurement Properties
Outcome measure | Type | Conclusions about measurement properties | MID |
|---|---|---|---|
EORTC QLQ-C30 | The EORTC QLQ-C30 is an instrument designed to measure self-reported HRQoL for patients with cancer. The EORTC QLQ-C30 consists of 30 items grouped into 14 domains that include 5 multiitem functional scales, 3 multiitem symptom scales, and 5 single-item scales. The EORTC QLQ-C30 also includes a 2-item global QoL scale.71,72 For each scale, the final scores range from 0 to 100, with higher scores indicating greater functioning, better QoL, or a greater degree of symptom burden. | Validity: In 98 patients with esophageal cancer receiving palliative treatment, the EORTC QLQ-C30 was found to have moderate item-scale convergent validity (r > 0.40) for all items.73 In 98 patients with esophageal, esophagogastric junction, or gastric cancer, the Polish version of the EORTC QLQ-C30 was found to have good item-scale convergent (r ≥ 0.04) and divergent (r < 0.4) validity for items related and unrelated to their scales, respectively. It was found that EORTC QLQ-C30 and EORTC QLQ-OG25 had low correlations, except for those with clinical overlap (data not reported). In subgroups of patients (esophagus vs. stomach cancers), the following scales and single items of the EORTC QLQ-C30 distinguished differences in clinical status: global health status, physical functioning scale, fatigue, pain, dyspnea, insomnia, and appetite loss. In the subgroup of different treatment types (curative vs. palliative), no such difference was noted.74 Reliability: In patients with esophageal or gastric cancer, the EORTC QLQ-C30 was found to have acceptable internal consistency (Cronback alpha ranged from 0.61 [cognitive scale] to 0.86 [fatigue scale]) and acceptable reliability based on test-retest 2 weeks apart (ICC range, 0.82 to 0.91).73,74 Responsiveness: Measures of responsiveness in patients with esophageal and esophagogastric cancers were not identified. | MID was not identified for patients with esophageal or gastric cancer. Various cancers70 Between-group differences in MID for improvement and deterioration ranged from 5 to 10 points across most scales:
|
EORTC QLQ-STO22 | The EORTC QLQ-STO22 module supplements the EORTC QLQ-C30 assessment of disease-specific HRQoL and specific symptoms that may occur during chemotherapy or radiation treatment in patients with gastric cancer.75 The EORTC QLQ-STO22 consists of 22 items:
Patients are asked to rate each item on a scale of 1 (not at all) to 4 (very much), with a 1-week recall period. All scales and single-item measures range from 0 to 100, with a higher score representing a more severe impact on HRQoL.75,76 | The psychometric properties of the EORTC QLQ-STO22 module were assessed in an international study of 219 patients with gastric cancer undergoing a variety of curative and/or palliative treatment modalities, as well as best supportive care.75 Validity Most items were weakly correlated with the EORTC QLQ-C30 scales, except for the dysphagia, eating restrictions, and gastric pain scales, which were moderately correlated with QLQ-C30 (data not reported). Items within a scale demonstrated convergent validity (r = 0.6 to 0.88), whereas with other scales, they showed divergent validity (r = 0.22 to 0.70). Clinically distinct groups based on Karnofsky score and treatment intent (curative vs. palliative) are differentiated using the dysphagia, pain, eating scales, as well as dry mouth, taste, and body image items (P < 0.05). Reliability Acceptable internal consistency has been demonstrated (Cronbach alpha > 0.7). Test-retest study showed higher reproducibility (ICC > 0.7) on the pain, eating restrictions, anxiety scales, and other single items relative to the dysphagia (ICC = 0.6) and reflux (ICC = 0.63) scales.75 Responsiveness Sensitivity to weight loss over time has been demonstrated in the reflux scale, as well as body image item (P < 0.05). Responsiveness to treatment over time has been demonstrated in the eating scale, as well as in taste and body image items in the surgery cohort, whereas in the palliative cohort, responsiveness was noted in taste and hair loss items (P < 0.05).75 | MID was not identified for patients with esophageal or gastric cancer. |
EORTC QLQ-C30 = European Organisation for Research and Treatment of Cancer Quality of Life Questionnaire Core 30; EORTC QLQ-OG25 = European Organisation for Research and Treatment of Cancer Quality of Life Questionnaire Oesophago-Gastric Module; EORTC QLQ-STO22 = European Organisation for Research and Treatment of Cancer Quality of Life Questionnaire Stomach Cancer Module; GI = gastrointestinal; HRQoL = health-related quality of life; ICC = interclass coefficient; MID = minimally important difference; QoL = quality of life.
Statistical Analysis
Sample Size Determination
Sample size determination was conducted for the full study cohort. Randomization to each study treatment in a 1:1 ratio was planned for 692 patients. For the PFS efficacy outcome, with 606 PFS events at the final analysis, the study would be powered at approximately 95% for detecting an HR of 0.7 at an initially assigned 0.003 (1-sided) significance level. For OS, with an expected 551 deaths at the time of the OS final analysis, the study would have approximately 90% power for detecting an HR of 0.75 at an initially assigned 0.020 (1-sided) significance level.
Although the indication population (the subgroup of patients with PD-L1–positive disease) made up 85% of the study population and was a prespecified subgroup, it was not included in the primary end point analysis. No sample size calculations were performed for the subgroup of patients with PD-L1–positive disease to determine what the power would be under the specified assumptions.
Planned Analyses
Interim and Final Analyses
The statistical analysis plan specified the performance of 3 interim analyses and a final analysis.77
The first interim analysis (IA1) was to be performed when the first 260 patients enrolled had at least 8.5 months of follow-up to test the ORR hypothesis specified for the full cohort of patients. The first analysis of PFS and OS was conducted at IA2 and was planned to be performed after approximately 542 PFS events had occurred and approximately 9 months after the last participant was randomized. IA2 was triggered at slightly more than 9 months after the last patient was enrolled, with 415 OS and 484 PFS events. The final PFS analysis was conducted at IA3 and was planned to be performed after the occurrence of approximately 606 PFS events and approximately 18 months after the last participant was randomized. IA3 was conducted 10 months after IA2, with 501 OS and 514 PFS events observed.
The final analysis for OS is expected to be performed after approximately 551 deaths have occurred and approximately 28 months after the last participant was randomized. For IA2, IA3, and the final analysis, if the events accrue more slowly than expected, the sponsor may conduct the analysis with up to 3 months of additional follow-up or when the specified number of events are observed, whichever occurs first, per protocol.
Control of Type I Error
An extension of the Maurer and Bretz (2012)78 approach was used to control for multiple hypotheses. The overall type I error of the dual primary end points (PFS and OS) and the key secondary end point (objective response rate) were controlled at 2.5% (1-sided), with 0.2% allocated to the ORR, 0.3% to PFS, and 2.0% to OS. Study hypotheses were tested in sequential order, and when a particular null hypothesis was rejected, the unused alpha allocated to that hypothesis was reallocated to the other hypothesis tests. ORR was tested at IA1. If the null hypothesis for ORR was rejected, then PFS and OS were tested.
The procedures used to control for multiplicity were not applicable to analyses specific to the indication population; therefore, analyses for the subgroup of patients with PD-L1–positive disease were not controlled for multiple testing.
Statistical Methods
Based on the primary end point findings from IA2 and IA3 in the full study cohort, subgroup analyses of the clinical trial end points based on PD-L1 status were conducted. A summary of the statistical analysis employed in the KEYNOTE-811 trial are presented in Table 8.
OS and PFS
The dual primary efficacy end points of PFS and OS (overall population) were estimated and plotted using a nonparametric Kaplan-Meier method. The treatment difference was assessed with a stratified log-rank test and a stratified Cox proportional hazards model, and the Efron method of tie handling was used to assess the magnitude of the treatment difference. Geographic region, PD-L1 status, and chemotherapy regimen were used as stratification factors. The HR and 95% CI from the Cox model, with the Efron method of tie handling and with a single covariate, were reported. An examination of the plausibility of the proportional hazards assumption of the Cox model was planned using graphical and analytical methods for the primary PFS analysis. Sensitivity analyses were planned to evaluate the robustness of the PFS findings to different censoring rules.
Treatment differences in the among the subgroup of patients with PD-L1–positive disease were assessed using an unstratified log-rank test and a Cox proportional hazards model. No sensitivity analyses were conducted for this population.
Health-Related Quality of Life
Compliance and completion rates were reported for all assessment time points from baseline up to week 48 for the HRQoL measures.
The completion rate of patients treated at a specific time point was defined as the number of treatment patients who completed at least 1 item divided by the number of treatment patients in the patient-reported outcome population. Additionally, the compliance rate for eligible patients was defined as the number of patients treated who completed at least 1 item divided by the number of eligible patients who were expected to complete the assessment, not including patients missing by design, such as death, discontinuation, or translations not available.
To assess the treatment effects on the change in HRQoL score from baseline to 24 weeks, a constrained longitudinal data analysis model proposed by Liang and Zeger79 was applied, with the HRQoL score as the response variable, and treatment, time, treatment by time interaction, and stratification factors used for randomization as covariates. The treatment difference in terms of least squares mean change from baseline is estimated from this model, together with 95% CI.
The number and proportion of patients who experienced deterioration, stability, or improvement in HRQoL from baseline to week 24, the time to deterioration, and the overall improvement rate were documented for the EORTC QLQ-C30 global health status/QoL scale, functioning scale, nausea/vomiting symptom scale, and the single item appetite loss, and for the EORTC QLQ-STO22 symptoms scale for pain.
Time to deterioration was estimated and plotted using the Kaplan-Meier method for each treatment group. The median time to deterioration and its 95% CI was determined from the Kaplan-Meier estimates, and the difference in time to deterioration was determined using the stratified log-rank test. A stratified Cox proportional hazards model with the Efron method of tie handling and with a single treatment covariate was used to assess the magnitude of the treatment difference via the HR. Geographic region, PD-L1 status, and chemotherapy regimen were used as stratification factors. The approach for the time to deterioration was based on the assumption of noninformative censoring. Analysis for the subgroup of patients with PD-L1–positive disease involved an unstratified approach.
The stratified Miettinen and Nurminen method was used to compare the overall improvement rate and the overall improvement and/or stability rate between the treatment groups. The difference in the overall improvement rate and its 95% CI from the stratified Miettinen and Nurminen method, with strata weighting by sample size, were reported. The stratification factors used for randomization were applied to the analysis. The point estimates of the overall improvement rate were determined for each treatment group, together with 95% CI, using exact binomial using the Clopper and Pearson method.
Subgroup Analysis
Subgroup analyses were included in the KEYNOTE-811 trial to determine whether the treatment effect was consistent across groups. The following subgroups analyzed in the KEYNOTE-811 trial were of interest:
MSI status (nonhigh versus other)
tumour burden (equal to or greater than median versus less than median).
Subgroup analyses were not conducted in the indication population.
Table 8: Statistical Analysis of Efficacy End Points in the KEYNOTE-811 Trial
End point | Statistical model | Adjustment factors | Handling of missing data | Sensitivity analyses |
|---|---|---|---|---|
KEYNOTE-811 overall study population | ||||
OS | IA2 and IA3 Test: One-sided P value based on a log-rank test stratified by geographic region (Western Europe, Israel, North America, and Australia; Asia; and the rest of the world), PD-L1 status (positive vs. negative), and chemotherapy regimen (CISPFU or CAPOX) with small strata collapsed Model: Cox regression model with the Efron method of tie handling and treatment as a covariate | Cox regression model with the Efron method of tie handling and treatment as a covariate stratified by geographic region (Western Europe, Israel, North America, and Australia; Asia; and the rest of the world), PD-L1 status (positive vs. negative), and chemotherapy regimen (CISPFU or CAPOX) with small strata collapsed | Censored at the last known-alive date | None |
PFS per RECIST 1.1, assessed by BICR | IA2 (and IA3 for information only after the PFS BICR objective was met in IA2) Test: One-sided P value based on log-rank test stratified by geographic region (Western Europe, Israel, North America, and Australia; Asia; and the rest of the world), PD-L1 status (positive vs. negative), and chemotherapy regimen (CISPFU or CAPOX) with small strata collapsed Model: Cox regression model with the Efron method of tie handling, with treatment as a covariate | Cox regression model with the Efron method of tie handling, with treatment as a covariate stratified by geographic region (Western Europe, Israel, North America, and Australia; Asia; and the rest of the world), PD-L1 status (positive vs. negative), and chemotherapy regimen (CISPFU or CAPOX) with small strata collapsed | Situation 1: PD or death documented immediately after ≥ 2 consecutive missed disease assessments or after the initiation of new anticancer therapy, if any Primary analysis: Censored at last disease assessment before the earlier date of ≥ 2 consecutive missed disease assessment and the initiation of new anticancer therapy, if any Sensitivity analysis 1: Progressed at date of documented PD or death Sensitivity analysis 2: Progressed at date of documented PD or death] Situation 2: No PD, no death, and no new anticancer treatment initiated Primary analysis: Censored at last disease assessment Sensitivity analysis 1: Censored at last disease assessment Sensitivity analysis 2: Progressed at treatment discontinuation for reasons other than complete response; otherwise censored at last disease assessment if the patient is still on or completed the study treatment] Situation 3: No PD, no death, and no new anticancer treatment initiated. Primary analysis: Censored at last disease assessment before the initiation of new anticancer treatment Sensitivity analysis 1: Censored at last disease assessment Sensitivity analysis 2: Progressed at initiation of new anticancer treatment] | Situation 1 Sensitivity analysis 1: Progressed at date of documented PD or death Sensitivity analysis 2: Progressed at date of documented PD or death Situation 2 Sensitivity analysis 1: Censored at last disease assessment Sensitivity analysis 2: Progressed at treatment discontinuation for reasons other than complete response; otherwise censored at last disease assessment if the patient is still on or completed the study treatment] Situation 3 Sensitivity analysis 1: Censored at last disease assessment Sensitivity analysis 2: Progressed at initiation of new anticancer treatment |
Mean change from baseline for HRQoL outcomes | cLDA model | Treatment, time, treatment by time interaction, and stratification factors (geographic region, PD-L1 status, chemotherapy regimen) as covariates | Implicit in the model, with missing data treated as missing at random | None |
Time to deterioration in HRQoL | Stratified log-rank test and HR estimation using stratified Cox model with the Efron tie handling method | Geographic region, PD-L1 status, and chemotherapy regimen were used as stratification factors | Right censoring at the time of last assessment when treatment is ongoing or the patient discontinued from the study without deterioration, or at the treatment start date when no baseline assessment is available | None |
Overall improvement rate and overall improvement and stability rate for HRQoL outcomes | Stratified Miettinen and Nurminen method | Geographic region, PD-L1 status, and chemotherapy regimen | Patients with missing data were considered to have not achieved improvement or stability | None |
KEYNOTE-811 PD-L1 CPS ≥ 1 subgroup | ||||
OS | Test: One-sided P value based on log-rank test Model: Cox regression model with the Efron method of tie handling and treatment as a covariate Rationale: CPS ≥ 1 was a preplanned subgroup, and corresponding subgroup analyses are typically not adjusted, per protocol | None | Censored at the last known-alive date | None |
PFS per RECIST 1.1, assessed by BICR | Test: One-sided P value based on log-rank test Model: Cox regression model with the Efron method of tie handling and treatment as a covariate Rationale: CPS ≥ 1 was a preplanned subgroup, and corresponding subgroup analyses are typically not adjusted, per protocol | None | Same censoring as used in the primary analysis of PFS BICR ITT: Censored at last disease assessment before the earlier date of ≥ 2 consecutive missed disease assessments and the initiation of new anticancer therapy, if any; data after the initiation of new anticancer therapy were censored at the last disease assessment before the initiation of that therapy | None |
Mean change from baseline for HRQoL outcomes | cLDA model | None | Implicit in the model, with missing data treated as missing at random | None |
Time to deterioration in HRQoL | Log-rank test and HR estimation using stratified Cox model with the Efron tie handling method | None | Right censoring at the time of last assessment when treatment is ongoing or the patient discontinued from the study without deterioration, or at the treatment start date when no baseline assessment is available | None |
Overall improvement rate and overall improvement and stability rate for HRQoL outcomes | Miettinen and Nurminen method | None | Patients with missing data were considered to have not achieved improvement or stability | None |
BICR = blinded independent central review; CAPOX = capecitabine and oxaliplatin; cLDA = constrained longitudinal data analysis; CPS = combined positive score; CISPFU = cisplatin and fluorouracil; HR = hazard ratio; HRQoL = health-related quality of life; IA = interim analysis; ITT = intention to treat; OS = overall survival; PD = progressive disease; PD-L1 = programmed cell death 1 ligand 1; PFS = progression-free survival; RECIST = Response Evaluation Criteria in Solid Tumours Version 1.1.
Sources: Clinical Study Report, Protocol and Statistical Analysis Plan for KEYNOTE-811.43,77,80 Details included in the table are from the sponsor’s Summary of Clinical Evidence.
Analysis Populations
A summary of the analysis set used for the KEYNOTE-811 trial are presented in Table 9.
Table 9: Analysis Populations of the KEYNOTE-811 Trial
Population | Definition | Application |
|---|---|---|
ITT | All patients who were randomized, whether or not IMP was administered. Patient data were analyzed according to the treatment group to which they were randomized. | All efficacy analyses. |
Safety population | All patients who were randomized participants and received at least 1 dose of study IMP. Patient data were analyzed according to the IMP they received. | All safety analyses. |
PD-L1 CPS ≥ 1 | All patients with PD-L1 CPS ≥ 1 who were randomized, whether or not the IMP was administered. | All efficacy analyses for the PD-L1 CPS ≥ 1 population. |
PD-L1 CPS ≥ 1 safety population | All patient with PD-L1 CPS ≥ 1 who were randomized and received at least 1 dose of IMP. Patient data were analyzed according to the IMP they received. | All safety analyses for the PD-L1 CPS ≥ 1 population. |
PD-L1 CPS ≥ 1 PRO population | All patients with PD-L1 CPS ≥ 1 who had completed at least 1 PRO assessment and received at least 1 dose of IMP. | All PRO analyses for the PD-L1 CPS ≥ 1 population. |
CPS = combined positive score; IMP = investigational medicinal product; ITT = intention to treat; PD-L1 = programmed cell death 1 ligand 1; PRO = patient-reported outcome.
Source: Clinical Study Report for KEYNOTE-811.43 Details included in the table are from the sponsor’s Summary of Clinical Evidence.
Results
Patient Disposition
Patient disposition for the KEYNOTE-811 trial is summarized in Table 10.
Approximately 47% of the 1,327 patients screened were not randomized in the KEYNOTE-811 trial, primarily because they did not meet the trial’s inclusion criteria (99.7%). Of the 698 patients enrolled in the KEYNOTE-811 trial, 350 (50.1%) were randomized to receive pembrolizumab in combination with SOC and 348 (49.9%) were randomized to receive placebo plus SOC. Among the patients randomized to receive placebo plus SOC, 2 did not receive treatment and were excluded from the safety analysis set. Overall, 70.0% of patients in the pembrolizumab plus SOC group and 74.1% of patients in the placebo plus SOC group discontinued the trial. In both groups, the main reason for discontinuation was death.
A total of 594 (85.1%) patients in the KEYNOTE-811 trial had PD-L1–positive disease. Among the patients with PD-L1–positive disease, 298 (50.2%) were randomized to receive pembrolizumab plus SOC and 296 (49.8%) were randomized to receive placebo plus SOC. Among patients randomized to receive placebo plus SOC, 1 did not receive treatment and was excluded from the safety analysis set. Overall, 68.5% of patients in the pembrolizumab plus SOC group and 74.3% of patients in the placebo plus SOC group discontinued the trial. In both groups, the main reason for discontinuation was death .
Protocol Deviation
Protocol deviations in the KEYNOTE-811 trial are summarized in Appendix 1 (Table 19).
Overall, at least 1 important protocol deviation was documented in 37 (10.6%) patients in the pembrolizumab plus SOC group and 31 (8.9%) patients in the placebo plus SOC group. The most reported protocol deviations in the pembrolizumab plus SOC group were related to safety events information not reported, per the timeline outlined in the protocol (4.6%) and the administration of improperly stored medicinal products that was considered unacceptable for use (3.4%). The most reported protocol deviations in the placebo plus SOC group were related to safety events information not reported, per the timeline outlined in the protocol (2.3%).
Among patients with PD-L1–positive disease, at least 1 important protocol deviation was documented in 35 (11.7%) and 23 (7.8%) patients in the pembrolizumab plus SOC and placebo plus SOC groups, respectively. The protocol deviations documented in this subgroup mirrored those in the overall population. The most reported protocol deviations in both the pembrolizumab plus SOC (5.0%) and placebo plus SOC (4.7%) groups were related to the safety events. The administration of improperly stored medicinal products that was considered unacceptable for use was documented in 12 (4.0%) patients in the pembrolizumab plus SOC group.
Baseline Characteristics
The baseline characteristics outlined in Table 11 are limited to those that are most relevant to this review or were felt to affect the outcomes or interpretation of the study results.
The mean age of all patients enrolled in the KEYNOTE-811 trial was 60.4 years (SD = 11.8 years) and 61.7 years (SD = 10.8) in the pembrolizumab plus SOC and placebo plus SOC groups, respectively. Approximately 56.9% of patients in the trial were younger than 65 years and 43.1% were aged 65 years or older. In terms of disease characteristics, 31.4% of patients in the pembrolizumab plus SOC group presented with adenocarcinoma of the GEJ and 68.6% presented with adenocarcinoma of the stomach; in the placebo plus SOC group, 35.1% and 64.9% of patients presented with adenocarcinoma of the GEJ and stomach, respectively. PD-L1–-positive disease was documented in 85.1% of patients in the combined pembrolizumab plus SOC and placebo plus SOC groups.
Among the subgroup of patients with PD-L1–positive disease, the mean age of all patients randomized to the pembrolizumab plus SOC and placebo plus SOC groups were 60.6 (SD = NR) and 61.4 (SD = NR) years, respectively. Approximately 56.9% of patients in the trial were younger than 65 years and 43.1% were 65 years or older. In terms of disease characteristics, 32.6% of patients in the pembrolizumab plus SOC group presented with adenocarcinoma of the GEJ and 67.4% presented with adenocarcinoma of the stomach; in the placebo plus SOC group, the rates were 33.4% and 66.6%, respectively.
Table 10: Patient Disposition in the Full Study Population and the Subgroup of Patients With PD-L1–Positive Disease in the KEYNOTE-811 Trial
Patient disposition | Full study population (ITT population) | PD-L1 CPS ≥ 1 subgroup | ||
|---|---|---|---|---|
Pembrolizumab + SOC | Placebo + SOC | Pembrolizumab + SOC | Placebo + SOC | |
Screened, N | 1,327 | |||
Screen failure | 629 (47.4) | |||
Reason for screening failure, n (%)a | ||||
Did not meet inclusion or exclusion criteria | 627 (99.7) | |||
Randomized, N (%) | 350 (100) | 348 (100) | 298 (100) | 296 (100) |
Randomized and treated, N (%) | 350 (100) | 346 (99.4) | 298 (100) | 295 (99.7) |
Discontinued from study, N (%) | 245 (70.0) | 258 (74.1) | 204 (68.5) | 220 (74.3) |
Reason for discontinuation from trial, N (%) | ||||
Death | 244 (69.7) | 254 (73.0) | 203 (68.1) | 216 (73.0) |
Lost to follow-up | 0 (0.0) | 1 (0.3) | 0 (0.0) | 1 (0.3) |
Withdrawal by patient | 1 (0.3) | 3 (0.9) | 1 (0.3) | 3 (1.0) |
Discontinued from study medication, N (%) | 286 (81.7) | 304 (87.9) | 241 (80.9) | 262 (88.8) |
Reason for discontinuation from study medication, N (%) | ||||
Adverse event | 37 (10.6) | 32 (9.2) | 33 (11.1) | 30 (10.2) |
Adverse event associated with COVID-19 | 2 (0.6) | 3 (0.9) | 2 (0.7) | 2 (0.7) |
Clinical progression | 27 (7.7) | 20 (5.8) | 17 (5.7) | 16 (5.4) |
Complete response | 1 (0.3) | 0 (0.0) | 1 (0.3) | 0 (0.0) |
Nonstudy anticancer therapy | 6 (1.7) | 5 (1.4) | 6 (2.0) | 4 (1.4) |
Physician decision | 8 (2.3) | 6 (1.7) | 8 (2.7) | 6 (2.0) |
Progressive disease | 191 (54.6) | 228 (65.9) | 165 (55.4) | 196 (66.4) |
Withdrawal by patient | 16 (4.6) | 13 (3.8) | 11 (3.7) | 10 (3.4) |
FAS and ITT, N | 350 | 348 | 298 | 296 |
PP, N | 350 | 346 | 298 | 295 |
Safety, N | 350 | 346 | 298 | 295 |
PRO, N | 345 | 340 | 272 | 274 |
CPS = combined positive score, FAS = full analysis set; ITT = intention to treat; PD-L1 = programmed cell death 1 ligand 1; PP = per protocol, PRO = patient-reported outcome; SOC = standard of care.
Note: Based on IA 3 (data cut-off date: March 29, 2023).
aScreen failure was defined as patients who consented to participate in the clinical study but were subsequently not randomized in the study.
Source: Clinical Study Report for KEYNOTE-811.43 Details included in the table are from the sponsor’s Summary of Clinical Evidence.
Table 11: Summary of Baseline Characteristics From the KEYNOTE-811 Trial — ITT Population
Characteristic | Full study population; N = 698 | PD-L1 CPS ≥ 1 subgroup; N = 594 | ||
|---|---|---|---|---|
Pembrolizumab + SOC (N = 350) | Placebo + SOC (N = 348) | Pembrolizumab + SOC (N = 298) | Placebo + SOC (N = 296) | |
Demographics | ||||
Age, years | ||||
Mean (SD) | 60.4 (11.8) | 61.7 (10.8) | 60.6 (NR) | 61.4 (NR) |
Age category, n (%) | ||||
< 65 | 205 (58.6) | 192 (55.2) | 174 (58.4) | 165 (55.7) |
≥ 65 | 145 (41.4) | 156 (44.8) | 124 (41.6) | 131 (44.3) |
Sex, n (%) | ||||
Male | 284 (81.1) | 280 (80.5) | 240 (80.5) | 237 (80.1) |
Female | 66 (18.9) | 68 (19.5) | 58 (19.5) | 59 (19.9) |
Race, n (%) | ||||
American Indian or Alaska Native | 5 (1.4) | 6 (1.7) | 5 (1.7) | 6 (2.0) |
Asian | 119 (34.0) | 121 (34.8) | 97 (32.6) | 97 (32.8) |
Black or African American | 2 (0.6) | 2 (0.6) | 2 (0.7) | 2 (0.7) |
White | 218 (62.3) | 212 (60.9) | 189 (63.4) | 186 (62.8) |
Multiple | 6 (1.7) | 5 (1.4) | 5 (1.7) | 4 (1.4) |
Missing | 0 (0.0) | 2 (0.6) | 0 (0.0) | 1 (0.3) |
Disease characteristics | ||||
ECOG PS, n (%) | ||||
0 | 146 (41.7) | 146 (42.0) | 127 (42.6) | 122 (41.2) |
1 | 204 (58.3) | 202 (58.0) | 171 (57.4) | 174 (58.8) |
Primary location at diagnosis, n (%) | ||||
Adenocarcinoma of the GEJ | 110 (31.4) | 122 (35.1) | 97 (32.6) | 99 (33.4) |
Adenocarcinoma of the stomach | 240 (68.6) | 226 (64.9) | 201 (67.4) | 197 (66.6) |
Current disease overall stage, n (%) | ||||
IIB | 1 (0.3) | 0 (0.0) | 1 (0.3) | 0 (0.0) |
IIIA | 3 (0.9) | 1 (0.3) | 2 (0.7) | 1 (0.3) |
IIIB | 5 (1.4) | 2 (0.6) | 5 (1.7) | 1 (0.3) |
IIIC | 1 (0.3) | 3 (0.9) | 0 (0.0) | 3 (1.0) |
IV | 340 (97.1) | 342 (98.3) | 290 (97.3) | 291 (98.3) |
Disease status, n (%) | ||||
Locally advanced | 10 (2.9) | 7 (2.0) | 8 (2.7) | 6 (2.0) |
Metastatic | 340 (97.1) | 341 (98.0) | 290 (97.3) | 290 (98.0) |
Number of metastatic sites, n (%) | ||||
0 to 2 | 179 (51.1) | 198 (56.9) | 146 (49.0) | 171 (57.8) |
≥ 3 | 171 (48.9) | 150 (43.1) | 152 (51.0) | 125 (42.2) |
Histological subtype (Lauren classification), n (%) | ||||
Diffuse | 68 (19.4) | 51 (14.7) | 54 (18.1) | 44 (14.9) |
Intestinal | 198 (56.6) | 188 (54.0) | 170 (57.0) | 159 (53.7) |
Indeterminate | 83 (23.7) | 109 (31.3) | 73 (24.5) | 93 (31.4) |
Unknown | 1 (0.3) | 0 (0.0) | 1 (0.3) | 0 (0.0) |
PD-L1 status (CPS ≥ 1), n (%) | ||||
Positive | 298 (85.1) | 296 (85.1) | 298 (100.0) | 296 (100.0) |
Negative | 52 (14.9) | 52 (14.9) | 0 (0.0) | 0 (0.0) |
HER2 status, n (%) | ||||
IHC 1+ | 1 (0.3) | 1 (0.3) | 1 (0.3) | 1 (0.3) |
IHC 2+ ISH equivocal | 0 (0.0) | 1 (0.3) | 0 (0.0) | 1 (0.3) |
IHC 2+ ISH negative | 1 (0.3) | 1 (0.3) | 1 (0.3) | 1 (0.3) |
IHC 2+ ISH positive | 62 (17.7) | 84 (24.1) | 51 (17.1) | 68 (23.0) |
IHC 3+ | 286 (81.7) | 261 (75.0) | 245 (82.2) | 225 (76.0) |
MSI status, n (%) | ||||
High | 6 (1.7) | 2 (0.6) | 6 (2.0) | 2 (0.7) |
Not high | 326 (93.1) | 329 (94.5) | 282 (94.6) | 280 (94.6) |
Unknown | 18 (5.1) | 17 (4.9) | 10 (3.4) | 14 (4.7) |
Chemotherapy regimen, n (%) | ||||
CAPOX | 297 (84.9) | 299 (85.9) | 251 (84.2) | 253 (85.5) |
FP | 53 (15.1) | 49 (14.1) | 47 (15.8) | 43 (14.5) |
CAPOX = capecitabine plus oxaliplatin; CPS = combined positive score; ECOG PS = Eastern Cooperative Oncology Group Performance Status; FP = fluoropyrimidine; GEJ = gastroesophageal junction; IHC = immunohistochemistry; ISH = in situ hybridization; ITT = intention to treat; MSI = microsatellite instability; NR = not reported; PD-L1 = programmed cell death 1 ligand 1; SD = standard deviation; SOC = standard of care.
Note: Based on IA3 (data cut-off date: March 29, 2023).
aWestern Europe includes Belgium, France, Germany, Spain, Italy, UK, Ireland, Latvia, and Lithuania, which is consistent with the Europe region defined in the protocol for stratification.
Source: Clinical Study Report for KEYNOTE-811.43 Details included in the table are from the sponsor’s Summary of Clinical Evidence.
Exposure to Study Treatments
Exposure to treatment for the full study population and exposure by duration for the subgroup of patients with PD-L1–positive disease are summarized in Table 12 and Table 13, respectively.
The median duration of follow-up in the full study population at the IA2 data cut-off (May 25, 2022) was 16.1 months (range, 0.6 to 41.6 months) and 14.8 months (range 0.3 to 41.2 months) in the pembrolizumab plus SOC and placebo plus SOC groups, respectively. The median duration of follow-up at the IA3 data cut-off (March 29, 2023) was not reported for the full study population. Mean duration of therapy was 12.8 months (SD = 10.0 months) in the pembrolizumab plus SOC group and 10.8 months (SD = 9.4 months) in the placebo plus SOC group. Among patients with PD-L1–positive disease, the mean duration of treatment with pembrolizumab plus SOC and with placebo plus SOC was 13.2 months (SD = 10.2 months) and 10.4 months (SD = 9.2 months), respectively.
The median duration of follow-up in the subgroup of patients with PD-L1–positive disease was 17.0 months (range, 0.6 to 41.6 months) and 13.9 months (range, 0.3 to 41.2 months) in the pembrolizumab plus SOC and placebo plus SOC groups, respectively. The median duration of follow-up at the IA3 data cut-off (March 29, 2023) was not reported for the subgroup of patients with PD-L1–positive disease. In the subgroup of patients with PD-L1–positive disease, exposure to pembrolizumab plus SOC for at least 3 months, at least 6 months, and at least 12 months was 3,865.9 person-months, 3,631.3 person-months, and 3,012.5 person-months, respectively; exposure to placebo plus SOC for at least 3 months, at least 6 months, and at least 12 months was 2,985.8 person-years, 2,692.5 person-years. and 1,996.8 person-years, respectively.
Table 12: Summary of Patient Exposure to Treatment in the KEYNOTE-811 Trial — Safety Population
Exposure | Full study population; N = 698 | PD-L1 CPS ≥ 1 subgroup; N = 594 | ||
|---|---|---|---|---|
Pembrolizumab + SOC (N = 350) | Placebo + SOC (N = 346) | Pembrolizumab + SOC (N = 298) | Placebo + SOC (N = 295) | |
Months on therapy | ||||
Mean (SD) | 12.8 (10.0) | 10.8 (9.4) | 13.2 (10.2) | 10.4 (9.2) |
Median (range) | 9.8 (0.3 to 41.1) | 7.3 (0.0 to 38.7) | 10.4 (0.3 to 41.1) | 7.1 (0.0 to 38.7) |
CPS = combined positive score; PD-L1 = programmed cell death 1 ligand 1; SD = standard deviation; SOC = standard of care.
Note: Based on IA3 (data cut-off date: March 29, 2023).
Source: Clinical Study Report for KEYNOTE-811.43 Details included in the table are from the sponsor’s Summary of Clinical Evidence.
Table 13: Drug Exposure by Duration in the PD-L1 CPS of 1 or More Subgroup — Safety Population
Exposure | PD-L1 CPS ≥ 1 subgroup, N = 594 | |||
|---|---|---|---|---|
Pembrolizumab + SOC (N = 298) | Placebo + SOC (N = 295) | |||
n | Person-months | n | Person-months | |
Treatment duration (months) | ||||
> 0 | 298 | 3,936.8 | 295 | 3,082.0 |
≥ 1 | 284 | 3,928.2 | 281 | 3,076.6 |
≥ 3 | 254 | 3,865.9 | 236 | 2,985.8 |
≥ 6 | 203 | 3,631.3 | 171 | 2,692.5 |
≥ 12 | 132 | 3,012.5 | 88 | 1,996.8 |
CPS = combined positive score; PD-L1 = programmed cell death 1 ligand 1; SOC = standard of care.
Note: Based on IA3 (data cut-off date: March 29, 2023)
Source: Clinical Study Report for KEYNOTE-811.43 Details included in the table are from the sponsor’s Summary of Clinical Evidence.
Concomitant Medications and Subsequent Treatment
Concomitant Medications
Concomitant medications used by at least 15% of the patients in any treatment group in the KEYNOTE-811 study are summarized in Table 14.
Overall, 695 (99.9%) patients reported the use of at least 1 concomitant medication. The most commonly used concomitant medication (pembrolizumab plus SOC versus placebo plus SOC) was dexamethasone (55.4% versus 57.2%), followed by ondansetron (45.4% versus 43.6%) and paracetamol (42.3% versus 39.0%). Homeopathic preparations were used by approximately 46% of patients in each groups. A greater proportion of patients in the pembrolizumab plus SOC group than in the placebo plus SOC group reported using loperamide (20.3% versus 13.6%) and unspecified herbal and traditional medicine (24.3% versus 15.5%).
Among the subgroup of patients with PD-L1–positive disease, the use of at least 1 concomitant medication was documented in 592 (99.8%) patients. The use of concomitant medication in this subgroup of patients was similar to that in the overall study population. The most commonly used concomitant medication was dexamethasone, at approximately 56% in each group. Ondansetron was used by 48.7% of patients in the pembrolizumab plus SOC group and 44.1% of patients in the placebo plus SOC group, and paracetamol was used by 41.9% and 38.6% of patients, respectively. Homeopathic preparations were used in 47.3% and 44.4% of patients in the pembrolizumab plus SOC and placebo plus SOC groups, respectively. A greater proportion of patients in the pembrolizumab plus SOC group than in the placebo plus SOC group reported using loperamide (21.1% versus 12.5%) and unspecified herbal and traditional medicine (25.2% versus 14.9%).
Subsequent Treatment
Subsequent treatments used among the subgroup of patients with PD-L1–positive disease are summarized in Table 15.
A total of 131 (44.0%) and 160 (54.2%) of patients in pembrolizumab plus SOC and placebo plus SOC groups, respectively, received subsequent therapy with antineoplastic drugs. The 2 most commonly received subsequent therapies in the pembrolizumab plus SOC group were paclitaxel (21.1%) and fluorouracil (21.1%). The 2 most commonly received subsequent therapies in the placebo plus SOC group were paclitaxel (31.5%) and irinotecan (17.3%).
Table 14: Concomitant Medications Used by at Least 15% of Patients in Any Treatment Group in the KEYNOTE-811 Trial — ITT Population
Medication | Full study population; N = 698 | PD-L1 CPS ≥ 1 subgroup; N = 594 | ||
|---|---|---|---|---|
Pembrolizumab + SOC (N = 350) | Placebo + SOC (N = 346) | Pembrolizumab + SOC (N = 298) | Placebo + SOC (N = 295) | |
Patients taking 1 or more concomitant medication | 350 (100) | 345 (99.7) | 298 (100) | 294 (99.7) |
Dexamethasone | 194 (55.4) | 198 (57.2) | 167 (56.0) | 167 (56.6) |
Homeopathic preparation | 162 (46.3) | 160 (46.2) | 141 (47.3) | 131 (44.4) |
Ondansetron | 159 (45.4) | 151 (43.6) | 145 (48.7) | 130 (44.1) |
Paracetamol | 148 (42.3) | 135 (39.0) | 125 (41.9) | 114 (38.6) |
Palonosetron hydrochloride | 126 (36.0) | 124 (35.8) | 101 (33.9) | 104 (35.3) |
Aprepitant | 101 (28.9) | 122 (35.3) | 84 (28.2) | 98 (32.2) |
Dexamethasone sodium phosphate | 96 (27.4) | 99 (28.6) | 80 (26.8) | 84 (28.5) |
Omeprazole | 95 (27.1) | 88 (25.4) | 82 (27.5) | 77 (26.1) |
Sodium chloride | 90 (25.7) | 90 (26.0) | 83 (27.9) | 76 (25.8) |
Metoclopramide hydrochloride | 88 (25.1) | 96 (27.7) | 80 (26.8) | 84 (28.5) |
Unspecified herbal and traditional medicine | 85 (24.3) | 54 (15.6) | 75 (25.2) | 44 (14.9) |
Potassium chloride | 74 (21.1) | 59 (17.1) | 70 (23.5) | 44 (14.0) |
Loperamide | 71 (20.3) | 47 (13.6) | 63 (21.1) | 37 (12.5) |
Loperamide hydrochloride | 65 (18.6) | 55 (15.9) | 52 (17.4) | 49 (16.6) |
Ondansetron hydrochloride | 63 (18.0) | 60 (17.3) | 55 (18.5) | 52 (17.6) |
Pantoprazole sodium sesquihydrate | 62 (17.7) | 63 (18.2) | 55 (17.8) | 57 (19.3) |
Red blood cells | 58 (16.6) | 53 (15.3) | 49 (16.4) | 49 (16.6) |
Metoclopramide | 56 (16.0) | 69 (19.9) | 48 (16.1) | 60 (20.3) |
Enoxaparin sodium | 55 (15.7) | 48 (13.9) | 48 (16.1) | 41 (13.9) |
Pantoprazole | 54 (15.4) | 47 (13.6) | 48 (16.1) | 40 (13.6) |
CPS = combined positive score; ITT = intention to treat; PD-L1 = programmed cell death 1 ligand 1; SOC = standard of care.
Notes: Every participant is counted a single time for each applicable specific concomitant medication. A participant with multiple concomitant medications within a medication category is counted a single time for that category.
Based on IA3 (data cut-off date: March 29, 2023).
Source: From additional information request received January 12, 2024.
Table 15: Summary of the Subsequent Treatment Used by at Least 5% of Patients With a PD-L1 CPS of 1 or More in the KEYNOTE-811 Trial — ITT Population
Subsequent treatment | PD-L1 CPS ≥ 1 subgroup, N = 594 | |
|---|---|---|
Pembrolizumab + SOC (N = 298) | Placebo + SOC (N = 295) | |
Received subsequent therapy, n (%) | 131 (44.0) | 160 (54.2) |
Antineoplastic and immunomodulating drugs | ||
Antineoplastic drugs | 131 (44.0) | 160 (54.2) |
Paclitaxel | 63 (21.1) | 93 (31.5) |
Fluorouracil | 37 (12.4) | 36 (12.2) |
Irinotecan | 34 (11.4) | 51 (17.3) |
Ramucirumab | 34 (11.4) | 48 (16.3) |
Trastuzumab | 33 (11.1) | 33 (11.2) |
Trastuzumab deruxtecan | 23 (7.7) | 24 (8.1) |
Oxaliplatin | 18 (6.0) | 18 (6.1) |
Capecitabine | 16 (5.4) | 19 (6.4) |
Cisplatin | 14 (4.7) | 16 (5.4) |
Docetaxel | 11 (3.7) | 19 (6.4) |
Blood and blood-forming organs | ||
Antianemic preparations | 26 (8.7) | 27 (9.2) |
Calcium folinate | 16 (5.4) | 17 (5.8) |
Cardiovascular system | ||
Cardiac therapy, paclitaxel | 63 (21.1) | 93 (31.5) |
Various | ||
All other therapeutic products | 24 (8.1) | 26 (8.8) |
Calcium folinate | 16 (5.4) | 17 (5.8) |
CPS = combined positive score; ITT = intention to treat; PD-L1 = programmed cell death 1 ligand 1; SOC = standard of care.
Note: Based on IA3 (data cut-off date: March 29, 2023).
Source: Clinical Study Report for KEYNOTE-811.43 Details included in the table are from the sponsor’s Summary of Clinical Evidence.
Efficacy
A summary of OS and PFS efficacy results and EORTC QLQ-C30 results from the KEYNOTE-811 trial are presented in Table 16. The Kaplan-Meier curves for OS and PFS at IA3 (March 29, 2023) are presented in Figure 3 and Figure 4, respectively.
Overall Survival
Full Study Population
The median duration of follow-up in the full study population at the IA2 data cut-off (May 25, 2022) was 16.1 months (range, 0.6 to 41.6 months) and 14.8 months (range, 0.3 to 41.2 months) in the pembrolizumab plus SOC and placebo plus SOC groups, respectively. The median duration of follow-up at the IA3 data cut-off (March 29, 2023) was 38.5 months (interquartile range [IQR], 29.8 to 44.4 months) for the overall population, 38.4 months (IQR, 29.5 to 44.4 months) in the pembrolizumab plus SOC group, and 38.6 months (IQR, 30.2 to 44.4 months) in the placebo plus SOC group.35
In the KEYNOTE-811 trial, the proportion of observed deaths at IA3 (March 29, 2023) was 70.0% and 73.6% in the pembrolizumab plus SOC and placebo plus SOC groups, respectively. The median OS was 20.0 months (95% CI, 17.8 to 22.1 months) in the pembrolizumab plus SOC group and 16.8 months (95% CI, 15.0 to 18.7 months) in the placebo plus SOC group. The stratified HR for OS was 0.84 (95% CI, 0.70 to 1.01; P = 0.0292) after treatment with pembrolizumab plus SOC versus placebo plus SOC. Risk differences in OS in the full study population after treatment with pembrolizumab plus SOC, compared to placebo plus SOC, at months 12, 18, and 36 were ████ ████ ███ █████ ██ ███████ ████ ████ ███ ████ ██ ███████ ███ ████ ████ ███ █████ ██ ███████ respectively.
PD-L1–Positive Subgroup
The median duration of follow-up in the PD-L1 CSP of 1 or more subgroup was 17.0 months (range, 0.6 to 41.6 months) and 13.9 months (range, 0.3 to 41.2 months) in the pembrolizumab plus SOC and placebo plus SOC groups, respectively. The median duration of follow-up at the IA3 data cut-off (March 29, 2023) was not reported for the subgroup of patients with PD-L1–positive disease.
Among patients in the PD-L1–positive subgroup, the proportion of observed deaths at IA3 (March 29, 2023) was 68.5% and 73.6% in the pembrolizumab plus SOC and placebo plus SOC groups, respectively. The median OS was 20.0 months (95% CI, 17.9 to 22.7 months) in the pembrolizumab plus SOC group and 15.7 months (95% CI, 13.5 to 18.5 months) in the placebo plus SOC group. The HR for OS was 0.81 (95% CI, 0.67 to 0.98; P = 0.0142) in favour of pembrolizumab plus SOC versus placebo plus SOC. Risk differences in OS in the PD-L1–positive subgroup after treatment with pembrolizumab plus SOC, compared to placebo plus SOC, at months 12, 18, and 36 were ████ ████ ███ ████ ██ ███████ █████ █████ ██ ███████ ███ ████ ████ ███ █████ ██ ██████, respectively.
Figure 3: Kaplan-Meier Estimates of OS, IA3 — (A) All Patients and (B) Patients With PD-L1 CPS of 1 or More
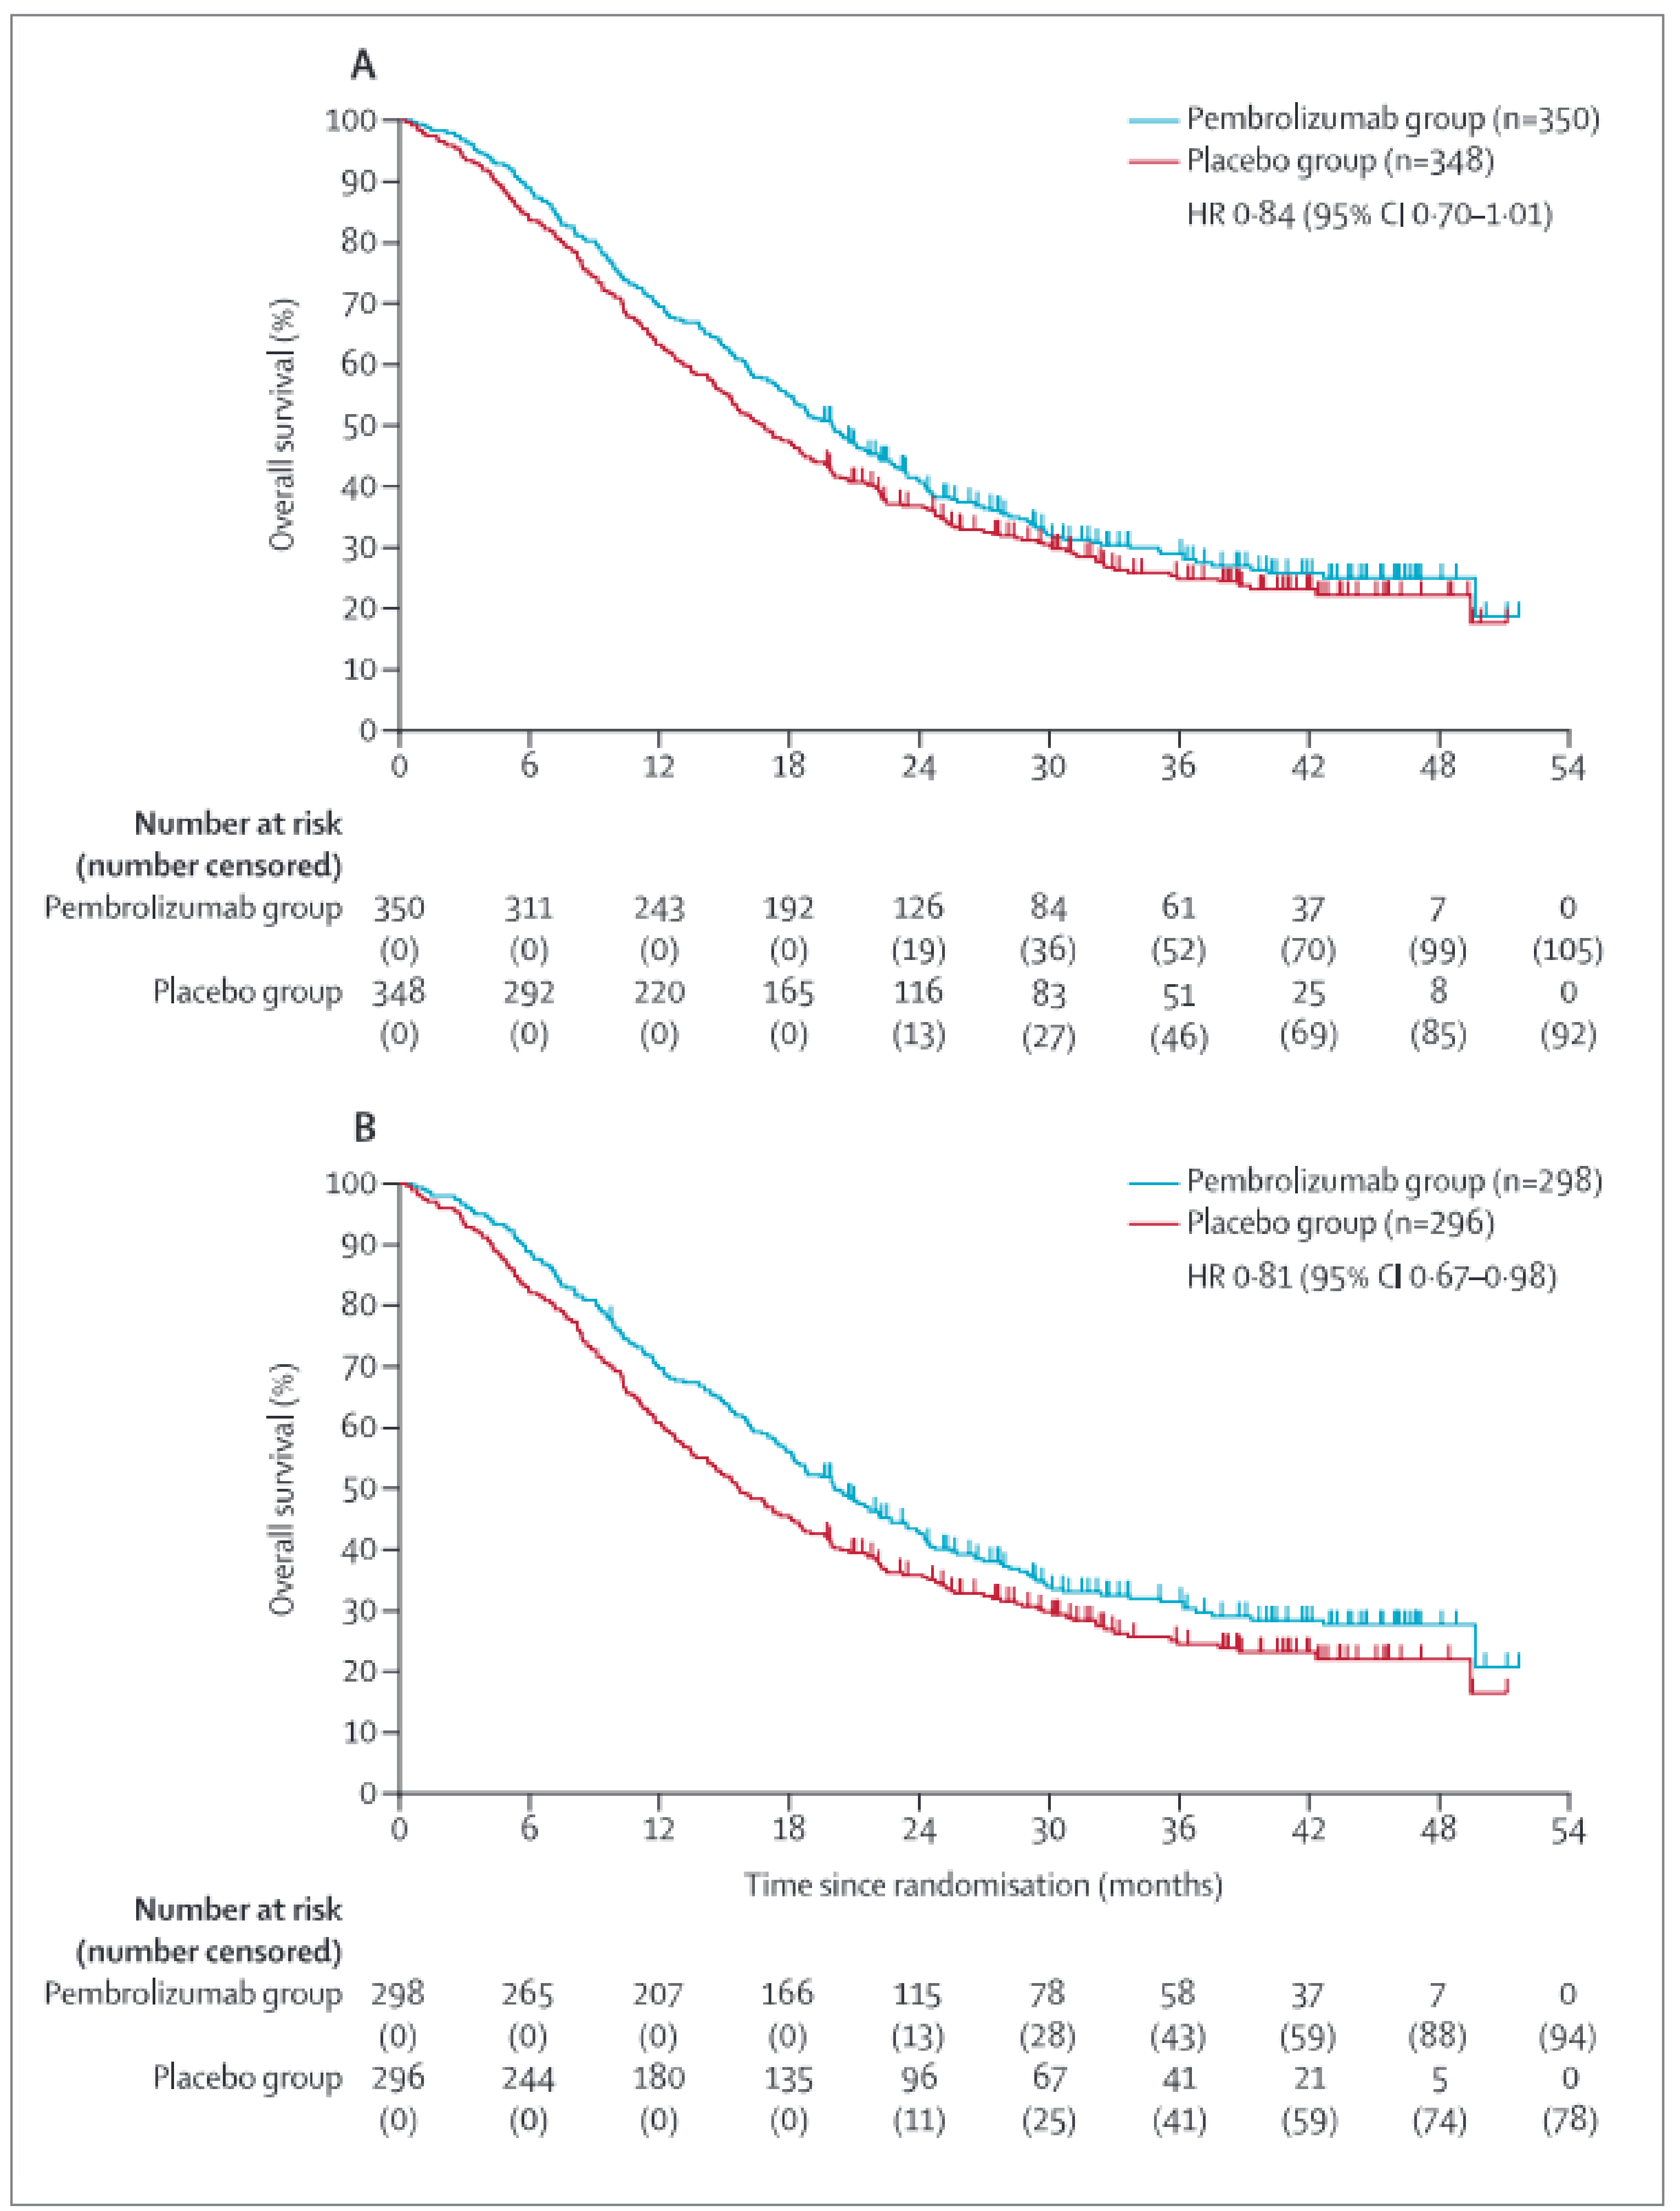
CI = confidence interval; CPS = combined positive score; GEJ = gastroesophageal junction; HR = hazard ratio; IA3 = third interim analysis; OS = overall survival; PD-L1 = PD-L1 = programmed cell death 1 ligand 1; SOC = standard of care.
Note: Based on IA3 (data cut-off date: March 29, 2023).
Reprinted from The Lancet, vol 402, Janjigian, et al., Pembrolizumab plus trastuzumab and chemotherapy for HER2-positive gastric or gastro-oesophageal junction adenocarcinoma: interim analyses from the phase 3 KEYNOTE-811 randomised placebo-controlled trial, pg 2197-208. Figure 4: Overall survival in the intention-to-treat population at the third interim analysis, Copyright (2023), with permission from Elsevier.
Source: Janjigian et al. (2023).35 Details included in the figure are from the sponsor’s Summary of Clinical Evidence.
Figure 4: Kaplan-Meier Estimates of PFS, IA3 — (A) All Patients and (B) Patients With PD-L1 CPS of 1 or More
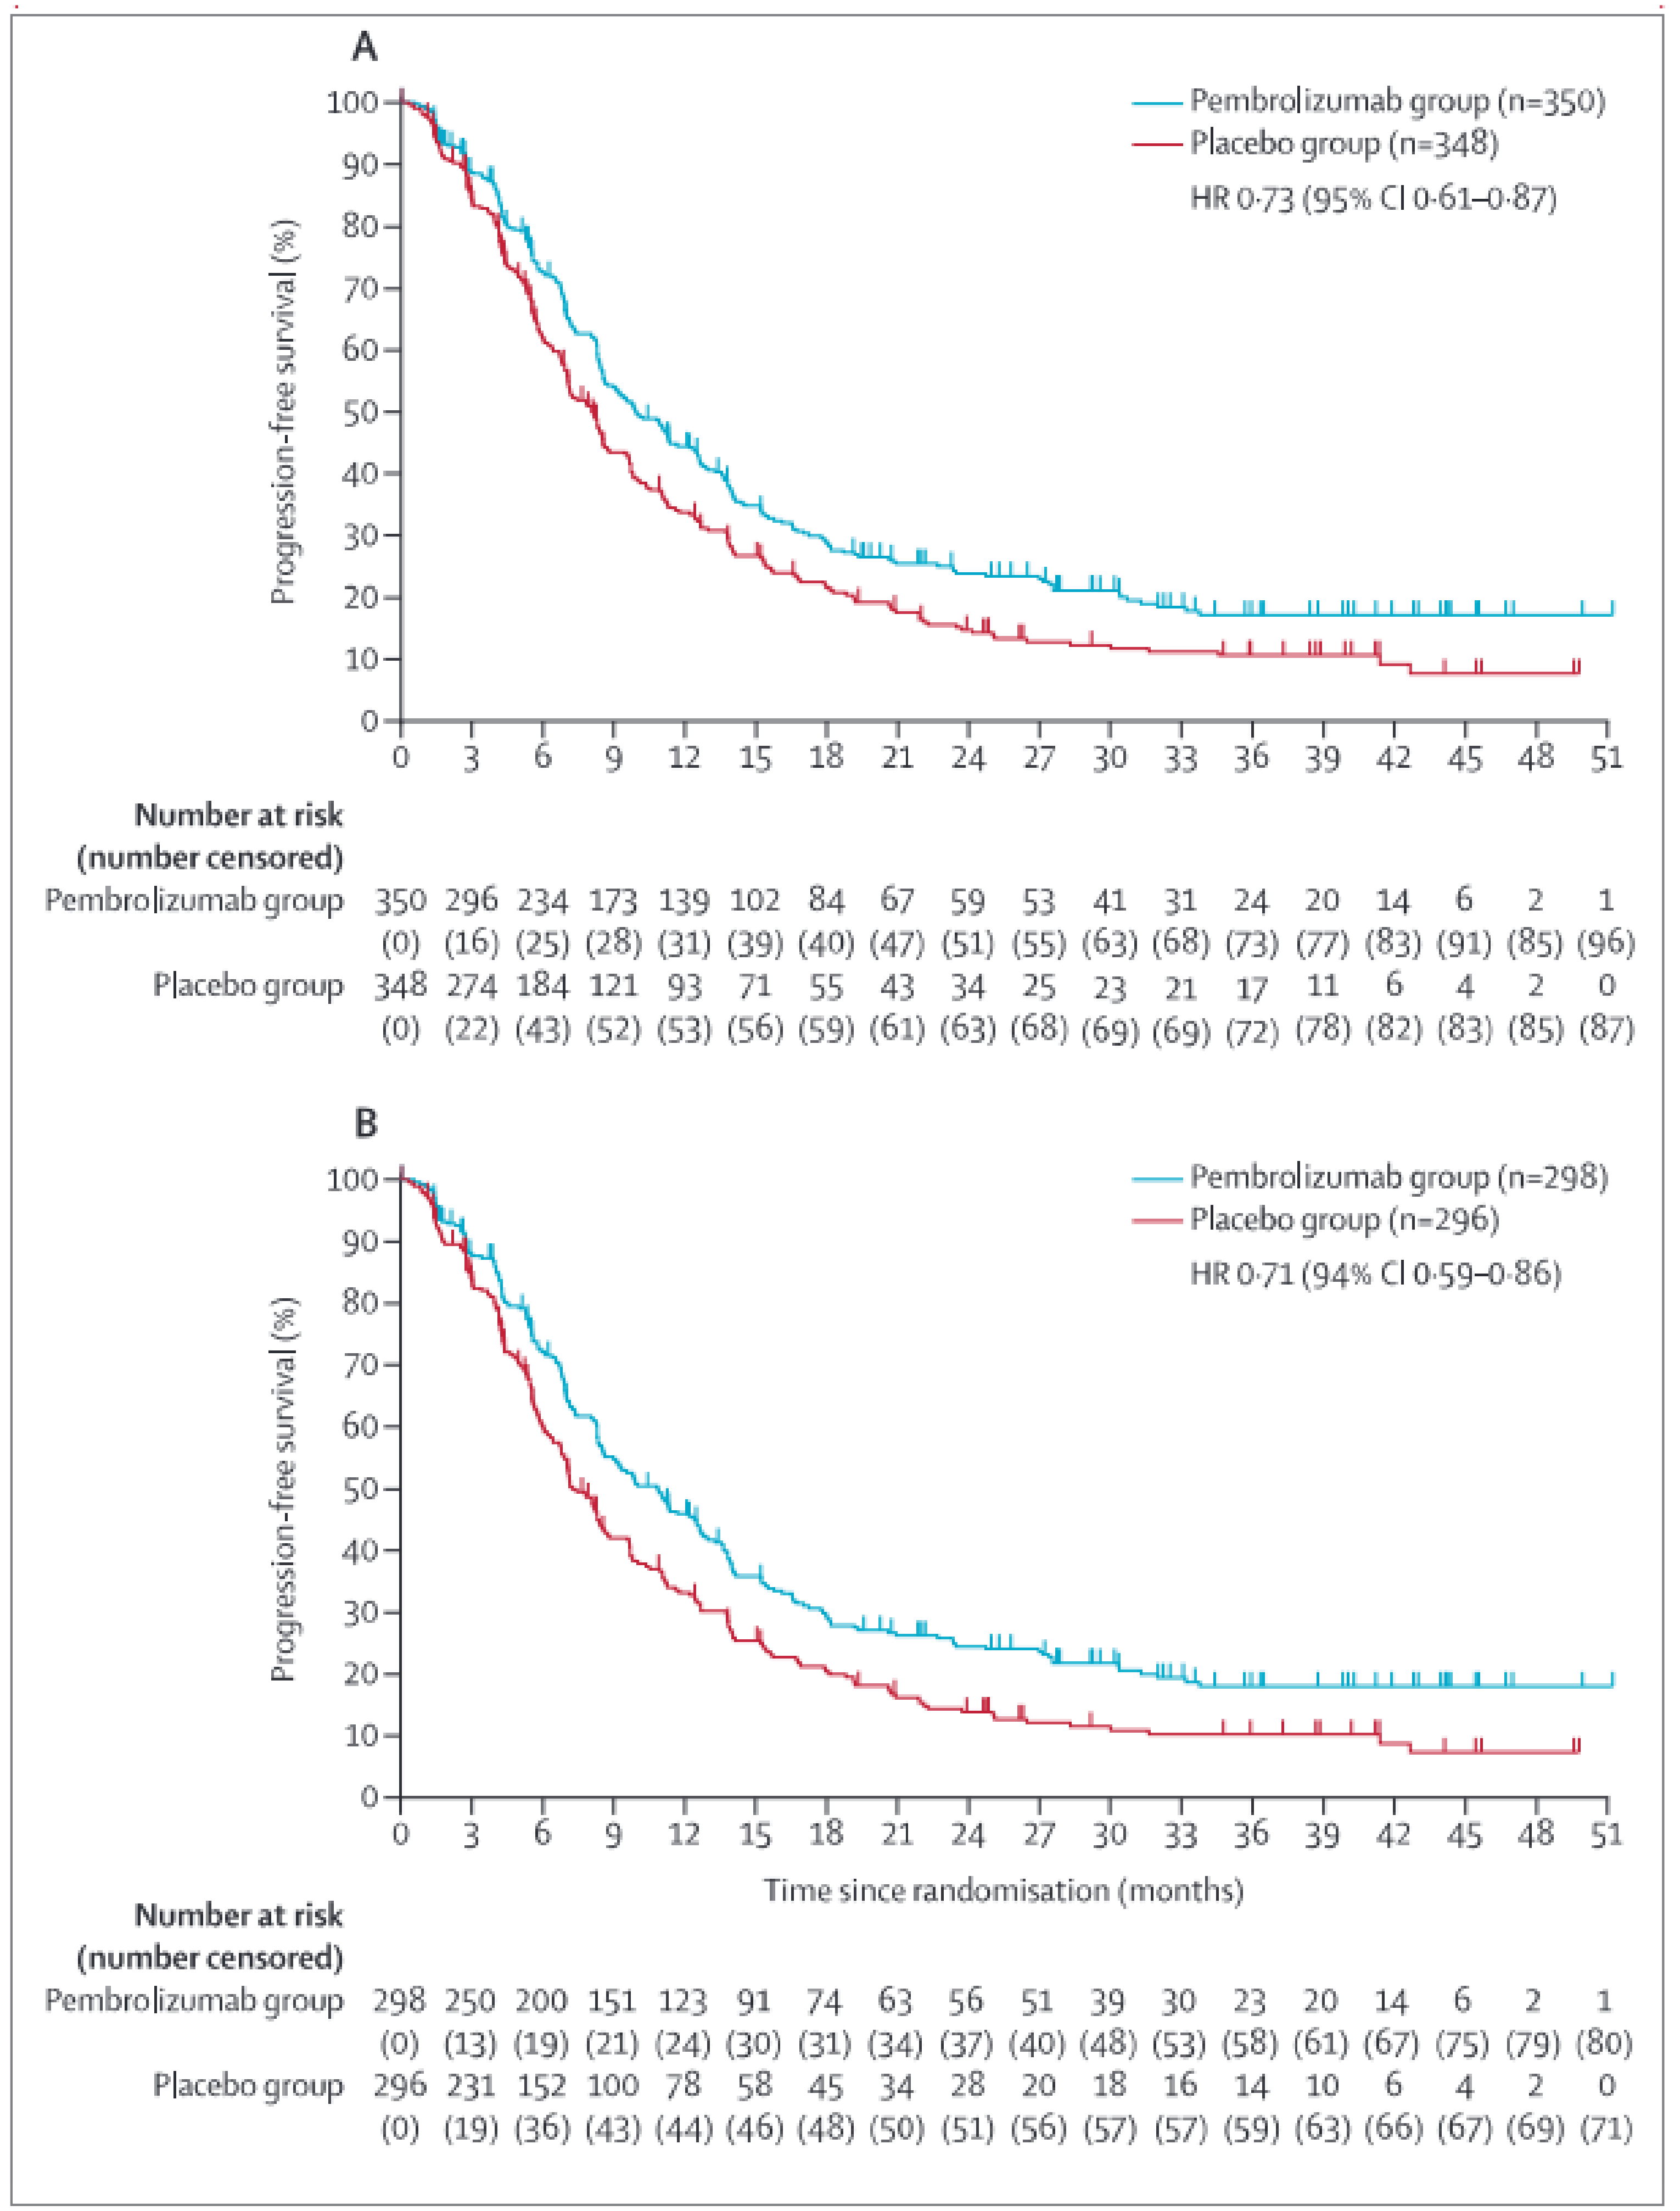
CI = confidence interval; CPS = combined positive score; GEJ = gastroesophageal junction; HR = hazard ratio; PD-L1 = programmed cell death 1 ligand 1; PFS = progression-free survival; SOC = standard of care.
Note: Based on IA3 (data cut-off date: March 29, 2023).
Reprinted from The Lancet, vol 402, Janjigian, et al., Pembrolizumab plus trastuzumab and chemotherapy for HER2-positive gastric or gastro-oesophageal junction adenocarcinoma: interim analyses from the phase 3 KEYNOTE-811 randomised placebo-controlled trial, pg 2197-208. Figure 2: Progression-free survival in the intention-to-treat population at the third interim analysis, Copyright (2023), with permission from Elsevier.
Source: Janjigian et al. (2023).35 Details included in the figure are from the sponsor’s Summary of Clinical Evidence.
Table 16: Summary of OS, PFS, and EORTC QLQ-C30 Results in the KEYNOTE-811 Trial for the Full Study Population and the PD-L1 CPS of 1 or More Subgroup
Outcome | Full study population; N = 698 | PD-L1 CPS ≥ 1 subgroup; N = 594 | ||
|---|---|---|---|---|
Pembrolizumab + SOC (n = 350) | Placebo + SOC (n = 348) | Pembrolizumab + SOC (n = 298) | Placebo + SOC (n = 296) | |
OS (ITT population) | ||||
Number of events (%) | ||||
Death | 245 (70.0) | 256 (73.6) | 204 (68.5) | 218 (73.6) |
Kaplan-Meier estimates (months)a | ||||
Median (95% CI) | 20.0 (17.8 to 22.1) | 16.8 (15.0 to 18.7) | 20.0 (17.9 to 22.7) | 15.7 (13.5 to 18.5) |
Treatment difference | ||||
HR (95% CI) | 0.84 (0.70 to 1.01)b | Reference | 0.81 (0.67 to 0.98)c | Reference |
P value | 0.0292d | Reference | 0.0142e,f | Reference |
OS probability, % (95% CI)a | ||||
At month 6 | 88.9 (85.1 to 91.7) | 83.9 (79.6 to 87.4) | 88.9 (84.8 to 92.0) | 82.4 (77.6 to 86.3) |
At month 12 | 69.4 (64.3 to 74.0) | 63.2 (57.9 to 68.0) | 69.5 (63.9 to 74.4) | 60.8 (55.0 to 66.1) |
Risk difference, % (95% CI)g | ███ █████ ██ █████ | Reference | ███ ████ ██ █████ | Reference |
At month 18 | 54.9 (49.5 to 59.9) | 47.4 (42.1 to 52.5) | 55.7 (49.9 to 61.1) | 45.6 (39.9 to 51.2) |
Risk difference, % (95% CI)g | ███ ████ ██ █████ | Reference | ████ ████ ██ █████ | Reference |
At month 24 | 40.8 (35.6 to 45.9) | 36.8 (31.7 to 41.9) | 42.5 (36.8 to 48.1) | 35.8 (30.4 to 41.3) |
At month 30 | 32.0 (27.0 to 37.2) | 30.4 (25.6 to 35.4) | 33.7 (28.2 to 39.3) | 29.8 (24.6 to 35.2) |
At month 36 | 29.0 (24.0 to 34.2) | 24.9 (20.2 to 29.9) | 31.3 (25.8 to 36.9) | 24.5 (19.4 to 30.0) |
Risk difference, % (95% CI)g | ███ ██████ ██ █████ | Reference | ███ █████ ██ █████ | Reference |
PFS (ITT population) | ||||
Number of events (%) | 253 (72.3) | 261 (75.0) | 217 (72.8) | 225 (76.0) |
Death | 39 (11.1) | 33 (9.5) | 32 (10.7) | 30 (10.1) |
Documented progression | 214 (61.1) | 228 (65.5) | 185 (62.1) | 195 (65.9) |
Kaplan-Meier estimates (months)a | ||||
Median (95% CI) | 10.0 (8.6 to 12.2) | 8.1 (7.1 to 8.6) | 10.9 (8.5 to 12.5) | 7.3 (6.8 to 8.5) |
Treatment difference | ||||
HR (95% CI) | 0.73 (0.61 to 0.87)b | Reference | 0.71 (0.59 to 0.86)c | Reference |
P value | 0.0002d | Reference | 0.0002e | Reference |
PSF probability, % (95% CI)a | ||||
At month 6 | 72.7 (67.6 to 77.2) | 62.2 (56.6 to 67.3) | 72.3 (66.7 to 77.1) | 60.3 (54.2 to 65.9) |
At month 12 | 44.7 (39.2 to 50.1) | 33.7 (28.4 to 39.2) | 46.0 (40.0 to 51.7) | 33.2 (27.4 to 39.1) |
Risk difference, % (95% CI)g | ████ ████ ██ █████ | Reference | ████ █████ ██ █████ | Reference |
At month 18 | 29.1 (24.1 to 34.3) | 21.6 (17.0 to 26.6) | 29.5 (24.1 to 35.0) | 20.4 (15.5 to 25.8) |
Risk difference, % (95% CI)g | ███ ████ ██ █████ | Reference | ███ ████ ██ █████ | Reference |
At month 24 | 23.9 (19.2 to 28.9) | 14.7 (10.8 to 19.3) | 24.5 (19.5 to 29.9) | 13.9 (9.8 to 18.7) |
At month 30 | 21.3 (16.8 to 26.2) | 12.3 (8.6 to 16.7) | 21.7 (16.9 to 27.0) | 11.6 (7.7 to 16.2) |
At month 36 | 17.3 (12.9 to 22.3) | 10.7 (7.2 to 15.0) | 18.0 (13.3 to 23.3) | 10.3 (6.6 to 14.9) |
Risk difference, % (95% CI)g | ███ ████ ██ █████ | Reference | ███ ████ ██ █████ | Reference |
EORTC QLQ-C30 | ||||
PRO analysis set, n | 345 | 340 | 272 | 274 |
Global health status/QoL | ||||
Baseline | ||||
n | 320 | 322 | 272 | 274 |
Mean (SD) | 68.91 (19.17) | 67.26 (20.59) | 69.61 (19.66) | 66.91 (19.61) |
Week 24 | ||||
n | 231 | 190 | 195 | 151 |
Mean (SD) | 70.67 (17.65) | 72.46 (17.25) | 70.60 (17.55) | 72.13 (17.03) |
Change from baseline to week 24 | ||||
LS mean (95% CI)h | 1.18 (–1.12 to 3.49) | 2.34 (–0.14 to 4.82) | 0.78 (–1.71 to 3.26) | 2.06 (–0.67 to 4.79) |
LS mean difference (95% CI)h | –1.16 (–4.23 to 1.91) | Reference | –1.29 (–4.65 to 2.08) | Reference |
P valueh,i | 0.4595f | Reference | 0.4529f | Reference |
Deterioration, months | ||||
Time to true deterioration, mediana | NR (NR to NR) | NR (NR to NR) | NR (NR to NR) | NR (NR to NR) |
True deterioration rate at 12 months,a % (95% CI) | 68.0 (61.9 to 73.4) | 71.3 (65.0 to 76.7) | 68.1 (61.6 to 73.8) | 72.6 (66.1 to 78.1) |
HR (95% CI)b | 1.14 (0.84 to 1.55) | Reference | 1.16 (0.83 to 1.61) | Reference |
P valuej | 0.3951f | Reference | 0.3756f | Reference |
Improvement and stability | ||||
n | 350 | 348 | 291 | 286 |
Improved or stable | 248 (71.9) | 243 (71.5) | 208 (71.5) | 203 (71.0) |
Improved | 109 (31.6) | 108 (31.8) | 92 (31.6) | 93 (32.5) |
Stable | 139 (40.3) | 135 (39.7) | 116 (39.9) | 110 (38.5) |
Deteriorated | 60 (17.4) | 56 (16.5) | 54 (18.6) | 50 (17.5) |
Unconfirmed | 5 (1.4) | 9 (2.6) | 5 (1.7) | 9 (3.1) |
No assessment | 32 (9.3) | 32 (9.4) | 24 (8.2) | 24 (8.4) |
Difference in improved, % | ||||
Estimate (95% CI)l | –0.2 (–7.2 to 6.8) | Reference | –0.9 (–8.5 to 6.7) | Reference |
P valuem | 0.5216f | Reference | 0.5927f | Reference |
Difference in improvement and stability, % | ||||
Estimate (95% CI)l | 0.4 (–6.3 to 7.0) | Reference | 0.4 (–6.8 to 7.7) | Reference |
P valuem | 0.4575f | Reference | 0.4534f | Reference |
Physical functioning | ||||
Baseline | ||||
n | 320 | 322 | 272 | 274 |
Mean (SD) | 86.10 (17.41) | 84.70 (17.94) | 86.03 (17.61) | 84.18 (18.13) |
Week 24 | ||||
n | 231 | 190 | 195 | 151 |
Mean (SD) | 85.19 (14.47) | 85.12 (16.91) | 85.37 (14.76) | 85.25 (16.82) |
Change from baseline to week 24 | ||||
LS mean (95% CI)h | –2.03 (–3.91 to –0.15) | –2.01 (–4.01 to –0.01) | –1.82 (–3.89 to 0.24) | –1.73 (–3.97 to 0.50) |
LS mean difference (95% CI)h | –0.02 (–2.57 to 2.54) | Reference | –0.09 (–2.93 to 2.75) | Reference |
P valueh,i | 0.9900f | Reference | 0.9501f | Reference |
Deterioration, months | ||||
Time to true deterioration, mediana | NR (NR to NR) | NR (NR to NR) | NR (NR to NR) | NR (NR to NR) |
True deterioration rate at 12 months,a % (95% CI) | 67.9 (61.8 to 73.2) | 70.9 (64.9 to 76.1) | 68.4 (61.8 to 74.1) | 70.2 (63.5 to 75.8) |
HR (95% CI)b | 1.05 (0.78 to 1.42) | Reference | 0.99 (0.72 to 1.38) | Reference |
P valuej | 0.7663 f | Reference | 0.9615 f | Reference |
Improvement and stability | ||||
Patients with available data | 350 | 348 | 291 | 286 |
Improved or stable | 252 (73.0) | 246 (72.4) | 218 (74.9) | 205 (71.7) |
Improved | 51 (14.8) | 54 (15.9) | 44 (15.1) | 50 (17.5) |
Stable | 201 (58.3) | 192 (56.5) | 174 (59.8) | 155 (54.2) |
Deteriorated | 55 (15.9) | 54 (15.9) | 44 (15.1) | 49 (17.1) |
Unconfirmed | 6 (1.7) | 8 (2.4) | 5 (1.7) | 8 (2.8) |
No assessment | 32 (9.3) | 32 (9.4) | 24 (8.2) | 24 (8.4) |
Difference in improvement, % | ||||
Estimate (95% CI)l | –1.2 (–6.6 to 4.2) | Reference | –2.5 (–8.6 to 3.5) | Reference |
P valuem | 0.6690 | Reference | 0.7948 | Reference |
Difference in improvement and stability, % | ||||
Estimate (95% CI)l | 0.7 (–5.8 to 7.3) | Reference | 3.3 (–3.8 to 10.4) | Reference |
P valuem | 0.4134 | Reference | 0.1839 | Reference |
Single item appetite loss | ||||
Baseline | ||||
n | 320 | 322 | NP | NP |
Mean (SD) | 24.79 (30.72) | 25.98 (31.65) | NP | NP |
Week 24 | ||||
n | 231 | 190 | NP | NP |
Mean (SD) | 17.89 (24.42) | 16.32 (23.44) | NP | NP |
Change from baseline to week 24 | ||||
LS mean (95% CI)h | –6.52 (–9.94 to –3.10) | –-6.62 (–10.27 to –2.96) | NP | NP |
Group difference (95% CI)h | 0.10 (–4.21 to 4.40) | Reference | NP | NP |
P valueh,i | 0.9644 f | Reference | NP | NP |
Deterioration, months | ||||
Time to true deterioration, mediana | NP | NP | NR (NR to NR) | NR (NR to NR) |
True deterioration rate at 12 months,a % (95% CI) | 68.1 (62.3 to 73.2) | 71.8 (65.9 to 76.9) | 68.2 (61.9 to 73.6) | 73.1 (66.8 to 78.4) |
HR (95% CI)b | 1.18 (0.87 to 1.60) | Reference | 1.23 (0.88 to 1.70) | Reference |
P valuej | 0.2898f | Reference | 0.2344f | Reference |
Improvement and stability | ||||
Patients with available data | 350 | 348 | 291 | 286 |
Improved or stable | 267 (77.4) | 247 (72.6) | 227 (78.0) | 207 (72.4) |
Improved | 112 (32.5) | 94 (27.6) | 95 (32.6) | 81 (28.3) |
Stable | 155 (44.9) | 153 (45.0) | 132 (45.4) | 126 (44.1) |
Deteriorated | 40 (11.6) | 50 (14.7) | 36 (12.4) | 44 (15.4) |
Unconfirmed | 6 (1.7) | 11 (3.2) | 4 (1.4) | 11 (3.8) |
No assessment | 32 (9.3) | 32 (9.4) | 24 (8.2) | 24 (8.4) |
Difference in improvement, % | ||||
Estimate (95% CI)l | 4.7 (–2.1 to 11.6) | Reference | 4.3 (–3.3 to 11.7) | Reference |
P valuem | 0.0879 f | Reference | 0.1334f | Reference |
Difference in improvement and stability, % | ||||
Estimate (95% CI)l | 4.8 (–1.7 to 11.2) | Reference | 5.6 (–1.3 to 12.7) | Reference |
P valuem | 0.0738f | Reference | 0.0566f | Reference |
CI = confidence interval; CPS = combined positive score; EORTC QLQ-C30 = European Organisation for Research and Treatment of Cancer Quality of Life Questionnaire Core 30; HR = hazard ratio; ITT = intention to treat; LS = least squares; NP = not provided; NR = not reached; OS = overall survival; PD-L1 = programmed cell death 1 ligand 1; PFS = progression-free survival; PRO = patient-reported outcome; QoL = quality of life; SD = standard deviation; SOC = standard of care.
Note: Based on IA3 (data cut-off date: March 29, 2023), except HRQoL data for the ITT cohort, which were based on IA2 (data cut-off date: May 25, 2022).
aFrom product-limit (Kaplan-Meier) method for censored data.
bBased on Cox regression model with the Efron method of tie handling and treatment as covariate, stratified by geographic region (Western Europe, Israel, North America, and Australia; Asia; and the rest of the world), PD-L1 status (positive or negative), and chemotherapy regimen (CISPFU or CAPOX) with small strata collapsed.
cBased on Cox regression model with the Efron method of tie handing and treatment as a covariate.
dOne-sided P value based on log-rank test stratified by geographic region (Western Europe, Israel, North America, and Australia; Asia; and the rest of the world), PD-L1 status (positive vs. negative), and chemotherapy regimen (CISPFU or CAPOX) with small strata collapsed, as prespecified in the statistical analysis plan.
eOne-sided P value based on log-rank test.
fNot adjusted for multiplicity.
gBased on the pooled standard error from both treatment arms.
hBased on a cLDA model with the PRO scores as the response variable and covariates for treatment by study visit interaction and stratification factors (geographic region Western Europe, Israel, North America, and Australia; Asia; and the rest of the world) and chemotherapy regimen (CISPFU or CAPOX).
iTwo-sided P value is based on t test.
jTwo-sided P value based on log-rank test stratified by geographic region (Western Europe, Israel, North America, and Australia; Asia; and the rest of the world) and chemotherapy regimen (CISPFU or CAPOX).
lBased on the Miettinen and Nurminen method, stratified by randomization factors.
mOne-sided P value for testing. H0 (difference in % = 0) vs. H1 (difference in % > 0).
Sources: Clinical Study Report for KEYNOTE-811,43 Statistical Report KN811 IA3,44 PRO Report.45 Details included in the table are from the sponsor’s Summary of Clinical Evidence.
Progression-Free Survival
Full Study Population
In the KEYNOTE-811 trial, the protocol-defined criterion of success was met at IA2, with 80% of the total events expected for the analysis (information fraction) having been accrued (data cut-off date: May 25, 2022). The stratified HR for PFS was 0.72 (95% CI, 0.60 to 0.87; P = 0.0002; superiority boundary was 1-sided P = 0.0013) in favour of pembrolizumab plus SOC. The stratified HR for PFS based on BICR assessment from sensitivity analyses 1, 2, and 3, which applied alternative censoring rules, were 0.74 (95% CI, 0.62 to 0.88; P = 0.0003), 0.74 (95% CI, 0.62 to 0.87; P = 0.0001), and 0.73 (95% CI, 0.61 to 0.87; P = 0.0003), respectively.
Disease progression or death on or before the IA3 data cut-off date (March 29, 2023) was observed in 72.3% of patients in the pembrolizumab plus SOC group and in 75.0% of patients in the placebo plus SOC group. The median PFS in the pembrolizumab plus SOC and placebo plus SOC groups was 10.0 months (95% CI, 8.6 to 12.2 months) and 8.1 months (95% CI, 7.1 to 8.6 months), respectively. The stratified HR for disease progression or death was 0.73 (95% CI, 0.61 to 0.87; P = 0.0002) in favour of pembrolizumab plus SOC versus placebo plus SOC. Risk differences in PFS in the full study population after treatment with pembrolizumab plus SOC, compared to placebo plus SOC at months 12, 18, and 36 were █████ ████ ███ ████ ██ ███████ ████ ████ ███ ████ ██ ███████ ███ ████ ████ ███ ████ ██ ███████ respectively.
PD-L1–Positive Subgroup
Among patients in the PD-L1–positive subgroup, disease progression or death on or before the data cut-off date (March 29, 2023) was observed in 72.8% of patients in the pembrolizumab plus SOC group and in 76.0% of patients in the placebo plus SOC group. The median PFS in the pembrolizumab plus SOC and placebo plus SOC groups was 10.9 months (95% CI, 8.5 to 12.5 months) and 7.3 months (95% CI, 6.8 to 8.5 months), respectively. The HR for disease progression or death was 0.71 (95% CI, 0.59 to 0.86; P = 0.0002) in favour of pembrolizumab plus SOC versus placebo plus SOC. Risk differences in PFS in the PD-L1–positive subgroup after treatment with pembrolizumab plus SOC, compared to placebo plus SOC at months 12, 18, and 36 were █████ ████ ███ ████ ██ ███████ ████ ████ ███ ████ ██ ██████ ███ ████ ████ ███ ████ ██ ███████ respectively.
Health-Related Quality of Life
European Organisation for Research and Treatment of Cancer Quality of Life Questionnaire Core 30
Full study population: In the KEYNOTE-811 trial, analysis of the EORTC QLQ-C30 in the full study population was based on IA2 (data cut-off date: May 25, 2022). Overall, baseline EORTC QLQ-C30 was completed by 320 (92.8%) patients in the pembrolizumab plus SOC group and 339 (99.7%) patients in the placebo plus SOC group. By week 24, 231 (67.0%) of the available 265 (76.8%) of patients in the pembrolizumab plus SOC group completed the questionnaire, for a compliance rate of 87.2%. In the placebo plus SOC group, 190 (55.9%) of the available 235 (69.1%) patients completed the questionnaire, for a compliance rate of 80.9%.
In the full study population, the between-group difference in least squares mean change from baseline to week 24 for global health status was █████ ██████ ████ ███ █████ ██ ████ █████████████ after treatment with pembrolizumab plus SOC versus placebo plus SOC. Improvement in global health status was reported in 31.6% and 31.8% of patients in the pembrolizumab plus SOC and the placebo plus SOC groups, respectively. The between-group difference in improvement was █████ ████ ███ █████ ██ █████ after treatment with pembrolizumab plus SOC versus placebo plus SOC. Improvement or stability in global health status was reported in 71.9% and 71.5% of patients in the pembrolizumab plus SOC and placebo plus SOC groups, respectively. The between-group difference in improvement or stability was ████ ████ ███ █████ ██ █████ after treatment with pembrolizumab plus SOC. compared to placebo plus SOC. The stratified HR for time to deterioration on the global health status scale at 12 months was 1.14 (95% CI, 0.84 to 1.55; P = 0.3951) for pembrolizumab plus SOC relative to placebo plus SOC.
For physical function, the between-group difference in least squares change from baseline to week 24 was █████ ██████ ████ ███ █████ ██ ████ █████████████ after treatment with pembrolizumab plus SOC versus placebo plus SOC. Improvement in physical function was reported in 14.8% and 15.9% of patients in the pembrolizumab plus SOC and placebo plus SOC groups, respectively. The between-group difference in improvement was █████ ████ ███ █████ ██ █████ after treatment with pembrolizumab plus SOC versus placebo plus SOC. Improvement or stability in physical function was reported in 73.0% and 72.4% of patients in the pembrolizumab plus SOC and placebo plus SOC groups, respectively. The between-group difference in improvement or stability was ████ ████ ███ ████ ██ █████ after treatment with pembrolizumab plus SOC compared to placebo plus SOC. The stratified HR for time to deterioration on the physical functioning scale at 12 months was 1.05 (95% CI, 0.78 to 1.47; P = 0.7663) for pembrolizumab plus SOC relative to placebo plus SOC.
For the single item appetite loss, the between-group difference in least squares change from baseline to week 24 was ████ ██████ ████ ███ █████ ██ ████ ██████████████. Improvement in appetite loss was reported in 32.5% and 26.6% of patients in the pembrolizumab plus SOC and placebo plus SOC groups, respectively. The between-group difference in improvement was ████ ████ ███ █████ ██ ██████ after treatment with pembrolizumab plus SOC versus placebo plus SOC. Improvement or stability in appetite loss was reported in 77.4% and 72.6% of patients in the pembrolizumab plus SOC and placebo plus SOC groups, respectively. The between-group difference in improvement or stability was ████ ████ ███ ████ ██ ██████ after treatment with pembrolizumab plus SOC compared to placebo plus SOC. The stratified HR for time to deterioration on the single item appetite loss at 12 months was 1.18 (95% CI, 0.87 to 1.60; P = 0.2898) for pembrolizumab plus SOC relative to placebo plus SOC.
PD-L1–positive subgroup: Among patients in the PD-L1–positive subgroup, analysis of the EORTC QLQ-C30 was conducted at IA3 (data cut-off date: March 29, 2023). The EORTC QLQ-C30 was completed at baseline by 272 (93.5%) patients in the pembrolizumab plus SOC group and 274 (95.8%) patients in the placebo plus SOC group. The number of patients available to complete the measure diminished over time. By week 24, 195 (67.0%) of the available 223 (76.6%) patients in the pembrolizumab plus SOC group had completed the questionnaire, for a compliance rate of 87.4%. In the placebo plus SOC group, 151 (52.8%) of the available 192 (67.1%) patients had completed the questionnaire, for a compliance rate of 78.6%.
In the PD-L1–positive subgroup, between-group difference in least squares mean change from baseline to week 24 for global health status was █████ ██████ ████ ███ █████ ██ ████ █████████████ after treatment with pembrolizumab plus SOC versus placebo plus SOC. Improvement in global health status was reported in 31.6% and 32.5% of patients in the pembrolizumab plus SOC and placebo plus SOC groups, respectively. The between-group difference in improvement was █████ ████ ███ █████ ██ ██████████ after treatment with pembrolizumab plus SOC versus placebo plus SOC. Improvement or stability in global health status was reported in 71.5% and 71.0% of patients in the pembrolizumab plus SOC and placebo plus SOC groups, respectively. The between-group difference in improvement or stability was ████ ████ ███ █████ ██ ███████████ after treatment with pembrolizumab plus SOC compared to placebo plus SOC. The HR for time to deterioration on the global health status scale at 12 months was 1.16 (95% CI, 0.83 to 1.61; P = 0.3756) for pembrolizumab plus SOC relative to placebo plus SOC.
For physical functioning, the between-group difference in least squares change from baseline to week 24 was █████ ██████ ████ ███ █████ ██ ████ ███████ ███████ █ ███████ after treatment with pembrolizumab plus SOC versus placebo plus SOC. Improvement in physical functioning was reported in 15.1% and 17.5% of patients in the pembrolizumab plus SOC and placebo plus SOC groups, respectively. The between-group difference in improvement was █████ ████ ███ █████ ██ ████████████ after treatment with pembrolizumab plus SOC versus placebo plus SOC. Improvement or stability in physical functioning was reported in 74.9% and 71.7% of patients in the pembrolizumab plus SOC and placebo plus SOC groups, respectively. The between-group difference in improvement or stability was ████ ████ ███ █████ ██ █████████████ after treatment with pembrolizumab plus SOC compared to placebo plus SOC. The HR for time to deterioration on the physical functioning scale at 12 months was 0.99 (95% CI, 0.72 to 1.38; P = 0.9615) for pembrolizumab plus SOC relative to placebo plus SOC.
For the single item appetite loss, the between-group difference in least squares change from baseline to week 24 was not reported. Improvement in appetite loss was reported in 32.6% and 28.3% of patients in the pembrolizumab plus SOC and placebo plus SOC groups, respectively. The between-group difference in improvement was ████ ████ ███ █████ ██ ████████████ after treatment with pembrolizumab plus SOC versus placebo plus SOC. Improvement or stability in appetite loss was reported in 78.0% and 72.4% of patients in the pembrolizumab plus SOC and placebo plus SOC groups, respectively. The between-group difference in improvement or stability was ████ ████ ███ █████ ██ █████████████ after treatment with pembrolizumab plus SOC compared to placebo plus SOC. The HR for time to deterioration on the single item appetite loss at 12 months was 1.23 (95% CI, 0.88 to 1.70; P = 0.2344) for pembrolizumab plus SOC relative to placebo plus SOC.
European Organisation for Research and Treatment of Cancer Quality of Life Questionnaire Stomach Cancer Module
Full study population: In the KEYNOTE-811 trial, analysis of the EORTC QLQ-STO22 conducted at IA2 (data cut-off date: May 25, 2022). Overall, the EORTC QLQ-STO22 was completed at baseline by 319 (92.5%) patients in the pembrolizumab plus SOC group and 320 (94.1%) patients in the placebo plus SOC group. The number of patients available to complete the measure diminished over time. By week 24, 229 (66.4%) of the available 265 (76.8%) patients in the pembrolizumab plus SOC group completed the questionnaire, for a compliance rate of 86.4%. In the placebo plus SOC group, 190 (55.9%) of the available 235 (69.1%) patients completed the questionnaire, for a compliance rate of 80.9%.
In the full study population, the between-group difference in least squares mean change from baseline to week 24 on the pain symptom scale of the EORTC QLQ-STO22 was █████ ██████ ████ ███ █████ ██ ████ █████████████ after treatment with pembrolizumab plus SOC versus placebo plus SOC. Improvement in pain symptoms was reported in 40.0% and 32.1% of patients in the pembrolizumab plus SOC and placebo plus SOC groups, respectively. The between-group difference in improvement was ████ ████ ███ ████ ██ ████████████, favouring treatment with pembrolizumab plus SOC over placebo plus SOC. Improvement or stability in pain was reported in 82.0% and 78.2% of patients in the pembrolizumab plus SOC and placebo plus SOC groups, respectively. The between-group difference in improvement or stability was ████ ████ ███ ████ ██ ███████████ after treatment with pembrolizumab plus SOC compared to placebo plus SOC. Deterioration on the pain symptom scale was recorded in 11.3% and 10.6% of patients in the pembrolizumab plus SOC and placebo plus SOC groups, respectively. The stratified HR for time to deterioration on the pain symptom scale at 12 months was 0.99 (95% CI, 0.62 to 1.58; P = 0.9681) for pembrolizumab plus SOC relative to placebo plus SOC.
PD-L1–positive subgroup: Among patients in the PD-L1–positive subgroup, analysis of the EORTC QLQ-STO22 was conducted at IA3 (data cut-off date: March 29, 2023). The EORT QLQ-STO22 was completed at baseline by 271 (93.1%) patients in the pembrolizumab plus SOC group and 273 (95.5%) patients in the placebo plus SOC group. The number of patients available to complete the measure diminished over time. By week 24, 193 (66.3%) of the available 223 (76.6%) patients in the pembrolizumab plus SOC group completed the questionnaire, for a compliance rate of 86.5%. In the placebo plus SOC group, 152 (79.2%) of the available 192 (67.1%) patients completed the questionnaire, for a compliance rate of 79.2%.
In the PD-L1–positive subgroup, the between-group difference in least squares mean change from baseline to week 24 on the pain symptom scale of the EORTC QLQ-STO22 was not reported. Improvement in pain symptoms was reported in 40.2% and 32.9% of patients in the pembrolizumab plus SOC and placebo plus SOC groups, respectively. The between-group difference in improvement was ████ ████ ███ █████ ██ █████████████ after treatment with pembrolizumab plus SOC versus placebo plus SOC. Improvement or stability in pain was reported in 83.2% and 78.3% of patients in the pembrolizumab plus SOC and placebo plus SOC groups, respectively. The between-group difference in improvement or stability was ████ ████ ███ ████ ██ █████████████ after treatment with pembrolizumab plus SOC compared to placebo plus SOC. Deterioration on the pain symptom scale was recorded in 11.4% and 10.6% of patients in the pembrolizumab plus SOC and placebo plus SOC groups, respectively. The HR for time to deterioration on the pain symptom scale at 12 months was 1.00 (95% CI, 0.60 to 1.66; P = 0.9943) for pembrolizumab plus SOC relative to placebo plus SOC.
Harms
Only the harms identified in the review protocol were reported. Harms and tolerability for the KEYNOTE-811 trial for the full study population and for the subgroup of patients with PD-L1–positive disease are summarized in Table 17.
Adverse Events
Full Study Population
In the KEYNOTE-811 trial, at least 1 AE was reported by 99.4% and 100% of patients in the pembrolizumab plus SOC group and the placebo plus SOC groups, respectively. Among patients randomized to receive pembrolizumab plus SOC, the 5 most commonly reported AEs were diarrhea (52.6%), nausea (48.3%), anemia (45.4%), vomiting (33.1%), and decreased appetite (32.3%). In the placebo plus SOC group, the 5 most commonly reported AEs were nausea (48.3%), diarrhea (47.1%), anemia (46.2%), decreased appetite (32.4%), and vomiting (28.6%).
In the full study population, AEs that were classified as grade 3 or higher were reported in 71.7% of patients in the pembrolizumab plus SOC group and in 65.9% of patients in the placebo plus SOC group. The most common AEs that were classified as grade 3 or higher (reported in more than 5% of patients) in the pembrolizumab plus SOC group were anemia (12.6%), diarrhea (9.7%), decreased neutrophil count (8.3%), neutropenia (6.6%), decreased platelet count (6.3%), and hypokalemia (5.7%). The most common AEs that were classified as grade 3 or higher (reported in more than 5% of patients) in the placebo plus SOC group were anemia (10.1%), decreased neutrophil count (8.7%), diarrhea (8.4%), decreased platelet count (6.9%), hypokalemia (5.8%), nausea (5.5%), and neutropenia (5.2%).
PD-L1–Positive Subgroup
Among patients in the PD-L1–positive subgroup, at least 1 AE was reported by 99.3% and 100% of patients in the pembrolizumab plus SOC group and the placebo plus SOC groups, respectively. Among patients with PD-L1–positive disease who were randomized to receive pembrolizumab plus SOC, the 5 most commonly reported AEs were diarrhea (53.7%), nausea (50.7%), anemia (46.3%), vomiting (35.2%), and decreased appetite (33.2%). In the placebo plus SOC group, the 5 most commonly reported AEs were nausea (48.5%), diarrhea (46.8.1%), anemia (46.8%), vomiting (30.5%). and decreased appetite (30.2%).
In the PD-L1–positive subgroup, AEs that were classified as grade 3 or higher were reported in 73.8% of patients in the pembrolizumab plus SOC group and in 65.8% of patients in the placebo plus SOC group. The most common AEs that were classified as grade 3 or higher (reported in more than 5% of patients) in the pembrolizumab plus SOC group were anemia (12.8%), diarrhea (10.7%), decreased neutrophil count (8.4%), neutropenia (7.7%), decreased platelet count (7.4%), and hypokalemia (6.0%). The most common AEs that were classified as grade 3 or higher (reported in more than 5% of patients) in the placebo plus SOC group were anemia (10.2%), decreased neutrophil count (9.2%), diarrhea (8.5%), decreased platelet count (5.8%), and nausea (5.8%).
Serious Adverse Events
Full Study Population
In the full study population, at least 1 SAE was reported in 46.0% of patients in each group. In the pembrolizumab plus SOC group, the following SAEs were reported in more than 2% of patients: pneumonia (5.1%), diarrhea (4.9%), and pulmonary embolism (2.9%). In the placebo plus SOC group, the following SAEs were reported in more than 2% of patients: diarrhea (4.6%), and vomiting (2.6%).
PD-L1–Positive Subgroup
In the PD-L1–positive subgroup, at least 1 severe AE was reported in 48.0% and 47.8% of patients in the pembrolizumab plus SOC group and placebo plus SOC groups, respectively. Details of incident severe AEs were not reported by the sponsor.
Withdrawals of Treatment Due to Adverse Events
Full Study Population
In the full study population, treatment with any of the study drugs was stopped in 41.4% and 38.4% of patients in the pembrolizumab plus SOC and the placebo plus SOC groups, respectively. In the pembrolizumab plus SOC group, pembrolizumab, trastuzumab, and any chemotherapy were discontinued in 13.1%, 13.1%, 38.9% of patients, respectively. In the placebo plus SOC group, placebo, trastuzumab, and chemotherapy were discontinued in 10.7%, 9.2%, and 38.2% of patients, respectively. Overall, 6.3% of patients in the pembrolizumab plus SOC group and 6.9% of patients in the placebo plus SOC group discontinued all drugs in the regimen.
PD-L1–Positive Subgroup
In the PD-L1–positive subgroup, treatment with any of the study drugs was stopped in 42.6% and 36.6% of patients in the pembrolizumab plus SOC and the placebo plus SOC groups, respectively. In the pembrolizumab plus SOC group, pembrolizumab, trastuzumab, and any chemotherapy were discontinued in 14.1%, 14.1%, 40.3% of patients, respectively. In the placebo plus SOC group, placebo, trastuzumab, and chemotherapy were discontinued in 11.5%, 10.5%, and 36.3% of patients, respectively. Overall, 6.7% of patients in the pembrolizumab plus SOC group and 7.8% of patients in the placebo plus SOC group discontinued all drugs in the regimen.
Mortality
Full Study Population
In the full study population, death due to AEs was documented in 6.6% of patients who received pembrolizumab plus SOC and in 6.1% of patients who received placebo plus SOC.
PD-L1–Positive Subgroup
In the PD-L1–positive subgroup, death due to AEs was documented in 6.7% of patients who received pembrolizumab plus SOC and in 6.8% of patients who received placebo plus SOC.
Notable Harms
Immune-mediated AEs were of interest to the CDA-AMC clinical review team.
Full Study Population
In the full study population, at least 1 immune-mediated AE was documented in █████ ███ █████ of patients who received pembrolizumab plus SOC and placebo plus SOC, respectively. Grade 3 or worse immune-mediated AEs were reported in ████ of patients in the pembrolizumab plus SOC group and ████ of patients in the placebo and SOC group.
PD-L1–Positive Subgroup
In the PD-L1–positive subgroup, at least 1 immune-mediated AE was documented in █████ of patients who received pembrolizumab plus SOC and in █████ of patients who received placebo plus SOC at the IA2. The proportion of patients assessed at IA2 with at least 1 grade 3 or worse immune-mediated or infusion-related AE was █████ ███ ████ of patients in the pembrolizumab plus SOC and placebo plus SOC groups, respectively.
Table 17: Summary of Harms Results From the KEYNOTE-811 Trial — Safety Population
Adverse events | Full study population | PD-1 CPS ≥ 1 subgroup | ||
|---|---|---|---|---|
Pembrolizumab + SOC (N = 350) | Placebo + SOC (N = 346) | Pembrolizumab + SOC (N = 298) | Placebo + SOC (N = 295) | |
Most common AEs, n (%) | ||||
Patients with ≥ 1 AE | 348 (99.4) | 346 (100.0) | 296 (99.3) | 295 (100.0) |
AE reported in > 15% of patients in any treatment group | ||||
Diarrhea | 184 (52.6) | 163 (47.1) | 160 (53.7) | 138 (46.8) |
Nausea | 169 (48.3) | 167 (48.3) | 151 (50.7) | 143 (48.5) |
Anemia | 159 (45.4) | 160 (46.2) | 138 (46.3) | 138 (46.8) |
Vomiting | 116 (33.1) | 99 (28.6) | 105 (35.2) | 90 (30.5) |
Decreased appetite | 113 (32.3) | 112 (32.4) | 99 (33.2) | 89 (30.2) |
Decreased neutrophil count | 98 (28.0) | 85 (24.6) | 79 (26.5) | 76 (25.8) |
Decreased platelet count | 97 (27.7) | 98 (28.3) | 83 (27.9) | 80 (27.1) |
Increased aspartate aminotransferase | 87 (24.9) | 63 (18.2) | 75 (25.2) | 50 (16.9) |
Peripheral sensory neuropathy | 85 (24.3) | 73 (21.1) | 74 (24.8) | 59 (20.0) |
Fatigue | 82 (23.4) | 77 (22.3) | 72 (24.2) | 64 (21.7) |
Palmar-plantar erythrodysesthesia syndrome | 81 (23.1) | 78 (22.5) | 67 (22.5) | 57 (19.3) |
Decreased weight | 75 (21.4) | 64 (18.5) | 65 (21.8) | 54 (18.3) |
Peripheral neuropathy | 65 (18.6) | 65 (18.8) | 55 (18.5) | 56 (19.0) |
Increased alanine aminotransferase | 67 (19.1) | 47 (13.6) | 58 (19.5) | 39 (13.2) |
Constipation | 63 (18.0) | 68 (19.7) | 56 (18.8) | 59 (20.0) |
Neutropenia | 59 (16.9) | 58 (16.8) | 53 (17.8) | 46 (15.6) |
Pyrexia | 56 (16.0) | 46 (13.3) | 45 (15.1) | 38 (12.9) |
Decreased white blood cell count | 55 (15.7) | 42 (12.1) | 46 (15.4) | 38 (12.9) |
Hypokalemia | 54 (15.4) | 41 (11.8) | 48 (16.1) | 31 (10.5) |
Hypoalbuminemia | 52 (14.9) | 55 (15.9) | 48 (16.1) | 50 (16.9) |
Increased blood bilirubin | 50 (14.3) | 34 (9.8) | 46 (15.4) | 30 (10.2) |
Asthenia | 49 (14.0) | 66 (19.1) | 39 (13.1) | 55 (18.6) |
Most common grade 3 to 5 AEs, n (%) | ||||
Patients with ≥ 1 grade 3 to 5 AE | 251 (71.7) | 228 (65.9) | 220 (73.8) | 194 (65.8) |
Grade 3 to 5 AEs reported in > 5% of patients in any treatment groupa | ||||
Anemia | 44 (12.6) | 35 (10.1) | 38 (12.8) | 30 (10.2) |
Diarrhea | 34 (9.7) | 29 (8.4) | 32 (10.7) | 25 (8.5) |
Decreased neutrophil count | 29 (8.3) | 30 (8.7) | 25 (8.4) | 27 (9.2) |
Neutropenia | 23 (6.6) | 18 (5.2) | 23 (7.7) | 13 (4.4) |
Decreased platelet count | 22 (6.3) | 24 (6.9) | 22 (7.4) | 17 (5.8) |
Hypokalemia | 20 (5.7) | 20 (5.8) | 18 (6.0) | 13 (4.4) |
Nausea | 14 (4.0) | 19 (5.5) | 13 (4.4) | 17 (5.8) |
SAEs, n (%) | ||||
Patients with ≥ 1 SAE | 161 (46.0) | 159 (46.0) | 143 (48.0) | 141 (47.8) |
SAEs reported in > 2% of patients in any treatment groupa | ||||
Pneumonia | 18 (5.1) | 7 (2.0) | NA | NA |
Diarrhea | 17 (4.9) | 16 (4.6) | NA | NA |
Pulmonary embolism | 10 (2.9) | 7 (2.0) | NA | NA |
Vomiting | 7 (2.0) | 9 (2.6) | NA | NA |
Patients who stopped treatment due to AEs, n (%) | ||||
Patients who stopped any drug | 145 (41.4) | 133 (38.4) | 127 (42.6) | 108 (36.6) |
Discontinued pembrolizumab or placebo | 46 (13.1) | 37 (10.7) | 42 (14.1) | 34 (11.5) |
Discontinued trastuzumab | 46 (13.1) | 32 (9.2) | 42 (14.1) | 31 (10.5) |
Discontinued any chemotherapy | 136 (38.9) | 132 (38.2) | 120 (40.3) | 107 (36.3) |
Discontinued all drugs in the regimen | 22 (6.3) | 24 (6.9) | 20 (6.7) | 23 (7.8) |
Death due to AE, n (%) | ||||
Patients who died | 23 (6.6) | 21 (6.1) | 20 (6.7) | 20 (6.8) |
Notable harms, n (%) | ||||
Immune-mediated AEs | ||||
Patients with ≥ I immune-mediated AE | ██ ██████ | ██ ██████ | ██ ██████ | ██ ██████ |
Patients with > 1 immune-mediated AE of grade 3 or worse | ██ █████ | ██ █████ | ██ █████ | █████ |
AEs of special interestb | ||||
Patients with ≥ 1 immune- or infusion-mediated eventa | ███ ██████ | ██ ██████ | ███ ██████ | ██ ██████ |
Patients with ≥ 1 immune- or infusion-mediated event of grade 3 or worse | NR | NR | ██ ██████ | ██ █████ |
AE = adverse event; CPS = combined positive score; NA = not available; NR = not reported; PD-L1 = programmed cell death 1 ligand 1; SAE = serious adverse event; SOC = standard of care.
aIA3 data were not available, therefore, data from IA2 were reported (data cut-off date: May 25, 2022)
bAEs of special interest refer to both immune-mediated events and infusion-related reactions.
Sources: Clinical Study Report for KEYNOTE-811,43 Statistical Report KN811 IA3.44 Sponsor reply to request for additional information. Details included in the table are from the sponsor’s Summary of Clinical Evidence.
Critical Appraisal
Internal Validity
The KEYNOTE-811 trial is a randomized, placebo-controlled, parallel-group, multicentre, double-blinded, phase III study. Patients were randomized centrally using interactive response technology, which is typically adequate for concealing allocation until treatment assignment. Stratification factors appeared appropriate, as they addressed important prognostic factors identified by the clinical experts we consulted, and the baseline characteristics between the treatment groups were generally well balanced. Of note, because PD-L1 status (CPS ≥ 1 versus CPS < 1) was a stratification factor, the review team assumed that the randomization and prognostic balance holds in the subgroup of interest. In both the full study population and the PD-L1–positive subgroup, between-group imbalances were noted in the concomitant use of loperamide and unspecified herbal and traditional medicine. However, according to the clinical experts we consulted for the purpose of this review, the use of loperamide or unspecified herbal and traditional medicine is not likely to have any meaningful effect on treatment response.
In the PD-L1–positive subgroup, a greater proportion of patients in the placebo plus SOC group received subsequent therapy than in the pembrolizumab plus SOC group (54.2% versus 44.0%). Even in double-blind studies, there is a risk that either patients or clinicians may become unblinded (e.g., due to known AE profiles) and decide to discontinue or switch treatments due to dissatisfaction with the interventions they were randomized to. Given that the reasons for treatment discontinuation were primarily disease progression and AE (which were similar in proportion in both intervention groups), the risk of unblinding appeared to be low. As there were a greater proportion of patients in the placebo plus SOC group who experienced disease progression, it would be expected that a greater proportion of these patients would have moved on to receive subsequent therapies. Based on input from the clinical experts, there is a possibility that the imbalance in subsequent therapies could have favoured pembrolizumab plus SOC on the OS curve over placebo plus SOC, thereby narrowing the survival gap between the treatment groups.
The dual primary outcomes in the KEYNOTE-811 trial were PFS and OS. The evaluation of PFS and OS as dual primary end points can be appropriate, based on guidelines from the European Medicines Agency, which suggests that when PFS is the primary end point, OS should be the designated secondary end point.81 Although improvements in PFS (a potential surrogate of OS) have the potential to confer benefits to the patient, favourable impacts on OS are viewed as a more persuasive patient-important outcome. An appropriate analysis set — ITT — for PFS and OS was used to measure the effect of assignment to intervention. To minimize the risk of measurement bias, patients’ responses to treatment were blinded to the study investigators, and tumour response was confirmed by radiologic evidence and BICR, per RECIST 1.1. Sensitivity analysis of PFS demonstrated consistency between the BICR and investigators’ assessment of tumour response, suggesting that the procedures employed to minimize bias associated with knowledge of group assignment were adequate. OS is considered an objective outcome and is not prone to bias due to knowledge of group assignment. The risk of bias to due to missing outcomes for OS and PFS appeared to be low, as losses to follow-up for reasons other than death were low and sensitivity analyses with different censoring rules for PFS in the overall population were consistent.
The KEYNOTE-811 trial assessed HRQoL — outcomes deemed to be important by patients and clinicians — as exploratory outcomes. The double-blind nature of the trial minimized risk of bias in the measurement of subjective items on the EORTC QLQ-30 and EROTC QLQ-STO22. However, comparative efficacy conclusions based on HRQoL outcomes are affected by the diminishing number of patients available to complete the questionnaires. By week 24, EORTC QLQ-C30 responses in the full study population were available for 67.0% and 55.9% of patients in the pembrolizumab plus SOC and placebo plus SOC groups, respectively. Thus, the HRQoL outcomes were limited by the large proportion of patients who had left the trial by week 24, and among those still in the trial, a considerable proportion of patients did not complete the questionnaire. Similarly, EORTC QLQ-STO22 responses in the full study population were available for 66.4% and 55.9% of patients in the pembrolizumab plus SOC and placebo plus SOC groups, respectively, at week 24. Consequently, assessment of HRQoL is at risk of attrition bias. Of note, the model used to analysis HRQoL outcomes implicitly imputed data based on the missing-at-random assumption. However, no sensitivity analyses were performed using different imputation approaches (e.g., considering the potential for data to be missing not at random), and no additional information was provided to determine if the missing-at-random assumption was appropriate. Moreover, because the completion rates were not balanced between the groups, there is a risk that attrition bias may favour 1 of the treatment groups over the other. The extent and direction of the bias, however, cannot be determined because it is not clear if those patients who completed the questionnaires were systematically different from those who did not.
The analysis of efficacy results followed a defined statistical plan and employed appropriate censoring criteria. The dual efficacy end points of PFS and OS in the full study population were addressed using a multiplicity hierarchical testing procedure that controlled for type I errors across multiple end points and interim analyses. Both PFS and OS were modelled using a proportional hazards assumption. Although the hazards assumption underlying the HRs for OS and PFS was not tested, based on visual inspection, the curves appear to be relatively parallel. The choice to limit treatment with pembrolizumab plus SOC to the subgroup of patients with PD-L1–positive disease was based on subgroup analyses. Although the subgroup analyses were prespecified, they were absent from the statistical testing hierarchy. There is a risk of type I error (i.e., falsely excluding the null) in the subgroup of patients with PD-L1–positive disease. However, the results observed in the full study population appeared to be driven by the PD-L1–positive subgroup; on visual inspection, the results of the full population and the PD-L1–positive subgroup are similar. Finally, results were based on interim analyses, which may have overestimated the treatment effect estimates.39,40 However, given the relatively large sample size and the number of events with a 75% information fraction, the effect estimate and CI are not likely to be highly unstable. Although reassuring, overestimation of the treatment effect cannot be completely excluded.39,40
External Validity
Overall, the clinical experts we consulted on this review agreed that the results of the KEYNOTE-811 trial were applicable to patients seen in the practice setting in Canada. The clinical experts did note trial details that were applicable to the clinical setting in Canada and others that were not. Generalizability of the evidence, including clinical expert input, is summarized in Table 18.
Table 18: Assessment of Generalizability of the Evidence for Pembrolizumab Plus SOC
Domain | Factor | Evidence | Assessment of generalizability |
|---|---|---|---|
Population | ECOG PS | To be eligible for inclusion in the KEYNOTE-811 trial, patients must have had an ECOG PS of 0 or 1. | The clinical experts noted that in clinical practice, patients with an ECOG PS of 2 are usually managed in the same manner as patients with an ECOG PS of 1. Thus, the clinical experts agreed that they would treat patients with an ECOG PS of 2 with pembrolizumab plus SOC. |
CNS metastases | Patients with active CNS metastases were excluded from the KEYNOTE-811 trial. Per the eligibility criteria, in which patients with previously treated brain metastases may participate in the trial, provided they were radiologically stable, clinically stable, and did not require steroid treatment for at least 14 days before the first dose of the study treatment. | Although patients with active brain metastases were not included in the KEYNOTE-811 trial, the clinical experts agreed that they would treat patients with treated or stable asymptomatic CNS metastases. | |
Intervention | Pembrolizumab in combination with SOC | In the KEYNOTE-811 trial, pembrolizumab was combined with the SOC regimen, which consisted of trastuzumab in combination with cisplatin plus fluoropyrimidine (infusion with 5-FU or capecitabine). | The clinical experts agreed that the SOC regimen used in the KEYNOTE-811 trial is reflective of current SOC in Canada. The clinical experts also noted that in the clinical practice setting, other first-line chemotherapy regimens are used in combination with trastuzumab, including FOLFOX, CAPOX, and cisplatin with fluoropyrimidine. The clinical experts agreed that treatment with pembrolizumab may be combined with other first-line chemotherapy combinations in the event that a patient is not able to tolerate or receive a platinum-based combination; this practice is already done for other treatments. |
Comparator | Placebo in combination with SOC | In the KEYNOTE-811 trial, placebo was combined with the SOC regimen, which consisted of trastuzumab in combination with cisplatin plus fluoropyrimidine (infusion with 5-FU or capecitabine). | |
Outcome | OS, PFS | PFS and OS were dual primary outcomes in the KEYNOTE-811 trial. | According to the clinical experts, OS is the main goal of treatment for patients with gastric or GEJ adenocarcinoma. The clinical experts added that PFS is only of relevance if it is an established surrogate of OS or QoL. |
HRQoL | HRQoL was assessed in the KEYNOTE-811 trial as an exploratory outcome, using the EORTC QLQ-C30 and EROTC QLQ-STO22. | The clinical experts stressed that after PFS, HRQoL outcomes are the second most important outcome to measure treatment success in this patient population. | |
Setting | Multinational, multicentre study | No Canadian trial sites were included in the KEYNOTE-811 trial. | The clinical experts did not expect the results from the KEYNOTE-811 trial to differ for the practice setting in Canada. |
5-FU = fluorouracil; CAPOX = capecitabine plus oxaliplatin; CNS = central nervous system; ECOG PS = Eastern Cooperative Oncology Group Performance Status; EORTC QLQ-C30 = European Organisation for Research and Treatment of Cancer Quality of Life Questionnaire Core 30; EORTC QLQ-STO22 = European Organisation for Research and Treatment of Cancer Quality of Life Questionnaire Stomach Cancer Module; FOLFOX = leucovorin calcium (folinic acid), fluorouracil, and oxaliplatin; GEJ = gastroesophageal junction; HRQoL = health-related quality of life; OS = overall survival; PFS = progression-free survival; PS = performance status; QoL = quality of life.
GRADE Summary of Findings and Certainty of the Evidence
Methods for Assessing the Certainty of the Evidence
For pivotal studies and RCTs identified in the sponsor’s systematic review, GRADE was used to assess the certainty of the evidence for outcomes considered to be most relevant to the expert committee deliberations, and a final certainty rating was determined as outlined by the GRADE Working Group:41,42
High certainty — We are very confident that the true effect lies close to that of the estimate of the effect.
Moderate certainty — We are moderately confident in the effect estimate. The true effect is likely to be close to the estimate of the effect, but there is a possibility that it is substantially different. We use the word “likely” for evidence of moderate certainty (e.g., X intervention likely results in Y outcome).
Low certainty — Our confidence in the effect estimate is limited. The true effect may be substantially different from the estimate of the effect. We use the word “may” for evidence of low certainty (e.g., X intervention may result in Y outcome).
Very low certainty: — We have very little confidence in the effect estimate. The true effect is likely to be substantially different from the estimate of effect. We describe evidence of very low certainty as very uncertain.
Following the GRADE approach, evidence from RCTs started as high-certainty evidence and could be rated down for concerns related to study limitations (which refer to internal validity or risk of bias), inconsistency across studies, indirectness, imprecision of effects, and publication bias.
When possible, certainty was rated in the context of the presence of an important (nontrivial) treatment effect; if this was not possible, certainty was rated in the context of the presence of any treatment effect (i.e., the clinical importance is unclear). In all cases, the target of the certainty of evidence assessment was based on the point estimate and where it was located relative to the threshold for a clinically important effect (when a threshold was available) or to the null. The presence or absence of an important effect for OS was based on threshold informed by the clinical experts we consulted for the purpose of this review; for HRQoL, this was based on MID estimates from the literature. For all other outcomes, the presence or absence of an important effect was based on the nonnull effect.
Results of GRADE Assessments
Table 2 presents the GRADE summary of findings for pembrolizumab in combination with SOC versus placebo in combination with SOC.
Long-Term Extension Studies
No long-term extension studies were included in this submission.
Indirect Evidence
No indirect treatment comparisons were included in this submission. The sponsor conducted a feasibility assessment to estimate the comparative efficacy and safety of pembrolizumab combined with SOC therapy (trastuzumab in combination with CISPFU or CAPOX) versus other fluoropyrimidine- and platinum-containing chemotherapy used in combination with trastuzumab in Canada, mainly FOLFOX and capecitabine-cisplatin. The availability of relevant studies to perform an indirect comparison was informed by a systematic literature review.46 This review identified 1 trial (ToGA)18 in which some patients in 1 arm received capecitabine plus cisplatin and trastuzumab. However, an indirect comparison was not possible because this arm was pooled with another arm (5-FU plus cisplatin and trastuzumab) in the analysis. Therefore, an indirect comparison was not deemed possible. A review of the feasibility appraisal by CDA-AMC is in agreement with this conclusion.
Studies Addressing Gaps in the Systematic Review Evidence
No studies addressing gaps in the evidence from the systematic review were included in this submission.
Discussion
Summary of Available Evidence
One sponsor-conducted trial was included in the clinical review: KEYNOTE-811.
The KEYNOTE-811 trial is an ongoing multicentre, placebo-controlled, double-blind, phase III, RCT evaluating the efficacy and safety of adding pembrolizumab to SOC therapy with trastuzumab and platinum-fluoropyrimidine doublet chemotherapy as first-line therapy for HER2-positive advanced gastric or GEJ cancer in adult patients. Patients were randomly assigned to receive either pembrolizumab 200 mg every 3 weeks (full study population, n = 350; PD-L1 CPS ≥ 1 subgroup, n = 298) or placebo (full study population, n = 348; PD-L1 CPS ≥ 1 subgroup, n = 296), each in combination with SOC therapy. The dual primary efficacy points were PFS and OS; HRQoL and harms were also assessed.
Based on a subgroup analysis conducted at IA2, it was noted that the favourable effect on PFS in the subgroup of patients with PD-L1–positive disease was comparable to that of the full population. This patient group made up 85% of all participants in the trial. Meanwhile, no clear benefit was observed in the subgroup of patients with a PD-L1 CPS of less than 1, which was small (the effect estimate was imprecise as a result). The sponsor determined that the benefit in the full population was driven by the subgroup of patients with PD-L1–positive disease. As such, the Health Canada–approved indication and reimbursement request is focused on the subgroup of patients with PD-L1–positive disease.
Among the subgroup of patients with PD-L1–positive disease, the mean age of patients randomized to the pembrolizumab plus SOC and placebo plus SOC groups was 60.6 years (SD = NR) and 61.4 years (SD = NR), respectively. Approximately 60.8% of patients in the trial were younger than 65 years and 45.7% were aged 65 years or older. In terms of disease characteristics, 32.6% of patients in the pembrolizumab plus SOC group presented with adenocarcinoma of the GEJ and 67.4% presented with adenocarcinoma of the stomach; in the placebo plus SOC group, 33.4% and 66.6% of patients presented with adenocarcinoma of the GEJ and stomach, respectively. A greater proportion of patients in the pembrolizumab plus SOC group than in the placebo plus SOC group reported using loperamide (21.1% versus 12.5%) and unspecified herbal and traditional medicine (25.2% versus 14.9%).
The sponsor conducted a feasibility assessment to estimate the comparative efficacy and safety of pembrolizumab combined with SOC therapy (trastuzumab in combination with CISPFU or CAPOX) versus other fluoropyrimidine- and platinum-containing chemotherapy used in combination with trastuzumab in Canada. However, no studies were identified that would have facilitated such a comparison. Based on input from the clinical experts we consulted, different regimens could be switched as needed (e.g., intolerability), as is done for other indications, even without evidence.
There were no long-term extension studies or studies addressing gaps in the evidence included in this submission.
Interpretation of Results
Efficacy
Evidence from the pivotal phase III trial, KEYNOTE-811, showed that first-line treatment with pembrolizumab combined with SOC in adult patients with locally advanced, unresectable or metastatic HER2-positive gastric or GEJ adenocarcinoma was associated with improved PFS compared to saline placebo in combination with SOC. Although OS results did not meet the criterion of success in the trial (this trend will likely continue to final analysis), survival trended toward favouring pembrolizumab plus SOC over placebo plus SOC in the full population, and pembrolizumab plus SOC resulted in improved OS compared to placebo plus SOC in the PD-L1–positive subgroup.
Based on input from the clinical experts, the main clinical outcome of interest for any treatment in oncology is improved OS. And based on input from the clinical experts we consulted, a 5% to 10% difference in the proportion of patients alive at months 12, 18, and 36 between treatment groups was considered meaningful. Although the observed difference in treatment effect met the lower bound of the threshold for being clinically meaningful and favoured pembrolizumab plus SOC over placebo plus SOC, the lower bounds of the 95% CI were compatible with little to no clinically important difference. Accordingly, the clinical review suggests with moderate certainty that the addition of pembrolizumab to SOC likely resulted in a clinically important increase in OS compared to placebo plus SOC. At IA3, OS data were based on a 91% information fraction. As OS continues to final analysis, the use of subsequent therapies may change the interpretation of the final OS results. As mentioned previously, at the data cut-off, patients in the pembrolizumab plus SOC group had not yet progressed to receive second-line treatment, whereas patients in the placebo plus SOC group had. Often, the between-group difference in OS might be attenuated by the use of subsequent treatment. However, it might be argued that the impact on OS of the addition of pembrolizumab to SOC, when followed by subsequent therapy, is a relevant clinical issue if the subsequent treatments provided are aligned with clinical practice.
In our assessment of PFS, there is high certainty that the addition of pembrolizumab to SOC resulted in an increase in PFS compared with placebo plus SOC. The clinical experts we consulted agreed that PFS is intended as a surrogate for OS and would only be considered if it can be shown that it can predict the patient-important outcomes of OS and HRQoL. A systematic review of 17 immune-oncology trials that included patients with advanced gastroesophageal carcinoma was submitted by the sponsor to support the validity of RECIST-based PFS as a surrogate for OS. The review demonstrated that median PFS was strongly correlated with OS at the arm-level, and that the trial-level correlation between PFS and OS was moderate. Of relevance to the reimbursement request, subgroup analyses showed that the trial-level correlation remained moderate for gastric and GEJ cancer but was weak for first-line therapy and combination therapy. There was no subgroup analysis of patient characteristics like PD-L1 expression. This evidence suggests that although the treatment effect on PFS may be a reasonable surrogate for OS among patients with gastroesophageal carcinoma treated with immune therapies, there is uncertainty about the application of this finding to patients receiving pembrolizumab as part of a combination therapy regimen in the first-line setting. Therefore, despite the evidence of a PFS benefit with pembrolizumab used in combination with SOC, there is a lack of clarity on its clinical importance.
HRQoL was considered an important and meaningful outcome to both patients and clinicians. The EORTC QLQ-C30 captured many of the domains considered important to the patient group and clinical experts, including global and functional health and appetite loss. The addition of pembrolizumab to SOC may result in little to no clinically important difference on the EORTC QLQ-C30 global health status/QoL scale and physical functioning scale at week 24 compared to placebo plus SOC. The low certainty attached to the EORTC QLQ-C30 was driven by the risk of attrition bias because results were available for less than 60% of available patients at week 24. Adding to the uncertainty was the lack of an MID estimate specific to patients with advanced gastric or GEJ adenocarcinoma. Using a range of between-group MID estimates for various other cancer types,70 the effect estimate and both upper and lower bounds of the 95% CI suggest little to no clinically important difference.
Several evidence gaps were identified. First, the long-term effects of the addition of pembrolizumab to SOC therapy were uncertain. No long-term extension studies were included in the submission. In the KEYNOTE-811 trial, the OS analysis for pembrolizumab plus SOC compared to placebo plus SOC at 36 months was not statistically significant in either the full population (risk difference, 4.1%; 95% CI, -–2.9% to 11.1%) or the subgroup of patients with PD-L1–positive disease (risk difference, 6.8%; 95% CI, –0.9% to 14.5%). Second, due to a lack of evidence on weight-based testing, the direct assumption that the use of weight-based dosing would lead to the same outcomes as fixed doses cannot be made. Finally, as dose-effect interactions were not reported, there is uncertainty about the impact of different dosing schedules on treatment efficacy.
As previously described, patient and clinician groups and the clinical experts we consulted identified the unmet need for more treatment options associated with improved survival and improved QoL for patients with locally advanced and metastatic HER2-positive gastroesophageal cancer. The addition of pembrolizumab to SOC therapy with trastuzumab and platinum doublet chemotherapy would represent a new first-line SOC treatment for this patient population that is likely to result in a clinically important OS benefit. There is uncertainty about whether the need for improved QoL was met.
Harms
The reports of immunotherapy-mediated AEs associated with the addition of pembrolizumab to SOC were more frequent than with placebo plus SOC. The addition of pembrolizumab to SOC likely resulted in increased grade or 3 worse immunotherapy-mediated AEs compared to placebo plus SOC; however, the evidence concerning grade 3 or worse immunotherapy-mediated AEs is of moderate certainty, given the small number of events used to estimate the treatment effect.
Although any grade 3 or worse AEs were more frequently reported in the pembrolizumab plus SOC group than in the placebo plus SOC group (73.8% versus 65.8%), SAEs were comparable between the groups (48.0% versus 47.8%). Based on input from the patient group, treatment tolerability was listed as important when considering a new treatment option. The proportion of patients who discontinued any of the investigational medicinal treatments due to an AE was higher in the pembrolizumab plus SOC group than in the placebo plus SOC group (42.6% versus 36.6%). A greater proportion of patients discontinued pembrolizumab than placebo (42.6% versus 36.6%). Death due to an AE was comparable in the 2 treatment groups (6.7% versus 6.8%). The clinical experts we consulted did not observe any new safety concerns in the KEYNOTE-811 trial.
The product monograph for pembrolizumab includes warnings and precautions about immune-mediated adverse reactions, infusion-related reactions, complications of allogeneic hematopoietic stem-cell transplant, and embryo-fetal toxicity. Per the product label, common adverse reactions (reported in at least 20% of patients) to pembrolizumab when used in combination with chemotherapy include fatigue, nausea, constipation, diarrhea, decreased appetite, rash, vomiting, cough, dyspnea, pyrexia, alopecia, peripheral neuropathy, mucosal inflammation, stomatitis, headache, and weight loss.82
Conclusions
Evidence of high certainty from 1 randomized, double-blind, placebo-controlled, phase III trial (KEYNOTE-811) of adult patients with locally advanced, unresectable or metastatic HER2-positive gastric or GEJ adenocarcinoma and positive PD-L1 expression, defined as a CPS of 1 or more, shows that over a median of 38 months of follow-up, first-line treatment with pembrolizumab in combination with SOC (trastuzumab in combination with CISPFU or CAPOX) results in improved PFS compared to placebo added to SOC. The clinical importance of the improvement is unclear, as there is uncertainty about the validity of this surrogate outcome for predicting the treatment effect on OS. Evidence of moderate certainty from the KEYNOTE-811 trial suggests that first-line treatment with pembrolizumab in combination with SOC (trastuzumab in combination with CISPFU or CAPOX) likely results in a clinically important increase in OS compared to placebo added to SOC. There were insufficient data to enable long-term outcome assessment beyond 36 months. Evidence from the pivotal trial suggests that at 36 months, the point estimate for the effect of adding pembrolizumab to SOC on OS exceeded the lower threshold (5%) suggested by the clinical experts for a clinically important benefit. However, the difference was small, and the certainty of this finding was decreased because the 95% CI included the potential for little to no difference in OS compared to placebo plus SOC. The addition of pembrolizumab to SOC may result in little to no difference in HRQoL, measured by the EORTC QLQ-C30 global health scale and physical functioning scale. The ability of the KEYNOTE-811 trial to assess the treatment effect of pembrolizumab in combination with SOC on HRQoL was limited due to the diminishing number of patients available to compete the EORTC QLQ-C30 over time. Immunotherapy-mediated AEs associated with the addition of pembrolizumab to SOC were more frequent than with placebo plus SOC. Although any grade 3 or worse AEs were more frequently reported in the pembrolizumab plus SOC group than in the placebo plus SOC group, SAEs were comparable between the groups. The clinical experts we consulted did not observe any new safety concerns in the KEYNOTE-811 trial. Although no indirect comparisons were possible, the clinical experts we consulted agreed that other SOC combinations could be used instead of the combination used in the KEYNOTE-811 trial, as done in other indications. The addition of pembrolizumab to SOC may meet the need for additional treatment options that improve OS.
References
1.Brenner DR, Poirier A, Woods RR, et al. Projected estimates of cancer in Canada in 2022. CMAJ. 2022;194(17):E601-E607. PubMed
2.Canadian Cancer Statistics Advisory Committee. Canadian Cancer Statistics [sponsor provided reference]. 2023; https://cancer.ca/en/cancer-information/cancer-types/stomach/statistics.
3.Arnold M, Ferlay J, van Berge Henegouwen MI, Soerjomataram I. Global burden of oesophageal and gastric cancer by histology and subsite in 2018. Gut. 2020;69(9):1564-1571. PubMed
4.National Cancer Institute. What is Stomach Cancer [sponsor provided reference]. https://www.cancer.gov/types/stomach#:~:text=Stomach%20(gastric)%20cancer%20is%20cancer,the%20mouth%20to%20the%20anus. Accessed 20 December 2023.
5.Canadian Cancer Society. Risks for stomach cancer [sponsor provided reference]. Stomach cancer https://cancer.ca/en/cancer-information/cancer-types/stomach/risks. Accessed 20 December 2023.
6.Moss SF. The Clinical Evidence Linking Helicobacter pylori to Gastric Cancer. Cell Mol Gastroenterol Hepatol. 2017;3(2):183-191. PubMed
7.Van Cutsem E, Sagaert X, Topal B, Haustermans K, Prenen H. Gastric cancer. Lancet. 2016;388(10060):2654-2664. PubMed
8.Canadian Cancer Society. Canadian Cancer Statistics. A 2018 special report of cancer incidence by stage [sponsor provided reference]. 2018; https://cdn.cancer.ca/-/media/files/research/cancer-statistics/2018-statistics/canadian-cancer-statistics-2018-en.pdf?rev=bbeabe19480c4ec2997fc2953c41f7eb&hash=91C2AF38EA9D192336B6B8F1DE8E9AA8&_ga=2.33583649.1077091045.1642544230-447695735.1612384914. Accessed January 20, 2022.
9.Rupp SK, Stengel A. Influencing Factors and Effects of Treatment on Quality of Life in Patients With Gastric Cancer-A Systematic Review. Front Psychiatry. 2021;12:656929. PubMed
10.CADTH Reimbursement Review of Nivolumab for Gastric, Gastroesophageal Junction, or Esphageal Adenocarcinoma [sponsor provided reference]. Ottawa: CADTH; 2022: https://www.cadth.ca/sites/default/files/DRR/2022/PC0259-Opdivo-combinedReport.pdf. Accessed October 30, 2023.
11.National Cancer Institute. Surveillance, Epidemiology, and End Results Program. Cancer Stat Facts: Stomach Cancer [sponsor provided reference]. https://seer.cancer.gov/statfacts/html/stomach.html. Accessed July 10, 2023.
12.Lewin, K. J., and Appelman, H. D. Atlas of Tumor Pathology. Washington DC: Armed Forces Institute of Pathology, 1995 [sponsor provided reference].
13.National Comprehensive Cancer Network. Gastric Cancer. Version 1 [sponsor provided reference]. NCCN Guidelines https://www.nccn.org/professionals/physician_gls/pdf/gastric.pdf. Accessed July 10, 2023.
14.Ding PQ, Dolley A, Cheung WY. Trifluridine/Tipiracil in the Real-World Management of Metastatic Gastric and Gastroesophageal Junction Cancers in Canada. Curr Oncol. 2022;30(1):130-144. PubMed
15.CADTH Provisional Funding Algorithm for HER2-Negative Gastric, Gastroesophageal Junction (GEJ), or Esophageal Cancer [sponsor provided reference]. Ottawa: CADTH; 2022: https://www.cadth.ca/sites/default/files/pdf/PH0010-EC%20GEJC%20GC-Final-Report.pdf. Accessed July 27, 2022.
16.Van Cutsem E, Bang YJ, Feng-Yi F, et al. HER2 screening data from ToGA: targeting HER2 in gastric and gastroesophageal junction cancer. Gastric Cancer. 2015;18(3):476-484. PubMed
17.Alberta Health Services. Gastric Cancer. GI-008. Version 6 [sponsor provided reference]. Clinical Practice Guidelines 2021.
18.Bang YJ, Van Cutsem E, Feyereislova A, et al. Trastuzumab in combination with chemotherapy versus chemotherapy alone for treatment of HER2-positive advanced gastric or gastro-oesophageal junction cancer (ToGA): a phase 3, open-label, randomised controlled trial. Lancet. 2010;376(9742):687-697. PubMed
19.Gravalos C, Jimeno A. HER2 in gastric cancer: a new prognostic factor and a novel therapeutic target. Ann Oncol. 2008;19(9):1523-1529. PubMed
20.Hofmann M, Stoss O, Shi D, et al. Assessment of a HER2 scoring system for gastric cancer: results from a validation study. Histopathology. 2008;52(7):797-805. PubMed
21.Tanner M, Hollmen M, Junttila TT, et al. Amplification of HER-2 in gastric carcinoma: association with Topoisomerase IIalpha gene amplification, intestinal type, poor prognosis and sensitivity to trastuzumab. Ann Oncol. 2005;16(2):273-278. PubMed
22.Janjigian YY, Kawazoe A, Yañez P, et al. The KEYNOTE-811 trial of dual PD-1 and HER2 blockade in HER2-positive gastric cancer. Nature. 2021;600(7890):727-730. PubMed
23.Gravalos C. Correlation between Her2/neu overexpression/amplification and clinicopathological parameters in advanced gastric cancer patients: a prospective study. Paper presented at: Gastrointestinal Cancers Symposium2007.
24.Lordick F. HER2-positive advanced gastric cancer: similar HER2-positivity levels to breast cancer. Eur J Cancer. 2007;5(Abstract 3541).
25.Yonemura Y, Ninomiya I, Yamaguchi A, et al. Evaluation of immunoreactivity for erbB-2 protein as a marker of poor short term prognosis in gastric cancer. Cancer Res. 1991;51(3):1034-1038. PubMed
26.Lordick F, Carneiro F, Cascinu S, et al. Gastric cancer: ESMO Clinical Practice Guideline for diagnosis, treatment and follow-up. Ann Oncol. 2022;33(10):1005-1020. PubMed
27.Ajani JA, D'Amico TA, Bentrem DJ, et al. Gastric Cancer, Version 2.2022, NCCN Clinical Practice Guidelines in Oncology. J Natl Compr Canc Netw. 2022;20(2):167-192. PubMed
28.NICE Guidelines for oesophago-gastric cancer assessment and management in adults. 2018.
29.Cancer Care Ontario. Systemic Therapy for Advanced Gastric and Gastro-Esophageal Carcinoma [sponsor provided reference]. Guideline 2-26 version 32022: https://www.cancercareontario.ca/sites/ccocancercare/files/guidelines/summary/pebc2-26V3s.pdf. Accessed July 10, 2023.
30.European Society for Medical Oncology. ESMO Gastric Cancer Living Guideline: Metastatic Disease - First Line [sponsor provided reference]. 2023; https://www.esmo.org/living-guidelines/esmo-gastric-cancer-living-guideline/metastatic-disease/metastatic-disease/first-line. Accessed November 6, 2023.
31.Keytruda (pembrolizumab): 100 mg/4 mL vial solutions for infusion. [product monograph - draft]. Kirkland, QC: Merk Canada Inc.; 2023.
32.Brahmer JR, Lacchetti C, Schneider BJ, et al. Management of Immune-Related Adverse Events in Patients Treated With Immune Checkpoint Inhibitor Therapy: American Society of Clinical Oncology Clinical Practice Guideline. J Clin Oncol. 2018;36(17):1714-1768. PubMed
33.HER2 FISH pharmDxTM Kit (label) [sponsor provided reference]. https://www.accessdata.fda.gov/cdrh_docs/pdf4/P040005S005C.pdf.
34.PD-L1 IHC 22C3 pharmDx [sponsor provided reference]. https://www.accessdata.fda.gov/scripts/cdrh/cfdocs/cfpma/pma.cfm?id=P150013S027.
35.Janjigian YY, Kawazoe A, Bai Y, et al. Pembrolizumab plus trastuzumab and chemotherapy for HER2-positive gastric or gastro-oesophageal junction adenocarcinoma: interim analyses from the phase 3 KEYNOTE-811 randomised placebo-controlled trial. The Lancet. 2023. PubMed
36.European Organisation for Research and Treatment of Cancer (EORTC). EORTC Quality of Life. Questionnaires. Brussels (BE): EORTC. https://qol.eortc.org/questionnaires/. Accessed 2024 Jan 25.
37.European Organisation for Research Treatment of Cancer (EORTC). EORTC QLQ-C30 scoring manual. Brussels (BE): EORTC; 2001. https://www.eortc.org/app/uploads/sites/2/2018/02/SCmanual.pdf?bcs-agent-scanner=e1284245-c178-0a43-a29d-2949b50384ee. Accessed 2024 Jan 25.
38.Vickery CW, Blazeby JM, Conroy T, et al. Development of an EORTC disease-specific quality of life module for use in patients with gastric cancer. Eur J Cancer. 2001;37(8):966-971. PubMed
39.Guyatt GH, Briel M, Glasziou P, Bassler D, Montori VM. Problems of stopping trials early. BMJ. 2012;344:e3863. PubMed
40.Bassler D, Briel M, Montori VM, et al. Stopping randomized trials early for benefit and estimation of treatment effects: systematic review and meta-regression analysis. JAMA. 2010;303(12):1180-1187. PubMed
41.Balshem H, Helfand M, Schünemann HJ, et al. GRADE guidelines: 3. Rating the quality of evidence. Journal of clinical epidemiology. 2011;64(4):401-406. PubMed
42.Santesso N, Glenton C, Dahm P, et al. GRADE guidelines 26: informative statements to communicate the findings of systematic reviews of interventions. Journal of clinical epidemiology. 2020;119:126-135. PubMed
43.Clinical Study Report: P811V02MK3475. A phase III, randomized, double-blind trial comparing trastuzumab plus chemotherapy and pembrolizumab with trastuzumab plus chemotherapy and placebo as first-line treatment in participants with HER2 positive advanced gastric or gastroesophageal junction adenocarcinoma (KEYNOTE-811) [internal sponsor's report]. Rahway, NJ: Merk Sharp & Dohme LLC; 1800.
44.Statistical Report of KEYNOTE-811: MK-3475-811 IA3. A phase III, randomized, double-blind trial comparing trastuzumab plus chemotherapy and pembrolizumab with trastuzumab plus chemotherapy and placebo as first-line treatment in participants with HER2 positive advanced gastric or gastroesophageal junction adenocarcinoma (KEYNOTE-811) [internal sponsor's report]. Rahway, NJ: Merk Sharp & Dohme LLC.
45.PRO Report of KEYNOTE-811: Keytruda (MK-3475) HTA report IA3. A phase III, randomized, double-blind trial comparing trastuzumab plus chemotherapy and pembrolizumab with trastuzumab plus chemotherapy and placebo as first-line treatment in participants with HER2 positive advanced gastric or gastroesophageal junction adenocarcinoma. [internal sponsor's report]. Rahway, NJ: Merk Sharp & Dohme LLC; 2023.
46.HER2+ feasbility assessment for indirect comparison (Canada) [internal sponsor's report]. In: Drug Reimbursement Review sponsor submission: pembrolizumab, 200 mg and 400 mg, IV infusion. Kirkland (QC): Merck & Co., Inc.; 2023.
47.Joshi SS, Badgwell BD. Current treatment and recent progress in gastric cancer. CA Cancer J Clin. 2021;71(3):264-279. PubMed
48.Morgan E, Arnold M, Camargo MC, et al. The current and future incidence and mortality of gastric cancer in 185 countries, 2020-40: A population-based modelling study. EClinicalMedicine. 2022;47:101404. PubMed
49.Mukaisho K, Nakayama T, Hagiwara T, Hattori T, Sugihara H. Two distinct etiologies of gastric cardia adenocarcinoma: interactions among pH, Helicobacter pylori, and bile acids. Front Microbiol. 2015;6:412. PubMed
50.Plummer M, de Martel C, Vignat J, Ferlay J, Bray F, Franceschi S. Global burden of cancers attributable to infections in 2012: a synthetic analysis. Lancet Glob Health. 2016;4(9):e609-616. PubMed
51.pCODR. Final Recommendation for Nivolumab for Advanced/Metastatic HER2-Negative gastric/GEJ/Esophageal Adenocarcinoma. Ottawa: CADTH; 2022.
52.Shah MA, Kennedy EB, Alarcon-Rozas AE, et al. Immunotherapy and Targeted Therapy for Advanced Gastroesophageal Cancer: ASCO Guideline. J Clin Oncol. 2023;41(7):1470-1491. PubMed
53.Ter Veer E, Creemers A, de Waal L, van Oijen MGH, van Laarhoven HWM. Comparing cytotoxic backbones for first-line trastuzumab-containing regimens in human epidermal growth factor receptor 2-positive advanced oesophagogastric cancer: A meta-analysis. Int J Cancer. 2018;143(2):438-448. PubMed
54.Ter Veer E, Haj Mohammad N, van Valkenhoef G, et al. The Efficacy and Safety of First-line Chemotherapy in Advanced Esophagogastric Cancer: A Network Meta-analysis. J Natl Cancer Inst. 2016;108(10). PubMed
55.Montagnani F, Turrisi G, Marinozzi C, Aliberti C, Fiorentini G. Effectiveness and safety of oxaliplatin compared to cisplatin for advanced, unresectable gastric cancer: a systematic review and meta-analysis. Gastric Cancer. 2011;14(1):50-55. PubMed
56.Al-Batran SE, Hartmann JT, Probst S, et al. Phase III trial in metastatic gastroesophageal adenocarcinoma with fluorouracil, leucovorin plus either oxaliplatin or cisplatin: a study of the Arbeitsgemeinschaft Internistische Onkologie. J Clin Oncol. 2008;26(9):1435-1442. PubMed
57.Cunningham D, Starling N, Rao S, et al. Capecitabine and oxaliplatin for advanced esophagogastric cancer. N Engl J Med. 2008;358(1):36-46. PubMed
58.Yamada Y, Higuchi K, Nishikawa K, et al. Phase III study comparing oxaliplatin plus S-1 with cisplatin plus S-1 in chemotherapy-naive patients with advanced gastric cancer. Ann Oncol. 2015;26(1):141-148. PubMed
59.Shitara K, Doi T, Dvorkin M, et al. Trifluridine/tipiracil versus placebo in patients with heavily pretreated metastatic gastric cancer (TAGS): a randomised, double-blind, placebo-controlled, phase 3 trial. Lancet Oncol. 2018;19(11):1437-1448. PubMed
60.Kang YK, Boku N, Satoh T, et al. Nivolumab in patients with advanced gastric or gastro-oesophageal junction cancer refractory to, or intolerant of, at least two previous chemotherapy regimens (ONO-4538-12, ATTRACTION-2): a randomised, double-blind, placebo-controlled, phase 3 trial. Lancet. 2017;390(10111):2461-2471. PubMed
61.Fuchs CS, Doi T, Jang RW, et al. Safety and Efficacy of Pembrolizumab Monotherapy in Patients With Previously Treated Advanced Gastric and Gastroesophageal Junction Cancer: Phase 2 Clinical KEYNOTE-059 Trial. JAMA Oncol. 2018;4(5):e180013. PubMed
62.U.S. Food & Drug Administration. FDA approves pembrolizumab with chemotherapy for HER2-negative gastric or gastroesophageal junction adenocarcinoma. 2023; https://www.fda.gov/drugs/resources-information-approved-drugs/fda-approves-pembrolizumab-chemotherapy-her2-negative-gastric-or-gastroesophageal-junction#:~:text=On%20November%2016%2C%202023%2C%20the,gastroesophageal%20junction%20(GEJ)%20adenocarcinoma. Accessed 2023 Dec 5.
63.U.S. Food and Drug Administration. Prescribing information: Keytruda (pembrolizumab) injection, for IV use. Silver Spring (MD): U.S. Food and Drug Administration; 2023: https://www.accessdata.fda.gov/drugsatfda_docs/label/2023/125514s143lbl.pdf. Accessed 2024 Apr 25.
64.Tabernero J, Hoff PM, Shen L, et al. Pertuzumab plus trastuzumab and chemotherapy for HER2-positive metastatic gastric or gastro-oesophageal junction cancer (JACOB): final analysis of a double-blind, randomised, placebo-controlled phase 3 study. Lancet Oncol. 2018;19(10):1372-1384. PubMed
65.Untitled ponsor's clinical summary report [internal sponsor's report]. In: Drug Reimbursement Review sponsor submission: pembrolizumab, 200 mg and 400 mg, IV infusion. Kirkland (QC): Merck; 2023.
66.Enhertu (trastuzumab deruxtecan): 100 mg and IV infusion [product monograph]. Mississauga (ON): AstraZeneca Canada Inc.; 2023.
67.PrecisionHeor. Systematic literature review and network meta-analyses for first-line treatment of locally advanced unresectable or metastatic gastric and gastroesophageal junction adenocarcinoma. HER2+ Feasibility assessment for indirect comparison (Canada) [sponsor provided reference]. 2023.
68.Janjigian Y, Kawazoe A, Weber P, et al. LBA-4 Initial data from the phase 3 KEYNOTE-811 study of trastuzumab and chemotherapy with or without pembrolizumab for HER2-positive metastatic gastric or gastroesophageal junction (G/GEJ) cancer. Annals of Oncology. 2021;32:S227.
69.Chung HC, Bang YJ, C SF, et al. First-line pembrolizumab/placebo plus trastuzumab and chemotherapy in HER2-positive advanced gastric cancer: KEYNOTE-811. Future Oncol. 2021;17(5):491-501. PubMed
70.Musoro JZ, Coens C, Sprangers MAG, et al. Minimally important differences for interpreting EORTC QLQ-C30 change scores over time: A synthesis across 21 clinical trials involving nine different cancer types. Eur J Cancer. 2023;188:171-182. PubMed
71.European Organisation for Research and Treatment of Cancer (EORTC). EORTC Quality of Life FAQ. Brussels (BE): EORTC. 2023: https://qol.eortc.org/faq/. Accessed 2024 Jan 15.
72.Braun DP, Gupta D, Grutsch JF, Staren ED. Can changes in health related quality of life scores predict survival in stages III and IV colorectal cancer? Health Qual Life Outcomes. 2011;9:62. PubMed
73.Brunelli C, Mosconi P, Boeri P, et al. Evaluation of quality of life in patients with malignant dysphagia. Tumori. 2000;86(2):134-138. PubMed
74.Tomaszewski KA, Püsküllüoğlu M, Biesiada K, Bochenek J, Nieckula J, Krzemieniecki K. Validation of the polish version of the eortc QLQ-C30 and the QLQ-OG25 for the assessment of health-related quality of life in patients with esophagi-gastric cancer. J Psychosoc Oncol. 2013;31(2):191-203. PubMed
75.Blazeby JM, Conroy T, Bottomley A, et al. Clinical and psychometric validation of a questionnaire module, the EORTC QLQ-STO 22, to assess quality of life in patients with gastric cancer. Eur J Cancer. 2004;40(15):2260-2268. PubMed
76.EORTC Quality of Life. Gastric Cancer (update of QLQ-STO22). Brussels (BEL): European Organisation for Research and Treatment of Cancer; 2024: https://qol.eortc.org/questionnaire/gastric-cancer-update-of-qlq-sto22/. Accessed 2024 Jan 15.
77.Protocol: Protocol number 811-00. A phase III randomized, double-blind trial comparing trastuzumab plus chemotherapy and pembrolizumab with trastuzumab plus chemotherapy and placebo as first-line treatment in participants with HER2 positive advanced gastric or gastroesophageal junction adenocarcinoma (KEYNOTE 811) [internal sponsor's report]. In: Drug Reimbursement Review sponsor submission: pembrolizumab, 200 mg Q3W IV solution Whitehouse Station (New Jersey): Merck Sharp & Dohme Corp; 2018.
78.Maurer W, Bretz F. Multiple testing in group sequential trials using graphical approaches. Stat Biopharm Res. 2012;5(4):9.
79.Liang KY ZS. Longitudinal data analysis of continuous and discrete responses for pre-post designs. Sankhyā Indian J Stat 2000;62(Series B).
80.Supplemental statistical analysis plan. Section 16.1.1.9. A phase III randomized, double-blind trial comparing trastuzumab plus chemotherapy and pembrolizumab with trastuzumab plus chemotherapy and placebo as first-line treatment in participants with HER2 positive advanced gastric or gastroesophageal junction adenocarcinoma (KEYNOTE 811) [internal sponsor's report]. In: Drug Reimbursement Review sponsor submission: pembrolizumab, 200 mg Q3W IV solution Whitehouse Station (New Jersey): Merck Sharp & Dohme Corp; 2018.
81.Committee for Medicinal Products for Human Use (CHMP). Guideline on the clinical evaluation of anticancer medicinal products. London (GB): European Medicines Agency; 2019: https://www.ema.europa.eu/en/documents/scientific-guideline/draft-guideline-evaluation-anticancer-medicinal-products-man-revision-6_en.pdf. Accessed 2024 Jun 17.
82.Merck. Prescribing information: Keytruda (pembrolizumab) injection, for IV use. Silver Spring (MD): U.S. Food and Drug Administration; 2023: https://www.accessdata.fda.gov/drugsatfda_docs/label/2023/125514s148lbl.pdf. Accessed 2023 Dec 12.
Appendix 1: Detailed Outcome Data
Please note that this appendix has not been copy-edited.
Figure 5: Forest Plot of PFS (BICR per RECIST 1.1) by Subgroup at IA2 — ITT Population
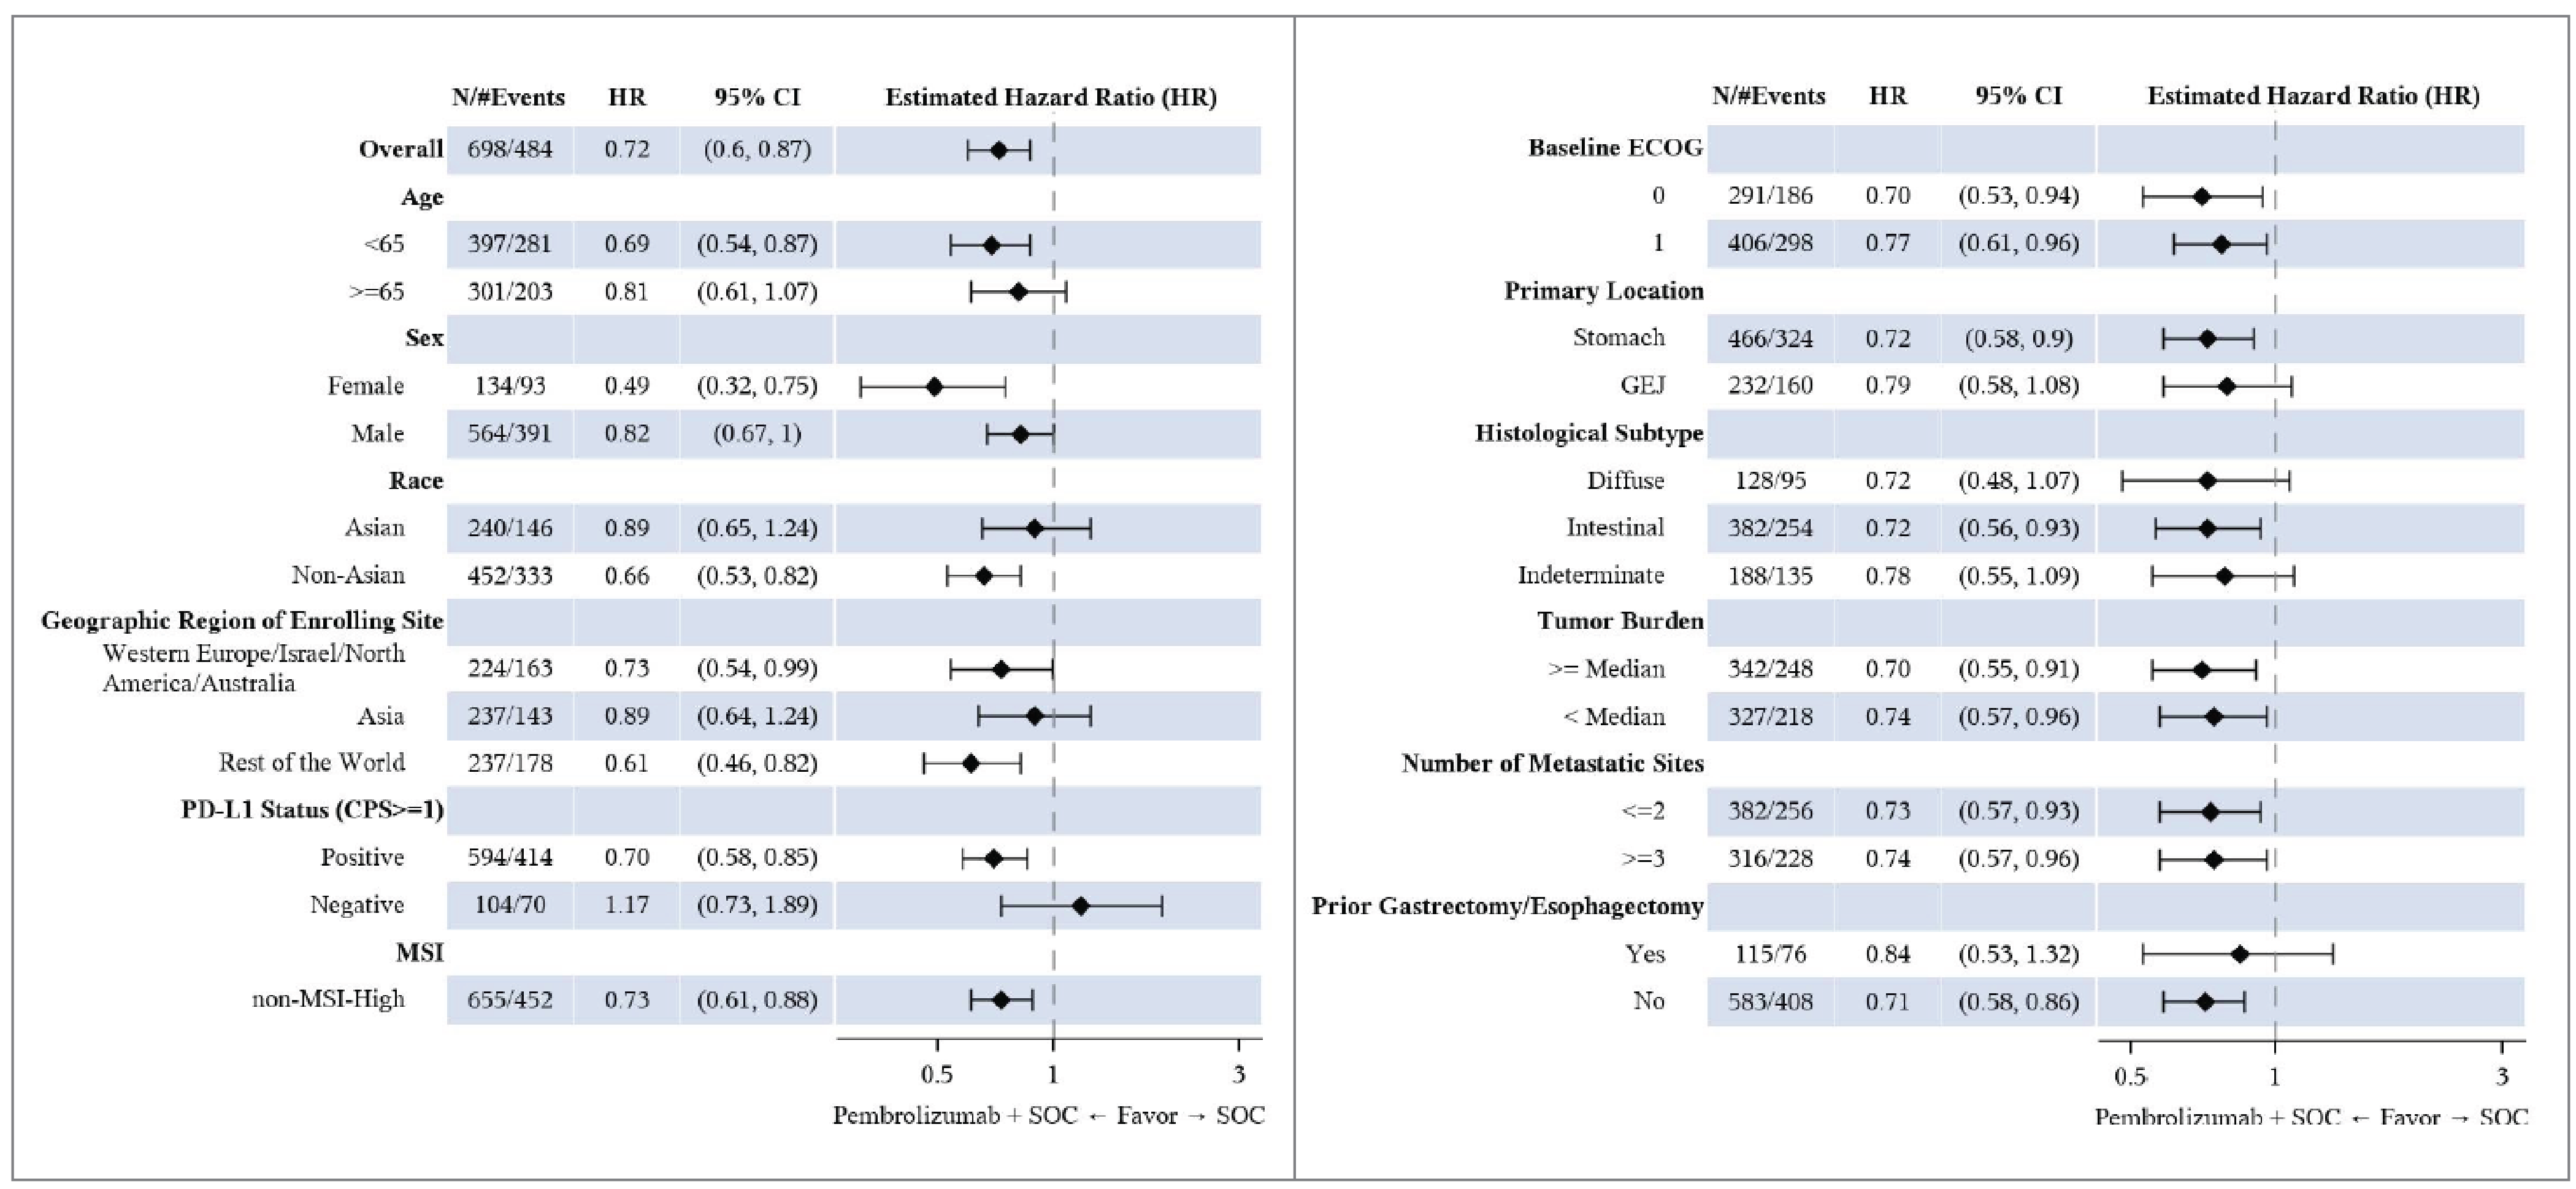
BICR = blinded independent central review; CI = confidence interval; CPS = combined positive score; ECOG = Eastern Collaborative Oncology Group; GEJ = gastroesophageal junction; HR = hazard ratio; MSI = microsatellite instability; PD-L1 = programmed cell death ligand 1; PFS = progression-free survival; RECIST 1.1 = Response Evaluation Criteria in Solid Tumours Version 1.1; SOC = standard of care (trastuzumab + platinum-fluoropyrimidine chemotherapy)
Note: Data cut-off date May 25, 2022
Source: Clinical Study Report for KEYNOTE-811.43 Details included in the figure are from the sponsor’s Summary of Clinical Evidence
Table 19: Protocol Deviations in the KEYNOTE-811 Trial — ITT Population
Protocol deviation | Full Study Population, N = 698 | PD-L1 CPS ≥ 1 Subgroup, N = 594 | ||
|---|---|---|---|---|
Pembrolizumab + SOC (N = 350) | Placebo + SOC (N = 348) | Pembrolizumab + SOC (N = 298) | Placebo + SOC (N = 296) | |
Patients with at least 1 important protocol deviation, N (%) | 37 (10.6) | 31 (8.9) | 35 (11.7) | 23 (7.8) |
Types of protocol deviationsa | ||||
Inclusion/exclusion criteria | 2 (0.6) | 4 (1.1) | 2 (0.7) | 4 (1.4) |
Patient had active of clinically significant cardiac disease or had inadequate cardiac function | 0 (0) | 1 (0.3) | 0 (0.0) | 1 (0.3) |
Patient not HER2+ by central lab | 2 (0.6) | 3 (0.9) | 2 (0.7) | 3 (1.0) |
Informed consent | 1 (0.3) | 1 (0.3) | 1 (0.3) | 0 (0.0) |
No documented informed consent | 1 (0.3) | 1 (0.3) | 1 (0.3) | 0 (0.0) |
Prohibited medicationsb | 1 (0.3) | 1 (0.3) | 0 (0.0) | 1 (0.3) |
Safety reportingc | 16 (4.6) | 16 (4.6) | 15 (5.0) | 12 (4.1) |
Study intervention | 16 (4.6) | 8 (2.3) | 15 (5.0) | 7 (2.4) |
Administered improperly stored study intervention that was deemed unacceptable for use | 12 (3.4) | 6 (1.7) | 12 (4.0) | 6 (2.0) |
Dispensed study intervention other than what was assigned | 5 (1.4) | 2 (0.6) | 4 (1.3) | 1 (0.3) |
Trial proceduresd | 8 (2.3) | 4 (1.1) | 8 (2.7) | 0 (0.0) |
aEvery patient is counted a single time for each applicable protocol deviation.
bAntineoplastic systemic chemotherapy, biologic therapy, immunotherapy, other investigational agents given while on treatment or before study entry during screening (unless allowed per protocol)
cPatient had a reportable safety event and/or follow-up safety event information that was not reported per the timelines outlined in the protocol
dFailure to conduct key safety or efficacy assessments
Note: Based on interim analysis 3 (data cut-off date March 29, 2023)
Source: From additional information request received January 12, 2024
Table 20: HRQoL Outcomes in the KEYNOTE-811 Trial Not Assessed Using GRADE — PRO Population
Outcomes | Full study population | PD-L1 CPS ≥ 1 subgroup | ||
|---|---|---|---|---|
Pembrolizumab + SOC (N = 350) | Placebo + SOC (N = 348) | Pembrolizumab + SOC (N = 298) | Placebo + SOC (N = 296) | |
EQ-5D-5L VAS, points | ||||
Baseline | ||||
n | 324 | 324 | 275 | 275 |
Mean (SD) | 76.33 (16.33) | 75.93 (18.61) | 76.49 (17.24) | 75.32 (18.48) |
Week 24 | ||||
n | 232 | 191 | 196 | 152 |
Mean (SD) | 78.66 (14.35) | 80.16 (14.40) | 78.85 (14.97) | 79.57 (14.78) |
Change from baseline to 24 weeks | ||||
n | 344 | 339 | 290 | 286 |
LS mean (95% CI)i | 0.95 (−0.87 to 2.76) | 1.63 (−0.30 to 3.56) | 1.20 (−0.83, 3.22) | 1.51 (−0.69, 3.70) |
Difference between groups | ||||
LS means (95% CI)i | −0.69 (−3.06 to 1.68) | Reference | −0.31 (−3.01, 2.39) | Reference |
P valueI,j | 0.5698 | Reference | 0.8217 | Reference |
EORTC QLQ-STO22 | ||||
Pain symptom scale | ||||
Baseline | ||||
n | 319 | 320 | NR | NR |
Mean (SD) | 24.40 (21.26) | 23.44 (21.80) | NR | NR |
Week 24 | ||||
n | 229 | 190 | NR | NR |
Mean (SD) | 13.65 (15.06) | 12.89 (15.23) | NR | NR |
Change from baseline to 24 weeks | ||||
n | 344 | 339 | NR | NR |
LS mean (95% CI)i | −9.76 (−11.87 to −7.65) | −9.74 (−11.97 to −7.51) | NR | NR |
Difference between groups | ||||
LS means (95% CI)i | −0.01 (−2.60 to 2.57) | Reference | NR | NR |
P valueI,j | 0.9916 | Reference | NR | NR |
Improvement and stability, n (%) | ||||
Improved or stable | 283 (82.0) | 266 (78.2) | 242 (83.2) | 224 (78.3) |
Improved | 138 (40.0) | 109 (32.1) | 117 (40.2) | 94 (32.9) |
Stable | 145 (42.0) | 157 (46.2) | 125 (43.0) | 130 (45.5) |
Deteriorated | 21 (6.1) | 25 (7.4) | 17 (5.8) | 22 (7.7) |
Unconfirmed | 8 (2.3) | 15 (4.4) | 7 (2.4) | 15 (5.2) |
No assessment | 33 (9.6) | 34 (10.0) | 25 (8.6) | 25 (8.7) |
Difference in improvement, % | ||||
Estimate (95%)k | 7.9 (0.7 to 15.1) | Reference | 7.3 (−0.6 to 15.1) | Reference |
P valuek | 0.0158 l | Reference | 0.0350 m | Reference |
Difference in improved and stable, % | ||||
Estimate (95% CI)k | 3.8 (−2.0 to 9.8) | Reference | 4.9 (−1.4 to 11.3) | Reference |
P valuek | 0.1002 l | Reference | 0.0653 m | Reference |
Deterioration | ||||
n | 319 | 320 | 271 | 273 |
Number of events, n (%) | 36 (11.3) | 34 (10.6) | 31 (11.4) | 29 (10.6) |
True deterioration rate at 12 months,m % (95% CI) | 86.5 (81.6 to 90.2) | 87.8 (83.2 to 91.1) | 86.4 (81.0, 90.3) | 87.7 (82.6, 91.3) |
Pairwise comparisons | ||||
Hazard ratio (95% CI)n | 0.99 (0.62 to 1.58) | Reference | 1.00 (0.60, 1.66) | Reference |
P value | 0.9681 o | Reference | 0.9943 o | Reference |
EORTC QLQ-C30 | ||||
Symptom Scale Nausea and Vomiting | ||||
Baseline | ||||
n | 320 | 322 | NP | NP |
Mean (SD) | 11.09 (19.73) | 11.54 (20.94) | NP | NP |
Week 24 | ||||
n | 231 | 190 | NP | NP |
Mean (SD) | 8.01 (17.01) | 7.28 (15.18) | NP | NP |
Change from baseline to week 24 | ||||
LS mean (95% CI)i | −3.24 (−5.60 to −0.89) | −3.57 (−6.08 to −1.05) | NP | NP |
Group difference groups (95% CI)i | 0.32 (−2.62 to 3.26) | Reference | NP | NP |
P valueI,j | 0.8302 | Reference | NP | NP |
Deterioration, months | ||||
Time to true deterioration, medianh | NP | NP | NR (NR, NR) | NR (NR, NR) |
True deterioration rate at 12 months,n % (95% CI) | NP | NP | 62.1 (55.6, 68.0) | 66.8 (59.9, 72.8) |
HR (95% CI)o | 1.23 (0.93, 1.63) | Reference | 1.24 (0.92, 1.68) | Reference |
P value | 0.1430 | Reference | 0.1596 | Reference |
Improvement and stability | ||||
Improved or stable | 267 (77.4) | 256 (75.3) | 229 (78.7) | 214 (74.8) |
Improved | 79 (22.9) | 72 (21.2) | 67 (23.0) | 56 (19.6) |
Stable | 188 (54.5) | 184 (54.1) | 162 (55.7) | 158 (55.2) |
Deteriorated | 36 (10.4) | 46 (13.5) | 31 (10.7) | 42 (14.7) |
Unconfirmed | 10 (2.9) | 6 (1.8) | 7 (2.4) | 6 (2.1) |
No assessment | 32 (9.3) | 32 (9.4) | 24 (8.2) | 24 (8.4) |
Difference in improved, % | ||||
Estimate (95%)k | 1.6 (−4.6 to 7.8) | Reference | 3.3 (−3.3 to 10.0) | Reference |
P valuek,o | 0.3055 | Reference | 0.1624 | Reference |
Difference in improved and stable, % | ||||
Estimate (95%)k | 2.1 (−4.2 to 8.4) | Reference | 3.9 (−2.9 to 10.7) | Reference |
P valuek,o | 0.2534 | Reference | 0.1300 | Reference |
CI = confidence interval; CPS = combined positive score; EORTC QLQ-STO22 = European Organisation for Research and Treatment of Cancer Quality of Life Questionnaire-STO22; HR = Hazard ratio; HRQoL = Health-related quality of life; LS = Least squares; NA = no assessment; NE = not evaluable; NP = not provided; NR = not reported; PD-L1 = programmed cell death 1 ligand 1; QoL = quality of life; SOC = standard of care.
Note: Based on interim analysis 3 (data cut-off date March 29, 2023), expect for HRQoL data for the ITT cohort, which was based on interim analysis 2 (data cut-off date May 25, 2022)
aStable disease includes SD, non-CR/non-PD and NED (no lesions were identified at baseline assessment and there remained no lesions at postbaseline assessment).
bPostbaseline assessment(s) were available however they were evaluable.
cNo postbaseline assessment was available for response evaluation.
dBased on Miettinen and Nurminen method stratified by geographic region (Europe/Israel/North America/Australia, Asia and Rest of the World), PD-L1 status (positive vs. negative), and chemotherapy regimen (CISPFU or CAPOX) with small strata collapsed.
eOne-sided P value for testing. H0: difference in % = 0 vs. H1: difference in % > 0.
fIncludes patients with best objective response as confirmed complete response or partial response.
g“+” indicates that there was no progressive disease by the time of last disease assessment.
hFrom product-limit (Kaplan-Meier) method for censored data.
iBased on a cLDA model with PRO scores as the response variable with covariates for treatment by study visit interaction and stratification factors (geographic region (Western Europe/Israel/North America/Australia, Asia and Rest of the World), PD-L1 status (positive vs. negative), and chemotherapy regimen (CISPFU or CAPOX)).
jTwo-sided P value based on t test
kBased on Meittinen and Nurminen method stratified by strata.
lOne-sided P value for testing: H0: difference in % = 0 vs. H1: difference in % > 0.
mPercentage were estimated by KM and represent the % of patients without a true deterioration at 12 months.
nBased on Cox regression model with Efron’s method of tie handling with treatment as a covariate stratified by (geographic region (Western Europe/Israel/North America/Australia, Asia, and Rest of the World), PD-L1 status (positive vs. negative), and chemotherapy regimen (CISPFU or CAPOX)).
oTwo-sided p value based on log-rank test stratified by geographic region (Western Europe/Israel/North America/Australia, Asia and Rest of the World) and chemotherapy regimen (CISPFU or CAPOX).
Source: Clinical Study Report for KEYNOTE-811,43 Statistical Report KN811 IA3,44 PRO Report.45 Details included in the table are from the sponsor’s Summary of Clinical Evidence
Pharmacoeconomic_Review
Abbreviations
AE
adverse event
BIA
budget impact analysis
CAPOX
capecitabine and oxaliplatin
CDA-AMC
Canada’s Drug Agency
CI
confidence interval
CISPFU
cisplatin and 5-fluorouracil
CPS
combined positive score
FOLFOX
leucovorin calcium (folinic acid), fluorouracil, and oxaliplatin
GEJ
gastroesophageal junction
ICER
incremental cost-effectiveness ratio
OS
overall survival
PD-L1
programmed cell death 1 ligand 1
PFS
progression-free survival
QALY
quality-adjusted life-year
RDI
relative dosing intensity
ToT
time on treatment
WTP
willingness to pay
Executive Summary
The executive summary comprises 2 tables (Table 1 and Table 2) and a conclusion.
Item | Description |
|---|---|
Drug product | Pembrolizumab (Keytruda), IV solution |
Indication | In combination with trastuzumab, fluoropyrimidine- and platinum-containing chemotherapy, is indicated for the first-line treatment of adult patients with locally advanced unresectable or metastatic HER2-positive gastric or gastroesophageal junction adenocarcinoma, whose tumours express PD-L1 (CPS ≥ 1), as determined by a validated test |
Health Canada approval status | NOC |
Health Canada review pathway | Standard |
NOC date | February 6, 2024 |
Reimbursement request | As per indication |
Sponsor | Merck Canada Inc. |
Submission history | Pembrolizumab (Keytruda) has been reviewed for numerous indications by Canada’s Drug Agency. Pembrolizumab was reviewed for esophageal carcinoma and gastroesophageal junction adenocarcinoma on December 2, 2021, with a recommendation to reimburse with conditions. |
CPS = combined positive score; NOC = Notice of Compliance; PD-L1 = programmed cell death 1 ligand 1.
Table 2: Summary of Economic Evaluation
Component | Description |
|---|---|
Type of economic evaluation | Cost-utility analysis PSM |
Target populations | Adults with locally advanced unresectable or metastatic HER2-positive gastric or gastroesophageal junction adenocarcinoma whose tumours express PD-L1 (CPS ≥ 1). |
Treatment | Pembrolizumab in combination with trastuzumab plus fluoropyrimidine- and platinum-containing chemotherapya (hereafter referred to as pembrolizumab plus trastuzumab and chemotherapy) |
Dose regimen | Pembrolizumab: 200 mg IV administered every 3 weeks for up to 35 cycles |
Submitted price | Pembrolizumab: 100 mg/4 mL: $4,400 per vial |
Submitted treatment cost | Pembrolizumab: $8,316 every 3 weeksb |
Comparator | Trastuzumab plus fluoropyrimidine- and platinum-containing chemotherapy (hereafter referred to as trastuzumab plus chemotherapy) |
Perspective | Canadian publicly funded health care payer |
Outcomes | QALYs, LYs |
Time horizon | Lifetime (25 years) |
Key data source | The KEYNOTE-811 trial informed PFS, OS, time on treatment, and health state utility values |
Submitted results | ICER = $191,271 per QALY gained (incremental costs = $142,868; incremental QALYs = 0.75). |
Key limitations |
|
CDA-AMC reanalysis results |
|
CDA-AMC = Canada’s Drug Agency; CPS = combined positive score; ICER = incremental cost-effectiveness ratio; LY = life-year; OS = overall survival; PD-L1 = programmed cell death 1 ligand 1; PFS = progression-free survival; PSM = partitioned survival model; QALY = quality-adjusted life-year; RDI = relative dose intensity; WTP = willingness to pay.
aChemotherapy was assumed by the sponsor to comprise capecitabine and oxaliplatin (CAPOX) or cisplatin and 5-fluorouracil (CISPFU).
bAssuming 94.5% RDI.
Conclusions
The clinical review by Canada’s Drug Agency (CDA-AMC) found that pembrolizumab in combination with standard of care (trastuzumab and chemotherapy) results in improved progression-free survival (PFS) among patients with programmed cell death 1 ligand 1 (PD-L1)-positive (combined positive score [CPS] ≥ 1), locally advanced, unresectable or metastatic, human epidermal growth factor receptor 2 (HER2)-positive gastric or gastroesophageal junction (GEJ) adenocarcinoma, based on data from the KEYNOTE-811 trial (mean duration of follow-up, approximately 38 months). Evidence from the KEYNOTE-811 trial suggests that at 36 months, the point estimate for adding pembrolizumab to SOC on overall survival (OS) exceeded the lower threshold suggested by the clinical experts for a clinically important benefit. However, the difference was small, and the certainty of this finding is decreased because the 95% confidence interval (CI) included the potential for little to no difference in OS compared to placebo plus SOC. The clinical review additionally found that the addition of pembrolizumab to trastuzumab and chemotherapy may result in little to no difference in health-related quality of life.
Analyses undertaken by CDA-AMC addressed several limitations in the sponsor’s analysis. These included adopting Kaplan-Meier data for OS and PFS from the KEYNOTE-811 for the trial period, alternative extrapolations for PFS and OS after the trial period, alternative distributions of subsequent treatments, 100% relative dose intensity (RDI) for all treatments, and age-based utility adjustments. Results of the CDA-AMC base case suggest that, at a $50,000 per quality-adjusted life-year (QALY) willingness-to-pay (WTP) threshold, pembrolizumab plus trastuzumab and chemotherapy is not a cost-effective treatment option for the first-line treatment of locally advanced, unresectable or metastatic, HER2-positive, PD-L1-positive GEJ adenocarcinoma. Relative to trastuzumab and chemotherapy alone, the cost of pembrolizumab would need to decrease to approximately $453 per 100 mg/4 mL vial using a fixed dosage regimen, or to $638 per 100 mg/4 mL vial using a weight-based dose, in order for pembrolizumab plus trastuzumab and chemotherapy to be considered cost-effective at a $50,000 per QALY threshold. This translates to a 28-day pembrolizumab cost of approximately $1,208 for fixed dosing and $1,160 for weight-based dosing.
Although the CDA-AMC base case estimated a gain in OS and QALYs with pembrolizumab plus trastuzumab and chemotherapy (incremental OS = 0.41 months; incremental QALYs = 0.36), 71% of the incremental OS and 72% of the incremental QALYs were gained in the extrapolated period. In the absence of comparative evidence beyond the trial duration, the incremental benefit of pembrolizumab plus trastuzumab and chemotherapy predicted in the CDA-AMC base case is highly uncertain, may be overestimated, and additional price reductions may be required.
Stakeholder Input Relevant to the Economic Review
This section is a summary of the feedback received from the patient groups, clinician groups, and drug plans that participated in the CDA-AMC review process.
Patient input was received from My Gut Feeling – Stomach Cancer Foundation of Canada, which provided input based on an online survey conducted in November 2023; respondents included 40 patients and caregivers (73% from Canada; 16% with HER2-positive disease). Patients described experiencing at least 1 symptom before diagnosis, including weight loss, reflux, appetite changes, pain, nausea and/or vomiting, and difficulty swallowing. Respondents reported that their cancer diagnosis had a significant impact on their quality of life, including their physical and mental health, ability to eat and work, social life, identity, and personal image. Patients additionally described loss of fertility, feeling isolated, worries over finances or financial difficulties, as well as financial and geographical barriers to accessing treatment and health care providers. Patients noted that the side effects of current treatment options included fatigue, appetite and taste changes, weight loss, alopecia, and neuropathy, and some patients reported stopping treatment after being admitted to hospital for the treatment of an adverse event (AE). Treatment goals described by respondents included prolonging survival, reducing recurrence, shrinking tumours, and improving symptoms and quality of life, as well as improved treatment tolerability. Respondents also described a need for equitable access, convenience of administration (e.g., oral versus IV, less frequent travel to hospital, shorter administration time), and a desire for more treatment options from which to choose based on their values and preferences. Last, patient input emphasized that biomarker testing should be accessible to all Canadians at the onset of their disease.
Clinician input was received from the Canadian Gastrointestinal Oncology Evidence Network (CGOEN) and from Ontario Health – Cancer Care Ontario Gastrointestinal Drug Advisory Committee (OH-CCO GI DAC). The clinician input indicated that immunotherapy is currently only available for patients with HER2-negative diseases, which is an unmet need for patients with HER2-positive disease. Input noted that patients best suited to receive pembrolizumab would be those with a CPS of 1 or more based on a validated test, and that response to treatment would be assessed in practice with routine imaging, as well as patient preference, tolerability, and quality of life. The clinician groups noted that patients would be evaluated on a regular basis for clinical response and toxicity, per current treatment standards. The clinician input noted that pembrolizumab should only be prescribed by or under the supervision of a specialist in medical oncology with expertise in the management of immunotherapy-related side effects, but that it could potentially be administered in hospital or outpatient clinics or in oncology clinics.
Drug plan input received by CDA-AMC for this review noted that PD-L1 testing must be operationalized and funded in some jurisdictions before pembrolizumab can be reimbursed for the target population. The plans noted the confidential listing prices for trastuzumab biosimilars, which would affect the overall costs of this treatment regimen. The plans also questioned the timing of pembrolizumab initiation and the financial impact of prescribing pembrolizumab to patients who are currently on platinum plus fluoropyrimidine-based chemotherapy. The drug plans noted that they intend to adopt weight-based dosing for pembrolizumab, similar to its use in the treatment of other cancers. This would involve administering the medication at 2 mg/kg every 3 weeks, capped at 200 mg, or 4 mg/kg every 6 weeks, with a maximum dose of 400 mg.
Several of these concerns were addressed in the sponsor’s model:
The treatment goals of PFS and OS, as well as AEs, were modelled.
The cost of PD-L1 testing was included.
CDA-AMC addressed some of these concerns, as follows:
aligning the distribution of subsequent treatments with clinical practice in Canada
exploring the impact of weight-based dosing for pembrolizumab and an extended dosing interval for pembrolizumab (400 mg every 6 weeks) in scenario analyses.
CDA-AMC was unable to address the following concerns raised from stakeholder input:
The drug plans’ concerns regarding the timing of pembrolizumab initiation and the financial implications for patients already undergoing platinum plus fluoropyrimidine-based chemotherapy.
Economic Review
Economic Evaluation
Summary of the Sponsor’s Economic Evaluation
Overview
The sponsor submitted a cost-utility analysis that compared costs and outcomes for pembrolizumab plus trastuzumab and fluoropyrimidine-containing chemotherapy and platinum-containing chemotherapy (assumed by the sponsor to be capecitabine plus oxaliplatin [CAPOX] or cisplatin plus 5-fluorouracil [CISPFU]) compared with trastuzumab plus CAPOX or CISPFU. The modelled population comprised adult patients with locally advanced, unresectable or metastatic, HER2-positive GEJ adenocarcinoma whose tumours express PD-L1 (CPS ≥ 1), based on the KEYNOTE-811 trial population,1 and was in line with the Health Canada indication and reimbursement request.
Pembrolizumab is available as a solution for infusion (100 mg/4 mL vial). The recommended dosage of pembrolizumab is 200 mg every 3 weeks or 400 mg every 6 weeks, in combination with trastuzumab (8 mg/kg loading dose, 6 mg/kg maintenance dose) and CAPOX or CISPFU every 3 weeks. At the submitted price of $4,400 per 4 mL vial, the cost of pembrolizumab per 3-week cycle was estimated by the sponsor to be $8,316 (assuming ████% RDI). When used in combination with trastuzumab and CAPOX or CISPFU, at the sponsor’s assumed dose intensities for each drug, the total regimen cost per cycle was $10,324. The total regimen cost per 21-day cycle for trastuzumab plus CAPOX or CISPFU was $2,014. The sponsor incorporated vial sharing and RDI in the calculation of drug costs.
The clinical outcomes were QALYs and life-years. The economic analysis was undertaken over a time horizon of 25 years from the perspective of a publicly funded health care system in Canada. Costs and QALYs were discounted at a rate of 1.5% per annum.
Model Structure
The sponsor submitted a partitioned survival model (PSM) with 3 health states: progression-free, progressed disease, and death (Appendix 3; Figure 1). The proportions of patients who were progression-free, who experienced progressed disease, or who were dead at any time over the model horizon were derived from nonmutually exclusive survival curves. All patients entered the model in the progression-free state and were assumed to receive treatment until disease progression and/or the development of treatment-limiting or treatment-related AEs. Patients could discontinue treatment but remain in the progression-free health state based on the time-on-treatment (ToT) curve and, upon discontinuation, the cost of first-line treatment would no longer be incurred. At the end of each weekly cycle, the proportion of patients with progressed disease or death was derived based on the area under the survival curves. Specifically, OS was partitioned to estimate the proportion of patients in the death state, whereas the PFS curve was used to estimate the proportion of patients in the progression-free health state. The difference between the OS curve and the PFS curve was partitioned at each time point to estimate the proportion of patients in the progressive disease health state. Disease progression was determined by investigator assessment according to Response Evaluation Criteria in Solid Tumours Version 1.1 (RECIST 1.1). Patients who transitioned to the progressed disease state incurred costs associated with subsequent treatment.
Model Inputs
The modelled population reflected the baseline characteristics of participants with a CPS of 1 or more in the KEYNOTE-811 trial.1 In KEYNOTE-811, adult participants with HER2-positive advanced gastric or GEJ adenocarcinoma were randomly assigned to receive pembrolizumab plus trastuzumab and chemotherapy or trastuzumab plus chemotherapy as a first-line treatment. The mean age of patients in the model was 61 years, mean body surface area was 1.8 m2, and mean weight was 68.2 kg.
The key clinical efficacy inputs (PFS, OS, ToT) for pembrolizumab plus trastuzumab and chemotherapy and for trastuzumab plus chemotherapy were derived from the KEYNOTE-811 trial (data cut-off date: March 29, 2023). The sponsor used spline models (hazards with 2 knots) to fit patient-level data from the KEYNOTE-811 trial and estimate PFS and OS during and after the end of the trial follow-up period, and selected survival models on the basis of clinical validity and statistical fit. Kaplan-Meier data for ToT from the KEYNOTE-811 trial are mature, and no data extrapolation were required. The proportion of patients receiving subsequent treatments after discontinuation in each treatment arm was based data from the KEYNOTE-811 trial.
The model accounted for grade 3 or higher all-cause and treatment-related AEs that were reported in at least 3% of participants in any treatment arm of the KEYNOTE-811 trial.
Health state utility values were based on 5-Level EQ-5D (EQ-5D-5L) data collected in the KEYNOTE-811 trial, which were valued using Canadian tariffs.2 The same utility values were applied to all treatment arms in the model. Disutility due to AEs was calculated in each treatment arm as a function of the mean duration of AEs, the estimated disutility associated with grade 3 or higher AEs, and the proportion of AEs.
The model included costs related to drug acquisition and administration, disease management, AEs, terminal care, and PD-L1 testing. Drug-acquisition costs were calculated by the sponsor as a function of unit drug costs, dosing schedules, RDI reported in the KEYNOTE-811 trial, and the proportion of patients on treatment based on ToT curves. Acquisition costs were based on the sponsor’s submitted price for pembrolizumab and were sourced from CDA-AMC economic reports and the Ontario Drug Formulary for chemotherapies and comparators.3-6 The sponsor assumed that all patients would receive pembrolizumab at a dosage of 200 mg every 3 weeks. The dosing schedule for pembrolizumab was based on the KEYNOTE-811 trial, whereas dosing schedules for trastuzumab, CAPOX, and CISPFU were based on the KEYNOTE-811 trial and Cancer Care Ontario regimens. The sponsor’s model applied maximum treatment durations of 35 cycles (105 weeks) for pembrolizumab and 6 cycles (18 weeks) for CISPFU, and assumed that trastuzumab and CAPOX were administered until disease progression. The duration of subsequent treatments was obtained from the KEYNOTE-811 trial. Drug-administration costs included costs associated with the infusion time required to administer the drug. Disease-management costs included CT scans, full blood count, renal function tests, hepatic function tests, and medical consultations, with unit costs for resources obtained from local estimates. Costs for the management of AEs were obtained from the 2019 Canadian Institute for Health Information (CIHI) Patient Cost Estimator. Terminal care costs were applied to patients who transitioned to the death health state; the cost estimate was obtained from the literature.7
Summary of the Sponsor’s Economic Evaluation Results
All analyses were run probabilistically (1,300 iterations), and the deterministic and probabilistic results were similar. The probabilistic findings are presented here. The submitted analyses were based on the submitted price for pembrolizumab and publicly available prices for other drugs. Additional results from the sponsor’s submitted economic evaluation base case are presented in Appendix 3.
Base-Case Results
In the sponsor’s base case, pembrolizumab plus trastuzumab and chemotherapy was associated with an incremental cost of $142,868 and 0.75 incremental QALYs over the lifetime horizon (25 years), resulting in an incremental cost-effectiveness ratio (ICER) of $191,271 per QALY compared to trastuzumab plus chemotherapy alone (Table 3). At a WTP threshold of $50,000 per QALY gained, the probability of pembrolizumab plus trastuzumab and chemotherapy being cost-effective was 0%. Approximately 93% of the incremental QALYs associated with pembrolizumab plus trastuzumab and chemotherapy were accrued beyond the trial follow-up period and based on the sponsor’s extrapolation of trial data.
The main cost drivers were drug-acquisition costs, which were influenced by RDI and the duration of subsequent treatments. Pembrolizumab plus trastuzumab and chemotherapy was predicted by the sponsor’s model to result in an additional 0.85 life-years relative to trastuzumab and chemotherapy alone. At the end of the model horizon (i.e., 25 years), approximately 2% of patients are predicted to remain alive in the pembrolizumab plus trastuzumab and chemotherapy group, compared with 1% in the trastuzumab and chemotherapy group.
Table 3: Summary of the Sponsor’s Economic Evaluation Results
Drug | Total costs ($) | Incremental costs ($) | Total QALYs | Incremental QALYs | ICER vs. trastuzumab + chemotherapy ($/QALY) |
|---|---|---|---|---|---|
Trastuzumab + chemotherapy | 174,752 | Reference | 2.29 | Reference | Reference |
Pembrolizumab + trastuzumab + chemotherapy | 317,621 | 142,868 | 3.04 | 0.75 | 191,271 |
ICER = incremental cost-effectiveness ratio; QALY = quality-adjusted life-year.
Note: Chemotherapy was assumed by the sponsor to comprise capecitabine and oxaliplatin (CAPOX) or 5-fluorouracil and cisplatin (CISPFU).
Source: Sponsor’s pharmacoeconomic submission.8
Sensitivity and Scenario Analysis Results
The sponsor provided deterministic scenario analyses that explored the impact of adopting alternative parametric survival models, incorporating alternative treatment-waning assumptions, using a different approach to derive health utility values, assuming 100% RDI, and using alterative time horizon or discount rates. Cost-effectiveness results were robust to changes in most parameters and assumptions. The scenarios with the greatest impact on the ICER were changes to discounting rates. Compared to trastuzumab and chemotherapy, the estimated ICERs for pembrolizumab plus trastuzumab and chemotherapy ranged between $167,949 per QALY (using 0% discount rate) and $238,642 per QALY (using 5% discount rate). No subgroup analyses were conducted.
The sponsor conducted a probabilistic scenario analysis from a societal perspective, which included additional costs associated with productivity loss. In this analysis, the ICER for pembrolizumab plus trastuzumab and chemotherapy was $176,791 per QALY gained. This was lower than the sponsor’s base-case analysis using a health care payer perspective.
CDA-AMC Appraisal of the Sponsor’s Economic Evaluation
CDA-AMC identified several key limitations to the sponsor’s analysis that have notable implications on the economic analysis:
Uncertainty about the long-term survival benefits of pembrolizumab in combination with trastuzumab and chemotherapy. The sponsor submitted a PSM in which treatment efficacy is represented by PFS and OS curves, informed by observations from the KEYNOTE-811 trial and extrapolated over the model’s horizon (25 years). In the pharmacoeconomic analysis, the long-term extrapolation of OS resulted in an incremental gain of approximately 9.48 months. Approximately 93% of QALYs derived from pembrolizumab treatment were accrued after the trial duration in the sponsor’s base case. The CDA-AMC clinical review found that, based on the latest analysis at 36 months (interim analysis 3), the point estimate for adding pembrolizumab to standard of care on OS exceeded the lower threshold suggested by the clinical experts for a clinically important benefit. However, the difference was small, and the certainty of this finding is decreased because the 95% CI included the potential for little to no difference in OS compared to placebo plus standard of care. Further, clinical expert input received by CDA-AMC for this review suggests that the extrapolation of OS data in the economic model likely overestimates pembrolizumab's long-term survival benefits, given that median survival rates for patients vary significantly, from approximately 4 months with best supportive care alone to less than 12 months with systemic chemotherapy.9
The clinical experts consulted by CDA-AMC also noted that the survival rates predicted through extrapolation in the sponsor's base-case analysis were overestimated. For example, the sponsor’s model estimates that about 21% of patients receiving pembrolizumab plus trastuzumab and chemotherapy would still be alive 5 years after the initiation of treatment. However, the clinical experts consulted by CDA-AMC indicated that a more realistic survival rate is approximately 5% at 5 years.
Further concerns were identified regarding the predicted survival benefits of pembrolizumab combined with chemotherapy, attributing this uncertainty to the sponsor’s choice of a PSM. Although this modelling approach is suitable in the decision-making context, it relies on structural assumptions about the PFS and OS relationship. Such assumptions may suggest optimistic postprogression survival for patients treated with pembrolizumab plus trastuzumab and chemotherapy.
CDA-AMC was unable to fully assess concerns related to this limitation. In the CDA-AMC base case, CDA-AMC adopted PFS data and OS data from the Kaplan-Meier estimates of the KEYNOTE-811 trial and adopted alternative extrapolation models that resulted in a 5-year survival rate closer to 5%, as suggested by clinical experts consulted by CDA-AMC.
The distribution of subsequent treatments is not reflective of clinical practice in Canada. In the base case, the sponsor estimated the costs associated with subsequent therapy after disease progression based on the distribution of subsequent treatments observed in the KEYNOTE-811 trial, after the removal of treatments not approved in Canada for the subsequent treatment of gastric cancer. Feedback from clinical experts consulted by CDA-AMC indicated that the treatment distributions adopted by the sponsor do not reflect clinical practice in Canada, and potentially bias the results in favour of pembrolizumab.
In the CDA-AMC base case, CDA-AMC adopted an alternate distribution of subsequent treatments, based on market share estimates from the Oncology Continuous Audit of Patients and Prescriptions (ONCO-CAPPS) Syndicated Drug Intelligence 2023 Q2 Gastric/GEJ/Esophageal Treater Survey report for Canada,10 which was provided as an option in the sponsor’s model.
Health state utility values lacked face validity. In the sponsor's base case, health state utility values were estimated based on 5-Level EQ-5D observations from the KEYNOTE-811 trial. CDA-AMC notes that the utility value adopted by the sponsor for patients in the progression-free health state was greater than population averages in Canada11 for the same age group (i.e., █████ versus 0.839) and was comparable to the utility value adopted for progressed disease (█████). According to the clinical experts consulted by CDA-AMC for this review, patient quality of life generally declines as the condition progresses. As a result, the utility value adopted by the sponsor for the progressed disease state lacks face validity and likely overestimates patients' postprogression quality of life, which biases the results in favour of pembrolizumab. The degree of the bias in favour of pembrolizumab is unknown, which adds uncertainty about the impact of health state utility values on the ICER.
CDA-AMC additionally notes concerns regarding the sponsor's omission of baseline utility values in their health utility analysis. Although economic evaluations from randomized controlled trials often presume that baseline characteristics are balanced across treatment groups, a difference in mean baseline utility among trial arms can occur. Such imbalances can significantly skew ICERs, given its high sensitivity to slight variations in QALYs stemming from differences in baseline utility.12
In the CDA-AMC reanalysis, CDA-AMC applied age-based utility decrements, which is provided as an option in the sponsor’s model.
The use of RDI may underestimate actual drug costs. The sponsor's base case reduced dose intensities for pembrolizumab, trastuzumab, and chemotherapy drugs using the RDIs observed in the KEYNOTE-811 trial. CDA-AMC notes that changes in RDI can result from numerous factors, including clinical judgment, dose delays, missed doses, and dose reductions, and such adjustments impact drug costs differently, especially when drug wastage is considered. Consistent with prior pembrolizumab reviews and due to the challenge of correlating specific dose intensities with patient outcomes, the CDA-AMC reanalysis did not include RDIs.
In the CDA-AMC base case, an RDI of 100% was assumed for pembrolizumab, trastuzumab, and chemotherapy. The impact of this change was explored in a scenario analysis.
Pembrolizumab dosing used in the submitted model did not align with the implementation strategy of public drug plans. In the KEYNOTE-811 study, pembrolizumab was administered at a fixed dosage of 200 mg IV every 3 weeks; in the economic model, the sponsor assumed that all patients would receive 200 mg every 3 weeks. Input from participating public drug plans indicates that a weight-based dosing is likely to be adopted for pembrolizumab (2 mg/kg [up 200 mg] every 3 weeks or 4 mg/kg [up to 400 mg] every 6 weeks). The clinical experts consulted by CDA-AMC felt that this approach would be appropriate. CDA-AMC notes that adopting a weight-based dosing strategy would decrease drug-acquisition costs for pembrolizumab (and hence the ICER for pembrolizumab plus trastuzumab and chemotherapy), while also providing better dosing flexibility. However, CDA-AMC notes that it is not possible to make the direct assumption that weight-based dosing would lead to the same outcomes as fixed dosing. The fact that patients would be exposed to a lower dose may impact the AE profile and the rate of discontinuation, which could affect treatment efficacy.
CDA-AMC was unable to fully address this limitation, given the uncertainty around the impact of different dosing regimens on treatment efficacy, and its impact on pembrolizumab acquisition costs (i.e., with no impact on clinical efficacy) was explored in a scenario analysis.
Additionally, the following key assumptions were made by the sponsor and have been appraised by CDA-AMC (Table 4.)
Table 4: Key Assumptions of the Submitted Economic Evaluation (Not Noted as Limitations of the Submission)
Sponsor’s key assumption | CDA-AMC comment |
|---|---|
The modelled population reflects the PD-L1-positive (CPS ≥ 1) subgroup of the KEYNOTE-811 trial. | Appropriate. The Health Canada–approved indication is for patients with PD-L1-positive (CPS ≥ 1), locally advanced, unresectable or metastatic, HER2-positive gastric or gastroesophageal junction adenocarcinoma, which is aligned with the modelled population and was a predefined subgroup of the KEYNOTE-811 trial. |
Chemotherapy was assumed by the sponsor to comprise CAPOX or CISPFU, based on the KEYNOTE-811 trial. | Reasonable. The clinical experts consulted by CDA-ACM for this review indicated that FOLFOX, CAPOX, and CAPECISP are the most commonly used chemotherapy backbones in Canada; however, the standard first-line platinum and fluoropyrimidine doublet options also include FOLFOX, CAPOX, CISPFU, and CAPECISP. The impact of these assumptions on the ICER is expected to be minor, given the comparable drug-acquisition costs for chemotherapy regimens. |
Costs and disutilities were incorporated for treatment-related grade 3 or higher AEs reported by at least 3% of patients in any treatment arm of the KEYNOTE-811 trial. | Uncertain. The inclusion of only treatment-related AEs is problematic, given that determining the cause of the AE relies on investigator judgment. Instead, all AEs that have clinical or cost consequences should be included in the model.13 Further, the inclusion of only grade 3 or higher AEs experienced by at least 3% of trial participants may not capture the costs and consequences of rare AEs. |
The unit cost of PD-L1 testing was assumed to be $105, and 85.1% of patients tested were assumed to have a positive result. | Acceptable. The cost per test was obtained from the Quebec Directory and Measurement System for Medical Biology Procedures, and the percentage of patients who test positive for PD-L1 was based on the population from the KEYNOTE-811 trial with CPS ≥ 1. Using these inputs, the cost of identifying 1 patient with PD-L1-positive disease was $123. The sponsor did not provide information on the diagnostic accuracy of PD-L1 testing, including sensitivity and specificity. |
Drug wastage was assumed. | Uncertain. The sponsor assumed that vial sharing would occur, with 5% of the vial contents wasted. Vial sharing is common in large centres, but there are no data on the percentage of excess drug wasted when vial sharing is allowed. As such, the sponsor’s assumption of 5% drug wastage when vial sharing is allowed is uncertain. CDA-AMC notes that assuming vial sharing with 0% drug wastage is expected to have minimal impact on the results. |
AE = adverse event; CAPECISP = capecitabine plus cisplatin; CAPOX = capecitabine plus oxaliplatin; CDA-AMC = Canada’s Drug Agency; CISPFU = 5-fluorouracil plus cisplatin; CPS = combined positive score; FOLFOX = leucovorin calcium (folinic acid), fluorouracil, and oxaliplatin; ICER = incremental cost-effectiveness ratio; PD-L1 = programmed cell death 1 ligand 1.
CDA-AMC Reanalyses of the Economic Evaluation
Base-Case Results
CDA-AMC undertook reanalyses to address some of the key limitations of the submitted model, as summarized in Table 5. The CDA-AMC base case was derived by making changes to model parameter values and assumptions in consultation with clinical experts. The number of probabilistic iterations was increased in the CDA-AMC base case (to 3,000) to improve the stability of the model’s results.
Table 5: CDA-AMC Revisions to the Submitted Economic Evaluation
Stepped analysis | Sponsor’s value or assumption | CDA-AMC value or assumption |
|---|---|---|
Changes to derive the CDA-AMC base case | ||
1. PFS and OS during the trial period | Transition probabilities during the trial period were derived from predicted OS and PFS data | Transition probabilities during the trial period were based on KM OS and KM PFS data provided by the sponsor |
2. Extrapolation of PFS and OS |
|
|
3. Distribution of subsequent treatments | Based on data from the KEYNOTE-811 trial. Pembrolizumab plus trastuzumab and chemotherapy:
Trastuzumab plus chemotherapy:
| Based on data from the ONCO-CAPPS Syndicated Drug Intelligence 2023 Q2 Gastric/GEJ/Esophageal Treater Survey report for Canada.10 Pembrolizumab plus trastuzumab and chemotherapy:
Trastuzumab plus chemotherapy:
|
4. RDI | RDI < 100% (varied by drug) | 100% for all drugs |
5. Utilities | Age-based utility decrements not applied | Age-related utility decrements applied |
CDA-AMC base case | ― | 1 + 2 + 3 + 4 + 5 |
CDA-AMC = Canada’s Drug Agency; FOLFIRI = leucovorin calcium (folinic acid), fluorouracil, and irinotecan hydrochloride; KM = Kaplan-Meier; ONCO-CAPPS = Oncology Continuous Audit of Patients and Prescriptions; OS = overall survival; PFS = progression-free survival; RDI = relative dose intensity.
In the CDA-AMC base case, pembrolizumab plus trastuzumab and chemotherapy was more expensive ($153,454) and produced more QALYs (0.36) than trastuzumab and chemotherapy alone, with an ICER of $425,549 per QALY gained (Table 6). The probability of pembrolizumab combined with trastuzumab and chemotherapy being cost-effective at a WTP threshold of $50,000 per QALY gained was 0%.
Results were driven by the drug-acquisition cost of pembrolizumab plus trastuzumab and chemotherapy (incremental cost = $157,327) (Table 11), as well as the predicted incremental gain of 0.36 QALYs with pembrolizumab plus trastuzumab and chemotherapy compared to trastuzumab plus chemotherapy alone. Consistent with the sponsor’s analysis, the CDA-AMC reanalysis estimates that the majority of incremental OS benefit (71%) and QALYs (72%) gained will be accumulated after the duration of the KEYNOTE-811 trial, on the basis of extrapolated data.
Table 6: Summary of the Stepped Analysis of the CDA-AMC Reanalysis Results
Stepped analysis | Druga | Total costs ($) | Total QALYs | ICER ($/QALY) |
|---|---|---|---|---|
Sponsor’s base case | Trastuzumab + chemotherapy | 174,492 | 2.25 | Reference |
Pembrolizumab + trastuzumab + chemotherapy | 315,834 | 3.00 | 188,516 | |
CDA-AMC reanalysis 1: OS and PFS during the trial period | Trastuzumab + chemotherapy | 172,974 | 2.19 | Reference |
Pembrolizumab + trastuzumab + chemotherapy | 309,915 | 2.79 | 229,123 | |
CDA-AMC reanalysis 2: Extrapolation of OS and PFS | Trastuzumab + chemotherapy | 162,149 | 1.68 | Reference |
Pembrolizumab + trastuzumab + chemotherapy | 305,698 | 2.06 | 377,498 | |
CDA-AMC reanalysis 3: Distribution of subsequent treatments | Trastuzumab + chemotherapy | 178,671 | 2.25 | Reference |
Pembrolizumab + trastuzumab + chemotherapy | 321,595 | 3.00 | 190,625 | |
CDA-AMC reanalysis 4: 100% RDI | Trastuzumab + chemotherapy | 175,873 | 2.25 | Reference |
Pembrolizumab + trastuzumab + chemotherapy | 325,961 | 3.00 | 200,181 | |
CDA-AMC reanalysis 5: Age-based utility decrements | Trastuzumab + chemotherapy | 174,492 | 2.21 | Reference |
Pembrolizumab + trastuzumab + chemotherapy | 315,834 | 2.92 | 197,628 | |
CDA-AMC base case | Trastuzumab + chemotherapy | 167,978 | 1.67 | Reference |
Pembrolizumab + trastuzumab + chemotherapy | 321,448 | 2.03 | 425,193 | |
CDA-AMC base case (1 + 2 + 3 + 4 + 5) (probabilistic) | Trastuzumab + chemotherapy | 168,048 | 1.67 | Reference |
Pembrolizumab + trastuzumab + chemotherapy | 321,502 | 2.03 | 425,549 |
CDA-AMC = Canada’s Drug Agency; ICER = incremental cost-effectiveness ratio; OS = overall survival; PFS = progression = free survival; QALY = quality-adjusted life-year; RDI = relative dose intensity.
aChemotherapy was assumed by the sponsor to comprise capecitabine and oxaliplatin (CAPOX) or cisplatin and 5-fluorouracil(CISPFU).
Scenario Analysis Results
The aforementioned analyses are based on publicly available prices of the comparator treatments and on a fixed-dose regimen for pembrolizumab. With the scenario analysis incorporating weight-based dosing for pembrolizumab, the incremental costs with pembrolizumab were $107,263 and the incremental QALYs were 0.36. This leads to a lower ICER of $297,169. Additional scenario analyses conducted by CDA-AMC to explore the uncertainty of the cost-effectiveness of pembrolizumab are provided in Table 12.
CDA-AMC undertook a price-reduction analysis based on the sponsor’s base case and the CDA-AMC base case (fixed pembrolizumab dose) and the CDA-AMC scenario analysis (weight-based pembrolizumab dose).
Based on the CDA-AMC base case, a price reduction of at least 89% for pembrolizumab is required for the ICER to be reduced to $50,000 per QALY gained (Table 7). Based on the CDA-AMC scenario, if a weight-based approach is adopted for pembrolizumab, a price reduction of at least 85% is required for the ICER to be reduced to $50,000 per QALY gained.
Table 7: CDA-AMC Price-Reduction Analyses
Analysis | Unit drug cost ($) | ICERs for pembrolizumab plus trastuzumab and chemotherapy | ||
|---|---|---|---|---|
Price reduction | $ | Sponsor base case | CDA-AMC base case | CDA-AMC scenario (weight-based dose) |
No price reduction | 4,400 | 191,271 | 425,549 | 297,169 |
10% | 3,960 | 172,966 | 382,512 | 269,149 |
20% | 3,520 | 153,412 | 341,243 | 239,600 |
30% | 3.080 | 135,172 | 299,427 | 209,988 |
40% | 2,640 | 115,382 | 258,917 | 180,618 |
50% | 2,200 | 93,158 | 213,839 | 151,319 |
60% | 1,760 | 77,852 | 173,606 | 122,530 |
70% | 1,320 | 57,080 | 131,952 | 93,462 |
80% | 880 | 39,362 | 90,056 | 64,178 |
90% | 440 | 16,871 | 47,893 | 35,074 |
CDA-AMC = Canada’s Drug Agency; ICER = incremental cost-effectiveness ratio; QALY = quality-adjusted life-year.
aChemotherapy was assumed by the sponsor to comprise capecitabine and oxaliplatin (CAPOX) or cisplatin and 5-fluorouracil (CISPFU).
Issues for Consideration
Feedback from drug plans indicates a need for operationalization and funding of PD-L1 CPS testing in specific jurisdictions to identify patients eligible for pembrolizumab treatment. Although included in the sponsor’s and CDA-AMC base cases, testing costs had minimal impact on the overall conclusions.
Overall Conclusions
The CDA-AMC clinical review found that pembrolizumab in combination with standard of care (trastuzumab and chemotherapy) results in improved PFS among patients with PD-L1-positive (CPS ≥ 1), locally advanced, unresectable or metastatic, HER2-positive gastric or GEJ adenocarcinoma, based on data from the KEYNOTE-811 trial (mean duration of follow-up, approximately 38 months). Evidence from the KEYNOTE-811 trial suggests that, at 36 months, the point estimate for adding pembrolizumab to standard of care on OS exceeded the lower threshold suggested by the clinical experts for a clinically important benefit. However, the difference was small, and the certainty of this finding is decreased because the 95% CI included the potential for little to no difference in OS compared to placebo plus standard of care. The clinical review additionally found that the addition of pembrolizumab to trastuzumab and chemotherapy may result in little to no difference in health-related quality of life.
CDA-AMC undertook reanalyses to address several limitations of the sponsor’s analysis, which included using Kaplan-Meier OS and PFS data during the KEYNOTE-811 trial period, adopting alternative extrapolations for PFS and OS after the trial period, adopting alternative distributions of subsequent treatments, assuming 100% RDI for all treatments, and applying age-based utility adjustments. CDA-AMC was unable to fully address uncertainty related to the long-term benefits of pembrolizumab and related to the health state utility values.
Results of the CDA-AMC base case are aligned with the sponsor’s results; that is, treatment with pembrolizumab plus trastuzumab and chemotherapy is associated with higher costs and higher QALYs than trastuzumab and chemotherapy alone and is not cost-effective at a threshold of $50,000 per QALY gained (ICER = $425,549 per QALY gained). Based on publicly available list prices for all comparators and fixed dosing for pembrolizumab, a price reduction of at least 89% for pembrolizumab would be required for pembrolizumab plus trastuzumab and chemotherapy to be considered cost-effective at a WTP threshold of $50,000 per QALY gained, which would reflect a price of approximately $453 per 100 mg/4 mL vial (28-day cost = $1,208). If pembrolizumab were provided using weight-based dosing, and assuming effectiveness equal to that used in the KEYNOTE trial [which used fixed dosing], the ICER would decrease to $297,169 per QALY. This is because with vial sharing, pembrolizumab can be given at a lower cost than when a fixed-based dose is used, and because efficacy is assumed to be equivalent, the ICER would be lower. If weight-based dosing is adopted for pembrolizumab, the price would need to be reduced by 86% for it to be cost-effective a $50,000 per QALY gained threshold, reflecting a price of $638 per 100 mg/4 mL vial (28-day cost = $1,160).
Although the CDA-AMC base case estimated a gain in OS and QALYs with pembrolizumab plus trastuzumab and chemotherapy (incremental OS = 0.41; incremental QALYs = 0.36;), 71% of the incremental OS and 72% of the incremental QALYs were gained in the extrapolated period. In the absence of comparative evidence beyond the trial duration, the incremental benefit of pembrolizumab plus trastuzumab and chemotherapy predicted in the CDA-AMC base case is highly uncertain and may be overestimated, and additional price reductions may be required.
References
1.Janjigian YY, Kawazoe A, Bai Y, et al. Pembrolizumab plus trastuzumab and chemotherapy for HER2-positive gastric or gastro-oesophageal junction adenocarcinoma: interim analyses from the phase 3 KEYNOTE-811 randomised placebo-controlled trial. Lancet. 2023. PubMed
2.Janjigian YY, Kawazoe A, Yañez P, et al. The KEYNOTE-811 trial of dual PD-1 and HER2 blockade in HER2-positive gastric cancer. Nature. 2021;600(7890):727-730. PubMed
3.CADTH Reimbursement Review - Entrectinib for extracranial solid tumours with NTRK gene fusion [sponsor provided reference]. Ottawa: CADTH; 2023: https://www.cadth.ca/sites/default/files/DRR/2023/PC0278-Rozlytrek.pdf. Accessed October 10, 2023.
4.CADTH Reimbursement Review - Pembrolizumab (Keytruda) for metastatic triple-negative breast cancer. Ottawa: CADTH; 2023: https://www.cadth.ca/sites/default/files/DRR/2023/PC0295-Keytruda-mTNBC_combined.pdf. Accessed October 10, 2023.
5.CADTH Reimbursement Review – Nivolumab for Non-small Cell Lung Cancer [sponsor provided reference]. Ottawa: CADTH; 2023: https://www.cadth.ca/sites/default/files/DRR/2023/PC0303-Opdivo-NSCLC.pdf. Accessed July 17, 2023.
6.Ontario Ministry of Long-Term Care. Ontario drug benefit formulary/comparative drug index. 2023; https://www.formulary.health.gov.on.ca/formulary/. Accessed 2023 Dec 7.
7.De Oliveira C, Pataky R, Bremner KE, et al. Estimating the cost of cancer care in British Columbia and Ontario: a Canadian inter-provincial comparison. Healthcare Policy. 2017;12(3). PubMed
8.Weinstein MC, Torrance G, McGuire A. QALYs: the basics. Value Health. 2009;12 Suppl 1:S5-9. PubMed
9.Van Cutsem E, Sagaert X, Topal B, Haustermans K, Prenen H. Gastric cancer. Lancet. 2016;388(10060):2654-2664. PubMed
10.Drug Intelligence. ONCO-CAPPS Mini ATU Report, Advanced/Metastatic Gastric/GEJ Adenocarcinoma. 2023.
11.Yan J, Xie S, Johnson JA, et al. Canada population norms for the EQ-5D-5L. The European Journal of Health Economics. 2024;25(1):147-155. PubMed
12.Manca A, Hawkins N, Sculpher MJ. Estimating mean QALYs in trial‐based cost‐effectiveness analysis: the importance of controlling for baseline utility. Health economics. 2005;14(5):487-496. PubMed
13.Guidelines for the Economic Evaluation of Health Technologies: Canada 4th Edition. Ottawa: CADTH; 2017: https://www.cadth.ca/sites/default/files/pdf/guidelines_for_the_economic_evaluation_of_health_technologies_canada_4th_ed.pdf. Accessed 2024 Feb 29.
14.Lin F, Song J, Kirker M, et al. The Budget Impact of Including Fam-Trastuzumab Deruxtecan-Nxki on the Formulary for the Treatment of Her2- Positive Advanced Gastric Cancer: Us Commercial Payer Perspective. Journal of Managed Care and Specialty Pharmacy. 2021;27(10-B SUPPL):S20.
15.Brenner DR, Poirier A, Woods RR, et al. Projected estimates of cancer in Canada in 2022. Canadian Medical Association Journal. 2022;194(17):E601-E607. PubMed
16.Public Health Agency of Canada. Cancer in Canada - An Epidemiologic Overview. A report based on the Cancer Incidence Atlas [sponsor provided reference]. Vol 22014: https://www.canada.ca/en/public-health/services/chronic-diseases/cancer/cancer-canada-epidemiologic-overview.html#s4c.
17.CADTH Reimbursement Review – Nivolumab for gastric, gastroesophageal junction, or esophageal adenocarcinoma [sponsor provided reference]. Ottawa: CADTH; 2022: https://www.cadth.ca/sites/default/files/DRR/2022/PC0259-Opdivo-combinedReport.pdf. Accessed July 17, 2023.
18.CADTH Reimbursement Review - Pembrolizumab for esophageal carcinoma, gastroesophageal junction adenocarcinoma [sponsor provided reference]. Ottawa: CADTH; 2022: https://www.cadth.ca/sites/default/files/DRR/2022/PC0250CL-Keytruda.pdf. Accessed Oct 30, 2023.
19.Ding PQ, Dolley A, Cheung WY. Trifluridine/Tipiracil in the Real-World Management of Metastatic Gastric and Gastroesophageal Junction Cancers in Canada. Curr Oncol. 2022;30(1):130-144. PubMed
Appendix 1: Cost Comparison Table
Please note that this appendix has not been copy-edited.
The comparators presented in the following table have been deemed to be appropriate based on feedback from clinical expert(s) and drug plan. Comparators may be recommended (appropriate) practice or actual practice. Existing Product Listing Agreements are not reflected in the table and as such, the table may not represent the actual costs to public drug plans.
Table 8: CDA-AMC Cost Comparison for the Treatment of Adult Patients With Metastatic, HER2-Positive, Gastric or GEJ Adenocarcinoma
Treatment | Strength / concentration | Form | Price ($) | Recommended dosage | Average daily cost ($) | Average 28-day cost ($) |
|---|---|---|---|---|---|---|
Pembrolizumab (Keytruda) | 100 mg/4mL | 4 mL vial | 4,400.0000a | 200 mg Q3W, or 400 mg Q6W | 419.05 | 11,733 |
Trastuzumab (Herceptin) | 440 mg | Vial | 1,417.1960 | Cycle 1: 8 mg/kg Cycles 2+: 6 mg/kg Q3W | Cycle 1: 85.89 Cycles 2+: 64.42 | Cycle 1: 2,401 Cycle 2+: 1,804 |
Pembrolizumab with trastuzumab plus CISPFU | Cycle 1: 534.49 Cycles 2+: 513.01 | Cycle 1: 14,966 Cycles 2+: 14,364 | ||||
Pembrolizumab with trastuzumab plus CAPECISP | Cycle 1: 530.77 Cycles 2+: 509.30 | Cycle 1: 14,862 Cycles 2+: 14,260 | ||||
Pembrolizumab with trastuzumab plus CAPOX | Cycle 1: 520.34 Cycles 2+: 498.87 | Cycle 1: 14,570 Cycles 2+: 13,968 | ||||
Pembrolizumab with trastuzumab plus FOLFOX | Cycle 1: 539.00 Cycles 2+: 517.52 | Cycle 1: 15,092 Cycles 2+: 14,491 | ||||
Trastuzumab + chemotherapy | ||||||
Trastuzumab (Herceptin) | 440 mg | Vial | 1,417.1960 | Cycle 1: 8 mg/kg Cycles 2+: 6 mg/kg Q3W | Cycle 1: 85.89 Cycles 2+: 64.42 | Cycle 1: 2,401 Cycle 2+: 1,804 |
Trastuzumab plus CISPFU | Cycle 1: 115.44 Cycles 2+: 93.97 | Cycle 1: 3,232 Cycles 2+: 2,631 | ||||
Trastuzumab plus CAPECISP | Cycle 1: 111.72 Cycles 2+: 90.25 | Cycle 1: 3,128 Cycles 2+: 2,527 | ||||
Trastuzumab plus CAPOX | Cycle 1: 101.29 Cycles 2+: 79.82 | Cycle 1: 2,836 Cycles 2+: 2,235 | ||||
Trastuzumab plus FOLFOX | Cycle 1: 119.95 Cycles 2+: 98.48 | Cycle 1: 3,359 Cycles 2+: 2,757 | ||||
Cisplatin-5-fluorouracil (CISPFU) | ||||||
Cisplatin (generic) | 1 mg/mL | 50 mL vial 100 mL vial | 135.5000 270.0000 | 80 mg/m2 Q3W | 18.51 | 518 |
5-Fluorouracil infusion | 50 mg/mL | 100 mL vial | 160.9000 | 800 mg/m2 days 1 to 5 Q3W OR 1,000 mg/m2 days 1 to 14 Q3W | 11.03 | 309 |
CISPFU | 29.55 | 827 | ||||
Cisplatin-capecitabine (CAPECISP) | ||||||
Capecitabine (Xeloda) | 150 mg 500 mg | Tab | 0.4575b 1.5250b | 1,000 mg/m2 twice daily from days 1 to 14 of Q3W | 7.32 | 205 |
Cisplatin (generic) | 1 mg/mL | 50 mL vial 100 mL vial | 135.5000 270.0000 | 80 mg/m2 Q3W | 18.51 | 518 |
CAPECISP | 25.83 | 723 | ||||
Capecitabine-oxaliplatin (CAPOX) | ||||||
Capecitabine (Xeloda) | 150 mg 500 mg | Tab | 0.4575b 1.5250b | 1,000 mg/m2 twice daily from days 1 to 14 Q3W | 7.32 | 205 |
Oxaliplatin (generic) | 5 mg/mL | 10 mL vial 20 mL vial 40 mL vial | 36.2700 72.5400 145.0800 | 130 mg/m2 Q3W | 8.08 | 226 |
CAPOX | 15.40 | 431 | ||||
Folinic acid (leucovorin)-fluorouracil-oxaliplatin (FOLFOX) | ||||||
Oxaliplatin (generic) | 5 mg/mL | 10 mL vial 20 mL vial 40 mL vial | 36.2700 72.5400 145.0800 | 85 mg/m2 Q2W | 7.93 | 222 |
Folic acid (Leucovorin) | 10 mg/mL | 5 mL vial 50 mL vial | 68.9430c 350.1900 | 400 mg/m2 Q2W | 36.02 | 1,009 |
5-Fluorouracil bolus | 50 mg/mL | 100 mL vial | 160.9000 | 400 mg/m2 Q2W | 1.65 | 46 |
5-Fluorouracil infusion | 50 mg/mL | 100 mL vial | 160.9000 | 2,400 mg/m2 Q2W | 9.93 | 278 |
FOLFOX | 55.53 | 1,555 | ||||
CDA-AMC = Canada’s Drug Agency; Q2W = every 2 weeks; Q3W = every 3 weeks, Q6W = every 6 weeks.
Note: All prices are IQVIA Delta PA wholesale list prices (accessed January 2024), unless otherwise indicated, and do not include dispensing fees or markups. Wastage was not included in costs. Recommended dosages are based on Cancer Care Ontario monographs, unless otherwise indicated. For dosing that depended on weight or body surface area, mean body weight of 70 kg and mean body surface area of 1.8m2 were assumed. Total cost estimates per regimen are based on the cheapest combination of the component drugs. Costs for 21-day treatment regimens have been prorated to a 28-day period.
aSponsor’s submitted price.
bOntario Drug Benefit Formulary.
cAlberta Health Care Insurance Plan.
Appendix 2: Submission Quality
Please note that this appendix has not been copy-edited.
Description | Yes or No | Comments |
|---|---|---|
Population is relevant, with no critical intervention missing, and no relevant outcome missing | Yes | No comment |
Model has been adequately programmed and has sufficient face validity | Yes | No comment |
Model structure is adequate for decision problem | Yes | Acceptable. A partitioned survival model is commonly used in oncology submissions; however, the model structure may produce a postprogression survival bias in favour of pembrolizumab in combination with trastuzumab and chemotherapy. |
Data incorporation into the model has been done adequately (e.g., parameters for probabilistic analysis) | Yes | No comment |
Parameter and structural uncertainty were adequately assessed; analyses were adequate to inform the decision problem | No | The sponsor conducted limited probabilistic scenario analyses. Consequently, the submitted scenario analysis results may not accurately represent the potential range of outcomes and uncertainties. |
The submission was well organized and complete; the information was easy to locate (clear and transparent reporting; technical documentation available in enough details) | Yes | No comment |
Appendix 3: Additional Information on the Submitted Economic Evaluation
Please note that this appendix has not been copy-edited.
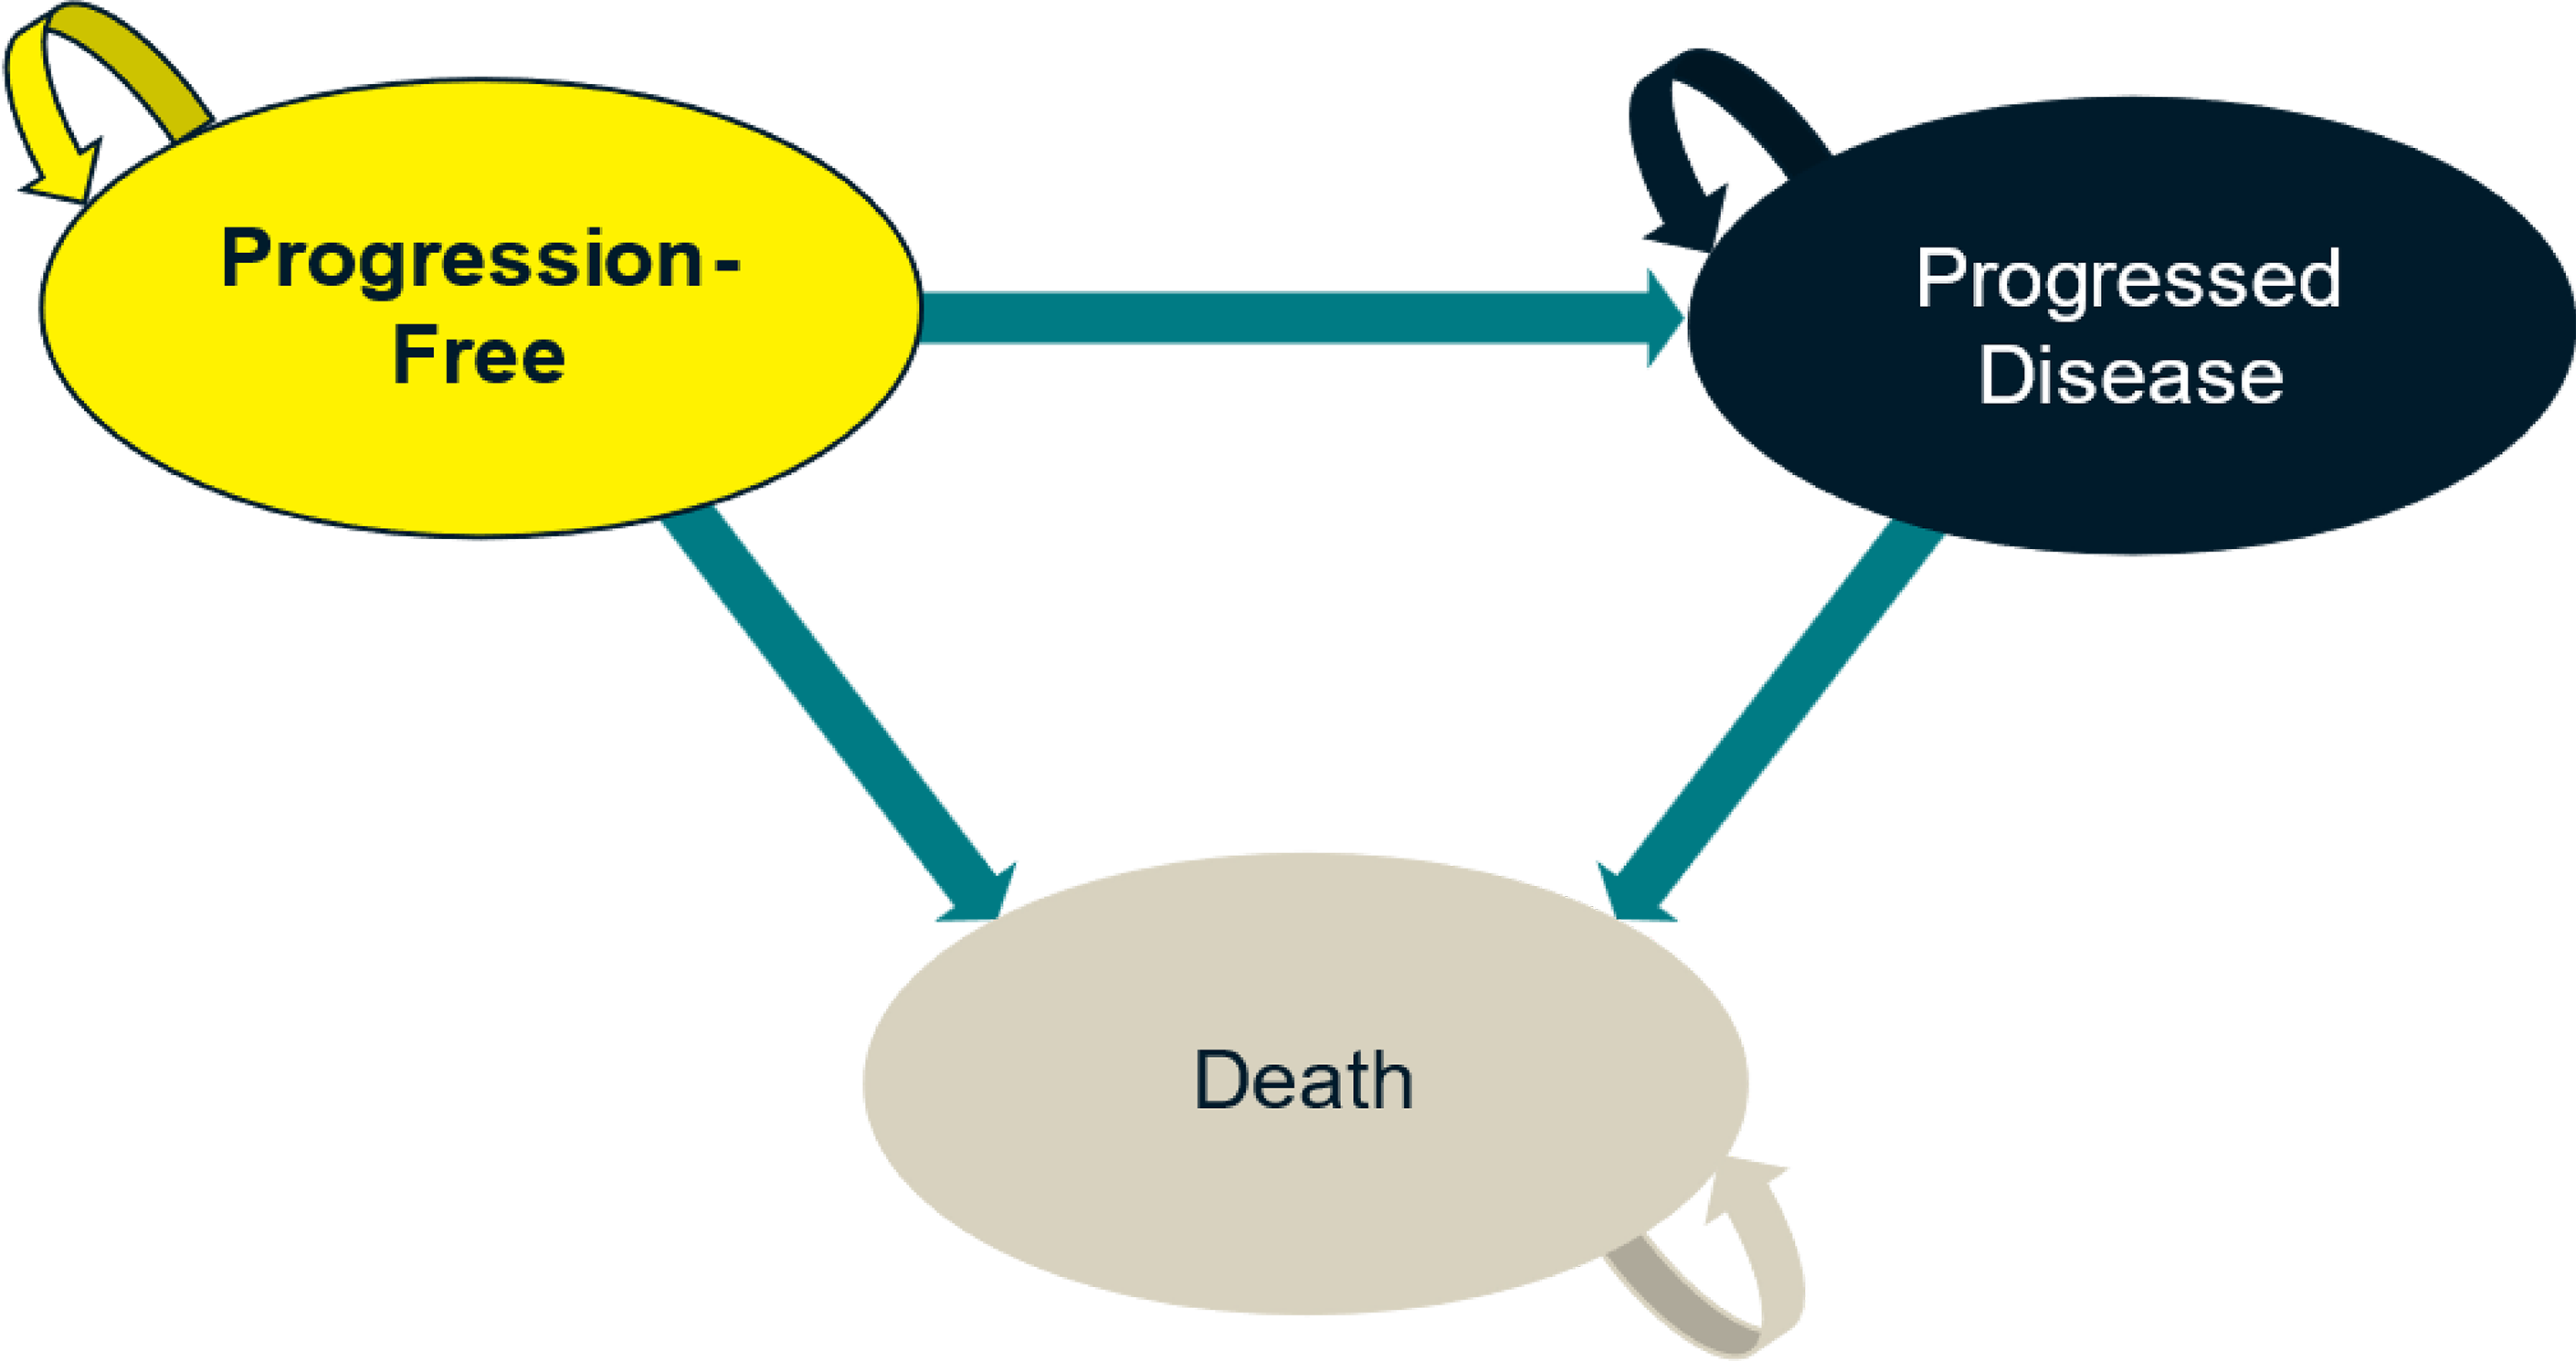
Detailed Results of the Sponsor’s Base Case
Table 10: Disaggregated Summary of the Sponsor’s Economic Evaluation Results
Parameter | Pembrolizumab + trastuzumab + chemotherapy | Trastuzumab + chemotherapy | Incremental |
|---|---|---|---|
Discounted LYs | |||
Total | 3.55 | 2.71 | 0.85 |
Progression-free | 2.34 | 1.38 | 0.97 |
Progressed | 1.21 | 1.33 | −0.12 |
Within the trial period | 1.11 | 1.06 | 0.06 |
After the trial period | 2.44 | 1.65 | 0.79 |
Discounted QALYs | |||
Total | 3.04 | 2.29 | 0.75 |
Progression-free | 2.06 | 1.21 | 0.85 |
Progressed | 1.00 | 1.10 | −0.10 |
AE disutility | −0.01 | −0.01 | −0.003 |
Within the trial period | 0.95 | 0.90 | 0.05 |
After the trial period | 2.09 | 1.39 | 0.70 |
Discounted costs ($) | |||
Total | 317,621 | 174,752 | 142,868 |
Acquisition | 171,304 | 22,718 | 148,586 |
Administration | 1,520 | 1,017 | 503 |
Subsequent treatments | 17,601 | 21,140 | −3,539 |
Adverse events costs | 4,468 | 3,180 | 1,288 |
Disease management | 34,081 | 36,071 | −1,990 |
PD-L1 testing | 124 | 0 | 124 |
Terminal care cost | 88,521 | 90,626 | −2,104 |
LY = life-year; QALY = quality-adjusted life-year.
Note: Chemotherapy was assumed by the sponsor to comprise capecitabine and oxaliplatin (CAPOX) plus 5-fluorouracil and cisplatin (CISPFU).
Source: Sponsor’s pharmacoeconomic submission.8
Appendix 4: Additional Details on the CDA-AMC Reanalyses and Sensitivity Analyses of the Economic Evaluation
Please note that this appendix has not been copy-edited.
Detailed Results of CDA-AMC Base Case
Table 11: Disaggregated Summary of the CDA-AMC Economic Evaluation Results
Parameter | Pembrolizumab + trastuzumab + chemotherapy | Trastuzumab + chemotherapy | Incremental |
|---|---|---|---|
Discounted LYs | |||
Total | 2.40 | 1.98 | 0.41 |
Profession-free | 1.76 | 1.19 | 0.57 |
Progressed | 0.64 | 0.79 | −0.15 |
Within the trial period | 1.27 | 1.15 | 0.12 |
After the trial period | 1.12 | 0.83 | 0.29 |
Discounted QALYs | |||
Total | 2.03 | 1.67 | 0.36 |
Profession-free | 1.52 | 1.04 | 0.49 |
Progressed | 0.52 | 0.65 | −0.12 |
Adverse events disutility | −0.01 | −0.01 | −0.003 |
Within the trial period | 1.08 | 0.98 | 0.10 |
After the trial period | 0.95 | 0.69 | 0.26 |
Discounted costs ($) | |||
Total | 321,502 | 168,048 | 153,454 |
Acquisition | 181,440 | 24,113 | 157,327 |
Administration | 1,527 | 1,023 | 504 |
Subsequent treatments | 23,378 | 25,354 | −1,976 |
Adverse events costs | 4,461 | 3,183 | 1,278 |
Disease management | 18,643 | 21,860 | −3,216 |
PD-L1 testing | 124 | 0 | 124 |
Terminal care cost | 91,928 | 92,515 | −587 |
CDA-AMC = Canada’s Drug Agency; LY = life-year; QALY = quality-adjusted life-year.
Note: Chemotherapy was assumed to comprise capecitabine and oxaliplatin (CAPOX) plus 5-fluorouracil and cisplatin (CISPFU).
Scenario Analyses
Table 12: Summary of the CDA-AMC Scenario Analyses
Scenario analysis | Drug | Total costs ($) | Total QALYs | ICER ($/QALY) |
|---|---|---|---|---|
CDA-AMC base case | Trastuzumab + chemotherapy | 168,048 | 1.67 | Reference |
Pembrolizumab + trastuzumab + chemotherapy | 321,502 | 2.03 | 425,549 | |
Scenario 1: Assuming sponsor’s adopted RDI | Trastuzumab + chemotherapy | 167,133 | 1.671 | Reference |
Pembrolizumab + trastuzumab + chemotherapy | 311,888 | 2.033 | 400,316 | |
Scenario 2: Weight-based dosing for pembrolizumab | Trastuzumab + chemotherapy | 168,236 | 1.67 | Reference |
Pembrolizumab + trastuzumab + chemotherapy | 275,499 | 2.03 | 297,169 | |
Scenario 3: 6-week interval for pembrolizumab (400 mg every 6 weeks) | Trastuzumab + chemotherapy | 167,978 | 1.67 | Reference |
Pembrolizumab + trastuzumab + chemotherapy | 326,389 | 2.03 | 438,883 |
CDA-AMC = Canada’s Drug Agency; ICER = incremental cost-effectiveness ratio; QALY = quality-adjusted life-year; RDI = relative dose intensity.
Note: Chemotherapy was assumed by the sponsor to comprise capecitabine and oxaliplatin (CAPOX) plus 5-fluorouracil and cisplatin (CISPFU).
Appendix 5: Submitted BIA and CDA-AMC Appraisal
Please note that this appendix has not been copy-edited.
Table 13: Summary of Key Takeaways
Key Takeaways of the BIA |
|---|
|
Summary of Sponsor’s BIA
The sponsor submitted a budget impact analysis (BIA)14 assessing the expected budgetary impact of the introduction of pembrolizumab, in combination with trastuzumab, fluoropyrimidine- and platinum-containing chemotherapy for the first-line treatment of adult patients with locally advanced unresectable or metastatic HER2-positive, PD-L1 positive (CPS ≥ 1) gastric or GEJ adenocarcinoma. The BIA was undertaken from the perspective of the pan-Canadian public drug plans over a 3-year time horizon (2025 to 2027). The sponsor estimated the size of the eligible population using an epidemiologic approach, with data obtained from publications, previous CDA-AMC submissions, and assumptions. The sponsor assumed a patient weight of 68.2 kg and a mean body surface area of 1.80m2 in the calculation of drug costs, as reported in the KEYNOTE-811 trial. Drug-acquisition costs for each comparator (adjusted by RDI observed in KEYNOTE-811) and subsequent therapy were included. The sponsor assumed that 5% of patients will be enrolled in clinical trials and that pembrolizumab will not capture any market share from clinical trials. Key inputs to the BIA are documented in Table 14.
Table 14: Summary of Key Model Parameters
Parameter | Sponsor’s estimate (reported as year 1 / year 2 / year 3 if appropriate) |
|---|---|
Target population | |
Incident cases of gastric or GEJ cancers Gastric or GEJ cancers that are adenocarcinomas De novo locally advanced unresectable or metastatic Proportion of patients referred to a medical oncologist Proportion diagnosed earlier that progressed HER2 testing rate Proportion HER2 positive Proportion treated by medical oncologists | 2,98015 90%16 43.5%17 85%18 35%17 100%17 19%19 90%18 |
Number of patients eligible for drug under review | 159 / 226 / 227 |
Market Uptake (3 years) | |
Uptake (reference scenario) Trastuzumab plus chemotherapya Clinical trials | 95% / 95% / 95% 5% / 5% / 5% |
Uptake (new drug scenario) Pembrolizumab plus trastuzumab and chemotherapy Trastuzumab plus chemotherapy Clinical trials | 17% / 59% / 64% 78% / 36% / 31% 5% / 5% / 5% |
Cost of treatment per 3-week cycle (per patient) | |
Pembrolizumabb plus trastuzumab and chemotherapy Trastuzumab plus chemotherapy | $9,872c $1,561c |
HER2 = human epidermal growth factor receptor 2; GEJ = gastroesophageal junction.
Note: total cost of treatment was adjusted in the sponsor submission by relative dose intensity based on the KEYNOTE-811 trial and assumed an average patient weight of 68.20kg and body surface area of 1.80m2.
aChemotherapy was assumed by the sponsor to comprise capecitabine and oxaliplatin (CAPOX) plus 5-fluorouracil and cisplatin (CISPFU).
bThe dosage of pembrolizumab was assumed by the sponsor to be 200 mg every 3 weeks.
cCost of treatment per 3-week cycle (per patient) reported by the sponsor refers to cycles 2 onwards; loading costs for trastuzumab were not included.
Summary of the Sponsor’s BIA Results
The sponsor estimated the 3-year budget impact of reimbursing pembrolizumab, in combination with trastuzumab, fluoropyrimidine- and platinum-containing chemotherapy for the first-line treatment of adult patients with locally advanced unresectable or metastatic HER2-positive, PD-L1 positive gastric or GEJ adenocarcinoma to be $35,977,114 (year 1: $1,820,279; year 2: $12,331,776; year 3: $21,825,058).
CDA-AMC Appraisal of the Sponsor’s BIA
CDA-AMC identified several key limitations to the sponsor’s analysis that have notable implications on the results of the BIA:
Use of RDI to estimate actual drug costs is inappropriate: The sponsor’s base-case analysis incorporated relative dose intensities for pembrolizumab, trastuzumab, and chemotherapy using data from the KEYNOTE-811 trial. The consideration of RDI is problematic as this parameter can be influenced by several factors. The dose received by a patient may differ from the full planned dose of the drug due to dose delays, missed doses, dose reductions to manage toxicity, or subsequent dose re-escalation; each of these have differing impacts on drug costs.
In the CDA-AMC reanalysis, 100% RDI was adopted for pembrolizumab, trastuzumab, and chemotherapies.
The proportion of patients eligible to receive pembrolizumab is uncertain: The sponsor estimated that approximately 85% of patients diagnosed with locally advanced unresectable or metastatic GEJ cancer are referred to a medical oncologist, based on clinical expert input obtained in a previous CDA-AMC review. Clinical expert feedback obtained by CDA-AMC for this review noted that the proportion of patients in Canada who would be referred to a medical oncologist is likely higher than 85%, as it is unlikely that a patient diagnosed with locally advanced unresectable or metastatic GEJ cancer would not be referred.
Additionally, the sponsor estimated that the approximately 90% of adult patients with locally advanced unresectable or metastatic HER2-positive gastric or GEJ adenocarcinoma would receive first-line treatment by medical oncologists, based on clinical expert input obtained in a previous CDA-AMC review. Clinical expert feedback obtained by CDA-AMC noted that this proportion may be overestimated and that the proportion is likely closer to 80% to 85%.
The impact of uncertainty in the proportion of patients referred to a medical oncologist and the proportion of patients who receive first-line treatment were explored in scenario analyses.
The sponsor’s assumption regarding patient enrolment in clinical trials as a comparator is uncertain: The sponsor assumed that 5% of patients eligible for pembrolizumab plus trastuzumab and chemotherapy would instead participate in a clinical trial and would thus receive medications through the clinical trial and not result in any treatment or drug costs to the public drug plans. The inclusion of clinical trials as a comparator in the sponsor’s BIA was inappropriate, as these patients are not receiving approved therapies for the treatment, and this artificially decreases the estimated market size. Further, the inclusion of clinical trials as a comparator does not align with the sponsor’s submitted economic evaluation of pembrolizumab plus trastuzumab and chemotherapy, which did not consider investigative therapies as a comparator.
In the CDA-AMC base case, the proportion of patients assigned to clinical trials by the sponsor were instead allocated to trastuzumab plus chemotherapy in the reference scenario and to pembrolizumab plus trastuzumab and chemotherapy in the new drug scenario, based on expert opinion received by CDA-AMC for this review.
The market uptake of pembrolizumab may be underestimated: The sponsor assumed pembrolizumab plus trastuzumab and chemotherapy will capture 17% of the market in year 1, 59% in year 2 and 64% in year 3. Clinical expert feedback obtained by CDA-AMC suggests that the estimated uptake in all 3 years is lower than expected given that pembrolizumab will be used as an add-on therapy to the trastuzumab plus chemotherapy. Expert feedback obtained by CDA-AMC suggests that by year 3, all eligible patients will receive pembrolizumab in addition to trastuzumab and chemotherapy.
In a scenario analysis, CDA-AMC explored the impact of uncertainty in market uptake of pembrolizumab, by assuming uptake of 60% in year 1, 85% in year 2 and 100% in year 3.
Weight-based dosing for pembrolizumab: In the KEYNOTE-811 trial, pembrolizumab was administered at a fixed dosage of 200 mg IV every 3 weeks or 400 mg every 6 weeks, and in the sponsor’s base case all patients were assumed to receive 200 mg every 3 weeks. Participating public drug plan input received by CDA-AMC indicates that a weight-based dosage will likely be implemented for pembrolizumab (2 mg/kg [to 200 mg] every 3 weeks or 4 mg/kg [up to 400 mg] every 6 weeks) and clinical experts agreed that this approach would be reasonable.
In a scenario analysis, weight-based dosing for pembrolizumab (2 mg/kg [up to 200 mg]) was adopted.
The distribution of doublet chemotherapy regimens is not aligned with clinical practice in Canada: In the BIA, the sponsor assumed that 84.2% of patients would receive CAPOX and 15.8% would receive CISPFU as the chemotherapy backbone, based on treatments received in KEYNOTE-811. Feedback from clinical experts consulted by CDA-AMC indicated that, in Canada, approximately 15% of patients would be expected to receive FOLFOX, which was not captured in the sponsor base case, and that the proportion receiving CAPOX would be lower than assumed by the sponsor.
In the CDA-AMC base case, 15% of patients were assumed to receive FOLFOX, with market share taken from CAPOX.
CDA-AMC Reanalyses of the BIA
CDA-AMC revised the sponsor’s submitted analyses by assuming 100% RDI in the calculation of all drug costs, removing market shares attributed to clinical trials, and revising the distribution of chemotherapy backbones (Table 15).
Table 15: CDA-AMC Revisions to the Submitted Budget Impact Analysis
Stepped analysis | Sponsor’s value or assumption | CDA-AMC value or assumption |
|---|---|---|
Changes to derive the CDA-AMC base case | ||
1. RDI | < 100% (varied by drug) | 100% for all drugs |
2. Clinical trials | 5% of eligible patients were assumed to take part in clinical trials | Clinical trials were removed, with market shares allocated to trastuzumab plus chemotherapy in the reference scenario and to pembrolizumab plus trastuzumab and chemotherapy |
3. Distribution of platinum-fluoropyrimidine doublet | CAPOX: 84.2% CISPFU: 15.8% FOLFOX: 0% | CAPOX: 69.2% CISPFU: 15.8% FOLFOX: 15% |
CDA-AMC base case | Reanalysis 1 + 2 + 3 | |
CAPOX = capecitabine + oxaliplatin; CDA-AMC = Canada’s Drug Agency; FOLFOX = leucovorin calcium (folinic acid), fluorouracil, and oxaliplatin; CISPFU = 5-FU + cisplatin; RDI = relative dose intensity.
The results of the CDA-AMC step-wise reanalysis are presented in summary format in Table 16 and a more detailed breakdown is presented in Table 17.
Based on the CDA-AMC base case, the budget impact associated with the reimbursement of pembrolizumab plus trastuzumab and chemotherapy for the first-line treatment of adult patients with locally advanced unresectable or metastatic HER2-positive gastric or GEJ adenocarcinoma, whose tumours express PD-L1 (CPS ≥ 1) is expected to be $1,927,523 in year 1, $13,060,487 in year 2, $23,107,901 in year 3, for a 3-year total budgetary impact of $38,095,911.
Table 16: Summary of the CDA-AMC Reanalyses of the BIA
Stepped analysis | Three-year total ($) |
|---|---|
Submitted base case | 35,977,114 |
CDA-AMC reanalysis 1 | 38,173,416 |
CDA-AMC reanalysis 2 | 35,977,114 |
CDA-AMC reanalysis 3 | 35,905,949 |
CDA-AMC base case (reanalysis 1 + 2 + 3) | 38,095,911 |
BIA = budget impact analysis; CDA-AMC = Canada’s Drug Agency.
CDA-AMC conducted the following scenario analyses to address remaining uncertainty, using the CDA-AMC base case (results are provided in Table 17.
Increasing the proportion of patients diagnosed with locally advanced unresectable or metastatic GEJ cancer who are referred to a medical oncologist (to 90%) and decreasing the proportion of patients with locally advanced unresectable or metastatic HER2-positive gastric or GEJ adenocarcinoma who would receive first-line treatment (to 80%) to align with clinical expectations.
Revising market share estimates for pembrolizumab to align with clinical expert opinion (60% in year 1, 85% in year 2 and 100% in year 3), with market share taken from trastuzumab plus chemotherapy.
Assuming that the price of pembrolizumab is reduced by 89.7% (based on the estimated price reduction from the cost-utility analysis, which utilized a fixed dose of pembrolizumab [200 mg Q3W]).
Assuming a weight-based dose for pembrolizumab (weight = 68.2 kg).
Assuming the price of pembrolizumab is reduced by 85.5% (based on the estimated price reduction from the cost-utility analysis [scenario analysis], which assumed a weight-based dose of pembrolizumab).
Table 17: Detailed Breakdown of the CDA-AMC Reanalyses of the BIA
Stepped analysis | Scenario | Year 0 (current situation) ($) | Year 1 ($) | Year 2 ($) | Year 3 ($) | Three-year total ($) |
|---|---|---|---|---|---|---|
Submitted base case | Reference | 4,062,000 | 9,312,061 | 11,070,563 | 11,611,044 | 36,055,667 |
New drug | 4,062,000 | 11,132,340 | 23,402,339 | 33,436,102 | 72,032,781 | |
Budget impact | 0 | 1,820,279 | 12,331,776 | 21,825,058 | 35,977,114 | |
CDA-AMC base case | Reference | 4,775,700 | 10,543,095 | 12,466,698 | 13,053,351 | 40,838,844 |
New drug | 4,775,700 | 12,470,618 | 25,527,186 | 36,161,251 | 78,934,755 | |
Budget impact | 0 | 1,927,523 | 13,060,487 | 23,107,901 | 38,095,911 | |
CDA-AMC scenario analysis 1: revising target population proportions | Reference | 4,494,777 | 9,922,913 | 11,733,363 | 12,285,507 | 38,436,559 |
New drug | 4,494,777 | 11,737,052 | 24,025,586 | 34,034,119 | 74,291,534 | |
Budget impact | 0 | 1,814,139 | 12,292,223 | 21,748,612 | 35,854,975 | |
CDA-AMC scenario analysis 2: revising market shares | Reference | 4,775,700 | 10,543,095 | 12,466,698 | 13,053,351 | 40,838,844 |
New drug | 4,775,700 | 12,470,618 | 25,527,186 | 36,161,251 | 78,934,755 | |
Budget impact | 0 | 1,927,523 | 13,060,487 | 23,107,901 | 38,095,911 | |
CDA-AMC scenario analysis 3: 89.7% price reduction | Reference | 4,775,700 | 10,543,095 | 12,466,698 | 13,053,351 | 40,838,844 |
New drug | 4,775,700 | 10,713,751 | 13,608,205 | 15,253,131 | 44,350,787 | |
Budget impact | 0 | 170,656 | 1,141,507 | 2,199,780 | 3,511,943 | |
CDA-AMC scenario analysis 4: weight-based dose | Reference | 4,775,700 | 10,543,095 | 12,466,698 | 13,053,351 | 40,838,844 |
New drug | 4,775,700 | 11,847,782 | 21,301,728 | 28,749,008 | 66,674,218 | |
Budget impact | 0 | 1,304,687 | 8,835,029 | 15,695,657 | 25,835,374 | |
CDA-AMC scenario analysis 5: 85.5% price reduction (weight-based dose) | Reference | 4,775,700 | 10,543,095 | 12,466,698 | 13,053,351 | 40,838,844 |
New drug | 4,775,700 | 10,796,012 | 14,166,284 | 16,232,107 | 45,970,103 | |
Budget impact | 0 | 252,917 | 1,699,586 | 3,178,756 | $5,131,259 |
BIA = budget impact analysis CDA-AMC = Canada’s Drug Agency.
ISSN: 2563-6596
Canada’s Drug Agency (CDA-AMC) is a pan-Canadian health organization. Created and funded by Canada’s federal, provincial, and territorial governments, we’re responsible for driving better coordination, alignment, and public value within Canada’s drug and health technology landscape. We provide Canada’s health system leaders with independent evidence and advice so they can make informed drug, health technology, and health system decisions, and we collaborate with national and international partners to enhance our collective impact.
Disclaimer: CDA-AMC has taken care to ensure that the information in this document was accurate, complete, and up to date when it was published, but does not make any guarantee to that effect. Your use of this information is subject to this disclaimer and the Terms of Use at cda-amc.ca.
The information in this document is made available for informational and educational purposes only and should not be used as a substitute for professional medical advice, the application of clinical judgment in respect of the care of a particular patient, or other professional judgments in any decision-making process. You assume full responsibility for the use of the information and rely on it at your own risk.
CDA-AMC does not endorse any information, drugs, therapies, treatments, products, processes, or services. The views and opinions of third parties published in this document do not necessarily reflect those of CDA-AMC. The copyright and other intellectual property rights in this document are owned by the Canadian Agency for Drugs and Technologies in Health (operating as CDA-AMC) and its licensors.
Questions or requests for information about this report can be directed to Requests@CDA-AMC.ca.