CADTH Reimbursement Review
Cabozantinib (Cabometyx)
Sponsor: Ipsen Biopharmaceuticals Canada Inc.
Therapeutic area: Advanced or metastatic renal cell carcinoma
This multi-part report includes:
Clinical Review
Pharmacoeconomic Review
Stakeholder Input
Clinical Review
Abbreviations
AE
adverse event
aRCC
advanced renal cell carcinoma
BICR
blinded independent central review
CI
confidence interval
DRS
disease-related symptoms
EQ VAS
EQ visual analogue scale
EQ-5D-3L
3-Level EQ-5D
FKSI-19
19-item Functional Assessment of Cancer Therapy–Kidney Symptom Index
FKSI-DRS
Functional Assessment of Cancer Therapy Kidney Cancer Symptom Index - Disease Related Symptoms
GU DAC
Genitourinary Cancer Drug Advisory Committee
HR
hazard ratio
HRQoL
health-related quality of life
IMAE
immune-mediated adverse event
IMDC
International mRCC [Metastatic Renal Cell Carcinoma] Database Consortium
IQR
interquartile range
ITT
intention to treat
KCC
Kidney Cancer Canada
KCRNC
Kidney Cancer Research Network of Canada
MID
minimal important difference
NMA
network meta-analysis
OH-CCO
Ontario Health (Cancer Care Ontario)
OR
odds ratio
ORR
objective response rate
OS
overall survival
PFS
progression-free survival
RCC
renal cell carcinoma
RCT
randomized controlled trial
RECIST
Response Evaluation Criteria in Solid Tumours
SAE
serious adverse event
SD
standard deviation
TEAE
treatment-emergent adverse event
TKI
tyrosine kinase inhibitor
VEGF
vascular endothelial growth factor
VEGF-TKI
vascular endothelial growth factor–tyrosine kinase inhibitor
Executive Summary
An overview of the submission details for the drug under review is provided in Table 1.
Table 1: Background Information on Application Submitted for Review
Item | Description |
|---|---|
Information on drug submitted for review | |
Drug product | Cabozantinib (Cabometyx): 40 mg once daily, oral tablet Nivolumab (Opdivo): 240 mg every 2 weeks, 30-minute IV infusion, or 480 mg every 4 weeks, 30-minute IV infusion |
Sponsor | Ipsen Biopharmaceuticals Canada Inc. |
Indication | Cabozantinib, in combination with nivolumab, is indicated for the first-line treatment of adult patients with advanced (not amenable to curative surgery or radiation therapy) or metastatic RCC. |
Reimbursement request | As per indication |
Health Canada approval status | NOC |
Health Canada review pathway | Standard |
NOC date | October 12, 2021 |
Recommended dosage | Cabozantinib: Until disease progression or unacceptable toxicity Nivolumab: Until disease progression or unacceptable toxicity for up to 2 years in patients without disease progression1 |
NOC = Notice of Compliance; RCC = renal cell carcinoma.
Introduction
Renal cell carcinoma (RCC) is the most common form of kidney cancer, accounting for approximately 90% of all cases around the world.2 Approximately 8,100 people living in Canada were diagnosed with kidney and renal pelvis cancer in 2022; 85% of these cases were attributed to RCC.3 RCC cases are further classified into different subtypes based on histology (clear cell, papillary, chromophobe, clear cell papillary, collecting duct, medullary, and unclassified). The clear cell component subtype is the most prevalent form of RCC and represents more than 70% of all RCC cases in practice.4 More than a third of cases identified at initial diagnosis have metastatic disease, due to the fact that most patients experience few or no symptoms at earlier stages.5 Common symptoms consist of flank pain, visible blood in the urine, a noticeable mass in the abdomen, loss of appetite, fatigue, pain, and anemia.6,7 Patients who have progressed to an advanced stage of RCC generally face a poor prognosis, with reported 5-year survival rates ranging from 0% to 20% for those with metastatic disease.8
Treatment options for untreated advanced clear cell RCC are guided by prognostic risk models, particularly the International mRCC [Metastatic Renal Cell Carcinoma] Database Consortium (IMDC) risk group classification (favourable, intermediate, and poor).9 More than 80% of metastatic patients are classified as intermediate risk and poor risk.10 There is no standard therapy for non–clear cell RCC, and it is generally accepted that patients with non–clear cell histology should be treated similarly to patients with clear cell histology.9
For patients who fall under the IMDC favourable-risk category, the preferred treatments according to the Kidney Cancer Research Network of Canada (KCRNC) guidelines are a combination of immunotherapy and vascular endothelial growth factor (VEGF) receptor tyrosine kinase inhibitor (TKI).9 These include pembrolizumab plus axitinib, pembrolizumab plus lenvatinib, or cabozantinib plus nivolumab, with sunitinib or pazopanib as alternative options for patients who have a contraindication to immunotherapy or who are unable to tolerate combination therapy. For patients who fall under the IMDC intermediate-risk or poor-risk category, the preferred treatments according to the KCRNC guidelines are ipilimumab plus nivolumab, pembrolizumab plus axitinib, cabozantinib plus nivolumab, or pembrolizumab plus lenvatinib, with sunitinib, pazopanib, or cabozantinib monotherapy as alternative options.9
Cabozantinib is a small molecule that inhibits multiple receptor protein-tyrosine kinases implicated in tumour growth and angiogenesis, pathologic bone remodelling, drug resistance, and the metastatic progression of cancer.1 Cabozantinib has inhibition targets of the protein MET, VEGF receptors, and the GAS6 receptor (AXL). Cabozantinib, in combination with nivolumab, is indicated for the first-line treatment of adult patients with advanced (not amenable to curative surgery or radiation therapy) or metastatic RCC (hereafter referred to as advanced RCC [aRCC]).1 The sponsor-submitted reimbursement criteria of cabozantinib plus nivolumab is the same as the Health Canada–approved indication. The recommended dosage for aRCC is cabozantinib 40 mg, taken orally once daily, plus nivolumab 240 mg IV every 2 weeks or 480 mg every 4 weeks.1
The objective of this report is to review and critically appraise the evidence submitted by the sponsor on the beneficial and harmful effects of cabozantinib plus nivolumab for the first-line treatment of adults with aRCC.
Stakeholder Perspectives
The information in this section is a summary of input provided by the patient and clinician groups that responded to CADTH’s call for input and from the clinical expert consulted by CADTH for the purpose of this review.
Patient Input
One patient group, Kidney Cancer Canada (KCC), submitted input for this review. KCC reported that patients in Canada do not have access to cabozantinib plus nivolumab, and therefore it could not gather information on patients’ feedback or experiences with this therapy. KCC’s submission was based on a survey of 2,213 respondents, of whom 139 were from Canada, including 111 (80%) patients diagnosed with kidney cancer.
From the patients’ perspective, there is a need for access to new and effective treatment options that can stop disease progression, control drug resistance, and improve overall outcomes and quality of life. The patient group indicated that cabozantinib plus nivolumab could fill an unmet need for patients with papillary RCC and for patients with brain metastases, where additional treatment options are needed.
Clinician Input
Input From the Clinical Expert Consulted by CADTH
Unmet Needs
The clinical expert noted that unmet needs of patients with aRCC include reducing side effects, particularly having access to less toxic therapies, and that available treatments do not have curative potential. The expert also noted that available treatments are considered palliative, and that most patients’ disease progresses, and next lines of therapy are sought.
Place in Therapy
The clinical expert noted that cabozantinib plus nivolumab would compete with other first-line options (i.e., single-drug vascular endothelial growth factor–tyrosine kinase inhibitor [VEGF-TKI] therapy, TKI-checkpoint inhibitor therapy, or dual checkpoint inhibitor therapy). The expert also indicated that the use of cabozantinib plus nivolumab would challenge the existing treatment paradigm since it is unclear what drugs would be effective as second-line treatment after disease progression.
Patient Population
The clinical expert indicated that patients who are best suited for cabozantinib plus nivolumab are those with an IMDC intermediate-risk or poor-risk prognosis, while patients with an IMDC favourable-risk prognosis remain candidates for a single-drug VEGF-TKI. The expert also noted that it is not clear from the available data which patients are most likely to respond, although they indicated it is probable that those with the least disease burden are most likely to respond.
Assessing Response to Treatment
The clinical expert noted that measures of response would include radiologic evidence and symptom assessment, conducted every 8 weeks to 12 weeks. These include stability of the known sites of disease, without worsening of disease-related symptoms (DRS) and without intolerable side effects.
Discontinuing Treatment
The clinical expert noted that progressive disease should be a definitive indication to discontinue treatment, as should significant side effects. The clinical expert also indicated in their opinion the need to rule out “pseudoprogression,” a common phenomenon that suggests early radiologic progression, by allowing the treatment to continue for at least 1 more assessment time point. The types of side effects that could lead to treatment discontinuation would include severe hypertension, severe diarrhea, severe fatigue, liver dysfunction, and any immune-mediated adverse events (IMAEs).
Prescribing Considerations
The clinical expert noted that a medical oncologist with experience in managing immunotherapy and TKI therapy should be required to diagnose, treat, and monitor patients who might receive cabozantinib plus nivolumab, in designated community settings.
Clinician Group Input
Two clinician groups, the Ontario Health (Cancer Care Ontario) (OH-CCO) Genitourinary Cancer Drug Advisory Committee (GU DAC) and KCRNC, submitted input for this review. Input was provided by 7 clinicians: 3 for OH-CCO and 4 for KCRNC. KCRNC highlighted the need for drug development and increasing clinical trial options for non–clear cell patients, developing biomarkers for predicting response to the treatment, decreasing the attrition of patients, and optimizing the treatment of brain metastases. OH-CCO’s GU DAC pointed to the lack of further options for refractory disease. Both clinician groups agreed that untreated patients with any IMDC prognostic risk score would be potentially eligible for systemic treatment with cabozantinib plus nivolumab. The clinician groups indicated that cabozantinib plus nivolumab would be an additional first-line treatment option for patients with aRCC, and this combination therapy could potentially address unmet needs for some patients. Both groups indicated that treatment should be discontinued in the case of disease progression or unacceptable toxicity.
Drug Program Input
Input was obtained from the drug programs that participate in the CADTH reimbursement review process. The following were identified as key factors that could potentially impact the implementation of a CADTH recommendation for cabozantinib plus nivolumab:
relevant comparators
consideration for the initiation of therapy
consideration for the prescribing of therapy
generalizability
funding algorithm
system and economic issues.
The clinical expert consulted by CADTH provided advice on the potential implementation issues raised by the drug programs. Refer to Table 4.
Clinical Evidence
Pivotal Studies and Randomized Controlled Trial Evidence
Description of Studies
One trial, CheckMate 9ER (N = 651), met the inclusion criteria for the systematic review conducted by the sponsor. The objectives of the CheckMate 9ER trial were to evaluate the efficacy and safety of cabozantinib plus nivolumab versus sunitinib in adult patients with previously untreated aRCC with a clear cell component. Patients had any IMDC prognostic risk score and a Karnofsky Performance Status score of at least 70 (on a scale from 0 to 100, with lower scores indicating greater disability), and were randomized in a 1:1 ratio stratified by IMDC prognostic risk score, geographic region, and tumour expression of the PD-L1. Eligible patients were randomized to receive cabozantinib 40 mg, taken orally once daily, plus nivolumab 240 mg IV infusion every 2 weeks or sunitinib 50 mg, taken orally once daily for 4 weeks, followed by 2 weeks off, per 6-week cycle. The primary outcome was progression-free survival (PFS) assessed by a blinded independent central review (BICR) using Response Evaluation Criteria in Solid Tumours (RECIST) version 1.1; secondary outcomes were overall survival (OS), objective response rate (ORR), and safety. Health-related quality of life (HRQoL) measured by the 19-item Functional Assessment of Cancer Therapy–Kidney Symptom Index (FKSI-19) questionnaire and the EQ visual analogue scale (EQ VAS) questionnaire (part of the 3-Level EQ-5D [EQ-5D-3L] tool) was included as an exploratory outcome. Key baseline patient characteristics were generally balanced between treatment groups. The population was predominately white (82%) and male (71% to 77%), with an approximate mean age of 60 years. Most patients had a Karnofsky Performance Status score of 90 or 100 (74% to 80%), and the majority of patients (approximately 57%) had an intermediate IMDC prognostic risk score. A similar proportion of patients in both groups had prior radiotherapy (14%) or nephrectomy (approximately 70%).
Efficacy Results
The key efficacy results from the CheckMate 9ER study are summarized in Table 2.
PFS by BICR
In total, 335 PFS events had occurred in both the cabozantinib plus nivolumab group and the sunitinib group by interim analysis 1 (with a March 30, 2020, data cut-off date). At a median follow-up of 18.1 months for OS (range = 10.6 months to 30.6 months), the median PFS with cabozantinib plus nivolumab was 16.6 months (95% confidence interval [CI], 12.5 months to 24.9 months) and with sunitinib was 8.3 months (95% CI, 7.0 months to 9.7 months; log-rank test P < 0.001), with a between-group hazard ratio (HR) of 0.51 (95% CI, 0.41 to 0.64). The probability of PFS at 9 months for the cabozantinib plus nivolumab group and the sunitinib group was 68.3% (95% CI, 62.6% to 73.2%) and 47.8% (95% CI, 41.7% to 53.6%), respectively. Findings at the extended follow-up (interim analysis 2 data cut-off date of June 24, 2021) were consistent with those of interim analysis 1 (Table 11). The results of sensitivity analyses were consistent with those of the primary analysis, and the efficacy results were consistent across IMDC prognostic risk categories (favourable, intermediate, and poor risk).
Overall Survival
By interim analysis 1 (with a March 30, 2020, data cut-off date), the median OS had not been reached in either group (log-rank test P = 0.001). An HR of 0.60 (98.89% CI, 0.40 to 0.89) was estimated. The median follow-up for OS was 18.1 months (range = 10.6 months to 30.6 months). OS rates at 9 months were higher in the cabozantinib plus nivolumab group at 89.9% (95% CI, 86.0% to 92.8%) compared with the sunitinib group at 80.5% (95% CI, 75.7% to 84.4%). Findings at the extended follow-up (interim analysis 2, data cut-off date of June 24, 2021) were consistent with those of interim analysis 1.
ORR by BICR
By interim analysis 1 (with a March 30, 2020, data cut-off date), the ORR in the cabozantinib plus nivolumab group was 55.7% (95% CI, 50.1% to 61.2%) and 27.1% (95% CI, 22.4% to 32.3%) in the sunitinib group, with a between-group difference of 28.6% (95% CI, 21.7% to 35.6%). The estimated odds ratio (OR) between groups was 3.52 (95% CI, 2.51 to 4.95; P < 0.0001) in favour of cabozantinib plus nivolumab. Findings at the extended follow-up (interim analysis 2, data cut-off date of June 24, 2021) were consistent with those of interim analysis 1.
Health-Related Quality of Life
The exploratory HRQoL outcomes of the FKSI-19 total score and its subscale FKSI-DRS score and the EQ-5D-3L’s EQ VAS score were assessed at the first interim analysis (with a March 30, 2020, data cut-off date) and were not controlled for multiplicity. Mean changes from baseline through week 91 were generally stable for the cabozantinib plus nivolumab group, whereas patients in the sunitinib group had a trend toward decreased scores, and at times were in excess of the minimal important difference (MID) of 3 points.11 In addition, the FKSI-DRS improved from baseline in patients in the cabozantinib plus nivolumab group, whereas patients in the sunitinib group had a decline from baseline after week 7 through week 91. For the EQ VAS score, patients in the cabozantinib plus nivolumab group had a trend toward improvement, while sunitinib patients remained relatively stable with a trend toward decline through week 91. The mean changes from baseline in both groups did not meet the MID of 712 through week 91. HRQoL was not assessed at the extended follow-up (interim analysis 2).
Harms Results
The key harms results from the CheckMate 9ER trial are summarized in Table 2. At least 1 treatment-emergent adverse event (TEAE) was reported in almost all patients in both treatment groups (99.7% of patients in the cabozantinib plus nivolumab group and 99.1% of patients in the sunitinib group). The most common TEAEs were diarrhea (65.3% in the cabozantinib plus nivolumab group versus 50% in the sunitinib group), palmar-plantar erythrodysesthesia syndrome (40.3% versus 41.9%), hypertension (38.4% versus 37.5%), hypothyroidism (36.9% versus 31.6%), and fatigue (33.8% versus 35.6%). At least 1 serious adverse event (SAE) was reported in 53.1% of patients in the cabozantinib plus nivolumab group, and in 42.2% of patients in the sunitinib group. The most common SAE in both groups was malignant neoplasm progression (4.7% and 4.4% in the cabozantinib plus nivolumab group and the sunitinib group, respectively). Overall, 37.2% of patients in the cabozantinib plus nivolumab group versus 20.9% of patients in the sunitinib group discontinued treatment due to TEAEs. Deaths were reported in 37.2% of patients in the cabozantinib plus nivolumab group, and in 45.9% of patients in the sunitinib group. Most deaths were attributed to disease progression in both treatment groups (25.0% with cabozantinib plus nivolumab; 34.7% with sunitinib). Most notable harms occurred in similar percentages of patients in both groups, with hypertension being the most frequently reported notable harm in both study groups (39.7% versus 39.4% in the cabozantinib plus nivolumab group versus the sunitinib group, respectively). Thrombotic events occurred in 13.4% versus 6.3% of patients treated with cabozantinib plus nivolumab versus sunitinib, respectively. In terms of IMAEs, the cabozantinib plus nivolumab group had a higher incidence compared to the sunitinib group for all IMAEs, with hypothyroidism/thyroiditis being the most frequently observed IMAE in the cabozantinib plus nivolumab and sunitinib groups (28.1% and 9.4%, respectively).
Table 2: Summary of Key Results From CheckMate 9ER Study
Outcome | Cabozantinib plus nivolumab (N = 323) | Sunitinib (N = 328) |
|---|---|---|
PFS by BICR: ITT population, interim analysis 1 | ||
Patients with events, n (%) | 144 (44.6) | 191 (58.2) |
Patients censored, n (%) | 179 (55.4) | 137 (41.8) |
Median PFS, months (95% CI)a | 16.59 (12.45 to 24.94) | 8.31 (6.97 to 9.69) |
Hazard ratio (95% CI)b | 0.51 (0.41 to 0.64) | |
Log-rank test P value | P < 0.0001c,d | |
PFS rate, % (95% CI) at 9 monthsa | 68.3 (62.6 to 73.2) | 47.8 (41.7 to 53.6) |
OS: ITT population, interim analysis 1 | ||
Deaths, n (%) | 67 (20.7) | 99 (30.2) |
Patients censored, n (%) | 256 (79.3) | 229 (69.8) |
Median OS, months (95% CI)a | Not reached | |
Hazard ratio (95% CI)b | 0.60 (0.40 to 0.89) | |
Log-rank test P value | P = 0.0010c,d,e | |
OS rate, % (95% CI) at 9 monthsa | 68.3 (62.6 to 73.2) | 47.8 (41.7 to 53.6) |
ORR by BICR: ITT population, interim analysis 1 | ||
ORR, n (%)f | 180 (55.7) | 93 (28.4) |
95% CI | 50.1 to 61.2 | 23.5 to 33.6 |
Difference, % (95% CI)g,h | 28.6 (21.7 to 35.6) | |
Odds ratio (95% CI)h,i | 3.52 (2.51 to 4.95) | |
P valuej | P < 0.0001 | |
Harms: Safety population, interim analysis 2 | ||
≥ 1 TEAE, n (%) | 319 (99.7) | 317 (99.1) |
≥ 1 SAE, n (%) | 170 (53.1) | 135 (42.2) |
Discontinued treatment due to TEAE, n (%) | 119 (37.2) | 67 (20.9) |
Deaths, n (%) | 119 (37.2) | 147 (45.9) |
Notable harms, n (%) | ||
Thrombotic events | 43 (13.4) | 20 (6.3) |
Hypertension | 127 (39.7) | 126 (39.4) |
GI perforation | 4 (1.3) | 1 (0.3) |
Fistulas | 4 (1.3) | 0 |
Hemorrhage | 76 (23.8) | 72 (22.5) |
Hepatotoxicity | 31 (9.7) | 15 (4.7) |
RPLS | NR | NR |
Wound complications | 11 (3.4) | 4 (1.3) |
IMAEs | ||
Hypothyroidism/thyroiditis | 90 (28.1) | 30 (9.4) |
Rash | 40 (12.5) | 3 (0.9) |
Hepatitis | 36 (11.3) | 7 (2.2) |
Hyperthyroidism | 31 (9.7) | 1 (0.3) |
Diarrhea/colitis | 20 (6.3) | 1 (0.3) |
Adrenal insufficiency | 14 (4.4) | 0 |
Pneumonitis | 13 (4.1) | 1 (0.3) |
Nephritis and renal dysfunction | 7 (2.2) | 3 (0.9) |
BICR = blinded independent central review; CI = confidence interval; CMH = Cochran-Mantel-Haenszel; GI = gastrointestinal; IMAE = immune-mediated adverse event; IMDC = International mRCC [Metastatic Renal Cell Carcinoma] Database Consortium; IRT = Interactive Response Technology; ITT = intention to treat; NR = not reported; ORR = objective response rate; OS = overall survival; PFS = progression-free survival; ROW = rest of the world; RPLS = reversible posterior leukoencephalopathy syndrome; SAE = serious adverse event; TEAE = treatment-emergent adverse event.
aBased on Kaplan-Meier estimates.
bStratified Cox proportional hazards model. The hazard ratio is cabozantinib plus nivolumab vs. sunitinib.
cLog-rank test stratified by IMDC prognostic risk score (0, 1 to 2, 3 to 6), PD-L1 tumour expression (≥ 1% vs. < 1% or indeterminate), and region (the US, Canada, western Europe, northern Europe, or the ROW), as entered in the IRT.
dTwo-sided P values from a stratified regular log-rank test.
eThe boundary for statistical significance P value is less than 0.0111.
fComplete response plus partial response, with the CI based on the Clopper-Pearson method.
gThe strata-adjusted difference in the ORR ([cabozantinib + nivolumab] – sunitinib) was based on the DerSimonian and Laird method.
hStratified by IMDC prognostic risk score (0, 1 to 2, 3 to 6), PD-L1 tumour expression (≥ 1% vs. < 1% or indeterminate), and region (the US, Canada, western Europe, northern Europe, or the ROW), as entered in the IRT.
iStrata-adjusted odds ratio (cabozantinib + nivolumab vs. sunitinib) using the Mantel-Haenszel method.
jTwo-sided P value from a stratified CMH test.
Source: CheckMate 9ER Clinical Study Report.13
Critical Appraisal
CheckMate 9ER was an open-label, phase III, randomized, multicentre trial. The open-label design introduces a potential bias in the assessment of PFS and ORR, and a potential reporting bias of the subjective outcomes of HRQoL and safety. However, these biases were mitigated by the use of a BICR for PFS and ORR. Randomization procedures, including stratification by IMDC prognostic risk score, tumour PD-L1 expression, and region, were appropriate and conducted by interactive response technology. In general, the baseline characteristics of patients appeared balanced between groups, indicating that randomization was successful. To minimize the risk of differential measurement error, the trial performed tumour assessments using RECIST version 1.1 criteria and radiographic scans were assessed by a BICR. There was low selective reporting bias, as the data were analyzed in accordance with the prespecified statistical plan. All interim analyses conducted were planned a priori with appropriately specified alpha spending methods, and secondary outcomes were adjusted for multiplicity. The censoring rules for PFS were prespecified, and sample size and power calculations were based on PFS. All planned outcomes were reported, and an intention-to-treat (ITT) population analysis was conducted for the primary outcome (PFS) and the secondary outcomes (OS and ORR). Multiplicity adjustments were not conducted for exploratory outcomes, including the analysis of prespecified subgroups. HRQoL was assessed as an exploratory outcome using the FKSI-DRS and EQ-5D-3L questionnaires. The FKSI-DRS questionnaire has been validated in patients with RCC with evidence of reliability, responsiveness, and an MID. Although the EQ-5D-3L has been widely used in oncology trials in different cancer populations, it has not been validated in patients with aRCC.
The population for the reimbursement request aligns with that of the Health Canada indication, and the dosing and administration of cabozantinib plus nivolumab was consistent with the Health Canada–approved product monograph. The clinical expert consulted by CADTH considered the eligibility criteria and baseline characteristics of the CheckMate 9ER trial generalizable to adult patients with aRCC with a clear cell component in the Canadian setting. The expert also noted that sunitinib, an approved treatment option for untreated patients with aRCC in Canada, was an appropriate comparator. The trial included outcomes that were important to patients and clinicians. The patient group indicated that stopping disease progression and improving overall outcomes and HRQoL are important to them.
Long-Term Extension Studies
No long-term extension studies were submitted by the sponsor.
Studies Addressing Gaps in the Evidence in the Pivotal and Randomized Controlled Trial Evidence
No additional studies addressing gaps in the pivotal and randomized controlled trial (RCT) evidence were submitted by the sponsor.
Indirect Comparisons
One sponsor-submitted network meta-analysis (NMA) was included in the submission to inform the pharmacoeconomic model and to identify indirect comparisons that fill gaps in the evidence for other first-line treatments of interest for aRCC. The objective of the NMA was to indirectly compare the efficacy and safety of cabozantinib plus nivolumab to other relevant comparators, including sunitinib, pazopanib, ipilimumab plus nivolumab, axitinib plus avelumab, axitinib plus pembrolizumab, and lenvatinib plus pembrolizumab, in treatment-naive patients with aRCC.
Description of NMA
Out of 10 eligible trials, 7 were included in the NMA. The rest were excluded due to lack of relevant data. In total, 5 different NMA approaches were used to generate estimates for PFS, OS, and AEs. For the purpose of this review, the results of the survival end point metaregression for the prognostic risk NMA, fractional polynomial NMA, and standard NMA for AEs are reported. The survival end point metaregression for the prognostic risk NMA attempted to address some sources of heterogeneity across studies in the network by including intermediate prognostic risk patients plus poor prognostic risk patients as a covariate. The fractional polynomial NMA was used to inform the pharmacoeconomic model and attempted to address the violation of the proportional hazards assumption that was identified in most trials The standard NMA for AEs reported on safety — the only NMA approach to do so. The other approaches did not attempt to address any additional gaps in the other methods, and therefore were not reported in this review.
Efficacy and Harms Results
All the connections within the network were limited to 1 study and comparisons of interest within the network were limited to indirect estimates only. In general, the estimates across the different NMA approaches varied with wide credible intervals. The survival end point |||| |||||||||| ||| |||||||||| |||| ||| ||||||| ||| ||| |||||||| ||||||||| |||||| ||| ||||||||||| during the observed period from the trial. After 5 years’ predictive time horizon, ||| ||||||| |||||||| ||||||||| |||||||| || ||||||| ||| ||||||||||| |||||||||| |||||||||| ||| ||||||| ||| ||| |||||||| |||||||||| |||||||| || ||||||||| during the observed period from the trial. After 5 years’ predictive time horizon, ||| ||||||| |||||||| ||||||||| |||||||| || |||||||||. For OS, ||| |||||||| |||||||| |||| |||||||||| ||| |||||||||| |||| ||| ||||||| |||||||| |||||||||| ||| |||||||||| |||||||| || ||||||||| during the observed trial period. After 10 years’ predictive time horizon, ||| ||||||| |||||||| |||||||| |||||||| || |||||||||. The |||||||||| |||||||||| ||| ||||||| ||| || |||||||| ||||||||||| |||||||| || |||||||||. After the observed period, ||| ||||||| |||||||| ||||||||||| |||||||| || |||||||||| ||| |||||||. For harms, ||| ||||||| ||| ||||||||| |||| |||| |||||||||| |||||| ||||| ||||||||||| |||| |||||||| || |||| ||||||||||.
Critical Appraisal
The methods used to conduct the systematic literature review were prespecified and appropriate to search databases, select studies, extract data, and assess quality of the included studies. In total, 5 different NMA approaches were used to generate estimates for PFS, OS, and AEs. However, clear rationale for these approaches was not provided by the sponsor. Out of 10 eligible trials, 7 were included in the NMAs. Three trials were excluded due to lack of relevant data. The authors noted that the NMAs may have been impacted by these exclusions. Based on quantitative and qualitative assessment, the exchangeability assumption was violated as there were several notable sources of heterogeneity and missing data for potential effect modifiers across the included trials, which further limited the ability to assess heterogeneity across the studies. These included patient histology, disease stage, brain metastases, study drug dosing, and follow-up duration. These sources of heterogeneity were not explored sufficiently in any of the NMA approaches, and none addressed the violation of the exchangeability and proportional hazards assumptions collectively. In addition, the risk of bias assessment at the individual study level on effect estimates was not explicitly assessed or discussed. Due to these limitations in the NMA approaches used and uncertainty in their estimates, no definitive conclusions could be drawn on the relative treatment effects of cabozantinib plus nivolumab versus other comparators.
Studies Addressing Gaps in the Pivotal and RCT Evidence
No studies addressing gaps were submitted by the sponsor.
Conclusions
Evidence from 1 phase III, open-label RCT showed that treatment with cabozantinib plus nivolumab resulted in clinically important improvements in PFS, OS, and ORR compared to sunitinib in adults with previously untreated aRCC. These results addressed key treatment outcomes noted as important by both patients and clinicians. For HRQoL, no definitive conclusions can be drawn due to the exploratory nature of the outcomes and open-label design of the trial. Due to limitations of the indirect treatment comparison, no conclusions can be drawn on the relative efficacy and safety of cabozantinib plus nivolumab compared to other active treatments.
Introduction
The objective of this report is to review and critically appraise the evidence submitted by the sponsor on the beneficial and harmful effects of cabozantinib (Cabometyx) 40 mg, taken orally once daily, plus nivolumab (Opdivo) 240 mg IV infusion every 2 weeks or 480 mg IV infusion every 4 weeks for the first-line treatment of adult patients with advanced (not amenable to curative surgery or radiation therapy) or metastatic RCC, hereafter referred to as aRCC.
Disease Background
Content in this section has been informed by materials submitted by the sponsor and clinical expert input. The following has been summarized and validated by the CADTH review team.
The vast majority of kidney cancer cases (90%) are attributed to RCC.2 RCCs are further classified into different subtypes based on histology (clear cell, papillary, chromophobe, clear cell papillary, collecting duct, medullary, and unclassified). The clear cell component subtype is the most prevalent form of RCC and represents more than 70% of all RCC cases in practice.4 Symptoms associated with RCC consist of flank pain, visible blood in the urine (gross hematuria), and a noticeable mass in the abdomen.6 Additional common symptoms of advanced RCC include loss of appetite (anorexia), fatigue, pain, anemia, high levels of calcium in the blood (hypercalcemia), and the formation of blood clots in veins (venous thromboembolism).7 RCC is the ninth most prevalent cancer among men and the 14th most prevalent cancer among women.2 Approximately 8,100 people living in Canada were diagnosed with kidney and renal pelvis cancer in 2022; 85% of those cases were attributed to RCC.14 This corresponds to an incidence rate of 20.4 per 100,000 individuals.3 Patients who have progressed to an advanced stage of RCC generally face a poor prognosis, with reported 5-year survival rates ranging from 0% to 20% for those with metastatic disease.8
RCC is often diagnosed by chest CT scan that was initially ordered for unrelated symptoms.6 Additional CT or MRI scans may be performed to gather more information about the extent of local invasion and potential spread to distant organs. Alongside imaging, laboratory tests are conducted to assess prognosis and determine the risk level using various prognostic scoring systems. To confirm the presence of the tumour, a renal tumour core biopsy is conducted before initiating ablative or systemic treatments.15
A prognostic model created by IMDC was established using 6 adverse prognostic factors, which are classified into the 3 groups of favourable risk (no factors present), intermediate risk (1 to 2 factors present), and poor risk (3 to 6 factors present); in this model, more than 80% of metastatic patients are classified as intermediate and poor risk.10
Standards of Therapy
Content in this section has been informed by materials submitted by the sponsor and clinical expert input. The following has been summarized and validated by the CADTH review team.
Treatment options for untreated clear cell aRCC are guided by IMDC risk group classification.9 There is no standard therapy for non–clear cell aRCC, and it is generally accepted that patients with non–clear cell histology should be treated similarly to patients with clear cell histology.9 The KCRNC guidelines outline therapy options for patients with untreated aRCC in 2 categories: therapies classified as “preferred” are based on studies that demonstrated improvement in OS and therapies classified as “options” are based on studies that demonstrated PFS and not necessarily OS.9
For patients who fall under the IMDC favourable-risk category, the preferred treatments according to the KCRNC guidelines are a combination of immunotherapy and VEGF receptor TKI. These include pembrolizumab plus axitinib, pembrolizumab plus lenvatinib, or cabozantinib plus nivolumab, with sunitinib or pazopanib as alternative options for patients who have a contraindication to immunotherapy or who are unable to tolerate combination therapy.9
For patients who fall under the IMDC intermediate-risk or poor-risk category, the preferred treatments according to the KCRNC guidelines are ipilimumab plus nivolumab, pembrolizumab plus axitinib, cabozantinib plus nivolumab, or pembrolizumab plus lenvatinib, with sunitinib, pazopanib, or cabozantinib monotherapy as alternative options. Active surveillance is an option for select patients based on disease and patient characteristics.9
Drug Under Review
Cabozantinib, in combination with nivolumab, is indicated for the first-line treatment of adult patients with advanced or metastatic RCC.1 Cabozantinib is also indicated for the treatment of patients with hepatocellular carcinoma who have been previously treated with sorafenib and for the treatment of adult patients with locally advanced or metastatic differentiated thyroid carcinoma that has progressed following prior VEGF receptors targeted therapy and who are radioactive iodine–refractory or ineligible. The recommended dosage of cabozantinib in combination with nivolumab for aRCC includes 40 mg cabozantinib once daily orally and 240 mg nivolumab every 2 weeks (30-minute IV infusion) or 480 mg every 4 weeks (30-minute IV infusion).1 Cabozantinib is a small molecule that inhibits multiple receptor protein-tyrosine kinases implicated in tumour growth and angiogenesis, pathologic bone remodelling, drug resistance, and metastatic progression of cancer. Cabozantinib inhibits MET, VEGF receptors, and GAS6 receptor (AXL).
Cabozantinib received a Health Canada Notice of Compliance for the indication under review on October 12, 2021. The reimbursement request aligns with the approved Health Canada indication. Key characteristics of cabozantinib and nivolumab, and commonly used treatments for untreated aRCC, are presented in Table 3.
Table 3: Key Characteristics of Cabozantinib, Nivolumab, Sunitinib, Pazopanib, Pembrolizumab, Axitinib, Lenvatinib, and Ipilimumab
Drug name(s) | Mechanism of action | Indicationa | Route of administration | Recommended dosage | Serious warnings and precautions |
|---|---|---|---|---|---|
Combination therapies | |||||
Cabozantinib plus nivolumab | Cabozantinib: Inhibits multiple RTKs with primary inhibition targets of MET, VEGF receptors, and GAS6 receptor (AXL) Nivolumab: A human IgG4 monoclonal antibody that binds to the PD-1 receptor and blocks its interaction with PD-L1 and PD-L2, releasing PD-1 pathway-mediated inhibition of the immune response, including the antitumour immune response | For the first-line treatment of adult patients with advanced (not amenable to curative surgery or radiation therapy) or metastatic RCC | Cabozantinib: Oral Nivolumab: IV | Cabozantinib: 40 mg once daily Nivolumab: 240 mg every 2 weeks or 480 mg every 4 weeks (30-minute IV infusion in both instances) | Cabozantinib: Thromboembolism, hypertension, gastrointestinal perforation and fistulas, hemorrhage, hepatotoxicity Nivolumab: Pneumonitis, interstitial lung disease, encephalitis, myocarditis, SJS, TEN, and autoimmune hemolytic anemia |
Pembrolizumab plus axitinib | Pembrolizumab: A high-affinity antibody with a dual ligand blockade of the PD-1 pathway Axitinib: Inhibits tyrosine kinase VEGFR-1, VEGFR-2, and VEGFR-3 | For the treatment of adult patients with advanced or metastatic RCC with no prior systemic therapy | Pembrolizumab: IV Axitinib: Oral | Pembrolizumab: 200 mg IV infusion over 30 minutes once every 3 weeks Axitinib: 5 mg orally twice daily | Pembrolizumab: Immune-mediated pneumonitis, colitis, hepatitis, nephritis and renal dysfunction, endocrinopathies, adrenal insufficiency, hypophysitis Axitinib: Hypertension, arterial thromboembolism, venous thromboembolism, hemorrhage, gastrointestinal perforation and fistulas, reversible posterior leukoencephalopathy syndrome, congestive heart failure |
Lenvatinib plus pembrolizumab | Lenvatinib: RTK inhibitor that selectively inhibits the kinase activities of VEGF receptors VEGFR-1 (FLT1), VEGFR-2 (KDR), and VEGFR-3 (FLT4) Pembrolizumab: A high-affinity antibody with a dual ligand blockade of the PD-1 pathway | For the treatment of adult patients with advanced or metastatic RCC with no prior systemic therapy for metastatic RCC | Lenvatinib: Oral Pembrolizumab: IV | Lenvatinib: 20 mg (two 10 mg capsules) once daily Pembrolizumab: 200 mg IV infusion over 30 minutes every 3 weeks or 400 mg IV infusion over 30 minutes every 6 weeks | Lenvatinib: Hypertension, cardiac failure, arterial thromboembolism, gastrointestinal perforation and fistulas, hepatotoxicity and/or hepatic failure, renal failure, hemorrhage, reversible posterior leukoencephalopathy syndrome Pembrolizumab: Immune-mediated pneumonitis, colitis, hepatitis, nephritis and renal dysfunction, endocrinopathies, adrenal insufficiency, hypophysitis |
Ipilimumab plus nivolumab | Ipilimumab: A human antibody that blocks T-cell inhibitory signals, increasing the number of tumour reactive T effector cells and tumour immune response Nivolumab: A human IgG4 monoclonal antibody that binds to the PD-1 receptor and blocks its interaction with PD-L1 and PD-L2, releasing PD-1 pathway-mediated inhibition of the immune response, including the antitumour immune response | For the treatment of adult patients with intermediate-risk or poor-risk advanced or metastatic RCC, when used in combination with nivolumab | Ipilimumab: IV Nivolumab: IV | Combination phase Ipilimumab: 1 mg/kg (30 minutes) on the same day as nivolumab Nivolumab: 3 mg/kg every 3 weeks (30 minutes) Single-drug phase Nivolumab: 3 mg/kg every 2 weeks or 240 mg every 2 weeks or 480 mg every 4 weeks (30-minute IV infusion) Duration of combination phase is the first 4 doses | Ipilimumab: Enterocolitis, intestinal perforation, hepatitis, dermatitis (including TEN), SJS, neuropathy, endocrinopathy, pneumonitis, interstitial lung disease, myocarditis, encephalitis, myasthenia gravis, autoimmune hemolytic anemia Nivolumab: Pneumonitis, interstitial lung disease, encephalitis, myocarditis, SJS, TEN, and autoimmune hemolytic anemia |
Single-drug therapies | |||||
Sunitinib | Small molecule that inhibits multiple RTKs | For the treatment of locally advanced or metastatic RCC in patients who failed or are intolerant to prior systemic therapy | Oral | 400 mg twice daily | Tumour hemorrhage, decreases in LVEF, hypertension, cardiomyopathy, cerebrovascular and cardiovascular events, pulmonary embolism, thrombotic microangiopathy, hepatotoxicity |
Pazopanib | Small, multitarget molecule TKI. It is a potent inhibitor of VEGF receptors VEGFR-1, VEGFR-2, and VEGFR-3, and PDGFR-alpha. | For the treatment of patients with metastatic RCC as first-line systemic therapy or as second-line systemic therapy after treatment with cytokines for metastatic disease | Oral | 800 mg orally once daily; should be taken without food | Hepatotoxicity, hypertension, cardiac dysfunction, QT or QT corrected prolongation, arterial and venous thrombotic events, hemorrhage, gastrointestinal perforation and fistulas, reversible posterior leukoencephalopathy syndrome, tumour lysis syndrome |
Axitinib | Inhibits tyrosine kinase VEGFR-1, VEGFR-2, and VEGFR-3 | Treatment of patients with metastatic RCC of clear cell histology after failure of prior systemic therapy with either a cytokine or the VEGF-TKI sunitinib | Oral | Tablet 5 mg twice daily | Hypertension, arterial thromboembolism, venous thromboembolism, hemorrhage, gastrointestinal perforation and fistulas, reversible posterior leukoencephalopathy syndrome, congestive heart failure |
IgG4 = immunoglobulin G4; LVEF = left ventricular ejection fraction; PDGFR = platelet-derived growth factor receptor; RCC = renal cell carcinoma; RPTK = receptor protein-tyrosine kinase; SJS = Stevens-Johnson syndrome; TEN = toxic epidermal necrolysis; TKI = tyrosine kinase inhibitor; VEGF = vascular endothelial growth factor; VEGF-TKI = vascular endothelial growth factor–tyrosine kinase inhibitor; VEGFR-1 = vascular endothelial growth factor receptor-1; VEGFR-2 = vascular endothelial growth factor receptor-2; VEGFR-3 = vascular endothelial growth factor receptor-3.
aHealth Canada–approved indication.
Sources: Product monographs for cabozantinib,1 nivolumab,16 sunitinib,17 pazopanib,18 pembrolizumab,19 axitinib,20 lenvatinib,21 and ipilimumab.22
Stakeholder Perspectives
Patient Group Input
This section was prepared by the CADTH review team based on the input provided by patient groups. The full original patient input received by CADTH has been included in the stakeholder section at the end of this report.
One patient group, KCC, submitted input for this review. KCC reported that patients in Canada do not have access to cabozantinib plus nivolumab for RCC through clinical trials or other programs and, as a result, KCC could not gather information on patients’ feedback or experiences with this therapy. Their submission was based on a survey conducted by the International Kidney Cancer Coalition and the KCC in 2022. Among 2,213 respondents, 139 were from Canada, including 111 (80%) patients diagnosed with kidney cancer and 28 (20%) caregivers.
According to KCC, metastatic RCC is a fatal disease with a poor prognosis. The patient group reported that outcomes for patients with metastatic RCC are improving due to new treatments becoming available. However, patients who are undergoing the same treatment may have different degrees of adverse events (AEs). A caregiver of a patient with stage IV papillary renal carcinoma noted challenges with accessing cabozantinib plus nivolumab in Canada, and it was emphasized that accessing this treatment privately involves substantial costs that must be covered out of pocket.
KCC reported that patients need access to new, effective treatment options that can stop disease progression, control drug resistance, and improve overall outcomes. KCC highlighted that if there are more and better treatment options, patients and oncologists can tailor treatment plans to each patient’s unique disease and treatment history, with the goal of achieving the best possible outcomes and improving patients’ quality of life. The patient group indicated that cabozantinib plus nivolumab could fill an unmet need in papillary RCC, where additional treatment options are needed. According to KCC, it is necessary to acknowledge different treatment options and the preferences of patients, and having alternative treatment options is crucial if a drug is intolerable for a patient. The patient group indicated it is also essential to have treatment decisions based on solid evidence for available treatments, patient and disease-specific characteristics, and communication between the physician and patient. KCC indicated that patients with brain metastases are a subgroup with significant treatment challenges and unmet needs.
Clinician Input
Input From Clinical Expert Consulted by CADTH
All CADTH review teams include at least 1 clinical specialist with expertise regarding the diagnosis and management of the condition for which the drug is indicated. Clinical experts are a critical part of the review team and are involved in all phases of the review process (e.g., providing guidance on the development of the review protocol, assisting in the critical appraisal of clinical evidence, interpreting the clinical relevance of the results, providing guidance on the potential place in therapy). The following input was provided by 1 clinical specialist with expertise in the diagnosis and management of aRCC.
Unmet Needs
The clinical expert noted that unmet needs of patients with aRCC include reducing side effects, particularly having access to less toxic therapies, and that available treatments do not have curative potential. The clinical expert highlighted that side effects are a major limitation of all the currently available treatments. Common side effects with VEGF-TKIs are hypertension, rash, diarrhea, hypothyroidism, and cytopenias, and immune checkpoint inhibitors carry a risk of off-target immune-related AEs, with some being life-threatening. The clinical expert also noted that available treatments are considered palliative, and that most patients’ disease progresses, and next lines of therapy are sought.
Place in Therapy
The clinical expert noted that cabozantinib plus nivolumab would compete with other first-line options (i.e., single-drug VEGF-TKI therapy, TKI-checkpoint inhibitor therapy, or dual checkpoint inhibitor therapy). Cabozantinib targets a broader range of tyrosine kinases than the VEGF-TKIs.
The clinical expert also indicated that the use of cabozantinib plus nivolumab would challenge the existing treatment paradigm since it is unclear what drugs would be effective as second-line treatment after disease progression. Cabozantinib monotherapy is currently used as either second-line therapy, after pembrolizumab plus axitinib, or third-line therapy, after single-drug VEGF-TKI as first-line therapy and nivolumab as second-line therapy. The clinical expert noted that, in their opinion, cabozantinib plus nivolumab would not be the first treatment choice to address the underlying disease process and it would be appropriate to recommend other first-line options so that cabozantinib remained available for patients who experience disease progression.
Patient Population
The clinical expert indicated that patients who are best suited for cabozantinib plus nivolumab are those with IMDC intermediate-risk or poor-risk prognosis, while patients with IMDC favourable-risk prognosis might be better off receiving a single-drug VEGF-TKI. The clinical expert noted that it is not clear which patients are most likely to respond, although it’s probable those with the least disease burden are most likely to respond. Other than standard assessment (i.e., history, physical exam, imaging, and bloodwork) and application of a prognostic framework (e.g., IMDC score), the clinical expert noted there is no other specific marker that will help to determine who is best suited for this combination treatment.
Assessing Response to Treatment
The clinical expert noted that measures of response would include radiologic evidence and symptom assessment, conducted every 8 weeks to 12 weeks. These include stability of the known sites of disease, without worsening of DRS and without intolerable side effects.
Discontinuing Treatment
The clinical expert noted that progressive disease should be a definitive indication to discontinue treatment, as should significant side effects. The clinical expert also indicated in their opinion the need to rule out “pseudoprogression,” a common phenomenon that suggests early radiologic progression, by allowing the treatment to continue for at least 1 more assessment time point. The types of side effects that could lead to treatment discontinuation would include severe hypertension, severe diarrhea, severe fatigue, liver dysfunction, and any IMAEs. The clinical expert noted that the requirement for additional treatment (e.g., radiation for brain metastases) would not necessarily lead to treatment discontinuation, but it could lead to a treatment pause.
Prescribing Considerations
The clinical expert noted that a medical oncologist with experience in managing immunotherapy and TKI therapy should be required to diagnose, treat, and monitor patients who might receive cabozantinib plus nivolumab, in designated community settings. Since nivolumab can occasionally lead to a hypersensitivity reaction like other monoclonal antibodies, it should be administered in a setting that has experience managing such reactions. The clinical expert also noted that in most settings, the co-supervision of treatment — along with the medical oncologist — is done by a family physician in oncology who has training in managing oncology drugs.
Clinician Group Input
This section was prepared by the CADTH review team based on the input provided by clinician groups. The full original clinician group input received by CADTH has been included in the stakeholder section at the end of this report.
Clinician group input was received from OH-CCO’s GU DAC, and KCRNC. A total of 7 clinicians (3 for OH-CCO and 4 for KCRNC) provided input for this review.
The clinician groups agreed that there are important unmet needs for the treatment of patients with aRCC. KCRNC highlighted the need for drug development and increasing clinical trial options for non–clear cell patients, as well as developing biomarkers for the prediction of response to the treatment, decreasing the attrition of patients, and optimizing the treatment of brain metastases. OH-CCO’s GU DAC pointed to the lack of further options for refractory disease.
Both clinician groups agreed that untreated patients with any IMDC prognostic risk score would be potentially eligible for systemic treatment with cabozantinib plus nivolumab. The clinician groups indicated that cabozantinib plus nivolumab would be an additional first-line treatment option for patients with aRCC, and this combination therapy could potentially address unmet needs for some patients. KCRNC added that papillary RCC patients, and patients with very aggressive disease who cannot tolerate any disease progression could benefit from this combination therapy. Both groups mentioned that treatment should be discontinued in case of disease progression or unacceptable toxicity.
Drug Program Input
The drug programs provide input on each drug being reviewed through CADTH’s reimbursement review processes by identifying issues that may impact their ability to implement a recommendation. The implementation questions and corresponding responses from the clinical experts consulted by CADTH are summarized in Table 4.
Table 4: Summary of Drug Plan Input and Clinical Expert Response
Drug program implementation question | Clinical expert response |
|---|---|
Relevant comparators | |
The trial compared cabozantinib plus nivolumab against sunitinib. Currently funded first-line options include pembrolizumab plus axitinib (any risk category), ipilimumab plus nivolumab (intermediate-risk or poor-risk category), and single-drug sunitinib or pazopanib. At the time of this input, pembrolizumab plus lenvatinib is under negotiation. How does cabozantinib plus nivolumab compare to either pembrolizumab plus axitinib, ipilimumab plus nivolumab, pembrolizumab plus lenvatinib, or pazopanib? | The clinical expert noted that, in their opinion, cabozantinib plus nivolumab is superior to a first-line single-drug VEGF-TKI (sunitinib and pazopanib), and it appears comparable to the other combination therapies listed. |
Considerations for initiation of therapy | |
The trial included patients who had 1 previous adjuvant or neoadjuvant therapy for completely resectable renal cell carcinoma, provided that the drug did not target VEGF or VEGF receptors and that the recurrence was at least 6 months from the last dose of adjuvant or neoadjuvant therapy. Adjuvant pembrolizumab is currently in negotiations. Should patients with prior adjuvant or neoadjuvant therapy be eligible for cabozantinib plus nivolumab provided there has been a disease-free interval of 6 months or greater in-between? | The clinical expert indicated that patients should be eligible for first-line systemic therapy if they received adjuvant or neoadjuvant therapy at least 6 months prior. The clinical expert noted that, so far, there has been modest uptake of perioperative systemic therapy in renal carcinoma, given limited evidence of a survival advantage with this treatment. |
Should patients who complete 2 years of nivolumab and experience disease progression or recurrence while off nivolumab be eligible for re-treatment with nivolumab? If yes, what is the treatment duration for the nivolumab re-treatment? Should nivolumab re-treatment be given with cabozantinib or can it be given as monotherapy? | The clinical expert noted that there is no clear approach, but they believe expert opinion would suggest that a trial with a checkpoint inhibitor (e.g., nivolumab) alone is reasonable if the patient has been off nivolumab for at least 3 months to 6 months. If there is a response, treatment should continue until progression or 2 years. |
Should the following patients be considered for cabozantinib plus nivolumab:
| The clinical expert indicated that patients with stable CNS metastases were included in the CheckMate 9ER trial and should be eligible for cabozantinib plus nivolumab. The trial required a component of clear cell, and this criterion should be maintained, although patients with non–clear cell histology are generally treated with the same regimens tested on patients with clear cell histology in regular practice. The clinical expert noted that data to support this approach is lacking but some studies have demonstrated that the non–clear cell malignancies respond to these therapies, albeit to a lesser extent. Cabozantinib plus nivolumab should not be used for patients with poor performance status. |
Should the criteria for cabozantinib plus nivolumab be similar to that of pembrolizumab plus lenvatinib or pembrolizumab plus axitinib? | The clinical expert indicated that the criteria should be similar. |
Considerations for prescribing of therapy | |
PAG would like to inform pERC that jurisdictions will implement weight-based dosing up to a cap for nivolumab, similar to other immunotherapy policies (i.e., 3 mg/kg up to 240 mg every 2 weeks or 6 mg/kg up to 480 mg every 4 weeks). | Comment from the drug plans to inform pERC deliberations. |
In the trial, if 1 drug had to be discontinued for reasons other than disease progression, treatment could continue with the other drug. | Comment from the drug plans to inform pERC deliberations. |
Generalizability | |
Should patients currently receiving an alternative first-line therapy, who have not yet progressed, be eligible to switch to cabozantinib plus nivolumab? | The clinical expert noted that given the lack of strong evidence that cabozantinib plus nivolumab is better than other first-line options or has a more favourable toxicity profile, there is no rationale for switching. |
Funding algorithm (oncology only) | |
Cabozantinib plus nivolumab would be an alternative first-line option. Under what circumstances would cabozantinib plus nivolumab be preferred over pembrolizumab plus axitinib, pembrolizumab plus lenvatinib, or ipilimumab plus nivolumab? What evidence is available to support downstream sequencing after being treated with cabozantinib plus nivolumab and what should the sequencing look like? | Cabozantinib plus nivolumab is an additional first-line treatment option. The clinical expert did not indicate circumstances in which cabozantinib plus nivolumab would be a preferred first-line option over pembrolizumab plus axitinib, pembrolizumab plus lenvatinib, or ipilimumab plus nivolumab. The clinical expert noted that both ipilimumab plus nivolumab and pembrolizumab plus axitinib have more obvious sequencing strategies, and therefore the clinical expert indicated these treatment options would be preferred first-line therapies over cabozantinib plus nivolumab, where a clear second-line treatment and beyond strategy is not yet apparent. |
System and economic issues | |
The cost of cabozantinib plus nivolumab should not exceed the drug program cost of the least costly tyrosine kinase inhibitor plus immunotherapy regimen reimbursed for this indication. | There was a comment from the drug plans to inform pERC deliberations. |
CNS = central nervous system; PAG = Provincial Advisory Group; pERC = CADTH pan-Canadian Oncology Review Expert Review Committee; VEGF = vascular endothelial growth factor; VEGF-TKI = vascular endothelial growth factor–tyrosine kinase inhibitor; VEGFR = vascular endothelial growth factor receptor.
Clinical Evidence
The objective of CADTH’s Clinical Review Report is to review and critically appraise the clinical evidence submitted by the sponsor on the beneficial and harmful effects of cabozantinib 40 mg, taken orally once daily, plus nivolumab 240 mg IV infusion every 2 weeks or 480 mg IV infusion every 4 weeks for the first-line treatment of adult patients with aRCC. The focus is placed on comparing cabozantinib plus nivolumab to relevant comparators and identifying gaps in the current evidence.
A summary of the clinical evidence included by the sponsor in the review of cabozantinib plus nivolumab is presented in 2 sections, and CADTH’s critical appraisal of the evidence is included after each section. The first section, the systematic review, includes pivotal studies and RCTs selected according to the sponsor’s systematic review protocol. The second section includes indirect evidence from the sponsor. No long-term extension studies or studies addressing gaps in the pivotal and RCT evidence were submitted by the sponsor.
Included Studies
Clinical evidence from the following are included in the CADTH review and appraised in this document:
One pivotal study and RCT evidence
One indirect treatment comparison.
Pivotal Studies and RCT Evidence
Content in this section has been informed by materials submitted by the sponsor. The following has been summarized and validated by the CADTH review team.
Description of Studies
Characteristics of the included study are summarized in Table 5.
Table 5: Details of the Pivotal Study Identified by the Sponsor
CheckMate 9ER study | |
|---|---|
Designs and populations | |
Study design | Phase III, randomized, open-label trial |
Locations | 125 sites across the following countries: Argentina, Australia, Brazil, Chile, Czechia, Germany, Greece, Israel, Italy, Japan, Mexico, Poland, Romania, Russia, Spain, Türkiye, the US, and the UK |
Patient enrolment dates | August 22, 2017, to May 2019 |
Randomized (N) | 651 (cabozantinib plus nivolumab = 323; sunitinib = 328) |
Inclusion criteria |
|
Exclusion criteria |
|
Drugs | |
Intervention | Cabozantinib 40 mg p.o. (by mouth) q.d. plus nivolumab 240 mg flat dose IV q.2.w. |
Comparator(s) | Sunitinib 50 mg p.o. (by mouth) q.d. for 4 weeks, followed by 2 weeks off-treatment, per cycle |
Study duration | |
Screening phase | Within 3 months but no more than 12 months before enrolment |
Treatment phase | Cabozantinib and sunitinib to be continued until disease progression or unacceptable toxicity Nivolumab to be continued until disease progression or unacceptable toxicity, with maximum treatment of 2 years from the first dose |
Follow-up phase | Every 3 months until death, loss to follow-up, or end of study up to 45 months |
Outcomes | |
Primary end point | Progression-free survival from randomization date to date of first documented tumour progression or death, whichever occurs first up to 39 months |
Secondary and exploratory end points | Secondary:
Exploratory:
|
Data cut-offs | March 30, 2020, and June 24, 2021 |
Publication status | |
Publications | ClinicalTrials.gov number NCT03141177 Choueiri et al. (2021)23 Motzer et al. (2022)24 Cella et al. (2022)25 |
AJCC = American Joint Committee on Cancer; CNS = central nervous system; EQ-5D-3L = 3-Level EQ-5D; FKSI-19 = 19-item Functional Assessment of Cancer Therapy–Kidney Symptom Index; IMDC = International mRCC [Metastatic Renal Cell Carcinoma] Database Consortium; q.d. = every day; q.2.w. = every 2 weeks; RCC = renal cell carcinoma; VEGF = vascular endothelial growth factor.
Note: Details from the table have been taken from the sponsor’s Summary of Clinical Evidence.
Source: CheckMate 9ER Clinical Study Report.13
CheckMate 9ER is a phase III, randomized, open-label, multicentre trial that aimed to assess the efficacy and safety of cabozantinib 40 mg, taken orally once daily, plus nivolumab 240 mg IV infusion every 2 weeks versus sunitinib 50 mg, taken orally once daily for 4 weeks, followed by 2 weeks off, per 6-week cycle in adult patients with previously untreated aRCC (Figure 1). The trial enrolled patients with aRCC with a clear cell component and no prior systemic therapy for RCC, except for 1 prior adjuvant or neoadjuvant therapy that did not include a drug targeting VEGF or VEGF receptors. The trial included a screening period of up to 12 months, a treatment period of until disease progression or unacceptable toxicity, with a maximum treatment of 2 years for nivolumab, and a follow-up period of up to 45 months, until death or loss to follow-up.
Enrolled patients were randomly assigned using interactive response technology 1:1 (N = 651, at 125 sites across 18 countries) to receive cabozantinib 40 mg orally plus nivolumab 240 mg IV infusion (N = 323) or sunitinib 50 mg orally (N = 328). There were no sites in Canada. Randomization was stratified according to the IMDC prognostic risk score (0 [favourable] versus 1 or 2 [intermediate] versus 3 to 6 [poor]), geographic region (the US,Europe versus the rest of the world), and tumour expression of the PD-L1 (≥ 1% versus < 1% or indeterminate).
The outcomes relevant to the CADTH review included the primary outcome of PFS, the secondary outcomes of OS, ORR, and safety, and exploratory HRQoL outcomes measured via FKSI-19 and the EQ-5D-3L’s EQ VAS. The trial enrolled patients between August 2017 and May 2019 and included 2 data cut-off dates: March 30, 2020, and June 24, 2021.
Figure 1: Study Design of CheckMate 9ER Study
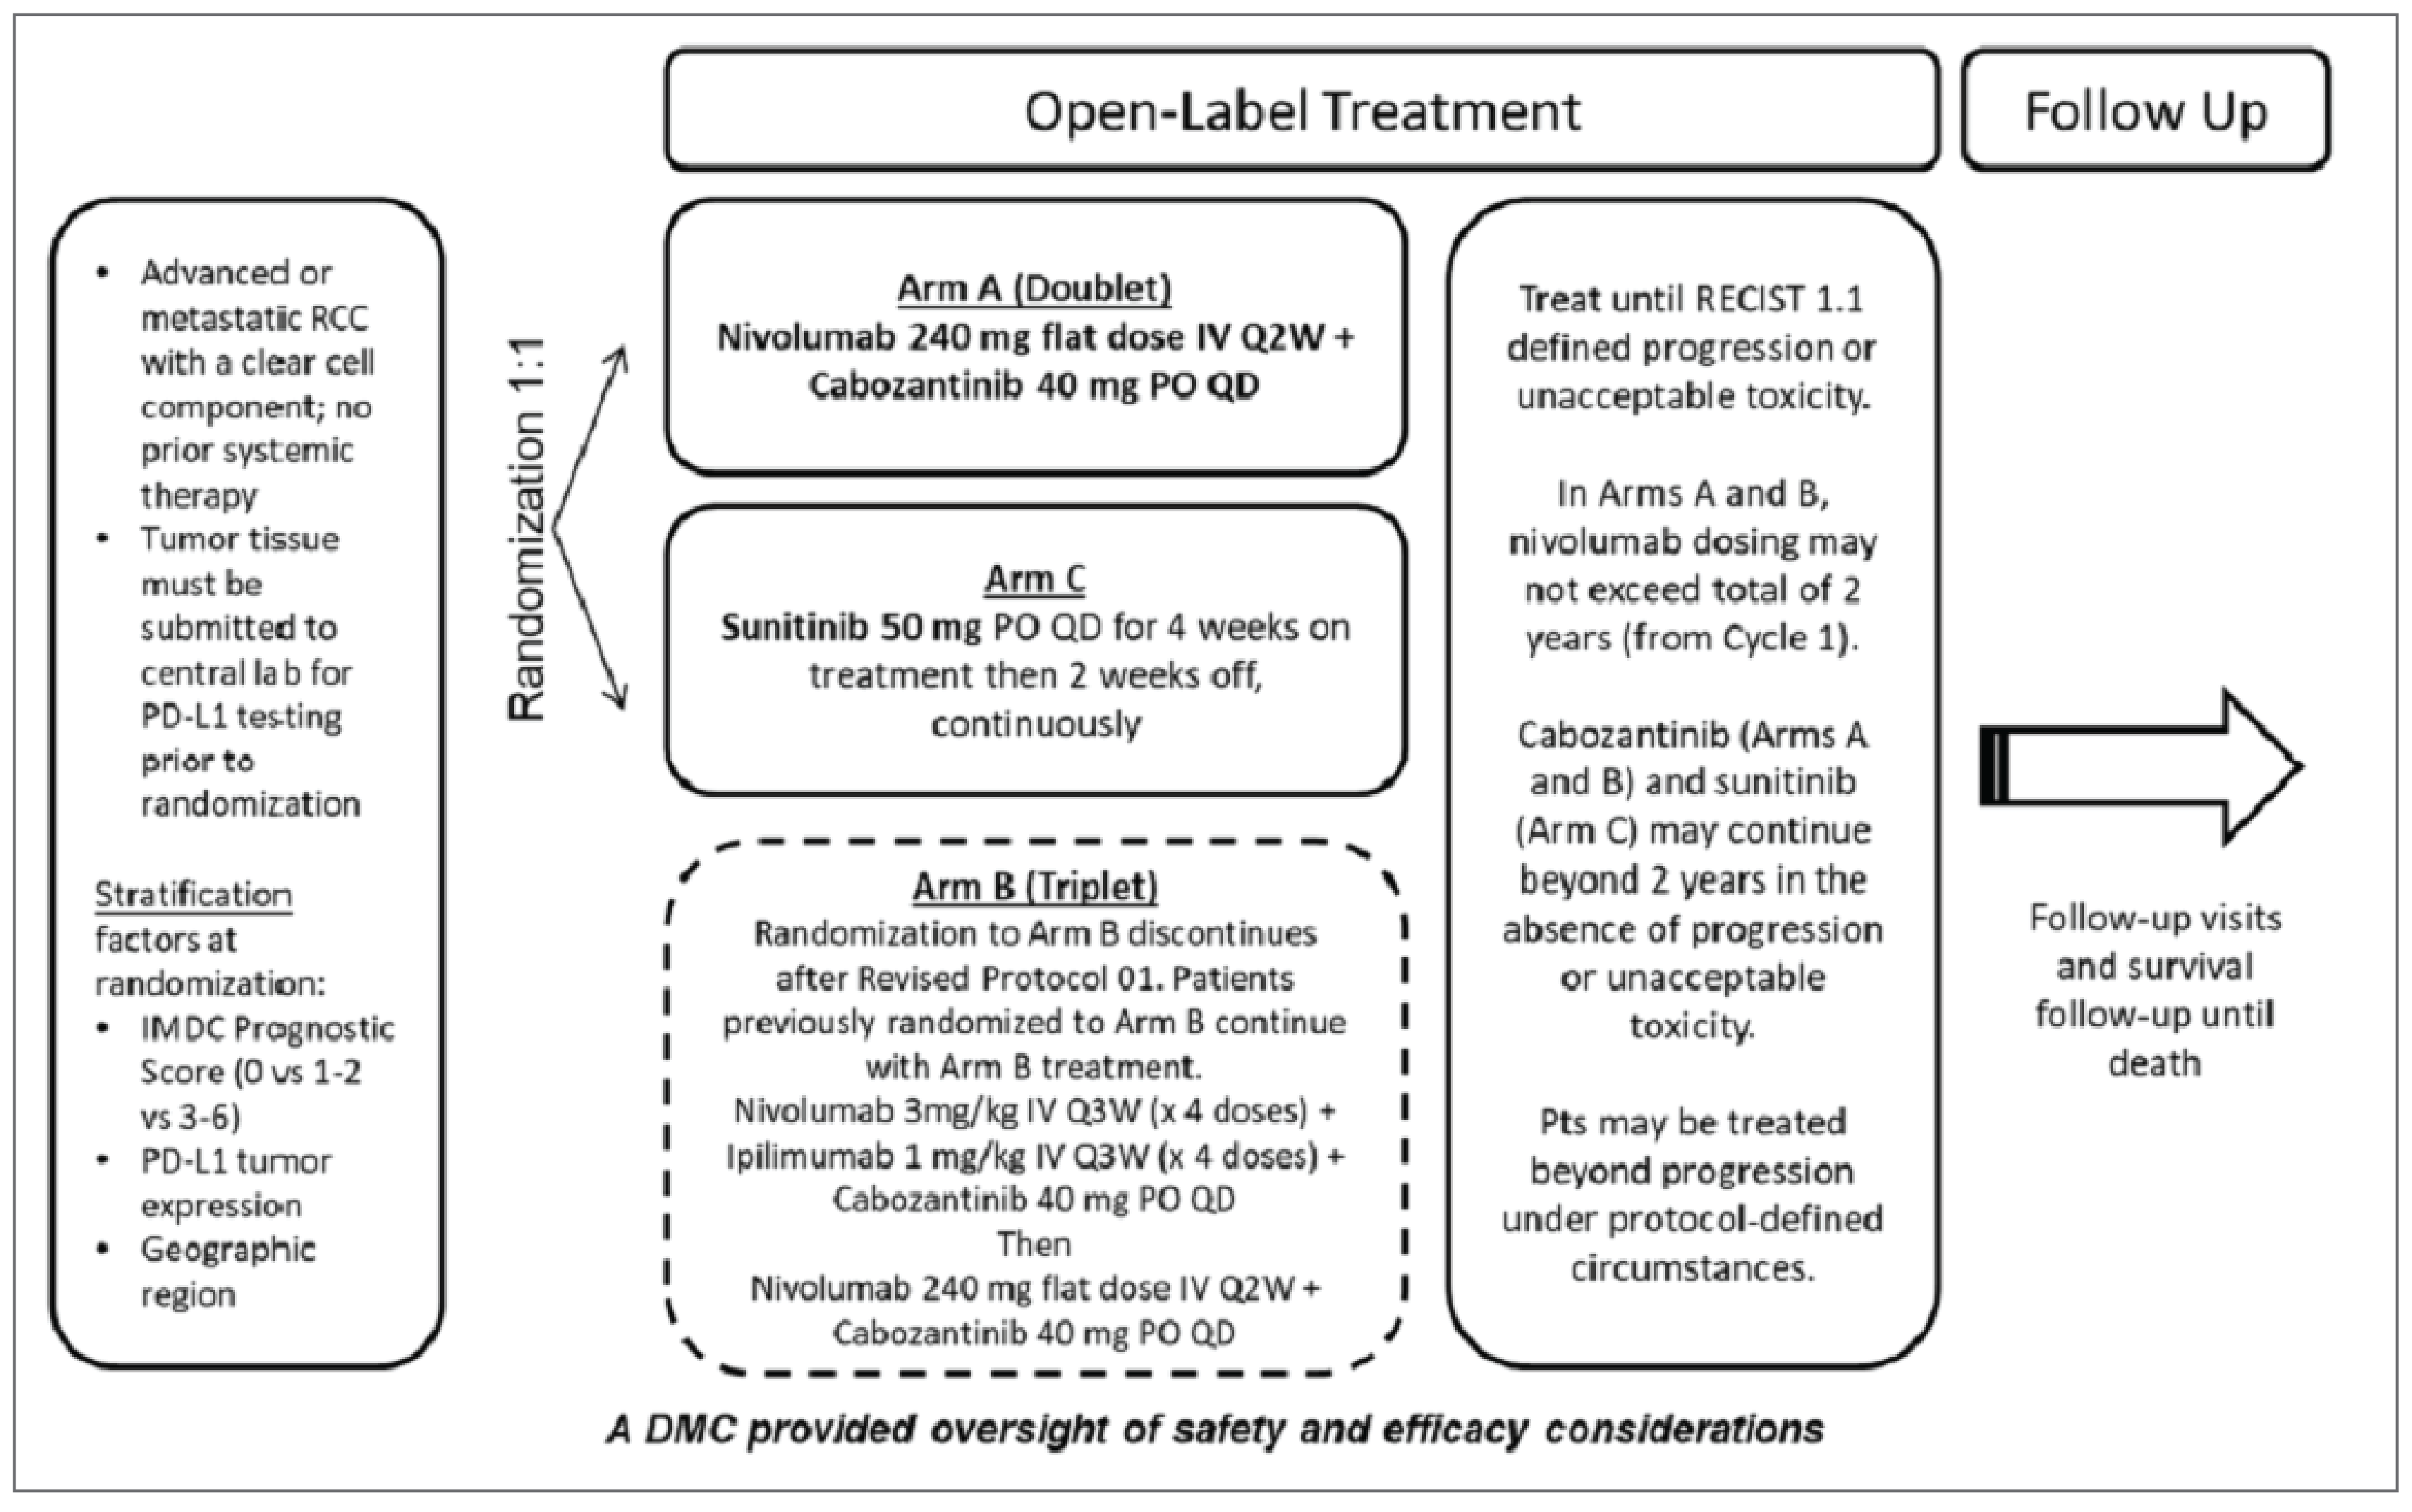
DMC = data-monitoring committee; IMDC = International mRCC [Metastatic Renal Cell Carcinoma] Database Consortium; PO = per os; pts = patients or participants; Q2W = every 2 weeks; Q3W = every 3 weeks; QD = every day; RCC = renal cell carcinoma; RECIST = Response Evaluation Criteria in Solid Tumours.
Note: Drugs administered PO are given orally, by mouth.
Source: CheckMate 9ER Clinical Study Report.13
Populations
Inclusion and Exclusion Criteria
A detailed description of the inclusion and exclusion criteria for the CheckMate 9ER study is provided in Table 5. Eligible patients were adults with previously untreated aRCC with a clear cell component and who had any IMDC prognostic risk score and a Karnofsky Performance Status score of at least 70. Patients were excluded if they had active central nervous system metastases or active autoimmune disease or had received systemic treatment with either glucocorticoids or other immunosuppressive medications within 14 days before randomization.
Interventions
Patients received cabozantinib 40 mg, taken orally once daily, plus nivolumab 240 mg IV infusion every 2 weeks or sunitinib 50 mg, taken orally once daily for 4 weeks, followed by 2 weeks off, per 6-week cycle. The nivolumab injection, 100 mg/10 mL (10 mg/mL) was administered as an IV infusion (30 minutes) through a 0.2-micron to 1.2-micron pore size, low-protein binding inline filter. All trial treatment continued until disease progression or unacceptable toxicity, with a maximum 2-year duration for nivolumab treatment. Crossover between groups was not permitted. Dose reductions were not allowed for nivolumab but were permitted for cabozantinib and sunitinib. Dose delays for AEs were permitted for all trial drugs. Discontinuation assessments for nivolumab and cabozantinib were made separately for each drug; if discontinuation criteria were met for only 1 drug, treatment could continue with the other drug that was not related to the observed toxic effect.
In patients who started a strong concomitant CYP3A4 inhibitor, the daily cabozantinib dose was reduced by 20 mg (for example, from 40 mg to 20 mg daily), resuming the dose that was used before initiating the CYP3A4 inhibitor 2 to 3 days after discontinuation of the strong inhibitor.
Outcomes
A list of efficacy end points assessed in this Clinical Review Report are summarized in Table 6. Summarized end points are based on those included in the sponsor’s Summary of Clinical Evidence as well as any identified as important to this review according to the clinical expert, clinician groups, or patient groups who provided input for this review.
Progression-Free Survival
The primary end point of the CheckMate 9ER trial was PFS (as defined by RECIST version 1.1) between the date of randomization and the first date of documented progression, or death due to any cause, whichever occurred first. Patients who died without a reported progression (and died without starting subsequent anticancer therapy) were considered to have progressed on the date of death. Patients who received subsequent anticancer therapy were censored at the date of their last evaluable tumour assessment on or before the date of initiation of the subsequent anticancer therapy. Tumour assessments were done with a CT or MRI of the chest, abdomen, pelvis, brain (baseline only), and all known sites of disease at baseline (within 28 days before randomization), at 12 weeks (± 7 days) after randomization, then every 6 weeks (± 7 days) until week 60, and then every 12 weeks (± 14 days) until disease progression according to RECIST version 1.1, as assessed by the investigator and confirmed by a BICR.
Table 6: Outcomes Summarized From Pivotal Study Identified by the Sponsor
Outcome measure | Time point | CheckMate 9ER study |
|---|---|---|
PFS | Through 39 months | Primarya |
OS | Through 42 months | Secondarya |
ORR | Through 36 months | Secondarya |
FKSI-19 total and DRS | Through 26.45 months | Exploratory |
EQ VAS, part of EQ-5D-3L | Through 26.45 months | Exploratory |
Safety | Through 45 months | Secondary |
DRS = Disease Related Symptoms; EQ VAS = EQ visual analogue scale; EQ-5D-3L = 3-Level EQ-5D; FKSI-19 = 19-item Functional Assessment of Cancer Therapy–Kidney Symptom Index; ORR = objective response rate; OS = overall survival; PFS = progression-free survival.
aStatistical testing for these end points was based on a prespecified hierarchical testing procedure.
Note: Details from the table have been taken from the sponsor’s Summary of Clinical Evidence.
Source: CheckMate 9ER Clinical Study Report.13
Overall Survival
The secondary outcome of OS was defined as the time between randomization and the date of death from any cause. For living patients, survival time was censored at the date of the last contact date or the last known date that they were alive. OS was censored at the date of randomization for patients who were randomized but had no follow-up.
Objective Response Rate
The secondary outcome ORR was defined as the number of randomized patients who achieved a best response of confirmed complete response or confirmed partial response based on BICR assessments using RECIST version 1.1 criteria.
Health-Related Quality of Life
The exploratory end points evaluating patient HRQoL were measured by FKSI-19 and the EQ-5D-3L’s EQ VAS. A summary of their measurement properties is in Table 7. These questionnaires were self-administered by patients. For the cabozantinib plus nivolumab group, data were collected every 2 weeks after baseline compared with every 6 weeks after baseline for the sunitinib group. The analysis included patients with a baseline assessment and at least 1 postbaseline assessment.
The FKSI-19 is a multidimensional, self-administered 19-item questionnaire that measures DRS in patients with kidney cancer over the past 7 days. The 19 items cover symptoms (e.g., lack of energy, fatigue, pain), ability to work, and HRQoL. Patients respond by selecting 1 of 5 response categories ranging from “not at all” to “very much.” Higher scores indicate fewer DRS (i.e., better HRQoL). The MID for the FKSI-19 total score and the DRS score have been estimated to be 3 points and 1 point, respectively.11
The EQ VAS, part of the EQ-5D-3L tool, is a standardized, self-rated generic instrument that measures global health status. The EQ VAS asks respondents to rate their current health on a scale ranging from worst imaginable (0) to best imaginable (100), using same-day recall. Sample estimates were compared with established population norms. The MID for patients with cancer was estimated to be 7 points.12 No MID for patients with RCC was identified.
Safety
The assessment of safety was based on the incidence of AEs, SAEs, AEs leading to discontinuation, and AEs leading to dose modification. AEs were reported at each study visit for a minimum of 100 days after the last dose according to the National Cancer Institute’s Common Terminology Criteria for Adverse Events, version 4.0. Due to the longer period of follow-up at the June 24, 2021, data cut-off compared with the March 30, 2020, data cut-off, safety analyses presented in this report are based on the June 24, 2021, cut-off.
Table 7: Summary of Outcome Measures and Their Measurement Properties
Outcome measure | Type | Conclusions about measurement properties | MID |
|---|---|---|---|
FSKI-19 | FKSI-19 is an instrument designed specifically for assessing kidney cancer. It consists of 4 subscales: DRS-P, DRS-E, TSE, and FWB. Responses to the questionnaire are provided on a 5-level Likert scale, ranging from “not at all” to “very much,” with scores assigned as either 0 to 4 (for 5 items) or reverse-scored as 4 to 0 (for 14 items). These scores are then combined to generate a total score that falls within the range of 0 to 76 points. A higher score indicates fewer symptoms, with a score of 0 indicating a patient experiencing severe symptoms and the highest possible score indicating a completely asymptomatic patient.26 | Validity: To assess convergent validity, the FKSI-19 total and subscale scores were correlated with the FACT-G total and subscale scores using Spearman correlations. Criterion validity was examined by analyzing the relationship between ECOG PS and FKSI-19 scores through 1-way analyses of variance. The internal consistency reliability of FKSI-19 was found to be good (alpha = 0.83), with the DRS and FWB subscales demonstrating adequate reliability (alpha = 0.76 and alpha = 0.78, respectively). However, the TSE subscale displayed lower internal consistency reliability (alpha = 0.59).26 Reliability: The Cronbach alpha was used to assess the internal consistency reliability of the FKSI-19 total and subscale scores. The full instrument, as well as the DRS and FWB subscales, showed good internal consistency reliability (alpha = 0.83, alpha = 0.76, and alpha = 0.78, respectively), while the TSE subscale exhibited lower reliability (alpha = 0.59).26 Another study reported good Cronbach alpha values for FKSI-19 (alpha = 0.86).27 Responsiveness: This has not been identified. | Meaningful improvement in HRQoL corresponds to a minimum change of 3 points from the baseline in the FKSI-19 total score.11 |
EQ-5D-3L | EQ-5D-5L is a generic, utility-based measure of HRQoL, comprising a descriptive system and the EQ VAS. Only the EQ VAS was assessed in the trial. The EQ VAS is a vertical visual analogue scale that takes values between 100 (best imaginable health) and 0 (worst imaginable health); patients provide a global assessment of their health on this scale.28 | While the EQ-5D-5L questionnaire and its EQ VAS have demonstrated acceptable validity and reliability in the general population, they have not undergone assessment for validity, reliability, and responsiveness in patients with RCC. | The MID for the EQ VAS in patients with all types of cancer was a decrease of 7 or more points.12 No MID was identified in patients with RCC specifically. |
DRS = Disease Related Symptoms; DRS-E = Disease-Related Symptoms-Emotional; DRS-P = Disease-Related Symptoms-Physical; ECOG PS = Eastern Cooperative Oncology Group Performance Status; EQ VAS = EQ visual analogue scale; EQ-5D-3L = 5-Level EQ-5D; FACT-G = Functional Assessment of Cancer Therapy–General; FKSI-19 = 19-item Functional Assessment of Cancer Therapy–Kidney Symptom Index; FWB = Function/Well-Being; HRQoL = health-related quality of life; MID = minimal important difference; RCC = renal cell carcinoma; TSE = Treatment Side Effects.
Statistical Analysis
It was estimated that 638 patients would undergo randomization. The overall alpha for this trial was 0.05 (2-sided) for the primary outcome of PFS, with at least 95% power, and secondary outcomes of OS (80% power), followed by ORR, using a hierarchical testing procedure.
Sample Size and Power Calculation
The sample size calculation was based on the primary outcome of PFS in all randomized participants. Using a 25% screen failure rate, it was expected that approximately 850 participants would need to be enrolled to randomize 638 participants (319 per group) in a 1:1 ratio and stratified according to an IMDC prognostic risk score (favourable risk, intermediate risk, or poor risk), tumour PD-L1 expression (≥ 1% or < 1% or indeterminate), and region (the US, Europe, or the rest of the world). To represent the normal frequency of patients categorized as favourable risk, enrolment was capped at 25% (i.e., 106 per group). The rest of the enrolled patients would fall under the intermediate-risk or poor-risk group (239 patients per group).
The PFS analysis was planned at a minimum follow-up of 9 months to 10 months on all randomized patients; approximately 350 events from both treatment groups were expected. The 350 PFS events were estimated to provide 95% power to detect a PFS HR of 0.68 and a critical HR of 0.811 with a type I error of 0.05 (2-sided) for the final analysis. The HR of 0.68 corresponded to a 47% increase in the median PFS, assuming a median PFS of 18.2 months for cabozantinib plus nivolumab and 12.4 months for sunitinib. It was projected that an observed HR of 0.811 or less, which corresponds to a 2.89-month or greater improvement in median PFS (12.4 months versus 15.3 months), would result in a statistically significant improvement in PFS.
For the secondary outcome of OS, approximately 254 events in both treatment groups provided 80% power to detect an HR of 0.70 with an overall type I error of 0.05 (2-sided). The HR of 0.70 corresponds to a 43% increase in the median OS, assuming a median OS of 47.1 months for cabozantinib plus nivolumab and 33 months for sunitinib. Two formal interim analyses of OS were planned for this study. The first interim analysis was planned to take place at the time of the final PFS analysis, and it was expected to observe 165 OS events (65% of the targeted OS events for final analysis) and the second interim analysis was planned to occur after observing approximately 211 events (83% of the targeted OS events needed for final analysis). The stopping boundaries at the interim and final analyses were derived based on the number of deaths using the O’Brien-Fleming spending function.
At the time of the first data cut-off date (March 30, 2020), 335 patients had disease progression or had died; 166 deaths had occurred.
Statistical Testing
The overall alpha for the CheckMate 9ER trial was 2-sided 0.05. The primary definition of PFS adjusting for subsequent anticancer therapy was used in the analysis. PFS and OS were compared between treatment groups with the use of a stratified log-rank test, and the estimate of the HR between treatment groups was calculated by a stratified Cox proportional hazards model that used the IMDC prognostic risk score, tumour PD-L1 expression, and region as stratification factors. Ties was handled using the exact method, and a 2-sided 95% CI for the HR was presented. PFS and OS were estimated using Kaplan-Meier methods. Estimates of the percentage of patients with an objective response, along with the 2-sided 95% CI, were computed according to the Clopper-Pearson method. Change from baseline in HRQoL outcomes was assessed descriptively, and nominal P values were based on a linear regression model for repeated measures that controlled for treatment group, time point, baseline patient-reported outcomes score, and the stratification factors (IMDC prognostic risk score, tumour PD-L1 expression, and geographic region). Descriptive statistics of safety were presented using Common Terminology Criteria for Adverse Events, version 4.0.
For assessing the secondary outcomes, a hierarchical testing procedure was used to preserve the overall type I error rate at 0.05. If the difference in PFS was significant, it was specified that the trial would continue until the between-group difference in OS was significant with an O’Brien-Fleming alpha spending function of 0.011 at the first interim analysis, 0.025 at the second interim analysis, and 0.041 at the final analysis, accounting for 2 formal interim analyses. If the difference in OS was significant, an analysis of ORR would be performed at an alpha level of 0.05 (single final analysis), according to a hierarchical testing procedure. For the exploratory outcomes FKSI-19 and EQ-5D-3L, the mean score and mean change from baseline for both total and subscale scores were analyzed. The exploratory outcomes were not controlled for multiplicity.
Subgroup Analysis
The forest plots of the unstratified HRs for PFS and OS and a forest plot of unweighted differences in the percentage of patients with an ORR were reported for the prespecified subgroup of interest, the IMDC prognostic risk status (favourable, intermediate, or poor). This analysis was not adjusted for multiplicity.
Data Imputation Methods
For the primary outcome of PFS, if the elapsed time between the PFS event and the last assessment immediately before the event was 2 or more missed visits (more than 12 weeks to 10 days), the patient’s PFS was censored at their last tumour assessment before the PFS event.
Sensitivity Analyses
For the primary outcome of PFS, a stratified multivariate Cox regression model was used to estimate the treatment effect after adjustment for stratification factors used in the randomization and for the following covariates: age, gender, race, region, IMDC score, Karnofsky Performance Status, prior nephrectomy, lactate dehydrogenase level, baseline PD-L1 status, and number of organs with metastasis. Additional supportive analyses included PFS by a BICR versus assessment by an investigator and PFS by a BICR using the secondary PFS definition, which accounts for tumour scans after therapies versus the primary PFS definition.
Analysis Populations
The efficacy outcomes were analyzed based on the ITT population. The safety outcomes were analyzed using the as-treated population, defined as patients who received at least 1 dose of any study medication.
Results
Patient Disposition
A summary of patient disposition for the second interim analysis data cut-off date of June 24, 2021, is presented in Table 8. In total, 1,003 patients were screened, and 323 patients were randomized to cabozantinib plus nivolumab and 328 patients to sunitinib. Of the 302 (30%) patients who were screened out, 223 (22.2%) patients failed to meet study criteria, 26 (2.6%) patients withdrew consent, 13 (1.3%) patients died, 17 (1.7%) patients failed for reasons categorized as “other,” and 18 (1.8%) patients were not reported. In total, 701 patients were randomized, leaving 50 patients not accounted for in the randomization.
At the second interim analysis, 92 (29%) patients in the cabozantinib plus nivolumab group and 46 (14%) patients in the sunitinib group were still receiving treatment. The total number of patients who discontinued treatment with sunitinib (n = 274; 84%) was higher compared with cabozantinib plus nivolumab (n = 228; 71%). The most common reason for discontinuation in both groups was disease progression (cabozantinib plus nivolumab group = 57%; sunitinib group = 69%), followed by drug toxicity (cabozantinib plus nivolumab group = 14%; sunitinib group = 13%).
Table 8: Summary of Patient Disposition — CheckMate 9ER Study, Interim Analysis 2 Data Cut-off
Patient disposition | CheckMate 9ER study | |
|---|---|---|
Cabozantinib plus nivolumab | Sunitinib | |
Screened, N (%) | 1,003 (100) | |
Failed screening, N (%) | 302 (30.1) | |
Reason for screening failure, N (%) | ||
No longer met study criteria | 223 (22.2) | |
Withdrew consent | 26 (2.6) | |
Not reported | 18 (1.8) | |
Other | 17 (1.7) | |
Died | 13 (1.3) | |
Poor compliance or noncompliance | 2 (0.2) | |
Lost to follow-up | 2 (0.2) | |
Adverse event | 1 (0.1) | |
Randomized, N (%) | 323 (NR) | 328 (NR) |
Treated, N (%) | 320 (99.1) | 320 (97.6) |
Not treated, N (%) | 3 (0.9) | 8 (2.4) |
Ongoing in study at June 2021 data cut-off date, N (%) | 190 (58.8) | 161 (49.1) |
Treatment ongoing at June 2021 data cut-off date, N (%) | 92 (28.8) | 46 (14.4) |
Discontinued from study, N (%) | 228 (71.3) | 274 (85.6) |
Reason for discontinuation, N (%) | ||
Disease progression | 129 (40.3) | 188 (58.8) |
Study drug toxicity | 31 (9.7) | 35 (10.9) |
Adverse event unrelated to study drug | 24 (7.5) | 24 (7.58) |
Completed treatment per protocol | 14 (4.4) | 0 |
Requested to discontinue study treatment | 5 (1.6) | 7 (2.2) |
Withdrew consent | 5 (1.6) | 10 (3.1) |
Maximum clinical benefit | 2 (0.6) | 0 |
Died | 3 (0.9) | 3 (0.9) |
Other | 13 (4.1) | 5 (1.6) |
Not reported | 2 (0.6) | 2 (0.6) |
FAS, N | 323 | 328 |
Safety, N | 320 | 320 |
FAS = full analysis set.
Note: Details from the table have been taken from the sponsor’s Summary of Clinical Evidence.
Sources: CheckMate 9ER Clinical Study Report, March 2020 data cut-off,13 and CheckMate 9ER Clinical Study Report Addendum, June 2021 data cut-off.29
Baseline Characteristics
A summary of baseline patient demographics and disease characteristics of the ITT population are in Table 9. The characteristics outlined in the table are limited to those that were most relevant to this review, or were felt to impact the outcomes or interpretation of the study results. Overall, key baseline characteristics were generally balanced between treatment groups. The trial population was predominately white (82%) and male (71% to 77%), with an approximate mean age of 60 years. Most patients had a Karnofsky Performance Status score of 90 or 100 (74% to 80%), indicating good overall performance, and the majority of patients (approximately 57%) had an intermediate IMDC prognostic risk score. A similar proportion of patients in both groups had prior radiotherapy (14%) or nephrectomy (approximately 70%). In both groups, most patients (approximately 79%) had a tumour PD-L1 expression level lower than 1%.
Exposure to Study Treatments
The median duration of treatment observed by the second interim data cut-off date (June 24, 2021) with cabozantinib plus nivolumab was 21.8 months (interquartile range [IQR] = 8.8 months to 29.5 months) and 8.9 months with sunitinib (IQR = 2.9 months to 20.7 months). In the cabozantinib plus nivolumab group, the median duration of treatment was 18.8 months with cabozantinib and 16.6 months with nivolumab. The median number of doses of cabozantinib and nivolumab received was 451.5 and 35.0, respectively. The median average daily dose of cabozantinib was 27.8 mg (IQR = 20.7 mg to 38.6 mg) and with sunitinib was 27.5 mg (IQR = 22.5 mg to 32.1 mg) during the 6-week cycle.
Table 9: Summary of Key Baseline Characteristics — CheckMate 9ER Study
Characteristic | CheckMate 9ER study | |
|---|---|---|
Cabozantinib plus nivolumab (N = 323) | Sunitinib (N = 328) | |
Age in years, mean (SD) | 61.4 (10.2) | 60.4 (10.6) |
Female, n (%) | 74 (22.90) | 96 (29.30) |
Male, n (%) | 249 (77.10) | 232 (70.70) |
Race, n (%) | ||
White | 267 (82.7) | 266 (81.1) |
Black or African American | 1 (0.3) | 4 (1.2) |
Asian | 26 (8.0) | 25 (7.6) |
American Indian or Alaska Native | 3 (0.9) | 2 (0.6) |
Other | 26 (8.0) | 30 (9.1) |
Karnofsky Performance Status score 90 or 100, n (%) | 257 (79.60) | 241 (73.40) |
Karnofsky Performance Status score 70 or 80, n (%) | 66 (20.40) | 85 (25.90) |
IMDC prognostic risk score favourable, n (%) | 74 (22.90) | 73 (22.30) |
IMDC prognostic risk score intermediate, n (%) | 189 (58.5) | 186 (56.37) |
IMDC prognostic risk score poor, n (%) | 60 (18.60) | 68 (20.70) |
Previous radiotherapy, n (%) | 46 (14.20) | 45 (13.70) |
Previous nephrectomy, n (%) | 222 (68.70) | 233 (71.00) |
Tumour PD-L1 expression ≥ 1%, n (%) | 81 (25.1) | 81 (24.7) |
Tumour PD-L1 expression < 1%, n (%) | 232 (71.8) | 240 (73.2) |
IMDC = International mRCC [Metastatic Renal Cell Carcinoma] Database Consortium; SD = standard deviation.
Note: Details from the table have been taken from the sponsor’s Summary of Clinical Evidence.
Source: CheckMate 9ER Clinical Study Report.13
Dose delays occurred in 270 of 320 (84%) patients treated with cabozantinib, 238 of 320 (74%) patients treated with nivolumab, and 239 of 320 (75%) patients treated with sunitinib. The most common reason for dose delay in each case was the management of AEs. Dose reductions occurred in 196 (61%) patients treated with cabozantinib and in 172 (54%) patients treated with sunitinib. The most common reason for dose reduction for cabozantinib or sunitinib was the management of AEs. The median time to first dose–level reduction due to AEs was 108.5 days (IQR = 64.5 days to 206.0 days) with cabozantinib and 61.0 days (IQR = 42.0 days to 168.0 days) with sunitinib. Most patients (98.1%) received at least 1 concomitant medication during the trial and this rate was comparable between groups.
Subsequent Treatment
The use of post-treatment anticancer medications was permitted at the survival follow-up phase after study treatment had been discontinued in patients. The proportion of patients receiving subsequent anticancer medications was higher in the sunitinib group (42%) compared with the cabozantinib plus nivolumab group (32%). The most common anticancer medications were VEGF receptor inhibitors (19%) in the cabozantinib plus nivolumab group and PD-1 or PD-L1 inhibitor-based therapy (28%) or nivolumab (26%) in the sunitinib group.
Table 10: Summary of Subsequent Treatment — Second Interim Analysis Second Data Cut-Off
Exposure, N (%) | CheckMate 9ER study | |
|---|---|---|
Cabozantinib plus nivolumab (N = 323) | Sunitinib (N = 328) | |
Any subsequent therapy | 104 (32.0) | 139 (42.4) |
Any subsequent systemic therapy | 70 (21.7) | 122 (37.2) |
Any PD-L1 inhibitor | 16 (5.0) | 92 (28.0) |
Nivolumab | 14 (4.3) | 84 (25.6) |
Pembrolizumab | 4 (1.2) | 6 (1.80) |
Atezolizumab | 0 (0) | 1 (< 1) |
Durvalumab | 0 (0) | 4 (1.0) |
Any CTLA-4 inhibitor | 7 (2.2) | 20 (6.1) |
Ipilimumab | 7 (2.2) | 19 (5.8) |
Tremelimumab | 0 (0) | 1 (< 1) |
Any VEGF or VEGFR inhibitor | 61 (18.9) | 58 (17.7) |
Nivolumab plus ipilimumab combination | NR | NR |
Axitinib | 25 (7.7) | 18 (5.5) |
Sunitinib | 21 (6.5) | 7 (2.1) |
Pazopanib | 10 (3.1) | 7 (2.1) |
Lenvatinib | 8 (2.5) | 3 (< 1) |
Cabozantinib | 5 (1.5) | 28 (8.5) |
Sorafenib | 2 (< 1) | 6 (1.8) |
Sorafenib tosylate | 1 (< 1) | 0 (0) |
Tivozanib | 1 (< 1) | 0 (0) |
Other | 14 (4.3) | 14 (4.3) |
Everolimus | 8 (2.5) | 6 (1.8) |
Investigational antineoplastic drugs | 3 (< 1) | 3 (< 1) |
BMS-986179 | 1 (< 1) | 0 (0) |
Gimeracil/oteracil potassium/tegafur | 1 (< 1) | 0 (0) |
Talazoparib | 1 (< 1) | 0 (0) |
Investigational drug | 0 (0) | 1 (< 1) |
Monoclonal antibodies | 0 (0) | 1 (< 1) |
Savolitinib | 0 (0) | 2 (< 1) |
Temsirolimus | 0 (0) | 1 (< 1) |
NR = not reported; VEGF = vascular endothelial growth factor; VEGFR = vascular endothelial growth factor receptor.
Source: CheckMate 9ER Clinical Study Report Addendum, June 24, 2021, data cut-off.29
Efficacy
Only those efficacy outcomes and analyses of subgroups identified as important to this review are reported. The main findings presented are from interim analysis 1 (with a March 30, 2020, data cut-off date), with interim analysis 2 (with a June 24, 2021, data cut-off date) presented as supportive evidence.
PFS by BICR
Table 11 provides a summary of PFS by BICR findings. In total, 335 events had occurred in both groups by the March 30, 2020, data cut-off date. At a median follow-up for OS of 18.1 months (range = 10.6 months to 30.6 months), the median PFS was 16.6 months (95% CI, 12.5 months to 24.9 months) with cabozantinib plus nivolumab and 8.3 months (95% CI, 7.0 months to 9.7 months) with sunitinib (log-rank test P < 0.001), with a between-group HR of 0.51 (95% CI, 0.41 to 0.64). The probability of PFS at 9 months for the cabozantinib plus nivolumab group was 68.3% (95% CI, 62.6% to 73.2%) and for the sunitinib group was 47.8% (95% CI, 41.7% to 53.6%). Findings at the extended follow-up (interim analysis 2 data cut-off date of June 24, 2021) were consistent with those of interim analysis 1 (Table 11). The results of sensitivity analyses were consistent with those of the primary analysis.
Table 11: Progression-Free Survival at Interim Analysis 1 and Interim Analysis 2 — ITT Population
Progression-free survival per BICR: Primary definition | CheckMate 9ER study | |
|---|---|---|
Cabozantinib plus nivolumab (N = 323) | Sunitinib (N = 328) | |
March 30, 2020, data cut-off | ||
Patients with events, n (%) | ||
Total | 144 (44.6) | 191 (58.2) |
Progressive disease | 121 (37.5) | 151 (46.0) |
Death | 23 (7.1) | 40 (12.2) |
Patients censored, n (%) | 179 (55.4) | 137 (41.8) |
No baseline tumour assessment | 2 (0.6) | 6 (1.8) |
No postbaseline tumour and no death | 5 (1.5) | 13 (4.0) |
Received subsequent anticancer therapy | 23 (7.1) | 43 (13.1) |
Still on treatment | 133 (41.2) | 61 (18.6) |
In follow-up period | 13 (4.0) | 10 (3.0) |
Discontinued study | 3 (0.9) | 4 (1.2) |
Progression-free survival (months) | ||
Median (95% CI)a | 16.59 (12.45 to 24.94) | 8.31 (6.97 to 9.69) |
Hazard ratio (95% CI)b | 0.51 (0.41 to 0.64) | |
Log-rank test P value | P < 0.0001c,d | |
Progression-free survival rate (%) (95% CI) | ||
At 6 monthsa | 80.3 (75.4 to 84.3) | 60.1 (54.1 to 65.5) |
At 9 monthsa | 68.3 (62.6 to 73.2) | 47.8 (41.7 to 53.6) |
Extended follow-up: June 24, 2021, data cut-off | ||
Patients with events, n (%) | ||
Total | 207 (64.1) | 223 (67.1) |
Progressive disease | 173 (53.6) | 176 (53.7) |
Death | 34 (10.5) | 47 (14.3) |
Patients censored, n (%) | 116 (35.9) | 105 (32.0) |
Progression-free survival (months) | ||
Median (95% CI)a | 16.59 (12.78 to 19.84) | 8.31 (6.97 to 9.69) |
Hazard ratio (95% CI)b | 0.56 (0.46 to 0.68) | |
Log-rank test P value | NR | |
Progression-free survival rate, % (95% CI) | ||
At 12 monthsa | 58.1 (52.3 to 63.4) | 36.9 (31.2 to 42.7) |
At 24 monthsa | 39.5 (33.9 to 45.1) | 20.9 (16.0 to 26.3) |
BICR = blinded independent central review; CI = confidence interval; IMDC = International mRCC [Metastatic Renal Cell Carcinoma] Database Consortium; IRT = Interactive Response Technology; ITT = intention to treat; NR = not reported; ROW = rest of the world.
aBased on Kaplan-Meier estimates.
bStratified Cox proportional hazards model. The hazard ratio is cabozantinib plus nivolumab vs. sunitinib.
cLog-rank test stratified by IMDC prognostic risk score (0, 1 to 2, 3 to 6), PD-L1 tumour expression (≥ 1% vs. < 1% or indeterminate), and region (US, Canada, western Europe, northern Europe, or the ROW), as entered in the IRT.
dTwo-sided P values from stratified regular log-rank test.
Sources: CheckMate 9ER Clinical Study Report, March 2020 data cut-off,13 and CheckMate 9ER Clinical Study Report Addendum, June 2021 data cut-off.29
PFS Subgroup Analyses
The efficacy results were consistent across IMDC prognostic risk categories (favourable risk, intermediate risk, and poor risk). For the favourable-risk group, the median PFS was not reached for the cabozantinib plus nivolumab group and was 12.81 months for the sunitinib group, with an HR of 0.60 (95% CI, 0.37 to 0.98). For the intermediate-risk group, the median PFS was 17.71 months for the cabozantinib plus nivolumab group versus 8.38 months for the sunitinib group, with an HR of 0.54 (95% CI, 0.41 to 0.73). For the poor-risk group, the median PFS was 12.29 months for the cabozantinib plus nivolumab group versus 4.21 months for the sunitinib group, with an HR of 0.36 (95% CI, 0.23 to 0.58).
Overall Survival
Table 12 provides a summary of OS findings. By interim analysis 1 (with a March 30, 2020, data cut-off date), the median OS had not been reached in either group (log-rank test P = 0.001). An HR of 0.60 (98.89% CI, 0.40 to 0.89) was estimated, representing a 40% reduction in the risk of death with the cabozantinib plus nivolumab group compared with the sunitinib group at any particular time point. The median follow-up for OS was 18.1 months (range = 10.6 months to 30.6 months). OS rates at 9 months were higher in the cabozantinib plus nivolumab group compared with the sunitinib group: 89.9% (95% CI, 86.0% to 92.8%) versus 80.5% (95% CI, 75.7% to 84.4%). Findings at the extended follow-up (interim analysis 2 data cut-off date of June 24, 2021) were consistent with those of interim analysis 1 (Table 12).
Table 12: Overall Survival at Interim Analysis 1 and Interim Analysis 2 — ITT Population
Overall survival | CheckMate 9ER study | |
|---|---|---|
Cabozantinib plus nivolumab (N = 323) | Sunitinib (N = 328) | |
March 30, 2020, data cut-off | ||
Deaths, n (%) | 67 (20.7) | 99 (30.2) |
Patients censored, n (%) | 256 (79.3) | 229 (69.8) |
Still on treatment | 178 (55.1) | 92 (28.0) |
Not progressed | 148 (45.8) | 76 (23.2) |
Progressed (radiographic or clinical) | 30 (9.3) | 16 (4.9) |
In follow-up period | 64 (19.8) | 118 (36.0) |
Discontinued study | 14 (4.3) | 19 (5.8) |
Overall survival (months) | ||
Median (95% CI)a | Not reached | |
Hazard ratio (98.89% CI)b | 0.60 (0.40 to 0.89) | |
Log-rank test P value | P = 0.0010c,d,e | |
Overall survival rate, % (95% CI) | ||
At 6 monthsa | 93.1 (89.7 to 95.4) | 86.2 (81.9 to 89.5) |
At 9 monthsa | 89.9 (86.0 to 92.8) | 80.5 (75.7 to 84.4) |
Extended follow-up: June 24, 2021, data cut-off | ||
Deaths, n (%) | 121 (37.5) | 150 (45.7) |
Patients censored, n (%) | 202 (62.5) | 178 (54.3) |
Still on treatment | 92 (28.5) | 46 (14.0) |
Not progressed | 68 (21.1) | 37 (11.3) |
Progressed (radiographic or clinical) | 24 (7.4) | 9 (2.7) |
In follow-up period | 98 (30.3) | 115 (35.1) |
Discontinued study | 12 (3.7) | 17 (5.2) |
Overall survival (months) | ||
Median (95% CI)a | 37.68 (35.32 to not estimable) | 34.27 (29.04 to not estimable) |
Hazard ratio (95% CI)b | 0.70 (0.55 to 0.90) | |
Log-rank test P value | NR | |
Overall survival rate, % (95% CI) | ||
At 12 monthsa | 85.5 (81.2 to 89.0) | 75.3 (70.2 to 79.7) |
At 24 monthsa | 70.3 (64.9 to 75.0) | 60.3 (54.7 to 65.5) |
CI = confidence interval; IMDC = International mRCC [Metastatic Renal Cell Carcinoma] Database Consortium; IRT = Interactive Response Technology; NR = not reported; ROW = rest of the world.
aBased on Kaplan-Meier estimates.
bStratified Cox proportional hazards model. The hazard ratio is cabozantinib plus nivolumab vs. sunitinib.
cLog-rank test stratified by IMDC prognostic risk score (0, 1 to 2, 3 to 6), PD-L1 tumour expression (≥ 1% vs. < 1% or indeterminate), and region (US, Canada, western Europe, northern Europe, or the ROW), as entered in the IRT.
dTwo-sided P values from stratified regular log-rank test.
eThe boundary for statistical significance P value is less than 0.0111.
Sources: CheckMate 9ER Clinical Study Report, March 2020 data cut-off,13 and CheckMate 9ER Clinical Study Report Addendum, June 2021 data cut-off.29
ORR by BICRs
A summary of ORR for the first and second interim analyses is shown in Table 13. At the March 30, 2020, data cut-off date, the ORR in the cabozantinib plus nivolumab group was 55.7% (95% CI, 50.1% to 61.2%) and 27.1% (95% CI, 22.4% to 32.3%) with the sunitinib group, with a between-group difference of 28.6% (95% CI, 21.7% to 35.6%). The estimated OR between groups was 3.52 (95% CI, 2.51 to 4.95; P < 0.0001) in favour of the cabozantinib plus nivolumab group. Findings at the extended follow-up (interim analysis 2 data cut-off of June 24, 2021) were consistent with those of interim analysis 1 (Table 13).
Table 13: Objective Response Rate at Interim Analysis 1 and Interim Analysis 2 — ITT Population
Objective response rate | CheckMate 9ER study | |
|---|---|---|
Cabozantinib plus nivolumab (N = 323) | Sunitinib (N = 328) | |
March 30, 2020, data cut-off | ||
Objective response rate, n (%)a | 180 (55.7) | 89 (27.1) |
95% CI | 50.1 to 61.2 | 22.4 to 32.3 |
Difference, % (95% CI)b,c | 28.6 (21.7 to 35.6) | |
Odds ratio (95% CI)c,d | 3.52 (2.51 to 4.95) | |
P valuee | P < 0.0001 | |
Extended follow-up: June 24, 2021, data cut-off | ||
Objective response rate, n (%)a | 180 (55.7) | 93 (28.4) |
95% CI | 50.1 to 61.2 | 23.5 to 33.6 |
Difference, % (95% CI)b,c | 27.4 (20.4 to 34.4) | |
Odds ratio (95% CI)c,d | 3.29 (2.35 to 4.61) | |
P value | NR | |
CI = confidence interval; CMH = Cochran–Mantel–Haenszel IMDC = International mRCC [Metastatic Renal Cell Carcinoma] Database Consortium; IRT = Interactive Response Technology; ITT = intention to treat; NR = not reported; ROW = rest of the world.
aComplete response plus partial response, with the CI based on the Clopper-Pearson method.
bThe strata-adjusted difference in ORR ([cabozantinib + nivolumab] – sunitinib) was based on the DerSimonian and Laird method.
cStratified by IMDC prognostic risk score (0, 1 to 2, 3 to 6), PD-L1 tumour expression (≥ 1% vs. < 1% or indeterminate), and region (US, Canada, western Europe, northern Europe, or the ROW), as entered in the IRT.
dStrata-adjusted odds ratio (cabozantinib + nivolumab vs. sunitinib) using the Mantel-Haenszel method.
eTwo-sided P value from a stratified CMH test.
Sources: CheckMate 9ER Clinical Study Report, March 2020 data cut-off,13 and CheckMate 9ER Clinical Study Report Addendum, June 2021 data cut-off.29
Health-Related Quality of Life
The exploratory HRQoL outcomes FKSI-19 total score and DRS score and the score for the EQ-5D-3L’s EQ VAS were assessed at the first interim analysis (March 30, 2020, data cut-off) and were not controlled for multiplicity. For FKSI-19, 93.4% of patients in the cabozantinib plus nivolumab group and 97.2% of patients in the sunitinib group had a baseline assessment. Completion rates were greater than or equal to 80% in both groups at all subsequent on-treatment assessments, through week 105 for the cabozantinib plus nivolumab group and week 97 for the sunitinib group. The mean baseline FKSI-19 total scores were 58.7 (standard deviation [SD] = 10.6) and 58.4 (SD = 9.92) in the cabozantinib plus nivolumab and sunitinib groups, respectively. Mean changes from baseline through week 91 were generally stable for the cabozantinib plus nivolumab group, whereas patients in the sunitinib group had a trend toward decreased scores, and at times were in excess of the MID of 3 points (Figure 2). In addition, the DRS score improved from baseline in patients in the cabozantinib plus nivolumab group, whereas patients in the sunitinib group had a decline from baseline after week 7 through week 91.
For the EQ VAS, 94.1% of patients in the cabozantinib plus nivolumab group and 97.5% of patients in the sunitinib group had a baseline assessment. Completion rates were greater than or equal to 80% in both treatment groups at all subsequent on-treatment assessments, through week 105 for the cabozantinib plus nivolumab group and week 97 for the sunitinib group, with the exception of the cabozantinib plus nivolumab group at week 93 (76.6%). The mean baseline EQ VAS scores were 74.2 (SD = 22.2) and 75.7 (SD = 20.9) in the cabozantinib plus nivolumab and sunitinib groups, respectively. Patients in the cabozantinib plus nivolumab group had a trend toward improvement, while sunitinib patients remained relatively stable with a trend toward decline through week 91 (Figure 3). The mean changes from baseline in both groups did not meet the MID of 7 through week 91.
For both scales, the authors noted that the nominal timing of the assessments for the sunitinib group meant they were performed at the end of the off-treatment period, thereby potentially minimizing the impact of treatment-related tolerability issues.
Harms
Harms data reported in this section are from the second interim analysis data cut-off date of June 24, 2021. The key harms results for the safety (i.e., the as-treated) population are summarized in Table 14.
Adverse Events
Almost all patients in the study reported at least 1 TEAE (99.7% of patients in the cabozantinib plus nivolumab group and 99.10% of patients in the sunitinib group). The most common TEAEs in both treatment groups were diarrhea (65.3% in the cabozantinib plus nivolumab group versus 50% in the sunitinib group), palmar-plantar erythrodysesthesia syndrome (40.3% versus 41.9%), hypertension (38.4% versus 37.5%), hypothyroidism (36.9% versus 31.6%), and fatigue (33.8% versus 35.6%).
Serious Adverse Events
At least 1 treatment-emergent SAE was reported in 53.1% of patients in the cabozantinib plus nivolumab group and in 42.2% of patients in the sunitinib group, with the most common SAE in both groups being malignant neoplasm progression (4.7% of patients in the cabozantinib plus nivolumab group and 4.4% of patients in the sunitinib group).
Withdrawal Due to Adverse Events
Study treatment discontinuation due to a TEAE was reported in 37.2% of patients in the cabozantinib plus nivolumab group and 20.9% of patients in the sunitinib group. The most common TEAEs that led to treatment discontinuation in the cabozantinib plus nivolumab group were diarrhea (2.8%), pneumonitis (2.8%), and proteinuria (2.2%). The most common TEAEs that led to treatment discontinuation in the sunitinib group were malignant neoplasm progression (2.5%) and proteinuria (2.2%).
Figure 2: Mean Changes in FKSI-19 Scores From Baseline to Week 91 at Interim Analysis 1 — All Treated Patients
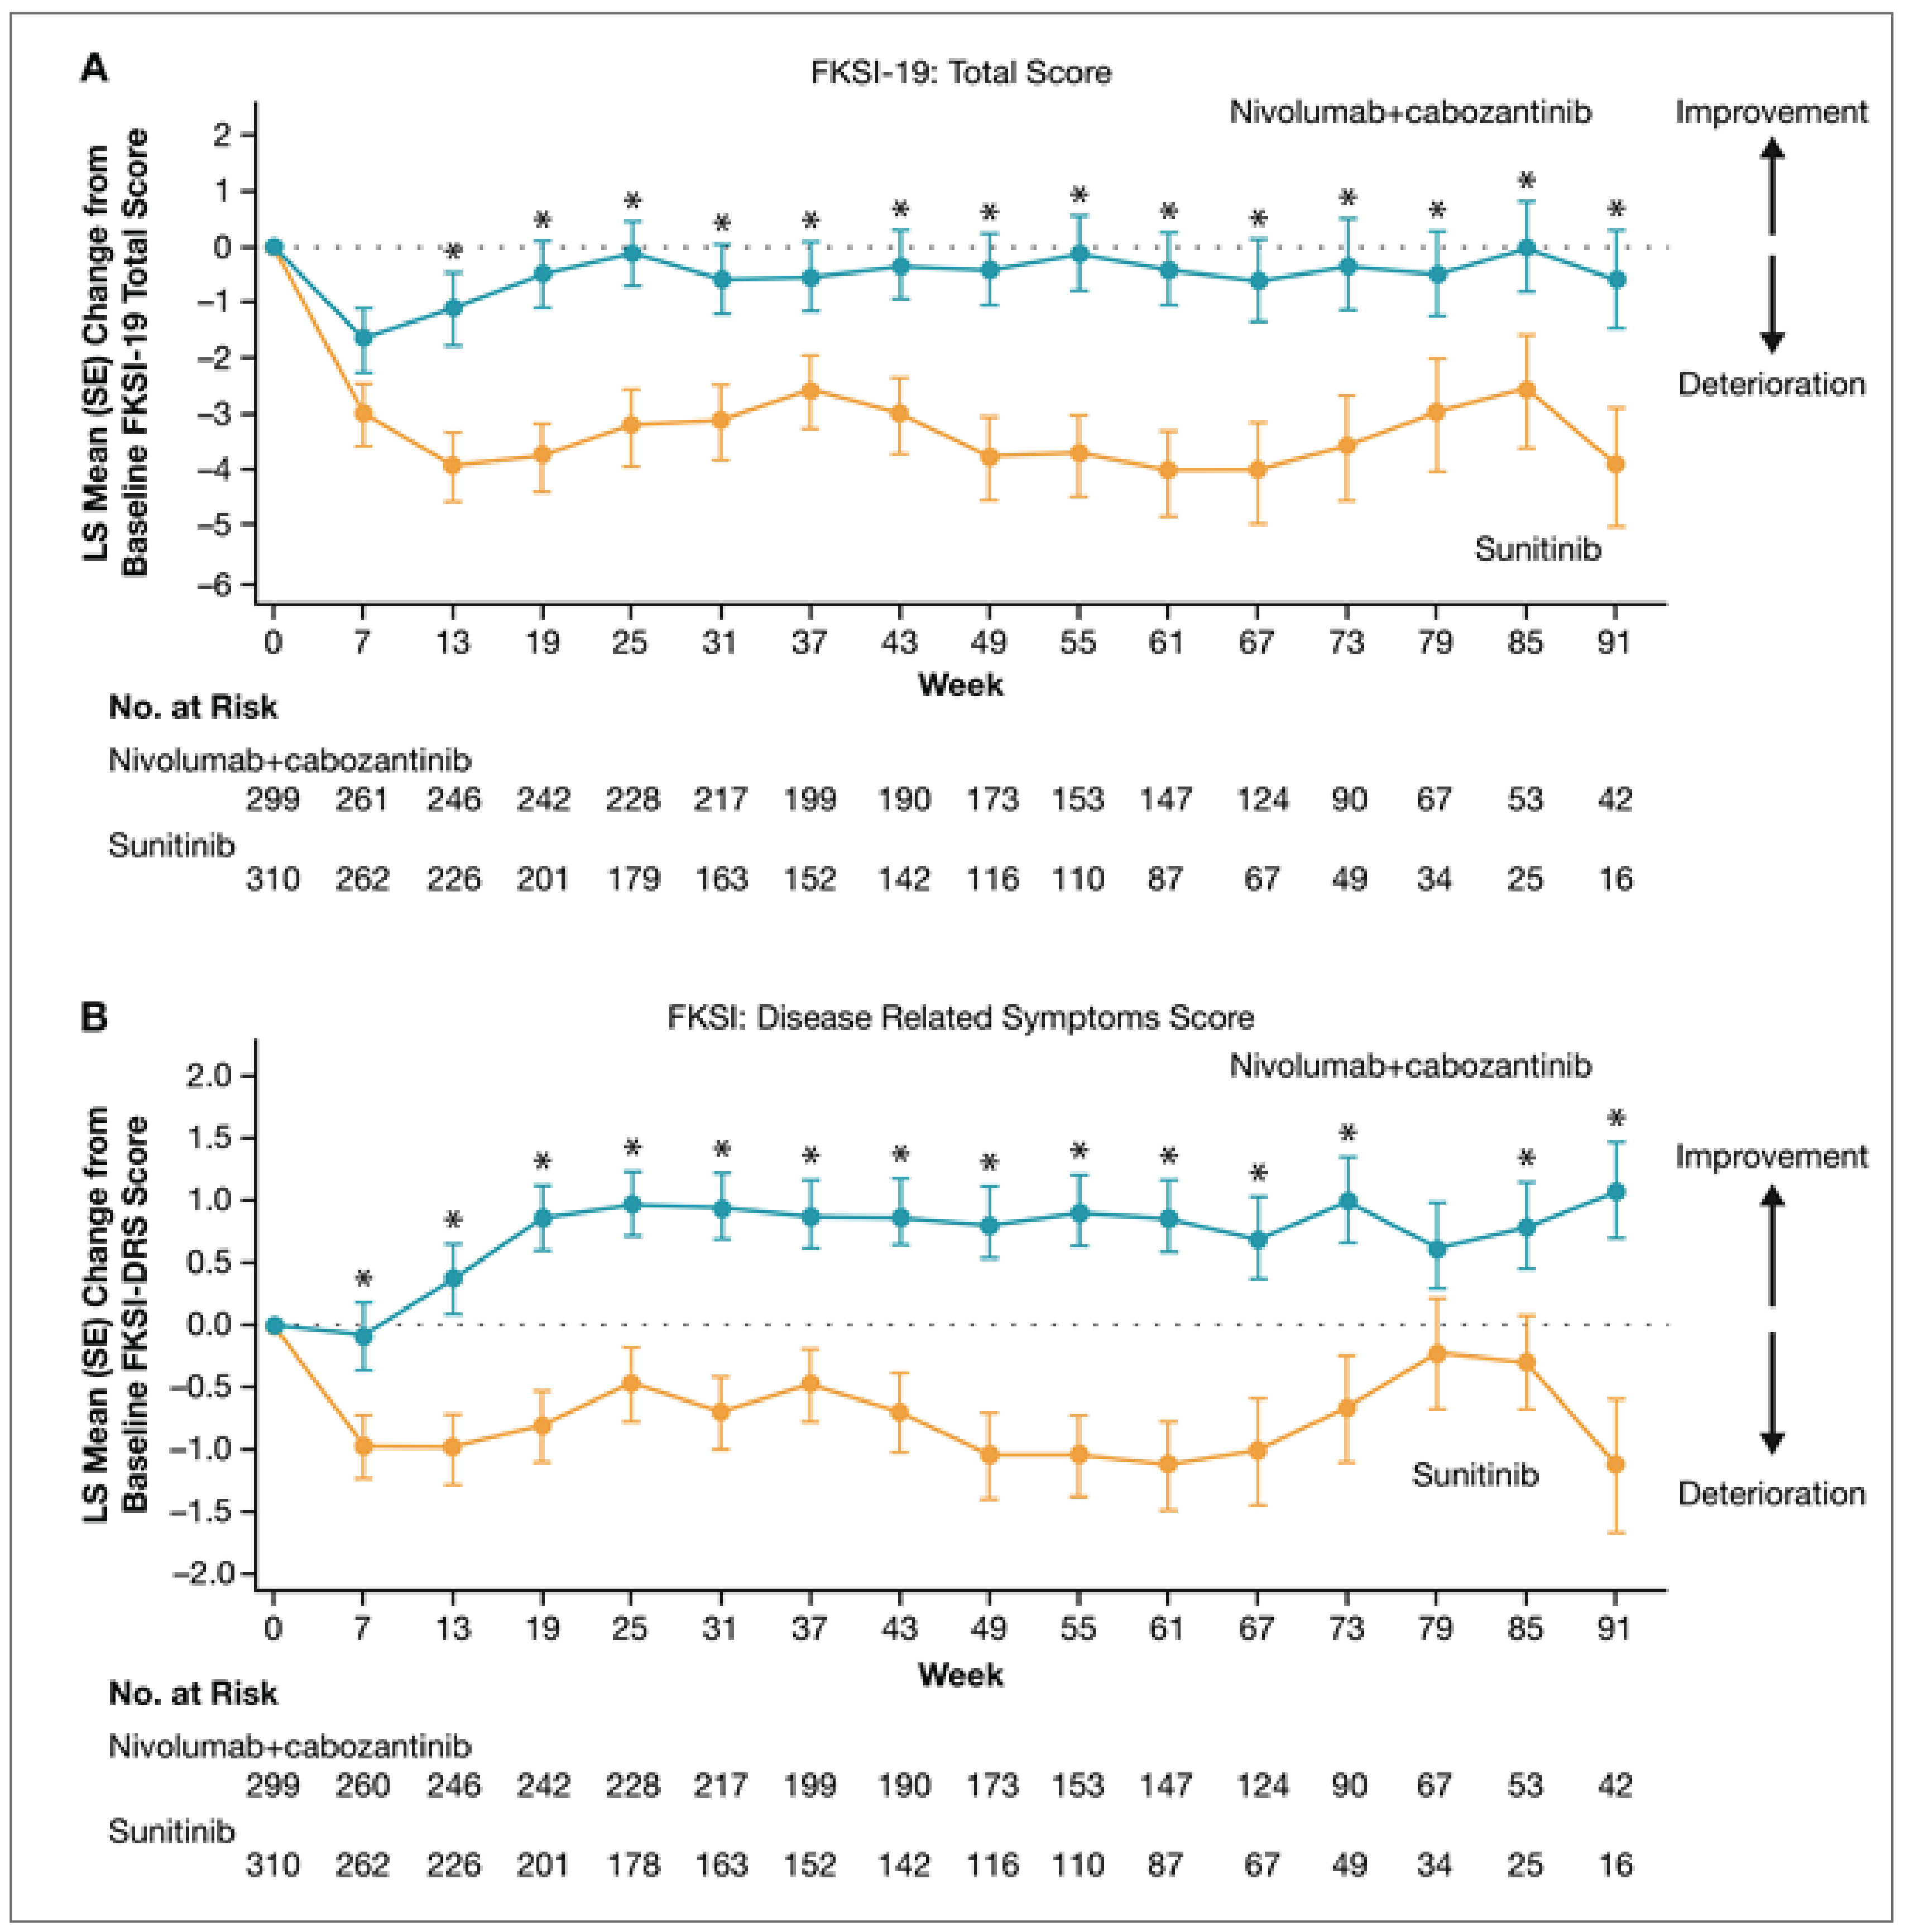
FKSI = Functional Assessment of Cancer Therapy–Kidney Symptom Index; FKSI-19 = 19-item Functional Assessment of Cancer Therapy–Kidney Symptom Index; FKSI-DRS = Functional Assessment of Cancer Therapy Kidney Cancer Symptom Index - Disease Related Symptoms; LS = least squares; no. = number; SE = standard error.
* Represents a time point where the between-group difference was statistically significant (P < 0.05).
Source: From the New England Journal of Medicine, Choueiri TK et al., nivolumab plus cabozantinib versus sunitinib for advanced renal-cell carcinoma, 384, 829 to 41. Copyright © (2021) Massachusetts Medical Society. Reprinted with permission from the Massachusetts Medical Society.
Figure 3: Mean Changes in EQ-5D-3L’s EQ VAS Scores From Baseline to Week 91 at Interim Analysis 1 — All Treated Patients
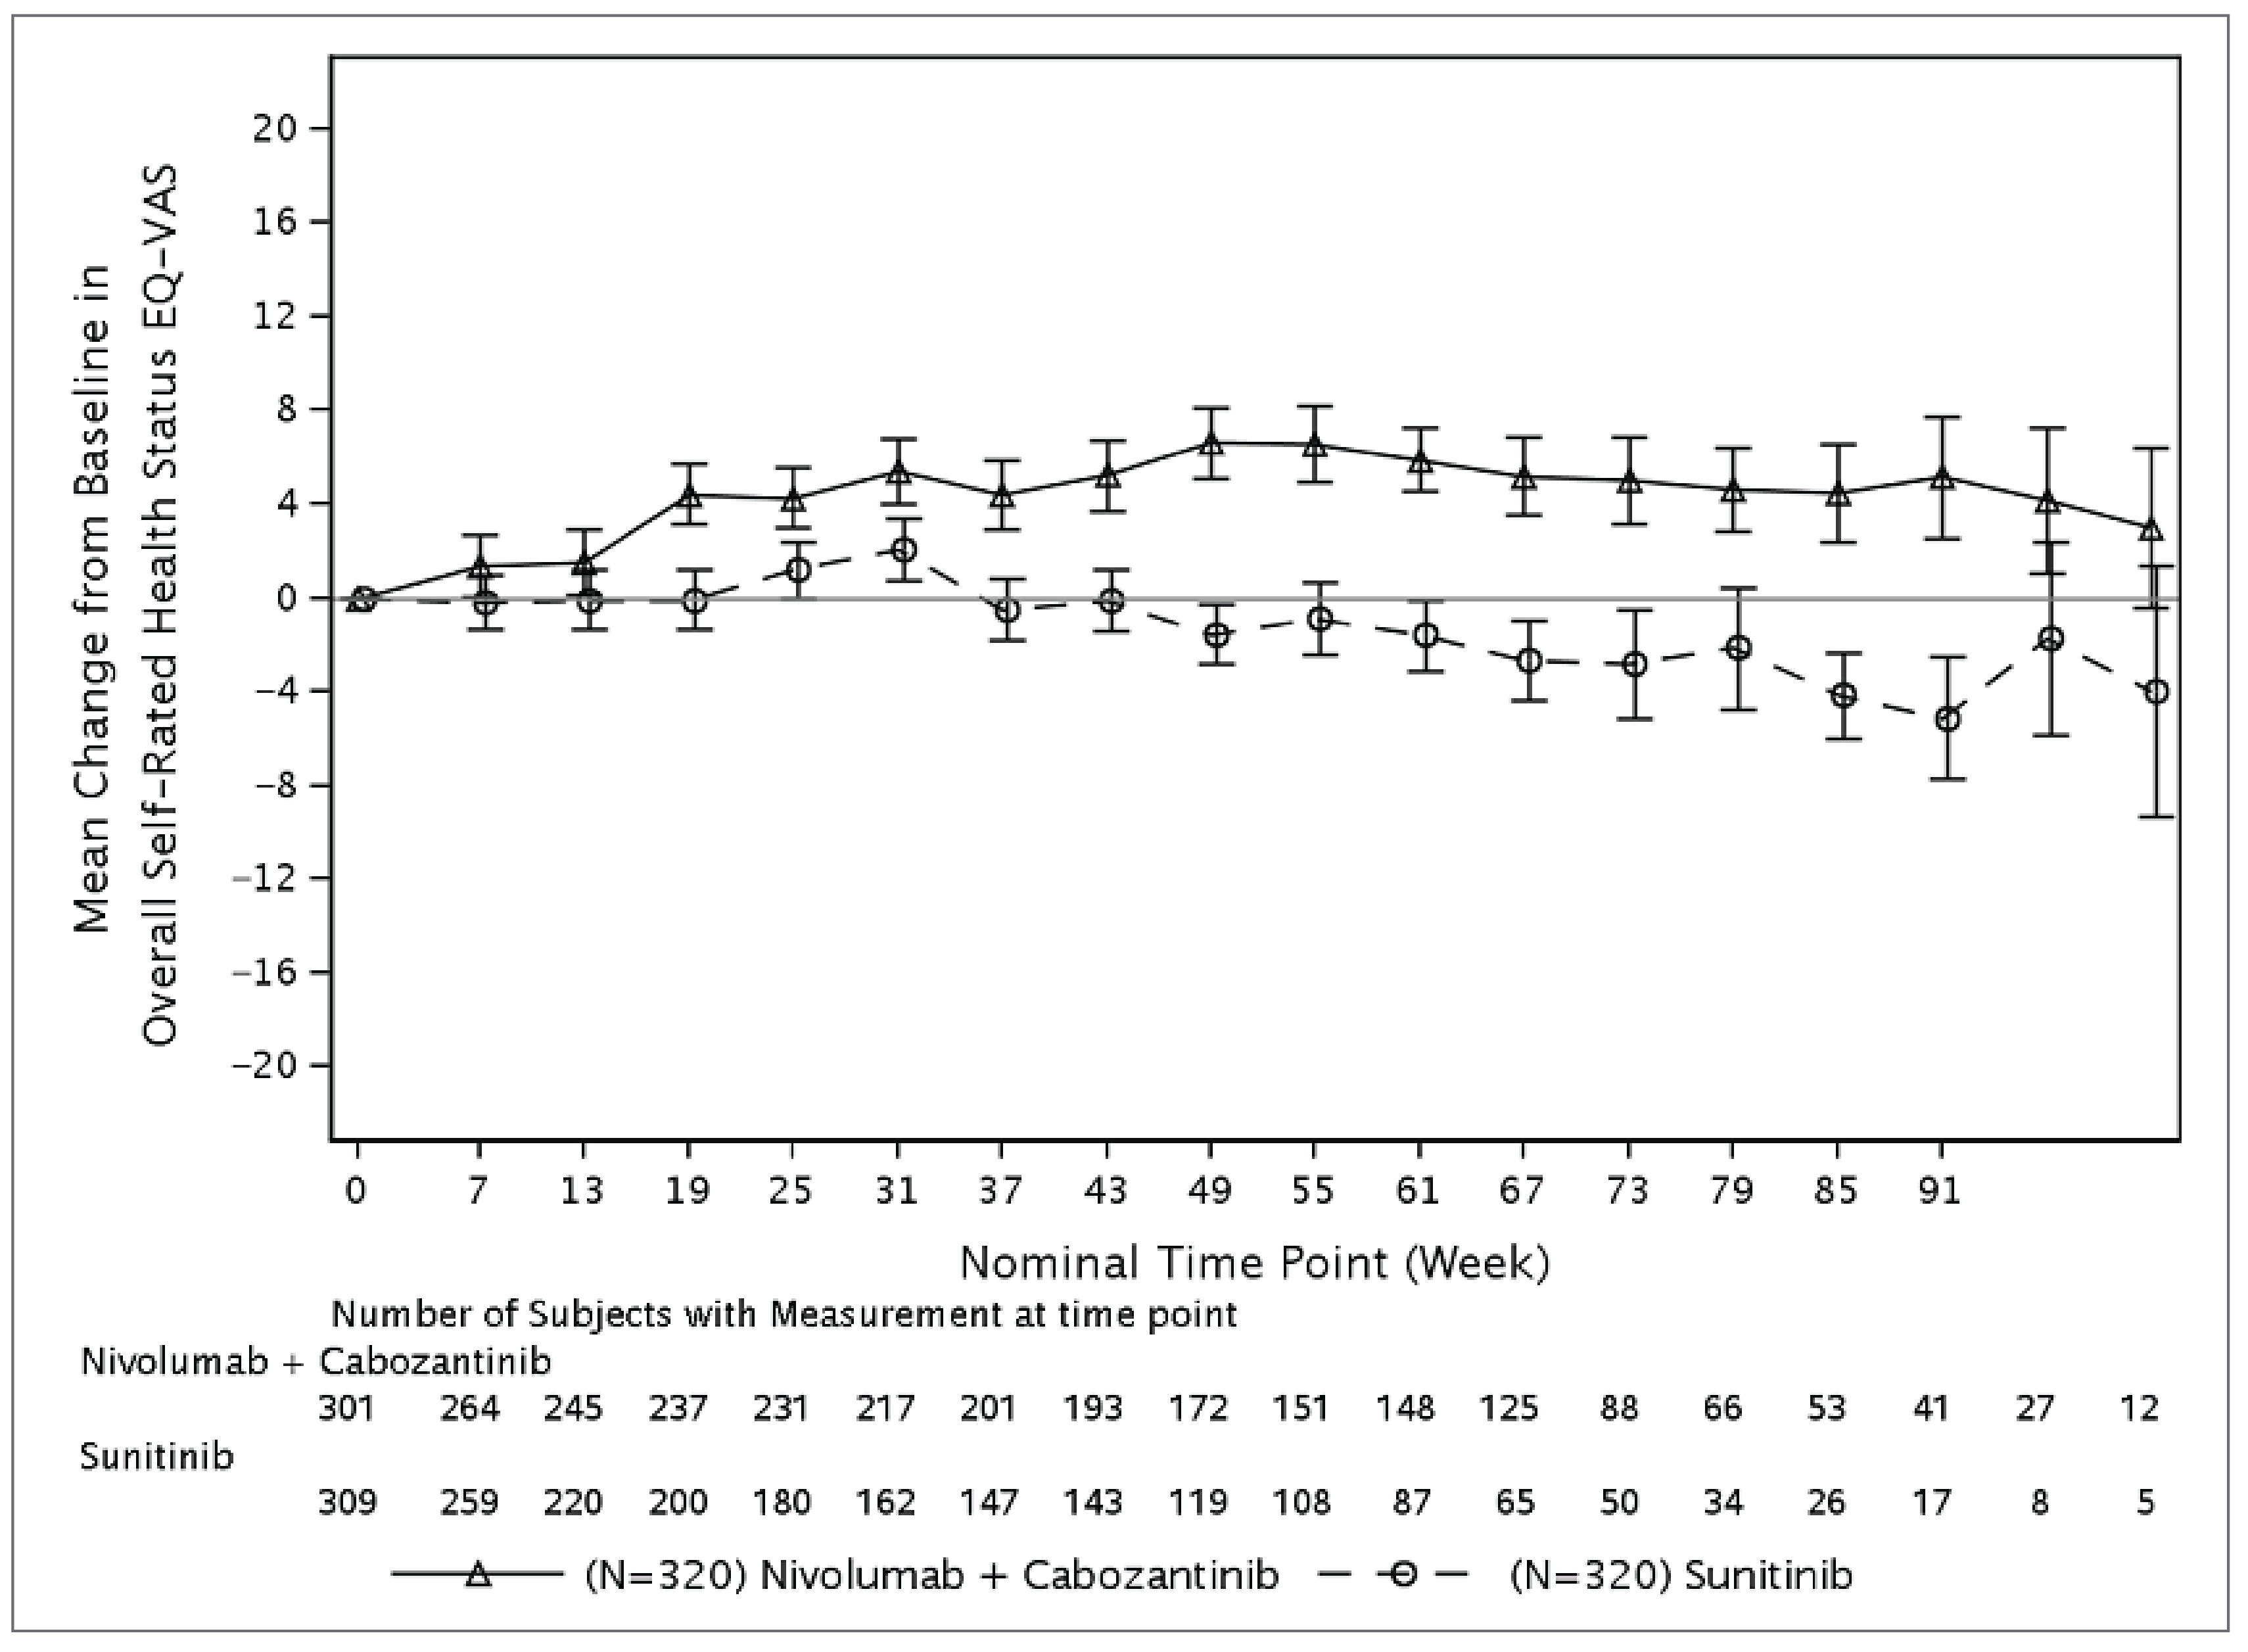
EQ-VAS = EQ visual analogue scale.
Note: Error bars represent standard error of the mean.
Source: CheckMate 9ER Clinical Study Report.13
Table 14: Summary of Harms at Interim Analysis 2 — Safety Population
Harms | Cabozantinib plus nivolumab (N = 320) | Sunitinib (N = 320) |
|---|---|---|
Most common TEAEs,a n (%) | ||
≥ 1 adverse event | 319 (99.7) | 317 (99.1) |
Diarrhea | 209 (65.3) | 160 (50) |
Palmar-plantar erythrodysesthesia | 129 (40.3) | 134 (41.9) |
Hypertension | 123 (38.4) | 120 (37.5) |
Hypothyroidism | 118 (36.9) | 101 (31.6) |
Fatigue | 108 (33.8) | 114 (35.6) |
ALT, increased | 102 (31.9) | 29 (9.1) |
Decreased appetite | 100 (31.3) | 66 (20.6) |
Nausea | 95 (29.7) | 104 (32.5) |
AST, increased | 93 (29.1) | 42 (13.1) |
Rash | 76 (23.8) | 71 (22.2) |
Asthenia | 75 (23.4) | 60 (18.8) |
Arthralgia | 72 (22.5) | 44 (13.8) |
Back pain | 71 (22.2) | 42 (13.1) |
Mucosal inflammation | 70 (21.9) | 84 (26.3) |
Pruritus | 69 (21.6) | 15 (4.7) |
Vomiting | 63 (19.7) | 66 (20.6) |
Cough | 61 (19.1) | 57 (17.8) |
Stomatitis | 60 (18.8) | 83 (25.9) |
Lipase, increased | 59 (18.4) | 42 (13.1) |
Abdominal pain | 59 (18.4) | 29 (9.1) |
Anemia | 58 (18.1) | 86 (26.9) |
Dysphonia | 58 (18.1) | 12 (3.8) |
Blood creatinine, increased | 55 (17.2) | 51 (15.9) |
Hyponatremia | 54 (16.9) | 30 (9.4) |
Headache | 54 (16.9) | 38 (11.9) |
Amylase, increased | 53 (16.6) | 33 (10.3) |
Constipation | 52 (16.3) | 43 (13.4) |
Hypomagnesemia | 49 (15.3) | 17 (5.3) |
Pyrexia | 48 (15) | 30 (9.4) |
SAEs,b n (%) | ||
Patients with ≥ 1 SAE | 170 (53.1) | 135 (42.2) |
Malignant neoplasm progression | 15 (4.7) | 14 (4.4) |
Diarrhea | 15 (4.7) | 0 |
Pneumonitis | 10 (3.1) | 0 |
Pulmonary embolism | 10 (3.1) | 3 (0.9) |
Hyponatremia | 8 (2.5) | 4 (1.3) |
Pyrexia | 7 (2.2) | 5 (1.6) |
Patients who stopped treatment due to AEs, n (%) | ||
Patients who stopped treatment | 119 (37.2) | 67 (20.9) |
Nivolumab discontinued | 37 (11.6) | NA |
Cabozantinib discontinued | 41 (12.8) | NA |
Nivolumab and cabozantinib both discontinued at the same time due to the same AE | 41 (12.8) | NA |
Deaths, n (%) | ||
Deaths | 119 (37.2) | 147 (45.9) |
Notable harms, n (%) | ||
Thrombotic events | 43 (13.4) | 20 (6.3) |
Hypertension | 127 (39.7) | 126 (39.4) |
Fistulas | 4 (1.3) | 0 |
GI perforation | 4 (1.3) | 1 (0.3) |
Hemorrhage | 76 (23.8) | 72 (22.5) |
Hepatotoxicity | 31 (9.7) | 15 (4.7) |
RPLS | NR | NR |
Wound complications | 11 (3.4) | 4 (1.3) |
IMAE | ||
Hypothyroidism/thyroiditis | 90 (28.1) | 30 (9.4) |
Rash | 40 (12.5) | 3 (0.9) |
Hepatitis | 36 (11.3) | 7 (2.2) |
Hyperthyroidism | 31 (9.7) | 1 (0.3) |
Diarrhea/colitis | 20 (6.3) | 1 (0.3) |
Adrenal insufficiency | 14 (4.4) | 0 |
Pneumonitis | 13 (4.1) | 1 (0.3) |
Nephritis and renal dysfunction | 7 (2.2) | 3 (0.9) |
AE = adverse event; ALT = alanine aminotransferase; AST = aspartate aminotransferase; GI = gastrointestinal; IMAE = immune-mediated adverse event; NA = not applicable; NR = not reported; RPLS = reversible posterior leukoencephalopathy syndrome; SAE = serious adverse event; TEAE = treatment-emergent adverse event.
aFrequency of 15% or more in at least 1 group.
bFrequency of 2% or more in at least 1 group.
Source: CheckMate 9ER Clinical Study Report Addendum, June 2021 data cut-off.29
Mortality
Deaths were reported in 37.2% of patients in the cabozantinib plus nivolumab group, and in 45.9% of patients in the sunitinib group. The majority of deaths in both groups was attributed to disease progression (25% in the cabozantinib plus nivolumab group and 34.7% in the sunitinib group).
Notable Harms
Notable harms for CADTH’s review were selected based on serious warnings and precautions in the Health Canada product monograph for cabozantinib1 and in consultation with the clinical expert consulted by CADTH. Hemorrhage events occurred in 23.8% of patients treated with cabozantinib plus nivolumab and in 22.5% of patients treated with sunitinib, while hypertension occurred in similar percentages of patients in the cabozantinib plus nivolumab and sunitinib groups (39.7% versus 39.4%, respectively). The percentage of patients who experienced thrombotic events with cabozantinib plus nivolumab versus sunitinib were 13.4% and 6.3%, respectively. Other notable harms reported in at least 1% of patients in either treatment group were as follows in the cabozantinib plus nivolumab versus sunitinib groups: hepatotoxicity (5.6% versus 3.1%), wound complications (3.4% versus 1.3%), gastrointestinal perforations (1.3% versus 0.3%), and fistulas (1.3% versus 0%).
Analyses of IMAEs included events, regardless of causality, occurring within 100 days of the last dose (i.e., with extended follow-up). These analyses were limited to patients who received immune-modulating medication for treatment of the event. The most frequently reported IMAE categories were as follows in the cabozantinib plus nivolumab versus sunitinib groups: hypothyroidism/thyroiditis (28.1% versus 9.4%), rash (12.5% versus 0.9%), hepatitis (11.3% versus 2.2%), hyperthyroidism (9.7% versus 0.3%), diarrhea/colitis (6.3% versus 0.3%), adrenal insufficiency (4.4% versus 0), pneumonitis (4.1% versus 0.3%), and nephritis and renal dysfunction (2.2% versus 0.9%).
Critical Appraisal
Internal Validity
CheckMate 9ER was an open-label, phase III, randomized, multicentre trial. This design was appropriate since different dosing schedules and the use of both IV infusions and oral tablets across the 2 treatment groups made blinding impractical. The open-label design introduces a potential bias in the assessment of PFS and ORR, and a potential reporting bias of the subjective outcomes HRQoL and safety. However, this bias was mitigated by the use of a BICR for PFS and ORR. Randomization procedures, including stratification by IMDC prognostic risk score, tumour PD-L1 expression, and region, were appropriate and conducted by interactive response technology. In general, the baseline characteristics of patients appeared balanced between groups, indicating that randomization was successful.
To minimize the risk of differential measurement error, the trial performed tumour assessments using RECIST version 1.1 criteria and radiographic scans were assessed by a BICR. The RECIST guideline was considered appropriate, given that it has been used to assess tumour changes in many oncology trials and in real-world settings by regulatory agencies, including Health Canada. All data were reviewed by an independent data-monitoring committee.
There was low selective reporting bias, as the data were analyzed in accordance with the prespecified statistical plan. All interim analyses conducted were planned a priori, and stopping rules were prespecified in the protocol. The approaches used to preserve alpha and the power in the interim analyses were considered appropriate.
The censoring rules for PFS were prespecified, and sample size and power calculations were based on PFS. All planned outcomes were reported, and ITT analysis was conducted for the primary outcome (PFS) and secondary outcomes (OS and ORR). The PFS, OS, and ORR estimates obtained at the March 30, 2020, data cut-off date, including the OS follow-up analysis at the June 24, 2021, data cut-off date, were considered robust given multiplicity adjustments were performed. Sensitivity analyses were conducted for the primary outcome PFS, and the findings were consistent with the primary analysis in the ITT set. Multiplicity adjustments were not conducted for exploratory HRQoL outcomes, including the analysis of prespecified subgroups. HRQoL was assessed as an exploratory outcome using the FKSI-19 and EQ-5D-3L questionnaires. The FKSI-19 questionnaire has been validated in patients with RCC with evidence of reliability, responsiveness, and MID. Although the EQ-5D-3L has been widely used in oncology trials in different cancer populations, it has not been validated in patients with aRCC.
Patients were permitted to receive post-treatment anticancer medications at the survival follow-up phase after study treatment had been discontinued. More patients in the sunitinib group (42%) received post-treatment anticancer medications compared with the cabozantinib plus nivolumab group (32%), which may influence the assessment of OS.
External Validity
The population for the reimbursement request aligns with that of the Health Canada indication, and the dosing and administration of cabozantinib plus nivolumab was consistent with the Health Canada–approved product monograph. According to the clinical expert consulted by CADTH, the inclusion and exclusion criteria and baseline characteristics of the CheckMate 9ER trial are generalizable to adult patients with untreated aRCC with a clear cell component in the Canadian setting. The expert also noted that sunitinib, an approved treatment option for untreated patients with aRCC in Canada, was an appropriate comparator.
Dose adjustments were allowed in the trial and the methods were outlined in the protocol. According to the clinical expert consulted, dose adjustments or modifications are anticipated in a clinical practice setting to manage AEs while maintaining drug benefit. The clinical expert also noted that the discontinuation of 1 treatment while the patient continues another treatment is frequently observed in practice for drug combinations.
The trial included outcomes that were important to patients. The patient group indicated that stopping disease progression and improving overall outcomes and HRQoL are important to them. According to the clinical expert consulted by CADTH, the outcomes PFS, OS, ORR, and HRQoL investigated during the trial were appropriate for patients with aRCC. However, assessing HRQoL as an exploratory outcome is a limitation to the evidence since no definitive conclusions can be drawn.
Long-Term Extension Studies
No long-term extension studies were submitted by the sponsor.
Indirect Evidence
Content in this section has been informed by materials submitted by the sponsor. The following has been summarized and validated by the CADTH review team.
Objectives for the Summary of Indirect Evidence
The aim of this section is to summarize and critically appraise 1 sponsor-submitted NMA30 used to inform the pharmacoeconomic model and to identify indirect comparisons that fill gaps in the evidence for other first-line treatments of interest for aRCC.
Description of Sponsor-Submitted NMA
The systematic literature search and study selection criteria for the NMA is summarized in Table 15.
Indirect Treatment Comparison Design
Objectives
Due to the lack of head-to-head trials of cabozantinib plus nivolumab against all relevant comparators, the objective of the submitted NMA was to provide evidence for the efficacy and safety of cabozantinib plus nivolumab relative to other relevant comparators, including sunitinib, pazopanib, ipilimumab plus nivolumab, axitinib plus avelumab, axitinib plus pembrolizumab, and lenvatinib plus pembrolizumab, in treatment-naive patients with aRCC.30
Study Selection Methods
Using a predefined framework based on patients, intervention, comparators, and outcomes (otherwise known as a PICO framework), a systematic literature search was conducted in October 2021 in MEDLINE, Embase, Cochrane Library, and the ClinicalTrials.gov trial registry using the criteria described in Table 15.
The review included RCTs in adults with aRCC who received first-line systemic treatments and reported on 1 of the efficacy outcomes (PFS or OS) or the safety outcomes of interest listed in Table 15. Search restrictions were not reported. Identified citations were assessed for eligibility against predefined inclusion and exclusion criteria. Two reviewers independently screened titles and abstracts and relevant full text citations for inclusion. Discrepancies were resolved through discussion and consensus or, if necessary, through reconciliation by a third reviewer. Data extraction of included studies was performed by 1 reviewer and verified by a second reviewer. The list of extracted variables is in Table 18. Discrepancies were resolved by discussion and consensus. Quality assessment of included studies was performed using the Cochrane Risk of Bias assessment tool.
NMA Analysis Methods
A feasibility assessment was conducted to determine whether a connected network comparing the treatments and outcomes of interest could be constructed and was based on the inclusion and exclusion criteria used in the systematic literature review. A publication was excluded from the NMA if it did not provide PFS, OS, or ORR as an efficacy outcome. PFS and OS could be reported as either HR or Kaplan-Meier data and ORR could be reported as a percentage or as an OR. The studies were compared with regard to trial inclusion and exclusion criteria and baseline patient characteristics such as prognostic factors and prognostic risk score, age, bone metastases, study drug dose, previous therapies (if any), and prognostic risk level at baseline (favourable, intermediate, or poor). The classification was based either on the Memorial Sloan Kettering Cancer Center model or on the IMDC model. The comparison of treatment effects was assessed using OS and PFS HRs in the overall patient population, and in subgroups of favourable, intermediate, and poor prognostic risk patients.
In total, 5 approaches (methods) were used to conduct NMAs. Table 17 provides a summary of the analytical methods used to conduct each NMA. For the purpose of this review, the results of method 2 (survival end point metaregression for prognostic risk), method 3 (fractional polynomial), and method 4 (standard NMA for AEs) are reported. The rationale for reporting the results of these methods are as follows: method 2 attempted to address some sources of heterogeneity across studies in the network by including intermediate plus poor prognostic risk patients as a covariate, method 3 was used to inform the pharmacoeconomic model and attempted to address the violation of the proportional hazards assumption that was identified in most trials, and method 4 was the only NMA approach that reported on comparative safety. The fifth approach (piecewise exponential NMA) was exploratory and did not attempt to address any additional gaps in the other methods, and therefore is not reported in this review.
Table 15: Study Selection Criteria and Methods for NMA Submitted by Sponsor
Characteristics | Indirect comparison |
|---|---|
Population | aRCC |
Intervention | Cabozantinib plus nivolumab |
Comparator |
|
Outcome |
|
Study designs | Randomized controlled trials |
Publication characteristics | Not reported |
Exclusion criteria | Studies that did not provide PFS, OS, or ORR as an efficacy outcome |
Databases searched |
|
Selection process | Two reviewers independently screened titles, abstracts, and full text citations using prespecified study eligibility criteria. Discrepancies were resolved through discussion and consensus or, if necessary, through reconciliation by a third reviewer. |
Data extraction process | Data from included studies were extracted by 1 reviewer and verified independently by a second reviewer. Disagreements were resolved through discussion. |
Quality assessment | Quality assessment was performed using the Cochrane Risk of Bias tool. |
AE = adverse event; aRCC = advanced renal cell carcinoma; NMA = network meta-analysis; ORR = objective response rate; OS = overall survival; PFS = progression-free survival.
Note: Details from the table have been taken from the sponsor’s Summary of Clinical Evidence.
Source: Sponsor-submitted indirect treatment comparison.30
Table 16: Variables Data Extracted From Included Studies
Category | Variable |
|---|---|
Study ID and study design | Study ID, study groups, outcome extracted, study design, follow-up, inclusion criteria, screened and ITT population |
Patient characteristics | Age, gender, ethnicity, geographical region, predominant tumour histology subtype, PD-L1 status, sarcomatoid features, time from disease to randomization, stage at initial diagnosis, metastatic sites, bone metastases, brain metastases, liver metastases, other metastases, Karnofsky Performance Status, ECOG PS, IMDC prognostic category, MSKCC prognostic category, prior VEGFR tyrosine kinase inhibitors, previous nephrectomy, previous radiotherapy, subsequent anticancer therapies, laboratory measurements |
Efficacy outcomes | OS, PFS, PFS2, TTP, total duration of treatment, overall response rate and ORR, CR, PR, SD, PD, DoR, TTR |
Safety outcomes | Evaluated dose, summary of all AEs, SAEs, grade 3 to grade 4 AEs, grade 3 to grade 5 AEs, grade 5 AEs, image of AE table, grade 3 + grade 4 AEs, 3 most common grade 3 to grade 5 AEs, AEs of special interest, treatment discontinuation (time, all cause, disease progression, AE, death), image of KM curve treatment discontinuation |
PROs | EQ-5D-3L, EQ-5D 5L, NFKSI-19, FKSI-15, NFKSI-DRS-13, 9-item FKSI-DRS, EORTC QLQ-C30, FACT-G, time to deterioration, other PROs, image of PROs table or figures |
AE = adverse event; CR = complete response; DoR = duration of response; ECOG PS = Eastern Cooperative Oncology Group Performance Status; EORTC QLQ-C30 = European Organisation for Research and Treatment of Cancer Quality of Life Questionnaire Core 30; EQ-5D-3L = 3-Level EQ-5D; EQ-5D-5L = 5-Level EQ-5D; FACT-G = Functional Assessment of Cancer Therapy–General; FKSI-15 = Functional Assessment of Cancer Therapy Kidney Cancer Symptom Index - 15 Item Version; FKSI-DRS = Functional Assessment of Cancer Therapy Kidney Cancer Symptom Index - Disease Related Symptoms; ID = identification; IMDC = International mRCC [Metastatic Renal Cell Carcinoma] Database Consortium; ITT = intention to treat; MSKCC = Memorial Sloan Kettering Cancer Center; NFKSI-19 = National Comprehensive Cancer Network/Functional Assessment of Cancer Therapy Kidney Cancer Symptom Index – 19 Item Version; NFKSI-DRS-13 = National Comprehensive Cancer Network/Functional Assessment of Cancer Therapy Kidney Cancer Symptom Index - 13 Item; ORR = objective response rate; OS = overall survival; PD = progressive disease; PFS = progression-free survival; PFS2 = progression-free survival 2; PR = partial response; PRO = patient-reported outcome; SAE = serious adverse event; SD = stable disease; TTR = time to objective response; TTP = time to progression; VEGFR = vascular endothelial growth factor receptor.
Note: Details from the table have been taken from the sponsor’s Summary of Clinical Evidence.
Source: Sponsor-submitted indirect treatment comparison.30
Table 17: NMA Analysis Methods
Methods | Description |
|---|---|
Analysis methods | Several approaches were explored to run the NMA. Method 1: Parametric survival curve–based NMA without covariate A family of parametric distributions was jointly fitted to the data with a Bayesian model. Five models were created, each assuming that each survival curve originated from a specific family of distributions. Four models assumed 2-parameter distributions (Weibull, Gompertz, log-logistic, and log-normal) while 1 model used 1-parameter exponential distributions. The exponential survival model was chosen because it made the same assumption as the previous method of hazard proportionality and allowed comparison. Random effects and fixed effects describing the in-between study effect were introduced. Bayesian meta-analysis models were used to determine treatment differences and estimate treatments in terms of their effect on the reference parameters. Effect transitivity is an underlying model assumption. Transitivity implies that the choice of reference treatment in each study has no influence on the results. Values of survival functions for each treatment over time were calculated based on reference values. Such adjustment was performed to match the survival values from the cabozantinib plus nivolumab group in the CheckMate 9ER study. Both fixed-effects and random-effects models were developed. All models were implemented in WinBUGS. Method 2: Survival end point metaregression for prognostic risk NMA Parametric survival models for OS and PFS were developed with study random effects, testing sequentially the following shapes: Weibull, Gompertz, log-logistic, log-normal, and exponential. Similar to NMA method 1, Bayesian meta-analysis models were used to generate results. Included studies had populations with different proportions of patients in each of the 3 prognostic risk groups at baseline: favourable-, intermediate-, and poor- prognosis patients. To account for these differences in risk distributions, an NMA was conducted by introducing a study-dependent covariate x_j in study j, which can take values in [0, 100%], and is defined as the proportion of intermediate-risk or poor-risk patients at baseline. The intermediate-risk and poor-risk groups were not separated because it would have resulted in too many parameters to estimate. Also, no covariate for the proportion of high-risk patients was introduced because it would be fully collinear with the other: it is the proportion of population remaining after subtracting poor-risk and intermediate-risk groups. Assumptions regarding the covariate included the following:
Method 3: Fractional polynomial NMA An NMA model was developed using parametric survival functions that included common survival distributions such as Weibull or Gompertz and more flexible fractional polynomials. The estimation of model parameters of interest — baseline and effect vectors — was performed in a Bayesian framework. The model parameters were estimated using a Markov chain Monte Carlo method implemented in WinBUGS software. The WinBUGS sampler, using 3 parallel chains, was run for 250,000 iterations as the burn-in period and a further 500,000 iterations for the first order FP model. Those numbers were increased to 500,000 and 1,000,000 for the second order FP model. Method 4: Standard NMA for AEs Fixed-effects and random-effects models were fit for OR. Analysis was done in R version 3.6.021 using package gemtc22 and rjags to perform the Gibbs sampling procedure for the Bayesian NMA. It was assumed that error on log scale is normal, yielding a linear regression model where the parameters to estimate were log (ORs) between any treatment and chosen reference treatment (in this case, cabozantinib plus nivolumab). The model outputs are point estimates and 95% credible intervals for ORs between pairs of treatments, as well as forest plots visualizing this information. Method 5: Piecewise exponential NMA (exploratory) Piecewise exponential NMA was explored as another option. It consisted of 2 steps: 1. select knots locations 2. run the Bayesian piecewise exponential curve NMA, with respect to each scenario of knots locations. The NMA was implemented in WinBUGS version 1.4.3, using Markov chain Monte Carlo techniques within the Bayesian framework. The WinBUGS sampler, using 3 parallel chains, was run for 250,000 iterations as the burn-in period and a further 500,000 iterations. |
Priors | Noninformative priors were used for Bayesian models (fixed effects and random effects). |
Assessment of model fit | Models were ranked for fit assessment according to their (posterior mean) DIC, with a lower DIC indicating a better model fit. Kaplan-Meier curves generated from extracted data and model fits were visually inspected against original Kaplan-Meier curves from published articles or conference posters. Long-term clinical plausibility was assessed in addition to the statistical fit. |
Assessment of convergence | The Gelman-Rubin statistic was applied to check the convergence of all models run using the Bayesian framework. |
Assessment of consistency | The Cochran’s Q statistic and node-splitting approach were used to measure the inconsistency in the NMA. |
Assessment of homogeneity | Heterogeneity assessment was done using qualitative and quantitative methods:
|
Outcomes | OS, PFS, CR, AE, TTD, DoR |
Follow-up time points | Follow-up varied across the studies and was commonly up to 40 months. |
Sensitivity analyses | Several scenario analyses were conducted. For method 1 and method 2 (comparison of survival curves without the covariate and with the covariate), the following scenarios were generated for 5 years and 40 years for both OS and PFS:
|
Subgroup analysis | Comparison of the treatment effects was done in the overall patient population, and in subgroups of favourable, intermediate, and poor prognostic risk patients. |
Methods for pairwise meta-analysis | Not applicable. |
Patient-level data | For the CheckMate 9ER study, the patient-level data (with a cut-off date of June 24, 2021) were used as a source for efficacy outcomes for cabozantinib plus nivolumab. |
AE = adverse event; CR = complete response; DIC = deviance information criterion; DoR = duration of response; FP = fractional polynomial; NMA = network meta-analysis; OR = odds ratio; OS = overall survival; PFS = progression-free survival; TKI = tyrosine kinase inhibitor; TTD = time to deterioration; vs. = versus.
Note: Details from the table have been taken from the sponsor’s Summary of Clinical Evidence.
Source: Sponsor-submitted indirect treatment comparison.30
Survival End Point Metaregression for Prognostic Risk NMA
Bayesian meta-analysis models were used to generate results. To account for differences in each of the 3 patient prognostic risk groups at baseline (favourable, intermediate, and poor), an NMA was conducted by introducing a study-dependent covariate x_j in study j, which can take values in [0, 100%], and is defined as the proportion of intermediate-risk or poor-risk patients at baseline. The authors noted that intermediate-risk and poor-risk groups were not separated because it would have resulted in too many parameters to estimate, and no covariate for the proportion of high-risk patients was introduced because it would be fully collinear with the other. Assumptions regarding the covariates included the following: only its global effect was estimated as there was no range that allowed estimating any treatment-specific effect, and the covariate was added only in the scale parameter instead of both shape and scale parameters to avoid any potential identifiability issue that could happen within a small network. Parametric survival models for OS and PFS were developed with study random effects, testing sequentially the following shapes: Weibull, Gompertz, log-logistic, log-normal, and exponential.
Fractional Polynomial NMA
An NMA model was developed using parametric survival functions that included common survival distributions such as Weibull or Gompertz and more flexible fractional polynomials. The estimation of model parameters of interest, baseline, and effect vectors was performed in a Bayesian framework. The model parameters were estimated using a Markov chain Monte Carlo method implemented in WinBUGS software. The WinBUGS sampler, using 3 parallel chains, was run for 250,000 iterations as the burn-in period and for a further 500,000 iterations for the first order fractional polynomial model. Those numbers were increased to 500,000 iterations as the burn-in period and a further 1,000,000 iterations for the second order fractional polynomial model.
All Bayesian NMAs used a noninformative prior. Models were ranked for fit assessment according to their (posterior mean) deviance information criterion, with a lower deviance information criterion indicating a better model fit. Kaplan-Meier curves generated from extracted data and model fits were visually inspected against original Kaplan-Meier curves from published articles or conference posters. Long-term clinical plausibility was assessed in addition to the statistical fit. The Cochran’s Q statistic and node-splitting approach were used to measure inconsistency. Of note, comparators of interest to this review were not involved in a closed loop within the network. Heterogeneity was assessed using qualitative and quantitative methods. Qualitative assessment included the comparison of study design and patient characteristics at baseline, and quantitative assessment was done for every network model using the Q statistic. The analysis was performed for the overall population and prognostic risk subgroups. The follow-up time chosen for all analyses was approximately 30 months.
Standard NMA for AEs
Fixed-effects and random-effects models were fit for OR. It was assumed that error on log scale is normal, yielding a linear regression model where the parameters to estimate were log (OR) between any treatment and the chosen reference treatment cabozantinib plus nivolumab. The model outputs were point estimates and 95% credible intervals for ORs between pairs of treatments, as well as forest plots visualizing this information. Analysis was done in R 3.6.021 using package gemtc22 and rjags to perform the Gibbs sampling procedure for the Bayesian NMA.
Results of Sponsor-Submitted NMA
Summary of Included Studies
In total, 10 studies were identified in the systematic literature review and deemed appropriate for inclusion in the NMA feasibility assessment. Three trials (the CESAR,31 PISCES,32 and BIONIKK33 trials) were not included in the NMA because HR, KM, or OR data were not available. Seven studies were included in the NMA: the CheckMate 9ER,23 CLEAR,34 CheckMate 214,35 COMPARZ,40 JAVELIN Renal 101,37 KEYNOTE-426,38,39 and SUTENT studies.36 CABOSUN41 was not included in the overall study population NMA because it excluded patients with favourable prognostic risk status. However, the CABOSUN study was used in the subgroup analyses.
Table 18: Summary Assessment of Homogeneity Across Trials
Characteristic | Description of potential effect modifiers for studies included in the NMA |
|---|---|
Disease severity (assessed by IMDC prognostic risk category) | In the overall study population, the proportion of patients in the favourable-risk group ranged from 21.3%37 to 34.7%34 across the included studies. The proportion of patients in the intermediate-risk group ranged from 55.1%38 to 62.2%.37 The proportion of patients in the poor-risk group ranged from 9.3%34 to 20.7%.23 As mentioned earlier, the CABOSUN study41 only consisted of patients with intermediate risk (81%) or poor risk (19%). Of note, the SUTENT trial36 was the only study that did not provide details on prognostic risk categories. Missing values were not reported in 3 of the 7 studies plus the CABOSUN trial. |
Bone metastases | In the overall study population, the proportion of patients with bone metastasis ranged from 15%36 to 24.1%.23 |
Treatment history | |
Prior nephrectomy | In the overall study population (i.e., the 7 studies), the CLEAR trial had the lowest rate of prior nephrectomy at 23% on average. For the rest of the studies, the rate ranged from 68.7%23 to 84%.36 |
Prior radiotherapy | Data on prior radiotherapy was provided by 4 of the 7 studies. The rate ranged from 8%36 to 14.2%.23 |
Dosing of comparators | There were some differences in the dosing of cabozantinib monotherapy in the CheckMate 9ER study (40 mg) and the CABOSUN study (60 mg) and in the dosing of nivolumab in the CheckMate 9ER study (240 mg) and the CheckMate 214 study (3 mg/kg). |
Clinical trial setting | For the overall study population, in 6 of the 7 studies, the proportion of patients originating from Europe and North America ranged from 48%23 to 62%.36 The SUTENT trial did not provide details on the settings. |
Study design | Most of the included studies were phase III RCTs, with the exception of the CABOSUN trial and the SUTENT trial, which were phase II RCTs. |
Blinding | All included studies were open label. |
Age | The median age across the studies was very similar, ranging from 57.6 years40 to 64 years.34 |
Sex | The studies were homogenous in terms of sex: the proportion of female population ranged from 22.5%37 to 29.3%.23 |
IMDC = International mRCC [Metastatic Renal Cell Carcinoma] Database Consortium; NMA = network meta-analysis; RCT = randomized controlled trial.
Note: Details from the table have been taken from the sponsor’s Summary of Clinical Evidence.
Source: Sponsor-submitted indirect treatment comparison.30
Figure 4: Assessment of Homogeneity Across Trials — Prognostic Risk Category and ECOG PS
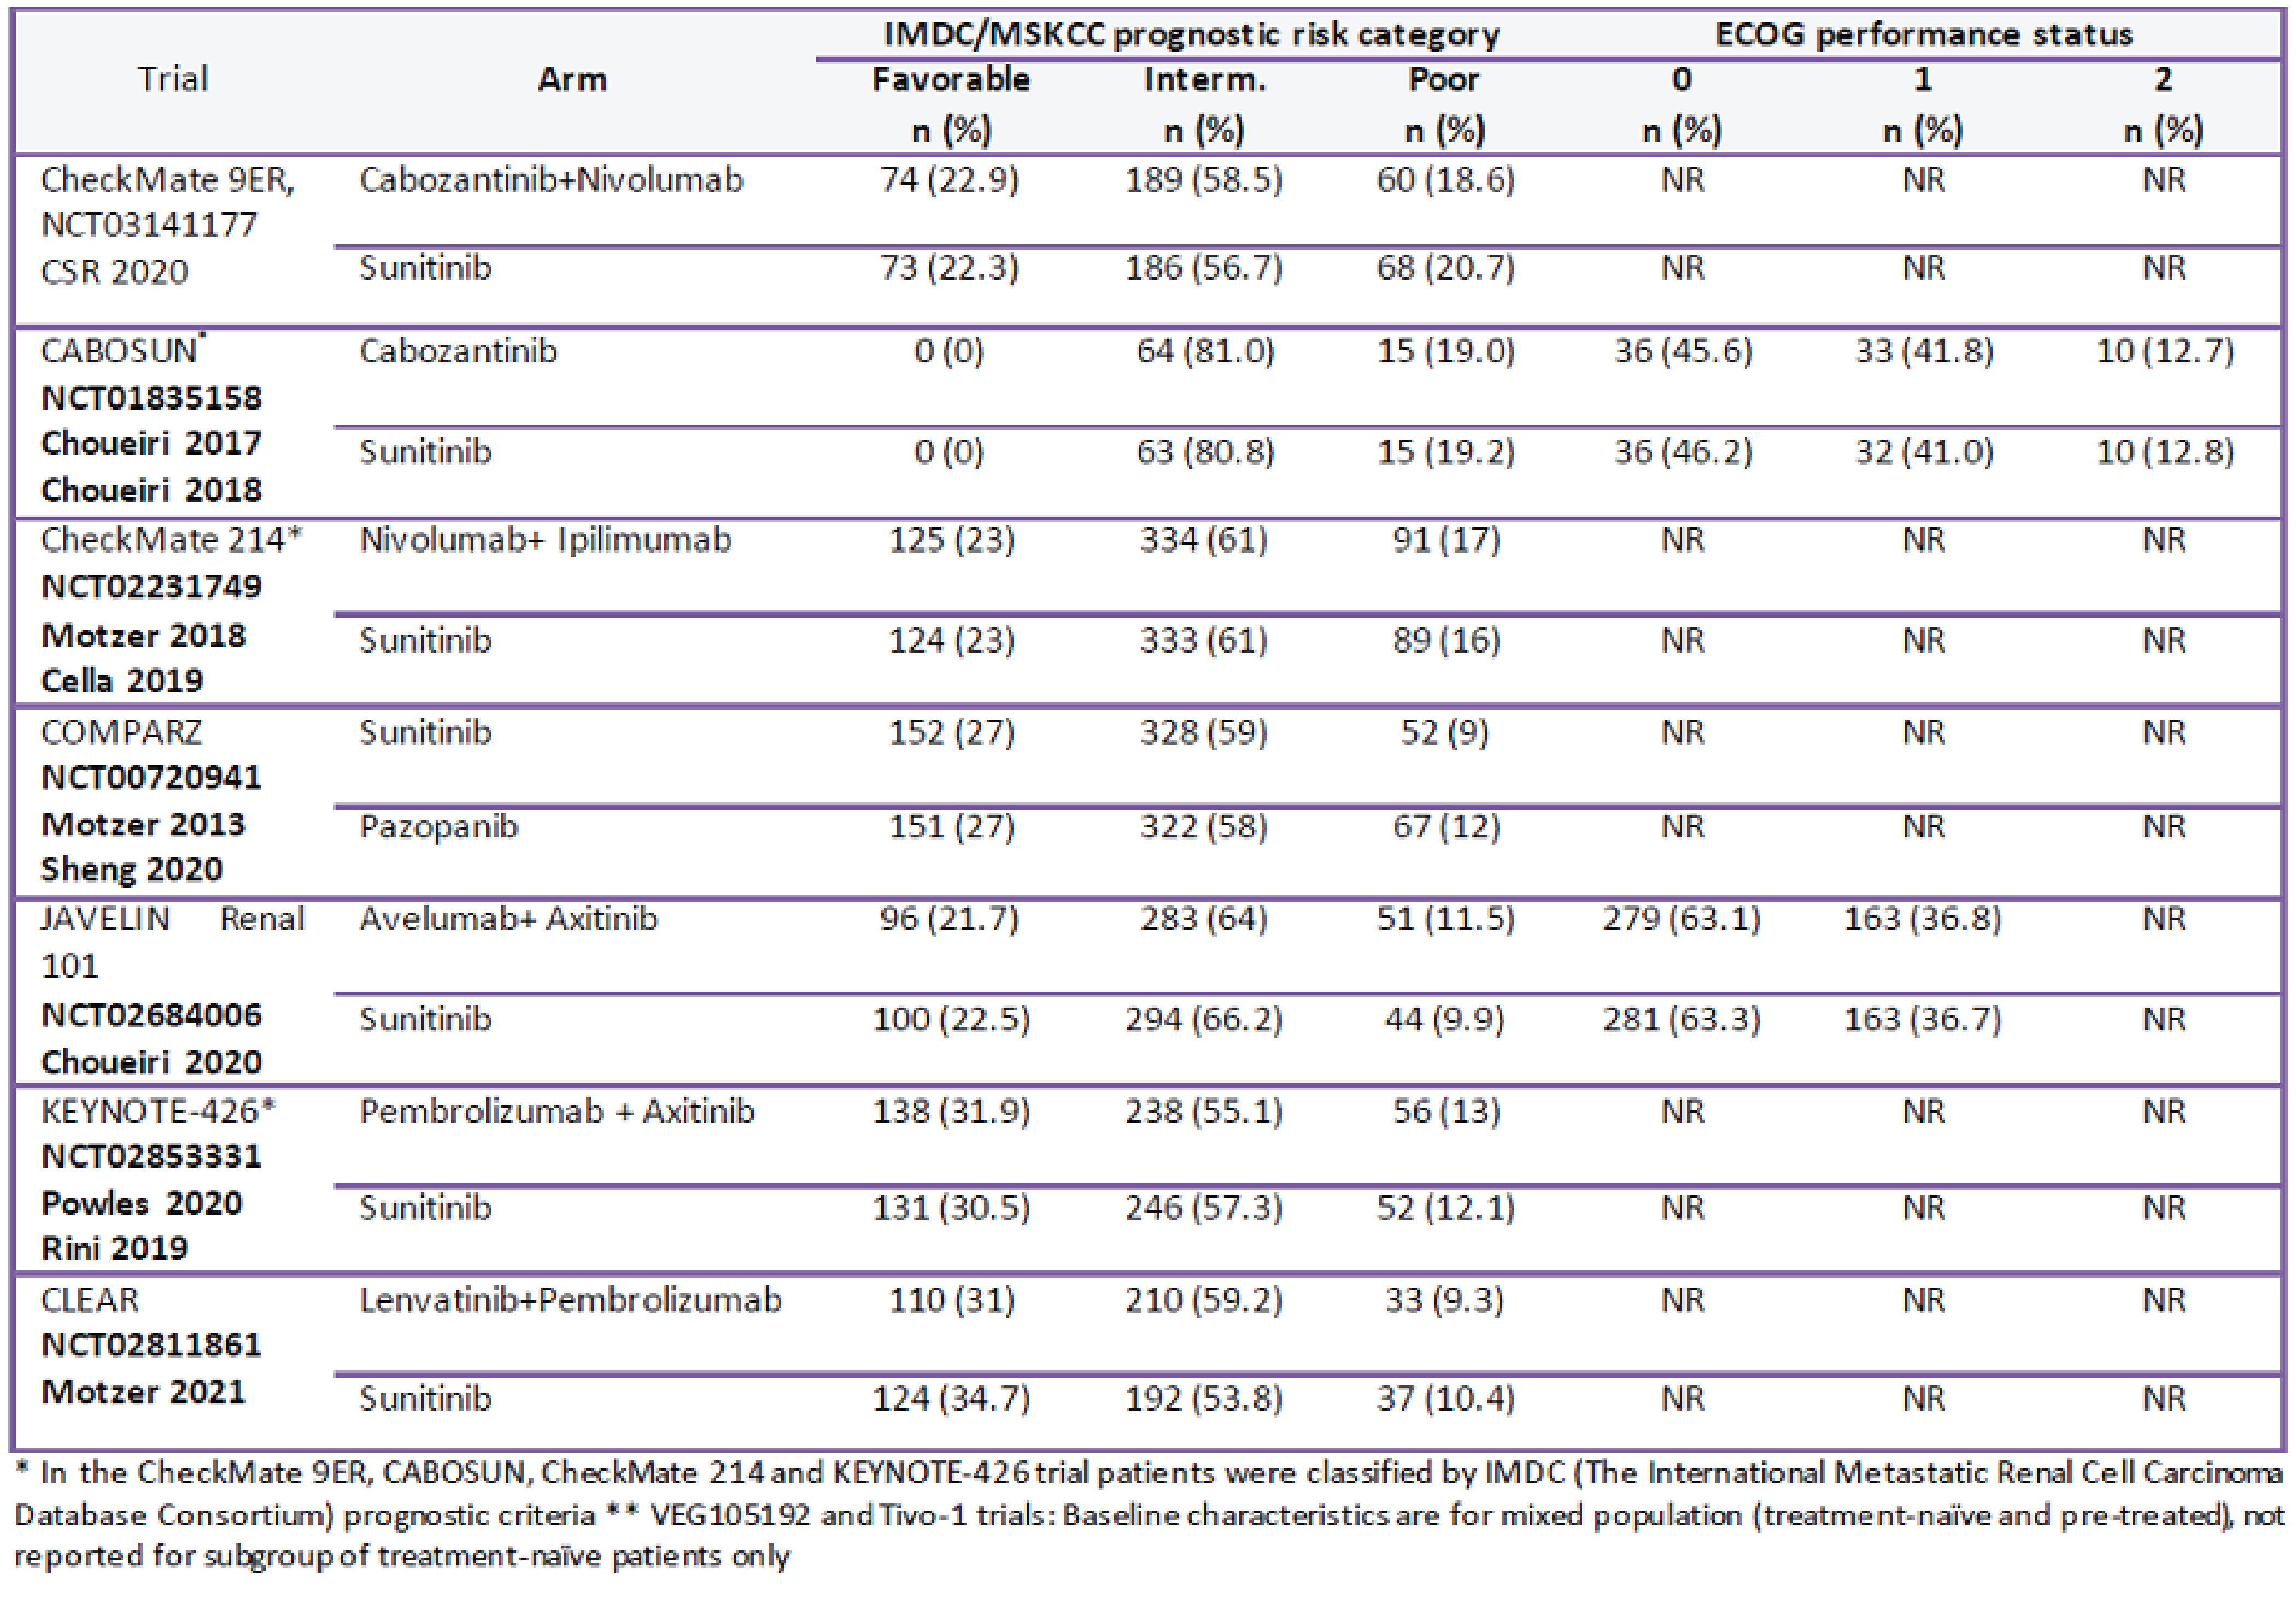
CSR = Clinical Study Report; ECOG = Eastern Cooperative Oncology Group; ECOG PS = Eastern Cooperative Oncology Group Performance Status; IMDC = International mRCC [Metastatic Renal Cell Carcinoma] Database Consortium; MSKCC = Memorial Sloan Kettering Cancer Center; NR = not reported.
Source: Sponsor-submitted indirect treatment comparison.30
Table 18 provides a summary of similarities and differences of potential effect modifiers, and Figure 4 and Figure 5 provide detailed patient characteristics across trials included in the NMA. Most patients were male and Caucasian, and had a median age between 58 years and 64 years. Almost all trials did not report the predominant tumour history subtype of patients, except for the COMPARZ study. All included trials enrolled patients with metastatic or advanced metastatic cancer. In most trials, the Karnofsky Performance Status and ECOG PS of patients were not reported. The proportion of patients ranged from 21.3% to 34.7% in the favourable-risk group, from 55.1% to 62.2% in the intermediate-risk group, and from 9.3% to 20.7% in the poor-risk group. The CABOSUN study only consisted of patients with intermediate-risk (81%) or poor-risk (19%) status, and the SUTENT study did not provide details on prognostic risk categories. The rate of prior nephrectomy across most trials ranged from 68.7% to 84%, with the CLEAR trial having the lowest rate of 23%. The rate of prior radiotherapy was reported in 4 trials, where the rates ranged from 8% to 14.2%. There were differences in the dosing of cabozantinib monotherapy in the CheckMate 9ER study (40 mg) and the CABOSUN study (60 mg) and nivolumab in the CheckMate 9ER study (240 mg) and the CheckMate 214 study (3 mg/kg). For studies that reported metastatic sites data, the majority of patients (60% to 90%) had 2 or more metastases. The proportion of patients with bone metastasis was similar across most trials (20% to 30%). The exceptions were the CABOSUN trial, which had the highest percentage reaching just below 40%, and the COMPARZ trial, with the lowest percentage at 15%.
Results
The results are based on the survival end point metaregression for prognostic risk NMA, the fractional polynomial NMA, and the standard NMA for AEs. Evidence networks used for the comparison of PFS and OS in the ITT population and patients in the intermediate-risk and poor-risk categories are presented in Figure 6 and Figure 7. The network included 8 comparators from 7 RCTs. Of note, there was insufficient data for time to deterioration for all comparators; therefore, no curve NMA was conducted. Global heterogeneity and/or inconsistency in the Q statistic for each model and its associated test P values showed heterogeneity in all networks. In most studies, the proportional hazards assumption did not hold for at least 1 of the outcomes. The exception was the CheckMate 9ER study, where the proportional hazards assumption was not violated for PFS in the overall population and for PFS and OS in the intermediate plus poor prognostic risk subgroup. The scaled Schoenfeld test, Schoenfeld plot, and log cumulative plot were used to assess whether the proportional hazards assumption had been violated.
Figure 5: Assessment of Homogeneity Across Trials — Dose, Age, and Metastatic Site
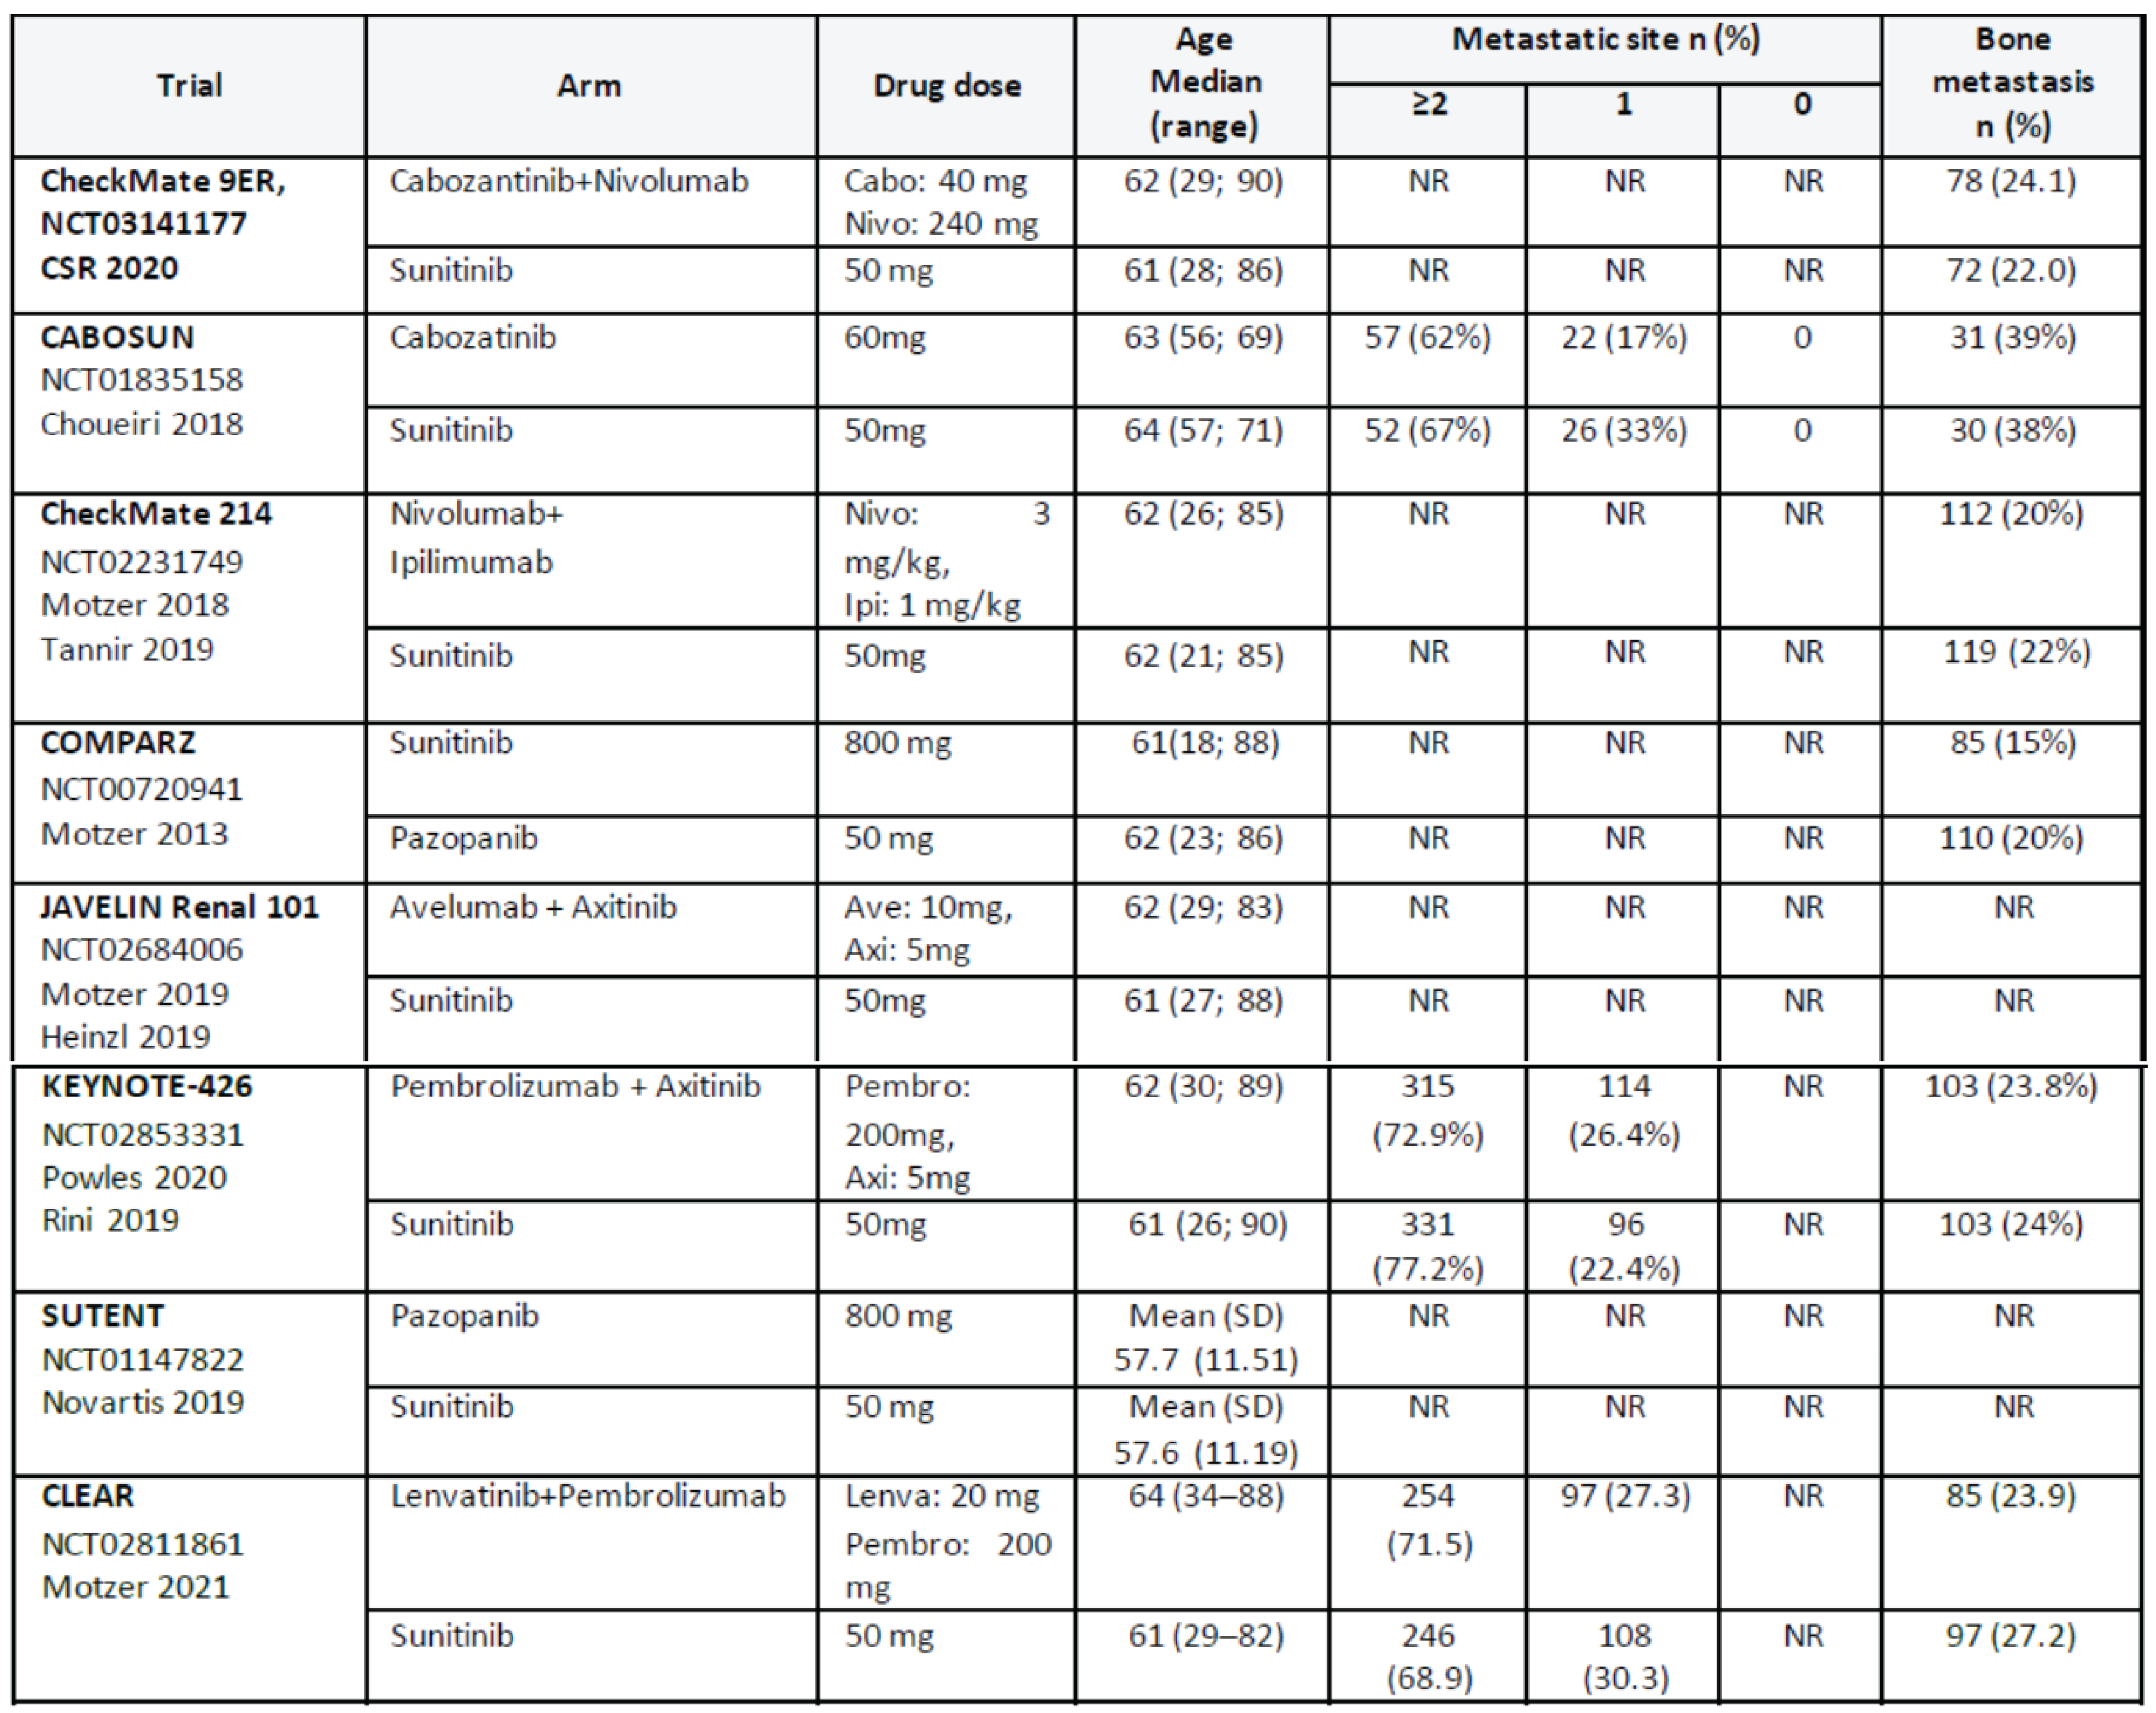
CSR = Clinical Study Report; NR = not reported; SD = standard deviation.
Source: Sponsor-submitted indirect treatment comparison.30
Progression-Free Survival
Survival End Point Metaregression for Prognostic Risk NMA
Median PFS with covariate results are reported in Table 19. Log-normal was chosen for both good statistical fit and clinical plausibility. In the ITT population, ||| ||||||| |||||||| |||||||||||||| ||| ||||||||||| |||||| ||| |||||||| |||||| |||| ||| |||||, with or without the covariate. After the observed period, ||| ||||||| |||||||| |||||||||| ||| |||| |||||||||||||| ||||| ||||||||||| |||||| ||| || |||||| |||||||||| |||| |||||||. Based on the NMA with the covariate, ||| |||||||||||||| ||||||||| |||||||| || ||||||| ||| |||| ||||||||| ||||||||||| |||||||||| |||| |||||||| ||||||||| |||||||| ||| |||||| ||||||| |||||| |||||||| ||||||||||| |||| || ||||||| |||||||||. The results from the NMA with the covariate had wider credible intervals than without the covariate.
In the intermediate-risk and poor-risk population, ||| ||||||| |||||||| |||||||||| |||||||| || ||||||||| |||||| ||||| ||||||||||| |||||| ||| |||||||| |||||| |||| ||| |||||| ||||| ||| |||||||| ||||||| ||| ||||||| |||||||| |||| |||||||||||| |||||||| || ||||||||| |||||| ||| || |||||| |||||||||| |||| |||||||| ||| |||||||| ||||| ||| |||| ||||||||| ||||||||||| |||||||||| |||| |||||||| |||| ||||||||||| |||||||| ||| ||||||| |||||| |||| |||||||| || |||||||||.
Figure 6: Curve PFS and OS, NMA Network in ITT Population
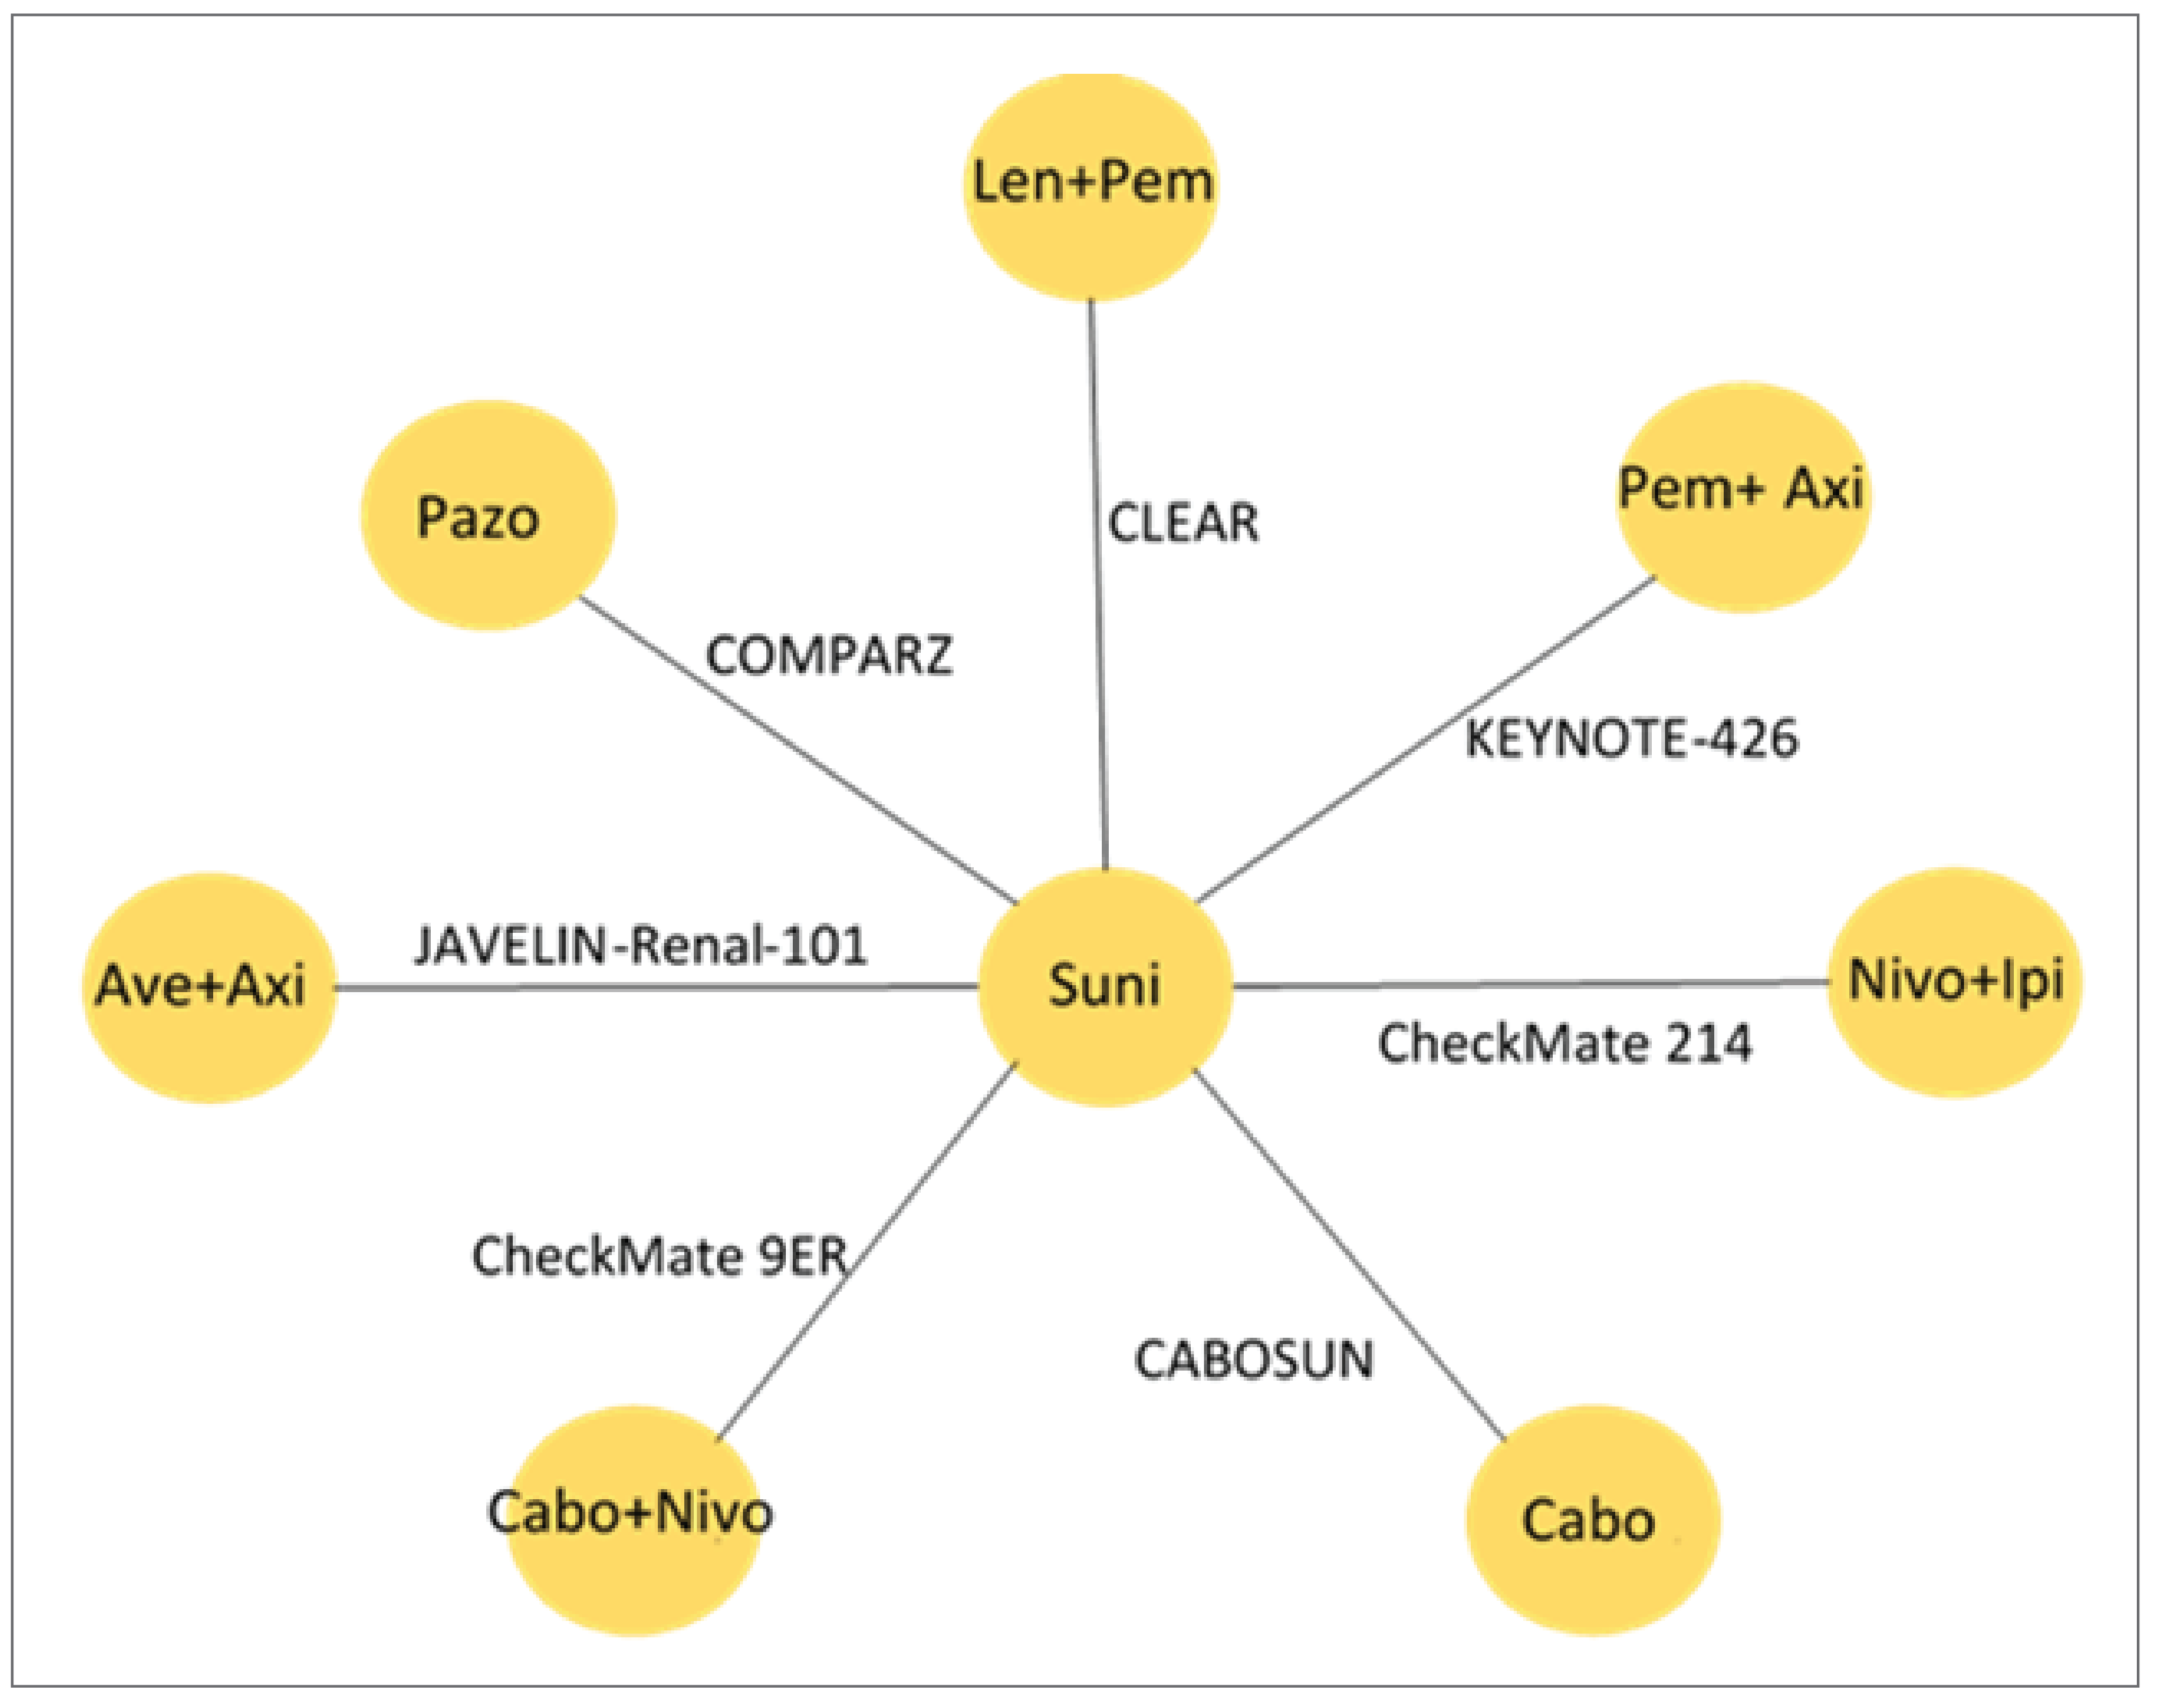
Ave = avelumab; Axi = axitinib; Cabo = cabozantinib; Ipi = ipilimumab; ITT = intention to treat; Len = lenvatinib; Nivo = nivolumab; NMA = network meta-analysis; OS = overall survival; Pazo = pazopanib; Pem = pembrolizumab; PFS = progression-free survival; Suni = sunitinib.
Note: Details from the table have been taken from the sponsor’s Summary of Clinical Evidence.
Source: Sponsor-submitted indirect treatment comparison.30
Fractional Polynomial NMA
PFS curves at 5 years and 40 years are presented in Figure 8 and median PFS results are reported in Table 20. In the ITT population, for PFS, second order P1 = –1, P2 = –1 was chosen for both good statistical fit and clinical plausibility. Under the best fitting parameterization, during the observed period from the trial, ||| ||||||| |||||||| ||||||||||| |||||||| || ||||||||| |||||||| || ||||| |||||||||||. After the observed period, ||| ||||||| |||||||| ||||||||| |||||||| || ||||||||| |||||||| || ||||| ||||||||||| |||||||||| |||||||||| |||| |||||||| |||||||||| ||| ||| ||||||| |||||| |||| |||||||| || |||||||||.
In the intermediate-risk and poor-risk population, ||| ||||||| |||||||| |||| ||||||||||| |||||||| || ||||||||| versus other comparators during the observed period from the trial. After the observed period, ||| ||||||| |||||||| |||| |||||||||||| |||||||| || |||||||||||||| ||| || |||||| |||||||||| |||| |||||||| ||| |||||||| |||||||| |||| ||||||||| ||||| |||||| |||||||||| |||| |||||||||| ||||||||||| |||||||| ||| ||||||| |||||| |||| |||||||| || |||||||||.
Figure 7: Curve PFS and OS, NMA Network in Patients With Intermediate-Risk and Poor-Risk Prognostic Status
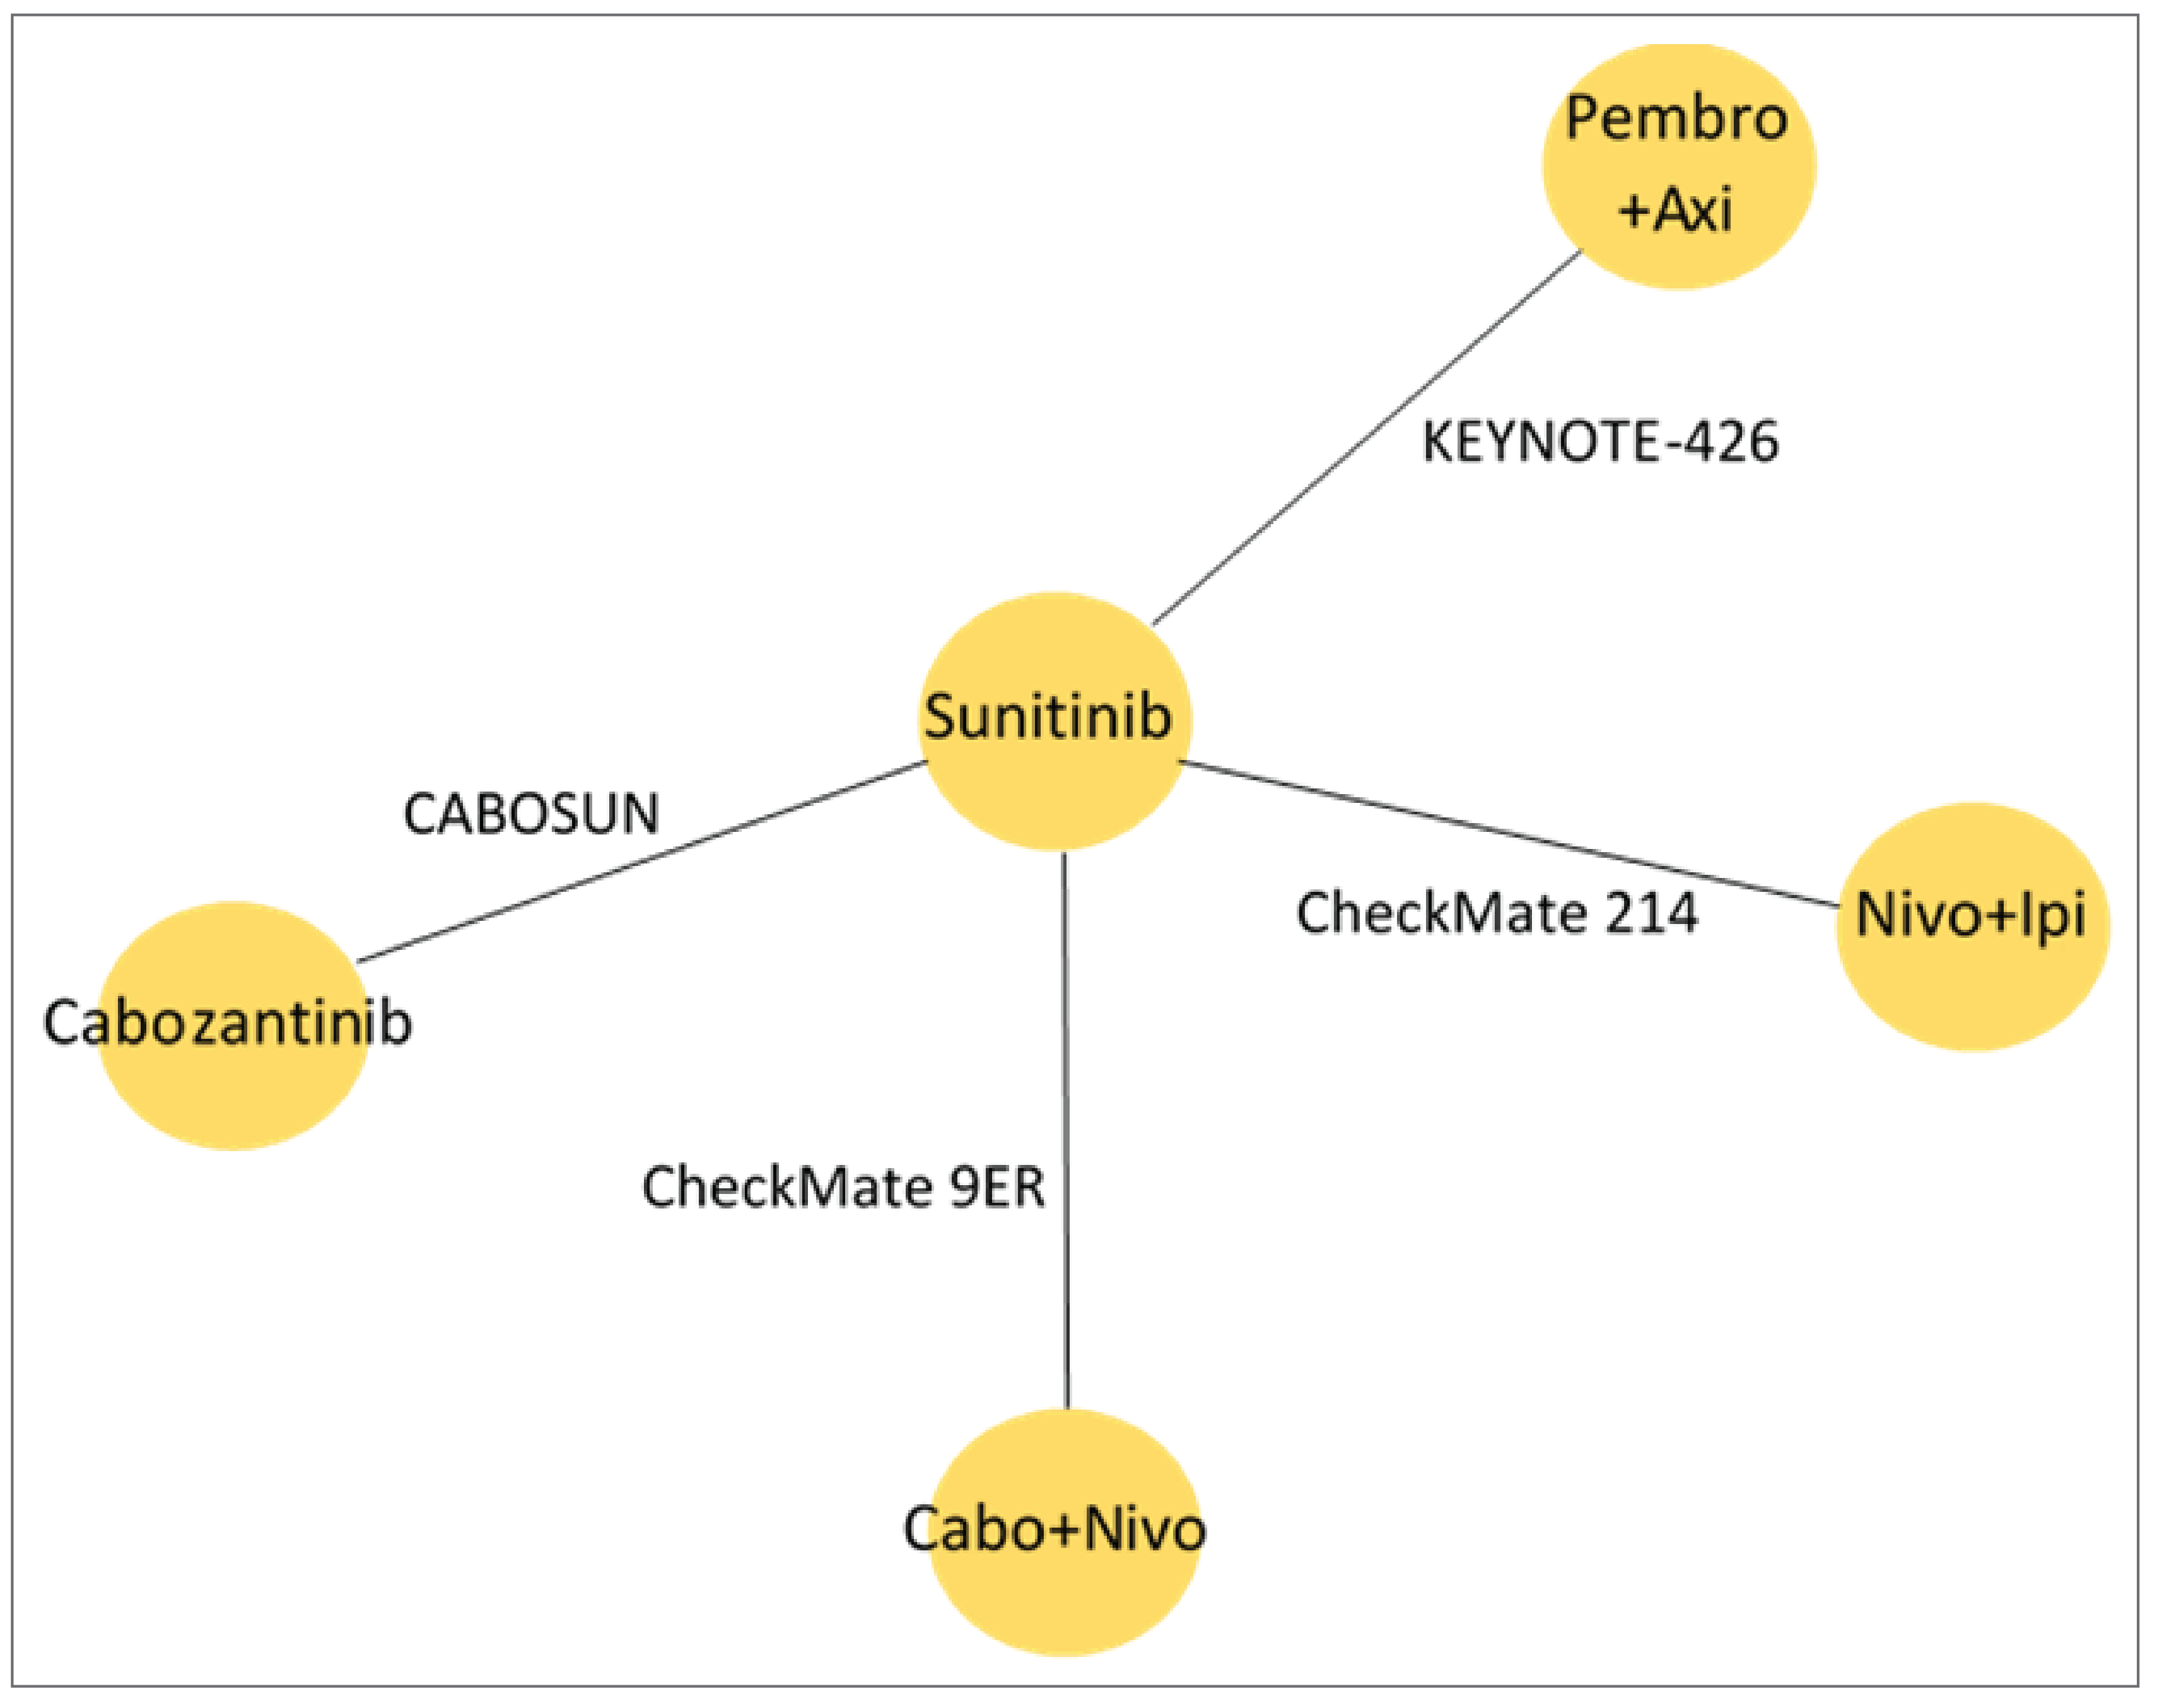
Axi = axitinib; Cabo = cabozantinib; Ipi = ipilimumab; Nivo = nivolumab; NMA = network meta-analysis; OS = overall survival; Pem = pembrolizumab; PFS = progression-free survival.
Note: Details from the table have been taken from the sponsor’s Summary of Clinical Evidence.
Source: Sponsor-submitted indirect treatment comparison.30
Table 19: Median PFS Estimates Adjusted to Baseline From CheckMate 9ER Study, Under Log-Normal Distribution — Survival End Point Metaregression for Prognostic Risk NMA
Treatment | Median from trial (95% CI) | Median (95% credible interval) |
|---|---|---|
SUNI (CheckMate 9ER study) | |||| ||||| || ||||| | |||| ||||| || |||||| |
CABO + NIVO (CheckMate 9ER study) | ||||| |||||| || |||||| | ||||| ||||| || |||||| |
IPI + NIVO (adjusted) | |||| |||| || ||||| | ||||| ||||| || |||||| |
AVE + AXI (adjusted) | |||| ||||| || ||||| | |||| ||||| || |||||| |
PAZO (adjusted) | ||| |||| || ||||| | |||| ||||| || |||||| |
PEMBRO + AXI (adjusted) | |||| ||||| || ||||| | |||| ||||| || |||||| |
LEN + PEMBRO (adjusted) | |||| ||||| || ||||| | ||||| ||||| || ||||||| |
AVE = avelumab; AXI = axitinib; CABO = cabozantinib; CI = confidence interval; IPI = ipilimumab; LEN = lenvatinib; NIVO = nivolumab; NMA = network meta-analysis; PAZO = pazopanib; PEMBRO = pembrolizumab; PFS = progression-free survival; SUNI = sunitinib.
Source: Sponsor-submitted indirect treatment comparison.30
Table 20: Median PFS in ITT Population, Adjusted to Baseline From CheckMate 9ER Study — Fractional Polynomial NMA
Treatment | Median from trial | Median + 95% credible interval | Fractional polynomial |
|---|---|---|---|
SUNI (CheckMate 9ER study) | |||| ||||| || ||||| | |||| ||||| || |||||| | P1 = –1, P2 = –1 |
CABO + NIVO (CheckMate 9ER study) | ||||| |||||| || |||||| | ||||| |||||| || |||||| | |
IPI + NIVO (adjusted) | |||| |||| || ||||| | |||| ||||| || |||||| | |
AVE + AXI (adjusted) | |||| ||||| || ||||| | ||||| |||| || |||||| | |
PAZO (adjusted) | ||| |||| || ||||| | |||| ||||| || |||||| | |
PEMBRO + AXI (adjusted) | |||| ||||| || ||||| | ||||| ||||| || |||||| | |
LEN + PEMBRO (adjusted) | |||| ||||| || ||||| | ||||| |||||| || |||||| |
AVE = avelumab; AXI = axitinib; CABO = cabozantinib; IPI = ipilimumab; ITT = intention to treat; LEN = lenvatinib; NIVO = nivolumab; NMA = network meta-analysis; PAZO = pazopanib; PEMBRO = pembrolizumab; PFS = progression-free survival; SUNI = sunitinib.
Source: Sponsor-submitted indirect treatment comparison.30
Overall Survival
Survival End Point Metaregression for Prognostic Risk NMA
Median OS results with the covariate are provided in Table 21. Weibull distribution was chosen for both good statistical fit and clinical plausibility. Based on the NMA without the covariate, during the observed period from the trial ||| ||||||| |||||||| ||||||||| versus other comparators. In the NMA with the covariate, ||| ||||||| |||||||| |||||||||| ||| |||||||||| |||||||| || |||||||||. After the observed period, based on the NMA without the covariate, ||| ||||||| |||||||| ||||||||| |||| ||||||||| after 10 years’ predictive time horizon. Based on the NMA with the covariate, ||| ||||||| |||||||| |||||||| |||||||| || ||||||||| versus other comparators during the 40 years’ predictive time horizon. ||||||||| |||||||| ||| ||||| ||||||| |||||| |||||| ||||||| ||| ||||||||||| with or without the covariate. In general, the results from the NMA with the covariate had wider credible intervals than without the covariate.
In the intermediate-risk and poor-risk population, ||| ||||||| |||||||| ||||||||| versus other comparators during the observed period from the trial. After the observed period, ||| ||||||| |||| |||||||| ||||||||| |||| ||||||||| after 6 years’ predictive time horizon. ||||||||| |||||||| ||| ||||| ||||||| |||||| ||| ||||| |||||||||| ||| ||||||||
Fractional Polynomial NMA
OS curves at 5 years and 40 years are presented in Figure 9 and median OS results are provided in Table 22. During the observed period from the trial, ||| ||||||| |||||||| |||||||||| |||||||| || ||||||||| versus other comparators after 2 years. After the observed period, ||| ||||||| |||||||| |||||||||| |||||||| || |||||||||| ||| ||||||||| versus other comparators. ||||||||| ||| ||||||||| |||||||| ||| ||||||| |||||| ||| |||||||| || |||||||||.
In the intermediate-risk and poor-risk population, ||| ||||||| |||||||| ||||||||||| |||||||| || ||||||||| versus other comparators during the observed period from the trial. After the observed period, ||| ||||||| |||||||| ||||||||||| |||||||| || ||||||||| during the 40 years’ predictive time horizon. |||||||||| |||||||| ||| ||||||| |||||| ||| |||||||| || ||||||||||
Table 21: Median OS Estimates Adjusted to Baseline From CheckMate 9ER Study, Under Weibull Distribution — Survival End Point Metaregression for Prognostic Risk NMA
Treatment | Median from trial | Median + 95% credible interval |
|---|---|---|
SUNI (CheckMate 9ER study) | ||||| |||||| || ||| | ||||| |||||| || |||||| |
CABO + NIVO (CheckMate 9ER study) | ||||| |||||| || ||| | ||||| |||||| || |||| |
IPI + NIVO (adjusted) | |||| ||||| || ||||| | ||||| ||||| || |||| |
AVE + AXI (adjusted) | || ||||| || ||| | ||||| |||||| || |||| |
PAZO (adjusted) | |||| ||| || ||||| | ||||| ||||| || |||| |
PEMBRO + AXI (adjusted) | |||| |||| | ||||| |||||| || |||| |
LEN + PEMBRO (adjusted) | || ||||| || ||| | ||||| ||||| || |||| |
AVE = avelumab; AXI = axitinib; CABO = cabozantinib; IPI = ipilimumab; LEN = lenvatinib; NA = not applicable; NE = not estimable; NIVO = nivolumab; NMA = network meta-analysis; NR = not reported; OS = overall survival; PAZO = pazopanib; PEMBRO = pembrolizumab; SUNI = sunitinib.
Source: Sponsor-submitted indirect treatment comparison.30

Note: This figure has been redacted.
||| ||||||| |||||||| |||||||||| |||||||| || ||||||||| |||||| ||||| ||||||||||| |||||| ||| |||||||| |||||| |||| ||| |||||| ||||| ||| |||||||| ||||||| ||| ||||||| |||||||| |||| |||||||||||| |||||||| || ||||||||| |||||| ||| || |||||| |||||||||| |||| |||||||| ||| |||||||| ||||| ||| |||| ||||||||| ||||||||||| |||||||||| |||| ||||||
||| ||||||| |||||||| |||||||||| |||||||| || ||||||||| |||||| ||||| ||||||||||| |
Table 22: Median OS in ITT Population, Adjusted to Baseline From CheckMate 9ER Study —Fractional Polynomial NMA
Treatment | Median from trial | Median (95% credible interval) | Fractional polynomial |
|---|---|---|---|
SUNI (CheckMate 9ER study) | ||||| ||||||| ||| | ||||| ||||||| |||||| | P = –2 |
CABO + NIVO (CheckMate 9ER study) | ||||| ||||||| ||| | ||||| ||||||| |||||| | |
IPI + NIVO (adjusted) | |||| |||||| ||||| | ||||| ||||||| |||||| | |
AVE + AXI (adjusted) | || |||||| ||| | ||||| ||||||| |||||| | |
PAZO (adjusted) | |||| |||| ||||| | |||| ||||||| |||||| | |
PEMBRO + AXI (adjusted) | |||| |||| | ||||| ||||||| |||||| | |
LEN + PEMBRO (adjusted) | || |||||| ||| | ||||| ||||||| |||||| |
AVE = avelumab; AXI = axitinib; CABO = cabozantinib; IPI = ipilimumab; ITT = intention to treat; LEN = lenvatinib; NA = not applicable; NE = not estimable; NIVO = nivolumab; NMA = network meta-analysis; NR = not reported; OS = overall survival; PAZO = pazopanib; PEMBRO = pembrolizumab; SUNI = sunitinib.
Source: Sponsor-submitted indirect treatment comparison.30
Adverse Events
Forest plots based on standard NMA for grade 3 to grade 5 TEAEs for the overall population are in Figure 10. A Bayesian fixed-effects model of OR and 95% credible intervals was used to compare between treatment group differences. In general, ||| ||||||| ||| ||||||||| |||| |||| |||||||||| |||||| ||||| ||||||||||| |||| |||||||| || |||| ||||||||||.
Critical Appraisal of Sponsor-Submitted NMA
The methods used to conduct the systematic literature review were prespecified and used appropriate criteria to search databases, select studies, extract data, and assess quality of the included studies. Selection bias was expected to be low as the literature review likely captured the relevant studies of interest and 2 reviewers independently conducted most steps, with discrepancies resolved by a third reviewer. Out of 10 eligible trials, 7 were included in the NMAs. Three trials were excluded due to lack of relevant data. The fifth trial, CABOSUN, was excluded from the ITT population analysis because it excluded patients with favourable prognostic risk status but it was included in the intermediate-risk plus poor-risk subgroup analyses. The authors noted that the NMAs may have been impacted by these exclusions.

Note: This figure has been redacted.
||| ||||||| |||||||| |||||||||| |||||||| || ||||||||| |||||| ||||| ||||||||||| |||||| ||| |||||||| |||||| |||| ||| |||||| ||||| ||| |||||||| ||||||| ||| ||||||| |||||||| |||| |||||||||||| |||||||| || ||||||||| |||||| ||| || |||||| |||||||||| |||| |||||||| ||| |||||||| ||||| ||| |||| ||||||||| ||||||||||| |||||||||| |||| ||||||
||| ||||||| |||||||| |||||||||| |||||||| || ||||||||| |||||| ||||| ||||||||||| |
In total, 5 different NMA approaches were used to generate indirect treatment comparison estimates for PFS and OS, and 1 approach was used for AEs in the overall patient population and in the subgroup analysis of patients with intermediate plus poor prognostic risk status. However, the sponsor did not provide appropriate rationale for using these approaches. For the purpose of this review, the results of the survival end point metaregression for the prognostic risk NMA, the fractional polynomial NMA, and the standard NMA for AEs were reported. The survival end point metaregression for the prognostic risk NMA attempted to address heterogeneity by including intermediate prognostic risk patients plus poor prognostic risk patients as a covariate. The fractional polynomial NMA was used to inform the pharmacoeconomic model and attempted to address the violation of the proportional hazards assumption that was identified in most trials. The standard NMA for AEs reported on safety — the only NMA approach to do so. The fifth approach (the piecewise exponential NMA) was exploratory and did not attempt to address any additional gaps in the other methods, and therefore was not reported in this review.
Based on quantitative and qualitative assessment, the exchangeability assumption was violated as there were several notable sources of heterogeneity and missing data for potential effect modifiers across the included trials, which limited the ability to assess heterogeneity across the studies in the network. Identified variables of concern included differences in patient histology, disease stage, study drug dosing, and follow-up duration. According to the clinical expert consulted by CADTH, the proportion of patients with brain metastases is also a potential effect modifier, although this was not reported across trials. These sources of heterogeneity were not explored sufficiently in any of the NMA approaches, and none addressed the violation of the exchangeability and proportional hazards assumptions collectively. Although the survival end point metaregression for the prognostic risk NMA incorporated a prognostic covariate in the NMA model (the proportion of patients with intermediate and poor prognostic risk status), its justification was not reported by the authors and it was unlikely to adequately address all the notable sources of heterogeneity. In addition, the risk of bias assessment at the individual study level and its potential impact on the NMA effect estimates at the outcome level were not explicitly assessed or discussed. In general, the magnitude and direction of potential bias due to heterogeneity and lack of proportionality on outcome estimates cannot be predicted.
All the connections within the network were limited to 1 study and comparisons of interest within the network were limited to indirect estimates only; therefore, inconsistency could not be assessed. In general, the estimates across the different NMA approaches varied with wide credible intervals, and these variations were not sufficiently addressed by the authors. Due to these limitations of the NMA approaches and uncertainty in their estimates, no definitive conclusions could be drawn on the relative treatment effects of cabozantinib plus nivolumab versus other comparators.
Studies Addressing Gaps in the Pivotal and RCT Evidence
No studies addressing gaps in the pivotal and RCT evidence were submitted by the sponsor.
Discussion
Summary of Available Evidence
One pivotal phase III, open-label RCT and 1 indirect treatment comparison submitted by the sponsor were summarized in this report.
One trial, CheckMate 9ER (N = 651), met the inclusion criteria for the systematic review conducted by the sponsor. The objectives of the CheckMate 9ER study were to evaluate the efficacy and safety of cabozantinib plus nivolumab versus sunitinib in adult patients with previously untreated aRCC with a clear cell component. Patients had any IMDC prognostic risk score and a Karnofsky Performance Status score of at least 70 (on a scale from 0 to 100, with lower scores indicating greater disability), and were randomized in a 1:1 ratio stratified by IMDC prognostic risk score, geographic region, and tumour expression of PD-L1. Eligible patients were randomized to receive cabozantinib 40 mg, taken orally once daily, plus nivolumab 240 mg IV infusion every 2 weeks or sunitinib 50 mg, taken orally once daily for 4 weeks, followed by 2 weeks off, per 6-week cycle. The primary outcome was PFS assessed by a BICR using RECIST version 1.1 criteria; secondary outcomes were OS, ORR, and safety. HRQoL measured by the FKSI-19 questionnaire and the EQ-5D-3L’s EQ VAS questionnaire was included as an exploratory outcome. Key baseline patient characteristics were generally balanced between treatment groups. The population was predominately white (82%) and male (71% to 77%), with an approximate mean age of 60 years. Most patients had a Karnofsky Performance Status score of 90 or 100 (74% to 80%), and the majority of patients (approximately 57%) had an intermediate IMDC prognostic risk score. A similar proportion of patients in both treatment groups had prior radiotherapy (14%) or nephrectomy (approximately 70%).
In the absence of direct comparative evidence of cabozantinib plus nivolumab versus relevant comparators other than sunitinib, an NMA was conducted by the sponsor. The objective of the NMA was to indirectly compare the efficacy and safety of cabozantinib plus nivolumab to other relevant comparators, including sunitinib, pazopanib, ipilimumab plus nivolumab, axitinib plus avelumab, axitinib plus pembrolizumab, and lenvatinib plus pembrolizumab, in treatment-naive patients with aRCC. Five different NMA approaches were used to estimate PFS, OS, and safety. For the purpose of this review, the results of the survival end point metaregression for the prognostic risk NMA, the fractional polynomial NMA, and the standard NMA for AEs were reported. The survival end point metaregression for the prognostic risk NMA attempted to address some sources of heterogeneity across studies in the network by including intermediate prognostic risk patients plus poor prognostic risk patients as a covariate, the fractional polynomial NMA was used to inform the pharmacoeconomic model and attempted to address the violation of the proportional hazards assumption that was identified in most trials, and the standard NMA for AEs reported on comparative safety — the only NMA approach to do so. The fifth approach (the piecewise exponential NMA) was exploratory and did not attempt to address any additional gaps in the other methods; therefore, it was not reported in this review.
Interpretation of Results
Efficacy
Evidence from the CheckMate 9ER trial supported a clinically meaningful improvement of cabozantinib plus nivolumab versus sunitinib for PFS, OS, and ORR in adults with previously untreated aRCC for the final PFS analysis (interim analysis 1). The PFS findings were consistent across the IMDC prognostic risk groups (poor, intermediate, and favourable), suggesting that cabozantinib plus nivolumab treatment was beneficial to patients in all 3 groups. These findings addressed key treatment outcomes noted by both patients and clinicians to be important. The patient group indicated that stopping disease progression and improving overall outcomes and HRQoL are important to them. The clinical expert consulted by CADTH considered the benefits of cabozantinib plus nivolumab versus sunitinib to PFS, OS, and ORR to be clinically meaningful. Descriptive assessments of HRQoL measures were consistent with these measures being maintained over the duration of the trial, with DRS improving over time from baseline with cabozantinib plus nivolumab. On the other hand, deterioration was reported with sunitinib, and at times the FKSI-19 total scores were more than the MID of 3 points. No MID for EQ-5D-3L in patients with RCC was identified in the literature. The HRQoL estimates could have been affected by bias due to the subjective nature of the outcomes and the CIs included the potential for effects that are not clinically important. The HRQoL outcomes were exploratory, and as such, this evidence cannot support firm conclusions for these end points.
Based on the sponsor-submitted indirect treatment comparison, the estimates for PFS and OS across the different NMA approaches varied with wide credible intervals; these variations were not sufficiently addressed by the authors. The authors also did not provide clear rationale for using the various NMA approaches. Based on quantitative and qualitative assessment, the exchangeability assumption was violated as there were several notable sources of heterogeneity and missing data for potential effect modifiers across the included trials. This included patient histology, disease stage, brain metastases, study drug dosing, and follow-up duration. These sources of heterogeneity were not explored sufficiently in any of the NMA approaches, and none addressed the violation of the exchangeability and proportional hazards assumptions collectively. Due to these limitations in the NMA approaches used and uncertainty in their estimates, no definitive conclusions could be drawn on the relative treatment effects of cabozantinib plus nivolumab versus other comparators.
Harms
The overall frequency of TEAEs was similar between the cabozantinib plus nivolumab and sunitinib groups in the CheckMate 9ER trial. Almost all patients experienced at least 1 TEAE in both treatment groups, with the most frequently reported TEAEs being diarrhea, palmar-plantar erythrodysesthesia, hypertension, hypothyroidism, and fatigue. A greater proportion of patients in the cabozantinib plus nivolumab group experienced diarrhea, which the clinical expert indicated is expected with a combination treatment compared to a single-drug treatment. The incidence of death was numerically lower in the cabozantinib plus nivolumab group compared with the sunitinib group; the majority of deaths in both groups were attributed to disease progression. The incidence of SAEs was numerically higher with cabozantinib plus nivolumab than sunitinib, with the most common being malignant neoplasm progression. There was a higher incidence of AEs leading to treatment discontinuation with cabozantinib plus nivolumab than with sunitinib. There are a number of serious warnings and precautions in the Health Canada product monograph of cabozantinib1 that were considered as notable harms in the CADTH review, including thrombotic events, hypertension, gastrointestinal perforations, fistulas, hemorrhage, hepatotoxicity, and wound complications. In addition, IMAEs were identified as important harms by the clinical expert consulted by CADTH. The incidence of notable harms was similar in both groups except for thrombotic events and IMAEs, which were numerically higher with cabozantinib plus nivolumab than with sunitinib. The patient group that provided input for this review highlighted that there is a need for alternative tolerable treatments. However, it is uncertain whether cabozantinib plus nivolumab is a more tolerable treatment compared to sunitinib since a higher incidence of SAEs, AEs leading to treatment discontinuation, and IMAEs was reported with cabozantinib plus nivolumab and the incidence of TEAEs between the groups was generally similar. The clinical expert indicated that the available data does not suggest cabozantinib plus nivolumab is better tolerated than existing first-line options and therefore would not be an obvious choice to deal with issues of intolerance or drug contraindication.
Due to the limitations in the sponsor-submitted indirect treatment comparison, no definitive conclusions could be drawn on the relative safety of cabozantinib plus nivolumab versus other comparators.
Conclusion
Evidence from 1 phase III, open-label RCT showed that treatment with cabozantinib plus nivolumab resulted in clinically important improvements in PFS, OS, and ORR compared to sunitinib in adults with previously untreated aRCC. These results addressed key treatment outcomes noted by both patients and clinicians as important. For HRQoL, no definitive conclusions can be drawn due to the exploratory nature of the outcomes and open-label design of the trial. Due to limitations of the indirect treatment comparisons, no conclusions can be drawn on the relative efficacy and safety of cabozantinib plus nivolumab compared to other treatments.
References
1.Cabometyx (cabozantinib): 20 mg, 40 mg, 60 mg oral tablets [product monograph]. Mississauga (ON): Ipsen Biopharmaceuticals Canada Inc; 2022 Sep 14.
2.Bukavina L, Bensalah K, Bray F, et al. Epidemiology of renal cell carcinoma: 2022 update. Eur Urol. 2022;82(5):529-542. PubMed
3.Drug Reimbursement Review clinical guidance report: pembrolizumab (Keytruda) for renal cell carcinoma. Ottawa (ON): CADTH; 2020 Apr 2: https://www.cadth.ca/sites/default/files/pcodr/Reviews2020/10185PembrolizumabRCC_fnCGR_REDACT_Post02Apr2020_final.pdf. Accessed 2023 May 9.
4.NCCN clinical practice guidelines in oncology (NCCN guidelines): kidney cancer version 1.2023 - January 18, 2023. Plymouth Meeting (PA): National Comprehensive Cancer Network; 2021: https://www.nccn.org. Accessed 2023 May 9.
5.Flanigan RC, Campbell SC, Clark JI, Picken MM. Metastatic renal cell carcinoma. Curr Treat Options Oncol. 2003;4(5):385-390. PubMed
6.Escudier B, Porta C, Schmidinger M, et al. Renal cell carcinoma: ESMO clinical practice guidelines for diagnosis, treatment and follow-up†. Ann Oncol. 2019;30(5):706-720. PubMed
7.Cella D. Beyond traditional outcomes: improving quality of life in patients with renal cell carcinoma. Oncologist. 2011;16 Suppl 2(Suppl 2):23-31.
8.Song XD, Tian YN, Li H, Liu B, Zhang AL, Hong Y. Research progress on advanced renal cell carcinoma. J Int Med Res. 2020;48(6):300060520924265. PubMed
9.Canil C, Kapoor A, Basappa NS, et al. Management of advanced kidney cancer: Kidney Cancer Research Network of Canada (KCRNC) consensus update 2021. Can Urol Assoc J. 2021;15(4):84-97. PubMed
10.Heng DY, Xie W, Regan MM, et al. External validation and comparison with other models of the International Metastatic Renal-Cell Carcinoma Database Consortium prognostic model: a population-based study. Lancet Oncol. 2013;14(2):141-148. PubMed
11.Cella D, Motzer RJ, Rini BI, et al. Important group differences on the Functional Assessment of Cancer Therapy-Kidney Symptom Index Disease-Related Symptoms in patients with metastatic renal cell carcinoma. Value Health. 2018;21(12):1413-1418. PubMed
12.Pickard AS, Neary MP, Cella D. Estimation of minimally important differences in EQ-5D utility and VAS scores in cancer. Health Qual Life Outcomes. 2007;5(1):70. PubMed
13.Clinical Study Report: CA2099ER. A phase 3, randomized, open-Label study of nivolumab combined with cabozantinib versus sunitinib in participants with previously untreated advanced or metastatic renal cell carcinoma [internal sponsor's report]. Lawrence Township (NJ): Bristol Myers Squibb; 2020 Aug 7.
14.Canadian Cancer Society. Canadian cancer statistics. 2022; https://cancer.ca/en/cancer-information/cancer-types/kidney/statistics. Accessed 2023 May 9.
15.Gray RE, Harris GT. Renal cell carcinoma: diagnosis and management. Am Fam Physician. 2019;99(3):179-184. PubMed
16.Opdivo (nivolumab): 10 mg/mL, 40 mg and 100 mg, intravenous infusion [product monograph]. Montreal (QC): Bristol-Myers Squibb Canada Co: https://pdf.hres.ca/dpd_pm/00050129.PDF. Accessed 2019 May 19.
17.Auro-Sunitinib (sunitinib): 12.5 mg, 25 mg, 37.5 mg, 50 mg capsules [product monograph]. Woodbridge (ON): Auro Pharma Inc; 2022 Oct 24: https://pdf.hres.ca/dpd_pm/00068298.PDF. Accessed 2023 May 29.
18.Pazopanib (pazopanib): 200 mg oral tablets [product monograph]. Montreal (QC): Pharmascience Inc; 2022 Mar 1: https://pdf.hres.ca/dpd_pm/00064903.PDF. Accessed 2023 May 29.
19.Keytruda (pembrolizumab): 100 mg/4 mL vial solution for infusion [product monograph]. Kirkland (QC): Merck Canada Inc; 2023 Apr 19: https://pdf.hres.ca/dpd_pm/00070462.PDF. Accessed 2023 May 29.
20.Inlyta (axitinib): 1 mg, 3 mg, 5 mg and 7 mg oral tablets [product monograph]. Kirkland (QC): Pfizer Products ULC; 2021 Sep 28: https://pdf.hres.ca/dpd_pm/00063084.PDF. Accessed 2023 May 29.
21.Lenvima (levantinib): 4 mg and 10 mg capsules [product monograph]. Mississauga (ON): Eisai Limited; 2022 May 31: https://pdf.hres.ca/dpd_pm/00066254.PDF. Accessed 2023 May 29.
22.Yervoy (ipilimumab): 5 mg ipilimumab / mL 10 mL and 40 mL vials intravenous infusion [product monograph]. Montreal (QC): Bristol-Myers Squibb Canada Co; 2022 Nov 24: https://pdf.hres.ca/dpd_pm/00068433.PDF. Accessed 2023 May 29.
23.Choueiri TK, Powles T, Burotto M, et al. Nivolumab plus cabozantinib versus sunitinib for advanced renal-cell carcinoma. N Engl J Med. 2021;384(9):829-841. PubMed
24.Motzer RJ, Powles T, Burotto M, et al. Nivolumab plus cabozantinib versus sunitinib in first-line treatment for advanced renal cell carcinoma (CheckMate 9ER): long-term follow-up results from an open-label, randomised, phase 3 trial. Lancet Oncol. 2022;23(7):888-898. PubMed
25.Cella D, Motzer RJ, Suarez C, et al. Patient-reported outcomes with first-line nivolumab plus cabozantinib versus sunitinib in patients with advanced renal cell carcinoma treated in CheckMate 9ER: an open-label, randomised, phase 3 trial. Lancet Oncol. 2022;23(2):292-303. PubMed
26.Rothrock NE, Jensen SE, Beaumont JL, et al. Development and initial validation of the NCCN/FACT symptom index for advanced kidney cancer. Value Health. 2013;16(5):789-796. PubMed
27.Rao D, Butt Z, Rosenbloom S, et al. A comparison of the Renal Cell Carcinoma–symptom Index (RCC-SI) and the Functional Assessment of Cancer Therapy–Kidney Symptom Index (FKSI). J Pain Symptom Manage. 2009;38(2):291-298. PubMed
28.EuroQol--a new facility for the measurement of health-related quality of life. Health Policy. 1990;16(3):199-208. PubMed
29.Clinical Study Report: CA2099ER-OS Addendum. A phase 3, randomized, open-label study of nivolumab combined with cabozantinib versus sunitinib in participants with previously untreated advanced or metastatic renal cell carcinoma [internal sponsor's report]. Vol Lawrence Township (NJ): Bristol-Myers Squibb; 2021 Oct 7.
30.Efficacy and adverse events of cabozantinib in combination with nivolumab versus available treatment optionsin first line treatment of advanced or metastatic renal cell carcinoma: a systematic literature review and network meta-analysis [internal sponsor's report]. In: Drug Reimbursement Review sponsor submission: Cabometyx (cabozantinib); 40 mg oral tablets. Mississauga (ON): Ipsen Biopharmaceuticals Canada Inc.; 2023 Feb 14.
31.Bergmann L, Grünwald V, Maute L, et al. A randomized phase IIa trial with temsirolimus versus sunitinib in advanced non-clear cell renal cell carcinoma: an intergroup study of the CESAR Central European Society for Anticancer Drug Research-EWIV and the Interdisciplinary Working Group on Renal Cell Cancer (IAGN) of the German Cancer Society. Oncol Res Treat. 2020;43(7-8):333-339. PubMed
32.Escudier B, Porta C, Bono P, et al. Randomized, controlled, double-blind, cross-over trial assessing treatment preference for pazopanib versus sunitinib in patients with metastatic renal cell carcinoma: PISCES Study. J Clin Oncol. 2014;32(14):1412-1418. PubMed
33.Vano YA, Elaidi RT, Bennamoun M, et al. LBA25 Results from the phase II biomarker driven trial with nivolumab (N) and ipilimumab or VEGFR tyrosine kinase inhibitor (TKI) in naïve metastatic kidney cancer (m-ccRCC) patients (pts): the BIONIKK trial. Ann Oncol. 2020;31(Suppl 4):S1157.
34.Motzer R, Alekseev B, Rha SY, et al. Lenvatinib plus pembrolizumab or everolimus for advanced renal cell carcinoma. N Engl J Med. 2021;384(14):1289-1300. PubMed
35.Albiges L, Tannir NM, Burotto M, et al. Nivolumab plus ipilimumab versus sunitinib for first-line treatment of advanced renal cell carcinoma: extended 4-year follow-up of the phase III CheckMate 214 trial. ESMO Open. 2020;5(6):e001079. PubMed
36.Motzer RJ, Hutson TE, Cella D, et al. Pazopanib versus sunitinib in metastatic renal-cell carcinoma. N Engl J Med. 2013;369(8):722-731. PubMed
37.Choueiri TK, Motzer RJ, Rini BI, et al. Updated efficacy results from the JAVELIN Renal 101 trial: first-line avelumab plus axitinib versus sunitinib in patients with advanced renal cell carcinoma. Ann Oncol. 2020;31(8):1030-1039. PubMed
38.Powles T, Plimack ER, Soulières D, et al. Pembrolizumab plus axitinib versus sunitinib monotherapy as first-line treatment of advanced renal cell carcinoma (KEYNOTE-426): extended follow-up from a randomised, open-label, phase 3 trial. Lancet Oncol. 2020;21(12):1563-1573. PubMed
39.Rini BI, Plimack ER, Stus V, et al. Pembrolizumab plus axitinib versus sunitinib for advanced renal-cell carcinoma. N Engl J Med. 2019;380(12):1116-1127. PubMed
40.Sheng X, Jin J, He Z, et al. Pazopanib versus sunitinib in Chinese patients with locally advanced or metastatic renal cell carcinoma: pooled subgroup analysis from the randomized, COMPARZ studies. BMC Cancer. 2020;20(1):219. PubMed
41.Choueiri TK, Hessel C, Halabi S, et al. Cabozantinib versus sunitinib as initial therapy for metastatic renal cell carcinoma of intermediate or poor risk (Alliance A031203 CABOSUN randomised trial): progression-free survival by independent review and overall survival update. Eur J Cancer. 2018;94:115-125. PubMed
Pharmacoeconomic Review
Abbreviations
AE
adverse event
BIA
budget impact analysis
CUA
cost-utility analysis
ICER
incremental cost-effectiveness ratio
IMDC
International mRCC [Metastatic Renal Cell Carcinoma] Database Consortium
KCC
Kidney Cancer Canada
KCRNC
Kidney Cancer Research Network of Canada
NIHB
Non-Insured Health Benefits
NMA
network meta-analysis
ODB EAP
Ontario Drug Benefit Exceptional Access Program
OS
overall survival
PFS
progression-free survival
PSM
partitioned survival model
QALY
quality-adjusted life-year
RCC
renal cell carcinoma
RDI
relative dose intensity
TTD
time to treatment discontinuation
Executive Summary
The executive summary comprises 2 tables (Table 1 and Table 2) and a conclusion.
Item | Description |
|---|---|
Drug product | Cabozantinib (Cabometyx), oral tablets |
Submitted price | Cabozantinib, 20 mg, 40 mg, and 60 mg: $301.29 per tablet |
Indication | Cabozantinib, in combination with nivolumab, is indicated for the first-line treatment of adult patients with advanced (not amenable to curative surgery or radiation therapy) or metastatic RCC. |
Health Canada approval status | NOC |
Health Canada review pathway | Standard |
NOC date | October 12, 2021 |
Reimbursement request | As per indication |
Sponsor | Ipsen Biopharmaceuticals Canada Inc. |
Submission history | Previously reviewed: State — Yes Indication: Differentiated thyroid carcinoma Recommendation date: November 17, 2022 Recommendation: Reimburse with clinical criteria and/or conditions Indication: Hepatocellular carcinoma Recommendation date: April 22, 2020 Recommendation: Reimburse with clinical criteria and/or conditions Indication: RCC Recommendation date: February 20, 2019 Recommendation: Reimburse with clinical criteria and/or conditions |
NOC = Notice of Compliance; RCC = renal cell carcinoma.
Table 2: Summary of Economic Evaluation
Component | Description |
|---|---|
Type of economic evaluation | Cost-utility analysis Partitioned survival model |
Target populations | Base case: Adult patients with advanced (not amenable to curative surgery or radiation therapy) or metastatic RCC who have not been previously treated (i.e., no restriction by IMDC risk) Key scenario (intermediate or poor risk): Adult patients with advanced (not amenable to curative surgery or radiation therapy) or metastatic RCC with intermediate-risk or poor-risk disease (according to IMDC) who have not been previously treated |
Treatment | CABO in combination with NIVO |
Comparators | Base case: Sunitinib, AXI + PEM, LEN + PEM, pazopanib Intermediate-risk or poor-risk scenario: IPI + NIVO, AXI + PEM |
Perspective | Canadian publicly funded health care payer |
Outcomes | QALYs and LYs |
Time horizon | Lifetime (45 years) |
Key data source | CheckMate 9ER trial (CABO + NIVO vs. sunitinib) Sponsor conducted an NMA used to inform comparison with rest of comparators |
Submitted results | Base case: CABO + NIVO is dominated by AXI + PEM (i.e., CABO + NIVO associated with greater costs and fewer QALYs). Pazopanib and LEN + PEM are on the cost-effectiveness efficiency frontier. Intermediate-risk or poor-risk scenario: ICER for CABO + NIVO — $103,041 per QALY gained vs. IPI + NIVO (incremental costs = $13.597; incremental QALYs = 0.132). Both regimens were dominated by AXI + PEM (i.e., greater costs and fewer QALYs) |
Key limitations |
|
CADTH reanalysis results |
|
AXI = axitinib; CABO = cabozantinib; ICER = incremental cost-effectiveness ratio; IMDC = international mRCC [Metastatic Renal Cell Carcinoma] Database Consortium; IPI = ipilimumab; LEN = lenvatinib; LY = life-year; NIVO = nivolumab; NMA = network meta-analysis; OS = overall survival; PEM = pembrolizumab; PFS = progression-free survival; QALY = quality-adjusted life-year; RCC = renal cell carcinoma; RDI = relative dose intensity, vs. = versus.
Conclusions
The CADTH clinical review found that based on evidence from 1 phase III, open-label, randomized controlled trial, cabozantinib plus nivolumab was associated with clinically important improvements in progression-free survival (PFS), overall survival (OS), and objective response rate in comparison with sunitinib in adult patients with previously untreated advanced renal cell carcinoma (RCC). However, definitive conclusions could not be drawn from the sponsor’s network meta-analysis (NMA), which was used to inform the comparative effectiveness of cabozantinib plus nivolumab with the other comparators in the submitted economic model (i.e., lenvatinib plus pembrolizumab, axitinib plus pembrolizumab, ipilimumab plus nivolumab, and pazopanib). There were sources of uncertainty that were not explored sufficiently in the NMA. As a result, it is uncertain whether cabozantinib plus nivolumab is more or less effective than other combination therapies for the treatment of advanced RCC.
CADTH undertook reanalyses that included the following changes to address key limitations where possible: the use of a time horizon better aligned with the life expectancy of the target population, revisions to subsequent treatment regimens so that they were better aligned with the current standard of care, updated drug prices for some of the comparator therapies, revisions to assumptions related to relative dose intensity (RDI), and the consideration of drug wastage.
In the CADTH base case, for the proposed Health Canada indicated population regardless of international mRCC [Metastatic Renal Cell Carcinoma] Database Consortium (IMDC) risk score, results were similar to those reported by the sponsor: cabozantinib plus nivolumab is associated with greater total costs and fewer quality-adjusted life-years (QALYs) compared with lenvatinib plus pembrolizumab (i.e., cabozantinib plus nivolumab is dominated) and does not represent a cost-effective treatment option (i.e., does not appear on the cost-effectiveness efficiency frontier). When compared with axitinib plus pembrolizumab and lenvatinib plus pembrolizumab — the most relevant comparators — a price reduction on cabozantinib of at least 35% is required for cabozantinib plus nivolumab to be the most cost-effective treatment option at a $50,000 per QALY gained threshold. When considering all relevant comparators, including single-drug regimens, a price reduction for nivolumab would also be needed, as a 100% price reduction on cabozantinib will not lead to an incremental cost-effectiveness ratio (ICER) below a $50,000 per QALY gained threshold.
Similar results were observed when considering a scenario specific to the intermediate-prognosis or poor-prognosis population. This included ipilimumab plus nivolumab as a comparator, with cabozantinib plus nivolumab dominated by axitinib plus pembrolizumab and not appearing on the cost-effectiveness efficiency frontier.
CADTH was unable to address limitations with the model regarding some of the sponsor’s assumptions around ad hoc estimates of parameter uncertainty, or the use of the partitioned survival model (PSM) modelling approach that does not consider the interdependence of OS and PFS curves. CADTH noted that despite this uncertainty, at present there is no evidence to support a price premium for cabozantinib plus nivolumab over other combination therapies for the treatment of advanced RCC.
Stakeholder Input Relevant to the Economic Review
This section is a summary of the feedback received from the patient groups, registered clinicians, and drug plans that participated in the CADTH review process.
One patient group, Kidney Cancer Canada (KCC), provided input for this review. KCC reported that as cabozantinib plus nivolumab has not yet been available to patients living in Canada through clinical trials or patient support plans, they were unable to gather information from patients living in Canada with experience on this therapy. Some of the submission was informed by the International Kidney Cancer Coalition Global Survey 2022, which included 2,213 respondents. A total of 139 respondents were from Canada, of whom 111 were kidney cancer patients and 28 were caregivers. KCC reported that while kidney cancer survival has improved in recent years as a result of new treatments, survival is still poor in those patients with stage IV disease. The group emphasized the importance of new treatments to improve overall outcomes, halt disease progression, overcome drug resistance mechanisms, and individualize treatment plans according to treatment history, contraindications, and intolerances to improve outcomes and quality of life. KCC also noted that cabozantinib plus nivolumab appears to fill an unmet need regarding papillary RCC and that cabozantinib appears to be of specific benefit to patients with brain metastases. One caregiver of a patient with stage IV papillary RCC emphasized the challenge and substantial expense of accessing cabozantinib plus nivolumab privately and the lack of funded second-line options if that route was chosen.
Input was received from 2 clinician groups, the Ontario Health (Cancer Care Ontario) Genitourinary Cancer Drug Advisory Committee and the Kidney Cancer Research Network of Canada (KCRNC). The KCRNC highlighted the importance of the doublet regimens for advanced or metastatic RCC, including axitinib plus pembrolizumab, lenvatinib plus pembrolizumab, cabozantinib plus nivolumab (currently under review and not yet available), and ipilimumab plus nivolumab (for the poor-risk or intermediate-risk category only). The Ontario Health (Cancer Care Ontario) Genitourinary Cancer Drug Advisory Committee also noted these regimens, as well as the single drugs sunitinib and pazopanib. Both groups specified the need to broaden the treatment paradigm of a vascular endothelial growth factor receptor tyrosine kinase inhibitor and PD-1 inhibitor and emphasized the need for treatments available across all IMDC risk categories. Like the patient group, KCRNC noted cabozantinib’s activity against brain metastases.
Drug plan input noted that currently funded first-line options for this patient population include pembrolizumab plus axitinib, ipilimumab plus nivolumab (for the intermediate-risk or poor-risk category), and the single-drug pazopanib or sunitinib, with pembrolizumab plus lenvatinib currently undergoing pricing negotiations at the time of this review. The drug plans noted that should nivolumab be funded in this regimen, jurisdictions will implement weight-based dosing up to a cap for nivolumab of 3 mg/kg up to 240 mg every 2 weeks or 6 mg/kg up to 480 mg every 4 weeks, similar to other immunotherapy policies.
Several of these concerns were addressed in the sponsor’s model:
The sponsor included all identified treatment options as comparators within the model.
The sponsor-submitted model considered disease progression, survival, and adverse events (AEs) related to treatment.
Economic Review
The current review is for cabozantinib (Cabometyx) in combination with nivolumab for the first-line treatment of adult patients with advanced (not amenable to curative surgery or radiation therapy) or metastatic RCC.
Economic Evaluation
Summary of Sponsor’s Economic Evaluation
Overview
The sponsor submitted a cost-utility analysis (CUA) of cabozantinib plus nivolumab compared with sunitinib, axitinib in combination with pembrolizumab, lenvatinib in combination with pembrolizumab, and pazopanib.1 The model population comprised adult patients with advanced (not amenable to curative surgery or radiation therapy) or metastatic RCC who were previously untreated. The sponsor’s base case was in the overall population that considered all patients regardless of IMDC risk status and was aligned with the proposed Health Canada indication. The sponsor also conducted a key scenario analysis in adult patients who are intermediate or poor risk according to their IMDC risk score, where cabozantinib plus nivolumab was compared with nivolumab in combination with ipilimumab, and axitinib plus pembrolizumab.
Cabozantinib is available as 20 mg, 40 mg, and 60 mg oral tablets. The recommended dose of cabozantinib is 40 mg once daily, plus 240 mg of nivolumab intravenously every 2 weeks for a maximum period of 24 months.2 At the sponsor’s submitted price of $301.29 per 40 mg dose, the cost per 28-day cycle of cabozantinib is $8,436. Based on public list prices, the cost of nivolumab per 28-day cycle is $9,327. Together, the total 28-day cycle cost for cabozantinib plus nivolumab is $17,823. The 28-day cycle costs for the comparators are $17,364 for axitinib plus pembrolizumab, $15,949 for lenvatinib plus pembrolizumab, $21,724 for ipilimumab plus nivolumab, $4,133 for sunitinib, and $3,468 for pazopanib.
The clinical outcomes of interest were QALYs and life-years. The economic analysis was undertaken over a lifetime (45-year) time horizon from the perspective of a Canadian public health care payer. Discounting (1.5% per annum) was applied to both costs and outcomes.
Model Structure
The sponsor submitted a PSM with 3 health states: preprogression survival, postprogression survival, and death (Figure 1).1 In both of the alive health states, patients could be on treatment or off treatment based on time to treatment discontinuation (TTD) curves. All patients entered the progression-free state and remained there until disease progression or death. The proportion of patients expected to have disease progression was determined by calculating the difference between the OS and PFS curves. The proportion of people with progression-free and progressed disease for all other comparators was determined by fitting NMAs with fractional polynomials on the PFS and OS digitized data from multiple trials.
The sponsor considered 2 populations through 2 analyses: a primary analysis of the overall population that considered all patients regardless of IMDC risk status, and a key scenario analysis of patients categorized by IMDC criteria as intermediate or poor risk.
Model Inputs
The model’s baseline population characteristics were informed by the CheckMate 9ER study, a phase III, randomized, open-label study of cabozantinib plus nivolumab versus sunitinib in patients with previously untreated advanced or metastatic RCC.3
Given that direct comparative evidence was only available for cabozantinib plus nivolumab in comparison with sunitinib, OS and PFS in the sponsor’s base case were informed by a systematic literature review and NMA.4 The objective of the NMA was to indirectly compare OS and PFS for all comparators with cabozantinib plus nivolumab, and it was informed by data from the CheckMate 9ER study, as well as trials identified in the literature that assessed sunitinib, pazopanib, axitinib plus pembrolizumab, lenvatinib plus pembrolizumab, and ipilimumab plus nivolumab. To inform its base case, the sponsor conducted a Bayesian fractional polynomial NMA, with first order and second order fractional polynomials assessed. This approach was chosen as it does not rely on the proportional hazards assumption being met. Several different parameterizations were assessed. The model chosen to inform the base case for PFS and OS was determined based on both statistical fit (via deviance information criteria) and long-term clinical plausibility. The sponsor’s submission included several other approaches to modelling comparative PFS and OS that could be tested in scenario analyses.
In the sponsor’s base case, due to the lack of treatment duration data for comparators identified through the systematic literature review, it was assumed that the proportional relationship between PFS and treatment duration was constant over time and PFS curves were used as a proxy for treatment duration. The model also included AEs reported in 5% or more of patients in the CheckMate 9ER trial. For the comparators, the AEs and rates described in the published trials were included in the model.
Health state utility values were derived from the CheckMate 9ER trial using the 3-Level EQ-5D questionnaire without a specified tariff; the values were applied to all patients independent of their treatment (0.8467 for the preprogression state and 0.8235 for the postprogression state).3 Disutilities associated with AEs were derived for all comparators from the CheckMate 9ER trial by multiplying the disutility for the AE by the rate and duration of the AE. The model also age-adjusted health state utility values.
Costs in the model included the costs of treatment acquisition, administration, disease management, subsequent therapies, AE management, and end-of-life costs. No wastage of drugs was assumed in the base-case analyses. To estimate the first-line treatment cost per cycle, the sponsor multiplied the cost per administration with the number of monthly administrations. First-line drug acquisition costs were applied based on the proportion of patients remaining on treatment in the preprogression health state. In the case of cabozantinib plus nivolumab, sunitinib, and pazopanib, all 3 treatment regimens were adjusted by an RDI from their respective relevant trials. All other comparators were assumed to have an RDI of 100%. The distribution of patients across subsequent therapies according to their first-line treatment was informed by multiple clinical trials.5-9
Health care resource use costs included medical oncology visits, blood tests, and CT scans, with visit frequencies depending on whether patients were in the progression-free or postprogression health states. Unit costs for oncology visits and CT scans were based on the Ontario Schedule of Benefits: Physician Services Under the Health Insurance Act,10 and blood test costs were based on the Ontario Schedule of Benefits for Laboratory Services.11 A 1-off mortality cost based on an Ontario end-of-life resource use study was applied.12 Management strategies and health care resource use for AEs were obtained from the published literature, as well as from surveying 3 Canadian kidney cancer oncologists.1
Summary of Sponsor’s Economic Evaluation Results
All analyses were run probabilistically (5,000 iterations for the base case and 1,000 iterations indicated for scenario analyses). The deterministic results and probabilistic results were similar. The probabilistic findings are presented subsequently.
Base-Case Results
In the overall population, cabozantinib plus nivolumab was not on the cost-effectiveness efficiency frontier, as it was more costly and less effective than axitinib plus pembrolizumab and was thus dominated (Table 3). Pazopanib and lenvatinib plus pembrolizumab appeared on the cost-effectiveness efficiency frontier. The majority of QALYs with cabozantinib plus nivolumab was experienced postprogression (57%). Drug acquisition costs accounted for the majority of the total costs for all comparators but were highest among cabozantinib plus nivolumab and lenvatinib plus pembrolizumab (87% and 88% of total costs, respectively). Subsequent treatment costs were the second largest source of total costs. Disaggregate results of the sponsor’s base case, including life-years, are reported in Table 11.
Table 3: Summary of the Sponsor’s Economic Evaluation Results — Whole Population
Treatments | Total costs ($) | Total QALYs | Sequential ICER ($/QALY) |
|---|---|---|---|
Pazopanib | 100,210 | 3.26 | Reference |
Lenvatinib + pembrolizumab | 418,209 | 4.50 | 256,658 |
Treatments ruled out by dominance or extended dominance | |||
Sunitinib | 129,440 | 3.15 | Dominated by pazopanib |
Axitinib + pembrolizumab | 365,761 | 4.28 | Subject to extended dominance via pazopanib and lenvatinib + pembrolizumab |
Cabozantinib + nivolumab | 415,161 | 4.26 | Dominated by axitinib + pembrolizumab |
ICER = incremental cost-effectiveness ratio; QALY = quality-adjusted life-year.
Note: An intervention is dominated when it is more costly and less effective than at least 1 other intervention. Extended dominance occurs when the ICER for a given intervention compared with a lower-cost alternative is higher than the ICER for a higher-cost intervention with the same lower-cost alternative.
Source: Sponsor’s pharmacoeconomic submission.1
In the key scenario analysis of the population categorized as intermediate or poor risk, cabozantinib plus nivolumab was associated with a QALY gain of 0.132 at an additional cost of $13,597 in comparison with ipilimumab plus nivolumab, resulting in an ICER of $103,041 per QALY gained (Table 4). Drug acquisition costs accounted for the majority of total costs in both cabozantinib plus nivolumab and ipilimumab plus nivolumab (88% and 86%, respectively). The sponsor noted that when axitinib plus pembrolizumab was considered as a comparator, cabozantinib plus nivolumab was dominated by axitinib plus pembrolizumab (Table 12). In a sequential analysis considering all 3 treatment options, cabozantinib plus nivolumab and ipilimumab plus nivolumab are dominated by axitinib plus pembrolizumab.
Table 4: Summary of the Sponsor’s Economic Evaluation Results — Intermediate or Poor Risk
Treatments | Total costs ($) | Incremental costs ($) | Total QALYs | Incremental QALYs | ICER vs. reference ($/QALY) |
|---|---|---|---|---|---|
Ipilimumab + nivolumab | 403,645 | Reference | 3.78 | Reference | Reference |
Cabozantinib + nivolumab | 417,242 | $13,597 | 3.91 | 0.13 | $103,041 |
ICER = incremental cost-effectiveness ratio; QALY = quality-adjusted life-year; vs. = versus.
Source: Sponsor’s pharmacoeconomic submission.1
Sensitivity and Scenario Analysis Results
The sponsor assessed several model parameters in deterministic sensitivity analysis and probabilistic scenario analyses. However, in the absence of both sequential cost-effectiveness analysis results and disaggregated results (costs and QALYs per treatment), CADTH was unable to present the appropriate ICERs. Only pairwise results (i.e., cabozantinib plus nivolumab in comparison with each comparator individually) were presented. From these analyses, the sponsor concluded that the choice of efficacy data had a substantial impact on results, whereas treatment duration and drug wastage assumptions only had a modest impact.
CADTH Appraisal of the Sponsor’s Economic Evaluation
CADTH identified several key limitations to the sponsor’s analysis that have notable implications for the economic analysis.
High degree of uncertainty surrounding comparative effectiveness of cabozantinib plus nivolumab with relevant comparators: The comparative effectiveness of therapies in the economic analysis submitted by the sponsor relied on a fractional polynomial NMA for PFS and OS estimates, given that there was only direct comparative evidence for cabozantinib plus nivolumab in comparison with sunitinib. The CADTH clinical review noted that due to limitations with the submitted NMA, which included a violation of the exchangeability assumption due to notable sources of heterogeneity and an assessment of risk of bias at the individual study level on effect estimates that was not explicitly assessed or discussed, no conclusions could be drawn on the relative efficacy and safety of cabozantinib plus nivolumab compared to other active treatments besides sunitinib. The NMA was noted to be associated with uncertainty. Given the small relative differences between therapies suggested by the NMA, the choice of parametric assumptions derived from the NMA had a large effect on the mean incremental QALYs and incremental costs between therapies. Hence, the model results were very sensitive around the NMA assumptions and the magnitude of benefit of cabozantinib plus nivolumab against other combination therapies such as lenvatinib plus pembrolizumab was considered highly uncertain. CADTH also noted that this conclusion is applicable to the intermediate-risk or poor-risk subpopulation; however, it is noted that the NMA in this population that informed the economic evaluation also excluded lenvatinib plus pembrolizumab as a comparator, which led to its exclusion from this scenario analysis despite being a relevant comparator. The clinical expert consulted by CADTH advised that cabozantinib plus nivolumab and other combinations of immunotherapy and vascular endothelial growth factor receptor tyrosine kinase inhibitor (i.e., lenvatinib plus pembrolizumab and axitinib plus pembrolizumab) are expected to have comparable effectiveness with regard to PFS and OS.
CADTH conducted scenario analyses where the second-best fitting fractional polynomial NMA was used for OS and PFS as an illustration of the amount of uncertainty observed based on alternative NMA assumptions.
Time horizon in the model was longer than real-world life expectancy for the target population: The modelled time horizon for an economic evaluation should be long enough to capture all relevant differences in future costs and outcomes associated with the intervention. The sponsor assumed an unrealistic length of time for the submitted model’s time horizon. In the sponsor’s base case, a 45-year time horizon was assumed, implying that there is a plausible scenario in which some patients will survive another 45 years postdiagnosis. The clinical expert consulted by CADTH for this review indicated that the vast majority of patients will not survive more than 10 years postdiagnosis. This assumption produced unrealistic estimates of life-years and QALYs in the sponsor’s base case with longer life-year and QALY gains than expected.
In the CADTH base case, the model time horizon is restricted to 10 years, to align with expert feedback regarding the life expectancy of the target patient population in the real world.
Structural uncertainty due to the use of a PSM: The sponsor used a PSM to calculate long-term costs and outcomes for each treatment. Although the PSM approach is commonly used in health technology assessments of oncology treatments, the model did not explicitly consider the relationship between PFS and OS, nor did it explicitly model progression and subsequent treatments; this could lead to inaccurate estimates of the long-term treatment effect of the modelled intervention.
CADTH was unable to assess the concerns identified with this limitation. It is also unclear what the magnitude and direction of bias associated with this methodological decision is.
Subsequent treatment regimen not reflective of current standard of care: In the sponsor’s model, the distribution of second-line therapy received originated from various sources in the literature that are likely temporally confounded or do not adequately reflect the Canadian landscape. In the sponsor’s base case, many subsequent therapies were considered after first-line advanced or metastatic RCC treatment that do not align with the current provisional funding algorithm.13 According to the clinical expert consulted by CADTH for this review, in Canadian clinical practice, second-line therapy is better reflected by the distribution of therapies provided in Table 14. This led to estimates of subsequent therapy costs that likely do not align with expectation in Canadian practice.
In the CADTH base case, the subsequent lines of therapy were modified to align with clinical expert feedback regarding Canadian clinical practice. The modifications are presented in Table 14.
Incorporation of an RDI is inappropriate: The sponsor’s base case incorporated an RDI of less than 100% for cabozantinib, nivolumab, sunitinib, and pazopanib, whereas the RDI for IV medications was assumed to be 100%. A reduction in RDI can be derived from a delayed dose, a missed dose, or a reduction in dose. The sponsor’s modelling approach only considers the impact of RDI on costs, rather than its impact on efficacy as well. In addition, the sponsor has assumed a 100% RDI for most of the combination comparators in the absence of data, whereas there is no evidence suggesting why cabozantinib plus nivolumab should have a different RDI in comparison with these other regimens. The sponsor’s assumption is expected to have underestimated the costs associated with cabozantinib plus nivolumab therapy in comparison with comparators such as axitinib plus pembrolizumab, lenvatinib plus pembrolizumab, and ipilimumab plus nivolumab.
CADTH revised the RDI for all comparators to be 100% in its reanalysis.
Failure to include drug wastage for IV-delivered therapies in the economic model: Drug wastage was not incorporated into the sponsor’s base case. However, given that some of the therapies considered in the model are delivered according to weight-based dosing and provided in single-use vials, some wastage is expected.
CADTH revised the base case to include the assumption of no vial sharing for IV-delivered therapies.
Less expensive lenvatinib pricing available and updates to comparator drug list prices: The sponsor assumed the price of lenvatinib should be based on the price of a blister pack containing 2 10 mg capsules. While the Ontario Drug Benefit Exceptional Access Program (ODB EAP) list price for blister packs containing a 20 mg daily dose of lenvatinib (consisting of 2 10 mg capsules each) was listed at $175.41 per 20 mg as of May 2023, blister packs containing a 10 mg daily dose (one 10 mg capsule each) have a list price of $75.28 per 10 mg, equivalent to $150.56 per 20 mg.14,15 Should patients receive 2 10 mg blister packs daily rather than 1 20 mg pack, the cost of treatment with lenvatinib would be $24.86 less expensive per day with lenvatinib plus pembrolizumab. As a result, the costs associated with lenvatinib in the model may have been overestimated.
Additionally, updated publicly available list prices were identified for other comparators as of May 2023, including for axitinib (sponsor base case = $99.46 for 5 mg; CADTH base case = $102.54 for 5 mg), pazopanib (sponsor base case = $36.43 for 200 mg; CADTH base case = $30.97 for 200 mg), and sunitinib (sponsor base case = $257.66 for 50 mg; CADTH base case = $221.42 for 50 mg).
In the CADTH base case, the price of lenvatinib was replaced with the price that corresponds to that of 2 10 mg capsules, and the revised public list prices for axitinib, pazopanib, and sunitinib were applied.
TTD not aligned with time to progression: The sponsor assumed in the base-case analysis that therapy ends when progression or death occurs. However, the clinical expert consulted by CADTH advised that therapy in this population is likely to continue postprogression if progression is slow and the patient tolerates the therapy. In addition, recent evidence from the CheckMate 9ER trial suggested that the median time to next therapy or death was 20.6 months versus 16.6 months for median progression or death.16
CADTH assessed the impact that an assumption of longer TTD would have on the results of CADTH’s base-case analysis by performing a scenario analysis where all therapies’ median TTD was extended by a factor of 1.24 (i.e., 20.6 months of treatment duration divided by 16.6 months of PFS).
Additionally, the following key assumptions were made by the sponsor and have been appraised by CADTH (refer to Table 5).
Table 5: Key Assumptions of the Submitted Economic Evaluation (Not Noted as Limitations to the Submission)
Sponsor’s key assumption | CADTH comment |
|---|---|
All AEs were assumed to incur the same reduction in health utilities. | Inappropriate. Assuming the same disutility across AEs does not provide the model with flexibility to capture differences in the duration and severity of the AEs between therapies. |
Axitinib plus pembrolizumab and ipilimumab plus nivolumab are the relevant comparators in the intermediate-risk or poor-risk subgroup. Lenvatinib plus pembrolizumab is also a relevant comparator with patients with intermediate or poor risk; however, it was excluded due to a lack of subgroup-specific data. | While cabozantinib plus nivolumab is most likely to displace dual-drug combination therapies, sunitinib and pazopanib remain relevant treatment options in this subgroup. Additionally, lenvatinib is a relevant comparator in this subgroup; however, the impact of its exclusion from this population is uncertain given the absence of available data and relatedly/as a result the fact that the cost-effectiveness of cabozantinib plus nivolumab in comparison with lenvatinib plus pembrolizumab in this subpopulation is uncertain. CADTH included sunitinib and pazopanib in the scenario analysis of the intermediate-risk or poor-risk subgroup, along with axitinib plus pembrolizumab and ipilimumab plus nivolumab. |
AE = adverse event.
CADTH Reanalyses of the Economic Evaluation
Base-Case Results
The CADTH reanalyses addressed several limitations within the economic model (summarized in Table 6). The CADTH base case was derived by making changes in model parameter values and assumptions, in consultation with clinical experts.
Table 6: CADTH Revisions to the Submitted Economic Evaluation
Stepped analysis | Sponsor’s value or assumption | CADTH value or assumption |
|---|---|---|
Corrections to sponsor’s base case | ||
None | — | — |
Changes to derive the CADTH base case | ||
1. Shortening of time horizon | 45 years | 10 years |
2. Cost of therapies updated to reflect May 2023 prices and revised lenvatinib costs | Axitinib: $99.46 for 5 mg Pazopanib: $36.43 for 200 mg Sunitinib: $257.66 for 50 mg Lenvatinib: Price for 20 mg tablet used | Axitinib: $102.54 for 5 mg Pazopanib: $30.97 for 200 mg Sunitinib: $221.42 for 50 mg Lenvatinib: Price for two 10 mg tablets used |
3. RDI | < 100% for cabozantinib, nivolumab, sunitinib, and pazopanib 100% for axitinib, lenvatinib, and pembrolizumab | All comparators set to 100% |
4. Distribution of subsequent therapies following treatment discontinuation | Varied according to the relevant trials identified in the literature, and included treatment options not currently used in Canadian clinical practice | Revised, based on Table 14, to align with available provincial funding algorithm |
5. Assumption on wastage for IV drugs | Assumed that no wastage will occur | Assumed wastage will occur |
CADTH base case | — | 1 + 2 + 3 + 4 + 5 |
RDI = relative dose intensity.
The CADTH base case focused on the whole target population, regardless of IMDC risk status. The results of CADTH’s stepped analysis are presented in Table 7. CADTH’s probabilistic base-case reanalysis demonstrates that cabozantinib plus nivolumab is the most expensive therapy with a total cost of $455,815 over the time horizon and yields fewer QALYs compared to lenvatinib plus pembrolizumab; as a result, it was dominated and did not appear on the cost-effectiveness efficiency frontier. CADTH found notable uncertainty in the probabilistic analysis across most comparisons, primarily due to the high degree of uncertainty in the NMA-informed parameters. The CADTH base case suggests that cabozantinib plus nivolumab is associated with more QALYs compared to axitinib plus pembrolizumab, pazopanib, and sunitinib. However, the differences in QALYs between therapies were also associated with a large degree of parameter uncertainty, primarily due to the uncertainty of the OS and PFS estimates derived from the sponsor’s NMA. CADTH notes that the OS for patients treated with cabozantinib plus nivolumab suggested by the NMA was lower than the OS for patients treated with lenvatinib plus pembrolizumab, similar to the OS for patients treated with axitinib plus pembrolizumab, and higher than the OS for patients treated with sunitinib and pazopanib. The CADTH base-case change that resulted in the largest increase in the total costs for cabozantinib plus nivolumab was assuming an RDI of 100% for all treatments; the other change that had a notable impact on results was reducing the time horizon from 45 years to 10 years.
Table 7: Summary of the Stepped Analysis of the CADTH Reanalysis Results
Stepped analysis | Treatments | Total costs ($) | Total QALYs | Sequential ICER ($/QALY) |
|---|---|---|---|---|
Sponsor’s base case (deterministic) | Pazopanib | 99,126 | 3.24 | Reference |
Lenvatinib + pembrolizumab | 417,457 | 4.48 | 256,718 vs. pazopanib | |
Sunitinib | 128,676 | 3.14 | Dominated by pazopanib | |
Axitinib + pembrolizumab | 364,738 | 4.27 | Subject to extended dominance via pazopanib and lenvatinib + pembrolizumab | |
Cabozantinib + nivolumab | 412,413 | 4.24 | Dominated by axitinib + pembrolizumab | |
CADTH reanalysis 1 (reduced time horizon) | Pazopanib | 97,734 | 3.04 | Reference |
Axitinib + pembrolizumab | 361,423 | 3.69 | 405,675 vs. pazopanib | |
Lenvatinib + pembrolizumab | 413,389 | 3.79 | 519,660 vs. axitinib + pembrolizumab | |
Sunitinib | 127,289 | 2.94 | Dominated by pazopanib | |
Cabozantinib + nivolumab | 405,607 | 3.69 | Dominated by axitinib + pembrolizumab | |
CADTH reanalysis 2 (updated prices for lenvatinib, axitinib, pazopanib, sunitinib) | Pazopanib | 81,470 | 3.24 | Reference |
Lenvatinib + pembrolizumab | 400,596 | 4.48 | 257,359 vs. pazopanib | |
Sunitinib | 119,267 | 3.14 | Dominated by pazopanib | |
Axitinib + pembrolizumab | 371,756 | 4.27 | Subject to extended dominance via pazopanib and lenvatinib + pembrolizumab | |
Cabozantinib + nivolumab | 411,191 | 4.24 | Dominated by axitinib + pembrolizumab and lenvatinib + pembrolizumab | |
CADTH reanalysis 3 (RDI set to 100%) | Pazopanib | 110,047 | 3.24 | Reference |
Lenvatinib + pembrolizumab | 419,213 | 4.48 | 248,821 vs. pazopanib | |
Sunitinib | 144,428 | 3.14 | Dominated by pazopanib | |
Axitinib + pembrolizumab | 367,710 | 4.26 | Subject to extended dominance via pazopanib and lenvatinib + pembrolizumab | |
Cabozantinib + nivolumab | 458,939 | 4.24 | Dominated by axitinib + pembrolizumab and lenvatinib + pembrolizumab | |
CADTH reanalysis 4 (second-line therapy distribution adjusted based on expert guidance) | Sunitinib | 147,904 | 3.14 | Reference |
Pazopanib | 149,621 | 3.24 | 15,752 vs. sunitinib | |
Axitinib + pembrolizumab | 363,187 | 4.27 | 208,968 vs. pazopanib | |
Lenvatinib + pembrolizumab | 424,104 | 4.48 | 282,023 vs. axitinib + pembrolizumab | |
Cabozantinib + nivolumab | 407,310 | 4.24 | Dominated by axitinib + pembrolizumab | |
CADTH reanalysis 5 (wastage included) | Pazopanib | 99,126 | 3.24 | Reference |
Lenvatinib + pembrolizumab | 418,501 | 4.48 | 257,976 vs. pazopanib | |
Sunitinib | 134,623 | 3.14 | Dominated by pazopanib | |
Axitinib + pembrolizumab | 365,589 | 4.27 | Subject to extended dominance via pazopanib and lenvatinib + pembrolizumab | |
Cabozantinib + nivolumab | 414,814 | 4.24 | Dominated by axitinib + pembrolizumab | |
CADTH base case (1 + 2 + 3 + 4 + 5) (deterministic) | Pazopanib | 150,098 | 3.04 | Reference |
Axitinib + pembrolizumab | 371,530 | 3.69 | 339,092 vs. pazopanib | |
Lenvatinib + pembrolizumab | 406,152 | 3.79 | 363,387 vs. axitinib + pembrolizumab | |
Sunitinib | 160,482 | 2.94 | Dominated by pazopanib | |
Cabozantinib + nivolumab | 452,894 | 3.69 | Dominated by lenvatinib + pembrolizumab | |
CADTH base case (1 + 2 + 3 + 4 + 5) (probabilistic) | Pazopanib | 150,424 | 3.04 | Reference |
Axitinib + pembrolizumab | 373,111 | 3.69 | 342,799 vs. pazopanib | |
Lenvatinib + pembrolizumab | 406,898 | 3.79 | 351,163 vs. axitinib + pembrolizumab | |
Sunitinib | 161,017 | 2.93 | Dominated by pazopanib | |
Cabozantinib + nivolumab | 455,815 | 3.69 | Dominated by lenvatinib + pembrolizumab |
ICER = incremental cost-effectiveness ratio; QALY = quality-adjusted life-year; RDI = relative dose intensity; vs. = versus.
Note: An intervention is dominated when it is more costly and less effective than at least 1 other intervention. Extended dominance occurs when the ICER for a given intervention compared with a lower-cost alternative is higher than the ICER of a higher-cost intervention with the same lower-cost alternative.
CADTH conducted a reanalysis of its base case where the population was narrowed to the intermediate-risk or poor-risk population. This reanalysis included ipilimumab plus nivolumab as well as other relevant comparators axitinib plus pembrolizumab, sunitinib, and pazopanib. The results of this analysis can be found in Table 16. Based on the sequential analysis of the CADTH reanalysis for the intermediate-prognosis or poor-prognosis population, cabozantinib plus nivolumab was dominated by axitinib plus pembrolizumab, with sunitinib and axitinib plus pembrolizumab appearing on the cost-effectiveness efficiency frontier.
Scenario Analysis Results
CADTH undertook price reduction analyses on the CADTH base case (Table 8), applying price reductions to cabozantinib only. These analyses demonstrated that at a price reduction of approximately 35% for cabozantinib, cabozantinib plus nivolumab is a cost-effective treatment (i.e., on the cost-effectiveness efficiency frontier) and among the most cost-effective double therapy regimens, when considering the CADTH reanalysis. However, at no price reduction for cabozantinib would cabozantinib plus nivolumab be the cost-effective option at a threshold of $50,000 per QALY gained in comparison with pazopanib when considering all relevant comparators, including single-drug treatments. In order for cabozantinib plus nivolumab to become cost-effective at such a threshold, additional discounts of approximately 22% on nivolumab would be necessary. Even if the price of nivolumab was 50% lower than its list price, a price reduction exceeding 81% for cabozantinib would be required for cabozantinib plus nivolumab to be considered cost-effective at a $50,000 per QALY gained threshold in comparison with pazopanib.
To address the remaining uncertainty regarding the parameterization of the model, CADTH conducted several scenario analyses (Table 16). When the second-best fitting distribution, according to the deviance information criterion, was used from the fractional polynomial NMA for OS or the second-best fractional polynomial NMA for PFS, the conclusions did not change, with cabozantinib plus nivolumab being a dominated strategy. Similarly, when the duration of treatment was extended by a factor of 1.24 across all therapies, no differences in conclusions were observed with cabozantinib plus nivolumab being a dominated strategy.
Issues for Consideration
Clinical expert feedback obtained by CADTH indicated that the use of cabozantinib plus nivolumab would complicate the existing treatment paradigm since it is unclear what drugs would be effective as second-line treatment options after disease progression with cabozantinib plus nivolumab. CADTH’s base case considered costs related to the use of lenvatinib following cabozantinib plus nivolumab based on clinical expert feedback obtained by CADTH; however, what will eventually be used in practice is unclear. As a result, the implications of this issue on the cost-effectiveness of cabozantinib plus nivolumab are uncertain.
Overall Conclusions
The CADTH clinical review found that based on evidence from 1 phase III, open-label, randomized controlled trial, cabozantinib plus nivolumab was associated with clinically important improvements in PFS, OS, and objective response rate in comparison with sunitinib in adult patients with previously untreated advanced RCC. However, definitive conclusions could not be drawn from the sponsor’s NMA, which was used to inform the comparative effectiveness of cabozantinib plus nivolumab with the other comparators in the submitted economic model (i.e., lenvatinib plus pembrolizumab, axitinib plus pembrolizumab, ipilimumab plus nivolumab, and pazopanib), as there were sources of uncertainty that were not explored sufficiently in the NMA. As a result, it is uncertain whether cabozantinib plus nivolumab is more or less effective than other combination therapies for the treatment of advanced RCC.
Table 8: CADTH Price Reduction Analyses
Analysis | Sequential ICERs ($/QALY) | |
|---|---|---|
Price reduction | Sponsor base case 1 (optimal outcome) | CADTH reanalysis (optimal outcome) |
No price reduction | WTP threshold < $256,718: pazopanib WTP threshold ≥ $256,718: LEN + PEM | WTP threshold < $339,092: pazopanib $339,092 ≤ WTP threshold < $363,387: AXI + PEM WTP threshold ≥ $363,387: LEN + PEM |
10% | WTP threshold < $256,718: pazopanib WTP threshold ≥ $256,718: LEN + PEM | WTP threshold < $339,092: pazopanib $339,092 ≤ WTP threshold < $363,387: AXI + PEM WTP threshold ≥ $363,387: LEN + PEM |
20% | WTP threshold < $256,718: pazopanib WTP threshold ≥ $256,718: LEN + PEM | WTP threshold < $339,092: pazopanib $339,092 ≤ WTP threshold < $363,387: AXI + PEM WTP threshold ≥ $363,387: LEN + PEM |
30% | WTP threshold < $251,670: pazopanib $251,670 ≤ WTP threshold < $280,741: CABO + NIVO WTP threshold ≥ $289,741: LEN + PEM | WTP threshold < $339,092: pazopanib $339,092 ≤ WTP threshold < $363,387: AXI + PEM WTP threshold ≥ $363,387: LEN + PEM |
40% | WTP threshold < $230,966: pazopanib $230,966 ≤ WTP threshold < $367,281: CABO + NIVO WTP threshold ≥ $367,281: LEN + PEM | WTP threshold < $317,800: pazopanib $317,800 ≤ WTP threshold < $516,146: CABO + NIVO WTP threshold ≥ $516,146: LEN + PEM |
50% | WTP threshold < $210,263: pazopanib $210,263 ≤ WTP threshold < $453,821: CABO + NIVO WTP threshold ≥ $453,821: LEN + PEM | WTP threshold < $281,907: pazopanib $281,907 ≤ WTP threshold < $772,206 = CABO + NIVO WTP threshold ≥ $772,206: LEN + PEM |
60% | WTP threshold < $189,560: pazopanib $189,560 ≤ WTP threshold < $540,362: CABO + NIVO WTP threshold ≥ $540,362: LEN + PEM | WTP threshold < $246,014: pazopanib $246,014 ≤ WTP threshold < $1,028,267: CABO + NIVO WTP threshold ≥ $1,028,267: LEN + PEM |
70% | WTP threshold < $168,857: pazopanib $168,857 ≤ WTP threshold < $626,902: CABO + NIVO WTP threshold ≥ $626,902: LEN + PEM | WTP threshold < $210,121: pazopanib $210,121 ≤ WTP threshold < $1,284,327: CABO + NIVO WTP threshold ≥ $1,284,327: LEN + PEM |
80% | WTP threshold < $148,153: pazopanib $148,153 ≤ WTP threshold < $713,443: CABO + NIVO WTP threshold ≥ $713,443: LEN + PEM | WTP threshold < $174,228: pazopanib $174,228 ≤ WTP threshold < $1,540,388 = CABO + NIVO WTP threshold ≥ $1,540,388: LEN + PEM |
90% | WTP threshold < $127,450: pazopanib $127,450 ≤ WTP threshold < $799,983: CABO + NIVO WTP threshold ≥ $799,983: LEN + PEM | WTP threshold < $138,335: pazopanib $138,335 ≤ WTP threshold < $1,796,448: CABO + NIVO WTP threshold ≥ $1,796,448: LEN + PEM |
100% | WTP threshold < $106,747: pazopanib $106,747 ≤ WTP threshold < $886,524: CABO + NIVO WTP threshold ≥ $886,524: LEN + PEM | WTP threshold < $102,442: pazopanib $102,442 ≤ WTP threshold < $2,052,509: CABO + NIVO WTP threshold ≥ $2,052,509: LEN + PEM |
AXI = axitinib; CABO = cabozantinib; ICER = incremental cost-effectiveness ratio; LEN = lenvatinib; NIVO = nivolumab; PEM = pembrolizumab; QALY = quality-adjusted life-year; WTP = willingness to pay.
Note: WTP indicates the willingness-to-pay threshold per QALY gained.
CADTH undertook reanalyses that included the following changes to address key limitations where possible: the use of a time horizon better aligned with the life expectancy of the target population, revisions to subsequent treatment regimens so that they were better aligned with the current standard of care, updated drug prices for some of the comparator therapies, revisions to assumptions related to RDI, and the consideration of drug wastage.
In the CADTH base case, for the proposed Health Canada indicated population regardless of IMDC risk score, results were similar to those reported by the sponsor: cabozantinib plus nivolumab is associated with greater total costs and fewer QALYs compared with lenvatinib plus pembrolizumab (i.e., cabozantinib plus nivolumab is dominated) and does not represent a cost-effective treatment option (i.e., does not appear on the cost-effectiveness efficiency frontier). When compared with axitinib plus pembrolizumab and lenvatinib plus pembrolizumab — the most relevant comparators — a price reduction on cabozantinib of at least 35% is required for cabozantinib plus nivolumab to be the most cost-effective treatment option at a $50,000 per QALY gained threshold. When considering all relevant comparators, including single-drug regimens, a price reduction for nivolumab would also need to be sought, as a 100% price reduction on cabozantinib will not lead to an ICER below a $50,000 per QALY gained threshold.
Similar results were observed when considering a scenario specific to the intermediate-prognosis or poor-prognosis population; this included ipilimumab plus nivolumab as a comparator, with cabozantinib plus nivolumab dominated by axitinib plus pembrolizumab and not appearing on the cost-effectiveness efficiency frontier.
CADTH was unable to address limitations with the model regarding some of the sponsor’s assumptions around ad hoc estimates of parameter uncertainty, or the use of the PSM modelling approach that does not consider the interdependence of OS and PFS curves. CADTH noted that despite this uncertainty, at present there is no evidence to support a price premium for cabozantinib plus nivolumab over other combination therapies for the treatment of advanced RCC.
References
1.Pharmacoeconomic evaluation [internal sponsor's report]. In: Drug Reimbursement Review sponsor submission: Cabometyx (cabozantinib): 40 mg oral tablets. Mississauga (ON): Ipsen Biopharmaceuticals Canada Inc.; 2023 Feb 14.
2.Cabometyx (cabozantinib): 20 mg, 40 mg, 60 mg oral tablets [product monograph]. Mississauga (ON): Ipsen Biopharmaceuticals Canada Inc.; 2022 Sep 14.
3.Clinical Study Report: CA2099ER. A phase 3, randomized, open-label study of nivolumab combined with cabozantinib versus sunitinib in participants with previously untreated advanced or metastatic renal cell carcinoma [internal sponsor's report]. Lawrence Township (NJ): Bristol-Myers Squibb; 2020 Aug 7.
4.Efficacy and adverse events of cabozantinib in combination with nivolumab versus available treatment optionsin first line treatment of advanced or metastatic renal cell carcinoma: a systematic literature review and network meta-analysis [internal sponsor's report]. In: Drug Reimbursement Review sponsor submission: Cabometyx (cabozantinib),: 40 mg oral tablets. Mississauga (ON): Ipsen Biopharmaceuticals Canada Inc.; 2023 Feb 14.
5.Rini BI, Plimack ER, Stus V, et al. Pembrolizumab plus axitinib versus sunitinib for advanced renal-cell carcinoma. N Engl J Med. 2019;380(12):1116-1127. PubMed
6.Motzer RJ, Tannir NM, McDermott DF, et al. Nivolumab plus ipilimumab versus sunitinib in advanced renal-cell carcinoma. N Engl J Med. 2018;378(14):1277-1290. PubMed
7.Sternberg CN, Davis ID, Mardiak J, et al. Pazopanib in locally advanced or metastatic renal cell carcinoma: results of a randomized phase III trial. J Clin Oncol. 2010;28(6):1061-1068. PubMed
8.Motzer R, Alekseev B, Rha SY, et al. Lenvatinib plus pembrolizumab or everolimus for advanced renal cell carcinoma. N Engl J Med. 2021;384(14):1289-1300. PubMed
9.Eichelberg C, Vervenne WL, De Santis M, et al. SWITCH: a randomised, sequential, open-label study to evaluate the efficacy and safety of sorafenib-sunitinib versus sunitinib-sorafenib in the treatment of metastatic renal cell cancer. Eur Urol. 2015;68(5):837-847. PubMed
10.Schedule of benefits for physician services under the Health Insurance Act: (January 25, 2022 (effective July 1, 2022)). Toronto (ON): Ontario Ministry of Health; 2022: https://www.health.gov.on.ca/en/pro/programs/ohip/sob/physserv/sob_master.pdf. Accessed 2023 Jun 15.
11.Schedule of benefits for laboratory services: effective July 1, 2020. Toronto (ON): Ontario Ministry of Health; 2020: https://www.health.gov.on.ca/en/pro/programs/ohip/sob/. Accessed 2023 Jun 15.
12.Bekelman JE, Halpern SD, Blankart CR, et al. Comparison of site of death, health care utilization, and hospital expenditures for patients dying with cancer in 7 developed countries. JAMA. 2016;315(3):272-283. PubMed
13.Provisional funding algorithm. Indication: renal cell carcinoma. Ottawa (ON): CADTH; 2023: https://www.cadth.ca/sites/default/files/pdf/PH0019-Adjuvant%20RCC-CAPCA%20Endorsement.pdf. Accessed 2023 Jun 26.
14.Exceptional Access Program (EAP). Toronto (ON): Ontario Ministry of Health; Ontario Ministry of Long-Term Care; 2022: http://www.health.gov.on.ca/en/pro/programs/drugs/odbf/odbf_except_access.aspx. Accessed 2023 May 13.
15.Lenvima (lenvatinib): 4 mg, 10 mg capsules [product monograph]. Mississauga (ON): Eisai Limited; 2022 May 31: https://pdf.hres.ca/dpd_pm/00066254.PDF. Accessed 2023 Jun 15.
16.Burotto M, Powles T, Escudier B, et al. Nivolumab plus cabozantinib vs sunitinib for first-line treatment of advanced renal cell carcinoma (aRCC): 3-year follow-up from the phase 3 CheckMate 9ER trial. J Clin Oncol. 2023;41(6_suppl):603-603.
17.Cancer Care Ontario: funded evidence-informed regimens. 2022; https://www.cancercareontario.ca/en/drugformulary/regimens. Accessed 2023 Apr 27.
18.DeltaPA. Ottawa (ON): IQVIA; 2022: https://www.iqvia.com/. Accessed 2023 Apr 27.
19.Ontario Ministry of Health, Ontario Ministry of Long-Term Care. Ontario drug benefit formulary/comparative drug index. 2022; https://www.formulary.health.gov.on.ca/formulary/. Accessed 2023 Apr 27.
20.Exceptional access program reimbursement criteria for frequently requested drugs. Toronto (ON): Ontario Ministry of Health; 2023: https://www.health.gov.on.ca/en/pro/programs/drugs/docs/frequently_requested_drugs.pdf. Accessed 2023 May 03.
21.Outpatient Cancer Drug Benefit Program. Edmonton (AB): Alberta Health Services; 2023: https://www.albertahealthservices.ca/assets/programs/ps-1025651-drug-benefit-list.pdf. Accessed 2023 May 03.
22.Table 17-10-0009-01: Population estimates, quarterly. Ottawa (ON): Statistics Canada; 2022: https://www150.statcan.gc.ca/t1/tbl1/en/cv.action?pid=1710000901. Accessed 2023 Jun 16.
23.Canadian Cancer Society. Kidney cancer statistics. 2022; https://cancer.ca/en/cancer-information/cancer-types/kidney/statistics. Accessed 2023 May 19.
24.Non-Insured Health Benefits program: First Nations and Inuit Health Branch: annual report 2020 to 2021. 2022; https://www.sac-isc.gc.ca/eng/1645718409378/1645718500555. Accessed 2022 May 19.
25.Drug Reimbursement Review clinical and economic report: pembrolizumab (Keytruda) for renal cell carcinoma, adjuvant treatment. Can J Health Technol. 2023;3(1). https://www.cadth.ca/sites/default/files/DRR/2022/PC0273-Keytruda-RCC_combined.pdf. Accessed 2023 May 19.
26.Drug Reimbursement Review clinical and economic report: lenvatinib and pembrolizumab (Lenvima and Keytruda) for advanced or metastatic renal cell carcinoma. Can J Health Technol. 2022;2(10). https://www.cadth.ca/sites/default/files/DRR/2022/PC0268-Lenvima-Keytruda.pdf. Accessed 2023 May 03.
27.De P, Otterstatter MC, Semenciw R, Ellison LF, Marrett LD, Dryer D. Trends in incidence, mortality, and survival for kidney cancer in Canada, 1986-2007. Cancer Causes Control. 2014;25(10):1271-1281. PubMed
28.Choueiri TK, Powles T, Burotto M, et al. Nivolumab plus cabozantinib versus sunitinib for advanced renal-cell carcinoma. N Engl J Med. 2021;384(9):829-841. PubMed
29.Budget Impact Analysis [internal sponsor's report]. In: Drug Reimbursement Review sponsor submission: Cabometyx (cabozantinib): 40 mg oral tablets. Mississauga (ON): Ipsen Biopharmaceuticals Canada Inc.; 2023 Feb 14.
30.Ipsen Biopharmaceuticals Canada Inc. response to May 24, 2023 CADTH request for additional information regarding Cabometyx (cabozantinib) CADTH review: clarification of BIA subpopulation market shares [internal additional sponsor's information]. Mississauga (ON): Ipsen Biopharmaceuticals Canada Inc; 2023 May 26.
31.SEER*Explorer: an interactive website for SEER cancer statistics. Kidney and renal pelvis stage distribution of SEER incidence cases, 2011-2020. 2023; https://seer.cancer.gov/statistics-network/explorer/application.html?site=72&data_type=1&graph_type=4&compareBy=sex&chk_sex_3=3&chk_sex_2=2&race=1&age_range=1&advopt_precision=1&hdn_view=0&advopt_show_apc=on&advopt_display=2#resultsRegion0. Accessed 2023 Jun 16.
Appendix 1: Cost Comparison Table
Note that this appendix has not been copy-edited.
The comparators presented in the following table have been deemed to be appropriate based on feedback from clinical experts and drug plans. Comparators may be recommended (appropriate) practice or actual practice. Existing Product Listing Agreements are not reflected in the table and as such, the table may not represent the actual costs to public drug plans.
Table 9: CADTH Cost Comparison Table for Advanced or Metastatic RCC
Treatment | Strength/ concentration | Form | Price | Recommended dosage | Daily cost | Average 28-day costa | |
|---|---|---|---|---|---|---|---|
Cabozantinib + nivolumab2 | |||||||
Cabozantinib | 20 mg 40 mg 60 mg | Tablet | 301.2944a, b | 40 mg once daily | 301.29 | 8,436 | |
Nivolumab | 10 mg/mL | 4 mL 10 mL Vial for IV infusion | 782.2200 1,955.5600 | 240 mg every 2 weeks or 480 mg every 4 weeks | 335.24 | 9,327 | |
Regimen cost | Until disease progression or toxicity | 636.53 | 17,823 | ||||
Immunotherapy + monoclonal antibody | |||||||
Axitinib + pembrolizumab17 | |||||||
Axitinib | 1 mg 5 mg | Tablet | 20.5073b 102.5387b | 5 mg twice daily | 205.08 | 5,742 | |
Pembrolizumab | 25 mg/mL | 4 mL Vial for IV infusion | 4,400.0000 | 2 mg/kg on day 1 (maximum of 200 mg) every 21 days or 4 mg/kg (max 400 mg) every 42 days | 419.05 | 11,733 | |
Axitinib + pembrolizumab | Until disease progression or toxicity (up to a maximum of 2 years) | 624.13 | 17,476 | ||||
Lenvatinib + pembrolizumab17 | |||||||
Lenvatinib | 4 mg 8 mg 10 mg 12 mg 14 mg 20 mg 24 mg | Multiple capsules in daily dose packages | 35.3853b 68.6407b 75.2783b 106.1559b 116.9347b 175.4127b 242.7333b | 20 mg orally once daily | 150.56c | 4,216c | |
Pembrolizumab | 25 mg/mL | 4 mL Vial for IV infusion | 4,400.0000a | 200 mg every 21 days or 400 mg every 42 days | 419.05 | 11,733 | |
Lenvatinib + pembrolizumab | Until disease progression or toxicity | 569.60 | 15,949 | ||||
Ipilimumab + nivolumab17 | |||||||
Nivolumab | 10 mg/mL | 4 mL 10 mL Vial for IV infusion | 782.2200 1,955.5600 | 3 mg/kg on day 1 every 21 days | 223.49 | 6,258 | |
Ipilimumab | 5 mg/mL | Vial for IV infusion (10 mL) | 5,800.0000 | 1 mg/kg on day 1 every 21 days | 552.38 | 15,467 | |
Ipilimumab + nivolumab | Usual total of 4 cycles unless disease progression or toxicity | 775.97 | 21,724 | ||||
Single-drug chemotherapy | |||||||
Cabozantinib17,d | 20 mg 40 mg 60 mg | Tablet | 301.2944b,d | 60 mg daily | 301.29 | 8,436 | |
Multitarget tyrosine kinase inhibitor | |||||||
Sunitinib17 | 12.5 mg 25 mg 50 mg | Tablet | 55.3553b 110.7100b 221.4208b | 50 mg daily on day 1 to day 28, every 42 days | 147.61 | 4,133 | |
Pazopanib17 | 200 mg | Tablet | 30.9655b | 800 mg daily | 123.86 | 3,468 | |
Note: All prices are from the IQVIA DeltaPA database (accessed May 2023) unless otherwise indicated, and do not include dispensing fees.18 Weight-based dosing assumes an 80 kg patient.
aSponsor’s submitted price.1
bOntario Drug Benefit Exceptional Access Program list price (accessed May 2023).14 Some ODB EAP prices were only available within the Formulary/Comparative Drug Index database; while listed as Off-Formulary Interchangeable, the included products are funded for RCC under the EAP and thus the prices should be the listed amount that the Ontario Ministry of Health pays.19,20
cAssumes patients receive two 10 mg capsules per day.
dWhile cabozantinib is indicated for the treatment of advanced RCC in treatment-naive adults with intermediate and poor risk,2 public health care payers typically limit funding to second-line or third-line therapy.20,21 The wholesale price of cabozantinib is $293.3333 per tablet.18
Appendix 2: Submission Quality
Note that this appendix has not been copy-edited.
Description | Yes/no | Comments |
|---|---|---|
Population is relevant, with no critical intervention missing, and no relevant outcome missing | Yes | No comment. |
Model has been adequately programmed and has sufficient face validity | Yes | No comment. |
Model structure is adequate for decision problem | No | A partitioned survival model does not explicitly consider the relationship between PFS and OS (refer to Limitation). |
Data incorporation into the model has been done adequately (e.g., parameters for probabilistic analysis) | Yes | No comment. |
Parameter and structural uncertainty were adequately assessed; analyses were adequate to inform the decision problem | No | Sequential cost-effectiveness analysis was not incorporated in the model presentation. Also, a variance that equals to 10% of the mean for a number of model parameters was used. |
The submission was well organized and complete; the information was easy to locate (clear and transparent reporting; technical documentation available in enough details) | Yes | No comment. |
Appendix 3: Additional Information on the Submitted Economic Evaluation
Note that this appendix has not been copy-edited.
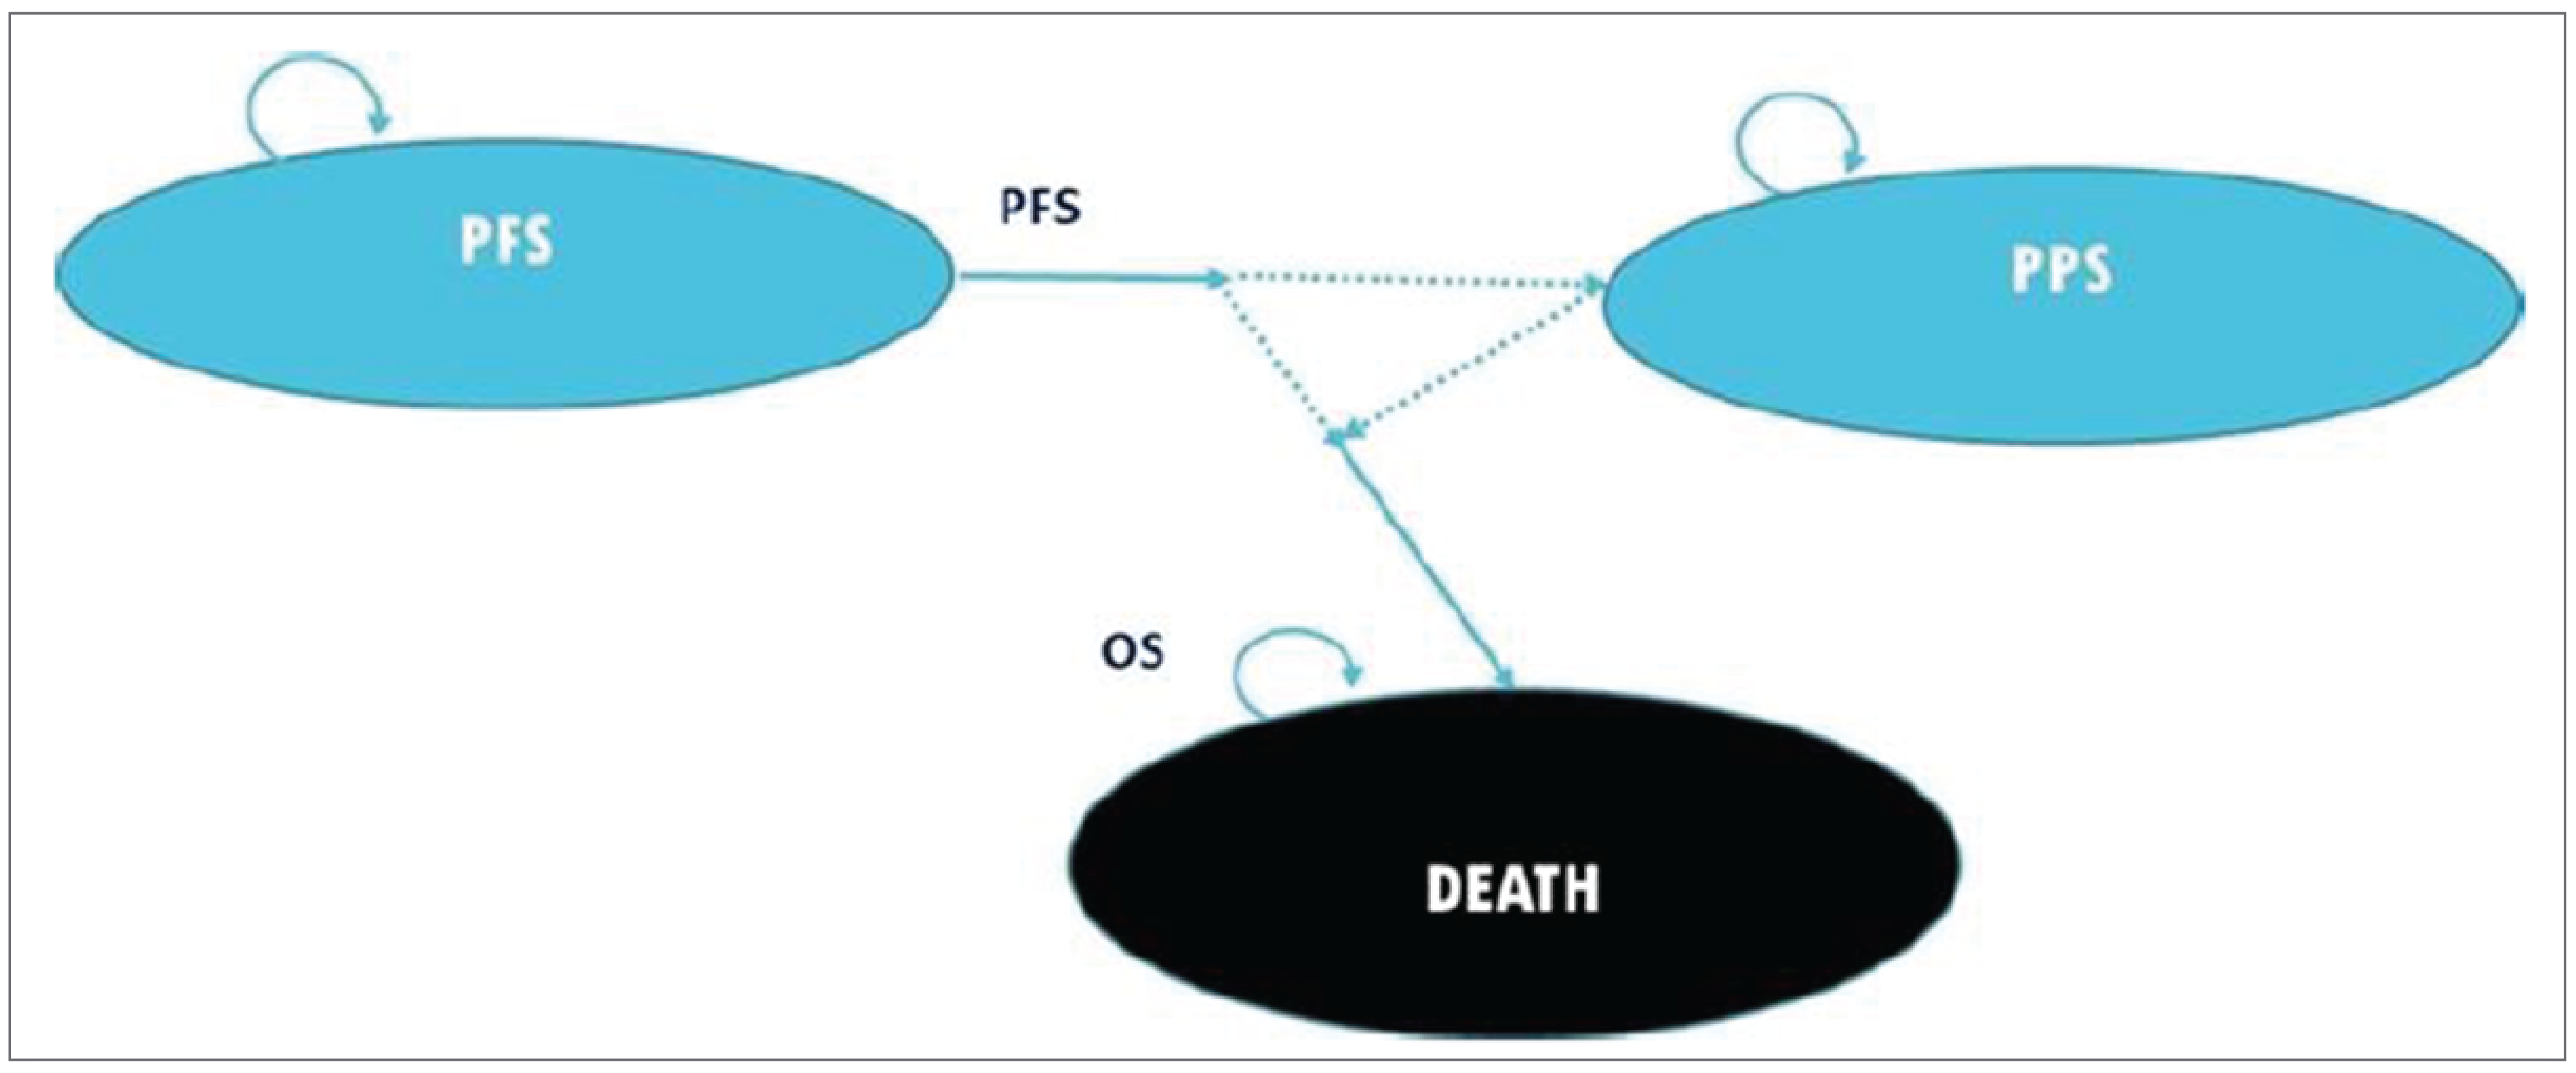
Table 11: Disaggregated Summary of Sponsor’s Base Case — Whole Population
Detail | CABO + NIVO | Sunitinib | Pazopanib | AXI + PEM | LEN + PEM |
|---|---|---|---|---|---|
Discounted life-years | |||||
Progression-free LYs | 2.217 | 1.284 | 1.150 | 1.685 | 2.309 |
Postprogression LYs | 3.026 | 2.573 | 2.845 | 3.600 | 3.244 |
Total life-years | 5.243 | 3.857 | 3.995 | 5.285 | 5.553 |
Discounted quality-adjusted life-years | |||||
Progression-free QALYs | 1.850 | 1.077 | 0.967 | 1.412 | 1.931 |
Postprogression QALYs | 2.408 | 2.071 | 2.291 | 2.868 | 2.567 |
Total QALYs | 4.259 | 3.148 | 3.258 | 4.280 | 4.497 |
Discounted costs | |||||
Preprogression cost | 368,303 | 68,682 | 63,486 | 303,970 | 373,955 |
Primary intervention | 363,201 | 65,450 | 61,409 | 300,597 | 368,371 |
Disease management | 3,020 | 1,820 | 1,648 | 2,336 | 3,139 |
Adverse events | 2,082 | 1,412 | 429 | 1,037 | 1,446 |
Postprogression cost | 46,858 | 60,758 | 36,724 | 61,791 | 45,254 |
Subsequent treatments | 31,003 | 45,216 | 20,859 | 45,207 | 29,180 |
Disease management | 3,892 | 3,309 | 3,658 | 4,630 | 4,173 |
End-of-life costs | 11,963 | 12,232 | 12,207 | 11,954 | 11,901 |
Total costs | 415,161 | 129,440 | 100,210 | 365,761 | 418,209 |
AXI = axitinib; CABO = cabozantinib; LEN = lenvatinib; NIVO = nivolumab; PEM = pembrolizumab; QALY = quality-adjusted life-year.
Source: Sponsor’s pharmacoeconomic submission.1
Table 12: Summary of the Sponsor’s Economic Evaluation Results — Intermediate or Poor Risk Versus Axitinib Plus Pembrolizumab
Treatments | Total costs ($) | Incremental costs ($) | Total QALYs | Incremental QALYs | ICER vs. reference ($/QALY) |
|---|---|---|---|---|---|
Axitinib + pembrolizumab | 349,383 | Reference | 4.00 | Reference | Reference |
Cabozantinib + nivolumab | 417,242 | $13,597 | 3.91 | –0.093 | Dominated by axitinib + pembrolizumab |
ICER = incremental cost-effectiveness ratio; QALY = quality-adjusted life-year.
Source: Sponsor’s pharmacoeconomic submission.1
Table 13: Disaggregated Summary of Sponsor’s Base Case — Intermediate or Poor Risk
Detail | CABO + NIVO | IPI + NIVO |
|---|---|---|
Discounted life-years | ||
Progression-free life-years | 2.318 | 2.474 |
Postprogression life-years | 2.473 | 2.142 |
Total life-years | 4.792 | 4.616 |
Discounted QALYs | ||
Progression-free QALYs | 1.932 | 2.053 |
Postprogression QALYs | 1.976 | 1.722 |
Total QALYs | 3.907 | 3.775 |
Discounted costs ($) | ||
Preprogression cost | 374,141 | 351,917 |
Primary intervention | 368,909 | 348,377 |
Disease management | 3,156 | 3,356 |
Adverse events | 2,075 | 184 |
Postprogression cost | 43,102 | 51,728 |
Subsequent treatments | 27,848 | 36,867 |
Disease management | 3,185 | 2,758 |
End-of-life costs | 12,069 | 12,103 |
Total costs | 417,242 | 403,645 |
CABO = cabozantinib; IPI = ipilimumab; NIVO = nivolumab; QALY = quality-adjusted life-year.
Source: Sponsor’s pharmacoeconomic submission.1
Appendix 4: Additional Details on the CADTH Reanalyses and Sensitivity Analyses of the Economic Evaluation
Note that this appendix has not been copy-edited.
Table 14: CADTH Assumption on Subsequent Treatment Lines
After progression on | Cabozantinib + nivolumab | Sunitinib | Pazopanib | Axitinib + pembrolizumab | Lenvatinib + pembrolizumab |
|---|---|---|---|---|---|
No treatment | 0.0% | 0.0% | 0.0% | 0.0% | 0.0% |
Axitinib | 0.0% | 50.0% | 50.0% | 0.0% | 0.0% |
Cabozantinib | 0.0% | 37.5% | 37.5% | 100.0% | 100.0% |
Lenvatinib | 100.0% | 0.0% | 0.0% | 0.0% | 0.0% |
Nivolumab | 0.0% | 87.5% | 87.5% | 0.0% | 0.0% |
Total | 100.0% | 175.0% | 175.0% | 100.0% | 100.0% |
Detailed Results of CADTH Base Case
Table 15: Disaggregated Summary of CADTH’s Economic Evaluation Results
Treatment | Component | Value | Incremental (vs. reference) | Incremental (sequential) |
|---|---|---|---|---|
Discounted LYs | ||||
Pazopanib | Total | 3.71 | NA | NA |
Preprogression | 1.152 | NA | NA | |
Postprogression | 2.558 | NA | NA | |
Lenvatinib + pembrolizumab | Total | 4.615 | 0.905 | NA |
Preprogression | 2.303 | 1.151 | NA | |
Postprogression | 2.312 | –0.246 | NA | |
Sunitinib | Total | 3.584 | –0.126 | –1.031 |
Preprogression | 1.286 | 0.134 | –1.017 | |
Postprogression | 2.298 | –0.26 | –0.014 | |
Axitinib + pembrolizumab | Total | 4.508 | 0.798 | 0.924 |
Preprogression | 1.684 | 0.532 | 0.398 | |
Postprogression | 2.824 | 0.266 | 0.526 | |
Cabozantinib + nivolumab | Total | 4.502 | 0.792 | –0.006 |
Preprogression | 2.174 | 1.022 | 0.49 | |
Postprogression | 2.328 | –0.23 | –0.496 | |
Discounted QALYs | ||||
Pazopanib | Total | 3.040 | NA | NA NA |
Preprogression | 0.969 | NA | NA | |
Postprogression | 2.071 | NA | NA | |
Lenvatinib + pembrolizumab | Total | 3.786 | 0.746 | NA |
Preprogression | 1.926 | 0.957 | NA | |
Postprogression | 1.859 | –0.212 | NA | |
Sunitinib | Total | 2.939 | –0.101 | –0.847 |
Preprogression | 1.08 | 0.111 | –0.846 | |
Postprogression | 1.859 | –0.212 | 0 | |
Axitinib + pembrolizumab | Total | 3.69 | 0.65 | 0.751 |
Preprogression | 1.412 | 0.443 | 0.332 | |
Postprogression | 2.278 | 0.207 | 0.419 | |
Cabozantinib + nivolumab | Total | 3.694 | 0.654 | 0.004 |
Preprogression | 1.817 | 0.848 | 0.405 | |
Postprogression | 1.877 | –0.194 | –0.401 | |
Discounted costs ($) | ||||
Pazopanib | Preprogression cost | 53,934 | NA | NA |
Primary intervention | 51,856 | NA | NA | |
Disease management | 1,650 | NA | NA | |
Adverse events | 428 | NA | NA | |
Postprogression cost | 96,491 | NA | NA | |
Subsequent treatments | 81,920 | NA | NA | |
Disease management | 3,287 | NA | NA | |
End-of-life costs | 11,283 | NA | NA | |
Total cost | 150,424 | NA | NA | |
Lenvatinib + pembrolizumab | Preprogression cost | 356,623 | 302,689 | NA |
Primary intervention | 352,050 | 300,194 | NA | |
Disease management | 3,129 | 1,479 | NA | |
Adverse events | 1,444 | 1,016 | NA | |
Postprogression cost | 50,275 | –46,216 | NA | |
Subsequent treatments | 37,408 | –44,512 | NA | |
Disease management | 2,972 | –315 | NA | |
End-of-life costs | 9,895 | –1,388 | NA | |
Total cost | 406,898 | 256,474 | NA | |
Sunitinib | Preprogression cost | 72,577 | 18,643 | –284,046 |
Primary intervention | 69,342 | 17,486 | –282,708 | |
Disease management | 1,822 | 172 | –1,307 | |
Adverse events | 1,413 | 985 | –31 | |
Postprogression cost | 88,441 | –8,050 | 38,166 | |
Subsequent treatments | 74,142 | –7,778 | 36,734 | |
Disease management | 2,953 | –334 | –19 | |
End-of-life costs | 11,346 | 63 | 1,451 | |
Total cost | 161,017 | 10,593 | –245,881 | |
Axitinib + pembrolizumab | Preprogression cost | 375,135 | 321,201 | 302,558 |
Primary intervention | 372,296 | 320,440 | 302,954 | |
Disease management | 2,057 | 407 | 235 | |
Adverse events | 781 | 353 | –632 | |
Postprogression cost | 61,175 | –35,316 | –27,266 | |
Subsequent treatments | 47,127 | –34,793 | –27,015 | |
Disease management | 3,664 | 377 | 711 | |
End-of-life costs | 10,150 | –1,133 | –1,196 | |
Total cost | 436,309 | 285,885 | 275,292 | |
Cabozantinib + nivolumab | Preprogression cost | 409,450 | 355,516 | 34,315 |
Primary intervention | 404,407 | 352,551 | 32,111 | |
Disease management | 2,963 | 1,313 | 906 | |
Adverse events | 2,080 | 1,652 | 1,299 | |
Postprogression cost | 46,364 | –50,127 | –14,811 | |
Subsequent treatments | 33,170 | –48,750 | –13,957 | |
Disease management | 2,992 | –295 | –672 | |
End-of-life costs | 10,203 | –1,080 | 53 | |
Total cost | 455,815 | 305,391 | 19,506 | |
Treatment | ICER vs. reference ($) | Sequential ICER ($) | ||
Pazopanib | Reference | Reference | ||
Lenvatinib + pembrolizumab | 341,965 | 341,965 vs. reference | ||
Sunitinib | Dominated by pazopanib | Dominated by pazopanib | ||
Axitinib + pembrolizumab | 342,595 | Dominated by lenvatinib + pembrolizumab | ||
Cabozantinib + nivolumab | 469,832 | Dominated by lenvatinib + pembrolizumab | ||
ICER = incremental cost-effectiveness ratio; LY = life-year; NA = not applicable; QALY = quality-adjusted life-year; vs. = versus.
Scenario Analyses
Table 16: CADTH Base Case for Intermediate and Poor Prognosis and Scenario Analyses
Treatment | Total costs | Total QALYs | Sequential ICER ($/QALY) |
|---|---|---|---|
CADTH base case for intermediate or poor prognosis | |||
Sunitinib | 152,545 | 2.58 | Reference |
Axitinib + pembrolizumab | 356,531 | 3.51 | 217,237 vs. sunitinib |
Pazopanib | 288,498 | 3.08 | Subject to extended dominance via sunitinib and axitinib + pembrolizumab |
Ipilimumab + nivolumab | 380,712 | 3.38 | Dominated by axitinib + pembrolizumab |
Cabozantinib + nivolumab | 453,713 | 3.47 | Dominated by axitinib + pembrolizumab |
CADTH base case with best fitting FP-NMA for OS | |||
Pazopanib | 99,126 | 3.24 | Reference |
Lenvatinib + pembrolizumab | 416,654 | 4.48 | 256,485 vs. pazopanib |
Sunitinib | 127,773 | 3.14 | Dominated by pazopanib |
Axitinib + pembrolizumab | 362,538 | 4.27 | Subject to extended dominance via pazopanib and lenvatinib + pembrolizumab |
Cabozantinib + nivolumab | 391,674 | 4.24 | Dominated by lenvatinib + pembrolizumab |
CADTH base case with second-best fitting FP-NMA for PFS | |||
Pazopanib | 149,995 | 3.04 | Reference |
Lenvatinib + pembrolizumab | 406,084 | 3.79 | 343,283 vs. reference |
Sunitinib | 161,828 | 2.94 | Dominated by pazopanib |
Axitinib + pembrolizumab | 378,704 | 3.70 | Subject to extended dominance via pazopanib and lenvatinib + pembrolizumab |
Cabozantinib + nivolumab | 442,646 | 3.70 | Dominated by lenvatinib + pembrolizumab |
CADTH base case with revised time to treatment discontinuation | |||
Pazopanib | 152,466 | 3.04 | Reference |
Lenvatinib + pembrolizumab | 434,134 | 3.79 | 376,561 vs. reference |
Sunitinib | 166,161 | 2.94 | Dominated by pazopanib |
Axitinib + pembrolizumab | 408,030 | 3.69 | Subject to extended dominance via pazopanib and lenvatinib + pembrolizumab |
Cabozantinib + nivolumab | 483,775 | 3.69 | Dominated by lenvatinib + pembrolizumab |
CADTH base case with higher price for lenvatinib | |||
Pazopanib | 150,436 | 3.04 | Reference |
Axitinib + pembrolizumab | 372,871 | 3.54 | 342,577 vs. reference |
Lenvatinib + pembrolizumab | 427,530 | 3.79 | 566,822 vs. stepwise |
Sunitinib | 161,000 | 2.94 | Dominated by pazopanib |
Cabozantinib + nivolumab | 455,405 | 3.70 | Dominated by lenvatinib + pembrolizumab |
FP-NMA = fractional polynomial network meta-analysis; ICER = incremental cost-effectiveness ratio; QALY = quality-adjusted life-year; vs. = versus.
Note: An intervention is dominated when it is more costly and less effective than at least 1 other intervention. Extended dominance occurs when the ICER for a given intervention compared with a lower-cost alternative is higher than the ICER for the comparison of a higher-cost intervention with the same lower-cost alternative.
aReference product is the least costly alternative.
Appendix 5: Submitted Budget Impact Analysis and CADTH Appraisal
Note that this appendix has not been copy-edited.
Table 17: Summary of Key Takeaways
Key takeaways of the Budget Impact Analysis |
|---|
|
Summary of Sponsor’s Budget Impact Analysis
In the submitted budget impact analysis (BIA), the sponsor assessed the introduction of cabozantinib plus nivolumab for the first-line treatment of adult patients with advanced (not amenable to curative surgery or radiation therapy) or metastatic RCC, into a market containing axitinib plus pembrolizumab, lenvatinib plus pembrolizumab, ipilimumab plus nivolumab, sunitinib, and pazopanib as treatment options. The BIA was undertaken from the perspective of a Canadian public drug plan payer over a 3-year time horizon (2023 through 2025) using an epidemiological approach. The sponsor’s base case included only drug acquisition costs, without markups, administration, or dispensing fees. Data for the model were obtained from various sources including Statistics Canada,22 the Canadian Cancer Society,23 the Non-Insured Health Benefits (NIHB) program,24 previous CADTH reviews of medications for RCC,25,26 the published literature,5-8,27,28 the sponsor’s internal forecasts, and expert opinion.29 Key inputs to the BIA are documented in Table 19.
Key assumptions include:
All patients will be eligible for cabozantinib plus nivolumab regardless of IMDC prognostic risk.
Patients with non–clear cell RCC will not be eligible for cabozantinib plus nivolumab therapy.
Treatment durations from various trials can be naively compared.
Cabozantinib plus nivolumab will only displace lenvatinib plus pembrolizumab in the favourable risk subpopulation, and only axitinib plus pembrolizumab and lenvatinib plus pembrolizumab in the intermediate-risk or poor-risk subpopulation.
Patients reimbursed by the NIHB will only accrue costs for oral comparators.
Table 18: Summary of Key Model Parameters
Parameter | Sponsor’s estimate (reported as year 1/year 2/ year 3, if appropriate) |
|---|---|
Target population | |
Canadian population (excluding Quebec) | 30,420,121 in year 1 (2023)a,22 |
Incidence of kidney and renal pelvis cancer | |
Incident cases of RCC | 85%27 |
Proportion of patients with RCC eligible for public coverage | 95%26 |
Proportion of RCC with clear cell histology type | 75%26 |
Proportion with aRCC at diagnosis | 35%b |
Proportion aRCC at diagnosis with intermediate-high risk and M1NED | 19.2%25 |
Proportion that undergoes nephrectomy | 90%25 |
Proportion relapsing postsurgery | 26.9%c |
Proportion referred to specialist | 90%25 |
Proportion treated with 1L therapy | 90%d |
Proportion aRCC at diagnosis otherwise not amenable to surgery | 15.8% (calculated) |
Proportion referred to specialist | 90% (assumed) |
Proportion treated with 1L therapy | 90% (assumed) |
Proportion who are not aRCC at diagnosis | 65%25 |
Proportion who are not aRCC at diagnosis who progress | 26.9%e |
Proportion referred to a specialist | 90% (assumed) |
Proportion treated with 1L therapy | 90% (assumed) |
Number of patients eligible for drug under review | 1,173 / 1,186 / 1,200 |
Proportion of eligible patients at favourable, intermediate, and poor risk | 22.4%, 57.8%, 19.8%28 |
Market uptake in reference scenario (3 years, overall population)f | |
Cabozantinib + nivolumab | 0% / 0% / 0% |
Pembrolizumab + axitinib | 30% / 27% / 25% |
Ipilimumab + nivolumab | 40% / 40% / 40% |
Sunitinib | 15% / 15% / 15% |
Pazopanib | 5% / 5% / 5% |
Lenvatinib + pembrolizumab | 5% / 8% / 10% |
Clinical trials | 5% / 5% / 5% |
Market uptake in new drug scenario (3 years, overall population)f | |
Cabozantinib + nivolumab | 2% / 3% / 5% |
Pembrolizumab + axitinib | 29% / 25% / 22% |
Ipilimumab + nivolumab | 40% / 40% / 40% |
Sunitinib | 15% / 15% / 15% |
Pazopanib | 5% / 5% / 5% |
Lenvatinib + pembrolizumab | 4% / 7% / 8% |
Clinical trials | 5% / 5% / 5% |
Cost of treatment per patient, treatment durationg (initial year of treatment/carry forward to following year)h | |
Cabozantinib + nivolumab, 14.3 months28 | $232,493 / $42,854 |
Pembrolizumab + axitinib, 10.4 months5 | $194,414 / $0 |
Ipilimumab + nivolumab, 7.9 monthsi | $120,063 / $0 |
Sunitinib, 9.2 months28 | $47,805 / $0 |
Pazopanib, 7.4 months7 | $32,619 / $0 |
Lenvatinib + pembrolizumab, 17.0 months8 | $217,127 / $88,575 |
Clinical trials, NA | $0 / $0 |
aRCC = advanced renal cell carcinoma; M1NED = metastatic, no evidence of residual disease; NA = not applicable; RCC = renal cell carcinoma.
aPopulation as reported here does not consider the NIHB populations of Quebec or the 3 territories.
bCalculated based on 65% of patients being diagnosed with local RCC.25
cBased on the reporting of a distant recurrence of 134 of 498 patients in the placebo group of the KEYNOTE-564 trial of pembrolizumab for adjunctive treatment of patients with intermediate-high or high risk or M1NED RCC following nephrectomy as reported in the CADTH review of pembrolizumab for that indication.25
dCited as from the CADTH review of pembrolizumab for adjunctive treatment of RCC,25 however this assumption could not be located within that report.
eCited as from the CADTH review of pembrolizumab for adjunctive treatment of RCC;25 presumably under the assumption that the proportion of patients diagnosed with non–advanced RCC who progress is the same as the proportion of advanced patients with intermediate-high or high-risk or M1NED RCC following nephrectomy who progress.
fMarket shares and uptake based on opinions of clinical experts consulted by the sponsor and internal projections.29 Upon request from CADTH, the sponsor provided updated market shares for each of the intermediate/poor and favourable risk subpopulations, which, when rounded, are consistent with the market shares of the overall population, when weighted by the assumed distribution of those subpopulations.29,30
gTreatment duration was based on median duration of treatment reported in the cited trials.
hCost of treatment funded by NIHB includes only the oral medications (initial year of treatment/carry forward to following year): Cabozantinib + nivolumab = $110,048 / $20,285; Pembrolizumab + Axitinib = $62,582 / $0; Ipilimumab + nivolumab = $0 / $0; Sunitinib = $47,805 / $0; Pazopanib = $32,619; Lenvatinib + Pembrolizumab = $64,069/26,136; Clinical Trials = $0 / $0.
iIncludes 4 months of nivolumab plus ipilimumab followed by 3.9 months of nivolumab alone.6,29
Summary of the Sponsor’s BIA Results
The sponsor’s estimated budget impact of funding cabozantinib plus nivolumab for the first-line treatment of adult patients with advanced or metastatic RCC was $641,880 in Year 1, $1,077,364 in Year 2, and $2,245,993 in Year 3, for a 3-year budgetary impact of $3,965,238.
CADTH Appraisal of the Sponsor’s BIA
CADTH identified several key limitations to the sponsor’s analysis that have notable implications on the results of the BIA:
Number of patients eligible for first-line systemic therapy for aRCC is underestimated: The sponsor’s estimate that 1,173 patients in Canada (excluding Quebec) in the base year would be eligible for first-line systemic therapy is substantially lower than a previous estimate of the same patient population (more than 1,600 per year).26 In this submission, the sponsor assumed that 65% of patients with RCC are diagnosed with local (i.e., non–advanced) RCC.25,31 The sponsor then assumed that 19.2% of patients with RCC were of intermediate-high, high risk, or M1NED, based on a previous CADTH review of pembrolizumab as adjuvant treatment of adults with RCC at intermediate-high or high risk of recurrence following nephrectomy, or following nephrectomy and resection of metastatic lesions.25 This 19.2% was assumed by the sponsor to be part of the 35% of patients who are diagnosed with advanced RCC. Of these patients, 90% were then assumed to have a nephrectomy with the remaining 10% being removed from consideration within the model, and then 26.9% of those receiving nephrectomies were assumed to relapse postnephrectomy, based on the proportion of patients in the placebo group of the KEYNOTE-564 trial who had a distant recurrence after nephrectomy.25 Of note, while all patients within the KEYNOTE-564 trial had at least an intermediate-high risk of recurrence, approximately 94% were at lymph node stage N0 at baseline, and a similar 94% were at metastatic stage M0.25 As such, the vast majority of such patients would be considered part of the 65% of patients with non–advanced RCC at diagnosis, rather than the 35% of patients diagnosed with advanced RCC as assumed by the sponsor. This is consistent with clinical expert feedback obtained by CADTH indicating that nephrectomies are now seldom conducted on patients with advanced RCC; instead, such patients would be expected to be directly eligible for systemic therapies such as cabozantinib plus nivolumab and its comparators, should systemic therapy be deemed appropriate and desired. The sponsor also assumed that of patients diagnosed with non–advanced RCC, 26.9% would eventually progress to an advanced stage, also based on the placebo group of the KEYNOTE-564 trial postnephrectomy. While this estimate is not derived from an overall population of patients with non–advanced RCC, clinical expert opinion elicited by CADTH indicated that it is in line with expectations for this population regardless of whether the patient received a nephrectomy.
In reanalysis, CADTH assumed that the 19.2% of intermediate-high or high-risk patients considered eligible for nephrectomy by the sponsor would be among the 65% of patients diagnosed with non–advanced RCC rather than the 35% of patients who are diagnosed with advanced disease, and these patients would have a 26.9% risk of progression to advanced RCC regardless of whether they received a nephrectomy. This assumption brings the expected patient population eligible for first-line systemic therapy for advanced or metastatic RCC in line with previous estimates.26
Modelled treatment durations were inconsistent with the submitted pharmacoeconomic analysis: In the sponsor’s submitted CUA, treatment duration was defined by PFS while the submitted BIA base case considered median TTD reported in the respective clinical trials of each comparator. This resulted in considerably shorter estimates of treatment duration in the BIA compared to the CUA. As no adjustments were made for between-trial methodological or population differences, the method used in the BIA constitutes a naive comparison. Additionally, as noted in the CADTH appraisal of the sponsor’s economic evaluation, treatment in the RCC population is likely to continue postprogression if progression is slow and the patient tolerates the therapy. Thus, the use of PFS as a proxy likely underestimates treatment duration, which is exacerbated in the BIA by the sponsor’s use of even shorter median times to discontinuation from individual trials. While the sponsor’s BIA model included a setting to alter treatment duration to “PFS,” the durations under this setting were inconsistent with PFS as programmed in the CUA.
In reanalysis, CADTH assumed BIA treatment durations consistent with the median PFS used in the submitted CUA model for all comparators. An additional scenario analysis was conducted increasing the duration of therapy of all comparators by a factor of 1.24, consistent with a similar scenario conducted on the CADTH CUA base case.
Allocating market share to clinical trials is inappropriate: The sponsor assumed that for 5% of the market share in the reference and new drug scenarios, patients were enrolled in clinical trials and as a result, received trial medications and did not incur treatment or drug costs. This artificially decreases the estimated market size, omitting treatment costs incurred by patients in clinical trials and underestimating the budget impact. Additionally, clinical expert input for this review noted patient participation in clinical trials can vary substantially by jurisdiction.
In CADTH reanalyses, clinical trials were removed from the market mix; the market share of clinical trials was proportionally re-distributed over other comparators based on feedback from clinical experts.
Modelled population does not reflect the full Health Canada Indication: The sponsor’s model limited eligibility for cabozantinib plus nivolumab and its comparators to patients with clear cell RCC (estimated as 75% of those with RCC). However, the Health Canada indication is for the first-line treatment of adult patients with advanced or metastatic RCC, without limitation by cell type. As such, the population modelled in the BIA does not represent the full population indicated by Health Canada. According to clinical expert input elicited by CADTH, in the absence of sufficient clinical evidence regarding treatment of non–clear cell RCC, health care practitioners typically treat patients with non–clear cell RCC in a manner similar to patients with clear cell RCC, and it is expected that cabozantinib plus nivolumab would be similarly used in this population, if funded.
CADTH conducted a scenario analysis removing the criterion limiting eligibility for cabozantinib plus nivolumab and its comparators to clear cell RCC only.
The NIHB population was inappropriately calculated: While the sponsor correctly noted that the NIHB covers only oral oncology medication, they did not appear to account for the funding of IV oncology medications by the provincial jurisdictions for NIHB clients. The submitted model subtracts eligible NIHB patients from the estimated eligible patient populations of each provincial jurisdiction and then assigns a cost of $0 for IV medications funded by NIHB; in effect, these patients are assumed to either not receive IV medications or to receive them at no cost to a public payer. This method also fails to account for the costs of oral medications funded by the NIHB for clients living within the borders of Quebec and the territories. Furthermore, the provinces of Saskatchewan and Alberta fund all oncology products for patients residing within their borders, including those who would otherwise be reimbursed by the NIHB, as does Ontario for patients aged younger than 25 years and 65 years and older.
Due to the structure of the model, CADTH was unable to adjust for this limitation in reanalyses; it is not expected to have a substantial impact on overall budget impact results.
Less expensive lenvatinib pricing available: While the ODB EAP list price for blister packs containing a 20 mg daily dose (consisting of 2 10 mg capsules each) are listed at $175.41 per 20 mg as of May 2023, blister packs containing a 10 mg daily dose (one 10 mg capsule each) have a list price of $75.28 per 10 mg, equivalent to $150.56 per 20 mg.14,15 Should patients receive 2 10 mg blister packs daily rather than 1 20 mg pack, the cost of treatment with lenvatinib would be $24.86 less expensive per day.
In reanalyses, CADTH assumed patients would receive lenvatinib in multiples of 10 mg capsules, costing $7.53 per mg rather than $8.77 per mg. A scenario was conducted reverting lenvatinib pricing back to the 20 mg blister packs.
Assumption that ipilimumab plus nivolumab will not be displaced is likely inappropriate: Under the sponsor’s assumptions, the funding of cabozantinib plus nivolumab would only displace lenvatinib plus pembrolizumab for patients in the favourable risk category, while displacing only lenvatinib plus pembrolizumab and axitinib plus pembrolizumab in patients in the intermediate-risk or poor-risk category, not ipilimumab plus nivolumab. While clinical expert opinion elicited by CADTH indicated that the displacement of only lenvatinib plus pembrolizumab was likely reasonable within the favourable risk population, it indicated that ipilimumab plus nivolumab would likely also be displaced within the intermediate-risk or poor-risk population in proportion to its market share. Additionally, according to clinical expert opinion elicited by CADTH, patients in the intermediate-risk or poor-risk category are less likely to receive ipilimumab plus nivolumab than predicted by the sponsor due to toxicities associated with its use, with more patients instead receiving axitinib plus pembrolizumab.
In reanalysis, CADTH assumed that approximately half of the intermediate-risk or poor-risk subpopulation market capture for cabozantinib plus nivolumab would be displacing ipilimumab plus nivolumab with the rest coming from lenvatinib plus pembrolizumab and axitinib plus pembrolizumab. In a scenario analysis, CADTH reversed the initial market shares of ipilimumab plus nivolumab and axitinib plus pembrolizumab in the intermediate-risk or poor-risk population, as well as their displacement by cabozantinib plus nivolumab.
Subsequent treatment regimens not reflective of current standard of care: The sponsor considered a scenario analysis including second-line and third-line of subsequent therapy after first-line treatment with cabozantinib plus nivolumab and its comparators. As noted in the CADTH appraisal of the sponsor’s economic evaluation, in the sponsor’s model, the distribution of second-line therapy received did not adequately reflect the Canadian landscape. According to the clinical expert consulted by CADTH for this review, in Canadian clinical practice, second-line therapy is better reflected by the distribution of therapies provided in Table 14. Unlike in the submitted CUA, the sponsor’s BIA also included third-line therapies, although no information was provided regarding the source of information used to inform them. Due to inflexibility of the model, as well as an absence of data to inform third-line treatments, CADTH was unable to adjust for this limitation in reanalyses.
CADTH Reanalyses of the BIA
CADTH updated several comparator costs to reflect May 2023 list prices on the ODB EAP formulary, directly weighted the updated comparator market shares for the intermediate-risk or poor-risk and favourable risk subpopulations as provided by the sponsor to calculate overall population market shares, corrected ipilimumab plus nivolumab duration to reflect the cost of 4 28-day cycles of ipilimumab as reported in the Motzer et al., 2018 trial,6 rather than 4 30.25-day months as programmed by the sponsor, and corrected or updated population data for each province from 2019 to 2021, where the sponsor’s inputs were slightly different than those reported by Statistics Canada at the time of this review.22
CADTH then revised the sponsor’s submitted analysis by assuming that patients at intermediate-high to high risk of progression after nephrectomy were part of the 65% of patients who were diagnosed with non–advanced RCC, by reassigning the 5% of patients assigned to participate in clinical trials to the other comparators, by lowering the cost of lenvatinib 20 mg to the least expensive option, and by assuming that cabozantinib plus nivolumab will also displace ipilimumab plus nivolumab in the intermediate-risk or poor-risk subpopulation. The changes applied to derive the CADTH base case are described in Table 19.
Table 19: CADTH Revisions to the Submitted BIA
Stepped analysis | Sponsor’s value or assumption | CADTH value or assumption |
|---|---|---|
Correctionsa to sponsor’s base case | ||
1. Drug price corrections | Axitinib 5 mg = $99.4621 Pazopanib 200 mg = $36.4300 Sunitinib 50 mg = $257.6610 | Axitinib 5 mg = $102.5387b Pazopanib 200 mg = $30.9655b Sunitinib 50 mg = $221.4208b |
2. Market share inputs | Overall population market shares were hardcoded by the sponsor and were consistent with rounded weighted averages of the risk-based subpopulations29 | Overall population market shares were directly weighted by those of the risk-based subpopulations (i.e., rounding and hard-coding removed)30 |
3. Ipilimumab + nivolumab duration | Ipilimumab = 4 months (4.32 cycles) Nivolumab = 7.9 months (8.53 cycles) Total regimen cost = $120,063 | Ipilimumab = 3.7 months (4.00 cycles) Nivolumab = 7.9 months (8.53 cycles) Total regimen cost = $116,085 |
4. Provincial population estimates | Data from 2010 to 2018 and 2022 were consistent with Q4 population estimates from Statistics Canada while 2019 to 2021 data were not. | Data from 2010 to 2022 were consistent with Q4 population estimates from Statistics Canada.22 |
Changes to derive the CADTH base case | ||
1. Estimated population | 19.2% advanced RCC of intermediate-high or high risk of relapse postnephrectomy 15.8% other advanced RCC 65% diagnosed with non–advanced RCC Total eligible patients, base year: 1,173 | 35% advanced RCC 65% diagnosed with non–advanced RCC, including those at intermediate-high or high risk of relapse postnephrectomy Total eligible patients, base year: 1,623 |
2. Treatment duration | CABO + NIVO = 14.3 months AXI + PEM = 10.4 months IPI + NIVO = 3.7 months (Ipi), 7.9 months (NIVO)c Sunitinib = 9.2 months Pazopanib = 7.4 months LEN + PEM = 17 months | CABO + NIVO = 16.8 months AXI + PEM = 13.4 months IPI + NIVO = 3.7 months (IPI), 9.6 months (NIVO) Sunitinib = 9.4 months Pazopanib = 8.2 months LEN + PEM = 21.4 months |
3. Clinical trial market share | 5% | 0% |
4. Lenvatinib cost per 20 mg daily dose | 20 mg blister pack: $175.4127 | 2 × 10 mg capsules: $150.5566 |
5. Displacement of IPI + NIVO in intermediate-risk and poor-risk subpopulation | CABO + NIVO: 2% / 3% / 6% AXI + PEM: 25% / 21% / 18% IPI + NIVO: 51% / 51% / 51% LEN + PEM: 2% / 5% / 5% | CABO + NIVO: 2% / 3% / 6% AXI + PEM: 25.5% / 22.0% / 20.0% IPI + NIVO: 50.0% / 49.5% / 48.0% LEN + PEM: 2.5% / 5.5% / 6.0% |
CADTH base case | 1 through 5 | |
AXI = axitinib; BIA = budget impact analysis; CABO = cabozantinib; IPI = ipilimumab; LEN = lenvatinib; NIVO = nivolumab; PEM = pembrolizumab; RCC = renal cell carcinoma.
aCorrections are minor errors (e.g., transcription errors between report and model, misapplication of distributions or SEs in probabilistic analyses) that are not identified as limitations.
bAxitinib, pazopanib, and sunitinib are all funded for RCC under the Ontario Drug Benefit Exceptional Access Program.20 As such, their list prices are as stated under the amount the Ministry of Health pays in the Ontario Drug Benefit formulary index19 or the Ontario Drug Benefit Exceptional Access Program drug benefit prices list (accessed May 2023).14
cDuration of ipilimumab plus nivolumab is adjusted from the submitted analysis to account for CADTH correction 3.
The results of the CADTH stepwise reanalysis are presented in summary format in Table 20 and a more detailed breakdown is presented in Table 21.
CADTH reanalyses suggest that the reimbursement of cabozantinib plus nivolumab for the first-line treatment of advanced or metastatic clear cell RCC will be associated with a 3-year budgetary incremental cost of $8,611,151.
Table 20: Summary of the CADTH Reanalyses of the BIA
Stepped analysis | 3-year total |
|---|---|
Sponsor’s submitted base case | $3,965,238 |
Sponsor’s corrected base case | $3,221,452 |
CADTH reanalysis 1: Estimated population | $4,457,240 |
CADTH reanalysis 2: PFS duration from submitted CUA | $1,007,599 |
CADTH reanalysis 3: Removal of clinical trial market share | $3,391,002 |
CADTH reanalysis 4: Lenvatinib pricing | $3,800,035 |
CADTH reanalysis 5: Displacement of IPI + NIVO | $8,201,269 |
CADTH base case (1 through 5) | $8,611,151 |
BIA = budget impact analysis; CUA = cost-utility analysis; IPI = ipilimumab; NIVO = nivolumab.
CADTH conducted additional scenario analyses (Table 21) to highlight the uncertainty associated with the potential budget impact. Scenarios were conducted assuming patients with non–clear cell RCC would also be eligible for cabozantinib plus nivolumab, reverting the price of lenvatinib to that of the 20 mg blister packs, reversing the underlying market share and displacement of axitinib plus pembrolizumab and ipilimumab plus nivolumab in the intermediate-risk or poor-risk subpopulation, and increasing the duration of treatment for all comparators by a factor of 1.24.
Table 21: Detailed Breakdown of the CADTH Reanalyses of the BIA
Stepped analysis | Scenario | Year 0 (current situation) | Year 1 | Year 2 | Year 3 | 3-year total |
|---|---|---|---|---|---|---|
Submitted base case | Reference | $143,750,330 | $147,328,880 | $151,784,461 | $157,101,078 | $599,964,749 |
New drug | $143,750,330 | $147,970,761 | $152,861,825 | $159,347,071 | $603,929,986 | |
Budget impact | $0 | $641,880 | $1,077,364 | $2,245,993 | $3,965,238 | |
Corrected base case | Reference | $143,970,707 | $147,802,780 | $152,672,833 | $157,894,555 | $602,340,875 |
New drug | $143,970,707 | $148,326,773 | $153,444,190 | $159,820,656 | $605,562,327 | |
Budget impact | $0 | $523,993 | $771,357 | $1,926,101 | $3,221,452 | |
CADTH base case | Reference | $260,818,044 | $282,276,452 | $289,751,967 | $299,269,641 | $1,132,116,104 |
New drug | $260,818,044 | $283,390,136 | $292,311,382 | $304,207,692 | $1,140,727,255 | |
Budget impact | $0 | $1,113,684 | $2,559,415 | $4,938,052 | $8,611,151 | |
CADTH scenario analysis 1: non–clear cell RCC included | Reference | $347,757,392 | $376,368,603 | $386,335,956 | $399,026,188 | $1,509,488,139 |
New drug | $347,757,392 | $377,853,515 | $389,748,510 | $405,610,257 | $1,520,969,673 | |
Budget impact | $0 | $1,484,912 | $3,412,554 | $6,584,069 | $11,481,535 | |
CADTH scenario 2: LEN 20 mg price | Reference | $261,285,702 | $283,484,643 | $291,734,066 | $301,902,362 | $1,138,406,773 |
New drug | $261,285,702 | $284,503,285 | $294,089,071 | $306,509,387 | $1,146,387,445 | |
Budget impact | $0 | $1,018,642 | $2,355,004 | $4,607,025 | $7,980,671 | |
CADTH scenario 3: IPI + NIVO has smaller market share | Reference | $277,771,156 | $308,366,263 | $318,968,117 | $330,582,228 | $1,235,687,763 |
New drug | $277,771,156 | $309,110,905 | $320,988,002 | $334,597,098 | $1,242,467,161 | |
Budget impact | $0 | $744,642 | $2,019,885 | $4,014,870 | $6,779,397 | |
CADTH scenario 4: Duration of all treatment is 1.24 times longera | Reference | $279,301,496 | $338,426,105 | $347,285,905 | $358,853,082 | $1,323,866,588 |
New drug | $279,301,496 | $339,239,836 | $350,408,179 | $364,485,355 | $1,333,434,866 | |
Budget impact | $0 | $813,730 | $3,122,274 | $5,632,273 | $9,568,277 |
BIA = budget impact analysis; IPI = ipilimumab; LEN = lenvatinib; NIVO = nivolumab; PEM = pembrolizumab; RCC = renal cell carcinoma.
aPatients receiving IPI plus NIVO still received 4 cycles of IPI, with only the duration of NIVO increasing.
Stakeholder Input
Patient Input
Kidney Cancer Canada
About Kidney Cancer Canada
Kidney Cancer Canada (KCC) is a national community of patients, caregivers and health professionals who work to provide every Canadian touched by kidney cancer with support, education and advocacy for their care pathways and treatment options.
Information Gathering
Cabozantinib + Nivolumab has not yet been available to Canadian patients through either clinical trials or patient support plans. As a result, KCC was unable to interview or survey Canadian patients about experience with this therapy.
Some of the content of this submission was informed by the results of the 2022 International Kidney Cancer Coalition Global Survey 2022 which Kidney Cancer Canada helped design and promote. This survey included 2,213 respondents (patients and caregivers) from 39 countries sharing their experiences and insights. Canada had 139 respondents of which 111 (80%) were patients diagnosed with kidney cancer, and 28 (20%) were a caregiver to someone who has been diagnosed with kidney cancer. The survey was designed to explore and benchmark worldwide patient experience in:
Patient knowledge, expectations of treatment and shared decision making
Clinical trials, research awareness and sources of information
Quality of life and overall health status of respondents
Disease Experience
The Canadian Cancer Society (CCS) estimates that (in 2022) there were 8,100 new cases of kidney and renal pelvis cancer diagnosed in Canada. It is the sixth most common cancer in men and the eleventh most common cancer in women. Of the cases of Canadians being diagnosed annually with kidney cancer, approximately 25% will be diagnosed as stage IV metastatic renal cell carcinoma (mRCC). mRCC is a fatal disease with no known cure. For patients with stage IV disease, the survival rate is poor with approximately 12% of these patients surviving for 5 years or longer. Nonetheless, kidney cancer survival has significantly improved over the last 12+ years as a result of new innovative treatments and improved access to those treatments.
New treatments and new treatment combinations are consistently improving the outcomes for patients with mRCC. Different treatment options can impact a person’s life in a variety of ways, and, while risk stratification and site of disease inform treatment decision-making, for individual patients, individual decisions are required, and treatment choice and shared decision-making is extremely important.
Experiences With Currently Available Treatments
KCC has asked patients about their experiences with currently available treatments at various times in the last decade. What we have determined is that while tremendous advancements have been made in drug treatments for advanced RCC, there is a range of severity in adverse events experienced by different patients using the same treatment. When assessing the value of a new drug, the importance overall of treatment choice and patient preference must be recognized, and, for patients who find a specific prescribed drug intolerable, treatment alternatives within that line of therapy are extremely important.
Additionally, treatment decisions should be enabled by treatment choice (when such treatments have strong evidence), patient and disease characteristics, and shared decision-making between patient and treating physician.
One caregiver “KM” recently provided us with a comment with respect to accessing treatments:
“After July 2022 diagnosis of stage IV papillary renal carcinoma, my husband was offered only one option for systematic treatment - pembrolizumab and axitinib. We asked if cabozantinib and nivolumab might be a better option based on evidence of strong and more durable outcomes from recent trials. We were informed that for cabo-nivo a) we could self-fund the treatment and have it given privately at a cost of over $15,000 per month; and b) there would be no funded second line options if we choose this route. It is painful to see patients in the US with papillary RCC receiving cabo-nivo as the standard of care for first line papillary rcc treatment – and not have it available, with second line options – in Canada. As science tells us, first line therapies give rcc patients the strongest chance of durable response – drugs used for salvage have far less efficacy. My husband has missed his chance to have this option. We hope other patients will have access to it.
P.S. I do think the situation is challenging and for us we did consider mortgaging our house and self- funding cabo nivo. But because there are no alternative second line treatments in Canada not to mention third line – for prcc, we decided to accept pembro axi with cabo as the planned second line. We will know this week if axi pembro worked - if not we will have to move to salvage with cabo.
Fingers crossed.”
Improved Outcomes
Access to new effective treatment alternatives is critical to afford patients the opportunity to improve outcomes overall, halt disease progression, to control drug resistance, overcome drug resistance mechanisms. More choice and improved treatments enable patients and oncologists to individualize treatment plans according to specific disease/treatment history and contraindications, thereby enabling the best possible outcomes and quality of life for the patient.
One area where additional treatment options are needed, and where cabozantinib + nivolumab appears to fill an unmet need is papillary RCC. Also, for patients with brain metastasis, a patient subgroup with significant treatment challenges, the cabozantinib component of this combination therapy may be of specific benefit as there is good data showing considerable intracranial activity and an acceptable safety profile in patients with RCC and brain metastases that were treated with cabozantinib as the sole agent.
Experience With Drug Under Review
Recognizing that the CheckMate 9ER had no Canadian sites, and that there was no patient support plan in Canada, KCC was able find patients with experience with this treatment). KCC did reach out to a UK-based patient group in an effort to find patients with experience with this treatment but discovered that cabozantinib + nivolumab has not yet undergone a review there.
Companion Diagnostic Test
Not applicable.
Conflict of Interest Declaration — Kidney Cancer Canada
To maintain the objectivity and credibility of the CADTH reimbursement review process, all participants in the drug review processes must disclose any real, potential, or perceived conflicts of interest. This Patient Group Conflict of Interest Declaration is required for participation. Declarations made do not negate or preclude the use of the patient group input. CADTH may contact your group with further questions, as needed.
Did you receive help from outside your patient group to complete this submission?
No.
Did you receive help from outside your patient group to collect or analyze data used in this submission?
No.
List any companies or organizations that have provided your group with financial payment over the past 2 years AND who may have direct or indirect interest in the drug under review.
IPSEN and B.M.S.
Table 1: Financial Disclosures for Kidney Cancer Canada
Company | $0 to 5,000 | $5,001 to 10,000 | $10,001 to 50,000 | In Excess of $50,000 |
|---|---|---|---|---|
B.M.S. | — | — | — | X |
Eisai | — | — | X | — |
IPSEN | — | — | — | X |
Merck | — | — | — | X |
Pfizer | — | — | — | X |
Clinician Input
Ontario Health (Cancer Care Ontario) Genitourinary Cancer Drug Advisory Committee
About Ontario Health (Cancer Care Ontario) Genitourinary Cancer Drug Advisory Committee
OH-CCO’s Drug Advisory Committees provide timely evidence-based clinical and health system guidance on drug-related issues in support of CCO’s mandate, including the Provincial Drug Reimbursement Programs (PDRP) and the Systemic Treatment Program.
Information Gathering
Information is gathered via emails.
Current Treatments and Treatment Goals
The current treatments are stated in the provisional funding algorithm.
The recommendations for advanced renal cell carcinoma (aRCC) can be found at this reference: https://pubmed.ncbi.nlm.nih.gov/33830005/.
First-line systemic treatment for advanced kidney cancer (i.e., aRCC) considers the IMDC risk categorization/groups. The following reflect available options in the Canadian context:
All IMDC risk groups: Pembrolizumab + Axitinib; alternatives Sunitinib, Pazopanib
Intermediate/poor risk groups: Pembrolizumab + Axitinib; Nivolumab + Ipilimumab; alternatives Sunitinib, Pazopanib.
Subsequent line options include therapies not already used in the aRCC setting, such as: Sunitinib, Pazopanib, Cabozantinib, Axitinib, Nivolumab
All listed drugs do target symptoms in patients such that patients that respond to therapy may feel better and have less pain from painful metastatic lesion. The TKIs are antiangiogenic and modify the biology of the RCC. The PD-(L)1 checkpoint inhibitors leverage the immune system allowing it to target the cancer cells more effectively.
RCC is known to be driven by angiogenesis and thought to thrive by immune escape to some degree. Thus, therapies that inhibit angiogenesis, and activate the immune system would be of benefit.
Treatment goals include an improvement in overall survival (OS) and progression free survival (PFS) with a reduction in the size (objective response rate/ORR) of metastatic lesions in patients with aRCC, with an improved quality of life by controlling symptoms of disease.
Treatment Gaps (Unmet Needs)
Considering the treatment goals, please describe goals (needs) that are not being met by currently available treatments.
This combination significantly improves outcomes for many patients with aRCC and is an important treatment option; however, patients with aRCC are still not routinely cured by available therapies and do become resistant to treatment over time, and most patients still die from their disease. Further options for refractory disease are an unmet need.
Regarding this drug under review, nivolumab and cabozantinib has an ORR of 56% and a CR rate of 12%. It is similar to other combinations of anti-PD1/PDL-1 therapies with antiangiogenic tyrosine kinase blockade. This combination provides a high probability of alleviating symptoms in symptomatic patients and has been shown to improve quality of life (QOL).
Place in Therapy
How would the drug under review fit into the current treatment paradigm?
The combination of nivolumab plus cabozantinib will provide an additional, efficacious first-line systemic therapy option for aRCC, along with axitinib/pembrolizumab, pembrolizumab/lenvatinib, nivolumab/ipilimumab (IMDC intermediate/poor risk), sunitinib, and pazopanib. This combination would be available for all risk groups, whereas nivolumab/Ipilimumab is restricted to intermediate/poor risk.
There is no available high-level data to recommend how to select one treatment combination over another. Treatment selection will be made after patient and treating oncologist’s discussion of the options. Some factors that may be considered are IMDC risk group, suitability for immunotherapy, tumour burden in terms of requiring rapid response, and patient preference. Occasional patients may be considered for a switch to Nivolumab+Cabozantinib, from Nivolumab/Ipilimumab if they experienced severe toxicity to ipilimumab in their first or second dose and these patients would need to be assessed on a case-by-case basis.
The general principle would remain that next line options would involve tyrosine kinase inhibitors (TKIs) not already used in the first line setting. Of note, Nivolumab/Cabozantinib would include or exhaust a generally effective drug usually used in next line treatments in terms of cabozantinib.
Cabozantinib is in the same class of medication as lenvatinib and axitinib (TKIs). Each of these acts on the receptors of tyrosine kinases in a unique fashion, but there is considerable overlap. Nivolumab and pembrolizumab belong to the same class (immune checkpoint inhibitors); they have the same overall mechanism of action in that they inhibit the PD-1 receptor but may have more subtle molecular differences. The treatment paradigm would not necessarily shift but become broader with the addition of this drug under review.
Which patients would be best suited for treatment with the drug under review? Which patients would be least suitable for treatment with the drug under review?
Patients with aRCC across any IMDC risk group who are suitable for immunotherapy and TKI therapy would be potentially eligible for systemic treatment with cabozantinib plus nivolumab.
There are currently no clinical or pathological biomarkers that can predict the best therapy for an individual patient (or who are most likely to exhibit a response).
Best suited: nivolumab and cabozantinib was found in to have activity and improve OS, PFS, duration of response ORR in aRCC patients in the ITT population across IMDC risk groups. As noted, there is not high-level data to choose amongst first line options. However, this combination would be especially useful for very symptomatic patients that need a good response in a short time.
Least suitable: There is no available, high-level data regarding tumour characteristics of aRCC patients that would make treatment “least suitable”. Patients with pre-existing autoimmune conditions requiring corticosteroid use more than 10mg/day of prednisone or needing other systemic treatments for autoimmune condition(s) are at potentially higher risk for side effects (similar considerations with pembrolizumab/axitinib and nivolumab/ipilimumab).
What outcomes are used to determine whether a patient is responding to treatment in clinical practice? How often should treatment response be assessed?
Standard of care to assess patient benefit to therapy include history, physical examination, and radiographic imaging (ie most commonly CT scans). This is identical to what is done with other currently funded first line options.
Standard of care for meaningful response/benefit to patient include improved or stable clinical status (i.e., feeling or functioning better) and stable disease or shrinkage of disease on radiographic imaging (i.e., CT scan).
Clinical assessment per patient/oncologist discretion (i.e., in person or virtual) and imaging usually every 3 months.
What factors should be considered when deciding to discontinue treatment with the drug under review?
Disease progression or serious side effects from nivolumab (ie high-grade immune-related adverse event, irAE) or high-grade AE from cabozantinib despite dose reduction or schedule change. Generally, clinical and radiographic progression (beyond progression where focal therapies could be leveraged) would suggest discontinuing this drug and other combinations for aRCC.
What settings are appropriate for treatment with [drug under review]? Is a specialist required to diagnose, treat, and monitor patients who might receive [drug under review]?
Specialists familiar with this combination would generally provide treatment in an outpatient clinic setting.
Additional Information
While there is another available option in the first-line setting for aRCC that employs checkpoint inhibition plus VEGF-TKI (pembrolizumab+axitinib), the combination under review does portend a very high response rate, lower primary progressive disease rate, and a long progression-free survival – which are relevant clinical endpoints and meaningful to patients.
Conflict of Interest Declarations — Ontario Health (Cancer Care Ontario) Genitourinary Cancer Drug Advisory Committee
To maintain the objectivity and credibility of the CADTH drug review programs, all participants in the drug review processes must disclose any real, potential, or perceived conflicts of interest. This conflict of interest declaration is required for participation. Declarations made do not negate or preclude the use of the clinician group input. CADTH may contact your group with further questions, as needed. Please refer to the Procedures for CADTH Drug Reimbursement Reviews (section 6.3) for further details.
Did you receive help from outside your clinician group to complete this submission? If yes, please detail the help and who provided it.
OH-CCO provided secretariat support to the group in completing this submission.
Did you receive help from outside your clinician group to collect or analyze any information used in this submission?
No.
List any companies or organizations that have provided your group with financial payment over the past two years AND who may have direct or indirect interest in the drug under review. Please note that this is required for each clinician who contributed to the input.
Declaration for Clinician 1
Name: Dr. Girish Kulkarni
Position: Genitourinary Drug Advisory Committee Lead
Date: 13-03-2023
Table 2: COI Declaration for OH-CCO Genitourinary Cancer Drug Advisory Committee — Clinician 1
Company | $0 to 5,000 | $5,001 to 10,000 | $10,001 to 50,000 | In Excess of $50,000 |
|---|---|---|---|---|
No COI | — | — | — | — |
Declaration for Clinician 2
Name: Dr. Reeta Barua
Position: Genitourinary Drug Advisory Committee Member
Date: 12-03-2023
Table 3: COI Declaration for OH-CCO Genitourinary Cancer Drug Advisory Committee — Clinician 2
Company | $0 to 5,000 | $5,001 to 10,000 | $10,001 to 50,000 | In Excess of $50,000 |
|---|---|---|---|---|
No COI | — | — | — | — |
Declaration for Clinician 3
Name: Dr Aly-Khan Lalani
Position: Genitourinary Drug Advisory Committee Member
Date: 13-03-2023
Table 4: COI Declaration for OH-CCO Genitourinary Cancer Drug Advisory Committee — Clinician 3
Company | $0 to 5,000 | $5,001 to 10,000 | $10,001 to 50,000 | In Excess of $50,000 |
|---|---|---|---|---|
Ipsen | X | — | — | — |
BMS | X | — | — | — |
Kidney Cancer Research Network of Canada
About Kidney Cancer Research Network of Canada
The Kidney Cancer Research Network of Canada (KCRNC) is a virtual and inclusive national network of researchers committed to the facilitation of kidney cancer research to enhance the knowledge of kidney cancer and its treatment. KCRNC is a federally registered not-for-profit organization.
Information Gathering
Information used to inform this submission was from clinical experience treating patients with metastatic renal cell carcinoma (mRCC), from familiarity of the published data on relevant clinical trials, (specifically: CheckMate 9ER) and from participating in research.
Current Treatments and Treatment Goals
Metastatic RCC 1st line treatment paradigm has changed dramatically over the last few years, and it has now become standard of care to offer patients immunotherapy-based doublet therapy, either as a PD-1 inhibitor given with a CTLA-4 inhibitor OR with a VEGFR tyrosine kinase inhibitor. Four of these doublet regimens were shown to improve all main oncological outcomes, namely OS, PFS, ORR while maintaining quality of life compared to the previous standard of care, sunitinib. While there is no head-to-head trial to inform which of these new regimens is superior to the other, each of them has different advantage and inconvenience and clinicians who have access to all treatment options can personalize treatment according to patient and disease characteristics. Currently, 3 of these treatments are available for Canadians with RCC:
ipilimumab with nivolumab
axitinib with pembrolizumab
Lenvatinib with pembrolizumab
The other regimen:
cabozantinib with nivolumab is not currently approved nor accessible via access programs.
Amongst approved options, ipilimumab and nivolumab is only indicated for patients with IMDC intermediate/poor risk, leaving out 20% of the patients with IMDC favorable risk disease.
All four treatments regimens were endorsed in 2021 as favored treatment options for first line treatment of metastatic or advanced RCC according to the most recent KCRNC RCC consensus for advanced disease. PMID: 33830005.
Treatment Gaps (Unmet Needs)
Considering the treatment goals, please describe goals (needs) that are not being met by currently available treatments.
Despite the significant progress that has been made in the treatment options and long-term survival outcomes for patients with advanced RCC, several critical unmet needs remain:
Advancements in treatment for RCC have predominantly been limited to the clear cell population. The approximately 20% of patients with non-clear cell RCC need further drug development and more clinical trial options to lead to more standard-of-care options.
Biomarkers capable of predicting response to therapy to help guide decision-making in the frontline and subsequent settings.
Decreasing the attrition of patients between lines of therapy, historically and currently sitting at around 50%.
Optimizing treatment of patients with brain metastases.
Place in Therapy
How would the drug under review fit into the current treatment paradigm?
In the pivotal trial checkmate 9ER, patients randomized to nivolumab and cabozantinib experienced a substantial gain in overall survival, progression free survival and objective response compared to sunitinib, while maintaining the quality of life. The mechanism of action this regimen is relatively similar to axitinib and pembrolizumab (a VEGFR TKI and PD-1 inhibitor) which is already approved in Canada. However, for certain RCC patients, cabozantinib could be a superior VEGFR TKI to partner with a PD-1 inhibitor.
In fact, cabozantinib targets additional important tyrosine kinases receptor (compared to axitinib) such as AXL and MET. Targeting MET is particularly important as it is overexpressed in many papillary RCC, which is a known driver mutation. In the PAPMET trial [NCT02761057] which focused on papillary RCC and heavily enrolled in Canada, cabozantinib was demonstrated to be a superior to sunitinib, a VEGFR that does not target MET.
In CheckMate 9ER, despite enrolling patients with worse disease characteristics [compared to the KeyNote 426 trial of axitinib with pembrolizumab], the rate of progressive disease as best response was only 6%. This is key when treating patients with aggressive disease to prevent early death due to inefficacious treatments. In addition, in the CaboPoint trial reported at ASCO GU symposium 2023 [NCT03945773], cabozantinib demonstrated a response rate of 29% in patients progressing on first line axitinib and pembrolizumab, suggesting that it may be a superior tyrosine kinase inhibitor that has activity when other VEGFR TKI fail.
This concept is also well illustrated in the METEOR trial [NCT01865747], where cabozantinib was superior to everolimus (OS, PFS, and ORR) in patients refractory to up to 2 VEGFR TKI. Given the 50% attrition rates from one line to another, using the most active agents upfront is capital to keep patients alive longer which makes cabozantinib plus nivolumab a key treatment option in high-risk patients.
Patients may also benefit from cabozantinib given the good retrospective data showing excellent brain metastasis activity, which remains a subgroup of patient extremely challenging to treat and where progression of disease is devastating PMID: 34673916.
KCRNC would like to point CADTH to the expert opinion of Dr. Sumanta Pal, M.D., an internationally recognized leader in genitourinary cancers, including kidney cancer. Recently Dr. Pal was interviewed by TargetedOnc.com™ which has a focus on precision medicine in oncology.
https://www.targetedonc.com/view/first-line-treatment-for-advanced-rcc-cabozantinib-nivolumab
In that interview, as part of a series “Evidence-Based Strategies for Selecting the Appropriate Frontline Therapy in Advanced RCC”, Dr. Pal evaluates the combination of cabozantinib + nivolumab as first-line therapy for advanced clear cell renal cell carcinoma, and shares some clinical observations:
“I see that the rates of discontinuation and treatment interruption are lower with cabozantinib- nivolumab vs what’s seen with lenvatinib-pembrolizumab in broad terms. That toxicity issue pivoted me toward cabozantinib-nivolumab for the bulk of patients.”
and
“With the data we have with cabozantinib-nivolumab vs sunitinib, we see the gradual trend toward improvement in quality of life with cabozantinib-nivolumab. It differentiates itself from sunitinib. I don’t see the same with axitinib-pembrolizumab or lenvatinib-pembrolizumab, so that’s another point in favor of using cabozantinib-nivolumab as my preferred frontline approach.”
Which patients would be best suited for treatment with the drug under review? Which patients would be least suitable for treatment with the drug under review?
Cabozantinib plus nivolumab is indicated for patients with any IMDC risk categories as an alternative to axitinib and pembrolizumab. The decision of which regimen to use ultimately depends on patient and disease characteristics as assessed by their medical oncologist in absence of face-to-face trial data and a full discussion with the patient. Papillary RCC seems an obvious subgroup of patients where nivolumab and cabozantinib should be privileged given the MET inhibition capability of cabozantinib. In addition, given the very low rate of progressive disease as best response observed in checkmate 9ER, patients who have very aggressive disease, and cannot tolerate any disease progression, could certainly benefit from the combination of cabozantinib and nivolumab.
There is currently no data suggesting that cabozantinib plus nivolumab would be inferior in some subset of patients. Immunotherapy based therapy such as cabozantinib with nivolumab remains relatively contraindication in patients with certain autoimmune diseases or solid organ transplant, who are more safely treated with single agent TKI.
What outcomes are used to determine whether a patient is responding to treatment in clinical practice? How often should treatment response be assessed?
CT imaging, routine bloodwork, history, and physical examination. Clinical assessment would take place every 4-6 weeks and imaging every 6-12 weeks in the initial stages.
What factors should be considered when deciding to discontinue treatment with the drug under review?
Typically, the combination of therapy is continued until disease progression or unacceptable toxicity. The latter may lead to complete discontinuation of treatment or either one of the two medications. For instance, in presence of severe immune related adverse events, nivolumab could be discontinue while cabozantinib is continued. If patients develop a complete response to therapy, a treatment holidays maybe considered according to patient preferences. However, there is currently no level 1 evidence to support doing so. The above is no different that axitinib and pembrolizumab which is currently approved and available.
What settings are appropriate for treatment with [drug under review]? Is a specialist required to diagnose, treat, and monitor patients who might receive [drug under review]?
As nivolumab is administered intravenously this should be done in an approved oncology infusion clinic or in an outpatient hospital setting. Cabozantinib is an oral treatment that can be taken at home. In general, a medical oncologist or a cancer specialist with experience in administering immunotherapy and targeted agents such as cabozantinib should monitor patients on this regimen.
Additional Information
While several network meta-analyses (NMAs) have found cabozantinib + nivolumab to provide the highest likelihood of maximal OS among the first-line treatments available for mRCC, KCRNC acknowledge that NMAs often contain methodological limitations that impact their applicability in informing drug reimbursement recommendations.
Of critical importance however is that this new treatment combination has tremendous potential to improve outcomes for patients.
To address remaining uncertainty, the KCRNC is uniquely positioned to provide real world evidence through use of the Canadian Kidney Cancer information system (CKCis). The KCRNC, in 2011 established a centralized Canadian kidney cancer database called the Canadian Kidney Cancer information system (CKCis) to collect data from medical centers across the country. CKCis is a web-based national registry supporting the development of clinical and basic research in kidney cancer across Canada. It contains pertinent retrospective, as well as prospective de-identified patient data collected from consented patients who have been diagnosed and treated for renal cell carcinoma.
CKCis is a flexible database platform that can integrate different data needs to accommodate creative innovations considered for research, including those to inform reimbursement decision-making. Data fields are updated as new information emerges regarding the treatment of renal cell carcinoma.
CKCis has now been in operation for over 12 years. Fifteen centers actively accrue kidney cancer patients into the CKCis registry, with over 18,000 patients enrolled with their data being collected. CKCis is now central to the activities of the KCRNC, and the data supported the publication of many manuscripts and abstracts. The network continues to bring together interested clinicians and researchers in kidney cancer and supports the development of active kidney cancer research programs in Canada.
As proof of concept of the ability for the KCRNC to generate high-quality RWE, in April 2017 CKCis was used to inform the very first pCODR Request for Advice (RFA) seeking advice on funding axitinib as an alternative to everolimus for the 2nd line treatment of mRCC. Details here:
https://www.cadth.ca/sites/default/files/pcodr/pcodr_rfa_axitinib_inlyta_mrcc_rfa_cgr.pdf
Conflict of Interest Declarations — Kidney Cancer Research Network of Canada
To maintain the objectivity and credibility of the CADTH drug review programs, all participants in the drug review processes must disclose any real, potential, or perceived conflicts of interest. This conflict of interest declaration is required for participation.
Declarations made do not negate or preclude the use of the clinician group input. CADTH may contact your group with further questions, as needed. Please refer to the Procedures for CADTH Drug Reimbursement Reviews (section 6.3) for further details.
Did you receive help from outside your clinician group to complete this submission?
No.
Did you receive help from outside your clinician group to collect or analyze any information used in this submission?
No.
List any companies or organizations that have provided your group with financial payment over the past two years AND who may have direct or indirect interest in the drug under review. Please note that this is required for each clinician who contributed to the input.
Declaration for Clinician 1
Name: Dominick Bosse
Position: Medical oncologist at the University of Ottawa
Date: 17-03-2023
Table 5: COI Declaration for Kidney Cancer Research Network of Canada — Clinician 1
Company | $0 to 5,000 | $5,001 to 10,000 | $10,001 to 50,000 | In Excess of $50,000 |
|---|---|---|---|---|
Ipsen | — | — | X | — |
BMS | X | — | — | — |
Declaration for Clinician 2
Name: Aly-Khan Lalani
Position: Medical Oncologist, Juravinski Cancer Centre
Date: 22-03-2023
Table 6: COI Declaration for Kidney Cancer Research Network of Canada — Clinician 2
Company | $0 to 5,000 | $5,001 to 10,000 | $10,001 to 50,000 | In Excess of $50,000 |
|---|---|---|---|---|
BMS | X | — | — | — |
IPSEN | X | — | — | — |
Declaration for Clinician 3
Name: Lori Wood
Position: Medical Oncologist
Date: March 18, 2023
Table 7: COI Declaration for Kidney Cancer Research Network of Canada — Clinician 3
Company | $0 to 5,000 | $5,001 to 10,000 | $10,001 to 50,000 | In Excess of $50,000 |
|---|---|---|---|---|
No COI | — | — | — | — |
Declaration for Clinician 4
Name: Simon Tanguay
Position: Professor and Chair, Division of Urology, McGill University
Date: March 24, 2023
Table 8: COI Declaration for Kidney Cancer Research Network of Canada — Clinician 4
Company | $0 to 5,000 | $5,001 to 10,000 | $10,001 to 50,000 | In Excess of $50,000 |
|---|---|---|---|---|
Merck | X | — | — | — |
Tolmar | X | — | — | — |
Tersera | X | — | — | — |
ISSN: 2563-6596
Disclaimer: The information in this document is intended to help Canadian health care decision-makers, health care professionals, health systems leaders, and policy-makers make well-informed decisions and thereby improve the quality of health care services. While patients and others may access this document, the document is made available for informational purposes only and no representations or warranties are made with respect to its fitness for any particular purpose. The information in this document should not be used as a substitute for professional medical advice or as a substitute for the application of clinical judgment in respect of the care of a particular patient or other professional judgment in any decision-making process. The Canadian Agency for Drugs and Technologies in Health (CADTH) does not endorse any information, drugs, therapies, treatments, products, processes, or services.
While care has been taken to ensure that the information prepared by CADTH in this document is accurate, complete, and up-to-date as at the applicable date the material was first published by CADTH, CADTH does not make any guarantees to that effect. CADTH does not guarantee and is not responsible for the quality, currency, propriety, accuracy, or reasonableness of any statements, information, or conclusions contained in any third-party materials used in preparing this document. The views and opinions of third parties published in this document do not necessarily state or reflect those of CADTH.
CADTH is not responsible for any errors, omissions, injury, loss, or damage arising from or relating to the use (or misuse) of any information, statements, or conclusions contained in or implied by the contents of this document or any of the source materials.
This document may contain links to third-party websites. CADTH does not have control over the content of such sites. Use of third-party sites is governed by the third-party website owners’ own terms and conditions set out for such sites. CADTH does not make any guarantee with respect to any information contained on such third-party sites and CADTH is not responsible for any injury, loss, or damage suffered as a result of using such third-party sites. CADTH has no responsibility for the collection, use, and disclosure of personal information by third-party sites.
Subject to the aforementioned limitations, the views expressed herein are those of CADTH and do not necessarily represent the views of Canada’s federal, provincial, or territorial governments or any third party supplier of information.
This document is prepared and intended for use in the context of the Canadian health care system. The use of this document outside of Canada is done so at the user’s own risk.
This disclaimer and any questions or matters of any nature arising from or relating to the content or use (or misuse) of this document will be governed by and interpreted in accordance with the laws of the Province of Ontario and the laws of Canada applicable therein, and all proceedings shall be subject to the exclusive jurisdiction of the courts of the Province of Ontario, Canada.
The copyright and other intellectual property rights in this document are owned by CADTH and its licensors. These rights are protected by the Canadian Copyright Act and other national and international laws and agreements. Users are permitted to make copies of this document for non-commercial purposes only, provided it is not modified when reproduced and appropriate credit is given to CADTH and its licensors.
Redactions: Confidential information in this document may be redacted at the request of the sponsor in accordance with the CADTH Drug Reimbursement Review Confidentiality Guidelines
Stakeholder Input: The views expressed in each submission are those of the submitting organization or individual; not necessarily the views of CADTH or of other organizations. As such, they are independent of CADTH and do not necessarily represent or reflect the view of CADTH. No endorsement by CADTH is intended or should be inferred. By filing with CADTH, the submitting organization or individual agrees to the full disclosure of the information. CADTH does not edit the content of the submissions.
CADTH does use reasonable care to prevent disclosure of personal information in posted material; however, it is ultimately the submitter’s responsibility to ensure no identifying personal information or personal health information is included in the submission. The name of the submitting organization or individual and all conflict of interest information are included in the submission; however, the name of the author, including the name of an individual patient or caregiver submitting the patient input, are not posted.
Accessibility: CADTH is committed to treating people with disabilities in a way that respects their dignity and independence, supports them in accessing material in a timely manner, and provides a robust feedback process to support continuous improvement. All materials prepared by CADTH are available in an accessible format. Where materials provided to CADTH by a submitting organization or individual are not available in an accessible format, CADTH will provide a summary document upon request. More details on CADTH’s accessibility policies can be found here.
About CADTH: CADTH is an independent, not-for-profit organization responsible for providing Canada’s health care decision-makers with objective evidence to help make informed decisions about the optimal use of drugs, medical devices, diagnostics, and procedures in our health care system.
Funding: CADTH receives funding from Canada’s federal, provincial, and territorial governments, with the exception of Quebec.