CADTH Reimbursement Review
Selinexor (Xpovio)
Sponsor: FORUS Therapeutics Inc.
Therapeutic area: Multiple myeloma
This multi-part report includes:
Clinical Review
Pharmacoeconomic Review
Stakeholder Input
Clinical Review
Abbreviations
AE
adverse event
CI
confidence interval
CMH
Cochrane-Mantel-Haenszel
CMRG
Canadian Myeloma Research Group
CR
complete response
CrI
credible interval
CTCAE
Common Terminology Criteria for Adverse Events
CyBorD
cyclophosphamide plus bortezomib plus dexamethasone
DAC
Drug Advisory Committee
DKd
daratumumab plus carfilzomib plus dexamethasone
DOR
duration of response
DRd
daratumumab plus lenalidomide plus dexamethasone
DSMB
Data and Safety Monitoring Board
DVd
daratumumab plus bortezomib plus dexamethasone
ECOG PS
Eastern Cooperative Oncology Group Performance Status
EORTC QLQ-C30
European Organisation for Research and Treatment of Cancer Quality of Life Questionnaire Core 30
EORTC QLQ-CIPN20
European Organisation for Research and Treatment of Cancer 20-item Quality of Life Questionnaire for Chemotherapy-Induced Peripheral Neuropathy
EQ-5D-5L
EQ-5D 5-Levels questionnaire
GHS
global health status
HR
hazard ratio
HRQoL
health-related quality of life
IMWG
International Myeloma Working Group
IRC
independent review committee
Isa
isatuximab
ITC
independent treatment comparison
ITT
intention-to-treat
Kd
carfilzomib plus dexamethasone
MID
minimal important difference
MM
multiple myeloma
NE
not evaluable
NMA
network meta-analysis
OR
odds ratio
ORR
overall response rate
OS
overall survival
Pd
pomalidomide plus dexamethasone
PFS
progression-free survival
PI
proteasome inhibitor
PN
peripheral neuropathy
PR
partial response
PVd
pomalidomide plus bortezomib plus dexamethasone
QoL
quality of life
RCT
randomized controlled trial
Rd
lenalidomide plus dexamethasone
R-ISS
Revised International Staging System
SAE
serious adverse event
sCR
stringent complete response
SdX
selinexor plus dexamethasone after crossover
SVd
selinexor plus bortezomib plus dexamethasone
SVdX
selinexor after crossover
TTD
time to treatment discontinuation
TTNT
time to next treatment
TTR
time to response
VAS
Visual Analogue Scale
Vd
bortezomib plus dexamethasone
VGPR
very good partial response
Executive Summary
An overview of the submission details for the drug under review is provided in Table 1.
Item | Description |
|---|---|
Drug product | Selinexor (Xpovio) 100 mg orally |
Indication | Proposed: In combination with bortezomib and dexamethasone for the treatment of adult patients with multiple myeloma who have received at least 1 prior therapy |
Reimbursement request | As per indication |
Health Canada approval status | Under review (pre-NOC) |
Health Canada review pathway | Standard |
NOC date | To be determined |
Sponsor | FORUS Therapeutics Inc. |
NOC = Notice of Compliance.
Introduction
Multiple myeloma (MM) is a plasma cell cancer caused by the growth of cancer cells in the bone marrow. In Canada, more than 3,000 new cases of MM are diagnosed annually, with slightly more cases occurring in men than women.1 Multiple myeloma is generally incurable, with a median survival for patients of approximately 5 years, and during this time patients can receive 4 or more lines of therapy.2 It is a heterogenous condition that typically affects older adults around the age of 65 years, and patient outcomes can depend on many factors, including disease stage, prognostic indicators, and early treatment of symptomatic disease to limit or avoid organ damage.1 Patients may initially present with symptoms including bone pain, lytic lesions, anemia, fatigue, infections, weight loss, hypercalcemia, and renal dysfunction.1 Patients may also have cytogenetic abnormalities that can influence the course of their disease, response to therapy, and overall prognosis.
The treatment landscape for MM has changed significantly in the recent past, with the emergence of new therapies in newly diagnosed and relapsed or refractory settings.2 Treatment choices for patients depend on whether they are eligible for stem cell transplant. Most patients in Canadian clinical practice will receive a lenalidomide based regimen. At relapse, treatment for patients depends on age, comorbidities, and previous treatments. Most patients will receive a daratumumab containing regimen. Other treatment options as patients continue to progress can include regimens containing carfilzomib, pomalidomide, isatuximab, or belantamab; funding of these regimens varies across Canadian jurisdictions and, in some cases, treatments may only be available through special access programs.
Selinexor is to be administered in combination with bortezomib and dexamethasone. Selinexor is to be administered at a dosage of 100 mg orally once weekly on day 1 of each week. Bortezomib is to be administered at a dosage of 1.3 mg/m2 by subcutaneous (SC) injection once weekly on day 1 of each week for 4 weeks followed by 1 week off. Dexamethasone is to be administered at a dosage of 20 mg orally twice weekly on days 1 and 2 of each week.3 Selinexor was submitted to CADTH before Notice of Compliance and was anticipated to be approved by Health Canada on June 2, 2022. Selinexor has not previously been reviewed by CADTH. The sponsor has requested reimbursement of selinexor as per the Health Canada indication.
The objective of this review is to perform a systematic review of the beneficial and harmful effects of selinexor (Xpovio) at 100 mg administered orally in combination with bortezomib and dexamethasone for the treatment of adult patients with MM who have received at least 1 prior therapy.
Stakeholder Perspectives
The information in this section is a summary of input provided by the patient groups that responded to CADTH’s call for patient input and from clinical experts consulted by CADTH for the purpose of this review.
Patient Input
One patient group, Myeloma Canada, provided input on the combination of selinexor plus bortezomib plus dexamethasone (SVd) for the treatment of MM in adult patients. The patient group conducted an online survey that was distributed through email and social media and made available to patients and caregivers across Canada from December 2021 to January 2022. According to Myeloma Canada, patients considered it extremely important to control symptoms of infections, kidney problems, mobility, and neuropathy related to myeloma. Patients also indicated that symptoms significantly affected their abilities to travel, work, exercise, and concentrate. Parking costs, travel costs, drug costs, lost income due to absence from work, and lost income or pensions due to early retirement were described as the most significant financial implications of myeloma treatment. Patients receiving treatment with bortezomib and dexamethasone described fatigue, diarrhea, and nausea as “totally unbearable” side effects. “Tolerable” side effects were anemia and thrombocytopenia. Peripheral neuropathy (PN) was highlighted by many patients as a side effect and an important symptom to control and reduce in severity. Two respondents had experience with SVd through participation in the BOSTON trial; 1 respondent had not relapsed since receiving SVd through the BOSTON trial, while the other relapsed within 3 months and was receiving a different treatment. Nausea was stated to be a “somewhat tolerable” side effect, while diarrhea, PN, and vomiting were “somewhat intolerable.” Other reported side effects included thrombocytopenia, anemia, fatigue, decreased appetite, and weight decrease. One patient indicated the trial regimen was very effective in helping control their myeloma, while the other patient reported that it was somewhat ineffective. Respondents mentioned the following as being important considerations for new treatments: effectiveness of treatment, quality of life, accessibility and portability of treatment, manageable side effects, and access to a supportive and communicative care team. The side effects that patients most frequently ranked as important to avoid when considering new treatments included infections, vomiting, pain, confusion, decreased appetite, and neuropathy. Many patients indicated a preference for an orally administered treatment versus SC injection and infusion. Many respondents indicated that fewer trips to a cancer centre or hospital for treatment would improve their quality of life.
Clinician Input
Input From Clinical Experts Consulted by CADTH
The clinical experts emphasized the need for treatments that improve survival, provide deeper and longer-lasting remissions, and improve disease-related symptoms and complications, such as pain and renal failure. In addition, treatments would have less of a negative impact on patient quality of life and require fewer clinic visits. The clinical experts acknowledged that most patients will relapse with currently available therapies. Treatments are palliative and may prolong patients’ lives, but they do not provide patients with a cure, and patients will eventually become refractory to available treatments. Patients with high-risk cytogenetics and who are ineligible for transplant were stated to be at a particularly high risk of progression and poor outcomes. The experts noted that the side effects of some treatments affect tolerability to treatment and effectiveness. Many treatment options for patients are provided intravenously or subcutaneously at a cancer centre as often as once or twice per week, resulting in significant burdens for patients, caregivers, and treatment centres. Selinexor could be an attractive option for patients as it is administered orally and only once per week, potentially reducing the need for clinic visits. The clinical experts acknowledged that selinexor would not require a significant paradigm shift and that other therapies for MM are available. However, selinexor operates under a mechanism of action that is different to other currently available treatments and may be effective in patients who become resistant to treatments that target other pathways. The clinical experts agreed that other regimens would likely be preferred before using a selinexor based regimen. The toxicity profile of selinexor was also described as different from that of other classes of drugs. The clinical experts agreed that no specific features make a patient a better candidate for selinexor. Patients with pre-existing anorexia, weight loss, or nausea may not be good candidates for this treatment as the side effect profile of selinexor is associated with anorexia, weight loss, or nausea.
A patient’s response to therapy is typically measured through monoclonal protein and serum free light chains; based on these evaluations, a clinically meaningful response would include a sustained partial response (PR) or better. Stable disease may also be considered an acceptable benefit to patients in some cases. Improvements in cancer-related complications, such as anemia, renal failure, hypercalcemia, and tumour-related pain, are also considered when assessing patient responses. In general, meaningful responses to treatment are expected to manifest through improvements in patients’ overall survival (OS) and progression-free survival (PFS). Improvements in quality of life (QoL), myeloma-related symptoms, and treatment toxicity were also stated to be important outcomes when assessing patients’ responses to treatment. Typically, patients may be assessed for response every 4 weeks, although less-frequent monitoring may be warranted if patients demonstrate stable long-term response and predictable and manageable toxicity.
The clinical experts agreed that discontinuing treatment should depend on whether a patient’s disease progresses, which is determined when patients fail to respond to treatment and require a change in their therapy. Significant toxicities or adverse events (AEs) that are not manageable through supportive care or dose modifications were also stated to result in discontinuation of therapy. Both clinical experts acknowledged that administration of therapies requires a specialty hematology or oncology clinic or the equivalent. Physicians with expertise and experience in treating MM, such as hematologists or oncologists, would be treating and monitoring patients. The clinical experts highlighted that changes to the treatment paradigm for MM patients are likely to occur with approval of daratumumab in the first-line setting. Because most patients will likely receive daratumumab plus lenalidomide plus dexamethasone (DRd) as a first-line therapy, these patients will not receive daratumumab-based regimens upon relapse. The next-line option for patients will likely be a combination regimen of bortezomib and another proteosome inhibitor (PI), such as cyclophosphamide plus bortezomib plus dexamethasone (CyBorD) or carfilzomib plus dexamethasone(Kd). Although selinexor could be considered as a second-line option, it may be more likely for SVd to be used in later lines of therapy.
Clinician Group Input
Two groups provided clinician input on the review of SVd for the treatment of adult patients with MM: the Ontario Health–Cancer Care Ontario (OH-CCO) Hematology Drug Advisory Committee (DAC) prepared by 7 physicians and the Canadian Myeloma Research Group (CMRG) prepared by 13 physicians. Both groups generally agreed that improving OS, PFS, disease-related symptoms, and health-related quality of life (HRQoL) are important goals for ideal treatment. The OH-COO group indicated the greatest unmet need for patients currently exists after the second-line setting; patients who failed daratumumab in the second-line setting could have the option to use this regimen in the third line. CMRG described the need for new classes of anti-myeloma drugs to complement available treatments and improve patient convenience (e.g., with oral administration) and toxicity profiles. Both groups agreed that patients who have the greatest unmet need for a selinexor-based regimen are those with relapsed or refractory multiple myeloma (RRMM) who are refractory to immunomodulatory inhibitors, PIs, and anti-CD38 monoclonal antibodies. The CMRG also noted that patients with renal insufficiency and poor risk features (e.g., high-risk cytogenetics, extramedullary disease, or highly proliferative disease) have the greatest unmet need for this therapy.
Selinexor was stated to be currently available through special access programs and was acknowledged by the CMRG to differ from currently available therapies based on route of administration, side-effect profile, and supportive care needs. Therapies such as selinexor that differ from currently available treatment options were stated to be sought after by physicians in Canada after patients progress through funded options and are not yet candidates for palliative care. The OH-CCO DAC expressed uncertainty about the specific placement of SVd in the current treatment paradigm. However, both groups generally agreed that daratumumab- or isatuximab-based treatments would be preferred as second-line regimens before recommending SVd. Both groups agreed that this drug would not affect the treatment sequence employed in current practice.
Both clinician groups acknowledged that eligible patients would be identified by their treating physician or hematologist. The OH-CCO DAC did not specify criteria for patients least suited for treatment, although the CMRG indicated that newly diagnosed patients with MM would be least suitable for treatment with SVd. Both groups indicated that patient responses to treatment would be assessed using conventional myeloma response criteria. A clinically meaningful response to treatment in the setting of advanced disease was stated to include a reduction in measurable disease. Both groups agreed that a patient’s response to treatment would be assessed each cycle or approximately every month. Both groups agreed that discontinuation of treatment would be based on disease progression and toxicity. Both groups agreed that SVd would be administered in outpatient clinics, hematology clinics, and hospitals.
Drug Program Input
The drug programs identified the following jurisdictional implementation issues: relevant comparators, considerations for initiation of therapy, considerations for prescribing of therapy, the funding algorithm, care provision, and system and economic issues. The clinical experts consulted by CADTH weighed evidence from the key study submitted by the sponsor and clinical expertise to provide responses to the drug programs’ implementation questions (Table 4).
Clinical Evidence
Pivotal Studies and Protocol-Selected Studies
Description of Studies
One multi-centre, phase III, active-controlled, open-label study, BOSTON, was included in this CADTH review. The objective of the BOSTON trial was to compare the efficacy, HRQoL, and safety of SVd to that of bortezomib plus dexamethasone (Vd) in adult patients with RRMM who received 1 to 3 prior anti-MM regimens. Patients were randomized to receive SVd or Vd in a 1:1 ratio and stratified based on prior PI therapy (yes versus no) and number of prior anti-MM regimens (1 versus > 1). Inclusion criteria included adult patients with histologically confirmed MM and measurable disease according to International Myeloma Working Group (IMWG) guidelines who had received between 1 and 3 prior anti-MM regimens. Patients had to have documented evidence of progressive MM on or after their most recent regimen. Patients previously treated with bortezomib or another PI were eligible if certain criteria were met (Table 6). Patients must also have had an Eastern Cooperative Oncology Group Performance Status (ECOG PS) of 2 or lower. Exclusion criteria included previous exposure to selective inhibitor of nuclear export (SINE) compounds, including selinexor, previous malignancies requiring treatment, or evidence of recurring and uncontrolled comorbidities. Patients could not have PN higher than grade 2, or a PN of grade ≥ 2 or higher with pain at baseline, regardless of whether or not they were receiving medication. The primary end point of the BOSTON trial was PFS. Key secondary end points included overall response rate (ORR), incidence of PN events of grade 2 or higher, response rates of very good partial response (VGPR) or better based on independent review committee (IRC) assessment. Other secondary end points included OS, duration of response (DOR), time to next treatment (TTNT), time to response (TTR), and HRQoL.
In general, characteristics across both the SVd and Vd treatment groups were well balanced. The mean age of patients was 65 years (standard deviation [SD] = 9.56) in the SVd group and 67 years (SD = 9.35) in the Vd group, with most patients aged 51 to 64 years (36% in the SVd group versus 31% in the Vd group), 65 to 74 years (39% versus 41%, respectively), or 75 years or older (17% versus 23%, respectively). Fewer patients were between 18 to 50 years of age (8% versus 5%). A slightly greater proportion of males was enrolled in the trial (59% versus 56% in the SVd and Vd groups). Most patients were White (83% versus 80% in the SVd and Vd groups) and not Hispanic or Latino (88% versus 91%), had never smoked (73% versus 74%), and had an ECOG PS of 0 (35% versus 37%) or 1 (54% versus 55%), a mean creatinine clearance at baseline of greater than 60 mL/min (71% versus 66%), and a status of nonfrail at baseline (66% versus 69%). Approximately one-quarter of patients (25% in the SVd group versus 27% in the Vd group) had stage I disease at diagnosis, compared to one-third who were diagnosed with stage II (32% versus 27%, respectively), and one-third with stage III (29% versus 32%). More than half of all patients had a kappa light chain type of active myeloma at baseline (56% versus 61% in the SVd group and Vd group, precatively). The Revised International Staging System (R-ISS) stage at screening was stage I for 29% of patients in the SVd group versus 25% in the Vd group, stage II for 60% of patients in both groups, and 6% and 7%, respectively, for stage III. Approximately half of all patients had a high-risk chromosomal abnormality, with most being 1q21 (41% versus 34% in the SVd and Vd groups, respectively) compared to t(4;14) (11% versus 14%), del(17p)/p53 (11% versus 8%), or t (14;16) (4% versus 5%). The mean number of prior lines of anti-MM therapy was 1.7 in both treatment groups; 51% versus 48% of patients in the SVd and Vd groups, respectively, had 1 prior line of therapy, compared to 33% and 31% of patients with 2 prior lines of anti-MM therapy, and 16% versus 21% of patients with 3 prior lines of anti-MM therapy. Most patients had received prior PI therapy (76% in the SVd group versus 77% in the Vd group). Other treatments patients had been previously exposed included bortezomib (69% versus 70% in the SVd and Vd groups, respectively), lenalidomide (40% versus 37%), carfilzomib (10% in both groups), pomalidomide (6% versus 3%), daratumumab (6% versus 3%), and ixazomib (3% versus 1%). Slightly more patients in the SVd group received a stem cell transplant (39%) compared with the Vd group (30%).
Efficacy Results
Results from the BOSTON trial were reported for 2 data cut-offs. The primary analysis was a pre-specified interim analysis and was based on a data cut-off on February 18, 2020. In agreement with the Data and Safety Monitoring Board (DSMB), the results of this interim analysis were considered final, as the stopping boundary for PFS had been reached. The updated analysis was based on a data cut-off date of February 15, 2021; results of the updated analysis were considered descriptive. The results of the updated analysis were supportive of the primary analysis; the results are not described here but are reported in Table 2.
Table 2: Summary of Key Results From Pivotal and Protocol-Selected Studies
Result | Primary analysis (February 18, 2020) | Updated analysis (February 15, 2021) | ||
|---|---|---|---|---|
SVd group N = 195 | Vd group N = 207 | SVd group N = 195 | Vd group N = 207 | |
Overall survival | ||||
Patients with events, n (%) | ||||
Death | 47 (24.1) | 62 (30.0) | 68 (34.9) | 80 (38.6) |
Median follow-up time, months (95% CI) | 17.28 (16.56 to 18.27) | 17.51 (17.08 to 18.23) | 28.71 (27.24 to 29.90) | 28.65 (27.63 to 29.67) |
Median OS (95% CI), months | NE (NE to NE) | 24.97 (23.49 to NE) | 36.67 (30.19 to NE) | 32.76 (27.83 to NE) |
Hazard ratio (95% CI)a,b | 0.8402 (0.5738 to 1.2304) | 0.8764 (0.6313 to 1.2168) | ||
1-sided P valuea | 0.1852 | 0.2152c | ||
Progression-free survival | ||||
Patients with events, n (%) | 80 (41.0) | 124 (59.9) | 92 (47.2) | 137 (66.2) |
Progressive disease | 69 (35.4) | 111 (53.6) | 79 (40.5) | 122 (58.9) |
Death | 11 (5.6) | 13 (6.3) | 13 (6.7) | 15 (7.2) |
Median follow-up time, months (95% CI) | 13.17 (10.64 to 15.34) | 16.53 (14.39 to 17.71) | 13.47 (10.64 to 24.87) | 24.48 (21.16 to 29.17) |
Median PFS (95% CI), months | 13.93 (11.73 to NE) | 9.46 (8.11 to 10.78) | 13.24 (11.73 to 23.43) | 9.46 (8.11 to 10.78) |
Hazard ratio (95% CI) | 0.7020 (0.5279 to 0.9335)a,b | 0.7096 (0.5417 to 0.9296) | ||
1-sided P value | 0.0075a | 0.0064c | ||
Duration of response | ||||
Patients who achieved a PR or better, n (%) | 149 (76.4) | 129 (62.3) | 150 (76.9) | 131 (63.3) |
Patients with events, n (%) | 53 (35.6) | 66 (51.2) | 65 (43.3) | 79 (60.3) |
Progressive disease | 47 (31.5) | 61 (47.3) | 57 (38.0) | 72 (55.0) |
Death | 6 (4.0) | 5 (3.9) | 8 (5.3) | 7 (5.3) |
Median DOR, months (95% CI) | 20.27 (12.55 to NE) | 12.88 (9.26 to 15.77) | 17.28 (12.55 to 26.25) | 12.88 (9.26 to 15.77) |
Time to next treatment | ||||
Patients with events, n (%) | 88 (45.1) | 135 (65.2) | NR | NR |
New MM treatment | 69 (35.4) | 116 (56.0) | NR | NR |
Death | 19 (9.7) | 19 (9.2) | NR | NR |
Median TTNT, months (95% CI) | 16.13 (13.93 to NE) | 10.84 (9.82 to 13.40) | NR | NR |
Hazard ratio (95% CI)a,b | 0.6587 (0.5017 to 0.8648) | NR | NR | |
1-sided P valueb | 0.0012 | NR | NR | |
Time to treatment discontinuation | ||||
Patients with events n (%) | ||||
Treatment discontinuation | 158 (81.0) | 171 (82.6) | NR | NR |
Hazard ratio (95% CI)a,b | 0.9894 (0.7937 to 1.2333) | NR | NR | |
1-sided P valueb | 0.4601 | NR | NR | |
Time to response | ||||
Patients with an IRC-confirmed ≥ PR, n (%) | 149 (76.4) | 129 (62.3) | NR | NR |
Media time to ≥ PR, months (SD) | 1.1 (0.81) | 1.4 (1.41) | NR | NR |
Death | 19 (9.7) | 19 (9.2) | NR | NR |
Median TTR, months (95% CI) | 1.41 (1.35 to 1.51) | 1.61 (1.51 to 2.14) | NR | NR |
Hazard ratio (95% CI)a b | 1.6712 (1.3064 to 2.1379) | NR | NR | |
1-sided P valueb | < 0.0001 | NR | NR | |
Overall response rate | ||||
Overall response rate,d n (%) (exact 95% CI) | 149 (76.4) (69.8 to 82.2) | 129 (62.3) (55.3 to 68.9) | 150 (76.9) (70.4 to 82.6) | 131 (63.3) (56.3 to 69.9) |
Best overall response, n (%) | ||||
Stringent complete response | 19 (9.7) | 13 (6.3) | 19 (9.7) | 13 (6.3) |
Complete response | 14 (7.2) | 9 (4.3) | 14 (7.2) | 9 (4.3) |
Very good PR | 54 (27.7) | 45 (21.7) | 54 (27.7) | 45 (21.7) |
PR | 62 (31.8) | 62 (30.0) | 63 (32.3) | 64 (30.9) |
Minimal response | 16 (8.2) | 20 (9.7) | 15 (7.7) | 18 (8.7) |
Stable disease | 25 (12.8) | 40 (19.3) | 25 (12.8) | 40 (19.3) |
Progressive disease | 1 (0.5) | 10 (4.8) | 1 (0.5) | 10 (4.8) |
Not evaluable | 4 (2.1) | 8 (3.9) | 4 (2.1) | 8 (3.9) |
Harms for safety population | ||||
Safety population, N | 195 | 204 | 195 | 204 |
Harms for the safety population, n (%) | ||||
AEs | 194 (99.5) | 198 (97.1) | 194 (99.5) | 198 (97.1) |
Patients with any grade 3 or 4 AE | 154 (79.0) | 114 (55.9) | 153 (78.5) | 115 (56.4) |
Patients with any grade ≥ 3 AE | 166 (85.1) | 125 (61.3) | 167 (85.6) | 128 (62.7) |
SAEs | 101 (51.8) | 77 (37.7) | 106 (54.4) | 79 (38.7) |
AEs leading to dose modifications | 173 (88.7) | 156 (76.5) | 173 (88.7) | 156 (76.5) |
AEs leading to treatment discontinuation | 41 (21.0) | 32 (15.7) | 41 (21.0) | 34 (16.7) |
Deaths | 12 (6.2) | 11 (5.4) | 14 (7.2) | 13 (6.4) |
Notable harms | ||||
Peripheral neuropathy | 63 (32.3) | 96 (47.1) | 65 (33.3) | 99 (48.5) |
Pain | 5 (2.6) | 4 (2.0) | 5 (2.6) | 4 (2.0) |
Anorexia | 0 | 0 | 0 | 0 |
Nausea | 98 (50.3) | 20 (9.8) | 98 (50.3) | 21 (10.3) |
Gastrointestinal disorders (system organ class) | 135 (69.2) | 91 (44.6) | 136 (69.7) | 93 (45.6) |
Thrombocytopenia | 117 (60.0) | 55 (27.0) | 121 (62.1) | 56 (27.5) |
Neutropenia | 29 (14.9) | 12 (5.9) | 30 (15.4) | 13 (6.4) |
AE = adverse event; CI = confidence interval; DOR = duration of response; IRC = independent review committee; MM = multiple myeloma; NE = not evaluable; NR = not reported; PFS = progression-free survival; PR = partial response; SAE = serious adverse event; SVd = selinexor plus bortezomib plus dexamethasone; TTNT = time to next treatment; TTR = time to response; Vd = bortezomib plus dexamethasone.
Note: Overall survival is calculated from the date of randomization to the date of death. Patients without events were censored at the date of study discontinuation or date of last participating visit, whichever occurred first. DOR is defined for patients with a confirmed PR or better as the duration from the date of first IRC-confirmed PR or better to the date of first IRC-confirmed progressive disease, or death due to any cause, whichever occurred first.
aStratified for prior proteosome inhibitor therapies, number of prior anti-MM regimens and Revised International Staging System stage at screening.
bBased on a stratified Cox proportional hazards model with the Efron method of handling ties.
cP value is considered nominal as results for the updated analysis were not pre-specified or controlled for multiplicity.
dOverall response rate is the proportion of patients who achieve a partial response or better, before IRC-confirmed progressive disease (PD) or initiating a new MM treatment or crossover.
Source: BOSTON Clinical Study Report.4
Overall Survival
At the time of the primary analysis, results for OS were based on a median follow-up time of 17.28 months (95% confidence interval [CI], 16.56 to 19.27) in the SVd group and 17.51 (95% CI, 17.08 to 18.23) in the Vd group. Similar proportions of patients died in the SVd (24.1%) and Vd (30.0%) treatment groups. The median OS was not evaluable [NE] (95% CI, NE to NE) in the SVd group and 24.97 months (95% CI, 23.49 to NE) in the Vd group. The hazard ratio (HR) of death was 0.84 (95% CI, 0.57 to 1.23; 1-sided P = 0.1852, stratified log-rank test). At this point, 75 patients (36%) from the Vd group had crossed over to the SVdX (selinexor plus bortezomib plus dexamethasone after crossover) or SdX (selinexor plus dexamethasone after crossover) groups.
Progression-Free Survival
A median follow-up time of 13.17 months (95% CI, 10.64 to 15.34) was reported for the SVd group and 16.53 months (95% CI, 14.39 to 17.71) for the Vd group. At the primary analysis, a higher proportion of patients in the Vd group experienced a PFS event compared with patients in the SVd group (59.9% versus 41.0%, respectively). The median PFS was longer in the SVd group at 13.93 months (95% CI, 11.73 to NE) compared to 9.46 months (95% CI, 8.11 to 10.78) in the Vd group. An HR of 0.70 (95% CI, 0.53 to 0.93) was reported for PFS, indicating an increase in PFS of 4.47 months and a 30% reduction in risk of disease progression or death in the SVd group compared to the Vd group (1-sided P = 0.0075, stratified log-rank test).
Duration of Response
At the primary analysis, more patients in the SVd group had achieved a PR or better (76.4%) compared with the Vd group (62.3%). The median DOR was 20.27 months (95% CI, 12.55 to NE) in the SVd group compared to 12.88 months (95% CI, 9.26 to 15.77) in the Vd group.
Time to Next Treatment
There were fewer patients in the SVd groups with TTNT events (45.1%) versus the Vd group (65.2%). The median TTNT was longer in the SVd group, at 16.13 months (95% CI, 13.92 to NE), than in the Vd group, at 10.84 months (95% CI, 9.82 to 13.40). There was a longer median treatment-free interval for patients with new MM treatment in the SVd group at 28.0 days (range, 1 to 447) than in the Vd group at 14.0 days (range, 1 to 419).
Time to Treatment Discontinuation
There were no differences between the SVd and Vd treatment groups in patients discontinuing treatment (81.0% versus 82.6%, respectively). The median TTD in the SVd group was 7.10 months (95% CI, 6.44 to 8.54) and 7.95 months (95% CI, 6.80 to 9.23) in the Vd group.
Time to Response
A greater proportion of patients in the SVd group had an IRC-confirmed response of a PR or greater (76.4%) compared with the Vd group (62.3%). The median TTR was numerically shorter in the SVd group, at 1.41 months (95% CI, 1.35 to 1.51) than in the Vd group, at 1.61 months (95% CI, 1.51 to 2.14).
Overall Response Rate
At the primary analysis, 149 patients had an overall response rate (76.4%; 95% CI, 69.8 to 82.2) in the SVd group compared to 129 patients (62.3%; 95% CI, 55.3 to 68.9) in the Vd group. There were no differences in the best overall response of patients between the 2 treatment groups. Most patients achieved a PR (31.8% in the SVd group versus 30.0% in the Vd group), VGPR (27.7% versus 21.7%, respectively), or stable disease (12.8% versus 19.3%, respectively).
Rate of Very Good Partial Responses or Better Responses
At the primary analysis, a VGPR, complete response (CR), or stringent complete response (sCR) was observed in 87 (44.6%) of 195 patients from the SVd group and 67 (32.4%) of 207 patients from the Vd group (odds ratio [OR] = 1.6594; 95% CI, 1.0993 to 2.5049; P = 0.0082).
Health-Related Quality of Life
Patient-Reported Peripheral Neuropathy Measured by EORTC QLQ-CIPN20
Baseline scores for the sensory, motor, and autonomic neuropathy symptoms subscales were similar between the 2 treatment groups. Regarding the sensory and motor subscales, a greater proportion of patients in the Vd group had higher post-baseline scores that showed increases from baseline equal to or greater than 10, 20, 30, 40, or 50 compared with the SVd group, indicating worse symptoms for patients in the Vd group. Regarding the autonomic subscale, a greater proportion of patients in the SVd group had higher post-baseline scores that showed increases from baseline equal to or greater than 10, 20, 30, 40, or 50 compared with the Vd group, indicating worse symptoms for patients in the SVd group. Linear mixed-effect models were also applied to scores on the European Organisation for Research and Treatment of Cancer 20-item Quality of Life Questionnaire for Chemotherapy-Induced Peripheral Neuropathy (EORTC QLQ-CIPN20); a lower mean change from baseline was observed in the SVd group compared to the Vd group for the sensory, motor symptoms, and autonomic subscale, indicating a lower symptom burden in the SVd treatment group. The results of the autonomic symptom score were broken down to its 3 components of blurred vision, difficulty with erection, and dizzy when standing up. The SVd and Vd groups showed similar scores in the dizziness and erectile-function components. The SVd group showed higher scores for blurred vision compared with the Vd group, indicating greater symptom burden. There were no statistically significant differences between the SVd and Vd groups on any of the subscales.
European Organisation for Research and Treatment of Cancer Quality of Life Questionnaire Core 30
The European Organisation for Research and Treatment of Cancer Quality of Life Questionnaire Core 30 (EORTC QLQ-C30) questionnaires were completed at baseline and at least 1 post-baseline time point by 188 patients in the SVd group and 195 patients in the Vd group. The mean baseline scores of patients were similar between the SVd and Vd group for the global health status (GHS) and QoL measure. There were no differences in GHS scores over time between the SVd and Vd groups. There were no statistically significant differences in the domains of the EORTC QLQ-C30 between SVd and Vd treatment groups.
EQ-5D 5-Levels
Baseline scores of patients in the SVd and Vd groups were similar for the EQ-5D 5-Levels (EQ-5D-5L) Visual Analogue Scale (VAS) and there were no differences between treatment groups throughout the trial. No major differences were observed for any other symptom domains.
Harms Results
Adverse Events
The most commonly occurring AEs included thrombocytopenia (60.0% in the SVd group versus 27.0% in the Vd group), nausea (50.2% versus 9.8%, respectively), fatigue (42.1% versus 18.1%), diarrhea (32.3% versus 25.0%), anemia (36.4% versus 23.0%), decreased appetite (35.4% versus 5.4%), PN (32.3% versus 47.1%), decreased weight (26.2% versus 12.3%), asthenia (24.6% versus 13.2%), cataracts (21.5% versus 6.4%), and vomiting (20.5% versus 4.4%). These AEs were all more commonly reported in the SVd group than in the Vd group, except for PN, which occurred more frequently in the Vd group. Other AEs that occurred more frequently in the SVd group included neutropenia (14.9% in the SVd group versus 5.9% in the Vd group), dizziness (12.3% versus 3.9%, respectively), and nasopharyngitis (11.8% versus 4.9%, respectively).
Grade 3 and 4 AEs also occurred more frequently in the SVd group at 79.0% compared to 55.9% of patients in the Vd group. Grade 3 or higher AEs occurred in 85.1% of patients in the SVd group compared to 61.3% of patients in the Vd group. The most commonly occurring grade 3 or higher AEs were thrombocytopenia (39.5% in the SVd group versus 17.2% in the Vd group) and anemia (15.9% versus 10.3%, respectively).
Serious Adverse Events
Serious adverse events (SAEs) were more frequent in the SVd group at 51.8% compared to 37.7% of patients in the Vd group. The most common SAE was pneumonia, which occurred in 11.8% of patients in each treatment group.
Adverse Events Leading to Dose Modifications
AEs leading to dose modifications were more frequent in the SVd group (88.7%) than in the Vd group (76.5%). Specifically, AEs leading to dose reductions or dose interruptions were both more common in the SVd group than in the Vd group (72.3% versus 51.0%, and 85.6% versus 68.1%, respectively).
Mortality
Deaths were reported for 6.2% patients in the SVd group and 5.4% patients in the Vd group. A breakdown of the causes of death is reported in Table 32. The most common cause of death in the SVd group was septic shock (1.5%) and pneumonia (1.0%). The most common cause of death in the Vd group was pneumonia (1.5%).
Notable Harms
Notable harms pre-specified in the CADTH systematic review protocol included pain, anorexia, nausea, gastrointestinal disorders, thrombocytopenia, and neutropenia. The incidence of pain was similar between both treatment groups (2.6% of patients in the SVd group versus 2.0% in the Vd group). No patients reported anorexia. Nausea (50.3% in the SVd group versus 9.8% in the Vd group), gastrointestinal disorders (69.2% versus 44.6%, respectively), thrombocytopenia (60.0% versus 27.0%) and neutropenia (15.9% versus 5.9%) were more common in the SVd group than in the Vd group.
The incidence of grade 2 or higher PN events was a key secondary safety end point of the BOSTON trial. The CADTH systematic review protocol also pre-specified PN as a notable harm. Peripheral neuropathy was less commonly reported in the SVd group than in the Vd group at the primary analysis (21.0% versus 34.3%, respectively). Most events were grade 2. Results at the updated analysis were consistent with the primary analysis.
Critical Appraisal
Two interim analyses were planned for the BOSTON trial. The first interim analysis was for sample size re-adjustment. At the first interim analysis, it was determined that no re-adjustment of sample size would be conducted. The second interim analysis was for an efficacy analysis based on PFS, and would allow for a conclusion of efficacy, and stopping for futility (non-binding). There was agreement between the sponsor and the DSMB to use the second interim analysis as the final analysis for PFS. As more than 75% of the planned PFS events occurred, the DSMB determined that the primary end point of PFS was met at a 1-sided alpha of 0.025, meeting the stopping boundary.
The sponsor conducted an additional analyses of efficacy end points at an updated time point (February 15, 2021). This updated analysis was not pre-specified and was not considered in the statistical analysis plan. All results from the updated analysis should be considered descriptive.
While not unique to the BOSTON trial, it is possible the choice of subsequent therapies affected the efficacy assessments of OS, as analyses for OS included patients who received subsequent therapies. A total of 69 patients in the SVd group and 116 patients in the Vd group received subsequent anticancer therapies. Disproportional differences were noted between treatment groups in the types of subsequent anticancer therapies received, as more patients in the SVd group received lenalidomide, pomalidomide, bortezomib, carfilzomib, and daratumumab compared with the Vd group. In addition, patients in the Vd group were eligible to cross over to receive a selinexor-based regimen. The differences in subsequent therapies are expected to introduce bias in the efficacy analyses of OS and other patient outcomes. However, the direction and extent of the biases are difficult to predict. It is possible that crossing over also affected safety analyses. Patients crossing over to a selinexor-based regimen would have experienced selinexor-related AEs. It is therefore possible that differences between treatment groups in the incidence of selinexor-related AEs are underestimated.
Regarding patient disposition in the BOSTON trial, a greater proportion of patients in the SVd group discontinued treatment due to withdrawal by the patients ||||||||||||||| than in the Vd group ||||||||||||||| The sponsor clarified that patient withdrawal was due to AEs ||||||||||||||| in the SVd group versus ||||||| in the Vd group), logistical reasons ||||||| versus |||||||, poor health or entering hospice care (||||||| versus |||||||, burden of assessments (||||||| versus |||||||, respectively), and IRC-confirmed disease progression (||||||| versus |||||||, respectively). An additional ||||||| patients in the SVd group versus ||||||| patients in the Vd group did not provide any additional information.5 Discontinuation due to AEs and/or toxicity were initially reported by 16.9% of patients in the SVd group versus 11.3% of patients in the Vd group. The clarification provided by the sponsor regarding reasons for “withdrawal by the patient” suggests there is additional toxicity related to SVd as an additional ||||||| patients in the SVd group versus ||||||| patients in the Vd group discontinued due to AEs. It is possible that these differences in patient disposition may have affected some efficacy end points, as this imbalance in discontinuations may be a result of informative censoring. Because PFS was the primary end point, it is possible that the analyses were conducted on a population of patients in the SVd group who could better tolerate the investigational treatment. The results of a number of sensitivity analyses conducted by the sponsor continued to support the primary analysis of PFS and favoured treatment with SVd over Vd. However, the sponsor also conducted a sensitivity analysis that considered treatment discontinuation as an event (Table 46); this analysis was the only sensitivity analysis for PFS that did not find a statistically significant improvement in PFS for the SVd group (HR = 0.95; 95% CI, 0.76 to 1.19). The imbalance in patient discontinuations may also have affected other secondary outcomes, specifically TTD. The median TTD was 7.10 months (95% CI, 6.44 to 8.54) in the SVd group and 7.95 months (95% CI, 6.80 to 9.23) in the Vd group (HR = 0.99; 95% CI, 0.79 to 1.23). It was expected that an improvement in PFS would translate to a longer TTD in the investigational therapy group versus the control; however, this was not the case in the BOSTON trial.
The clinical experts consulted by CADTH for this review acknowledged that the eligibility criteria of the BOSTON trial, while similar to those of other clinical trials for MM, were restrictive and likely excluded patients who would be candidates for SVd in clinical practice. For example, the trial excluded patients who had received radiation, chemotherapy immunotherapy, or other anticancer therapy before 2 weeks before receiving study treatment. The eligibility criteria also excluded patients with severe PN, plasma cell leukemia, and comorbidities. Also excluded were those with spinal cord compression, documented systemic light chain amyloidosis, and major surgery less than 4 weeks before beginning the study therapy. In general, exclusion criteria were acknowledged to be restrictive and exclusive of patients who could potentially benefit from treatment with SVd.
The demographic and clinical characteristics of patients randomized in the BOSTON trial were generally considered representative of patients living in Canada, as confirmed through consultation with clinical experts for this review. However, the clinical experts noted that the proportion of patients with previous exposure to lenalidomide was low (39.5% in the SVd group and 37.2% in the Vd group). In Canadian clinical practice, lenalidomide would be administered to most patients as a first-line therapy in a metastatic setting. Therefore, it is expected that nearly all patients living in Canada would have had previous exposure to lenalidomide.
The BOSTON trial was a phase III trial comparing SVd to Vd. The use of Vd as a comparator was not considered appropriate in the current Canadian context. In particular, the dose of bortezomib was differed between the 2 treatment groups. Bortezomib was administered at a dose of 1.3 mg/m2 SC on days 1, 8, 15, and 22 of each 35-day cycle in the SVd group. In the Vd group, bortezomib was administered at a dose of 1.3 mg/m2 SC on days 1, 4, 8, and 11 of each 21-day cycle for the first 8 cycles; after cycle 8, bortezomib was administered at a dose of 1.3 mg/m2 SC on days 1, 8, 15, and 22 of each 25 day cycle. The clinical experts consulted by CADTH confirmed that the twice-weekly dosing in the Vd group is not commonly used in clinical practice. In addition, Vd is not a common regimen administered to patients. The clinical experts confirmed that Vd is often administered to patients as part of a triplet regimen. Overall, the clinical experts agreed that the Vd was not an appropriate comparator in the current Canadian treatment landscape for MM. However, it was acknowledged that enrolment in the BOSTON trial began in 2017, when the standard of care may have been different, and global variation in reimbursement of treatments may have led to the decision to choose Vd as the comparator for the BOSTON trial.
Indirect Comparisons
Description of Studies
Sponsor’s Indirect Treatment Comparison
All 66 studies included patients with RRMM. Most were phase II or III trials, including 19 phase II trials (29%) and 45 phase III trials (68%). Details about trial phase were not reported for 1 study. Another study was a retrospective matched-pair analysis that was included to complete the treatment networks. Of the studies, 50 (76%) were open-label, 12 (18%) were double-blind, and 4 did not report blinding procedures. The median follow-up ranged from |||||||||||||| months (median = |||||||). Sample sizes in treatment groups ranged from ||||||| patients per treatment group (median = |||||||). The median age ranged between |||| and |||| years (median = ||||); the median ages were similar across most trials. The proportion of males across the trials ranged from |||||||| (median = ||||).
Dolph et al. (2021)
A total of 21 studies were included in the network for PFS for second-line treatment, including 14 randomized controlled trials (RCTs) with only second-line patients, 5 studies with a mixed population but in which the majority were second-line patients, and 2 studies in which the majority of patients were in the third line of treatment or later. The 2 studies that included majority third-line or later patients were stated to be necessary to connect dexamethasone with lenalidomide plus dexamethasone (Rd). A total of 24 studies were included in the network for PFS in the third line or later, including 19 studies with outcomes reported exclusively in the third line or later. Four studies included patients in the second line and third line or later, and 1 study included exclusively second-line patients but was necessary to link Vd with bortezomib.
A total of 15 studies were included in the network for OS in the second line; 4 of these studies reported only second-line OS information. A mixed population was enrolled for 9 studies, with the majority of patients being in the second line, and 1 study enrolled primarily patients in the third line or later. A total of 22 studies were included in the network for OS in the third line, including 11 studies that reported outcomes in the third line or later and 10 studies with a mixed population but in which the majority were in the third line or later. A single study reported results exclusively in the second line but was required to connect bortezomib with Vd.
A total of 20 studies were included in the network for objective response rate in the second line, including 12 RCTs reporting outcomes exclusively in the second line. A mixed population was reported in 8 of the studies with a majority of second-line patients. A total of 27 studies were included in the network for ORR in the third line, including 17 that reported outcomes exclusively in the third line or later. A mixed population was reported for 9 studies with the majority of patients being in the third line or later. A single study was included that reported exclusively second-line results but was required to link bortezomib with Vd.
Arcuri et al. (2021)
Six studies included lenalidomide in the control group, with 8 studies including bortezomib in the control group; only 3 studies did not include either of these treatments, and instead included carfilzomib (n = 1) or pomalidomide (n = 2) in the control group. Interventions assessed in the studies included vorinostat (n = 1), panobinostat (n = 1), pomalidomide (n = 1), pegylated doxorubicin (n = 1), cyclophosphamide (n = 1), elotuzumab (n = 1), pembrolizumab (n = 1), autologous stem cell transplantation (n = 1), venetoclax (n = 1), carfilzomib (n = 2), ixazomib (n = 2), daratumumab (n = 3), isatuximab (n = 1), and selinexor (n = 1). Studies included a range of median follow-up of 6 months to 36.8 months. The studies also included patients who had received between 1 and 3 prior therapies. Studies were published between 2007 and 2020. No further assessment of heterogeneity was conducted by the authors.
Botta et al. (2021)
Six phase III RCTs (CASTOR, ENDEAVOUR, OPTIMISM, CANDOR, IKEMA, and BOSTON) were included, representing 1,615 RRMM patients who were previously exposed to lenalidomide and 984 patients who were refractory to lenalidomide.6 The authors reported that studies were well balanced for the presence of patients refractory to lenalidomide, who accounted for approximately 70% of patients, except for the CASTOR trial, in which 50% of the patients were refractory to lenalidomide. Studies were also well balanced in terms of exposure to bortezomib, accounting for approximately 65% of patients, except for patients in the IKEMA trial, which had 85% to 93% of patients with previous exposure to bortezomib. The proportions of patients in second-line therapy were well balanced across trials, accounting for approximately 45% of trial patients.6 No further assessment of study and patient characteristics was provided.
Efficacy Results
Sponsor’s ITC
Progression-free survival: Regarding the network meta-analysis (NMA) conducted for second-line treatment, compared to Vd, ||||||||||||||||||||||||||||||||||||||||||||||||||||||||||||||||||||||||||||||||||||||||||||||||||||||||||||||||||||||||||||||||||||||||||||||||||||||||||||||||||||||||||||||||||||||||||||||||||||||||||||||||||||||||||||||||||||||||||||||||||||||||||||||||||||||||||||||||||||||||||||||||||||||||||||||||||||||||||||||||||||||||||||||||||||||||||||||||||||||||||||||||||||||||||||||||||||||||||||||||||||||||||||||||||||||||||||||||||||||||||||||||||||||||||||||||||||||||||||||||||||||||||||||||||||||||||||||| Regarding the NMA conducted for third-line or later treatment, compared to Vd, |||||||||||||||||||||||||||||||||||||||||||||||||||||||||||||||||||||||||||||||||||||||||||||||||||||||||||||||||||||||||||||||||||| The remaining regimens, including ||||||||||||||||||||||||||||||||||||||||||. Pairwise comparisons against selinexor ||||||||||||||||||||||||||||||||||||||||||||||||||||||||||||||||||||||||||||||||||||
Overall survival: Regarding the NMA conducted in the second-line, there were |||||||||||||||||||||||||||||||||||||||||||||||||||||||||||||||||||||||||||||||||||||||||||||||||||||||||||||||| Regarding the NMA conducted in the third line or later, compared to Vd, ||||||| |||||||||||||||||||||||||||||||||||||||||||||||||||||||||||||||||||||||||||||||||||||||||||||||||| The remaining regimens, ||||||||||||||||||||||||||||||||||||||||||||||||||||||||||||||| Pairwise comparisons against selinexor suggested that |||||||||||||||||||||||||||||||||||||||||||||||||||||||||||||||||||||||||||||
Objective response rate: Regarding the NMA conducted in the second-line, compared to Vd, |||||||||||||||||||||||||||||||||||||||||||||||||||||||||||||||||||||||||||||||||||||||||||||||||||||||||||||||||||||||||||||| Pairwise comparisons suggested that ORR was ||||||||||||||||||||||||||||||||||||||||||||||||||||||||||||||||||||||||||||||||||||||||||| Regarding the NMA conducted in the third line or later, compared to Vd, ||||||||||||||||||||| |||||||||||||||||||||||||||||||||||||||||||||||||||||||||||||||||||||||||||||||||||| Pairwise comparisons suggested that ORR was |||||||||||||||||||||||||||||||||||||||||||||||||||||||||||||||||||||||||||||
Dolph et al. (2021)
Progression-free survival: In the second line, compared to Vd, the greatest benefit was suggested to be from daratumumab plus bortezomib plus dexamethasone (DVd), followed by DRd, and Kd. There were no differences between the remaining treatments of interest, including SVd. In the third line, compared to Vd, treatments that were favoured included DRd, DVd, Kd, and pomalidomide plus bortezomib plus dexamethasone (PVd). There were no differences between the remaining treatments of interest, including SVd. Specific estimates for comparisons were not provided.
Overall survival: There were no differences between treatments in the second line, including SVd. In the third line, DVd, daratumumab plus carfilzomib plus dexamethasone (DKd), and Kd were favoured over Vd. The remaining treatments did not show any differences, including SVd. The treatment effects were not reported.
Objective response rate: In the second line, treatments favoured over Vd included DKd, DVd, and SVd. There were no differences between the remaining interventions of interest. In the third line, DVd, DKd, and Kd were favoured over Vd. The remaining treatments did not show any differences, including SVd. No treatment effects were reported.
Arcuri et al. (2021)
Progression-free survival: There were no differences between selinexor and any of the comparators of interest: carfilzomib (HR = 0.86; 95% CI, 0.50 to 1.48), daratumumab (HR = 0.65, 85% CI, 0.38 to 1.10), high-dose chemotherapy (HR = 1.24; 95% CI, 0.65 to 2.38), isatuximab (HR = 0.85; 95% CI, 0.44 to 1.65), ixazomib (HR = 0.98; 95% CI, 0.55 to 1.75), pomalidomide (HR = 0.97; 95% CI, 0.50 to 1.87). The heterogeneity measured for PFS, as assessed by I2, was 64%.
Overall survival: Estimates for comparisons between each treatment were not provided for OS. However, in general, most treatments indicated no difference.
Botta et al. (2021)
Progression-free survival: Results suggested that PFS among patients exposed to lenalidomide was favoured with Isa-Kd (HR = 0.34; 95% CI, 0.18 to 0.64), followed by KDd (HR = 0.36; 95% CI, 0.22 to 0.61), DVd (HR = 0.38; 95% CI, 0.38; 95% CI, 0.26 to 0.56), PVd (HR = 0.61; 95% CI, 0.49 to 0.76), SVd (HR = 0.63, 95%CI, 0.41 to 0.96), and Kd (HR = 0.69; 95% CI, 0.52 to 0.92) compared to Vd.6 Among patients who were lenalidomide-refractory, PFS was favoured with treatment with DVd (HR = 0.36; 95% CI, 0.21 to 0.62), followed by KDd (HR = 0.38; 95% CI, 0.21 to 0.68), Isa-Kd (HR = 0.48; 95% CI, 0.25 to 0.92), and PVd (HR = 0.65; 95% CI, 0.50 to 0.84) compared to Vd. No difference was observed between Kd (HR = 0.80; 95% CI, 0.57 to 1.12) and Vd.6
Harms Results
Sponsor’s ITC
No analyses for harms were conducted in the sponsor’s ITC.
Dolph et al. (2021)
No analyses for harms were conducted in the ITC conducted by Dolph et al.
Arcuri et al. (2021)
The authors conducted an analysis for SAEs. However, because the analysis for SAEs did not include selinexor, these results are not reported.
Botta et al. (2021)
No analyses for harms were conducted in the ITC conducted by Botta et al.
Critical Appraisal
Sponsor’s ITC
The sponsor included 17 trials in its ITC. There is likely high heterogeneity across study and patient characteristics. Differences in these study and patient characteristics may result in uncertainty in the analyses as the studies may not necessarily be comparable. In addition, the proportion of patients in different lines of therapy may not be similar across treatment groups within studies, and across studies. It is likely that variations in patient characteristics were present in the trials and unaccounted for.
The clinical experts consulted by CADTH for this review also emphasized the importance of considering subgroups of patients who would be exposed to lenalidomide exposed versus refractory to lenalidomide. The sponsor did not conduct any sensitivity analyses to determine the differences in treatment effect for these patient groups. These patient subgroups were highlighted as it is expected that most patients living in Canada will receive a lenalidomide-based regimen in the first line, and that subsequent therapy should consider the patient’s initial response to first-line therapy.
Networks of evidence were separated by line of therapy (second line, third line, or later line), which was considered appropriate given that patients in later lines of therapy tend to have worse outcomes. However, within networks, studies that included a mix of patients in multiple lines of therapy were included in networks in which the majority of patients represented patients in either the second line or later lines of therapy. This may introduce bias as patients in earlier or later lines of therapies can influence each network differently. Patients receiving second-line therapy may overestimate the efficacy of treatments included in studies in the third-line or later networks, while patients receiving later lines of therapy may underestimate the efficacy of treatments included in the second-line networks.
Trials were phase II and III trials, and the earlier-phase trials may not be powered to test hypotheses; inclusion of phase II trials is expected to introduce bias into the NMAs that may not be present in phase III trials, which are typically designed to detect differences between different treatment groups. A retrospective matched-pair analysis, which was required to link bortezomib to Vd (no RCTs were available for this link), was also included. Inclusion of this retrospective study therefore does not satisfy the transitivity assumption of the ITC as all other studies were clinical trials. Because the sponsor considered the connection between bortezomib and Vd to be necessary, it included this retrospective matched-case analysis to allow for comparisons of included regimens. Inclusion of this retrospective matched-case analysis is expected to introduce considerable uncertainty to the NMAs.
Overall, the networks of the NMAs were complex, leading to a high degree of variability. Methodological limitations are likely to have introduced further uncertainty into the analyses. For example, the sponsor did not conduct adjustments for crossover. Crossover to investigational treatment from a control is expected to underestimate the treatment effect observed in that trial and influence the analyses of the ITC. Important effect modifiers were not controlled for. Subgroup analyses were not performed due to small sample sizes. However, the lack of adjustment may introduce bias that can affect treatment comparisons.
Dolph et al. (2021)
The ITC conducted by Dolph et al. was similar to the ITC provided by the sponsor. As the methodology was similar to the ITC provided by the sponsor, the results of both ITCs could be compared. In general, results reported the same or similar conclusions regarding favoured treatments and the efficacy of SVd relative to other interventions. The consistency between these 2 analyses supports the position that the analyses conducted by the sponsor and Dolph et al. are replicable. However, limitations associated with the sponsor’s ITC are linked to the ITC conducted by Dolph et al. Critiques of the sponsor’s ITC reported in a preceding section should also be considered for the ITC published by Dolph et al.
The authors conducted an additional NMA including only Vd-containing regimens. This was preferred methodologically as it did not rely on a retrospective study to link treatments and allowed for comparisons between regimens with 1 shared common anchor; in this case all regimens were compared to Vd. The authors also stated that this analysis was highly relevant as lenalidomide is used in most patients as a first-line option and would not likely be used in later lines. Therefore, lenalidomide-based regimens are likely not important comparators in the second and later lines. The clinical experts consulted by CADTH for this review supported this statement and agreed that lenalidomide-based regimens would not be competing with other regimens in the second or later lines as they would most likely be used in the first line. However, the authors did not report specific results, and it is unclear exactly which interventions were favoured over the others.
The authors also reported that the CASTOR study, which was included in some networks, incorporated 2 trial characteristics that were not consistent with usual clinical practice and magnified the effect of daratumumab in the study. Specifically, the CASTOR study administered bortezomib twice weekly even though most clinicians administer bortezomib once weekly, and the trial required that bortezomib be discontinued after 24 weeks in both the DVd and Vd treatment groups, resulting in treatment with daratumumab to be compared to no treatment after 24 weeks. The clinical experts consulted by CADTH for this review confirmed that bortezomib is often administered beyond 24 weeks (or 8 cycles) for patients who can tolerate and respond well to treatment. The CADTH team agreed that this is likely to have amplified the treatment effects of daratumumab, and biased results that did support most daratumumab-based regimens in the NMAs.
Arcuri et al. (2021)
There is likely high variation in patient characteristics across the trials, which is likely to have introduced biases and result in considerable uncertainty in the analyses. The authors did not report a thorough assessment of heterogeneity. However, variations were reported across trial characteristics. Studies were published between 2007 and 2020; treatment practices of 2007 are likely not the same as current treatment practices, and the patient groups being compared are likely not the same as new therapies that have been introduced that alter the treatment pathways for patients and their outcomes. Differences in treatment duration were not accounted for in the analyses. The authors acknowledged that prolonged treatment duration may lead to increased PFS and higher rates of near-complete or complete responses. It is possible that effect modifiers that could affect efficacy analyses may be present but were unaccounted for. For example, the authors included patients across multiple lines of therapies. The clinical experts consulted by CADTH for this review confirmed that patients in later lines of therapy likely will experience poorer outcomes, and differences in patients across different lines of therapy may under- or overestimate treatment effects.
The authors connected studies through a common comparator group of either Rd or Vd based on the assumption that these 2 treatments are equally effective. This allowed the authors to create a single control group, a shorter path for indirect comparisons, and greater power to detect differences. However, 3 studies that did not include either Rd or Vd as a comparator and instead included Kd or pomalidomide plus dexamethasone (Pd), were also incorporated into this comparison group. The authors conducted a sensitivity analyses that separated the control group into 2 categories: 1 group included lenalidomide- and pomalidomide-based regimens, and another included bortezomib-based regimens. The authors concluded that the 2 treatments were equivalent, which further supported their decision to group these categories together. The clinical experts consulted by CADTH for this review did not agree with the assumption that Rd and Vd were equally effective treatments. In addition, the clinical experts also disagreed that Kd and Pd were equally effective treatments; however, they acknowledged that use of Pd would occur after treatment with Rd, and that Pd would be expected to be less efficacious for patients as it is used in a later line in patients previously treated with an immunomodulatory drug. The CADTH team therefore considered comparisons conducted in this ITC to be inappropriate, as data for treatments that are not considered equivalent were combined to create connections between regimens.
In general, details of the methodology used by the authors for the ITC were sparse. It is not possible to provide a full appraisal of these methods. The authors did not report on whether they adjusted for crossover in the trials, although it is unlikely. Treatment crossover could have biased efficacy analyses of these trials. However, it was reported that the authors conducted NMAs with fixed effects, unless the I2 values were greater than 40%, in which case random-effects models were used. The I2 value of the NMA for PFS was 64%, which indicates that a random-effects model was used. The analyses of OS and SAEs were reported to have an I2 value of 0; however, a random-effects model was used for the analysis of OS. The use of random effects was considered appropriate given the number of comparators and the high amount of heterogeneity; however, without an assessment of model convergence and consistency, it is not completely possible to know which model was best for these analyses.
Conclusions
One multinational, sponsor-funded, open-label RCT, BOSTON, was included in the CADTH review. SVd demonstrated statistically significant and clinically meaningful improvement in PFS compared to Vd in a population of patients with MM who had received 1 to 3 prior lines of therapy. At the time of the analysis, median OS was not reached; however, other secondary end points (e.g., ORR, DOR, TTR, and TTNT) were supportive of the primary end point of PFS, demonstrating improved efficacy with SVd over Vd. An updated analysis continued to support the improved PFS of SVd over Vd, although these results were considered descriptive. The comparator in the BOSTON trial, Vd, was not considered appropriate for the current Canadian treatment landscape due to changes in standard of care. Four ITCs, including 1 submitted by the sponsor and 3 published ITCs, compared the efficacy of SVd to other relevant comparators (i.e., DVd, DRd, Kd, PVd, CyBorD, and Isa-Pd). The ITCs were congruent with direct evidence from the BOSTON trial that found improved PFS and ORR with treatment SVd over Vd. However, the ITCs also suggested that other regimens, such as daratumumab-based regimens, may be preferred over SVd, and this suggestion was supported by the clinical experts. However, the methodological limitations and heterogeneity across patients included in the ITCs limit the ability to draw firm conclusions. The collected HRQoL data suggest that there were no differences between patients in the SVd and Vd treatment groups; however, HRQoL data also highlight impacts on patient vision in the SVd group, although this finding should be interpreted with caution given the exploratory nature of the analysis. Detrimental effects on patient vision were also observed in harms data, which indicate an increase in cataracts in the SVd group. Notable harms that occurred more frequently in the SVd group included nausea, gastrointestinal disorders, thrombocytopenia. and neutropenia. In general, AEs related to SVd were described by the clinical experts consulted by CADTH for this review as manageable.
Introduction
Disease Background
Multiple myeloma is a plasma cell cancer caused by the growth of cancer cells in the bone marrow. In Canada, more than 3,000 new cases of MM are diagnosed annually, with slightly more cases occurring in men than women.1 While new therapies have been introduced that can improve a patient’s OS and PFS, MM remains an incurable condition.2 Some estimates suggest that the median survival for patients with MM is approximately 5 years, and during this time patients can receive 4 or more lines of therapy.2 Multiple myeloma is a heterogenous condition that typically affects older adults around the age of 65 years, and patient’s outcomes can depend on many factors, including disease stage, prognostic indicators, and early treatment of symptomatic disease to limit or avoid organ damage.1 Typically when MM is suspected clinically, patients are tested for the presence of M proteins, although a small proportion of patients (approximately 2%) may present without any evidence of M protein.7
The clinical experts consulted by CADTH for this review highlighted a particular need to prevent skeletal damage due to the disease. Bone disease is 1 of the main causes of morbidity for patients, and can be detected using imaging techniques, such as MRI or PET and CT scans.7 The most common site of pain related to bone pain is the lumbar spine. Patients may also initially present with lytic lesions, anemia, fatigue, infections, weight loss, hypercalcemia, and/or renal dysfunction.1 Patients may also have cytogenetic abnormalities that can influence the course of their disease, response to therapy, and overall prognosis. Cytogenetic abnormalities can include t(4;14), t(14;16), t(14;20), del(17p), or gain(1q), which can be detected using fluorescence in situ hybridization (FISH) technology. The R-ISS system is used to classify the stage of disease for patients diagnosed with MM; the combined elements of tumour burden and disease biology (e.g., the presence of high-risk cytogenetic abnormalities) are used to create a prognostic index to assist in clinical care and comparison of data from clinical trials.7
Standards of Therapy
The treatment landscape for MM has changed significantly in recent years with the emergence of new therapies in newly diagnosed and relapsed or refractory settings.2
According to the clinical experts, initial therapy depends on whether patients are eligible for transplant at diagnosis. Initial treatment for patients who are eligible was stated to include induction therapy for 4 months with cyclophosphamide, bortezomib, and CyBorD. Other treatment regimens include lenalidomide plus bortezomib plus dexamethasone (RVd) for high-risk patients or those who fail to response to initial therapy when funding is available. Other regimens containing daratumumab and carfilzomib have recently been described but are rarely used as they are not currently funded for induction. Following induction therapy, the clinical experts stated that patients undergo stem cell collection with growth factors with or without high-dose cyclophosphamide. Following this, patients undergo treatment with melphalan followed by a stem cell transplant and then consolidation therapy with RVd in some jurisdictions (depending on local practices and funding). Patients continue with lenalidomide maintenance therapy until disease progression; this was stated to be the standard across all Canadian jurisdictions. The clinical experts also acknowledged that some patients with high-risk cytogenetics confirmed by fluorescence in situ hybridization (FISH), such as t(4:14), t(14:16), 1q gain(1q), and del(17p), will be offered tandem transplants.
For patients who are not eligible for transplant, RVd was described as the most commonly used treatment; other treatment options include Rd and CyBorD, although CyBorD has been used less frequently in current practice since the approvals of lenalidomide-based regimens. Daratumumab-based regimens such as DRd or daratumumab plus bortezomib plus melphalan plus prednisone (DVMP) were expected to be used more frequently due to recent approvals from CADTH and funding approvals across jurisdictions. The clinical experts indicated that they expected that daratumumab-based regimens would be the preferred front-line option, with DRd as the most likely choice.
Both clinical experts agreed that most patients would be started on IV pamidronate or zoledronic acid (Zometa) to prevent bone-related AEs.
At relapse, treatment for patients was stated to depend on patient factors, including age, comorbidities, and previous treatments. In the second-line treatment setting, a second transplant may be an option for transplant-eligible patients. Although this was stated not to be a common approach because of the available alternatives, patients with long responses to the first transplant will often be considered for a second transplant if their age and comorbidities are not contraindications. The clinical experts stated that most patients will receive a daratumumab-containing regimen, likely DRd or DVd; patients who are refractory to lenalidomide would usually receive DVd while those who previously received bortezomib would receive DRd. Current treatment practices suggest using bortezomib or another PI after treatment with lenalidomide.
Regimens containing carfilzomib were acknowledged to be available to patients in the second line, although these regimens are typically reserved for relapse after daratumumab-based regimens in the third line or after. Pomalidomide-based regimens were stated to be considered in the third or fourth line of therapy. Isatuximab-based regimens were stated to be another option for patients, especially for those who are not eligible for daratumumab-based regimens, but these are currently not funded. The clinical experts stated that isatuximab-based regimens would likely not be effective for patients who progress on a daratumumab-based regimen. Belantamab is another option that could be available to patients; however, this treatment is only available through special access and is not used frequently.
The treatment practices described by the clinical experts also align with recommended regimens by National Comprehensive Cancer Network (NCCN) guidelines.8
Drug
Selinexor is a reversible covalent selective inhibitor of nuclear export (SINE) compound that blocks the exportin 1 (XPO1) protein, which is a nuclear transport protein that transports cargo proteins within the cell. Selinexor mediates the nuclear transport of many cargo proteins, including cargo proteins associated with the growth of oncogenic proteins as well as tumour suppressor proteins. Inhibition of XPO1 by selinexor leads to reductions in cancer cells. When combined with bortezomib and dexamethasone, the resulting SVd regimen demonstrates antitumour activity, including in in vivo models resistant to PIs.3 Selinexor is indicated to be administered in combination with bortezomib and dexamethasone. Selinexor is to be administered at a dosage of 100 mg orally once weekly on day 1 of each week. Bortezomib is to be administered at a dosage of 1.3 mg/m2 SC once weekly on day 1 of each week for 4 weeks followed by 1 week off. Dexamethasone is to be administered at a dosage of 20 mg orally twice weekly on days 1 and 2 of each week.3
Selinexor was submitted to CADTH pre-Notice of Compliance and is anticipated to be approved by Health Canada on June 2, 2022. Selinexor has not previously been reviewed by CADTH. The sponsor has requested reimbursement of selinexor as per the Health Canada indication.
Table 3: Key Characteristics of Selinexor, Bortezomib, and Dexamethasone
Detail | Selinexor | Proteasome inhibitors | Immunomodulatory drugs | Dexamethasone | Daratumumab |
|---|---|---|---|---|---|
Mechanism of action | A compound that specifically blocks exportin 1, a nuclear export protein that transports cargo proteins within the cell; inhibition of exportin 1 by selinexor leads to reduction of cancer cells | Proteasome inhibition leads to accumulation of misfolded protein in the endoplasmic reticulum, resulting in apoptosis and inhibition of cell proliferation | Immunomodulatory and antineoplastic activity; inhibits proliferation and induces apoptosis of hematopoietic tumour cells | A glucocorticoid that suppresses the migration of neutrophils, suppression of the immune response, and decreases the proliferation of lymphocyte colonies | An mAb that targets CD38 overexpressed on tumour cells in hematologic malignancies; induces cell lysis via a variety of mechanisms, including ADCC, CDC, and ADCP |
Indicationa | In combination with bortezomib and dexamethasone for the treatment of adult patients with MM who have received at least 1 prior therapy | Carfilzomib: In combination with dexamethasone and daratumumab, or lenalidomide and dexamethasone, or dexamethasone alone, for patients with relapsed MM who have received 1 to 3 prior lines of therapy Bortezomib: Part of combination therapy for previously untreated MM who are unsuitable for SCT Part of combination therapy for induction treatment of patients with previously untreated MM who are suitable for SCT Treatment of progressive MM in patients who have received at least 1 prior therapy and who have already undergone or are unsuitable for SCT Part of combination therapy for the treatment of patients with previously untreated mantle cell lymphoma who are unsuitable for SCT Treatment of patients with mantle cell lymphoma who have relapsed or were refractory to at least 1 prior therapy | Lenalidomide: In combination with dexamethasone, for the treatment of MM patients who are not eligible for SCT Pomalidomide: In combination with dexamethasone and bortezomib for patients with MM who have received at least 1 prior treatment regimen that included lenalidomide In combination with dexamethasone for patients with MM for whom both bortezomib and lenalidomide have failed and who have received at least 2 prior regimens and demonstrated disease progression on the last regimen | NA | In combination with lenalidomide and dexamethasone, or bortezomib, melphalan, and prednisone for newly diagnosed MM who are ineligible for ASCT In combination with lenalidomide and dexamethasone, or bortezomib and dexamethasone, for patients with MM who have received at least 1 prior therapy For treatment of patients with MM who have received at least 3 prior lines of therapy, including a PI and an immunomodulatory imide drug or who are refractory to both |
Route of administration | Orally | IV infusion | Orally | Orally | IV infusion |
Recommended dosage | 100 mg | Carfilzomib
Bortezomib For MM, patients suitable for SCT In combination with other products used for MM, 1.3 mg/m2 IV twice weekly on days 1, 4, 8, and 11, followed by a 20-day rest period For patients not suitable for SCT In combination with melphalan and oral prednisone for 9 6-week cycles; cycles 1 to 4: bortezomib twice weekly (days 1, 4, 8, 11, 22, 25, 29, 32); cycles 5 to 9: bortezomib once weekly (days 1, 8, 22 and 29) For relapsed MM
| Pomalidomide
Lenalidomide
| 20 mg on days 1, 2, 8, 9, 15, 16, 22, 23, 29, and 30 of each cycle. | DRd (4-week cycle)
DVd (3-week cycle)
|
Serious adverse effects or safety issues | Serious warnings and precautions: Fatigue, severe or life-threatening hyponatremia, nausea, vomiting, diarrhea, anorexia/weight loss, thrombocytopenia, neutropenia, infections, dizziness, cataracts | Carfilzomib: Infusion reactions, TLS infections, cardiac disorders, venous thrombosis, hypertension, hemorrhage, thrombocytopenia, hepatoxicity, hepatitis B reactivation, posterior reversible encephalopathy syndrome, PML, acute renal failure, pulmonary toxicity Bortezomib: TLS, hemorrhage, hepatoxicity, posterior reversible encephalopathy syndrome, PML, hypotension, CHF, pericarditis, QT prolongation, motor neuropathy, pulmonary toxicity, neutropenia | Both: Neutropenia, thrombocytopenia, Infections, DVT and PE, hepatoxicity, anaphylaxis, hepatitis B reactivation, severe rash (SJS, TEN, DRESS), TLS, teratogenic | Contraindications: Fungal infections, hypersensitivity to dexamethasone, cerebral malaria Precautions: Patients with cirrhosis, diverticulitis, myasthenia gravis, renal insufficiency, ulcerative diseases, cardiac issues | Infusion reactions neutropenia, thrombocytopenia hepatitis B reactivation |
Other | None | Premedication for carfilzomib recommended with dexamethasone (at least 30 minutes prior), to reduce incidence and severity of infusion reactions Antiviral prophylaxis should be considered before initiating bortezomib to prevent reactivation of herpes zoster | Antithrombotic prophylaxis recommended Only available under a controlled distribution program | None | Premedication with dexamethasone, antipyretics, and antihistamines is recommended; post-infusion (to prevent delayed infusion reactions), oral corticosteroid; antiviral prophylaxis should also be considered to prevent reactivation of herpes zoster |
ADCC = antibody-dependent cell-mediated toxicity; ADCP = antibody-dependent cellular phagocytosis; CDC = complement-dependent toxicity; CHF = congestive heart failure; DRESS = drug reaction with eosinophilia and systemic symptoms; DKd = daratumumab plus carfilzomib plus dexamethasone; DRd = daratumumab plus lenalidomide plus dexamethasone; DVT = deep vein thrombosis; Kd = isatuximab plus dexamethasone; KRd = isatuximab plus lenalidomide plus dexamethasone; mAb = monoclonal antibody; MM = multiple myeloma; PE = pulmonary embolism; PI = proteasome inhibitor; PML = progressive multifocal leukoencephalopathy; PVd = pomalidomide plus bortezomib plus dexamethasone; Rd = lenalidomide plus dexamethasone; SCT = stem cell transplant; SJS = Stevens Johnson syndrome; TEN = toxic epidermal necrolysis; TLS = tumour lysis syndrome.
aHealth Canada–approved indication.
Source: Xpovio product monograph,3 Bortezomib product monograph,9 Johnson et al. (2021),10 and Canadian Pharmacists Association.11
Stakeholder Perspectives
Patient Group Input
This section was prepared by CADTH staff based on the input provided by patient groups.
About the Patient Groups and Information Gathered
One patient group, Myeloma Canada, provided input on the combination of selinexor with bortezomib and dexamethasone for the treatment of MM in adult patients. Myeloma Canada is a charitable organization with a mission of improving the lives of all patients living in Canada affected by myeloma. The patient group conducted an online survey of patients and caregivers across Canada from December 2021 to January 2022. The survey was distributed through email and social media. Overall, 254 patients and 1 caregiver responded to the survey (N = 255); respondents represented people living in Canada from Alberta, British Columbia, Manitoba, New Brunswick, Newfoundland and Labrador, Nova Scotia, Ontario, Quebec, and Saskatchewan. Three respondents from France were also included. The following is a summary of key input from the perspective of the patient group.
Disease Experience
According to Myeloma Canada, patients considered it extremely important to control symptoms of infections, kidney problems, mobility, and neuropathy related to myeloma. Patients also indicated that symptoms significantly impacted their abilities to travel, work, exercise, and concentrate. Infections, kidney problems, mobility, and neuropathy are among the symptoms that patients report as extremely important to control. While half of respondents stated they did not need the support of a caregiver or family member to help manage disease or treatment-related symptoms, 39% stated that they did, and 4% indicated that they did but were unable to access the support they need. Parking costs, travel costs, drug costs, lost income due to absence from work, and lost income or pensions due to early retirement were identified as the most significant financial implications due to myeloma treatment.
Experience With Treatment
Of patients who had or were currently receiving treatment with bortezomib and dexamethasone, more than half indicated that, overall, the side effects were either bearable (7 of 23 responses) or somewhat bearable (7 of 23 responses). Side effects considered “totally unbearable” by most (19 of 23) patients included fatigue, diarrhea, and nausea, while the most “tolerable” side effects were anemia and thrombocytopenia. Peripheral neuropathy was highlighted by many (19 of 23) patients as a side effect and an important symptom to control (7 of 19) and to reduce the severity (7 of 19).
Two respondents had experience with SVd through participation in the BOSTON trial; 1 had not relapsed since receiving SVd through the BOSTON trial, while the other relapsed within 3 months and was receiving a different treatment. One patient indicated the trial regimen was very effective in helping control their myeloma, while the other patient reported that it was somewhat ineffective. Nausea was stated to be a “somewhat tolerable” side effect, while diarrhea, PN, and vomiting were “somewhat intolerable.” Other reported side effects included thrombocytopenia, anemia, fatigue, decreased appetite, and weight decrease. One respondent indicated that SVd had met their expectations in treating their myeloma but mentioned that it was “too soon to tell” whether myeloma treatment had improved their overall QoL.
Improved Outcomes
Respondents most frequently mentioned effectiveness of treatment, QoL, accessibility and portability of treatment, manageable side effects, and access to a supportive and communicative care team as important when considering any treatment for myeloma. The side effects that patients most frequently ranked as important to avoid when considering new treatments included infections, vomiting, pain, confusion, decreased appetite, and neuropathy. Many patients indicated a preference for orally administered treatments, while SC injection and infusion were less preferred. Many respondents indicated that fewer trips to a cancer centre or hospital for treatment would positively affect their QoL.
Myeloma Canada additionally described that access to health care services and treatment options for MM patients varies across the country and that a treatment option that would minimize patients’ time in hospital would be welcome. The patient group added that the treatment under review would fulfill an unmet need in patients requiring a fourth line of therapy as 1 of the only options for them.
Clinician Input
Input From Clinical Experts Consulted by CADTH
All CADTH review teams include at least 1 clinical specialist with expertise in the diagnosis and management of the condition for which the drug is indicated. Clinical experts are a critical part of the review team and are involved in all phases of the review process (e.g., providing guidance on the development of the review protocol, assisting in the critical appraisal of clinical evidence, interpreting the clinical relevance of the results, and providing guidance on the potential place in therapy). The following input was provided by 2 clinical specialists with expertise in the diagnosis and management of MM.
Unmet Needs
The clinical experts highlighted the need for treatments that improve survival, provide deeper and longer-lasting remissions, and improve disease-related symptoms and complications, such as pain and renal failure. In addition, treatments would have less of a negative impact on patient QoL and require fewer clinic visits.
The clinical experts acknowledged that most patients will relapse with currently available therapies. Treatments are palliative and may prolong patients’ lives, but they do not provide a cure. Patients will eventually become refractory to available treatments. The clinical experts also stated that remission beyond the second-line setting is becoming brief. Patients with high-risk cytogenetics were stated to be at particularly high risk of progression and poor outcomes as they may be more likely to fail to respond to initial therapy or have a brief initial remission. The clinical experts also highlighted unmet needs among patients who are not eligible for transplant as they have a poorer prognosis compared to patients who are eligible. The side effects of some treatments were stated to affect tolerability to treatment and effectiveness. Many treatment options for patients are provided intravenously or subcutaneously at a cancer centre as often as once or twice per week, resulting in a significant burden on patients, caregivers, and treatment centres.
Place in Therapy
The clinical experts acknowledged that selinexor would not require a significant paradigm shift and that other therapies to treat MM are available. However, selinexor operates through a mechanism of action that differs from other treatments currently available for MM, presenting an opportunity to be effective in patients who become resistant to treatments that target other pathways. It is therefore likely that selinexor would be used as a later line of therapy. The clinical experts agreed that other regimens are preferred before using a regimen based on selinexor. The toxicity profile of selinexor was also stated to be different from other classes of drugs. Selinexor could be an attractive option for patients as it is administered orally and only once per week, potentially reducing the need for clinic visits.
Patient Population
The clinical experts agreed that there are no specific features that would make a patient a better candidate for selinexor. In general, patients with high-risk features (i.e., high-risk cytogenetics), poor performance status, and those who have received many prior lines of therapy will be unlikely to respond to other therapies, including selinexor. Patients with pre-existing anorexia, weight loss, or nausea may not be good candidates for this treatment as the side effects of selinexor include anorexia, weight loss and nausea.
Assessing Response to Treatment
A patient’s response to therapy is typically measured in terms of monoclonal protein and serum free light chains; based on these evaluations, a clinically meaningful response would include a sustained PR or better. Stable disease may also be considered an acceptable benefit to patients in some cases. Improvements in cancer-related complications, such as anemia, renal failure, hypercalcemia, and tumour-related pain, are also considered when assessing a patient’s response. Imaging of bones can assess response, but this was described as a less-sensitive outcome that may not always be helpful. In general, meaningful responses to treatment are expected to translate through improvements in patient OS and PFS. Improvements in QoL, myeloma-related symptoms, and treatment toxicity were also considered important outcomes when assessing patient’s response to treatment.
Typically, patients may be assessed for response every 4 weeks. Less-frequent monitoring of patients (i.e., every 2 or 3 months) may be warranted if patients demonstrate a stable long-term response and predictable and manageable toxicity.
Discontinuing Treatment
The clinical experts agreed that discontinuing treatment should depend on whether a patient’s disease progresses. When patients fail to respond to treatment, a change in therapy is required. Disease progression can be determined by measuring levels of serum free light chains and paraprotein, and sometimes with worsening hemoglobin, renal function, and bone imaging. Significant toxicities or AEs that cannot be managed through supportive care or dose modifications were also described as indications warranting discontinuation of therapy.
Prescribing Conditions
Treatment will need to be prescribed by a hemato-oncologist. Administration of therapies will require a specialty hematology or oncology clinic or equivalent. Physicians with expertise and experience in treating MM, such as a hematologist or oncologist, would be treating and monitoring patients. Patients may be monitored by other care providers, such as clinical associates, general practitioners in oncology, and nurse practitioners, particularly when a hematologist or oncologist is not routinely available onsite; however, these staff are typically under the supervision of a treating hematologist or oncologist.
Additional Considerations
The clinical experts emphasized that changes to the treatment paradigm for MM patients are likely to occur with approvals of daratumumab in the first-line setting. Because most patients will likely receive DRd as a first-line therapy, these patients will not receive daratumumab-based regimens upon relapse. The next-line option for patients would likely be a combination regimen that includes bortezomib and another PI (e.g., CyBorD or Kd). Selinexor in combination with bortezomib and dexamethasone could be considered as a second-line option; however, it may be more likely for SVd to be used in later lines of therapy.
Clinician Group Input
This section was prepared by CADTH staff based on the input provided by patient groups.
Two groups provided clinician input on the review of SVd for the treatment of adult patients with MM. The OH-CCO Hematology DAC submission was prepared by 7 physicians and the CMRG submission was prepared by 13 physicians.
OH-CCO provides timely evidence-based clinical and health system guidance on drug-related issues in support of CCO’s mandate, including the Provincial Drug Reimbursement Programs (PDRP) and the Systemic Treatment Program. The CMRG is a charitable organization whose membership consists of researchers in Canada who aim to develop better treatments that extend the life of melanoma patients, improve the QoL of those living with myeloma and related disorders, and find a cure for these diseases and other plasma cell disorders.
Unmet Needs
Both patient groups generally agreed that improving OS, PFS, disease-related symptoms, and HRQoL are important goals for ideal treatment. The CMRG mentioned that new treatments that reduce the burden of myeloma-related organ damage and symptoms (e.g., anemia, ongoing lytic bone destruction, renal failure, and hypercalcemia) would be ideal for patients. The CMRG also pointed out that, although CR is ideal, an incomplete response (e.g., minimal response or stable disease) may also afford symptom control or improvement. Treatments that control the disease and prevent worsening of patient’s symptoms (e.g., renal damage causing dialysis) were stated to be helpful for patients and prevent degeneration of performance status, leading to less resource utilization in the treatment of MM complications and reduced caregiver burden. The CMRG highlighted the need to prevent further lytic skeletal destruction; while complications related to skeletal damage can be arrested, fractures stabilized, and pain controlled, lytic lesions do not fully heal. Overall, affected bones remain at risk for future fractures and are further weakened from cortical structure.
The OH-COO group indicated the greatest unmet need for patients currently exists after the second-line setting; patients who failed daratumumab in the second-line setting could have the option to use this regimen in the third line. The CMRG expressed the need for new classes of anti-myeloma drugs to complement available treatments and improve patients’ convenience (e.g., with oral administration) and toxicity profiles.
Both groups agreed that patients who have the greatest unmet need for a selinexor-based regimen are those with RRMM who are refractory to immunomodulatory inhibitors, PIs, and anti-CD38 monoclonal antibodies. The CMRG also specified patients with renal insufficiency and poor risk features (e.g., high-risk cytogenetics, extramedullary disease, or highly proliferative disease) have the greatest unmet need for this therapy; the needs of patients who are earlier in their disease course and are refractory to lenalidomide and/or daratumumab were also highlighted.
Place in Therapy
According to the CMRG, patients with MM who are younger, fit, and eligible for transplant are initially treated with triplet bortezomib-based regimen induction, followed by autologous stem cell transplant, followed by maintenance with lenalidomide until disease progression. For patients ineligible for transplant, a lenalidomide-based regimen (e.g., Rd, RVd, or DRd) would typically be used with lenalidomide and continued until disease progression. The CMRG also stated that a small proportion of patients who are not eligible for transplant may receive a bortezomib regimen (e.g., bortezomib plus melphalan plus prednisone [VMP] or CyBorD) as a “fixed duration” regimen for approximately 9 cycles. Most newly diagnosed patients experience their first relapse on lenalidomide and are considered refractory to lenalidomide.
The OH-CCO group indicated most patients in the second line would receive daratumumab or isatuximab. The CMRG agreed that daratumumab would be offered in the second line, specifying that, depending on the initial regimen, it may be paired with either Vd or Rd.
As stated by CMRG, third-line therapy is based on either carfilzomib with dexamethasone and/or cyclophosphamide, pomalidomide with dexamethasone with or without cyclophosphamide, or dexamethasone with or without bortezomib. Carfilzomib was considered the most suitable for patients without cardiac comorbidities.
Therapies beyond the third-line treatment setting include treatments provided through clinical trials, special access programs, or palliative therapies. The CMRG noted that clinical trials almost exclusively require prior exposure to PIs, immunomodulatory drugs and anti-CD38 monoclonal antibodies. Selinexor was stated to be currently available through special access programs and was acknowledged by the CMRG to differ compared with currently available therapies based on the route of administration, side-effect profile, and supportive care needs. According to the clinical groups, physicians in Canada are seeking therapies such as selinexor that differ from currently available treatment options for patients who progress through funded options but are not yet candidates for palliative care.
The OH-CCO DAC expressed uncertainty about the specific placement of SVd into the current treatment paradigm. However, both groups generally agreed that daratumumab- or isatuximab-based regimens would be preferred in the second line before recommending SVd. Both groups agreed that this drug would not affect the treatment sequence employed in current practice.
Patient Population
Both clinician groups acknowledged that eligible patients would be identified by their treating physician or hematologist. The OH-COO DAC did not specify criteria for patients who would be least suited for treatment, although the CMRG indicated that newly diagnosed patients with MM would be least suitable for treatment with SVd.
Assessing Response to Treatment
Both groups indicated that patient responses to treatment would be assessed using conventional myeloma response criteria. Specifically, responses could be assessed using regular blood and urine examinations to measure M protein, quantitative immunoglobulins, free light chains and immunofixation, and imaging and/or bone marrow biopsies for patients with oligosecretory or non-secretory disease.
The clinical experts suggested that a clinically meaningful response to treatment in the setting of advanced disease includes a minimum 50% reduction in measurable disease (i.e., M protein or reduction in oligosecretory disease lesions). The CMRG emphasized that, depending on the severity of myeloma-related organ damage, a lesser response might be acceptable if the disease stopped progressing. Both groups agreed that patient responses to treatment would be assessed each cycle or approximately every month.
Discontinuing Treatment
Both groups agreed that discontinuation of treatment would be based on disease progression and toxicity.
Prescribing Conditions
Both groups agreed that SVd would be administered in outpatient clinics, hematology clinics, and hospitals.
Additional Considerations
The CMRG highlighted the route of administration of selinexor is advantageous for patients, as oral therapies are more convenient. In addition, the weekly administration of bortezomib as part of the regimen was acknowledged as another advantage, as the incidence of PN was stated to be lower than the biweekly dose typically used with bortezomib. The OH-CCO DAC additionally indicated that inclusion of bortezomib introduces uncertainty to this regimen, as SVd cannot be given to patients who are triple-refractory because of the need to be bortezomib-sensitive.
Drug Program Input
The drug programs provide input on each drug being reviewed through CADTH’s reimbursement review processes by identifying issues that may affect their ability to implement a recommendation. The implementation questions and corresponding responses from the clinical experts consulted by CADTH are summarized in Table 4.
Table 4: Summary of Drug Plan Input and Clinical Expert Response
Drug program implementation questions | Clinical expert response |
|---|---|
Relevant comparators | |
The BOSTON trial compared SVd vs. twice-weekly Vd in myeloma patients who had received at least 1 but no more than 3 prior lines of therapy. At the time of the PAG input, Vd may be more appropriate as a comparator if SVd is used in a much later line setting (e.g., fourth line). PAG noted that the bortezomib dosing used in the Vd arm of the BOSTON trial was twice weekly whereas most Jurisdictions use weekly bortezomib and dexamethasone. | Vd in the second or third line is not a relevant comparator based on standard of care in current clinical practice. The twice-weekly schedule of Vd used in the comparator group of the BOSTON trial is not often used in clinical practice. In addition, Vd is often not used alone and is usually part of a triplet regimen. |
Considerations for initiation of therapy | |
Should SVd be used in patients who have bortezomib-refractory multiple myeloma? | Patients who are refractory to bortezomib may not continue to experience a response to this therapy. Patients who were refractory to a PI were excluded from the BOSTON trial. |
Patients with plasma cell leukemia and systemic light chain amyloidosis were excluded from the BOSTON trial. Should patients with plasma cell leukemia and systemic light chain amyloidosis be excluded from receiving therapy with selinexor and dexamethasone? | The eligibility criteria of the BOSTON trial were restrictive, and, while patients with plasma cell leukemia and systemic light chain amyloidosis were excluded from the BOSTON trial, these patients would be treated in clinical practice and could benefit from SVd therapy. |
Considerations for prescribing of therapy | |
In the trial, a selinexor dose escalation to a 120 mg weekly dose starting at cycle 3 could have been considered for SVd patients who did not achieve at least a partial response within the first 2 cycles, were tolerating the 100 mg weekly dose well, and did not have any adverse events at the time of dose escalation. | For pERC consideration. |
The cycle length of Vd when combined with selinexor is different than the Vd 28-day cycle that centres are accustomed to, which may lead to errors. | For pERC consideration. |
The incidence of cataracts with the combination of selinexor, bortezomib and dexamethasone may require consultation with ophthalmologists. | The BOSTON trial also required ophthalmic examination by an optometrist or ophthalmologist before the first dose of treatment, and at the end of treatment. This was repeated if clinically indicated during the study (e.g., monitoring of pre-existing cataracts or visual disturbances). The incidence of cataracts during the treatment period was higher than expected. Therefore, clinicians may consider closer observation of vision problems in patients. |
The Incidence of gastrointestinal toxicities, most notably diarrhea, nausea and vomiting and anorexia, requires supportive care. Additional resources will be required for the monitoring and management of side effects with selinexor. | For pERC consideration. |
Funding algorithm | |
Drug may change place in therapy of drugs reimbursed in previous lines. | For pERC consideration. |
Drug change place in therapy of drugs reimbursed in subsequent lines. | For pERC consideration. |
Complex therapeutic space with multiple lines of therapy, subpopulations, or competing products. | For pERC consideration. |
What is the place in therapy for SVd? Under which clinical circumstances would SVd be preferred over existing funded regimens (e.g., DVd, DRd, KRd, Kd, pomalidomide plus dexamethasone, lenalidomide plus dexamethasone)? | Based on eligibility criteria from the BOSTON trial, patients could have received SVd in the second line or later. The clinical experts agreed that SVd could be used in the second line, although it would likely be used in third line or later. Other regimens may be preferred over SVd, including daratumumab based regimens. An ITC submitted by the sponsor also suggested that other regimens (|||||||||||||||||||||||||||||||||||) may be preferred before using SVd. |
Care provision | |
Eye exams are needed due to new onset or worsening of existing cataracts. | See response under considerations for prescribing of therapy. |
System and economic issues | |
The extent of the budget impact would depend on the eventual place in therapy for SVd and also the prevalent patients who may be treated with SVd in the fourth-line setting. | For pERC consideration. |
High-cost drug. | For pERC consideration. |
pERC = CADTH pan-Canadian Oncology Drug Review Expert Review Committee; ITC = indirect treatment comparison; PAG = Provincial Advisory Group; PI = proteosome inhibitor; SVd = selinexor plus bortezomib plus dexamethasone; Vd = bortezomib plus dexamethasone.
Clinical Evidence
The clinical evidence included in the review of selinexor is presented in 3 sections. The first section, the Systematic Review, includes pivotal studies provided in the sponsor’s submission to CADTH and Health Canada, as well as studies selected according to an a priori protocol. The second section includes indirect evidence from the sponsor and indirect evidence selected from the literature that met the selection criteria specified in the review. The third section includes sponsor-submitted long-term extension studies and additional relevant studies that were considered to address important gaps in the evidence included in the systematic review.
Systematic Review (Pivotal and Protocol-Selected Studies)
Objectives
To perform a systematic review of the beneficial and harmful effects of selinexor (Xpovio) at 100 mg administered orally in combination with Vd for the treatment of adult patients with MM who have received at least 1 prior therapy.
Methods
Studies selected for inclusion in the systematic review included pivotal studies provided in the sponsor’s submission to CADTH and Health Canada, as well as those meeting the selection criteria presented in Table 5. Outcomes included in the CADTH review protocol reflect those considered to be important to patients, clinicians, and drug plans.
Table 5: Inclusion Criteria for the Systematic Review
Criteria | Description |
|---|---|
Patient population | Adult patients with multiple myeloma who have received at least 1 prior therapy Subgroups:
|
Intervention |
|
Comparatorsa |
|
Outcomes | Efficacy outcomes:
Harms outcomes:
|
Study design | Published and unpublished phase III and IV randomized controlled trials |
AE = adverse event; DOR = duration of response; HRQoL = health-related quality of life; IMWG = International Myeloma Working Group; ORR = overall response rate; OS = overall survival; PFS = progression-free survival; SAE = serious adverse event; TTNT = time to next treatment; TTP = time to progression; TTR = time to response; WDAE = withdrawal due to adverse event.
aLenalidomide-based regimens were considered for inclusion as comparators but were ultimately excluded on the basis that they would not be competing with selinexor in combination with bortezomib and dexamethasone, and instead used in sequence.
bThis regimen is not currently funded across Canadian jurisdictions.
cThis regimen has received a positive funding recommendation from CADTH.
dOutcomes that were identified as being of particular importance to patients in the input received by CADTH from patient groups.
The literature search was performed by an information specialist using a peer-reviewed search strategy. Two CADTH clinical reviewers independently selected studies for inclusion in the review based on titles and abstracts, according to the pre-determined protocol. Full-text articles of all citations considered potentially relevant by at least 1 reviewer were acquired. Reviewers independently made the final selection of studies to be included in the review, and differences were resolved through discussion.
The literature search for clinical studies was performed by an information specialist using a peer-reviewed search strategy according to the PRESS Peer Review of Electronic Search Strategies tool.12
Published literature was identified by searching the following bibliographic databases: MEDLINE All (1946‒) via Ovid and Embase (1974‒) via Ovid. All Ovid searches were run simultaneously as a multi-file search. Duplicates were removed using Ovid deduplication for multi-file searches, followed by manual deduplication in EndNote. The search strategy comprised both controlled vocabulary, such as the National Library of Medicine’s MeSH (Medical Subject Headings), and keywords. The main search concept was selinexor. Clinical trials registries searched included the US National Institutes of Health’s clinicaltrials.gov, WHO’s International Clinical Trials Registry Platform (ICTRP) search portal, Health Canada’s Clinical Trials Database, and the European Union Clinical Trials Register.
No filters were applied to limit the retrieval by study type. Retrieval was not limited by publication date or by language. Conference abstracts were excluded from the search results. Refer to Appendix 1 for the detailed search strategies.
The initial search was completed on February 15, 2022. Regular alerts updated the search until the meeting of the CADTH pan-Canadian Oncology Drug Review Expert Committee (pERC) on April 13, 2022.
Grey literature (literature that is not commercially published) was identified by searching relevant websites from the Grey Matters: A Practical Tool For Searching Health-Related Grey Literature checklist.13 Included in this search were the websites of regulatory agencies (FDA and European Medicines Agency). Google was used to search for additional internet-based materials. Refer to Appendix 1 for more information on the grey literature search strategy.
Findings From the Literature
One unique study was identified from the literature for inclusion in the systematic review (Figure 1). The included studies are summarized in Table 6. A list of excluded studies is presented in Appendix 2.
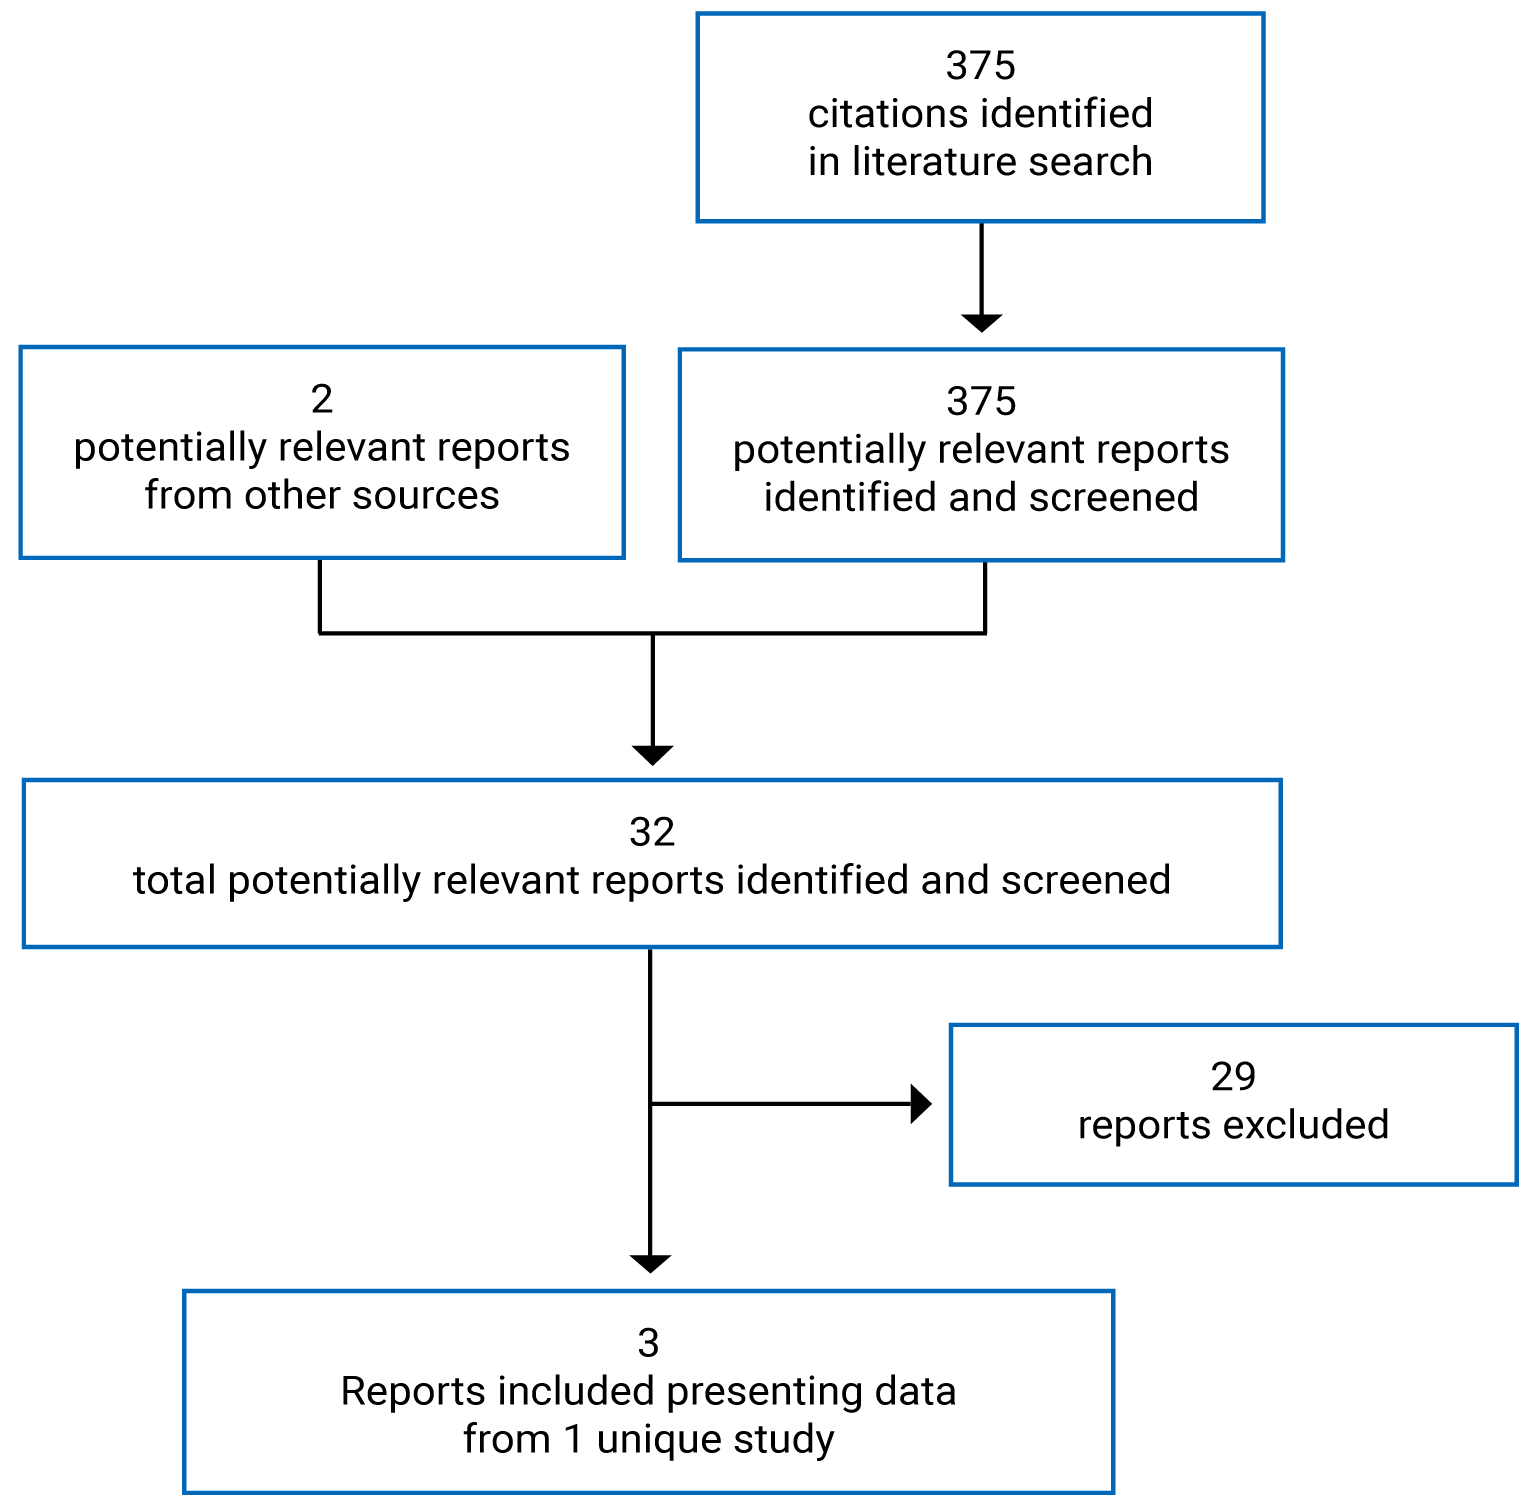
Table 6: Details of the Included Study
Detail | BOSTON |
|---|---|
Designs and populations | |
Study design | Phase III, open-label, randomized controlled trial |
Locations | Region 1: Canada, US Region 2: Austria, Belgium, France, Germany, Italy, Spain, UK, Israel, Australia Region 3: Czech Republic, Greece, Hungary, Poland Region 4: India, Russia, Ukraine, Bulgaria, Romania, Serbia |
Patient enrolment dates | June 6, 2017, to February 5, 2019 |
Randomized (N) | 402 |
Inclusion criteria |
|
Exclusion criteria |
|
Drugs | |
Intervention | Selinexor plus bortezomib plus dexamethasone:
|
Comparator | Bortezomib plus dexamethasone:
|
Outcomes | |
Primary end point | PFS per IRC |
Secondary and exploratory end points | Secondary:
Exploratory:
|
Notes | |
Publications | Grosicki et al. (2020)14 |
C1D1 = cycle 1 day 1; DOR = duration of response; ECOG PS = Eastern Cooperative Oncology Group Performance Status; EORTC QLC-CIPN20 = European Organisation for Research and Treatment of Cancer 20-item Quality of Life Questionnaire for Chemotherapy-Induced Peripheral Neuropathy; EORTC QLQ-C30 = European Organisation for Research and Treatment of Cancer Quality of Life Questionnaire Core 30; EQ-5D-5L = EQ-5D 5-Levels; FLC = free light chain; HRQoL = health-related quality of life; IgA = immunoglobin A; IMWG = International Myeloma Working Group; IRC = independent review committee; MM = multiple myeloma; ORR = overall response rate; ORR1 = overall response rate for patients treated with selinexor plus bortezomib plus dexamethasone after crossover; OS = overall survival; PFS = progression-free survival; PFS1 = progression-free survival for patients treated with selinexor plus bortezomib plus dexamethasone after crossover; PFS2 = progression-free survival for patients who received treatment after treatment with selinexor plus bortezomib plus dexamethasone, bortezomib plus dexamethasone, or selinexor plus bortezomib plus dexamethasone after crossover; PI = proteosome inhibitor; PN = peripheral neuropathy; PR = partial response; R-ISS = Revised International Staging System; SC = subcutaneous; SINE = selective inhibitor of nuclear export; TTNT = time to next treatment; TTR = time to response.
Note: Two additional reports were included.15,16
aSymptomatic ischemia.
Source: BOSTON Clinical Study Report.4
Description of Studies
One multi-centre, phase III, active-controlled open-label study, BOSTON, was included in this CADTH review. The objective of the BOSTON trial was to compare the efficacy, HRQoL and safety of SVd with those of Vd in adult patients with RRMM who received 1 to 3 prior anti-MM regimens. BOSTON was conducted at 123 sites across 21 countries including Canada. Patients were randomized to receive SVd or Vd in a 1:1 ratio and stratified based on prior PI therapy (yes versus no), number of prior anti-MM regimens (1 versus > 1). Patients were randomized within each of 4 geographic regions. At screening, patients’ R-ISS stage was assessed (R-ISS stage III versus R-ISS stage I or II); patients for whom R-ISS staging was not possible due to unavailable data for chromosomal abnormalities and serum lactate dehydrogenase were assigned to the R-ISS category corresponding to their ISS stage. Evaluations for MM were conducted at baseline, on day 1 of each cycle every 3 weeks through to week 37 to identify patients who progress quickly, and then every 5 weeks thereafter for the remainder of the study regardless of patient cycle length. This ensured comparable PFS data for both the SVd and Vd treatment groups. Patients who progressed, based on assessment by IRC, while receiving Vd were eligible to cross over to receive either SVd (SVdX) or selinexor plus dexamethasone (SdX) for those who were intolerant to bortezomib. Patients who received a selinexor-based regimen after crossover underwent MM evaluations every 5 weeks. Patient responses were graded according to IMWG response criteria.17 Per IMWG, response may be confirmed if the patient fails to provide a 24-hour urine sample after screening activities occur. To confirm a response, 2 consecutive assessments were needed. All MM disease assessments were required to be performed at the study visits pre-specified in the study protocol.
The end-of-study period was when the last patient completed their last survival follow-up. Completion of follow-up for the last patient was to occur when the last patient in the study was followed for up to 5 years after patients received their last dose of study treatment (including the assigned study therapy as well as selinexor-based regimens after crossover), withdrew their consent, were withdrawn from the study by the investigator, died, or had been lost to follow-up, whichever occurred first.
Populations
Inclusion and Exclusion Criteria
A complete summary of eligibility criteria for the BOSTON trial is supplied in Table 6. Briefly, inclusion criteria included adult patients with histologically confirmed MM with measurable disease per IMWG guidelines and who had received between 1 and 3 prior anti-MM regimens. Patients had to have documented evidence of progressive MM on or after their most recent regimen. Patients previously treated with bortezomib or another PI were eligible if certain criteria were met (Table 6). Patients must also have had an ECOG PS of no more than 2. Exclusion criteria included previous exposure to SINE compounds, including selinexor, previous malignancies requiring treatment, or evidence of recurring, and uncontrolled comorbidities. Patients could not have a PN greater than grade 2, or a PN of grade 2 or higher with pain at baseline, regardless of whether or not they were receiving medication.
Baseline Characteristics
A summary of baseline characteristics for all patients in the BOSTON trial is provided in Table 7. In general, characteristics across both the SVd and Vd treatment groups were well balanced. The mean age of patients was 65 years (SD = 9.56) in the SVd group and 67 years (SD = 9.35) in the Vd group, with most patients being aged 51 to 64 years (36% in the SVd group versus 31% in the Vd group), 65 to 74 years (39% versus 41%, respectively), or 75 years or older (17% versus 23%); fewer patients were between 18 and 50 years (8% versus 5%). There was a slightly greater proportion of males enrolled in the trial (59% versus 56% in the SVd and Vd groups, respectively). Most patients were White (83% versus 80% in the SVd and Vd groups, respectively) and not Hispanic or Latino (88% versus 91%), never smokers (73% versus 74%), and had an ECOG PS of 0 (35% versus 37%) or 1 (54% versus 55%), a mean creatinine clearance at baseline of greater than 60 mL/min (71% versus 66%), and a status of nonfrail at baseline (66% versus 69%).
Regarding disease stage, approximately one-quarter of patients (25% in the SVd group versus 27% in the Vd group) were diagnosed with stage I disease at diagnosis, compared to one-third who were diagnosed with stage II (32% versus 27%, respectively), and one-third with stage III (29% versus 32%, respectively). More than half of all patients had kappa light chain type of the active myeloma at baseline (56% versus 61% in the SVd group and Vd group, respectively). The R-ISS stage at screening was stage I for 29% of patients in the SVd group versus 25% in the Vd group, stage II for 60% of patients in both groups, and 6% and 7%, respectively, for stage III. Approximately half of patients had a high-risk chromosomal abnormality, with most being 1q21 (41% versus 34% in the SVd and Vd groups, respectively) compared to t(4;14) (11% versus 14%), del(17p)/p53 (11% versus 8%), or t(14;16) (4% versus 5%). The mean number of prior lines of anti-MM therapy was 1.7 in both treatment groups; 51% versus 48% of patients in the SVd and Vd groups, respectively, had 1 prior line of therapy, compared to 33% and 31% of patients with 2 prior lines of anti-MM therapy, and 16% versus 21% of patients with 3 prior lines of anti-MM therapy.
Most patients had received prior PI therapy (76% in the SVd group versus 77% in the Vd group). Other treatments to which patients had been previously exposed included bortezomib (69% versus 70% in the SVd and Vd groups, respectively), lenalidomide (40% versus 37%), carfilzomib (10% in both groups), pomalidomide (6% versus 3%), daratumumab (6% versus 3%), and ixazomib (3% versus 1%). Slightly more patients in the SVd group received a stem cell transplant (39%) than in the Vd group (30%).
A summary of baseline characteristics for patients in the crossover populations (SVdX and SdX) are reported in Table 8. There were no differences in baseline characteristics between the SVdX and SdX groups. Baseline characteristics also generally matched those of the total population. However, the mean number of prior lines of anti-MM therapies was greater in the crossover population (mean prior anti-MM therapies = 3); this is expected as these patients would have received treatment in the BOSTON trial as well, which would increase the average number of therapies for this group compared to patients who entered the BOSTON trial at baseline.
Table 7: Summary of Baseline Characteristics (Intention-to-Treat Population)
Characteristic | SVd group (N = 195) | Vd group (N = 207) |
|---|---|---|
Age, mean (SD) | 65.3 (9.56) | 66.7 (9.35) |
Age category (years), n (%) | ||
18 to 50 | 15 (7.7) | 11 (5.3) |
51 to 64 | 71 (36.4) | 64 (30.9) |
65 to 74 | 75 (38.5) | 85 (41.1) |
≥ 75 | 34 (17.4) | 47 (22.7) |
Sex, n (%) | ||
Male | 115 (59.0) | 115 (55.6) |
Female | 80 (41.0) | 92 (44.4) |
Race, n (%) | ||
Asian | 25 (12.8) | 25 (12.1) |
Black or African American | 4 (2.1) | 7 (3.4) |
White | 161 (82.6) | 165 (79.7) |
Other | 0 | 1 (0.5) |
Missing | 5 (2.6) | 9 (4.3) |
Ethnicity, n (%) | ||
Hispanic or Latino | 6 (3.1) | 5 (2.4) |
Not Hispanic or Latino | 171 (87.7) | 188 (90.8) |
Not reported | 14 (7.2) | 11 (5.3) |
Unknown | 4 (2.1) | 2 (1.0) |
Missing | 0 | 1 (0.5) |
Baseline ECOG Performance Status, n (%) | ||
0 | 69 (35.4) | 77 (37.2) |
1 | 106 (54.4) | 114 (55.1) |
2 | 20 (10.3) | 16 (7.7) |
Creatinine clearance at baseline (mL/min), mean (SD) | 77.35 (29.062) | 75.57 (31.645) |
< 30 | 3 (1.5) | 10 (4.8) |
30 to 60 | 53 (27.2) | 60 (29.0) |
> 60 | 139 (71.3) | 137 (66.2) |
Frail status at baseline, n (%) | ||
Frail | 66 (33.8) | 64 (30.9) |
Nonfrail | 129 (66.2) | 143 (69.1) |
Disease stage at initial diagnosis, n (%) | ||
I | 48 (24.6) | 55 (26.6) |
II | 63 (32.3) | 56 (27.1) |
III | 57 (29.2) | 67 (32.4) |
Unknown | 27 (13.8) | 29 (14.0) |
Missing | 0 | 0 |
Light chain type of the active myeloma at baseline, n (%) | ||
Kappa | 109 (55.9) | 127 (61.4) |
Lambda | 76 (39.0) | 69 (33.3) |
Value too low to quantify | 6 (3.1) | 8 (3.9) |
Sample not collected | 4 (2.1) | 3 (1.4) |
Bone marrow result availability at baseline, n (%) | ||
Yes | 183 (93.8) | 198 (95.7) |
No | 12 (6.2) | 9 (4.3) |
R-ISS stage at screening, n (%) | ||
I | 56 (28.7) | 52 (25.1) |
II | 117 (60.0) | 125 (60.4) |
III | 12 (6.2) | 16 (7.7) |
Not available | 10 (5.1) | 14 (6.8) |
Patients with high-risk chromosomal abnormalities, n (%) | ||
del (17p)/p53 | 21 (10.8) | 16 (7.7) |
t(14;16) | 7 (3.6) | 11 (5.3) |
t(4;14) | 22 (11.3) | 28 (13.5) |
1q21 | 80 (41.0) | 71 (34.3) |
Any of del(17p)/p53, t(14;16), t(4;14), 1q21 | 97 (49.7) | 95 (45.9) |
Smoking status, n (%) | ||
Never | 143 (73.3) | 154 (74.4) |
Current | 9 (4.6) | 15 (7.2) |
Former | 42 (21.5) | 38 (18.4) |
Number of prior lines of anti-MM therapy, mean (SD) | 1.7 (0.74) | 1.7 (0.79) |
Number of prior lines of anti-MM Therapy, n (%) | ||
1 | 99 (50.8) | 99 (47.8) |
2 | 65 (33.3) | 64 (30.9) |
3 | 31 (15.9) | 44 (21.3) |
Prior PI therapies, n (%) | 148 (75.9) | 159 (76.8) |
Previously exposed, n (%) | ||
Bortezomib | 134 (68.7) | 145 (70.0) |
Carfilzomib | 20 (10.3) | 21 (10.1) |
Ixazomib | 6 (3.1) | 3 (1.4) |
Daratumumab | 11 (5.6) | 6 (2.9) |
Lenalidomide | 77 (39.5) | 77 (37.2) |
Pomalidomide | 11 (5.6) | 7 (3.4) |
Stem cell transplant, n (%) | 76 (39.0) | 63 (30.4) |
Patients who received any prior anti-MM radiotherapy, n (%) | 30 (15.4) | 41 (19.8) |
Number of unique anti-MM radiotherapy, mean (SD) | 1.3 (0.52) | 1.1 (0.46) |
Patients who received any prior anti-MM surgery, n (%) | 11 (5.6) | 14 (6.8) |
ECOG = Eastern Cooperative Oncology Group; MM = multiple myeloma; PI = proteosome inhibitor; R-ISS = Revised International Staging System; SD = standard deviation; SVd = selinexor plus bortezomib plus dexamethasone; Vd = bortezomib plus dexamethasone.
Source: BOSTON Clinical Study Report.4
Table 8: Baseline Characteristics by Crossover Population
Characteristic | SVdX group (N = 63) | SdX group (N = 11) |
|---|---|---|
Age, mean (SD) | 63.6 (9.81) | 61.5 (8.78) |
Age category (years), n (%) | ||
18 to 50 | 7 (11.1) | 1 (9.1) |
51 to 64 | 22 (34.9) | 7 (63.6) |
65 to 74 | 26 (41.3) | 2 (8.2) |
≥ 75 | 8 (12.7) | 1 (9.1) |
Sex, n (%) | ||
Male | 36 (57.1) | 7 (63.6) |
Female | 27 (42.9) | 4 (36.4) |
Race, n (%) | ||
Asian | 6 (9.5) | 3 (27.3) |
Black or African American | 1 (1.6) | 1 (9.1) |
White | 55 (87.3) | 7 (63.6) |
Other | 0 | 0 |
Missing | 1 (1.6) | 0 |
Ethnicity, n (%) | ||
Hispanic or Latino | 3 (4.8) | 0 |
Not Hispanic or Latino | 58 (92.1) | 11 (100.0) |
Not reported | 2 (3.2) | 0 |
Unknown | 0 | 0 |
Missing | 0 | 0 |
Previously exposed, n (%) | ||
Carfilzomib | 6 (9.5) | 1 (9.1) |
Ixazomib | 0 | 0 |
Daratumumab | 0 | 1 (9.1) |
Lenalidomide | 28 (44.4) | 3 (27.3) |
Pomalidomide | 5 (7.9) | 0 |
Stem cell transplant, n (%) | 23 (36.5) | 6 (54.5) |
Treatment-free interval for patients with new MM treatment in days, mean (SD) | 11.7 (8.05) | 71.5 (132.80) |
Light chain type of active myeloma at baseline, n (%) | ||
Kappa | 42 (66.7) | 11 (100.0) |
Lambda | 19 (30.2) | 0 |
Value too low to quantify | 2 (3.2) | 0 |
Sample not collected | 0 | 0 |
Number of prior lines of anti-MM therapy, mean (SD) | 2.9 (0.83) | 3.1 (0.83) |
Number of prior lines of anti-MM therapy, n (%) | ||
2 | 25 (39.7) | 3 (27.3) |
3 | 20 (31.7) | 4 (36.4) |
4 | 18 (28.6) | 4 (36.4) |
MM = multiple myeloma; SD = standard deviation; SdX = selinexor plus dexamethasone after crossover; SVdX = selinexor plus bortezomib plus dexamethasone after crossover.
Source: BOSTON Clinical Study Report.4
Interventions
Patients in the intervention group received SVd. Each treatment in this regimen was administered in the following doses:
Selinexor administered at 100 mg (5 tablets of 20 mg each) orally on days 1, 8, 15, 22, and 29 of each cycle. Each cycle was 35 days.
Bortezomib administered at a dose of 1.3 mg/m2 SC on days 1, 8, 15, and 22 of each cycle. Each cycle was 35 days.
Dexamethasone administered at a dose of 20 mg orally on days 1, 2, 8, 9, 15, 16, 22, 23, 29, and 30. Each cycle was 35 days.
Selinexor tablets were administered orally with at least 120 mL (4 ounces) of water and could be taken with or without food once daily. The doses of the selinexor-based combination were determined based on results from a phase II trial (STOMP).
Patients in the comparator group received Vd. Each treatment in this regimen was administered in the following doses:
Bortezomib administered at a dose of 1.3 mg/m2 SC on days 1, 4, 8, and 11 of each cycle for the first 8 cycles. Each cycle consisted of 21 days; after cycle 8, bortezomib was administered at a dose of 1.3 mg/m2 SC on days 1, 8, 15, and 22 of each cycle; each cycle was 25 days.18
Dexamethasone administered at a dose of 20 mg rally on days 1, 2, 4, 5, 8, 9, 11, and 12 of each cycle for the first 8 cycles; each cycle consisted of 21 days; after cycle 8, dexamethasone was administered at a dose of 20 mg orally on days 1, 2, 8, 9, 15, 16, 22, 23, 29, and 30 of each cycle; each cycle was 25 days.18
Where possible, each study treatment (selinexor, bortezomib, and dexamethasone), was generally taken 1 to 2 hours apart. Dexamethasone was to be administered at least an hour before selinexor and bortezomib. Disease progression was required to be confirmed by IRC, unless patients were medically contraindicated; an exception was made for patients randomized to the Vd group who terminated bortezomib treatment before IRC-confirmed disease progression if the decision to stop bortezomib treatment was due to significant toxicities, such as PN, and all treatment measures addressing these toxicities were exhausted and documented before bortezomib termination. The decision to terminate bortezomib early for these patients was discussed and approved by a medical monitor to allow crossover to SdX after progression was confirmed by IRC.
Treatment could be discontinued if it was decided by the investigator or patient to discontinue, or due to pregnancy, unacceptable AEs or toxicity that could not be managed by supportive care, withdrawal of consent, death, or the study sponsor’s decision to terminate the study. After patients experienced disease progression, patients in the SVd group completed their end-of-treatment visit and were followed for survival. Patients in the Vd group either crossed over or discontinued study treatment, completed their end-of-treatment visit, and were followed for survival.
Crossover
After disease progression, per IRC assessment, patients in the Vd group were eligible to cross over to receive SVd (referred to as SVdX) or selinexor plus dexamethasone (SdX) if they were intolerant to bortezomib. The following procedures were put in place to prevent premature crossover:
Investigators assessed for disease progression according to IMWG criteria, which included repeated testing if disease progression was based on serum and/or urine M protein, quantitative immunoglobulins for immunoglobin A or D, or serum free light chain (FLC). Disease progression could also be based on new or enlarging plasmacytoma(s) or bone lesion(s) or on other symptoms and signs of clinical progression that met the IMQG criteria.
All cases of disease progression were confirmed by an IRC before crossover.
Crossover was not permitted based purely on disease progression assessed by the investigator that did not meet any IMWG criteria and which could not be verified by IRC (e.g., deteriorating performance status).
Crossover was not permitted if dosing of bortezomib was terminated before disease progression was confirmed by an IRC, unless termination of bortezomib was due to significant toxicities (i.e., PN), and all treatment measures addressing these toxicities were exhausted and documented before bortezomib termination. Early termination of bortezomib was discussed and approved by the sponsor’s medical monitor to allow crossover to SdX after progression was confirmed by an IRC.
Investigator-assessed presumptive events of progressive disease that were not confirmed by the IRC had their PFS censored at the time of treatment discontinuation.
Patients receiving SVdX would return to cycle 1 for SVd treatments at the doses of the SVd group, and undergo MM evaluations every 5 weeks. Patients receiving SdX returned to cycle 1 for treatment with selinexor plus dexamethasone and underwent MM evaluations every 5 weeks. Doses for the SdX group were the same as the doses for selinexor and dexamethasone in the SVd group.18
Dose Escalation
Patients being treated with a selinexor-based regimen (SVd, SVdX, or SdX) could have been considered for dose escalation for selinexor if they met the following criteria: did not achieve at least a PR within the first 2 cycles, were tolerating SVd well at dose level 0, and did not have any AEs of grade 2 or higher related to study treatment at the time of dose escalation.18
For cycles 3 and beyond, selinexor could be increased to a fixed oral dosage of 60 mg twice weekly during weeks 1 through 5 of each cycle. Dexamethasone (20 mg) was given twice weekly on the same days as selinexor.18 A total of 45 patients (23.1%) in the SVd group underwent dose escalation with selinexor.19
Patients could also have undergone dose escalation with Vd. Ten patients (5.1%) in the SVd group and 6 patients (2.9%) in the Vd group underwent dose escalation to bortezomib. Six patients (3.1%) in the SVd group and 9 patients (4.4%) in the Vd group underwent dose escalation to dexamethasone.
Dose Modifications
Dose modifications were permitted for selinexor, bortezomib, and dexamethasone to manage tolerability.
Dose reductions were conducted based on a pre-specified dose-adjustment guide for selinexor related to AEs, including fatigue, anorexia or weight loss, acute nausea, hyponatremia, diarrhea, thrombocytopenia, neutropenia, anemia, tumour lysis syndrome, and other selinexor-related AEs. For some AEs, dose interruptions were recommended rather than reductions.18 Procedures for dose modifications of selinexor are specified in Table 9.
Table 9: Pre-Specified Dose Modifications for Adverse Events Related to Selinexor
Selinexor dose level | Total weekly selinexor dosage | Selinexor dosage schedule |
|---|---|---|
+ 1a | 120 mg | 60 mg b.i.w. (i.e., 120 mg q.w. not allowed) |
0 (starting level) | 100 mg | 100 mg q.w. |
−1 | 80 mg | 80 mg q.w. |
−2 | 60 mg | 60 mg q.w. |
−3 | 40 mg | 40 mg q.w. |
b.i.w. = twice weekly; q.w. = once weekly; SVd = selinexor plus bortezomib plus dexamethasone.
aDose level of + 1 may be considered for patients who meet the following 3 criteria: 1) they do not achieve at least a partial response after the first 2 cycles of SVd; and 2) they are tolerating SVd well at dose level 0; and 3) they do not have any AEs related to study treatment of grade 2 or worse as defined by the National Cancer Institute Common Terminology Criteria for Adverse Events version 4.03 at the time of dose escalation.
Source: BOSTON Protocol.18
Dose modifications for bortezomib related to PN resulted in a change from a dosage of 1.3 mg/m2 twice weekly to once weekly. Other toxicities requiring dose modifications of bortezomib were conducted according to guidelines in the prescribing information for bortezomib. Doses of dexamethasone were to remain constant throughout the study. However, patients who had a partial intolerance to dexamethasone could have had a dosage reduction to a minimum dose of 10 to 12 mg twice weekly.18
Dose Modifications for Overlapping Toxicities
It was possible for toxicities related to both selinexor and bortezomib to overlap; in these cases, it was strongly recommended that the investigator reduce the dose or delay 1 drug at a time. Thrombocytopenia and neutropenia were considered to have potentially overlapping toxicities for selinexor plus bortezomib. For patients who experienced drug-induced thrombocytopenia and/or neutropenia while they were receiving any study regimen, attempts were made to determine which drug may be responsible and to treat appropriately, with dose modifications if necessary. For cases where the cause of the AE could not be attributed to a single drug, it was strongly recommended that the investigator reduce the dose or delay 1 of the drugs at a time.18
Missed or Vomited Doses
Pre-specified instructions were provided for patients who missed doses. For patients in the Vd group who missed a dose of bortezomib, their schedules were altered to accommodate 2 doses in that week, with at least 72 hours between 2 consecutive doses of bortezomib. For patients who missed a dose of any study treatment, they were to simply take their next dose as scheduled.18
Patients who missed doses of treatment for reasons unrelated to the study protocol (e.g., a required medical procedure or an unanticipated personal emergency) were to replace the missed doses on the following cycle. If selinexor doses are vomited within 1 hour of ingestion, the dose was to be replaced. If vomiting occurred more than 1 hour after dosing, it was considered a complete dose.18
Concomitant Medications
Concomitant medications to treat symptoms, AEs, and intercurrent illnesses were permitted such that they were a necessary part of standard of care. Medications to treat concomitant illnesses such as diabetes and hypertension were permitted. If clinically indicated, patients could receive transfusions of red blood cell or platelets.18
Restrictions
On the days when selinexor was administered, the use of acetaminophen or products containing acetaminophen was limited to a total daily dose of 1 g; no restrictions were placed on the use of acetaminophen-containing products for other days. Patients were not permitted to take products containing glutathione, S-adenosylmethionine, or N-acetylcysteine during their participation in the BOSTON trial as these products may enhance the metabolism of selinexor; however, patients could use these products if the patient had elevated liver function tests.18
Outcomes
A list of efficacy and safety end points identified in the CADTH review protocol that were assessed in the clinical trials included in this review is provided in Table 10, and these end points are further summarized in the following section. A detailed discussion and critical appraisal of the outcome measures is provided in Appendix 4.
Table 10: Summary of Outcomes of Interest Identified in the CADTH Review Protocol
Outcome measure | Description |
|---|---|
Primary | |
PFS | PFS was defined as the time from data of randomization until the first data of disease progression, per IMWG response criteria, or death due to any cause, whichever occurs first. PFS was assessed centrally via IRC. Clinical deterioration in the absence of objective M protein increase was not considered disease progression. |
Key secondary end points | |
ORR | ORR was defined as the proportion of patients who achieved a confirmed PR or better (i.e., PR, VGPR, CR, or sCR) based on the IRC’s response outcome assessments, according to the IMWG response criteria, before IRC-confirmed disease progression or initiating a new MM treatment. |
Incidence of grade ≥ 2 peripheral neuropathy events | Classified as a safety end point. The incidence of any PN events of grade 2 or higher were compared between the SVd and Vd treatment groups. |
Response rates for responses ≥ VGPR based on the IRC’s assessment | NA |
Other secondary end points | |
OS | Overall survival is defined as the duration from date of first dose until the date of death due to any cause. If a death event did not occur, the patient was censored at the date of discontinuation from the study (i.e., withdrawal of consent) or date of last participating visit (e.g., a telephone contact with patient status being alive) on or before database cut-off date. |
Response ≥ CR, ≥ sCR, or MRD negative (for patients who achieve CR or sCR): | NA |
Duration of response | DOR was defined, for patients with a confirmed PR or better, as the duration from the date of first confirmed PR or better to the date of first confirmed progressive disease or death due to any cause, whichever occurred first. |
ORR1 | ORR for SVdX patients only |
PFS1 | PFS for SVdX patients only was defined as the duration of time from the date of the first dose of the SVd treatment after crossover from the Vd arm until the first date of progressive disease or death due to any cause, whichever occurred first. |
TTNT | TTNT was defined as the duration of time from the date of the last dose of the study treatment until the date of the first dose of treatment after SVd, Vd, SVdX, or SdX. |
TTR | TTR was defined as the duration of time from randomization until the date of the first documented response (≥ PR) according to IMWG response criteria. |
PFS2 | PFS for patients who received treatment after SVd, Vd, or SVdX, was defined as the duration of time from the date of the first dose of the treatment after SVd, Vd, or SVdX until the first date of progressive disease on treatment after SVd, Vd, or SVdX or death due to any cause, whichever occurred first. |
Chemotherapy-induced peripheral neuropathy (QLQ-CIPN20) | NA |
CR = complete response; DOR = duration of response; EORTC QLQ-CIPN20 = European Organisation for Research and Treatment of Cancer 20-item Quality of Life Questionnaire for Chemotherapy-Induced Peripheral Neuropathy; IMWG = International Myeloma Working Group; IRC = independent review committee; MRD = minimal residual disease; NA = not applicable; ORR = overall response rate; OS = overall survival; PFS = progression-free survival; PR = partial response; sCR = stringent complete response SdX = selinexor plus dexamethasone after crossover; SVd = selinexor plus bortezomib and dexamethasone; SVdX = selinexor plus bortezomib plus dexamethasone after crossover; VGPR = very good partial response.
Source: BOSTON Protocol.
Safety
Adverse events were graded by severity according to the National Cancer Institute (NCI) Common Terminology Criteria for Adverse Events (CTCAE) version 4.03. For AEs that did not have a specific CTCAE grade, severity was characterized as mild (transient and not interfering with the patient’s daily activities), moderate, severe, or life-threatening, indicating grade 1 (usually transient and do not interfere with the patient’s daily activities), 2 (introduces a low level of inconvenience or concern to the patient and may interfere with daily activities), 3 (interrupts the patient’s usual daily activities), and 4 (life-threatening) AEs, respectively. Adverse events of special interest were reported by the sponsor for selinexor. Those of special interest for selinexor included cataracts and acute cerebellar syndrome. Adverse events were recorded through to the end of the study for at least 30 days following the last dose of study treatment, or until resolution.
The incidence of any PN events of grade 2 or higher was a safety end point, and 1 of the key secondary end points of the BOSTON trial. Non-key secondary safety end points included safety and tolerability of study treatments based on AE reports, physical examination results (including vital signs), ECOG PS scores, 12-lead electrocardiogram results, ophthalmic results, and clinical laboratory tests.
Statistical Analysis
Results from the BOSTON trial were reported for 2 data cut-offs: February 28, 2020 (primary analysis) and February 15, 2021 (updated analysis). The primary analysis was based on a pre-specified interim analysis, which is described in the following section. An additional analysis after the second interim analysis was conducted on February 15, 2021, at the request of the Committee for Medicinal Products for Human Use (CHMP). At this updated-item point, analyses of the primary end point, key secondary end points, and safety data (e.g., PFS, DOR, OS, ORR, AEs, SAEs, AEs of clinical interest, and deaths) were also analyzed. The updated analysis was considered noninferential and P values from this analysis were considered nominal.19
Sample Size
The sample size was determined to have an 80% power to detect a median time to PFS of 13.5 months for patients treated with SVd versus 9.4 months for patients treated with Vd using a 1-sided alpha of 0.025; this allowed for 15 months of patient accrual and 18 months of follow-up. The median time to PFS of 9.4 months in the Vd group was based on recent ENDEAVOR and CASTOR clinical studies; the eligibility criteria of these studies were considered to be similar to those of the BOSTON trial, with a PFS of 9.4 months in the ENDEAVOR trial and 7.2 months in the CASTOR trial. The median time to PFS in the SVd group was based on preliminary results from the ongoing STOMP trial. Treatment difference was assessed via a log-rank test, which found that 267 PFS events were required for the final analysis. A total of 364 patients was required for enrolment, or approximately 182 patients in each treatment group. An exponential dropout rate of 0.65% per month was assumed, which is equivalent to a dropout rate of approximately 10% after 18 months.
Interim Analyses
Two interim analyses for PFS for futility or superiority were pre-specified (Figure 2). The first interim analysis was planned to be performed for sample size re-estimation. The DSMB reviewed overall survivorship for PFS at this first interim analysis to determine if the sample size, recruitment period, or duration of the follow-up needed to be adjusted to ensure timely achievement of the 267 PFS events required for the final analysis. This first interim analysis was planned to occur after approximately 30% (i.e., 81) of the PFS events had occurred. The unblinded sample size re-estimation was based on the condition power. The sample size re-estimation analyses were conducted by an independent statistician external to the sponsor of the BOSTON trial, and the results were provided to the DSMB, which reviewed the results and then made a recommendation to the sponsor.
The second interim analysis for PFS was planned to occur after approximately 75% of PFS events (i.e., approximately 201 PFS events) and 22 months after the start of the study to allow for patient accrual to be completed before this interim analysis. The results of the interim analysis would allow for a conclusion of significant efficacy at a P value less than or equal to 0.0072, and stopping for futility (non-binding) at a P value greater than or equal to 0.0598. The timing of this second interim analysis was to allow for sufficient follow-up time following the end of patient accrual so that any delayed treatment effect may become sufficiently attenuated. There was a plan to adapt the study at this interim analysis to estimate the treatment effect. The type I error for this second interim analysis was maintained using the Cui, Hung, and Wang (CHW) method if the unblinded sample size re-estimation was conducted. At the time of this second interim analysis, the 3 key secondary end points were also tested: ORR, incidence of PN events of grade 2 or higher, and response rates for responses of a VGPR or better based on an IRC assessment. To maintain the overall type I error of these 3 tests at a 1-sided significance level of 0.025, a hierarchical testing procedure was conducted; testing of these end points was not conducted until the primary end point of PFS reached statistical significance.
The alpha level for the final analysis of PFS was adjusted for the planned interim analyses using the Lan-DeMets alpha spending function with the O’Brien-Fleming type of boundary. If, at the first interim analysis, the unblinded sample size re-estimation was conducted, the CHW method was also used for the final analysis of PFS.
Figure 2: Overview of the BOSTON Trial Interim Analyses
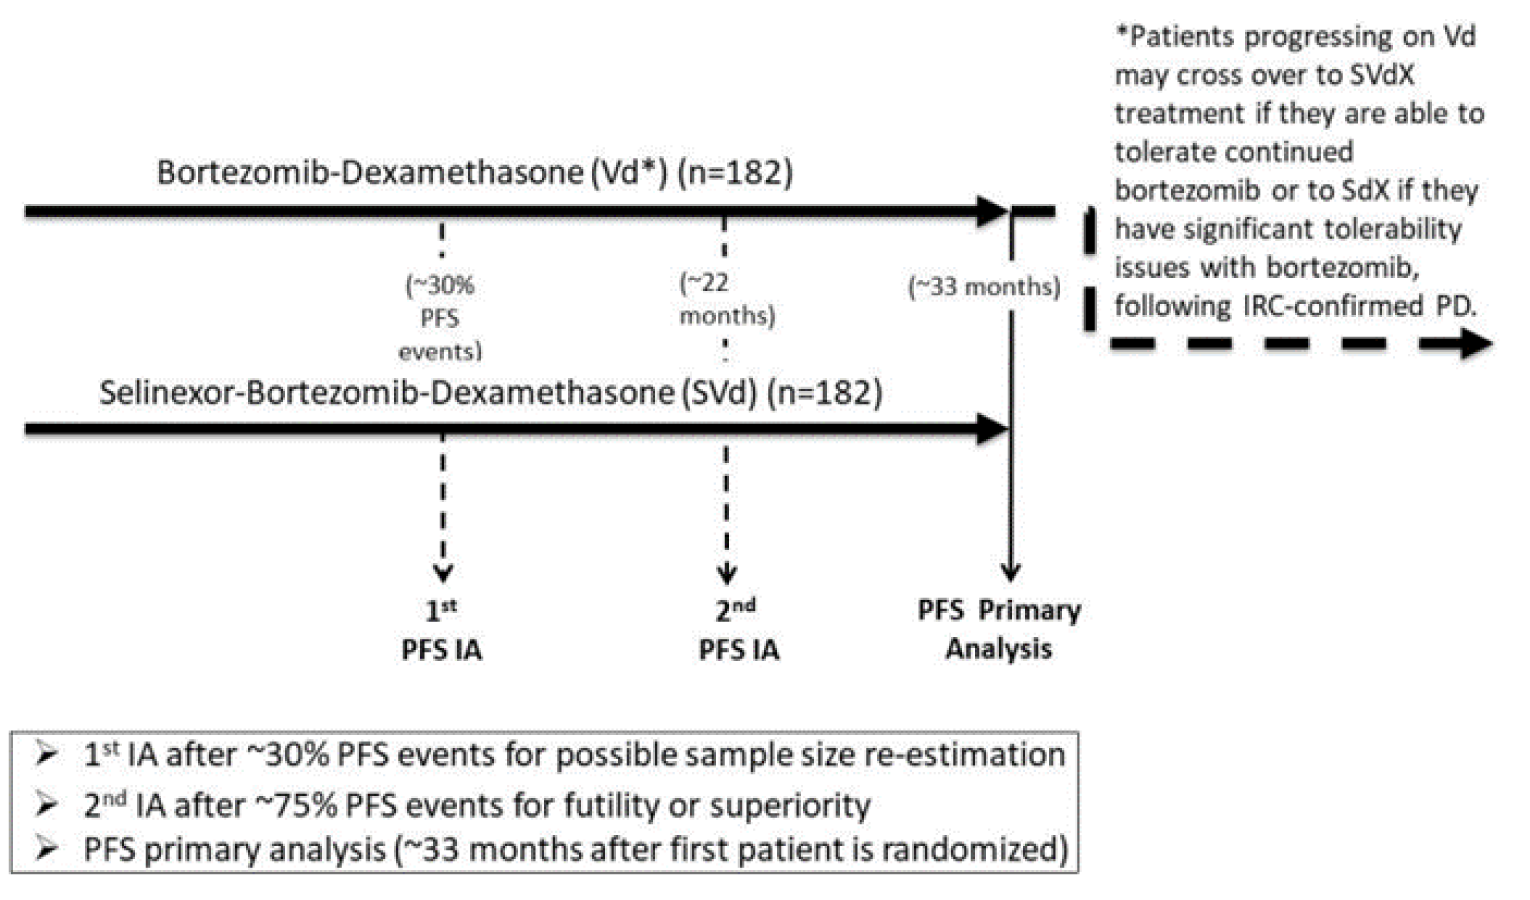
IA = interim analysis; IRC = independent review committee; PD = progressive disease; PFS = progression-free survival; SdX = selinexor plus dexamethasone after crossover; SVdX = selinexor plus bortezomib plus dexamethasone after crossover; Vd = bortezomib plus dexamethasone.
Note: The second interim analysis was based on the data cut-off date of February 18, 2020.
Source: BOSTON Clinical Study Report.4
Handling of Missing Data
In general, for all efficacy end points no substitutions for missing data points were made. For HRQoL measurements, missing data were handled as described in the scoring manuals for each of the EORTC QLQ-C30, EORTC QLQ-CIPN20, and EQ-5D-5L. No other imputations for missing efficacy data were planned. Patients without efficacy evaluations were considered censored at time 0 for time-to-event analyses. For AEs, missing dates were outlined according to rules outlined in the statistical analysis plan.19
Analysis of End Points
Unless otherwise specified, all analyses of efficacy end points were conducted with the intention-to-treat (ITT) population. Summary statistics (i.e., n, median, mean, SD, minimum, and maximum) were computed for continuous variables. Frequencies and percentages were presented for categorical variables. The Kaplan-Meier method was used for time-to-event variables. Graphical displays were provided when appropriate.
The primary end point of the BOSTON trial was PFS. Key secondary end points included ORR, response rates at any time before disease progression or death due to any cause, and incidence of any grade 2 or higher PN events. To maintain the overall type I error at a 1-sided 0.025 level of significance, the ORR was tested under a hierarchical testing procedure. Key secondary end points were tested in the following sequence: ORR, incidence of any grade 2 or higher PN events, and response rates of a VGPR or better based on an IRC assessment.
Non-key secondary end points included OS; DOR; ORR for SVdX patients only (ORR1); PFS for SVdX patients only (PFS1); TTNT, TTR, and PFS for patients who received treatment after SVd, Vd, or SVdX 2 (PFS2), and HRQoL measured using the EORTC QLQ-CIPN20.
Exploratory end points included TTD of SVd and Vd treatment, HRQoL measured using the EORTC QLQ-C30, and the EQ-5D-5L, disease response to SdX treatment according to the IMWG response criteria.
Progression-Free Survival
As clinical deterioration without an increase in M protein levels was not considered disease progression, patients who ended study treatment due to clinical deterioration without an increase in M protein levels were censored for analysis of PFS. Unless otherwise specified, relapse from CR by positive immunofixation or trace amount (defined as < 0.5 g/dL of M protein) was not considered to be disease progression. A summary of PFS used Kaplan-Meier methodology and 25th, 50th, and 75th percentiles with associated 2-sided 95% CIs. Percentages of censored observations and proportions of events were reported. Patients who did not experience a PFS event were censored at the date of their last disease assessment. A stratified log-rank test was used to compare the PFS distributions between treatment groups for the primary efficacy assessment. Analyses were stratified by prior PI therapy, number of prior anti-MM regimens, and the R-ISS stage at study entry. Hazard ratios were estimated using a stratified Cox proportional hazards model with treatment as the only factor and stratification based on the same stratification variables used for randomization.
A supportive analysis was planned to be conducted for PFS using the per-protocol population.
The following sensitivity analyses were conducted for PFS:
a sensitivity analysis used a nonstratified log-rank test and a Cox proportional hazards model
PFS events were defined as documented progression as verified by IRC or death when the patient was closely followed, whichever occurred first; patients were censored at the data of their last disease assessment if no there was no progression, as confirmed by IRC, treatment was discontinued for any reason, new anticancer treatment was started, or death or progression occurred after 2 or more missed visits
similar to the primary analysis for PFS, except treatment discontinuation for any reason was counted as an event
similar to the primary analysis for PFS, except the initiation of non-study antineoplastic therapy was counted as an event
similar to the primary analysis for PFS, except clinical progression, defined as when a patient discontinues the treatment with reason of disease progression but the event is not classified as disease progression by IRC, was counted as an event in addition to IRC-confirmed disease progression
similar to the primary analysis for PFS described above, except the timing of the IRC-confirmed disease progression at an unscheduled visit is changed to the net scheduled visit
analysis of PFS based on assessment by the investigator.
Overall Response Rate
ORR was 1 of the key secondary end points tested hierarchically upon statistical significance of PFS at the time of the second interim analysis. A Cochrane-Mantel-Haenszel (CMH) test stratified by prior PI therapy, number of prior anti-MM regimens, and the R-ISS stage at study entry were used to compare ORRs between the 2 treatment groups. The Breslow-Day test was used to evaluate the homogeneity of ORs across the strata associated with ORR. Patients missing MM disease assessments after cycle 1 day 1 (C1D1) were imputed as nonresponders. Forest plots of estimated ORs were provided for each stratification factor. The analysis of the response rate for responses of a VGPR or better were based on assessments by the IRC and performed in a similar manner to the primary efficacy end point of ORR using the CMH test.
A supportive analysis was planned to be conducted for ORR using the per-protocol population.
The following sensitivity analysis was conducted for ORR:
Patients who did not have the opportunity to complete at least 2 post-C1D1 MM evaluations were considered nonresponders.
Incidence of Peripheral Neuropathy Events of Grade 2 or Higher
This analysis for PN was 1 of the key secondary end points tested hierarchically upon statistical significance of PFS at the time of the second interim analysis. A CMH test stratified by randomization stratification factors was used to compare the differences in incidence of PN events of grade 2 or higher between the 2 treatment groups. This analysis was conducted using the safety population. The number and percentage of events were summarized by each treatment group along with ORs and associated 95% CIs. The Breslow-Day test was used to assess homogeneity of ORs across strata. Similar analyses were conducted for assessing the incidence of PN events of grades 2, 3, and 4 separately.
The following sensitivity analysis was conducted:
All PN events of grade 2 or higher that occurred for patients in the Vd group, regardless of crossover status, were included in the sensitivity analysis.
Response Rate for Responses of VGPR or Better Based on IRC Assessment
This end point was 1 of the key secondary end points tested hierarchically upon statistical significance of PFS at the time of the second interim analysis. The analysis for this end point was performed in a manner similar to that of the analysis for ORR using the CMH test. The unadjusted number and percentage of patients were summarized for each treatment group with associated 95% CIs. The Breslow-Day test was used to assess homogeneity of ORs across the strata. Only responses better than a VGPR that occurred before IRC-confirmed progressive disease or initiating a new MM treatment were included in the analysis.19
Overall Survival
Analyses for OS were performed by treatment group using a stratified log-rank test stratified by prior PI therapy, number of prior anti-MM regimens, and the R-ISS stage at study entry. The Kaplan-Meier method was used to estimate medians and associated 95% CIs. Kaplan-Meier curves were graphically displayed where appropriate.19
Duration of Response
Analyses for DOR were conducted in the same manner as OS.19
Time to Next Treatment
Analyses for TTNT were conducted in the same manner as OS.19
Time to Response
Analyses for TTR were conducted in the same manner as OS.19
Objective Response Rate for SVdX Patients Only (ORR1)
The percentage of patients who achieved a confirmed PR or better (i.e., PR, VGPR, CR, or sCR) was tested assuming a null hypothesis fixed-threshold value of 10% against a 1-sided alternative hypothesis of greater than 10% using exact methods for a 1-sample binomial without stratification.19
Time to Discontinuation of SVd and Vd
Analyses were performed using a stratified log-rank test by treatment group, stratified by prior PI therapies, the number of prior anti-MM regimens, and the R-ISS stage at study entry. The Kaplan-Meier method was used to determine median TTD with 95% CIs; graphical representation of the Kaplan-Meier curve was provided for each treatment group. Patients were censored if they did not discontinue treatment; these patents were censored at the date of the last dosing on or before the data cut-off date.19
Disease Response to SdX treatment According to IMWG Response Criteria
The IRC-confirmed response according to IMWG response criteria was summarized as the number and percentage of patients achieving the following responses: sCR, CR, VGPR, PR, minimal residual disease, stable disease, progressive disease, and NE. The corresponding 95% exact CI for each response category were also provided.19
Health-Related Quality of Life
Health-related quality of life was measured using 3 questionnaires: the EORTC QLQ-CIPN20, EORTC QLQ-C30, and EQ-5D-5L. A brief explanation of each instrument is provided here, and further detail is provided in Appendix 4.
EORTC QLQ-CIPN20: The EORTC QLQ-CIPN20 is a 20-item tool to elicit a patient’s experience of symptoms and functional limitations related to chemotherapy-induced PN. The questionnaire contains 3 subscales, including sensory (9-item), motor (8-item), and autonomic (3-item) subscales. Responses indicate the degree of sensory, motor, or autonomic symptoms during the past week as measured on a 4-point Likert scale, with 1 indicating “not at all” and 4 indicating “very much.” Responses are converted to a 0-to-100 scale, with higher scores indicating greater symptom burden. The scale was only calculated if a minimum of 50% of items (i.e., 5 of 9 items or 4 of 8 items) from the subscale were answered. Descriptive statistics were used to measure the value and change from baseline before initiating a new MM treatment for each of the 3 subscales. A linear-effects model was also used to analyze the change from baseline with treatment group as the fixed effect; analysis was stratified by prior PI therapies, the number of prior anti-MM regimens, and the R-ISS stage at study entry. The baseline value of the corresponding subscale score was included as a covariate, as well as the random effect of patients and repeated measures over time points. Adjusted mean changes of each treatment group and treatment differences were presented with 95% CIs and P values. The P values were considered nominal.19
EORTC QLQ-C30: The instrument consists of 5 functional scales, 3 symptom scales, a GHS/QoL scale, and 6 single items. The actual value and change from baseline before initiating a new MM treatment was summarized using descriptive statistics over time for each scale: functional scale, symptom scale, GHS/QoL scale, and single items.19
EQ-5D-5L: The actual value and change from baseline before initiating a new MM treatment were summarized using descriptive statistics over time for EQ-5D-5L health states and VAS scores.19
Analysis Populations
A summary of the analysis populations used in the BOSTON trial is provided in Table 11.
Table 11: Analysis Populations in the BOSTON Trial
Analysis set | Definition |
|---|---|
ITT population | The ITT population consisted of all patients who were randomized to study treatment, regardless of whether they received their study treatment. This analysis set included patients who discontinued study treatment due to toxicity or disease progression and patients who died from any cause. The ITT population was used for the primary analysis of efficacy, and patients were analyzed based on the treatment group they were randomized to and their strata assignment at the time of randomization. |
PP population | The PP population consisted of all patients in the ITT population who had study treatment compliance ≥ 70% and who had no major protocol violations that were expected to affect efficacy of assessment. The PP population was used for supportive analyses of efficacy, and patients were analyzed in the treatment group to which they were randomized. |
SVdX population (crossover from Vd) | The SVdX population consisted of a subset of patients in the Vd group of the safety population who crossed over from treatment with Vd to the SVdX treatment after disease progression on Vd (confirmed by IRC) and who had received at least 1 dose of selinexor. This population was used to analyze ORR1, PFS1, and safety information including grade ≥ 2 peripheral neuropathy events. |
SdX population (crossover from Vd) | The SdX population consisted of a subset of patients in the Vd group of the safety population who crossed over from the Vd treatment group to treatment with SdX after progression on Vd (confirmed by IRC) and who had received at least 1 dose of selinexor. This SdX population was limited to patients who were unable to crossover to SVdX based on a newly-established and clearly documented intolerance to bortezomib while receiving treatment in the Vd group. |
Safety population | The safety population consisted of all patients who received at least 1 dose of study treatment. Patients were analyzed according to the treatment they actually received. |
IRC = independent review committee; ITT = intention-to-treat; ORR1 = objective response rate for patients receiving selinexor plus bortezomib plus dexamethasone after crossover; PFS = progression-free survival for patients receiving selinexor plus bortezomib plus dexamethasone after crossover; PP = per-protocol; SdX = selinexor plus dexamethasone after crossover; SVdX = selinexor plus bortezomib plus dexamethasone after crossover; Vd = bortezomib plus dexamethasone.
Source: BOSTON Clinical Study Report.4
Results
Patient Disposition
A summary of patient disposition for all patients in the BOSTON trial is provided in Table 12. A total of 195 patients were randomized to the SVd group and 207 patients were randomized to the Vd group. All patients in the SVd group received their allocated treatment; only 3 patients in the Vd group did not receive the allocated treatment due to withdrawal of consent, death, and AEs (N = 1 for each). At the primary analysis, there were no differences in patients discontinuing from the study between treatment groups (81.0% in the SVd group versus 82.4% in the Vd group). The reasons for discontinuation were mainly due to disease progression (34.4% versus 52.5%, respectively), withdrawal by the patient (19.0% versus 8.8%, respectively) and AEs and/or toxicity (16.9% versus 11.3, respectively). A greater proportion of patients discontinued due to disease progression in the Vd group, but a greater proportion of patients in the SVd group discontinued due to withdrawal from the patient and AEs and/or toxicity. At the time of the primary analysis, more patients in the SVd group than in the Vd group were followed up for survival (33.3% versus 25.0%, respectively). Similar proportions of patients in both treatment groups had discontinued from the BOSTON trial (47.7% versus 50.5% in the SVd and Vd groups, respectively); the primary reasons for withdrawal were death (24.1% versus 29.9%) and withdrawal by the patient (19.0% versus 17.2%).
Table 12: Patient Disposition of All Patients
Disposition | Primary analysis (February 18, 2020) | Updated analysis (February 15, 2021) | |||
|---|---|---|---|---|---|
SVd group | Vd group | SVd group | Vd group | ||
Screened, N | 457 | ||||
Randomized, N (%) | 195 | 207 | 195 | 207 | |
Received allocated treatment, n (%) | 195 (100) | 204 (100) | 195 (100) | 204 (100) | |
Did not receive allocated treatment, n (%) | 0 | 3 | NA | NA | |
Withdrawal of consent | 0 | 1 | NA | NA | |
Death | 0 | 1 | NA | NA | |
AEs | 0 | 1 | NA | NA | |
End-of-treatment disposition, n (%) | |||||
On treatment | 37 (19.0) | 36 (17.6) | 21 (10.8) | 16 (7.8) | |
Discontinued from study, N (%) | 158 (81.0) | 168 (82.4) | 174 (89.2) | 188 (92.2) | |
Reason for discontinuation, N (%) | |||||
Disease progression | 67 (34.4) | 107 (52.5) | 76 (39.0) | 118 (57.8) | |
Withdrawal by patient | 37 (19.0) | 18 (8.8) | 37 (19.0) | 21 (10.3) | |
Adverse events or toxicity to study drug | 33 (16.9) | 23 (11.3) | 33 (16.9) | 26 (12.7) | |
Death | 12 (6.2) | 12 (5.9) | 14 (7.2) | 14 (6.9) | |
Lost to follow-up | 2 (1.0) | 2 (1.0) | 3 (1.5) | 2 (1.0) | |
Non-compliance with study drug or protocol deviation | 0 | 1 (0.5) | 1 (0.5) | 2 (1.0) | |
Physician decision | 7 (3.6) | 5 (2.5) | 10 (5.1) | 5 (2.5) | |
Patients in survival follow-upa | 65 (33.3) | 51 (25.0) | 52 (26.7) | 58 (28.4) | |
Patients who have completed 5-year survival follow-upb | 0 | 0 | 0 | 0 | |
Patients who died during survival follow-up | 35 (17.9) | 41 (20.1) | 54 (27.7) | 55 (27.0) | |
Patients who discontinued from the study without completing 5-year survival follow-up | 9 (4.6) | 13 (6.4) | 13 (6.7) | 16 (7.8) | |
End-of-study disposition | |||||
On study | 102 (52.3) | 101 (49.5) | 73 (37.4) | 78 (38.2) | |
Discontinued from study, N (%) | 93 (47.7) | 103 (50.5) | 122 (62.6) | 126 (61.8) | |
Reason for discontinuation, N (%) | |||||
Withdrawal by patient | 37 (19.0) | 35 (17.2) | 39 (20.0) | 39 (19.1) | |
Death | 47 (24.1) | 61 (29.9) | 68 (34.9) | 79 (38.7) | |
Lost to follow-up | 7 (3.6) | 6 (2.9) | 12 (6.2) | 7 (3.4) | |
Physician decision | 0 | 0 | 1 (0.5) | 0 | |
Other | 2 (1.0) | 1 (0.5) | 2 (1.0) | 1 (0.5) | |
ITT, N | 195 (48.5) | 207 (51.5) | 195 (48.5) | 207 (51.5) | |
PP, N | 194 (48.3) | 202 (50.2) | 194 (48.3) | 202 (50.2) | |
Safety, N | 195 (48.5) | 204 (50.7) | 195 (48.5) | 204 (50.7) | |
SVdX populationc | NA | 63 (15.7) | NA | 63 (15.7) | |
SdX populationd | NA | 11 (2.7) | NA | 11 (2.7) | |
AE = adverse event; ITT = intention-to-treat; NA = not applicable; PP = per-protocol; SdX = selinexor plus dexamethasone after crossover; SVd = selinexor plus bortezomib plus dexamethasone; SVdX = selinexor plus bortezomib plus dexamethasone after crossover; Vd = bortezomib plus dexamethasone.
aPatients in follow-up who were willing to continue into survival follow-up, still alive, not lost to follow-up, and had not discontinued from the study.
bPatients who have been followed for 5 years after the last dose of SVd, Vd, SVdX, or SdX treatment.
cPatients in the safety population who cross over from the Vd arm to the SVdX treatment and have received at least 1 dose of selinexor.
dPatients in the safety population who cross over from the Vd arm to the SdX treatment and have received at least 1 dose of selinexor.
Source: BOSTON Clinical Study Report.4
At the time of the updated analysis, few patients from both treatment groups were still on treatment as the majority had discontinued from the trial, with 89.2% discontinuing from the SVd group and 92.2% discontinuing from the Vd group. As with the primary analysis, the primary reasons for discontinuation were disease progression (29.0% versus 57.8% for the SVd and Vd groups, respectively), withdrawal by the patient (19.0% versus 10.2%, respectively), and AEs and/or toxicity (16.9% versus 12.7%, respectively). More patients in the Vd group discontinued due to disease progression, while more patients in the SVd group discontinued due to withdrawal by the patient and AEs and/or toxicity. Similar proportions of patients were being followed for survival in the SVd (26.7%) and Vd (28.4%) groups. A total of 73 patients (27.4%) in the SVd group and 78 patients (38.2%) in the Vd group were still in the study by the updated analysis. The primary reasons for discontinuation were withdrawal by the patient (20.0% versus 19.1%, respectively) and death (34.9% versus 38.7%, respectively).
It should be noted that none of the patients enrolled in the BOSTON trial had completed the 5-year survival follow-up at either the primary or updated analysis.
A summary of the disposition of crossover patients (SVdX and SdX groups) is provided in Table 13. The disposition of crossover patients was similar to all randomized patients.
Table 13: Patient Disposition of Crossover Patients
Disposition | Primary analysis (February 18, 2020) | |
|---|---|---|
SVdX group N = 63 | SdX group N = 11 | |
Received any dose of selinexor, n (%) | 63 (100.0) | 11 (100.0) |
End-of-treatment disposition, n (%) | ||
On treatment | 11 (17.5) | 3 (27.3) |
Discontinued from study, N (%) | 52 (82.5) | 8 (72.7) |
Reason for discontinuation, N (%) | ||
Disease progression | 29 (46.0) | 4 (36.4) |
Withdrawal by patient | 6 (9.5) | 3 (27.3) |
Adverse events or toxicity to study drug | 10 (15.9) | 0 |
Death | 7 (11.1) | 1 (9.1) |
Patients in survival follow-upa | 20 (31.7) | 2 (18.2) |
Patients who have completed 5-year survival follow-upb | 0 | 0 |
Patients who die during survival follow-up | 17 (27.0) | 2 (18.2) |
Patients who discontinued from the study without completing 5-year survival follow-up | 2 (3.2) | 0 |
End-of-study disposition | ||
On study | 31 (49.2) | 5 (45.5) |
Discontinued from study, N (%) | 32 (50.8) | 6 (54.5) |
Reason for discontinuation, N (%) | 0 | 0 |
Disease progression | 8 (12.7) | 3 (27.3) |
Withdrawal by patient | 0 | 0 |
Adverse events/toxicity to study drug | 24 (38.1) | 3 (27.3) |
SdX = selinexor plus dexamethasone after crossover; SVd = selinexor plus bortezomib plus dexamethasone; SVdX = selinexor plus bortezomib plus dexamethasone after crossover; Vd = bortezomib plus dexamethasone.
aPatients in follow-up were willing to continue into survival follow-up, still alive, not lost to follow-up, and had not discontinued from the study.
bPatients who have been followed for 5 years after the last dose of SVd, Vd, SVdX, or SdX treatment.
Source: BOSTON Clinical Study Report.
Protocol Deviations
At the primary analysis (February 18, 2020), 22 major protocol deviations were reported for 21 patients due to issues involving informed consent (n = 17), eligibility criteria (n = 2), study conduct (n = 1), and investigational medicinal product (n = 1). At the updated analysis (February 15, 2021), an additional 9 major protocol deviations involving informed consent (n = 7), study drug dosing (n = 1), and investigational medicinal product (n = 1) were reported.
Protocol Amendments
Three protocol amendments were made to the original conduct of the BOSTON trial. The first protocol amendment was dated February 22, 2017. At this amendment, crossover for treatment to SdX was permitted as an option for patients in the Vd group after they experienced disease progression confirmed by an IRC if they had significant tolerability issues with bortezomib, such as a PN of greater than grade 2 or PN of 2 or higher with pain. At the third protocol amendment dated August 17, 2018, a series of changes were made to the total number of required PFS events:
at the final analysis, the number of PFS events required changed from 284 events to 267
for the interim analysis for sample size re-estimation, the number of PFS events required changed from 85 to 81
for the interim analysis for futility or superiority, the number of PFS events required changed from 213 to 201.
Exposure to Study Treatments
Dose Intensity
A summary of patients’ exposures to treatments at the primary and updated analyses are reported in Table 14. The mean duration of study treatment exposure was similar between both treatment groups at both the primary and updated analyses. The mean duration of study treatment exposure remained similar between both treatment groups throughout the trial. The mean duration of selinexor exposure was 39.5 weeks (SD = 29.98) at the primary analysis and 47.2 weeks (SD = 44.00) at the updated analysis, with a mean number of 36 doses (SD = 28.06) at the primary analysis and 43 doses (SD = 41.55) at the updated analysis, and an average mean dose of 79 mg per week at both time points. The mean duration of bortezomib and dexamethasone exposure was similar between both treatment groups at both the primary and updated analyses. However, the average total dose and the average number of doses of bortezomib and dexamethasone were slightly lower in the SVd group than in the Vd group at both the primary and updated analyses.
The exposure to study treatment among crossover patients (SVdX and SdX groups) is reported in Table 15. The mean duration of study treatment exposure was 17.2 weeks (SD = 12.53) in the SVdX group and 11.5 weeks (SD = 7.06) in the SdX group.
Table 14: Exposure to Treatment (Safety Population)
Exposure | Primary analysis (February 18, 2020) | Updated analysis (February 15, 2021) | ||
|---|---|---|---|---|
SVd group N = 195 | Vd group N = 204 | SVd group N = 195 | Vd group N = 204 | |
Study treatment exposure | ||||
Duration of study treatment exposure (weeks), mean (SD) | 40.0 (29.96) | 38.3 (27.90) | 47.8 (43.90) | 44.1 (39.25) |
Number of weeks of study treatment exposure n (%) | ||||
≥ 2 | 194 (99.5) | 202 (99.0) | NA | NA |
≥ 4 | 189 (96.9) | 194 (95.1) | NA | NA |
≥ 8 | 180 (92.3) | 184 (90.2) | NA | NA |
≥ 12 | 165 (84.6) | 165 (80.9) | NA | NA |
≥ 24 | 121 (62.1) | 123 (60.3) | NA | NA |
≥ 36 | 80 (41.0) | 89 (43.6) | NA | NA |
≥ 48 | 70 (35.9) | 66 (32.4) | NA | NA |
≥ 60 | NA | NA | 51 (26.2) | 50 (24.5) |
≥ 72 | NA | NA | 41 (21.0) | 41 (20.1) |
≥ 84 | NA | NA | 40 (20.5) | 31 (15.2) |
Selinexor exposure | ||||
Duration of selinexor exposure (weeks), mean (SD) | 39.5 (29.98) | NA | 47.2 (44.00) | NA |
Number of weeks of selinexor exposure, n (%) | ||||
< 2 | 2 (1.0) | NA | 2 (1.0) | NA |
2 to < 4 | 4 (2.1) | NA | 4 (2.1) | NA |
4 to < 12 | 25 (12.8) | NA | 25 (12.8) | NA |
12 to < 24 | 44 (22.6) | NA | 44 (22.6) | NA |
24 to < 48 | 53 (27.2) | NA | 53 (27.2) | NA |
≥ 48 | 67 (34.4) | NA | 67 (34.4) | NA |
Total selinexor doses received (mg), mean (SD) | 3,030.2 (2,345.01) | NA | 3,559.4 (3,328.84) | NA |
Average selinexor doses received per week (mg/week), mean (SD)a | 79.27 (18.516) | NA | 78.89 (18.822) | NA |
Number of selinexor doses received, mean (SD) | 35.6 (28.06) | NA | 42.9 (41.55) | NA |
Bortezomib exposure | ||||
Duration of bortezomib exposure (weeks), mean (SD) | 38.3 (29.27) | 37.6 (27.87) | 45.4 (42.73) | — |
Number of weeks of bortezomib exposure, n (%) | ||||
< 2 | 2 (1.0) | 2 (1.0) | 2 (1.0) | 2 (1.0) |
2 to < 4 | 4 (2.1) | 8 (3.9) | 4 (2.1) | 8 (3.9) |
4 to < 12 | 25 (12.8) | 30 (14.7) | 25 (12.8) | 30 (14.7) |
12 to < 24 | 47 (24.1) | 44 (21.6) | 47 (24.1) | 44 (21.6) |
24 to < 48 | 55 (28.2) | 55 (27.0) | 55 (28.2) | 55 (27.0) |
≥ 48 | 62 (31.8) | 65 (31.9) | 62 (31.8) | 65 (31.9) |
Total bortezomib doses received (mg), mean (SD) | 62.9 (50.11) | 82.4 (54.15) | 72.0 (68.47) | 90.3 (69.08) |
Average bortezomib doses received per week (mg), mean (SD)a | 1.72 (0.470) | 2.52 (0.758) | 1.70 (0.478) | 2.49 (0.782) |
Total bortezomib dose received (mg/m2), mean (SD) | 33.68 (25.940) | 45.07 (29.125) | 38.45 (35.319) | 49.38 (37.674) |
Average bortezomib doses received per week (mg/m2), mean (SD)a | 0.93 (0.219) | 1.38 (0.388) | 0.92 (0.225) | 1.37 (0.402) |
Number of bortezomib doses received, mean (SD) | 27.9 (21.61) | 36.0 (23.32) | 32.4 (30.14) | 39.7 (30.33) |
Dexamethasone exposure | ||||
Duration of dexamethasone exposure (weeks), mean (SD) | 39.8 (29.97) | 37.5 (27.55) | 47.5 (43.84) | 43.1 (38.52) |
Number of weeks of dexamethasone exposure, n (%) | ||||
< 2 | 1 (0.5) | 2 (1.0) | 1 (0.5) | 2 (1.0) |
2 to < 4 | 5 (2.6) | 8 (3.9) | 5 (2.6) | 8 (3.9) |
4 to < 12 | 26 (13.3) | 30 (14.7) | 26 (13.3) | 30 (14.7) |
12 to < 24 | 42 (21.5) | 42 (20.6) | 42 (21.5) | 42 (20.6) |
24 to < 48 | 51 (26.2) | 58 (28.4) | 51 (26.2) | 58 (28.4) |
≥ 48 | 70 (35.9) | 64 (31.4) | 70 (35.9) | 64 (31.4) |
Total dexamethasone doses received (mg), mean (SD) | 1,310.7 (980.68) | 1,465.9 (1,034.77) | 1,520.4 (1,375.80) | 1,616.6 (1,341.24) |
Average dexamethasone doses received per week (mg), mean (SD)a | 33.80 (6.707) | 43.78 (12.722) | 33.59 (6.958) | 43.41 (13.063) |
Number of dexamethasone doses received, mean (SD) | 71.2 (54.52) | 78.4 (53.59) | 84.3 (78.13) | 87.4 (71.26) |
NA = not applicable; SD = standard deviation; SVd = selinexor plus bortezomib and dexamethasone; Vd = bortezomib plus dexamethasone.
Note: For patients who cross over from the Vd Arm to the SVdX or SdX treatment, dosage information after the crossover is not included. Study treatment was selinexor with bortezomib and dexamethasone for the SVd arm. Study treatment was bortezomib with dexamethasone for the Vd arm.
aAverage dose received per week is defined as total dose received divided by duration of exposure.
Source: BOSTON Clinical Study Report.4
Table 15: Exposure to Treatment for Crossover Patients (Safety Population; Primary Analysis)
Exposure | SVdX group N = 63 | SdX group N = 11 |
|---|---|---|
Study treatment exposure | ||
Duration of study treatment exposure (weeks), mean (SD) | 17.2 (12.53) | 11.5 (7.06) |
Selinexor exposure | ||
Duration of selinexor exposure in weeks, mean (SD) | 17.0 (12.60) | 10.9 (7.26) |
Total selinexor dose in mg received, mean (SD) | 1,411.1 (1,037.00) | 996.4 (712.00) |
Average selinexor dose received per week (mg), mean (SD)a | 86.89 (19.970) | 90.71 (16.039) |
Number of selinexor doses received, mean (SD) | 16.2 (12.88) | 11.1 (9.19) |
Bortezomib exposure | ||
Duration of bortezomib exposure (weeks), mean (SD) | 16.5 (12.48) | NA |
Total bortezomib dose in mg received, mean (SD) | 27.0 (19.54) | NA |
Average bortezomib dose received per week (mg), mean (SD)a | 1.80 (0.492) | NA |
Total bortezomib dose received (mg/m2), mean (SD) | 14.62 (10.744) | NA |
Average bortezomib dose received per week (mg/m2), mean (SD)a | 0.97 (0.239) | NA |
Number of bortezomib doses received, mean (SD) | 12.6 (9.04) | NA |
Dexamethasone exposure | ||
Duration of dexamethasone exposure (weeks), mean (SD) | 17.5 (12.46) | 11.5 (7.06) |
Total dexamethasone dose received (mg), mean (SD) | 595.5 (444.82) | 393.5 (246.57) |
Average dexamethasone dose received per week (mg), mean (SD)a | 33.63 (8.333) | 35.19 (5.298) |
Number of dexamethasone doses received, mean (SD) | 32.1 (22.83) | 20.9 (12.28) |
NA = not applicable; SD = standard deviation; SdX = selinexor plus dexamethasone after crossover; SVdX = selinexor plus bortezomib plus dexamethasone after crossover.
aAverage dose received per week is defined as total dose received divided by duration of exposure.
Source: BOSTON Clinical Study Report.4
Dose Modifications
In general, dose modifications, including reductions, delays, and interruptions, were required more frequently in the SVd group than in the Vd group (91.8% versus 82.4%, respectively). Dose modifications related to selinexor occurred in 89.2% of patients in the SVd group with a mean of 4.4 (SD = 3.38) dose modifications, and most patients required 3 or more (60.5%) dose modifications compared to only 1 (13.3%) or 2 (15.4%) dose modifications in the Vd group. There were no differences in dose modifications related to bortezomib in the SVd (84.1%) and Vd (80.4%) groups, with a mean of 3.5 and 3.7 dose modifications in each group, respectively. There were no differences in dose modifications related to dexamethasone in the SVd (80.5%) and Vd (76.0%) groups, with a mean of 3.4 and 3.5 dose modifications, respectively. In general, few patients missed treatment doses to any study treatment in both treatment groups.
There were more dose reductions for any study treatment in the SVd group (73.3%) compared to the Vd group (53.9%), although the mean number of dose reductions was similar between the 2 groups (2.7 versus 1.8, respectively). Patients in the SVd group also had a greater proportion of patients needing 2 or more dose reductions compared with the Vd group; 21.0% of patients in the SVd group required 2 dose reductions versus 14.2% of patients in the Vd group, and 34.9% versus 10.3% of patients required 3 or more dose reductions, respectively. A dose reduction of selinexor was reported for 64.6% of patients in the SVd group, with a mean of 1.8 (SD = 0.96) dose reductions; most patients required only 1 (27.7%) or 2 (24.1%) dose reductions, with 12.8% of patients reporting 3 or more reductions. There were no differences in reductions of bortezomib doses in the SVd and Vd groups (43.1% versus 44.6%, respectively), with similar proportions of patients reporting the number of reductions of bortezomib doses. Fewer dose reductions for dexamethasone were reported in the SVd group (27.2%) than in the Vd group (36.3%), but the mean number of dose reductions for dexamethasone was similar between the 2 groups (1.3 versus 1.4, respectively).
Dose delays or interruptions for any study treatment were more frequent in the SVd group (88.7%) than in the Vd group (76.0%). A dose delay or interruption for selinexor was reported for 86.7% of patients, with a mean of 3.2 dose reductions or interruptions (SD = 2.81) in the SVd group; most patients reported 2 (26.2%) or 3 or more (42.1%) dose delays or interruptions, with 18.5% reporting only 1 dose delay or interruption. A greater proportion of patients required a dose delay or interruption for bortezomib in the SVd group (81.5%) than in the Vd group (72.5%), although the mean number of dose delays or interruptions was similar between the 2 treatment groups (2.9 in the SVd group versus 3.2 in the Vd group). Dose delays or interruptions for dexamethasone were similar between the SVd and Vd groups (79.5% versus 72.5%, respectively) with a mean number of 3.0 dose delays or interruptions in both treatment groups.
More patients in the SVd group required dose escalation for any study treatment than in the Vd group (24.6% versus 7.4%, respectively); this was expected, as a total of 45 patients (23.1%) in the SVd group underwent a dose escalation with selinexor.19 There were no differences between the SVd and Vd groups in the proportion of patients requiring an escalation in doses of bortezomib (5.1% versus 2.9%, respectively) or dexamethasone (3.1% versus 4.4%).
Table 16: Dose Modifications (Safety Population)
Dose modification | SVd group N = 195 | Vd group N = 204 |
|---|---|---|
Any study treatment dose modification | ||
Patients with a dose reduction of any study treatment, n (%) | 143 (73.3) | 110 (53.9) |
Days to the first dose reduction, mean (SD) | 86.0 (80.02) | 92.5 (74.43) |
Number of dose reductions, mean (SD) | 2.7 (1.56) | 1.8 (1.19) |
Number of dose reductions, n (%) | ||
1 | 34 (17.4) | 60 (29.4) |
2 | 41 (21.0) | 29 (14.2) |
≥ 3 | 68 (34.9) | 21 (10.3) |
Patients with a dose delay or interruption of any study treatment, n (%) | 173 (88.7) | 155 (76.0) |
Days to the first dose delay or interruption, mean (SD) | 81.5 (84.18) | 93.0 (98.14) |
Patients with a dose modification of any study treatment, n (%)a | 179 (91.8) | 168 (82.4) |
Days to the first dose modification, mean (SD) | 68.3 (79.11) | 76.3 (84.90) |
Patients with a missed dose of any study treatment, n (%) | 54 (27.7) | 51 (25.0) |
Patients with dose escalation of any study treatment, n (%) | 48 (24.6) | 15 (7.4) |
Selinexor dose modification | ||
Patients with dose reduction of selinexor, n (%) | 126 (64.6) | NA |
Days to the first dose reduction, mean (SD) | 96.1 (96.39) | NA |
Number of dose reductions, mean (SD) | 1.8 (0.96) | NA |
Number of dose reductions, n (%) | — | NA |
1 | 54 (27.7) | NA |
2 | 47 (24.1) | NA |
≥ 3 | 25 (12.8) | NA |
Patients with a dose delay or interruption of selinexor, n (%), mean (SD) | 169 (86.7) | NA |
Days to the first dose delay or interruption, mean (SD) | 84.7 (86.70) | NA |
Number of dose delays or interruptions, mean (SD) | 3.2 (2.81) | NA |
Number of dose delays or interruptions, n (%) | ||
1 | 36 (18.5) | NA |
2 | 51 (26.2) | NA |
≥ 3 | 82 (42.1) | NA |
Patients with a dose modification of selinexor, n (%) | 174 (89.2) | NA |
Days to the first dose modification, mean (SD) | 74.9 (80.45) | NA |
Number of dose modifications, mean (SD) | 4.4 (3.38) | NA |
Number of dose modifications, n (%) | ||
1 | 26 (13.3) | NA |
2 | 30 (15.4) | NA |
≥ 3 | 118 (60.5) | NA |
Patients with a missed dose of selinexor, n (%) | 28 (14.4) | NA |
Patients with dose escalation of selinexor, n (%) | 45 (23.1) | NA |
Bortezomib dose modification | ||
Patients with dose reduction of bortezomib, n (%) | 84 (43.1) | 91 (44.6) |
Days to the first dose reduction, mean (SD) | 144.4 (107.61) | 105.0 (85.19) |
Number of dose reductions, mean (SD) | 1.5 (0.68) | 1.5 (0.87) |
Number of dose reductions, n (%) | ||
1 | 54 (27.7) | 63 (30.9) |
2 | 23 (11.8) | 19 (9.3) |
≥ 3 | 7 (3.6) | 9 (4.4) |
Patients with a dose delay or interruption of bortezomib, n (%) | 159 (81.5) | 150 (73.5) |
Days to the first dose delay or interruption, mean (SD) | 96.4 (93.88) | 92.5 (96.81) |
Number of dose delays or interruptions, mean (SD) | 2.9 (2.74) | 3.2 (3.50) |
Number of dose delays or interruptions, n (%) | ||
1 | 51 (26.2) | 52 (25.5) |
2 | 41 (21.0) | 31 (15.2) |
≥ 3 | 67 (34.4) | 67 (32.8) |
Patients with a dose modification of bortezomib, n (%) | 164 (84.1) | 164 (80.4) |
Days to the first dose modification, mean (SD) | 89.8 (92.21) | 84.9 (87.26) |
Number of dose modifications, mean (SD) | 3.5 (3.14) | 3.7 (3.60) |
Number of dose modifications, n (%) | ||
1 | 38 (19.5) | 46 (22.5) |
2 | 35 (17.9) | 33 (16.2) |
≥ 3 | 91 (46.7) | 85 (41.7) |
Patients with a missed dose of bortezomib, n (%) | 23 (11.8) | 27 (13.2) |
Patients with a dose escalation of bortezomib, n (%) | 10 (5.1) | 6 (2.9) |
Dexamethasone dose modification | ||
Patients with a dose reduction of dexamethasone, n (%) | 53 (27.2) | 74 (36.3) |
Patients with a dose reduction of dexamethasone, n (%) | 53 (27.2) | 74 (36.3) |
Days to the first dose reduction, mean (SD) | 158.9 (111.14) | 99.3 (77.74) |
Number of dose reductions, mean (SD) | 1.3 (0.59) | 1.4 (0.69) |
Number of dose reductions, n (%) | ||
1 | 38 (19.5) | 54 (26.5) |
2 | 12 (6.2) | 15 (7.4) |
≥ 3 | 3 (1.5) | 5 (2.5) |
Patients with a dose delay or interruption of dexamethasone, n (%) | 155 (79.5) | 148 (72.5) |
Days to the first dose delay or interruption, mean (SD) | 101.0 (93.70) | 97.0 (98.98) |
Number of dose delays or interruptions, mean (SD) | 3.0 (2.86) | 3.0 (3.56) |
Number of dose delays or interruptions, n (%) | ||
1 | 48 (24.6) | 61 (29.9) |
2 | 41 (21.0) | 30 (14.7) |
≥ 3 | 66 (33.8) | 57 (27.9) |
Patients with a dose modification of dexamethasone, n (%) | 157 (80.5) | 155 (76.0) |
Days to the first dose modification, mean (SD) | 96.3 (91.96) | 82.6 (91.29) |
Number of dose modifications, mean (SD) | 3.4 (3.03) | 3.5 (3.63) |
Number of dose modification, n (%) | ||
1 | 39 (20.0) | 51 (25.0) |
2 | 36 (18.5) | 32 (15.7) |
≥ 3 | 82 (42.1) | 72 (35.3) |
Patients with missed dose of dexamethasone, n (%) | 34 (17.4) | 36 (17.6) |
Patients with dose escalation of dexamethasone, n (%) | 6 (3.1) | 9 (4.4) |
NA = not applicable; SdX = selinexor plus dexamethasone after crossover; SD = standard deviation; SVd = selinexor plus bortezomib and dexamethasone; SVdX = selinexor plus bortezomib plus dexamethasone after crossover; Vd = bortezomib plus dexamethasone.
Note: For patients who cross over from the Vd Arm to the SVdX or SdX treatment, dosage information after the crossover is not included. Study treatment was selinexor with bortezomib and dexamethasone for SVd arm. Study treatment was bortezomib with dexamethasone for Vd arm. Dose modification includes dose reduction, dose delay and dose interruption.
Source: BOSTON Clinical Study Report.
Subsequent Therapy
A summary of subsequent therapies received by patients in the BOSTON trial is reported in Table 17. |||||||||||||||||||||||||||||||||||||||||||||||||||||||||||||||||||||||||||||||||||||||||||||||||||||||||||||||||||||||||||||||||||||||||||||||||||||||||||||||||||||||||||||||||||||||||||||||||||||||||||||||||||||||||||||||||||||||||||||||||||||||||||||||||||||||||||||||||||||||||||||||||||||||||||||||||||||||||||||||||||||||||||||||||||||||||||||||||||||||||||||||||||||||||||||||||||||||||||||||||||||||||||||||||||||||||||||||||||||||||||||||||||||||||||||||||||||||||||||||||||.
Table 17: Subsequent Therapies (Primary Analysis)
Therapy | SVd group N = 69 | Vd group N = 116 |
|---|---|---|
Crossover treatment, n (%) | ||
SVdX | NA | 63 (54.3) |
SdX | NA | 11 (9.5) |
Post-SVd, Vd, SVdX, or SdX treatment, n (%) | ||
|||||||||||||||||||||||||||| | |||||||||| | |||||||||| |
||||||||||||||||||||| | |||||||||| | |||||||||| |
||||||||||||||||||||| | |||||||||| | |||||||||| |
||||||||||||||||||||| | |||||||||| | |||||||||| |
||||||||||||||||||||| | |||||||||| | |||||||||| |
||||||||||||||||||||| | |||||||||| | |||||||||| |
||||||||||||||||||||| | |||||||||| | |||||||||| |
||||||||||||||||||||| | |||||||||| | |||||||||| |
NA = not applicable; SdX = selinexor plus dexamethasone after crossover; SVd = selinexor plus bortezomib plus dexamethasone; SVdX = SVd after crossover; Vd = bortezomib plus dexamethasone.
Source: Additional information from sponsor.5
Treatment Adherence
Adherence to treatment, which was measured as a percentage of the number of doses taken by patients compared to the number of doses scheduled, was high in both treatment groups; nearly all patients (99% in both groups) received scheduled doses of treatment. The high level of adherence was maintained through to the updated analysis. Adherence to treatment was similarly high among the subgroup of patients who crossed over (the SVdX and SdX groups).
Efficacy
Only those efficacy outcomes and analyses of subgroups identified in the review protocol are reported here. Refer to Appendix 3 for detailed efficacy data.
Overall Survival
At the time of the primary analysis, results for OS were based on a median follow-up time of 17.28 months (95% CI, 16.56 to 19.27) in the SVd group and 17.51 (95% CI, 17.08 to 18.23) in the Vd group (Table 18). Similar proportions of patients experienced death in the SVd (24.1%) and Vd (30.0%) treatment groups. The median OS was NE (95% CI, NE to NE) in the SVd group and 24.97 months (95% CI, 23.49 to NE) in the Vd group. The HR of death was 0.84 (95% CI, 0.57 to 1.23; 1-sided P = 0.1852, stratified log-rank test). At this time, 75 patients (36%) from the Vd group had crossed over to the SVdX or SdX groups (Figure 3).
At the updated analysis, results were based on a median follow-up of 28.71 months (95% CI, 27.24 to 29.90) in the SVd group and 28.65 months (95% CI, 27.63 to 29.67) in the Vd group, and were consistent with the primary analysis. In the SVd group, 34.9% of patients experienced an OS event compared to 38.6% of patients in the Vd group. Median OS was 36.67 months (95% CI, 30.19 to NE) in the SVd group and 32.76 (95% CI, 27.83 to NE) in the Vd group (HR = 0.88; 95% CI, 0.63 to 1.22) (Figure 4).
Table 18: Overall Survival (Intention-to-Treat Population)
Overall survival | Primary analysis (February 18, 2020) | Updated analysis (February 15, 2021) | ||
|---|---|---|---|---|
SVd group N = 195 | Vd group N = 207 | SVd group N = 195 | Vd group N = 207 | |
Patients with events, n (%) | ||||
Death | 47 (24.1) | 62 (30.0) | 68 (34.9) | 80 (38.6) |
Patients censored, n (%) | 148 (75.9) | 145 (70.0) | 127 (65.1) | 127 (61.4) |
Study discontinuation due to | 39 (20.0) | 38 (18.4) | 42 (21.5) | 42 (20.3) |
Patient withdrawal | 37 (19.0) | 37 (17.9) | 39 (20.0) | 41 (19.8) |
Other | 2 (1.0) | 1 (0.5) | 3 (1.5) | 1 (0.5) |
Lost to follow-up | 7 (3.6) | 6 (2.9) | 12 (6.2) | 7 (3.4) |
Database cut | 102 (52.3) | 101 (48.8) | 73 (37.4) | 78 (37.7) |
Median follow-up time, months (95% CI) | 17.28 (16.56 to 18.27) | 17.51 (17.08 to 18.23) | 28.71 (27.24 to 29.90) | 28.65 (27.63 to 29.67) |
Median overall survival, months (95% CI) | NE (NE to NE) | 24.97 (23.49 to NE) | 36.67 (30.19 to NE) | 32.76 (27.83 to NE) |
Hazard ratio (95% CI)a b | 0.8402 (0.5738 to 1.2304) | 0.8764 (0.6313 to 1.2168) | ||
1-sided P valuea | 0.1852 | 0.2152c | ||
Supremum test for proportional hazards assumption | 0.8330 | 0.8350 | ||
CI = confidence interval; NE = not evaluable; SVd = selinexor plus bortezomib and dexamethasone; Vd = bortezomib plus dexamethasone.
Note: Overall survival is calculated from date of randomization to date of death. Patients without events were censored at the date of study discontinuation or date of last participating visit, whichever occurred first.
aStratified for prior proteosome inhibitor therapies, number of prior anti–multiple myeloma regimens and Revised International Staging System stage at screening.
bBased on a stratified Cox proportional hazard models with the Efron method of handling ties.
cP value is considered nominal as results for the updated analysis were not pre-specified or controlled for multiplicity.
Source: BOSTON Clinical Study Report.4
Figure 3: Overall Survival (Intention-to-Treat Population; Data Cut-Off: February 18, 2020)
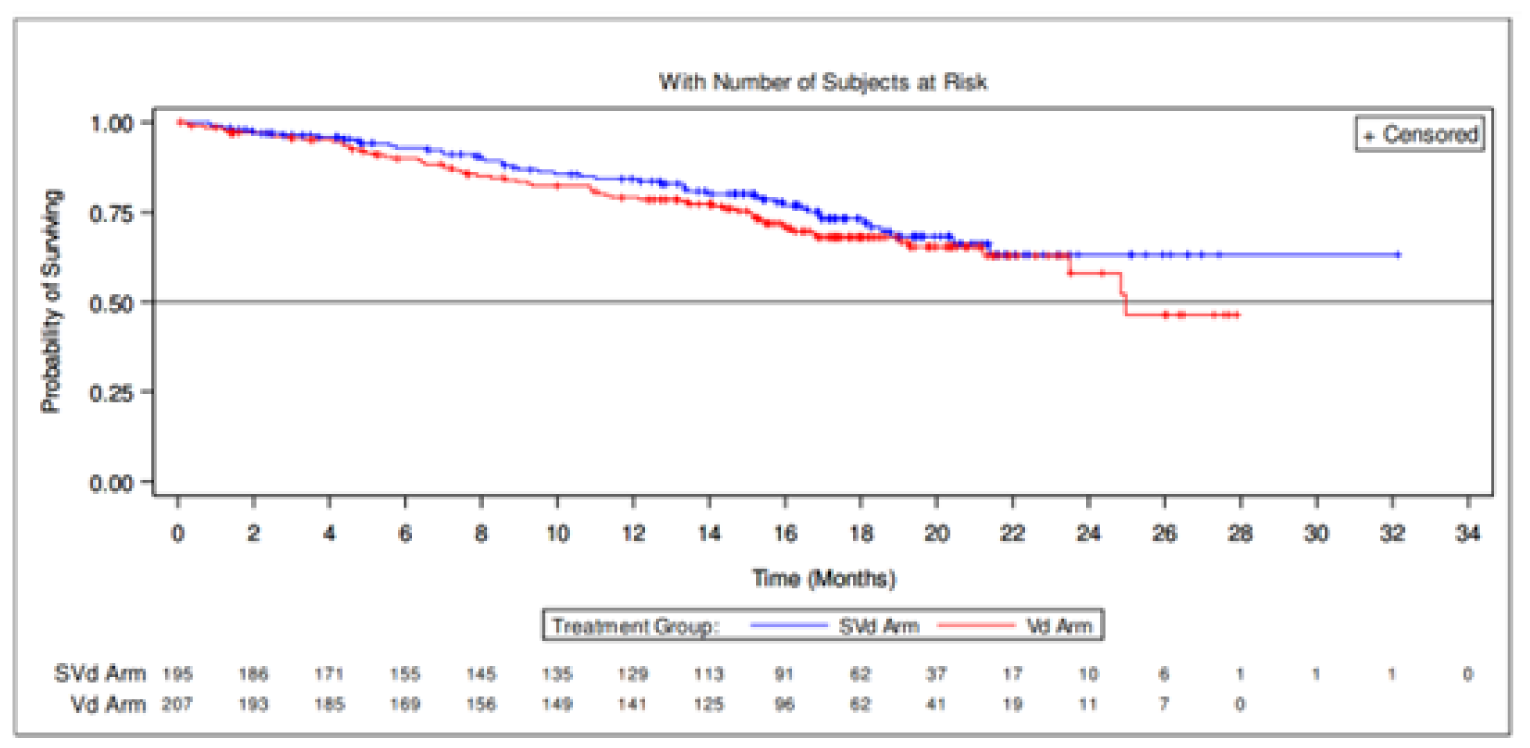
SVd = selinexor plus bortezomib and dexamethasone; Vd = bortezomib plus dexamethasone.
Source: BOSTON Clinical Study Report.4
Figure 4: Overall Survival (Intention-to-Treat Population; Data Cut-Off: February 15, 2021)
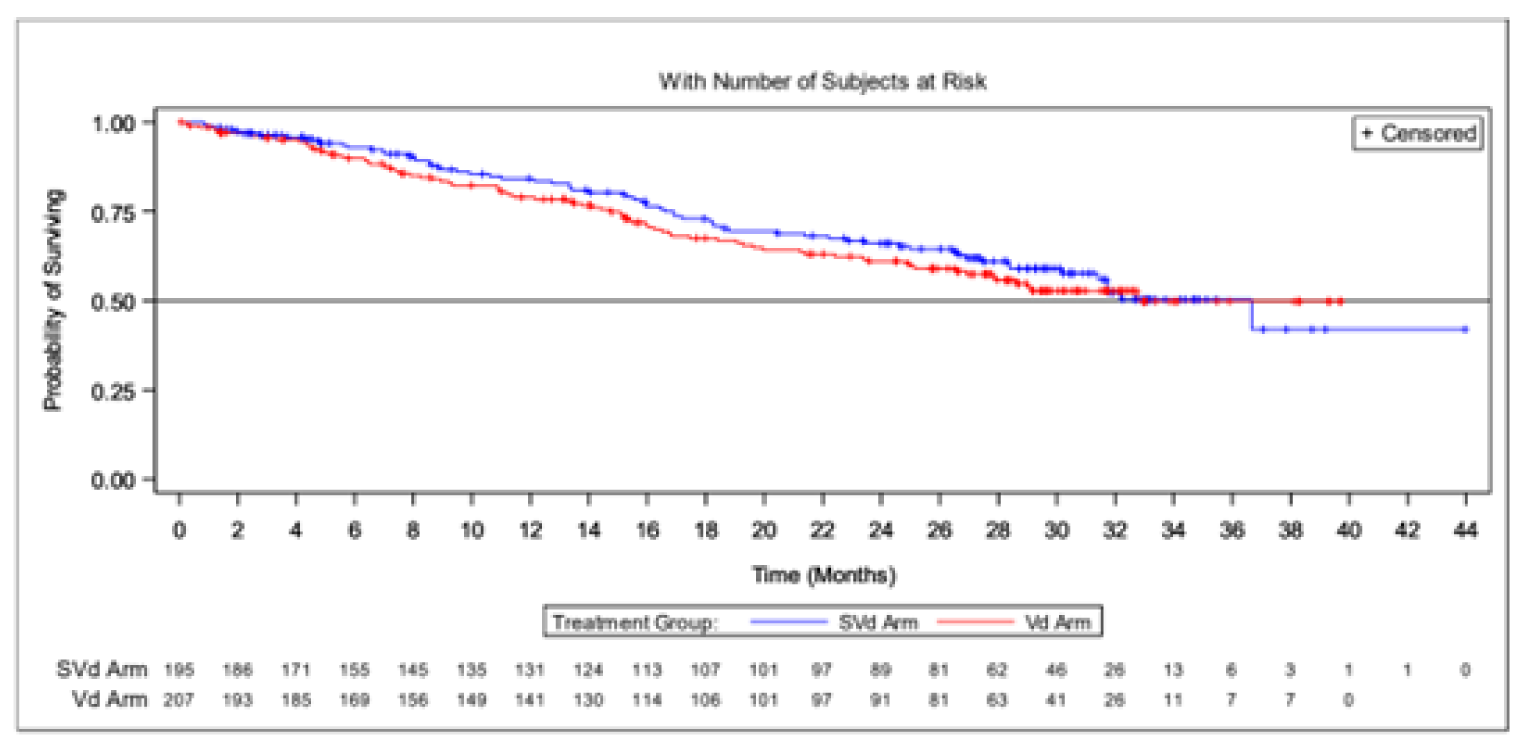
SVd = selinexor plus bortezomib and dexamethasone; Vd = bortezomib plus dexamethasone.
Source: BOSTON Clinical Study Report.4
Subgroup Analysis
Forest plots of all subgroup analyses are depicted in Figure 37. Results of subgroup analyses highlighted in the CADTH protocol are listed in Table 19. Subgroup analysis did not indicate any differences between the SVd and Vd in terms of OS.
Table 19: Subgroup Analysis of Overall Survival
Subgroup | Hazard ratio (95% CI)a,b |
|---|---|
Patients with prior PI therapies | 0.8541 (0.5635 to 1.2946) |
Patients without prior PI therapies | 0.6313 (0.2482 to 1.6055) |
Patients with exactly 1 prior line of anti-MM therapy | 0.7650 (0.4394 to 1.3321) |
Patients with > 1 prior line of anti-MM therapy | 0.8599 (0.5112 to 1.4464) |
Patients with exactly 2 prior lines of anti-MM therapy | 0.6277 (0.3097 to 1.2724) |
Patients with exactly 3 prior lines of anti-MM therapy | 1.4362 (0.6629 to 3.1115) |
Patients with stem cell transplant | 0.7131 (0.3706 to 1.3724) |
Patients without stem cell transplant | 0.8985 (0.5633 to 1.4333) |
Patients with del[17p] | 0.5590 (0.1635 to 1.9117) |
Patients with t[4;14] | 0.7619 (0.2537 to 2.2887) |
Patients with t[14;16] | 1.9760 (0.5291 to 7.3794) |
Patients with del[17p] or t[4;14] or t[14;16] | 0.8700 (0.4339 to 1.7447) |
Patients with 1q21 | 0.7616 (0.4208 to 1.3783) |
Patients with del[17p] or t[4;14] or t[14;16] or 1q21 | 0.7356 (0.4435 to 1.2201) |
Patients with previous bortezomib exposure | 0.8173 (0.5321 to 1.2553) |
Patients with previous carfilzomib exposure | 3.3510 (0.8632 to 13.0094) |
Patients with previous ixazomib exposure | 0.0000 (0.0000 to NE) |
Patients with previous daratumumab exposure | 0.3549 (0.0852 to 1.4789) |
Patients with previous lenalidomide exposure | 0.8318 (0.4820 to 1.4353) |
Patients with previous lenalidomide exposure | 2.1669 (0.5543 to 8.4711) |
CI = confidence interval; MM = multiple myeloma; NE = not estimable; PI = proteasome inhibitor.
aBased on an unstratified model.
bBased on a Cox proportional hazards model with the Efron method of handling ties.
Source: BOSTON Clinical Study Report.4
Progression-Free Survival per IRC Assessment
The median follow-up times were 13.17 months (95% CI, 10.64 to 15.34) for the SVd group and 16.53 months (95% CI, 14.39 to 17.71) for the Vd group (Table 20). At the primary analysis, a higher proportion of patients in the Vd group experienced a PFS event than did patients in the SVd group (59.9% versus 41.0%, respectively). The median PFS was longer in the SVd group (13.93 months; 95% CI, 11.73 to NE) compared to 9.46 months (95% CI, 8.11 to 10.78) in the Vd group. An HR of 0.70 (95% CI, 0.53 to 0.93) was reported for PFS, indicating an increase in PFS of 4.47 months and a 30% reduction in risk of disease progression or death in the SVd group compared to the Vd group (1-sided P = 0.0075, stratified log-rank test; Figure 5).
At the time of the updated analysis, the median follow-up time was 13.47 months (95% CI, 10.64 to 24.87) in the SVd group and 24.48 months (95% CI, 21.16 to 29.17) in the Vd group. The results at the updated analysis were consistent with those of the primary analysis. There was a higher proportion of PFS events in the Vd group compared to the SVd group (66.2% versus 47.2%, respectively) with a longer median PFS in the SVd group at 13.24 months (95% CI, 11.73 to 23.43) compared to the Vd group at 9.46 months (95% CI, 8.11 to 10.78); results indicated an increase of 3.78 months and a 29% reduction in risk of disease progression or death in the SVd group (HR = 0.71; 95% CI, 0.54 to 0.93; Figure 6).
A high proportion of patients were censored for these analyses of PFS. More patients in the SVd group were censored compared with patients in the Vd group at both the primary (59.0% versus 40.1%, respectively) and updated (52.8% versus 33.8%) analyses.
Sensitivity Analyses
Results of the sensitivity analyses are reported Table 46. In general, the results continued to support the primary analysis, which suggested that treatment with SVd was superior to Vd for PFS.
Table 20: Progression-Free Survival Based on IRC Assessment (ITT Population)
Progression-free survival | Primary analysis (February 18, 2020) | Updated analysis (February 15, 2021) | ||
|---|---|---|---|---|
SVd group N = 195 | Vd group N = 207 | SVd group N = 195 | Vd group N = 207 | |
Patients with events | ||||
Patients with events, n (%) | 80 (41.0) | 124 (59.9) | 92 (47.2) | 137 (66.2) |
Progressive disease | 69 (35.4) | 111 (53.6) | 79 (40.5) | 122 (58.9) |
Death | 11 (5.6) | 13 (6.3) | 13 (6.7) | 15 (7.2) |
Patients censored | ||||
Patients censored, n (%) | 115 (59.0) | 83 (40.1) | 103 (52.8) | 70 (33.8) |
No adequate post-baseline response assessment | 3 (1.5) | 6 (2.9) | 3 (1.5) | 6 (2.9) |
Documented treatment discontinuation and reasons | 73 (37.4) | 41 (19.8) | 77 (39.5) | 48 (23.2) |
Disease progression according to investigator assessment | 0 | 1 (0.5) | 0 | 1 (0.5) |
Withdrawal by patient | 35 (17.9) | 16 (7.7) | 35 (17.9) | 19 (9.2) |
Adverse event | 31 (15.9) | 20 (9.7) | 31 (15.9) | 23 (11.1) |
Physician decision | 7 (3.6) | 4 (1.9) | 10 (5.1) | 4 (1.9) |
Other | 0 | 0 | 1 (0.5) | 1 (0.5) |
Lost to follow-up | 2 (1.0) | 2 (1.0) | 3 (1.5) | 2 (1.0) |
Database cut | 37 (19.0) | 34 (16.4) | 20 (10.3) | 14 (6.8) |
Median follow-up time, months (95% CI) | 13.17 (10.64 to 15.34) | 16.53 (14.39 to 17.71) | 13.47 (10.64 to 24.87) | 24.48 (21.16 to 29.17) |
Median PFS, months (95% CI) | 13.93 (11.73 to NE) | 9.46 (8.11 to 10.78) | 13.24 (11.73 to 23.43) | 9.46 (8.11 to 10.78) |
Hazard ratio (95% CI) | 0.7020 (0.5279 to 0.9335)a,b | 0.7096 (0.5417 to 0.9296) | ||
1-sided P value | 0.0075a | 0.0064 | ||
Supremum test for proportional hazards assumption | 0.6520 | 0.7020 | ||
CI = confidence interval; IRC = independent review committee; ITT = intention-to-treat; MM = multiple myeloma; NE = not evaluable; SVd = selinexor plus bortezomib plus dexamethasone; Vd = bortezomib plus dexamethasone.
aStratified for prior proteosome inhibitor therapies, number of prior of anti-MM regimens and Revised International Staging System stage at screening.
bBased on a stratified Cox proportional hazards model with the Efron method of handling ties.
Source: BOSTON Clinical Study Report.4
Figure 5: Progression-Free Survival Based on IRC Assessment (ITT Population; Data Cut-Off: February 18, 2020)
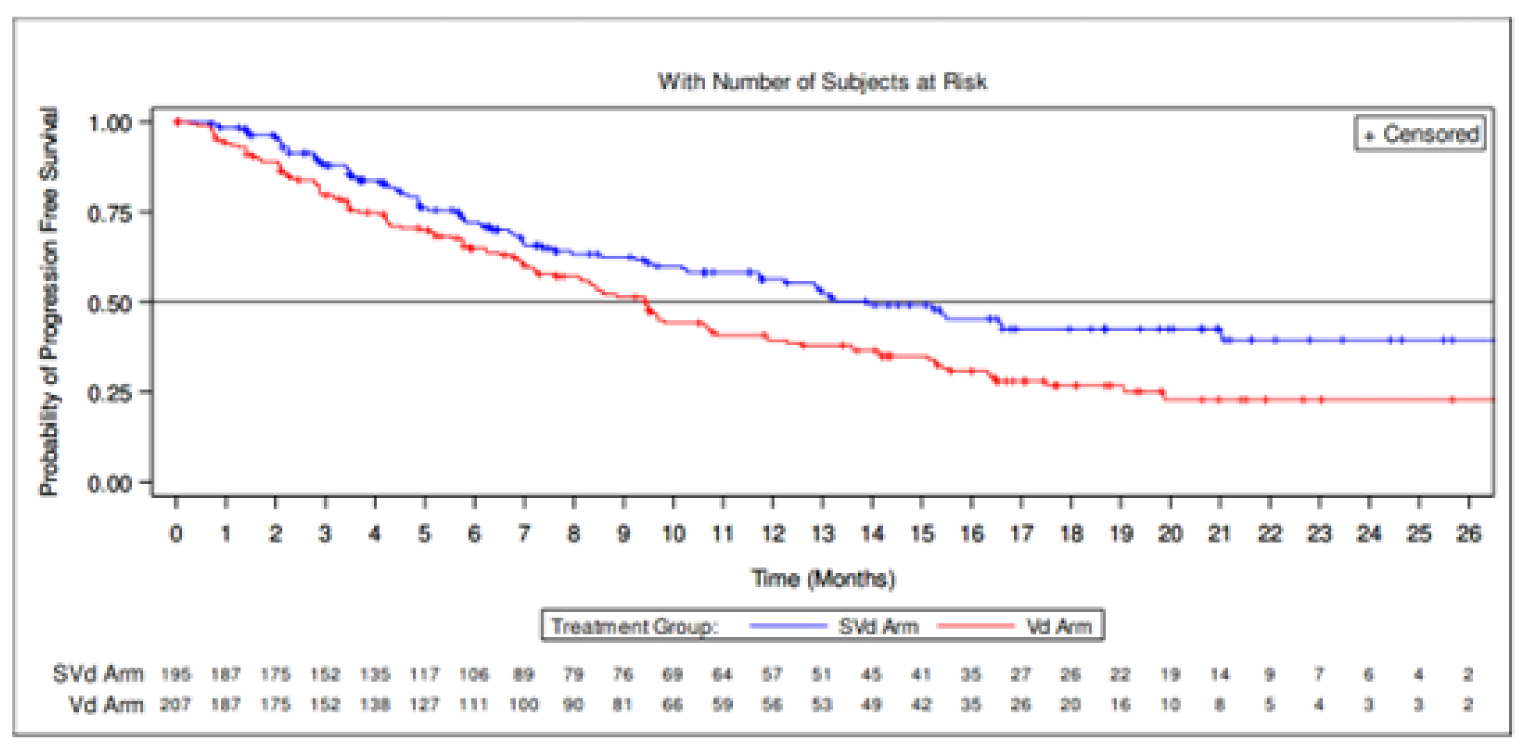
IRC = independent review committee; ITT = intention-to-treat; SVd = selinexor plus bortezomib plus dexamethasone; Vd = bortezomib plus dexamethasone.
Source: BOSTON Clinical Study Report.4
Figure 6: Progression-Free Survival Based on IRC Assessment (ITT Population; Data Cut-Off: February 15, 2021)
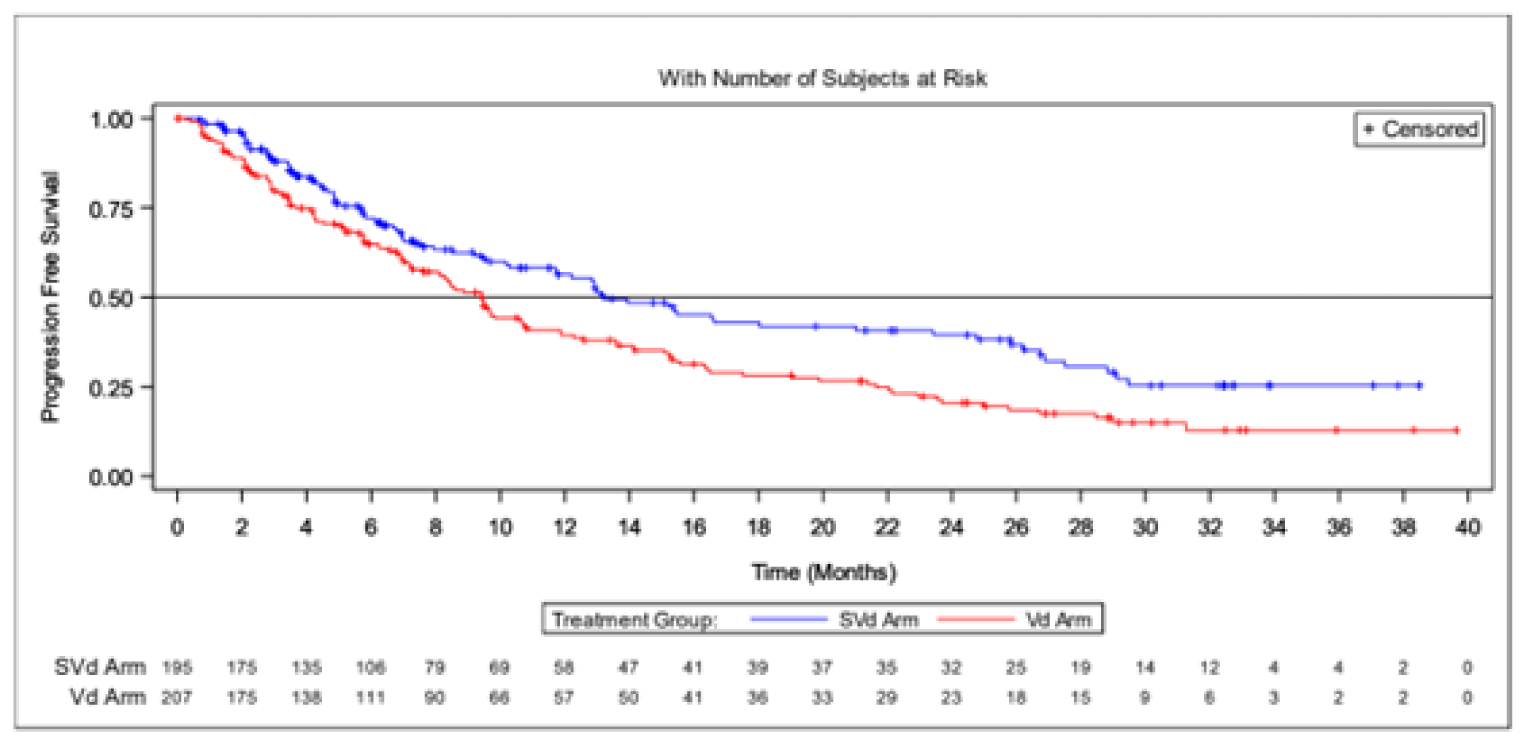
IRC = independent review committee; ITT = intention-to-treat; SVd = selinexor plus bortezomib plus dexamethasone; Vd = bortezomib plus dexamethasone.
Source: BOSTON Clinical Study Report.4
Crossover Patients
Results for PFS of patients in the Vd group who crossed over to receive SVdX are provided in Table 21. A total of 36 patients (57.1%) experienced a PFS event. Twenty-seven patients (42.9%) were censored at the time of the analysis (Figure 7).
Table 21: Progression-Free Survival Based on IRC Assessment (SVdX Population)
Progression-free survival | Primary analysis (February 18, 2020) |
|---|---|
SVdX group (N = 63) | |
Patients with events, n (%) | 36 (57.1) |
Progressive disease | 27 (42.9) |
Death | 9 (14.3) |
Patients censored, n (%) | 27 (42.9) |
No adequate post-baseline response assessment | 2 (3.2) |
Documented treatment discontinuation and reasons | 15 (23.8) |
Disease progression according to investigator assessment | 15 (23.8) |
Database cut | 10 (15.9) |
IRC = independent review committee; SVdX = selinexor plus bortezomib plus dexamethasone after crossover.
Source: BOSTON Clinical Study Report.4
Figure 7: Progression-Free Survival Based on IRC Assessment of SVdX Patients
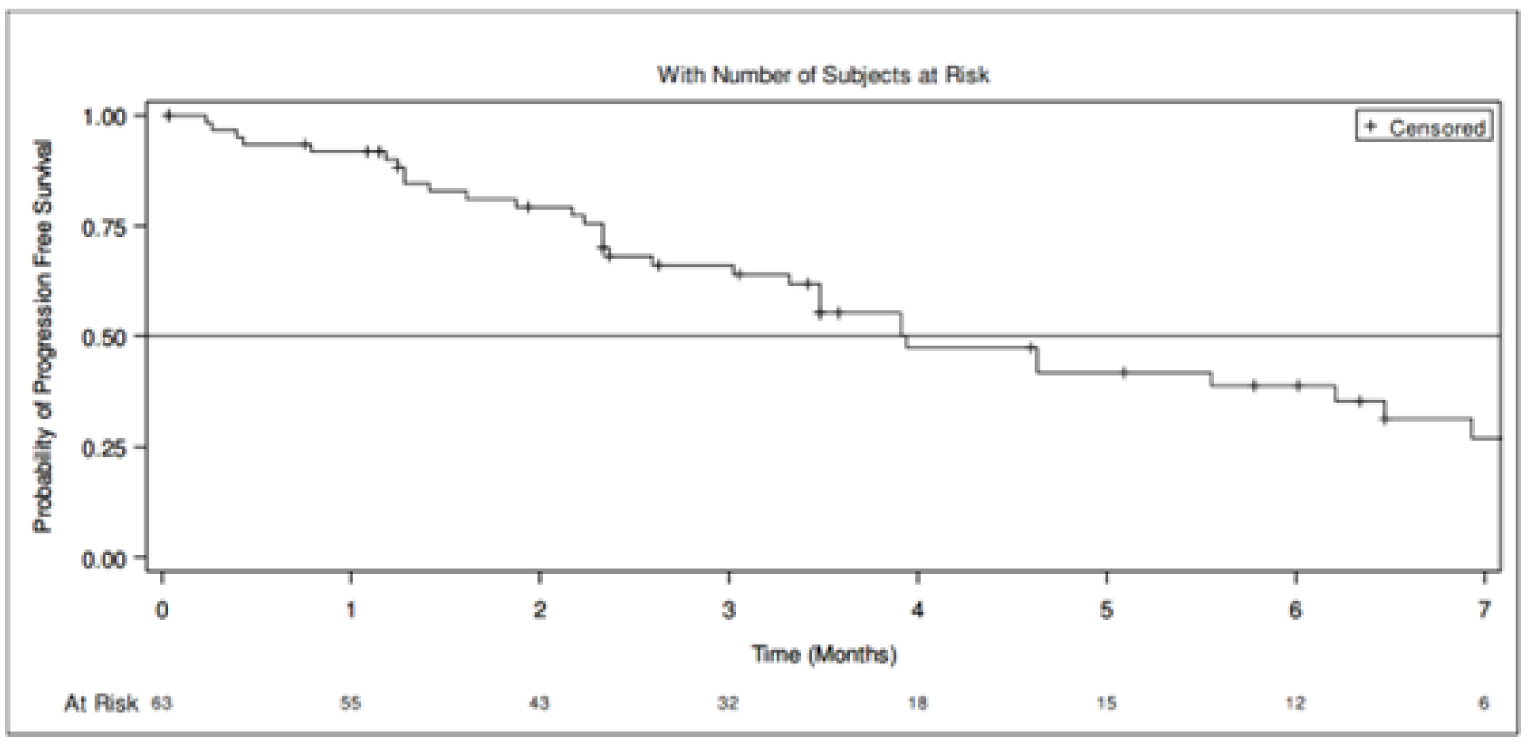
IRC = independent review committee; SVdx = selinexor plus bortezomib plus dexamethasone after crossover; Vd = bortezomib plus dexamethasone.
Note: Progression-free survival is calculated from date of first SVdX treatment after crossover from the Vd group to the date of first IRC-confirmed progressive disease, according to International Myeloma Working Group response criteria, or death due to any cause, whichever occurred first.
Source: BOSTON Clinical Study Report.4
PFS After Treatment with SVd, Vd, or SVdX
A summary of PFS results for patients who received SVd, Vd, or SVdX after receiving subsequent therapy post-progression on BOSTON study therapy is provided in Table 22. PFS events were similar between the SVd (35.4%) and Vd (32.8%) groups, but higher in the SVdX group (49.2%); this is expected, as patients in the SVdX group would have progressed on an additional line of therapy compared to patients in the SVd and Vd groups (Figure 8).
Table 22: Progression-Free Survival After Treatment With SVd, Vd, or SVdX
Progression-free survival | Primary analysis (February 18, 2020) | ||
|---|---|---|---|
SVd group N = 195 | Vd group (non-crossover) N = 207 | SVdX group N = 63 | |
Patients who received any post-SVd, Vd, or SVdX anti-MM therapy | 69 (35.4) | 42 (32.3) | 31 (49.2) |
Patients with events, n (%) | 41 (59.4) | 20 (47.6) | 14 (45.2) |
Progressive disease | 26 (37.7) | 9 (21.4) | 7 (22.6) |
Death | 15 (21.7) | 11 (26.2) | 7 (22.6) |
Patients censored, n (%) | 28 (40.6) | 22 (52.4) | 17 (54.8) |
MM = multiple myeloma; SVd = selinexor plus bortezomib plus dexamethasone; SVdX = selinexor plus bortezomib plus dexamethasone after crossover; Vd = bortezomib plus dexamethasone.
Note: Progression-free survival is calculated from the date of first dose of post-SVd, Vd, or SVdX treatment to the date of first PD on post-SVd, Vd, or SVdX treatment, or death due to any cause. Patients who do not have an event are censored at the date of last disease assessment, or the database cut-off date, whichever occurs first.
Source: BOSTON Clinical Study Report.4
Figure 8: Progression-Free Survival After Treatment With SVd, Vd, or SVdX
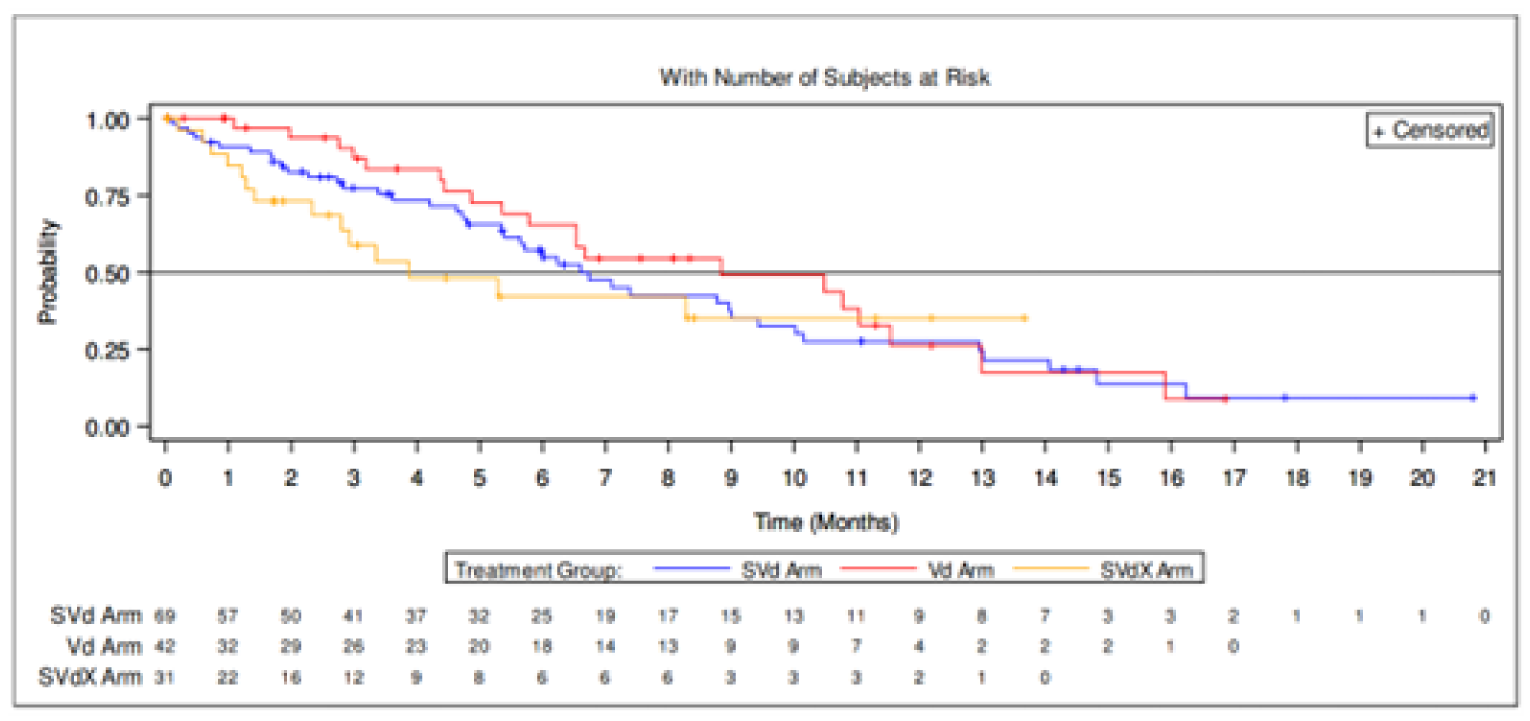
SVd = selinexor plus bortezomib plus dexamethasone; SVdX = selinexor plus bortezomib plus dexamethasone after crossover; Vd = bortezomib plus dexamethasone.
Note: Only patients who do not cross over are included in the Vd arm. Progression-free survival is calculated from the date of first dose after treatment with SVd, Vd, or SVdX to the date of first progressive disease after treatment with SVd, Vd, or SVdX, or death due to any cause. Patients who do not have an event is censored at the date of last disease assessment, or database cut-off date, whichever occurred first.
Source: BOSTON Clinical Study Report.4
Subgroup Analysis
Forest plots depicting all results for subgroup analyses are presented in Figure 35 and Figure 36. Results for subgroup analysis of subgroups highlighted in the CADTH protocol are reported in Table 23. In general, point estimates at the primary of subgroup analyses at the primary analysis appeared to favour treatment with SVd compared to Vd, although results were not statistically significant for most subgroups. Subgroup analysis demonstrated improved PFS with SVd compared with Vd among patients without previous PI therapy (HR = 0.23; 95% CI, 0.11 to 0.60), with only 1 prior line of anti-MM therapy (HR = 0.63; 95% CI, 0.41 to 0.96), with stem cell transplant (HR = 0.55; 95% CI, 0.34 to 0.90), with del[17p] (HR = 0.38; 95% CI, 0.16 to 0.86), with 1q21 (HR = 0.62; 95% CI, 0.40 to 0.96), with del[17p] or t[4;14] or t[14;16] or 1q21 (HR = 0.67; 95% CI, 0.45, 0.98), and with previous exposure to lenalidomide (HR = 0.63; 95% CI, 0.41 to 0.97). Results of subgroup analyses at the updated analysis were consistent with the primary analysis, except that differences between SVd and Vd groups in the subgroup of patients with previous exposure to lenalidomide was no longer statistically significant. Subgroup analyses were not powered to detect differences between treatment groups in the BOSTON trial at either the primary or updated analyses.
Table 23: Subgroup Analysis of Progression-Free Survival Based on IRC Assessment
Patient subgroup | Primary analysis (February 18, 2020) | Updated analysis (February 15, 2021) | ||||
|---|---|---|---|---|---|---|
SVd group N = 195 n (%) | Vd group N = 207 n (%) | HR (95% CI)a,b | SVd group N = 195 n (%) | Vd group N = 207 n (%) | HR (95% CI)a,b | |
With prior PI therapies | 73 (49.3) | 99 (62.3) | 0.7839 (0.5791 to 1.0612) | 82 (55.4) | 109 (68.6) | 0.8052 (0.6044 to 1.0728) |
Without prior PI therapies | 7 (14.9) | 25 (52.1) | 0.2585 (0.1116 to 0.5988) | 10 (21.3) | 28 (58.3) | 0.2749 (0.1323 to 0.5714) |
With exactly 1 prior line of anti-MM therapy | 36 (36.4) | 55 (55.6) | 0.6295 (0.4133 to 0.9586) | 40 (40.4) | 62 (62.6) | 0.5997 (0.4025 to 0.8934) |
With > 1 prior line of anti-MM therapy | 44 (45.8) | 69 (63.9) | 0.6949 (0.4760 to 1.0147) | 52 (54.2) | 75 (69.4) | 0.7416 (0.5204 to 1.0568) |
With exactly 2 prior lines of anti-MM therapy | 27 (41.5) | 39 (60.9) | 0.6539 (0.4000 to 1.0689) | 31 (47.7) | 42 (65.6) | 0.6783 (0.4261 to 1.0799) |
With exactly 3 prior lines of anti-MM therapy | 17 (54.8) | 30 (68.2) | 0.8171 (0.4499 to 1.4842) | 21 (67.7) | 33 (75.0) | 0.9571 (0.5507 to 1.6632) |
With stem cell transplant | 30 (39.5) | 37 (58.7) | 0.5527 (0.3411 to 0.8955) | 33 (43.4) | 39 (61.9) | 0.5645 (0.3546 to 0.8986) |
Without stem cell transplant | 50 (42.0) | 87 (60.4) | 0.7239 (0.5111 to 1.0252) | 59 (49.6) | 98 (68.1) | 0.7325 (0.5301 to 1.0121) |
With del[17p] | 11 (52.4) | 13 (81.3) | 0.3762 (0.1649 to 0.8583) | 13 (61.9) | 13 (81.3) | 0.4298 (0.1951 to 0.9467) |
With t[4;14] | 10 (45.5) | 19 (67.9) | 0.6615 (0.3068 to 1.4259) | 12 (54.5) | 21 (75.0) | 0.7179 (0.3523 to 1.4628) |
With t[14;16] | 5 (71.4) | 7 (63.6) | 1.4647 (0.4473 to 4.7962) | 5 (71.4) | 9 (81.8) | 1.4647 (0.4473 to 4.7962) |
With del[17p] or t[4;14] or t[14;16] | 24 (54.5) | 33 (68.8) | 0.7869 (0.4639 to 1.3346) | 27 (61.4) | 37 (77.1) | 0.7941 (0.4826 to 1.3069) |
With 1q21 | 34 (42.5) | 45 (63.4) | 0.6171 (0.3952 to 0.9636) | 40 (50.0) | 50 (70.4) | 0.5861 (0.3839 to 0.8946) |
With del[17p] or t[4;14] or t[14;16] or 1q21 | 45 (46.4) | 60 (63.2) | 0.6661 (0.4525 to 0.9807) | 52 (53.6) | 67 (70.5) | 0.6656 (0.4631 to 0.9569) |
With previous bortezomib exposure | 69 (51.5) | 93 (64.1) | 0.8064 (0.5903 to 1.1016) | 77 (57.5) | 103 (71.0) | 0.8169 (0.6077 to 1.0980) |
With previous carfilzomib exposure | 7 (35.0) | 11 (52.4) | 0.6186 (0.2392 to 1.5996) | 9 (45.0) | 11 (52.4) | 0.7710 (0.3185 to 1.8664) |
With previous ixazomib exposure | 2 (33.3) | 1 (33.3) | 0.5146 (0.0461 to 5.7417) | 4 (66.7) | 1 (33.3) | 1.6889 (0.1769 to 16.1266) |
With previous daratumumab exposure | 6 (54.5) | 4 (66.7) | 0.4895 (0.1303 to 1.8397) | 6 (54.5) | 4 (66.7) | 0.5794 (0.1622 to 2.0698) |
With previous lenalidomide exposure | 36 (46.8) | 52 (67.5) | 0.6348 (0.4148 to 0.9714) | 41 (53.2) | 55 (71.4) | 0.6949 (0.4635 to 1.0418) |
With previous pomalidomide exposure | 6 (54.5) | 5 (71.4) | 0.9970 (0.2988 to 3.3261) | 6 (54.5) | 5 (71.4) | 0.9970 (0.2988 to 3.3261) |
HR = hazard ratio; IRC = independent review committee; MM = multiple myeloma; SVd = selinexor plus bortezomib plus dexamethasone; Vd = bortezomib plus dexamethasone.
aBased on unstratified model.
bBased on a Cox proportional hazards model with the Efron method of handling ties.
Source: BOSTON Clinical Study Report4 and additional information.5
Duration of Response
Results for DOR are presented in Table 24. At the primary analysis, more patients in the SVd group had achieved a PR or better (76.4%) compared with the Vd group (62.3%). The median DOR was 20.27 months (95% CI, 12.55 to NE) in the SVd group compared to 12.88 months (95% CI, 9.26 to 15.77) in the Vd group (Figure 9). Results at the updated analysis were consistent with results of the primary analysis. A greater proportion of patients in the SVd group achieved a PR or better compared to the Vd group (76.9% versus 63.3%, respectively). The median DOR was 17.28 months (95% CI, 12.55 to 26.25) in the SVd group and 12.88 months (95% CI, 9.26 to 15.77; Figure 10) in the Vd group.
Table 24: Duration of Response Based on IRC Assessment
Response | Primary analysis (February 18, 2020) | Updated analysis (February 15, 2021) | ||
|---|---|---|---|---|
SVd group N = 195 | Vd group N = 207 | SVd group N = 195 | Vd group N = 207 | |
Patients who achieved a partial response or better, n (%) | 149 (76.4) | 129 (62.3) | 150 (76.9) | 131 (63.3) |
Patients with events, n (%) | 53 (35.6) | 66 (51.2) | 65 (43.3) | 79 (60.3) |
Progressive disease | 47 (31.5) | 61 (47.3) | 57 (38.0) | 72 (55.0) |
Death | 6 (4.0) | 5 (3.9) | 8 (5.3) | 7 (5.3) |
Median DOR, months (95% CI) | 20.27 (12.55 to NE) | 12.88 (9.26 to 15.77) | 17.28 (12.55 to 26.25) | 12.88 (9.26 to 15.77) |
Patients censored, n (%) | 96 (64.4) | 63 (48.8) | 85 (56.7) | 52 (39.7) |
Documented treatment discontinuation and reasons | 59 (39.6) | 30 (23.3) | 63 (42.0) | 37 (28.2) |
Disease progression according to investigator assessment | 0 | 1 (0.8) | 0 | 1 (0.8) |
Withdraw by patient | 28 (18.8) | 13 (10.1) | 28 (18.7) | 16 (12.2) |
Adverse event | 25 (16.8) | 15 (11.6) | 25 (16.7) | 18 (13.7) |
Physician decision | 6 (4.0) | 1 (0.8) | 9 (6.0) | 1 (0.8) |
Other | 0 | 0 | 1 (0.7) | 1 (0.8) |
Lost to follow-up | 1 (0.7) | 1 (0.8) | 2 (1.3) | 1 (0.8) |
Database cut | 36 (24.2) | 32 (24.8) | 20 (13.3) | 14 (10.7) |
CI = confidence interval; DOR = duration of response; IRC = independent review committee; MM = multiple myeloma; NE = not evaluable; PR = partial response; SVd = selinexor plus bortezomib plus dexamethasone; Vd = bortezomib plus dexamethasone.
Note: DOR is defined for patients with a confirmed PR or better as the duration from the date of first IRC-confirmed PR or better to the date of first IRC-confirmed progressive disease, or death due to any cause, whichever occurs first. All percentages are calculated based on patients with a PR or better.
aStratified for prior proteosome inhibitor therapies, number of prior of anti-MM regimens and Revised International Staging System stage at screening.
bBased on a stratified Cox proportional hazards model with the Efron method of handling ties.
Source: BOSTON Clinical Study Report.4
Figure 9: Duration of Response Based on IRC Assessment (ITT Population; Data Cut-Off: February 18, 2020)
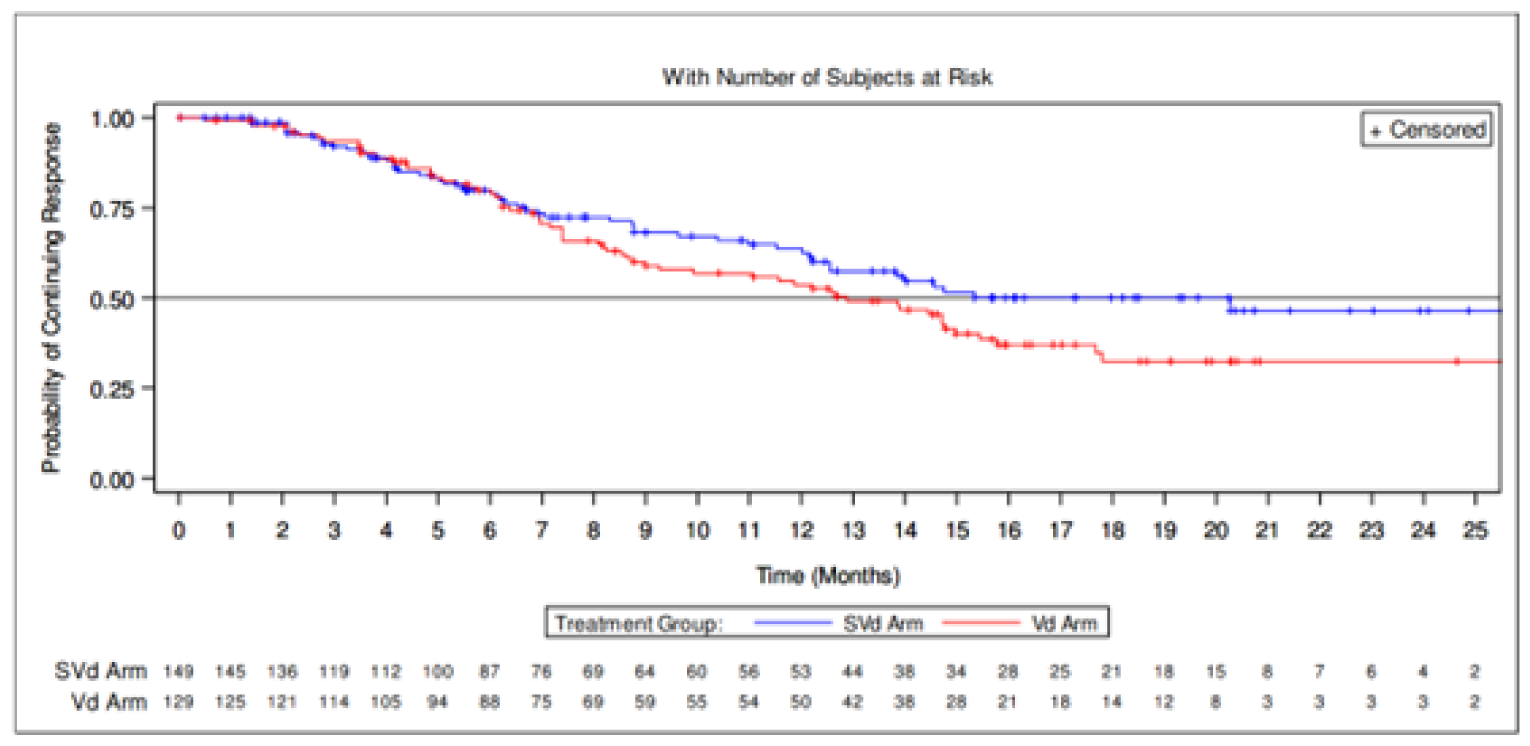
IRC = independent review committee; ITT = intention-to-treat; SVd = selinexor plus bortezomib plus dexamethasone; Vd = bortezomib plus dexamethasone.
Source: BOSTON Clinical Study Report.4
Figure 10: Duration of Response Based on IRC Assessment (ITT Population; Data Cut-Off: February 15, 2021)
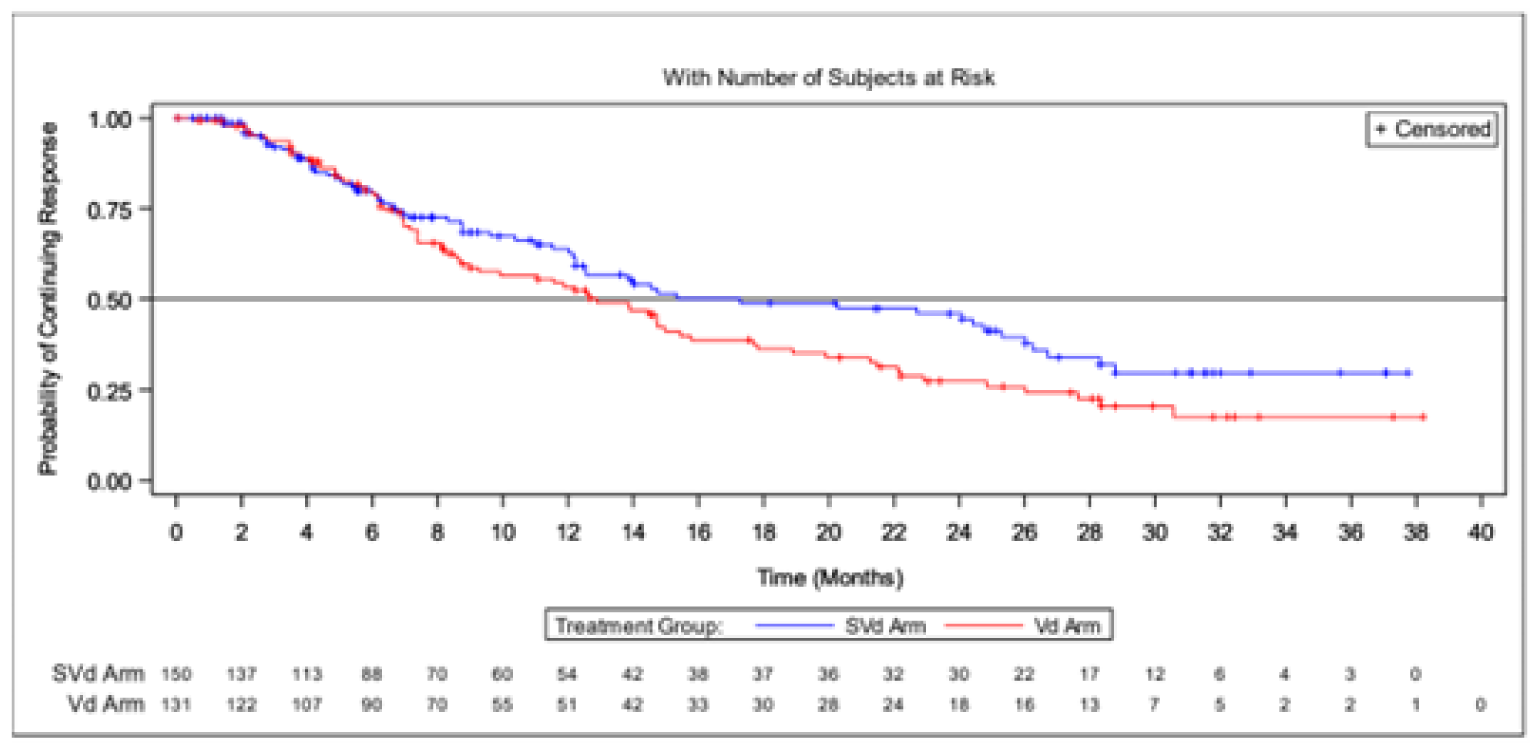
IRC = independent review committee; ITT = intention-to-treat; SVd = selinexor plus bortezomib plus dexamethasone; Vd = bortezomib plus dexamethasone.
Source: BOSTON Clinical Study Report.4
Time to Next Treatment
Results for TTNT are reported in Table 25. There were fewer patients in the SVd groups with TTNT events (45.1%) versus the Vd group (65.2%). The median TTNT was longer in the SVd group at 16.13 months (95% CI, 13.92 to NE) than in the Vd group at 10.84 months (95% CI, 9.82 to 13.40; Figure 11). There was a longer median treatment-free interval for patients with new MM treatment in the SVd group at 28.0 days (range, 1 to 447) than the Vd group at 14.0 days (range, 1 to 419).
Table 25: Time to Next Treatment (Intention-to-Treat Population)
Patient characteristics | Primary analysis (February 18, 2020) | |
|---|---|---|
SVd group N = 195 | Vd group N = 207 | |
Patients with events | ||
Patients with events, n (%) | 88 (45.1) | 135 (65.2) |
New MM treatment | 69 (35.4) | 116 (56.0) |
Death | 19 (9.7) | 19 (9.2) |
Patients censored, n (%) | 107 (54.9) | 72 (34.8) |
Median time to next treatment, months (95% CI) | 16.13 (13.93 to NE) | 10.84 (9.82 to 13.40) |
Hazard ratio (95% CI)a,b | 0.6587 (0.5017 to 0.8648) | |
1-sided P valueb | 0.0012 | |
Supremum test for proportional hazards assumption | 0.0640 | |
Treatment-free interval for patients with new MM treatment (days) | ||
N | 69 | 116 |
Median (range) | 28.0 (1 to 447) | 14.0 (1 to 419) |
CI = confidence interval; MM = multiple myeloma; SVd = selinexor plus bortezomib plus dexamethasone; Vd = bortezomib plus dexamethasone.
aBased on a stratified Cox proportional hazard models with the Efron method of handling ties.
bStratified for prior proteosome inhibitor therapies, number of prior of anti-MM regimens and Revised International Staging System stage at screening.
Source: BOSTON Clinical Study Report.4
Figure 11: Time to Next Treatment (Primary Analysis; Intention-to-Treat Population)
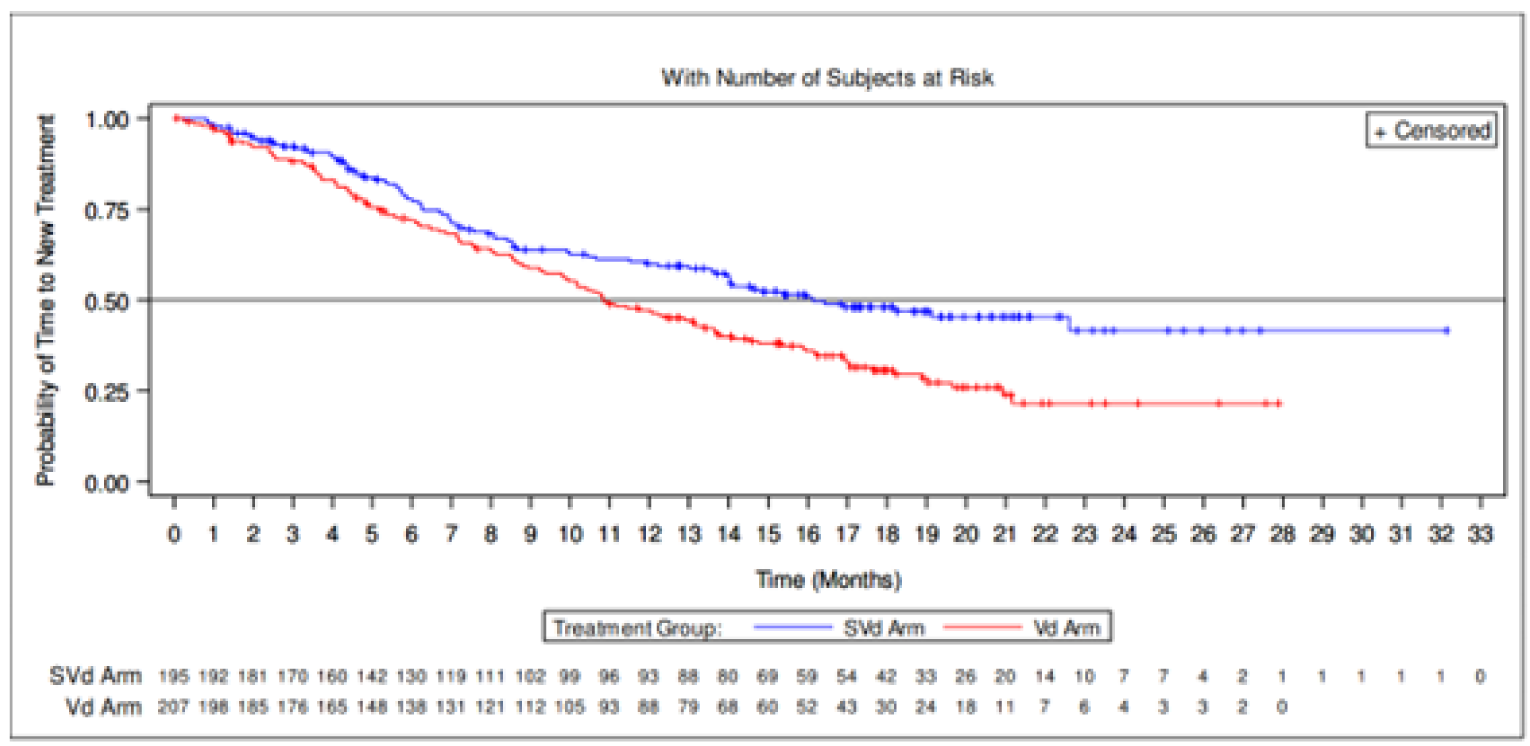
SVd = selinexor plus bortezomib plus dexamethasone; Vd = bortezomib plus dexamethasone.
Source: BOSTON Clinical Study Report.4
Time to Treatment Discontinuation
A summary of TTD is reported in Table 26. There were no differences between the SVd and Vd treatment groups in patients discontinuing treatment (81.0% versus 82.6%, respectively). The median TTDs were 7.10 months (95% CI, 6.44 to 8.54) in the SVd group and 7.95 months (95% CI, 6.80 to 9.23; Figure 12) in the Vd group.
Table 26: Time to Treatment Discontinuation (Intention-to-Treat Population)
Patient characteristics | Primary analysis (February 18, 2020) | |
|---|---|---|
SVd group N = 195 | Vd group N = 207 | |
Patients with events, n (%) | ||
Treatment discontinuation | 158 (81.0) | 171 (82.6) |
Patients censored, n (%) | 37 (19.0) | 36 (17.4) |
Median time to response, months (95% CI) | 7.10 (6.44 to 8.54) | 7.95 (6.80 to 9.23) |
Hazard ratio (95% CI)a b | 0.9894 (0.7937 to 1.2333) | |
1-sided P valueb | 0.4601 | |
CI = confidence interval; MM = multiple myeloma; SVd = selinexor plus bortezomib plus dexamethasone; Vd = bortezomib plus dexamethasone.
aStratified for prior proteosome inhibitor therapies, number of prior anti-MM regimens and Revised International Staging System stage at screening.
bBased on a stratified Cox proportional hazards model with the Efron method of handling ties.
Source: BOSTON Clinical Study Report.4
Figure 12: Time to Treatment Discontinuation
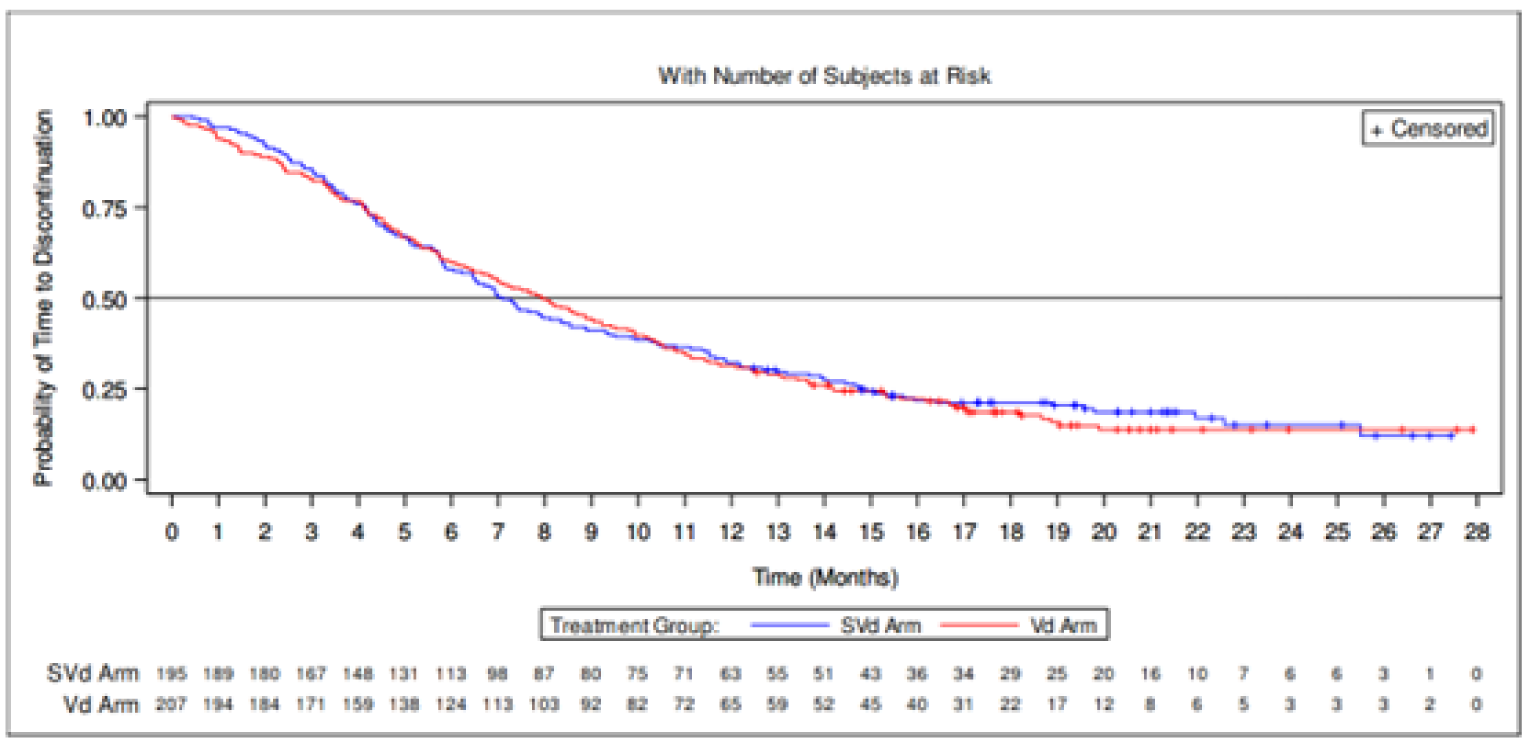
SVd = selinexor plus bortezomib plus dexamethasone; Vd = bortezomib plus dexamethasone.
Note: Time to treatment discontinuation is calculated from date of randomization to date of treatment discontinuation. Patients without events were censored at the last non-zero dose date or database cut-off, whichever occurred first. For crossover patients, only the end of treatment of the randomization phase was considered.
Source: BOSTON Clinical Study Report.4
Time to Response
Results for TTR are reported in Table 27. A greater proportion of patients in the SVd group had an IRC-confirmed response of PR or greater (76.4%) compared with the Vd group (62.3%). The median TTR was numerically shorter in the SVd group at 1.41 months (95% CI, 1.35 to 1.51) than in the Vd group at 1.61 months (95% CI, 1.51 to 2.14) (Figure 13).
Table 27: Time to Response (Intention-to-Treat Population)
Patient characteristics | Primary analysis (February 18, 2020) | |
|---|---|---|
SVd group N = 195 | Vd group N = 207 | |
Patients with an IRC-confirmed ≥ PR, n (%) | 149 (76.4) | 129 (62.3) |
Time to ≥ PR in months, median (SD) | 1.1 (0.81) | 1.4 (1.41) |
Death | 19 (9.7) | 19 (9.2) |
Patients censored, n (%) | 46 (23.6) | 78 (37.7) |
Median time to response, months (95% CI) | 1.41 (1.35 to 1.51) | 1.61 (1.51 to 2.14) |
Hazard ratio (95% CI)a b | 1.6712 (1.3064 to 2.1379) | |
1-sided P valueb | < 0.0001 | |
Supremum test for proportional hazards assumption | 0.3280 | |
CI = confidence interval; IRC = independent review committee; MM = multiple myeloma; PR = partial response; SVd = selinexor plus bortezomib and dexamethasone; Vd = bortezomib plus dexamethasone.
aBased on a stratified Cox proportional hazards model with the Efron method of handling ties.
bStratified for prior proteosome inhibitor therapies, number of prior of anti-MM regimens and Revised International Staging System stage at screening.
Source: BOSTON Clinical Study Report.4
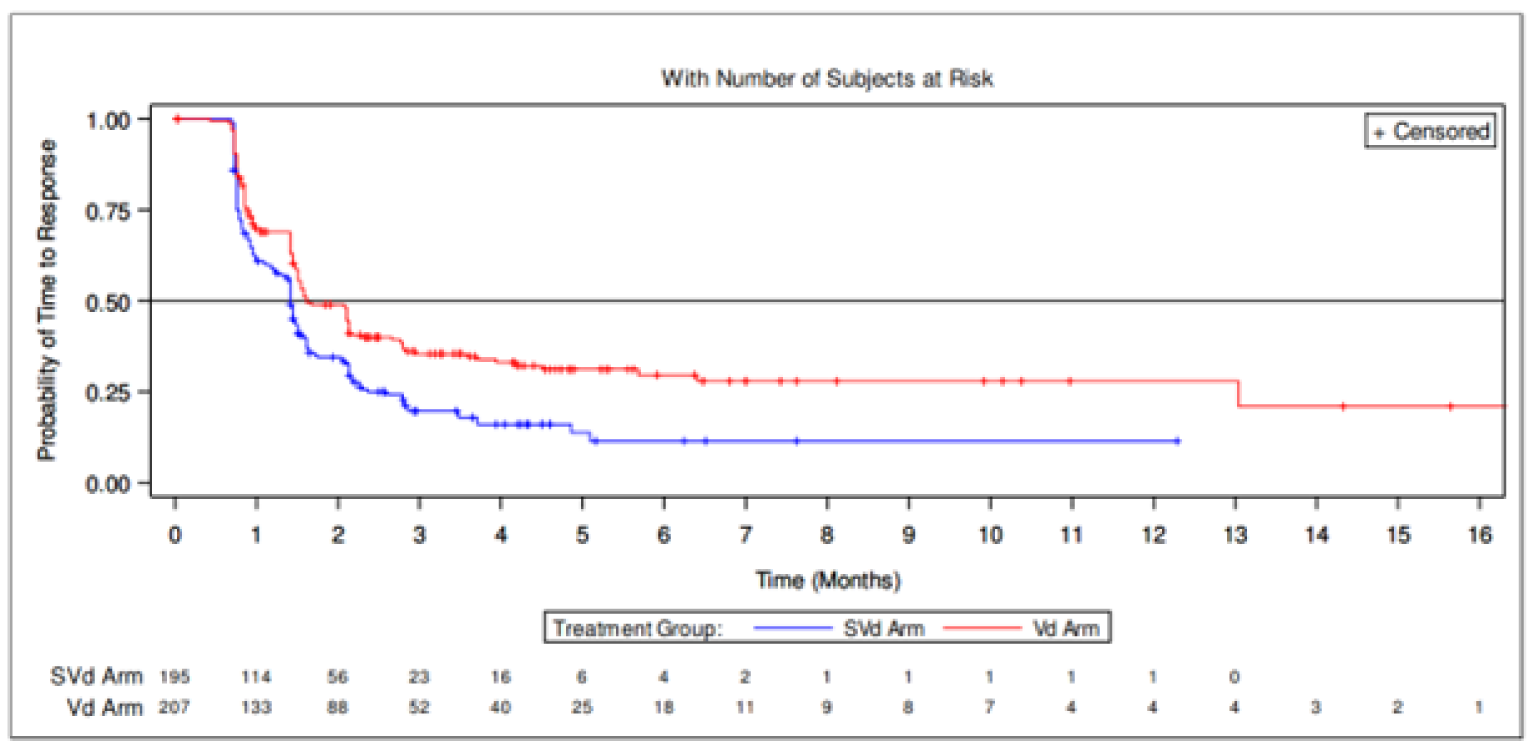
SVd = selinexor plus bortezomib and dexamethasone; Vd = bortezomib plus dexamethasone.
Source: BOSTON Clinical Study Report.4
Overall Response Rate
At the primary analysis, a total of 149 patients (76.4%; 95% CI, 69.8 to 82.2) in the SVd group had an ORR compared to 129 patients (62.3%; 95% CI, 55.3 to 68.9) in the Vd group. There were no differences in the best overall response of patients between the 2 treatment groups. Most patients achieved a PR (31.8% in the SVd group versus 30.0% in the Vd group), VGPR (27.7% versus 21.7%, respectively), or stable disease (12.8% versus 19.3%, respectively).
At the updated analysis, the ORR of the SVd group increased to 150 patients (76.9%; 95% CI, 70.4 to 92.6) versus 131 patients (63.3%; 95% CI, 56.3 to 69.9) in the Vd group. Little difference remained between treatment groups in best overall response. The results were consistent with those of the primary analysis.
A summary of results for ORR in the crossover (SVdX) group is provided in Table 28. The ORR was reported in 12 patients (19.0%; 95% CI, 10.2 to 20.9) and results for best overall response were similar to results of the total population.
Table 28: Overall Response Rate Based on IRC Assessment (Intention-to-Treat Population)
Overall response | Primary analysis (February 18, 2020) | Updated analysis (February 15, 2021) | ||
|---|---|---|---|---|
SVd group N = 195 | Vd group N = 207 | SVd group N = 195 | Vd group N = 207 | |
Overall response rate,a n (%) (exact 95% CI) | 149 (76.4) (69.8 to 82.2) | 129 (62.3) (55.3 to 68.9) | 150 (76.9) (70.4 to 82.6) | 131 (63.3) (56.3 to 69.9) |
Best overall response, n (%) | ||||
Stringent complete response | 19 (9.7) | 13 (6.3) | 19 (9.7) | 13 (6.3) |
Complete response | 14 (7.2) | 9 (4.3) | 14 (7.2) | 9 (4.3) |
Very good partial response | 54 (27.7) | 45 (21.7) | 54 (27.7) | 45 (21.7) |
Partial response | 62 (31.8) | 62 (30.0) | 63 (32.3) | 64 (30.9) |
Minimal response | 16 (8.2) | 20 (9.7) | 15 (7.7) | 18 (8.7) |
Stable disease | 25 (12.8) | 40 (19.3) | 25 (12.8) | 40 (19.3) |
Progressive disease | 1 (0.5) | 10 (4.8) | 1 (0.5) | 10 (4.8) |
Not evaluable | 4 (2.1) | 8 (3.9) | 4 (2.1) | 8 (3.9) |
CI = confidence interval; IRC = independent review committee; MM = multiple myeloma; SVd = selinexor plus bortezomib plus dexamethasone; Vd = bortezomib plus dexamethasone.
aOverall response rate is the proportion of patients who achieve a partial response or better, before IRC-confirmed progressive disease or initiating a new MM treatment or crossover.
Source: BOSTON Clinical Study Report.4
Table 29: Overall Response Rate Based on IRC Assessment (SVdX Population)
Response | SVdX group (N = 63) |
|---|---|
Overall response rate,a n (%) (exact 95% CI) | 12 (19.0) (10.2 to 30.9) |
Best overall response, n (%) | |
Stringent complete response | 0 |
Complete response | 0 |
Very good partial response | 3 (4.8) |
Partial response | 9 (14.3) |
Minimal response | 9 (14.3) |
Stable disease | 30 (47.6) |
Progressive disease | 5 (7.9) |
Not evaluable | 7 (11.1) |
CI = confidence interval; IRC = independent review committee; MM = multiple myeloma; SVdX = selinexor plus bortezomib plus dexamethasone after crossover.
aOverall response rate is the proportion of patients who achieve a partial response or better, before IRC-confirmed progressive disease or initiating a new MM treatment or crossover.
Source: BOSTON Clinical Study Report.4
Subgroup Analysis
A depiction of all subgroup analyses is provided in Figure 38. Results of subgroup analyses highlighted in the CADTH protocol are reported in Table 30. Subgroup analysis suggested an improvement with treatment with SVd over Vd in patients who had received prior PI therapies (OR = 2.26; 95% CI, 1.37 to 3.7), with only 1 prior line of anti-MM therapy (OR = 2.20; 95% CI, 1.15 to 4.21), with stem cell transplant (OR = 2.91; 95% CI, 1.35 to 6.29), with del(17p) (OR = 5.33; 95% CI, 1.28 to 22.2), with del(17p) or t(4;14) or t(14;16) (OR = 3.21; 95% CI, 1.23 to 8.37), with 1q21 (OR = 2.06; 95% CI, 1.0359 to 4.0798), with del(17p) or t(4;14) or t(14;16) or 1q21 2.7015 (OR = 2.70; 95% CI, 1.45 to 5.04), and previous bortezomib exposure (OR = 2.38; 95% CI, 1.41 to 4.02).
Table 30: Subgroup Analysis of Overall Response Rate Based on IRC Assessment
Patient subgroup | SVd group (N = 195) n (%) | Vd group (N = 207) n (%) | Overall response rate, OR (95% CI) |
|---|---|---|---|
With prior PI therapies | 114 (77.0) | 95 (59.7) | 2.2588 (1.3740 to 3.7135) |
Without prior PI therapies | 35 (74.5) | 34 (70.8) | 1.2010 (0.4863 to 2.9658) |
With exactly 1 prior line of anti-MM therapy | 80 (80.8) | 65 (65.7) | 2.2024 (1.1500 to 4.2181) |
With > 1 prior line of anti-MM therapy | 69 (71.9) | 64 (59.3) | 1.7569 (0.9763 to 3.1619) |
With exactly 2 prior lines of anti-MM therapy | 50 (76.9) | 39 (60.9) | 2.1368 (0.9944 to 4.5914) |
With exactly 3 prior lines of anti-MM therapy | 19 (61.3) | 25 (56.8) | 1.2033 (0.4714 to 3.0716) |
With stem cell transplant | 62 (81.6) | 38 (60.3) | 2.9135 (1.3506 to 6.2852) |
Without stem cell transplant | 87 (73.1) | 91 (63.2) | 1.5834 (0.9338 to 2.6851) |
With del[17p] | 16 (76.2) | 6 (37.5) | 5.3333 (1.2817 to 22.192) |
With t[4;14] | 20 (90.9) | 20 (71.4) | 4.0000 (0.7539 to 21.224) |
With t[14;16] | 6 (85.7) | 6 (54.5) | 5.0000 (0.4415 to 56.623) |
With del[17p] or t[4;14] or t[14;16] | 36 (81.8) | 28 (58.3) | 3.2143 (1.2342 to 8.3709) |
With 1q21 | 59 (73.8) | 41 (57.7) | 2.0557 (1.0359 to 4.0798) |
With del[17p] or t[4;14] or t[14;16] or 1q21 | 75 (77.3) | 53 (55.8) | 2.7015 (1.4470 to 5.0437) |
With previous bortezomib exposure | 104 (77.6) | 86 (59.3) | 2.3783 (1.4080 to 4.0171) |
With previous carfilzomib exposure | 13 (65.0) | 13 (61.9) | 1.1429 (0.3201 to 4.0809) |
With previous ixazomib exposure | 4 (66.7) | 2 (66.7) | 1.0000 (0.0529 to 18.915) |
With previous daratumumab exposure | 7 (63.6) | 3 (50.0) | 1.7500 (0.2327 to 13.159) |
With previous lenalidomide exposure | 52 (67.5) | 41 (53.2) | 1.8263 (0.9495 to 3.5130) |
With previous pomalidomide exposure | 5 (45.5) | 5 (71.4) | 0.3333 (0.0440 to 2.5235) |
CI = confidence interval; IRC = independent review committee; MM = multiple myeloma; OR = odds ratio; PI = proteasome inhibitor; SVd = selinexor plus bortezomib plus dexamethasone; Vd = bortezomib plus dexamethasone.
Source: BOSTON Clinical Study Report.4
Rate of Very Good Partial Responses or Better Responses
At the primary analysis, a VGPR, CR, or sCR was observed in 87 (44.6%) of 195 patients from the SVd group and 67 (32.4%) of 207 patients from the Vd group (OR = 1.6594; 95% CI, 1.0993, 2.5049; P = 0.0082). At the updated analysis, a VGPR, CR, or sCR was observed in 87 (44.6%) of 195 patients from the SVd group and 67 (32.4%) of 207 patients from the Vd group (OR = 1.6594; 95% CI, 1.0993 to 2.5049; P = 0.0082).
Health-Related Quality of Life
Patient-Reported Peripheral Neuropathy Measured by EORTC QLQ-CIPN20
Baseline scores for the sensory, motor, and autonomic neuropathy symptoms subscales were similar between the 2 treatment groups. A summary of post-baseline score increases for the 3 subscales is presented in Table 31. Regarding the sensory and motor subscales, a greater proportion of patients in the Vd group had higher post-baseline scores that showed increases from baseline equal to or greater than 10, 20, 30, 40, and 50 compared with the SVd group, indicating worse symptoms for patients in the Vd group. Regarding the autonomic subscale, a greater proportion of patients in the SVd group had higher post-baseline scores that showed increases from baseline equal to or greater than 10, 20, 30, 40, and 50 compared with the Vd group, indicating worse symptoms for patients in the SVd group. Linear mixed-effect models were also conducted for the EORTC QLQ-CIPN20 scores; a lower mean change from baseline was observed in the SVd group compared to the Vd group for the sensory, motor, and autonomic subscale, indicating reduced symptom burden in the SVd treatment group.
Figure 14 presents the absolute values of sensory and motor subscale scores over time. Symptom scores were numerically higher in the Vd group than in the SVd group, suggesting greater symptom burden; however, there were no statistically significant differences between the 2 treatment groups. Absolute values of PN autonomic symptom scores are presented in Figure 15. Patients in the SVd group showed higher symptom scores compared to the Vd group, indicating greater symptom burden; however, the results were not statistically significantly different. The results of the autonomic symptom score were broken down to its 3 components of blurred vision, difficulty with erection, and dizzy when standing up (Figure 16). The SVd and Vd groups showed similar scores for the dizziness and erectile-function components. The SVd group showed higher scores for blurred vision than the Vd group, indicating greater symptom burden.
Absolute values of PN autonomic symptom scores are presented in Figure 15. There were no statistically significant results between the SVd and Vd groups for any of the subscales. The results of the autonomic symptom score were broken down to its 3 components of blurred vision, difficulty with erection, and dizzy when standing up (Figure 16). The SVd and Vd groups showed similar scores for the dizziness and erectile-function components. The SVd group showed higher scores for blurred vision than the Vd group, indicating greater symptom burden.
Table 31: Change From Baseline of EORTC QLQ-CIPN20 (Primary Analysis; ITT Population)
Change from baseline | Patients with baseline and at least 1 post-baseline score | Patients with baseline and at least 2 post-baseline scores | ||
|---|---|---|---|---|
SVd group (N = 184) n (%) | Vd group (N = 189) n (%) | SVd group (N = 166) n (%) | Vd group (N = 182) n (%) | |
EORTC QLQ-CIPN20 sensory score | ||||
N (%) | 184 (94.4) | 189 (91.3) | 166 (85.1) | 182 (87.9) |
Any increase post-baseline | ||||
≥ 10 | 90 (48.9) | 115 (60.8) | 60 (36.1) | 95 (52.2) |
≥ 20 | 41 (22.3) | 66 (34.9) | 25 (15.1) | 44 (24.2) |
≥ 30 | 20 (10.9) | 41 (21.7) | 10 (6.0) | 24 (13.2) |
≥ 40 | 10 (5.4) | 32 (16.9) | 4 (2.4) | 15 (8.2) |
≥ 50 | 5 (2.7) | 15 (7.9) | 2 (1.2) | 3 (1.6) |
EORTC QLQ-CIPN20 motor score | ||||
N (%) | 184 (94.4) | 190 (91.8) | 166 (85.1) | 182 (87.9) |
Any increase post-baseline | ||||
≥ 10 | 81 (44.0) | 97 (51.1) | 54 (32.5) | 66 (36.3) |
≥ 20 | 42 (22.8) | 57 (30.0) | 26 (15.7) | 44 (24.2) |
≥ 30 | 24 (13.0) | 35 (18.4) | 8 (4.8) | 20 (11.0) |
≥ 40 | 12 (6.5) | 23 (12.1) | 2 (1.2) | 11 (6.0) |
≥ 50 | 7 (3.8) | 10 (5.3) | 1 (0.6) | 4 (2.2) |
EORTC QLQ-CIPN20 autonomic score | ||||
N (%) | 183 (93.8) | 189 (91.3) | 165 (84.6) | 181 (87.4) |
Any increase post-baseline | ||||
≥ 10 | 141 (77.0) | 138 (73.0) | 117 (70.9) | 109 (60.2) |
≥ 20 | 102 (55.7) | 94 (49.7) | 71 (43.0) | 67 (37.0) |
≥ 30 | 80 (43.7) | 73 (38.6) | 59 (35.8) | 51 (28.2) |
≥ 40 | 39 (21.3) | 34 (18.0) | 27 (16.4) | 21 (11.6) |
≥ 50 | 28 (15.3) | 24 (12.7) | 18 (10.9) | 12 (6.6) |
EORTC QLQ-CIPN20 = European Organisation for Research and Treatment of Cancer 20-item Quality of Life Questionnaire for Chemotherapy-Induced Peripheral Neuropathy; ITT = intention-to-treat; SVd = selinexor plus bortezomib plus dexamethasone; Vd = bortezomib plus dexamethasone.
Note: For patients who crossed over, QLQ-CIPN20 questionnaires collected after crossover are not included. Scale scores were calculated only if at least half of the items from the subscale were answered.
Source: BOSTON Clinical Study Report.4
Figure 14: EORTC QLQ-CIPN20 Peripheral Neuropathy Sensory and Motor Symptom
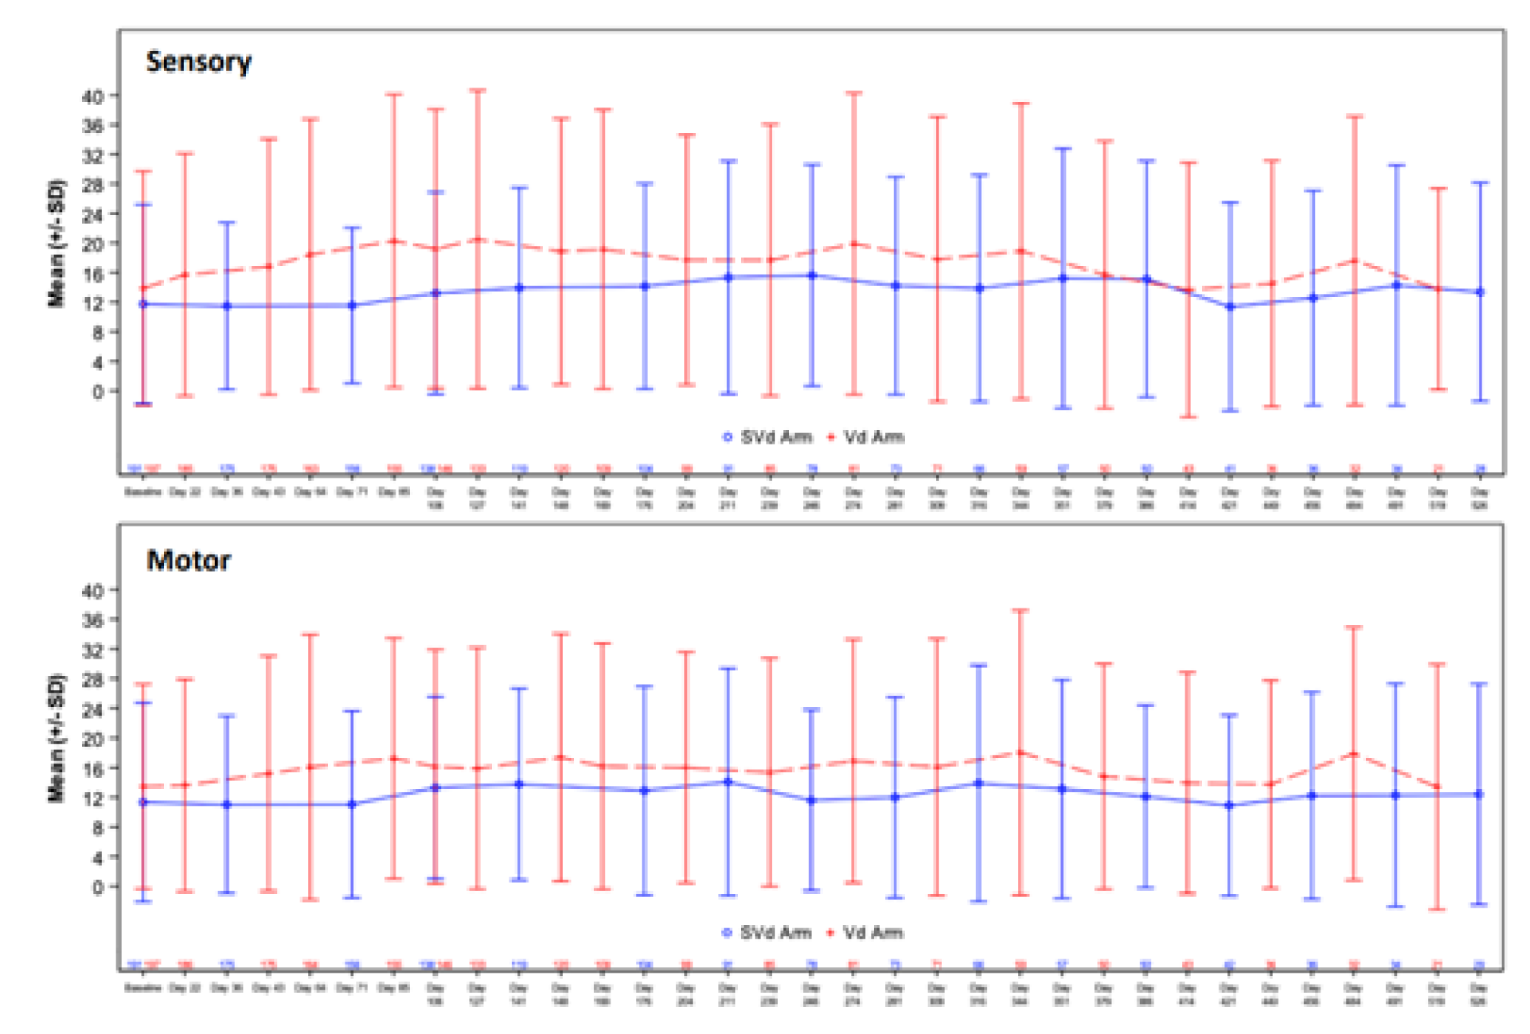
EORTC QLQ-CIPN20 = European Organisation for Research and Treatment of Cancer 20-item Quality of Life Questionnaire for Chemotherapy-Induced Peripheral Neuropathy; SD = standard deviation; SVd = selinexor plus bortezomib plus dexamethasone; Vd = bortezomib plus dexamethasone.
Source: BOSTON Clinical Study Report.4
Figure 15: EORTC QLQ-CIPN20 Peripheral Neuropathy Autonomic Symptom Scores
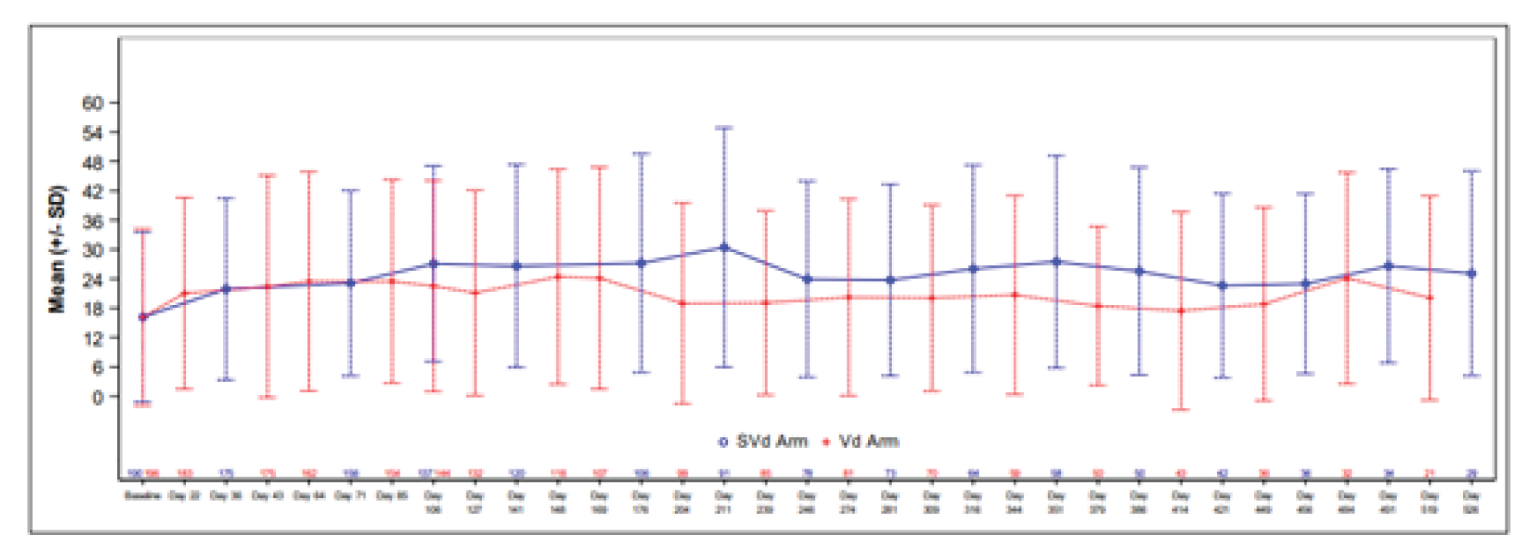
EORTC QLQ-CIPN20 = European Organisation for Research and Treatment of Cancer 20-item Quality of Life Questionnaire for Chemotherapy-Induced Peripheral Neuropathy; SD = standard deviation; SVd = selinexor plus bortezomib plus dexamethasone; Vd = bortezomib plus dexamethasone.
Note: For patients who cross over, EORTC QLQ-CIPN20 questionnaires collected after crossover are not included. Scale scores were calculated only if at least half of the items from the subscale were answered.
Source: BOSTON Clinical Study Report.4
Figure 16: EORTC QLQ-CIPN20 Peripheral Neuropathy Autonomic Symptom Scores (3 components)
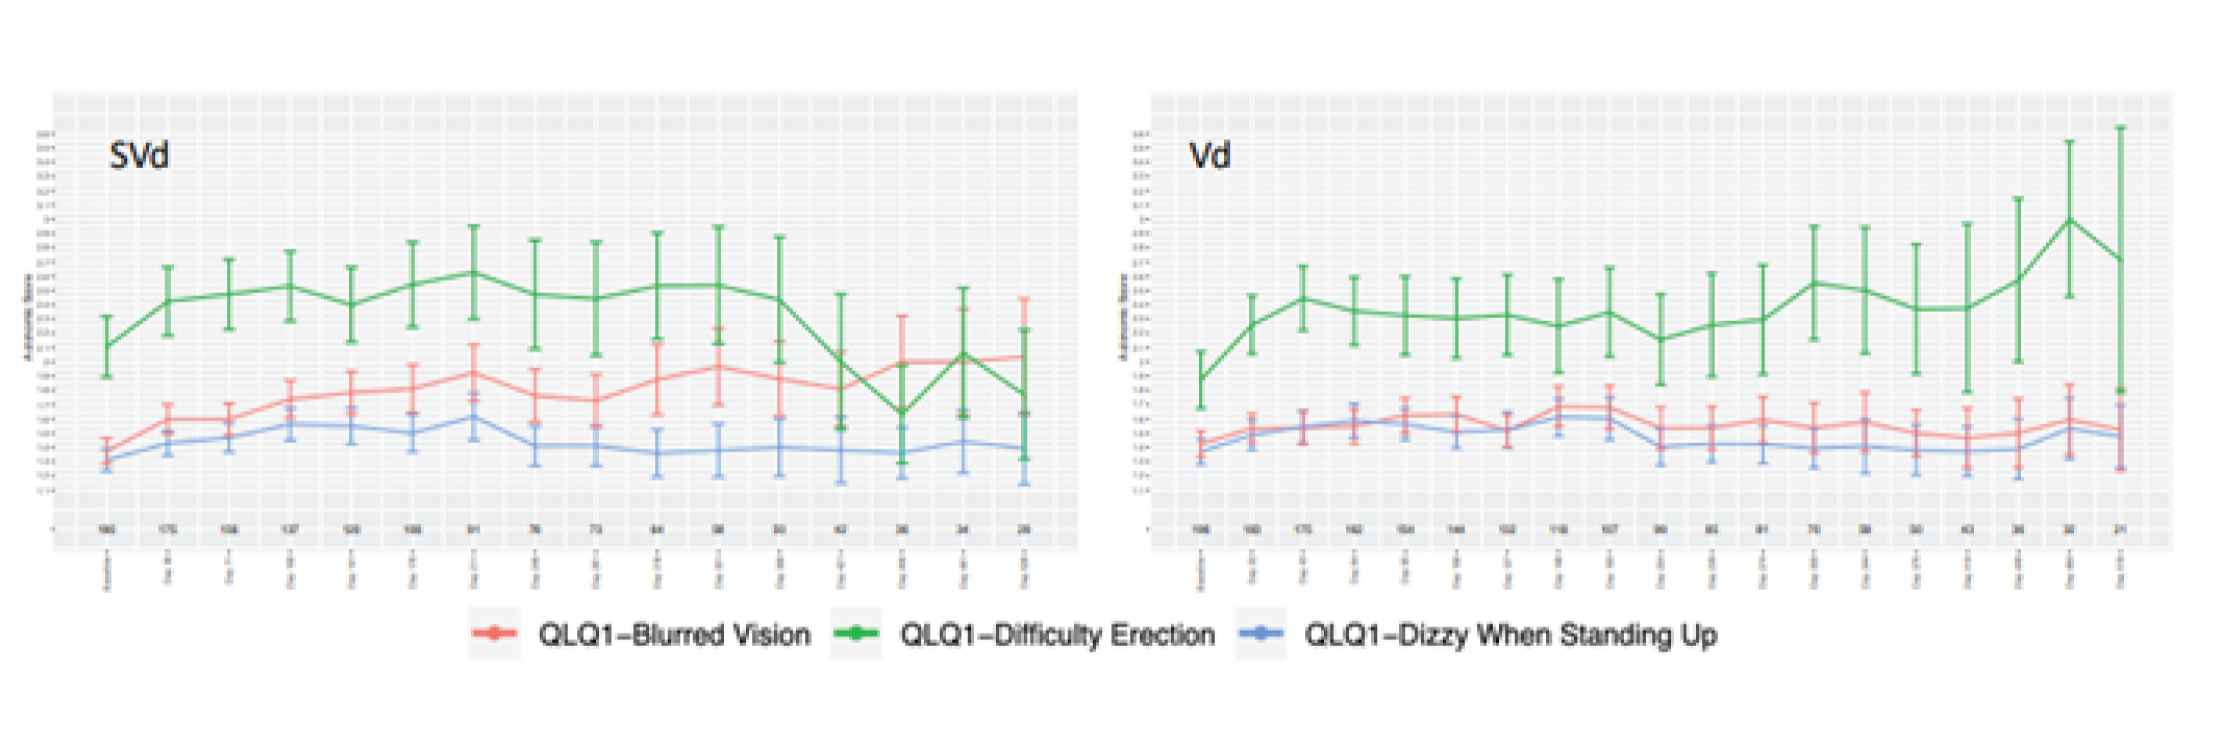
EORTC QLQ-CIPN20 = European Organisation for Research and Treatment of Cancer 20-item Quality of Life Questionnaire for Chemotherapy-Induced Peripheral Neuropathy; SD = standard deviation; SVd = selinexor plus bortezomib plus dexamethasone; Vd = bortezomib plus dexamethasone.
Source: BOSTON Clinical Study Report.4
EORTC QLQ-C30
The EORTC QLQ-C30 questionnaires were completed at baseline and at least 1 post-baseline time point by 188 patients in the SVd group and 195 patients in the Vd group. The mean baseline score of patients were similar between the SVd and Vd group for the GHS/QoL. There were no differences in GHS scores over time between the SVd and Vd groups (Figure 17). There were no statistically significant differences in the domains of the EORTC QLQ-C30 between the SVd and Vd treatment groups.
EQ-5D 5-Levels
Baseline scores of patients in the SVd and Vd groups were similar for the VAS and there were no differences between treatment groups throughout the trial (Figure 18). No major differences were observed for any other symptom domains.
Figure 17: Plot of Change From Baseline — EORTC QLQ-C30 GHS and QoL
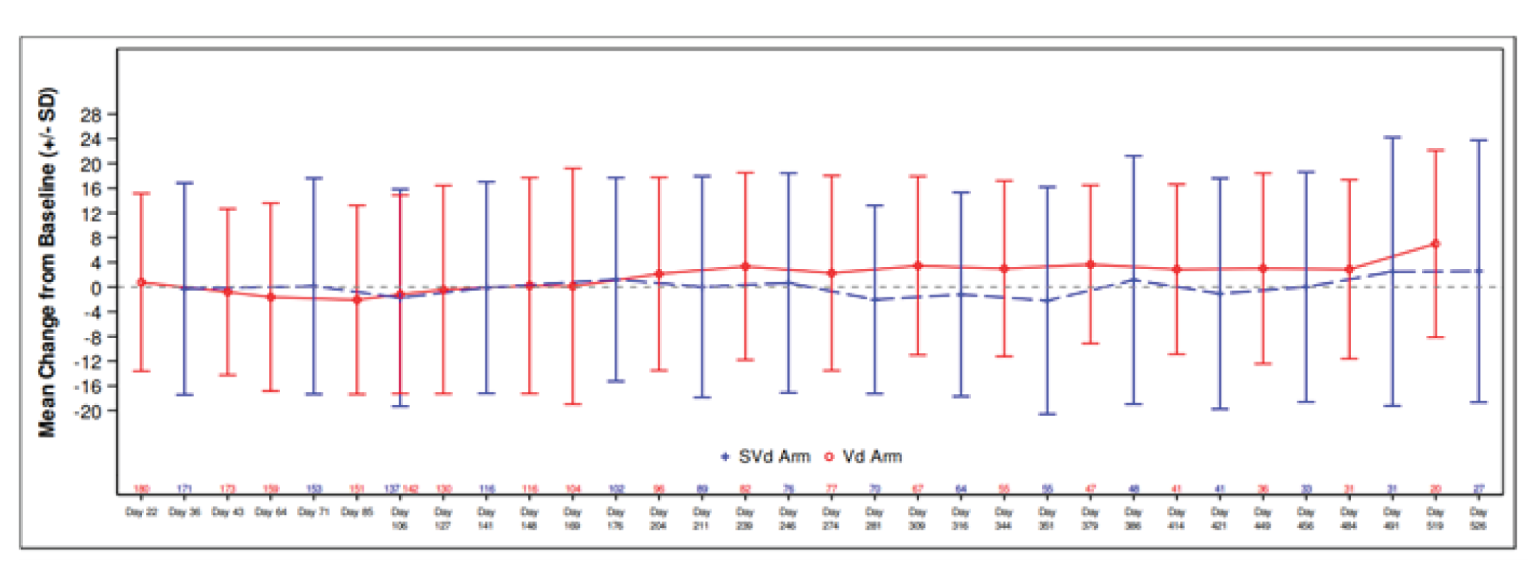
EORTC QLQ-C30 = European Organisation for Research and Treatment of Cancer Quality of Life Questionnaire Core 3; GHS = global health status; QoL = quality of life; SD = standard deviation; SVd = selinexor plus bortezomib plus dexamethasone; Vd = bortezomib plus dexamethasone.
Source: BOSTON Clinical Study Report.4
Figure 18: Plot of Change From Baseline — EQ-5D-5L Visual Analogue Scale
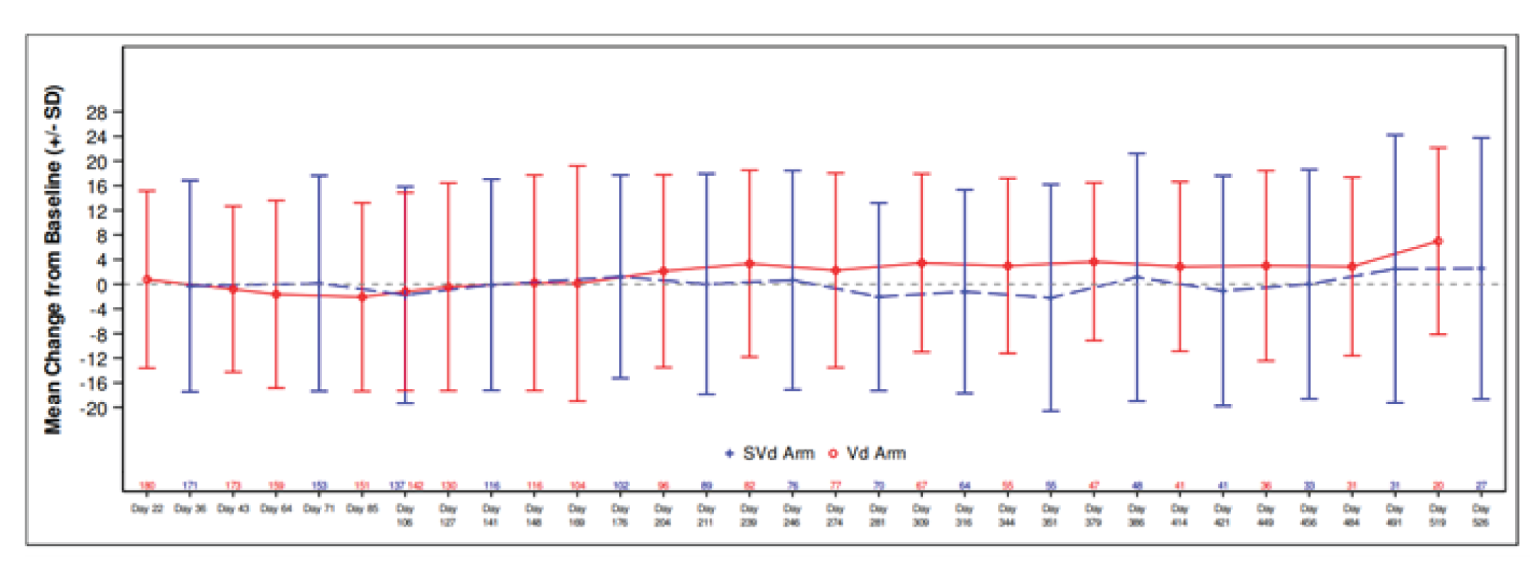
EQ-5D-5L = EQ-5D 5-Levels; SD = standard deviation; SVd = selinexor plus bortezomib plus dexamethasone; Vd = bortezomib plus dexamethasone.
Source: BOSTON Clinical Study Report.4
Harms
Only those harms identified in the review protocol are reported. Table 32 provides detailed harms data.
Table 32: Summary of Harms (Safety Population)
Harms | Primary analysis | Updated analysis | ||
|---|---|---|---|---|
SVd group N = 195 | Vd group N = 204 | SVd group N = 195 | Vd group N = 204 | |
Patients with ≥ 1 AE | ||||
Patients with ≥ 1 AE, n (%) | 194 (99.5) | 198 (97.1) | 194 (99.5) | 198 (97.1) |
Most common AEs,a n (%) | ||||
Thrombocytopenia | 117 (60.0) | 55 (27.0) | 121 (62.1) | 56 (27.5) |
Nausea | 98 (50.3) | 20 (9.8) | 98 (50.3) | 21 (10.3) |
Fatigue | 82 (42.1) | 37 (18.1) | 82 (42.1) | 37 (18.1) |
Diarrhea | 63 (32.3) | 51 (25.0) | 65 (33.3) | 52 (25.5) |
Anemia | 71 (36.4) | 47 (23.0) | 73 (37.4) | 48 (23.5) |
Decreased appetite | 69 (35.4) | 11 (5.4) | 69 (35.4) | 11 (5.4) |
Peripheral neuropathy | 63 (32.3) | 96 (47.1) | 65 (33.3) | 99 (48.5) |
Weight decreased | 51 (26.2) | 25 (12.3) | 51 (26.2) | 25 (12.3) |
Asthenia | 48 (24.6) | 27 (13.2) | 49 (25.1) | 27 (13.2) |
Cataract | 42 (21.5) | 13 (6.4) | 46 (23.6) | 15 (7.4) |
Vomiting | 40 (20.5) | 9 (4.4) | 40 (20.5) | 10 (4.9) |
Upper respiratory tract infection | 35 (17.9) | 30 (14.7) | 40 (20.5) | 30 (14.7) |
Cough | 35 (17.9) | 30 (14.7) | 36 (18.5) | 31 (15.2) |
Constipation | 33 (16.9) | 35 (17.2) | 33 (16.9) | 36 (17.6) |
Insomnia | 31 (15.9) | 32 (15.7) | 31 (15.9) | 32 (15.7) |
Back pain | 30 (15.4) | 29 (14.2) | 31 (15.9) | 29 (14.2) |
Pyrexia | 30 (15.4) | 22 (10.8) | 31 (15.9) | 26 (12.7) |
Neutropenia | 29 (14.9) | 12 (5.9) | 30 (15.4) | 13 (6.4) |
Pneumonia | 28 (14.4) | 28 (13.7) | 37 (19.0) | 35 (17.2) |
Dizziness | 24 (12.3) | 8 (3.9) | 24 (12.3) | 9 (4.4) |
Bronchitis | 24 (12.3) | 20 (9.8) | 25 (12.8) | 21 (10.3) |
Peripheral edema | 23 (11.8) | 26 (12.7) | 23 (11.8) | 29 (14.2) |
Nasopharyngitis | 23 (11.8) | 10 (4.9) | 23 (11.8) | 10 (4.9) |
Headache | > 10% | > 10% | 20 (10.3) | 13 (6.4) |
Dyspnea | 18 (9.2) | 27 (13.2) | 18 (9.2) | 28 (13.7) |
Patients with any grade 3 or 4 AE | ||||
Patients with any grade 3 or 4 AE, n (%) | 154 (79.0) | 114 (55.9) | 153 (78.5) | 115 (56.4) |
Patients with any grade ≥ 3 AE | ||||
Patients with any grade ≥ 3 AE, n (%)b | 166 (85.1) | 125 (61.3) | 167 (85.6) | 128 (62.7) |
Most common grade ≥ 3 AE, n (%) | ||||
Thrombocytopenia | 77 (39.5) | 35 (17.2) | 79 (40.5) | 36 (17.6) |
Anemia | 31 (15.9) | 21 (10.3) | 32 (16.4) | 21 (10.3) |
Fatigue | 26 (13.3) | 2 (1.0) | 26 (13.3) | 2 (1.0) |
Pneumonia | 22 (11.3) | 22 (10.8) | 23 (11.8) | 23 (11.3) |
Asthenia | 16 (8.2) | 9 (4.4) | 16 (8.2) | 9 (4.4) |
Neutropenia | 17 (8.7) | 7 (3.4) | 18 (9.2) | 7 (3.4) |
Cataract | 17 (8.7) | 3 (1.5) | 22 (11.3) | 4 (2.0) |
Nausea | 15 (7.7) | 0 | 15 (7.7) | 0 |
Diarrhea | 12 (6.2) | 1 (0.5) | 13 (6.7) | 1 (0.5) |
Hypophosphatemia | 10 (5.1) | 3 (1.5) | 11 (5.6) | 3 (1.5) |
Peripheral neuropathy | 9 (4.6) | 18 (8.8) | 9 (4.6) | 18 (8.8) |
Patients with ≥ 1 SAE | ||||
Patients with ≥ 1 SAE, n (%) | 101 (51.8) | 77 (37.7) | 106 (54.4) | 79 (38.7) |
Most common events,a n (%) | ||||
Pneumonia | 23 (11.8) | 24 (11.8) | 24 (12.3) | 25 (12.3) |
AEs leading to dose modifications | ||||
AEs leading to dose modifications, n (%) | 173 (88.7) | 156 (76.5) | 173 (88.7) | 156 (76.5) |
AEs leading to dose reductions, n (%) | 141 (72.3) | 104 (51.0) | 141 (72.3) | 106 (52.0) |
AEs leading to dose interruptions, n (%) | 167 (85.6) | 139 (68.1) | 167 (85.6) | 139 (68.1) |
AEs leading to treatment discontinuation | ||||
AEs leading to treatment discontinuation, n (%) | 41 (21.0) | 32 (15.7) | 41 (21.0) | 34 (16.7) |
Deaths | ||||
Deaths, n (%) | 12 (6.2) | 11 (5.4) | 14 (7.2) | 13 (6.4) |
Pneumonia | 2 (1.0) | 3 (1.5) | 3 (1.5) | 4 (2.0) |
Septic shock | 3 (1.5) | 0 | 3 (1.5) | 0 |
Pulmonary edema | 1 (0.5) | 1 (0.5) | 1 (0.5) | 1 (0.5) |
Anemia | 0 | 1 (0.5) | 0 | 1 (0.5) |
Cardiomyopathy | 0 | 1 (0.5) | 0 | 1 (0.5) |
Left ventricular failure | 0 | 1 (0.5) | 0 | 1 (0.5) |
Myocardial infarction | 1 (0.5) | 0 | 1 (0.5) | 0 |
Myocardial ischemia | 0 | 1 (0.5) | 0 | 1 (0.5) |
Death | 1 (0.5) | 0 | 1 (0.5) | 0 |
Bronchitis | 1 (0.5) | 0 | 1 (0.5) | 0 |
Injury | 1 (0.5) | 0 | 1 (0.5) | 0 |
Subdural hemorrhage | 0 | 1 (0.5) | 0 | 1 (0.5) |
Myelodysplastic syndrome | 0 | 1 (0.5) | 0 | 1 (0.5) |
Cerebral hemorrhage | 1 (0.5) | 0 | 1 (0.5) | 0 |
Hemorrhagic shock | 1 (0.5) | 0 | 1 (0.5) | 0 |
Circulatory collapse | 0 | 1 (0.5) | 0 | 1 (0.5) |
Respiratory failure | 0 | 0 | 0 | 1 (0.5) |
Notable harms, n (%) | ||||
Peripheral neuropathy | 63 (32.3) | 96 (47.1) | 65 (33.3) | 99 (48.5) |
Pain | 5 (2.6) | 4 (2.0) | 5 (2.6) | 4 (2.0) |
Anorexia | 0 | 0 | 0 | 0 |
Nausea | 98 (50.3) | 20 (9.8) | 98 (50.3) | 21 (10.3) |
Gastrointestinal disorders (system organ class) | 135 (69.2) | 91 (44.6) | 136 (69.7) | 93 (45.6) |
Thrombocytopenia | 117 (60.0) | 55 (27.0) | 121 (62.1) | 56 (27.5) |
Neutropenia | 29 (14.9) | 12 (5.9) | 30 (15.4) | 13 (6.4) |
AE = adverse event; SVd = selinexor plus bortezomib plus dexamethasone; Vd = bortezomib plus dexamethasone.
aFrequency of 10% or greater in any treatment group.
aFrequency of 5% or greater in any treatment group.
Source: BOSTON Clinical Study Report.4
Adverse Events
The most commonly occurring AEs included thrombocytopenia (60.0% in the SVd group versus 27.0% in the Vd group), nausea (50.2% versus 9.8%, respectively), fatigue (42.1% versus 18.1%), diarrhea (32.3% versus 25.0%), anemia (36.4% versus 23.0%), decreased appetite (35.4% versus 5.4%), PN (32.3% versus 47.1%), decreased weight (26.2% versus 12.3%), asthenia (24.6% versus 13.2%), cataract (21.5% versus 6.4%), and vomiting (20.5% versus 4.4%). These AEs were all more commonly reported in the SVd group than in the Vd group, except for PN, which occurred more frequently in the Vd group. Other AEs which occurred more frequently in the SVd group included neutropenia (14.9% in the SVd group versus 5.9% in the Vd group), dizziness (12.3% versus 3.9%, respectively), and nasopharyngitis (11.8% versus 4.9%).
Grade 3 and 4 AEs also occurred more frequently in the SVd group at 79.0% compared to 55.9% of patients in the Vd group. Grade 3 or higher AEs occurred in 85.1% of patients compared to 61.3% of patients. The most commonly occurring grade 3 or higher AEs were thrombocytopenia (39.5% in the SVd group versus 17.2% in the Vd group) and anemia (15.9% versus 10.3, respectively).
Serious Adverse Events
SAEs were more frequent in the SVd group at 51.8% compared to 37.7% of patients in the Vd group. The most common SAE was pneumonia, which occurred in 11.8% of patients in each treatment group.
Adverse Events Leading to Dose Modifications
Adverse events leading to dose modifications were more frequent in the SVd group (88.7%) than in the Vd group (76.5%). Specifically, AEs leading to dose reductions or dose interruptions were both more common in the SVd group than in the Vd group (72.3% versus 51.0% and 85.6% versus 68.1%, respectively).
Mortality
Deaths were reported for 6.2% patients in the SVd group and 5.4% patients in the Vd group. A breakdown of causes of death is provided in Table 32. The most common causes of death in the SVd group were septic shock (1.5%) and pneumonia (1.0%). The most common cause of death in the Vd group was pneumonia (1.5%).
Notable Harms
Incidence of Any Grade 2 or Higher Peripheral Neuropathy Events
The incidence of grade 2 or higher PN events was a key secondary safety end point of the BOSTON trial. The CADTH systematic review protocol also pre-specified PN as a notable harm. A summary of PN events by grade is provided in Table 33. Peripheral neuropathy was reported less often in the SVd group than in the Vd group at the primary analysis (21.0% versus 34.3%, respectively). Most events were grade 2. Results at the updated analysis were consistent with the primary analysis.
Table 33: Incidence of Grade 2 or Higher Peripheral Neuropathy Events (Safety Population)
Events | Primary analysis | Updated analysis | ||
|---|---|---|---|---|
SVd group N = 195 | Vd group N = 204 | SVd group N = 195 | Vd group N = 204 | |
Patients with at least 1 PN event of grade ≥ 2, n (%) | 41 (21.0) | 70 (34.3) | 42 (21.5) | 73 (35.8) |
Grade 2 | 32 (16.4) | 52 (25.5) | 33 (16.9) | 55 (27.0) |
Grade 3 | 8 (4.1) | 18 (8.8) | 8 (4.1) | 18 (8.8) |
Grade 4 | 1 (0.5) | 0 | 1 (0.5) | 0 |
Grade 5 | 0 | 0 | 0 | 0 |
PN = peripheral neuropathy; SVd = selinexor plus bortezomib plus dexamethasone; Vd = bortezomib plus dexamethasone.
Source: BOSTON Clinical Study Report.4
Other notable harms pre-specified in the CADTH systematic review protocol included pain, anorexia, nausea, gastrointestinal disorders, thrombocytopenia, and neutropenia. The incidence of pain was similar between both treatment groups (2.6% of patients in the SVd group versus 2.0% in the Vd group). No patients had observations of anorexia. Nausea (50.3% in the SVd group versus 9.8% in the Vd group), gastrointestinal disorders (69.2% versus 44.6%, respectively), thrombocytopenia (60.0% versus 27.0%), and neutropenia (15.9% versus 5.9%) were more commonly reported in the SVd group than in the Vd group.
Critical Appraisal
Internal Validity
The BOSTON trial was a phase III, active-controlled open-label study. It is possible that the open-label nature of the trial introduced bias as patients and investigators were aware of treatment assignment; the knowledge of treatment assignment may have affected the performance, reporting, and analyses of the trial, benefiting the investigational treatment (selinexor) over the standard of care. The sponsor took efforts to reduce the potential bias by using an IRC to analyze subjective outcomes such as PFS, ORR, and DOR. It is therefore unlikely that bias from the open-label design affected the efficacy analyses for these end points. However, it is still possible that biases from knowledge of treatment assignment could have affected patients’ reporting of side effects and HRQoL as these questionnaires relied on self-reporting from patients. However, results from HRQoL analyses were generally aligned with reporting of AEs; for example, the increased symptom burden related to vision impairment as assessed in the EORTC QLQ-CIPN20 corresponded to the increase in incidence of cataracts in the SVd group compared to the Vd group. While it is possible for bias due to the open-label nature of this trial to have affected the results, the effect is estimated to be low.
Regarding dose intensity, the mean duration of study treatment exposure was similar between the SVd and Vd groups at both the updated and primary analyses. The mean duration of treatment with bortezomib and dexamethasone was similar between the 2 groups, although the average total dose and the average number of doses of bortezomib and dexamethasone were slightly lower in the SVd group than in the Vd group. The clinical experts consulted by CADTH for this review confirmed that these differences were unlikely to greatly bias the results in favour of any treatment group. This is further highlighted by the high rates of treatment adherence (99%) in both the SVd and Vd treatment groups.
The demographic and clinical characteristics of patients randomized to the BOSTON trial were similar across the 2 treatment groups. It is therefore unlikely that differences in patient characteristics could have biased any treatment group in favour of the other.
The BOSTON trial allowed for patients in the Vd group to crossover to the SVd group upon IRC-confirmed disease progression. It is possible that crossover also affected safety analyses. Patients crossing over to a selinexor-based regimen would have experienced selinexor-related AEs. Therefore, it is possible that differences between treatment groups in the incidence of selinexor-related AEs are underestimated.
Subgroup analyses were conducted for efficacy analyses in the BOSTON trial, and subgroup analyses for PFS and ORR generally trended toward an improved treatment effect with SVd over Vd. These subgroup analyses were pre-specified. However, these analyses were not controlled for multiplicity or to detect differences and may be indicative of imprecision due to wide CIs. The lack of adjustment for these subgroup analyses may increase the likelihood of type I error, resulting in an increased likelihood of detecting a treatment effect when none are present; as such, subgroup analyses should be considered descriptive and interpreted with caution.
Two interim analyses were planned for the BOSTON trial. The first interim analysis was for sample size re-adjustment. At the first interim analysis, it was determined that no re-adjustment of sample size would be conducted. The second interim analysis was for efficacy analysis based on PFS, and would allow for a conclusion of efficacy, and stopping for futility (non-binding). Regardless of whether the outcome was positive, the sponsor believed that it was in the best interest of patients for the second interim analysis to serve as the final efficacy analysis due to concerns that the trial would not reach the planned number of PFS events and that it would take an extended period of time to accrue additional PFS events with minimal gain in power. The DSMB agreed to use the second interim analysis as the final analysis for PFS. As more than 75% of the planned PFS events occurred, the DSMB determined that the primary end point of PFS was met at a 1-sided alpha of 0.025 and therefore met the stopping boundary.
The primary efficacy analysis of the BOSTON trial was based on a pre-specified interim analysis that was planned to occur after approximately 75% of PFS events (i.e., approximately 201 events) and 22 months after the start of the study to allow for patient accrual to be completed before this interim analysis. At the time of the primary analysis, there was a total of 205 PFS events across both treatment groups. The type I error of this interim analysis was maintained using the Lan-DeMets alpha spending function with an O’Brien-Fleming type of boundary. The 3 key secondary end points (i.e., ORR, incidence of grade ≥ 2 PN events, and response rates for responses ≥ VGPR based on IRC assessment), were also tested hierarchically using a 1-sided significance level of 0.025, dependent on the primary end point of PFS reaching statistical significance. The CADTH team determined that the statistical procedures specified by the sponsor for this interim analysis were appropriate for controlling for multiplicity and reducing the risk of type I error. Additional efficacy end points assessed during this interim analysis were not part of the statistical hierarchy and were not controlled for multiplicity; these end points (OS, DOR, TTNT, TTR, and HRQoL) should be interpreted as supportive of the primary and key secondary end points but are at risk of both type I and type II error. The sponsor conducted an additional analyses of efficacy end points at an updated time point (February 15, 2021). This updated analysis was not pre-specified and was not considered in the statistical analysis plan. All results from the updated analysis should be considered descriptive.
Health-related quality of life was assessed using the EORTC QLQ-CIPN20, EORTC QLQ-C30, and EQ-5D-5L instruments. In general, there were no statistically significant differences observed in HRQoL between the SVd and Vd group for any of the questionnaires. However, there were numerical differences between the SVd and Vd groups for subscales in the EORTC QLQ-CIPN20, which may suggest greater symptom burden for patients depending on their assigned treatment. While these numerical differences were observed, HRQoL was an exploratory end point that was not powered to detect differences between treatment with SVd and Vd. Therefore, results of HRQoL should be interpreted with caution.
While not unique to the BOSTON trial, it is possible the choice of subsequent therapies could have affected efficacy assessments of OS, as analyses for OS included patients who received subsequent therapies. A total of 69 patients in the SVd group and 116 patients in the Vd group received subsequent anticancer therapies. Disproportional differences were noted between treatment groups in the types of subsequent anticancer therapies received, as more patients in the SVd group received |||||||||||||||||||||||||||||||||||||||||||||||||||||||||||||||||||||| than in the Vd group. In addition, patients in the Vd group were eligible to cross over to receive a selinexor-based regimen. The differences in subsequent therapies are expected to introduce bias in the efficacy analyses of OS and other patient outcomes. However, the direction and extent of the biases are difficult to predict.
Overall survival was not considered a primary or key secondary end point. However, the end point of OS is often considered important for oncology trials. At the time of the interim analysis, median OS was not reached; the median OS was NE (95% CI, NE to NE) in the SVd group and 24.97 months (95% CI, 23.49 to NE) in the Vd group, and the results did not indicate any differences between the 2 groups (HR = 0.84; 95% CI, 0.57 to 1.23; 1-sided P = 0.1852). As OS was not part of the statistical hierarchy and was immature at the time of the primary analysis, results should be interpreted with caution; longer-term OS data would be useful in determining the long-term effects of treatment with SVd among patients with MM.
At the primary analysis, 22 major protocol deviations were reported, with an additional 9 major protocol deviations at the updated analysis. Protocol deviations occurred in similar proportions across the SVd and Vd groups. According to the sponsor, none of the major protocol deviations had a significant impact on study conduct, patient safety, or treatment efficacy. Review by the CADTH team confirmed that the impact of these protocol deviations is likely very low.
Regarding patient disposition in the BOSTON trial, a greater proportion of patients in the SVd group discontinued treatment due to withdrawal by the patients |||||||||||||||||||| compared with the Vd group ||||||||||||||||||||. The sponsor clarified that the reasons for patient withdrawal were due to AEs (|||||| in the SVd group versus |||||| in the Vd group), logistical reasons (|||||| versus ||||||, respectively), poor health or entering hospice care (|||||| versus ||||||), burden of assessments (|||||| versus ||||||), and IRC-confirmed disease progression (|||||| versus ||||||); an additional |||||| patients in the SVd group versus |||||| patients in the Vd group did not provide any additional information.5 Discontinuation due to AEs and/or toxicity were initially reported by 16.9% of patients in the SVd group versus 11.3% of patients in the Vd group. The clarification provided by the sponsor regarding reasons for “withdrawal by the patient” may indicate that there is additional toxicity related to SVd, as an additional |||||| patients in the SVd group versus |||||| patients in the Vd group discontinued due to AEs. It is possible that these differences in patient disposition may have affected some efficacy end points, as this imbalance in discontinuations may be a result of informative censoring. As PFS was the primary end point, it is possible that the analyses were conducted on a population of patients in the SVd group who could better tolerate the investigational treatment. The sponsor conducted a number of sensitivity analyses in which the results continued to support the primary analysis of PFS and favoured treatment with SVd over Vd. However, the sponsor also conducted a sensitivity analysis that considered treatment discontinuation as an event (Table 46); this analysis was the only sensitivity analysis for PFS that did not demonstrate a statistically significant improvement in PFS for the SVd group (HR = 0.95; 95% CI, 0.76 to 1.19). The imbalance in patient discontinuations may also have affected other secondary outcomes, namely TTD. The median TTDs were 7.10 months (95% CI, 6.44 to 8.54) in the SVd group and 7.95 months (95% CI, 6.80 to 9.23) in the Vd group (HR = 0.99; 95% CI, 0.79 to 1.23). It was expected that an improvement in PFS would translate to a longer TTD in the investigational therapy group versus the control, however this was not the case in the BOSTON trial.
Additional analyses were conducted for patients in the crossover group. In particular, results for PFS were reported for patients in the crossover group. However, these results are difficult to interpret without a comparator group.
External Validity
The clinical experts consulted by CADTH for this review acknowledged that the eligibility criteria of the BOSTON trial, while similar to other clinical trials for MM, were restrictive and likely excluded patients who would be candidates for SVd in clinical practice. For example, the trial excluded patients who received radiation, chemotherapy immunotherapy, or other anticancer therapy before 2 weeks before receiving study treatment. The clinical experts confirmed that, in clinical practice, patients may often begin new therapy within 2 weeks of a previous treatment. The eligibility criteria also excluded patients with severe PN; however, it was stated that PN is a common symptom and that, in some cases, patients may be treated regardless. Patients with plasma cell leukemia were excluded; the clinical experts commented that it is likely that a treatment that is efficacious for patients with MM would be efficacious for patients with plasma cell leukemia, and that these patients would be treated in clinical practice. In addition, patients presenting with comorbidities are common, and would likely be treated as well. Patients were also excluded if they had been treated with a prior malignancy within 5 years of randomization into the BOSTON trial; the clinical experts stated that this would exclude patients who could benefit from treatment, and that, at times, patients are being treated while also having another cancer. Patients were also excluded if they had spinal cord compression, documented systemic light chain amyloidosis, or major surgery within 4 weeks of beginning study therapy. In general, exclusion criteria were acknowledged to be restrictive and exclude patients who could potentially benefit from treatment with SVd.
The demographic and clinical characteristics of patients randomized in the BOSTON trial were generally considered representative of patients living in Canada, as confirmed through consultation with clinical experts for this review. However, the clinical experts noted that the proportions of patients with previous exposure to lenalidomide were low (39.5% in the SVd group and 37.2% in the Vd group). In Canadian clinical practice, lenalidomide would be administered to most patients as a first-line therapy in the metastatic setting. Therefore, it is expected that nearly all patients living in Canada would have had previous exposure to lenalidomide. It is unclear how SVd may perform in a cohort of patients who have mostly been exposed to lenalidomide; subgroup analyses of PFS suggest that patients with previous lenalidomide exposure show improved outcomes when treated with SVd over Vd (Table 23). However, subgroup analyses should be interpreted with caution.
Patients enrolled in the BOSTON trial could have received between 1 and 3 prior treatments. The mean number of prior lines of anti-MM therapies received by patients was approximately 2 in both the SVd and Vd groups; 50.8% versus 47.8% received 1 prior line, 33.3% of the SVd group versus 30.9% of the Vd group received 2 prior lines, and 15.9% versus 21.3%, respectively, received 3 prior lines of anti-MM therapy. Consultation with the clinical experts consulted by CADTH for this review confirmed that other treatments may be preferred before use of the selinexor-based regimen. The clinical experts consulted by CADTH for this review confirmed that use of SVd beyond the fourth line is possible, and that the treatment need not necessarily be limited to earlier lines of therapy; further, selinexor would likely be an option for patients who are would be refractory to PIs, immunomodulatory drugs, and anti-CD38 therapies.
In the BOSTON trial, evaluations for MM during treatment were conducted on day 1 of each cycle every 3 weeks through to week 37, and then every 5 weeks for the remainder of the trial. The clinical experts consulted by CADTH for this review confirmed that the assessments from baseline to week 37 of the trial were conducted more frequently than would be the case in clinical practice, in which patients are more likely to be assessed once every 4 or 5 weeks. The sponsor stated that patients were assessed every 3 weeks to identify the patients who progress quickly. It is possible that the more frequent assessment schedule of the BOSTON trial could have led to over-identification of patients.
The BOSTON trial was a phase III trial comparing SVd to Vd. The use of Vd as a comparator was not considered to be appropriate in the current Canadian context. In particular, the dose of bortezomib differed between the 2 treatment groups. Bortezomib was administered at a dose of 1.3 mg/m2 SC on days 1, 8, 15, and 22 of each 35-day cycle in the SVd group. In the Vd group bortezomib was administered at a dose of 1.3 mg/m2 SC on days 1, 4, 8, and 11 of each 21-day cycle for the first 8 cycles; after cycle 8, bortezomib was administered at a dose of 1.3 mg/m2 SC on days 1, 8, 15, and 22 of each 25-day cycle. The clinical experts consulted by CADTH confirmed that the twice-weekly dosing of Vd in the Vd group is not common in clinical practice. In addition, Vd alone is not commonly administered to patients. The clinical experts confirmed that Vd is often administered to patients as part of a triplet regimen. Overall, the clinical experts agreed that Vd is not an appropriate comparator in the current Canadian treatment landscape for MM. However, it was acknowledged that enrolment for the BOSTON trial began in 2017 when the standard of care may have been different, and that global variation in reimbursement of treatments may have led to the decision to choose Vd as the comparator for the BOSTON trial.
The primary end point of the BOSTON trial was PFS. Key secondary end points included ORR, incidence of grade 2 or higher PN events, and response rates for responses of a VGPR or better based on an IRC assessment. Consultation with clinical experts for this review confirmed that PFS is a clinically meaningful end point for patients and clinicians. The PFS results of the BOSTON trial showed statistically significant improvement with treatment with SVd over Vd. Key secondary end points (i.e., ORR) and other secondary end points (i.e., DOR, TTNT, and TTR) were supportive of PFS. The results of secondary end points were therefore considered supportive of the primary end point, and appropriate for analysis of efficacy for new MM therapies in this clinical trial.
Indirect Evidence
Objectives and Methods for the Summary of Indirect Evidence
The objective of this section is to summarize and critically appraise available evidence comparing selinexor to other relevant treatments (identified in the CADTH protocol) for patients with MM.
A focused literature search for NMAs dealing with MM was run in MEDLINE All (1946–) on February 11, 2022. No limits were applied to the search. Of 100 records identified by the CADTH literature search, 3 published ITCs by Arcuri et al. (2021),20 Botta et al. (2021),6 and Dolph et al. (2021)21 were included.
Description of Indirect Comparisons
Selection criteria for studies to be included in the sponsor’s NMA are described in Table 34. Details of the study selection methods by Botta et al.6 were not reported. In addition, study selection methods as well as methods for data extraction of selected articles were not reported for the literature reviews conducted for the ITCs by the sponsor,22 Dolph et al.,21 or Botta et al.6 Methods for quality assessment of selected studies were not reported by Dolph et al.21 nor Botta et al.6
Table 34: Study Selection Criteria and Methods for Indirect Treatment Comparisons
Criteria | Sponsor’s ITC | Dolph et al. (2021) | Arcuri et al. (2021) | Botta et al. (2021) |
|---|---|---|---|---|
Population | Patients diagnosed with RRMM | Patients diagnosed with RRMM | Patients diagnosed with RRMM | MM patients who were exposed to lenalidomide and refractory to lenalidomide |
Intervention |
|
| NR |
|
Comparator |
|
|
|
|
Outcome |
|
|
| NR |
Study design |
|
| RCT | NR |
Publication characteristics | Publications were limited to the English language and humans; searches included publications from database inception to date of search | Publications were limited to the English language and humans; searches included publications from database inception to date of search | Publications were limited to those published between January 1, 2007, to December 21, 2020 | NR |
Exclusion criteria | Patients:
Interventions: Studies not including at least 1 of the interventions listed in the inclusion criteria Outcomes: Studies not including at least 1 of the outcomes listed in the inclusion criteria Study design:
| Patients:
Interventions: Studies not including at least 1 of the interventions listed in the inclusion criteria Outcomes: Studies not including at least 1 of the outcomes listed in the inclusion criteria Study design:
| NR | NR |
Databases searched |
|
|
| NR |
Selection process | NR | NR | 2 reviewers independently reviewed all records; discrepancies were settled by discussion | NR |
Data extraction process | NR | NR | Data extraction was conducted independently by 2 reviewers; discrepancies were settled by discussion | NR |
Quality assessment | Studies were assessed for quality using the Cochrane Collaboration tool | NR | Studies were assessed for quality using the Cochrane Collaboration tool | NR |
AE = adverse event; DKd = daratumumab plus carfilzomib plus dexamethasone; DVd = daratumumab plus bortezomib plus dexamethasone; HRQoL = health-related quality of life; Kd = carfilzomib plus dexamethasone; MM = multiple myeloma; NR = not reported; ORR = objective response rate; OS = overall survival; PFS = progression-free survival; PK = pharmacokinetic; PVd = pomalidomide plus bortezomib plus dexamethasone; RCT = randomized controlled trial; RRMM = relapsed or refractory multiple myeloma; SAE = serious adverse event; SVd = selinexor plus bortezomib plus dexamethasone; Vd = bortezomib plus dexamethasone.
Source: Sponsor’s indirect treatment comparison,22 Arcuri et al. (2021),20 Botta et al. (2021),6 and Dolph et al. (2021).21
Methods of the Sponsor’s Indirect Treatment Comparison
Objectives
The aim of the sponsor’s ITC was to conduct an NMA to compare selinexor to relevant comparators with respect to PFS, OS and ORR.
Study Selection Methods
To identify relevant studies for the sponsor’s ITC, a literature search was conducted based on eligibility criteria reported in Table 34. Studies were retrieved from electronic databases using the Ovid platform. The systematic literature review conducted by the sponsor was conducted in 2020 but updated in October of 2021. The target population included patients with RRMM. Interventions and comparators included selinexor, bortezomib, lenalidomide, pomalidomide, panobinostat, ixazomib, elotuzumab, daratumumab, and carfilzomib. Eligible study designs included RCTs, subgroup analyses of previously published studies, systematic reviews, meta-analyses, and pooled analyses. Systematic reviews, meta-analyses and pooled analyses were included in the sponsor’s systematic literature review for cross-checking only.
It was unclear how studies from the systematic literature review were screened, or how data were extracted from studies that were included based on eligibility criteria of the systematic review as these details were not provided by the sponsor.
Risk of bias was conducted using the Cochrane Collaboration’s tool, which assesses trials based on the following criteria: random sequence generation, allocation concealment, blinding of participants and personnel, blinding of outcome assessment, incomplete outcomes, selective reporting.
ITC Analysis Methods
Details of the methodology used for the sponsor’s ITC are provided in Table 35.
Table 35: Indirect Treatment Comparison Analysis Methods
Method | Sponsor’s indirect treatment comparison |
|---|---|
Indirect treatment comparison methods | The NMA was conducted using a Bayesian framework with a mixed treatment-effect approach to allow for complex networks with multiple treatments per comparison or per trial; random-effects models were used, except for networks with small number of studies, resulting in nonconvergence and/or unrealistically wide credible intervals, where fixed-effect models were used instead |
Priors | Non-informative priors were used and were initiated |
Assessment of model fit | The following criteria were used to assess model fit: Dbar, Dhat, DIC, and pD; no description was provided as to how these were used in the choice of models |
Assessment of consistency | An assessment of consistency was conducted by comparisons of study and patient characteristics |
Assessment of convergence | Convergence of models was assessed using trace plots and Gelman-Rubin-Brooks plots of the potential scale reduction factor with a minimum cut-off below 1.05 by the final iteration |
Outcomes | PFS, OS, and ORR |
Construction of nodes | Networks for each outcome were constructed based on whether 1) studies included second-line patients only, or 2) studies included patients treated in the third-line or after; studies that included patients in both second and later lines of therapy and that did not report outcomes stratified by line of therapy were allocated to the network the majority of patients represented |
Sensitivity analyses | None |
Subgroup analysis | Subgroup analyses and meta-regressions were not conducted due to small sample sizes |
Methods for pairwise meta-analysis | Treatment effects were compared using HRs for PFS and OS end points, and ORs for the ORR end point with associated credible intervaIs; all comparisons were made against bortezomib plus dexamethasone |
Dbar = posterior mean of the deviance; Dhat = a point estimate of the deviance; DIC = deviance information criterion; HR = hazard ratio; ITC = indirect treatment comparison; OR = odds ratio; ORR = objective response rate; OS = overall survival; pD = posterior mean of the deviance minus the deviance of the posterior mean; PFS = progression-free survival.
Source: Sponsor’s indirect treatment comparison.22
Results of Sponsor’s Indirect Treatment Comparison
Summary of Included Studies
A total of 7,802 publications were identified from the systematic literature search conducted on May 26, 2020; after title and abstract review, 5,360 records were excluded, leaving 258 publications for full-text review. After full-text review, 47 publications representing 28 original studies were considered relevant. The updated literature search conducted on October 31, 2021, identified an additional 943 publications; a total of 155 records were selected for full-text review and 19 publications representing 12 original studies were considered relevant for data extraction. A total of 66 publications were fully extracted based on the original and updated literature search.
All 66 studies included patients with RRMM. Most studies were phase II or III trials, including 19 phase II trials (29%) and 45 phase III trials (68%). Details about trial phase were not reported for 1 study. Another study was a retrospective matched-pair analysis that was included to complete the treatment networks. Of the studies, 50 (76%) were open-label, 12 (18%) were double-blind, and 4 did not report blinding procedures. The median follow-up ranged from |||||||||||| months (median = |||||| months). Sample sizes in treatment groups ranged from |||||||||||||||||| (median = |||||| per treatment group). The median age ranged between |||||| and |||||| years (median = |||||| years); the median ages were similar across most trials. The proportion of males across the trials ranged from |||||| (median = ||||||).
Risk of Bias
As assessment of risk of bias was conducted on the 17 studies included in the sponsor’s ITC. No overall assessment of the risk of bias of all studies was conducted; instead, each domain of the Cochrane Collaboration tool was assessed. The risk of bias regarding random sequence generation and allocation concealment for all studies was low, except for the study by Dimopoulos et al. references in the sponsor’s NMA22 which was a retrospective matched-pair analysis. All studies had a high risk of bias for blinding of participants and blinding of outcomes, with the exception of 2 studies that were rated to have low risk of bias; the bias of these 2 domains were reported to be unclear for the retrospective matched-pair analysis. All studies were rated to have a low risk of bias for incomplete outcomes and selective reporting domains, except for the matched-pair analysis by Dimopoulos et al. referenced in the sponsor’s NMA22 which was reported to have an unclear risk of bias for these domains.
Construction of Networks
A total of 17 studies were included in the network of patients receiving second-line therapy, and 14 studies were included in the network of patients in the third line or later of therapy. Separate networks were also built for each outcome as not all studies reported all of PFS, OS and ORR. The network diagrams for PFS, OS and ORR for second-line treatment of patients are depicted in Figure 19, Figure 20, and Figure 21, respectively. The network diagrams for PFS, OS, and ORR for treatment in the third line are depicted in Figure 22, Figure 23, and Figure 24, respectively.
Figure 19: PFS Treatment Network — Second Line
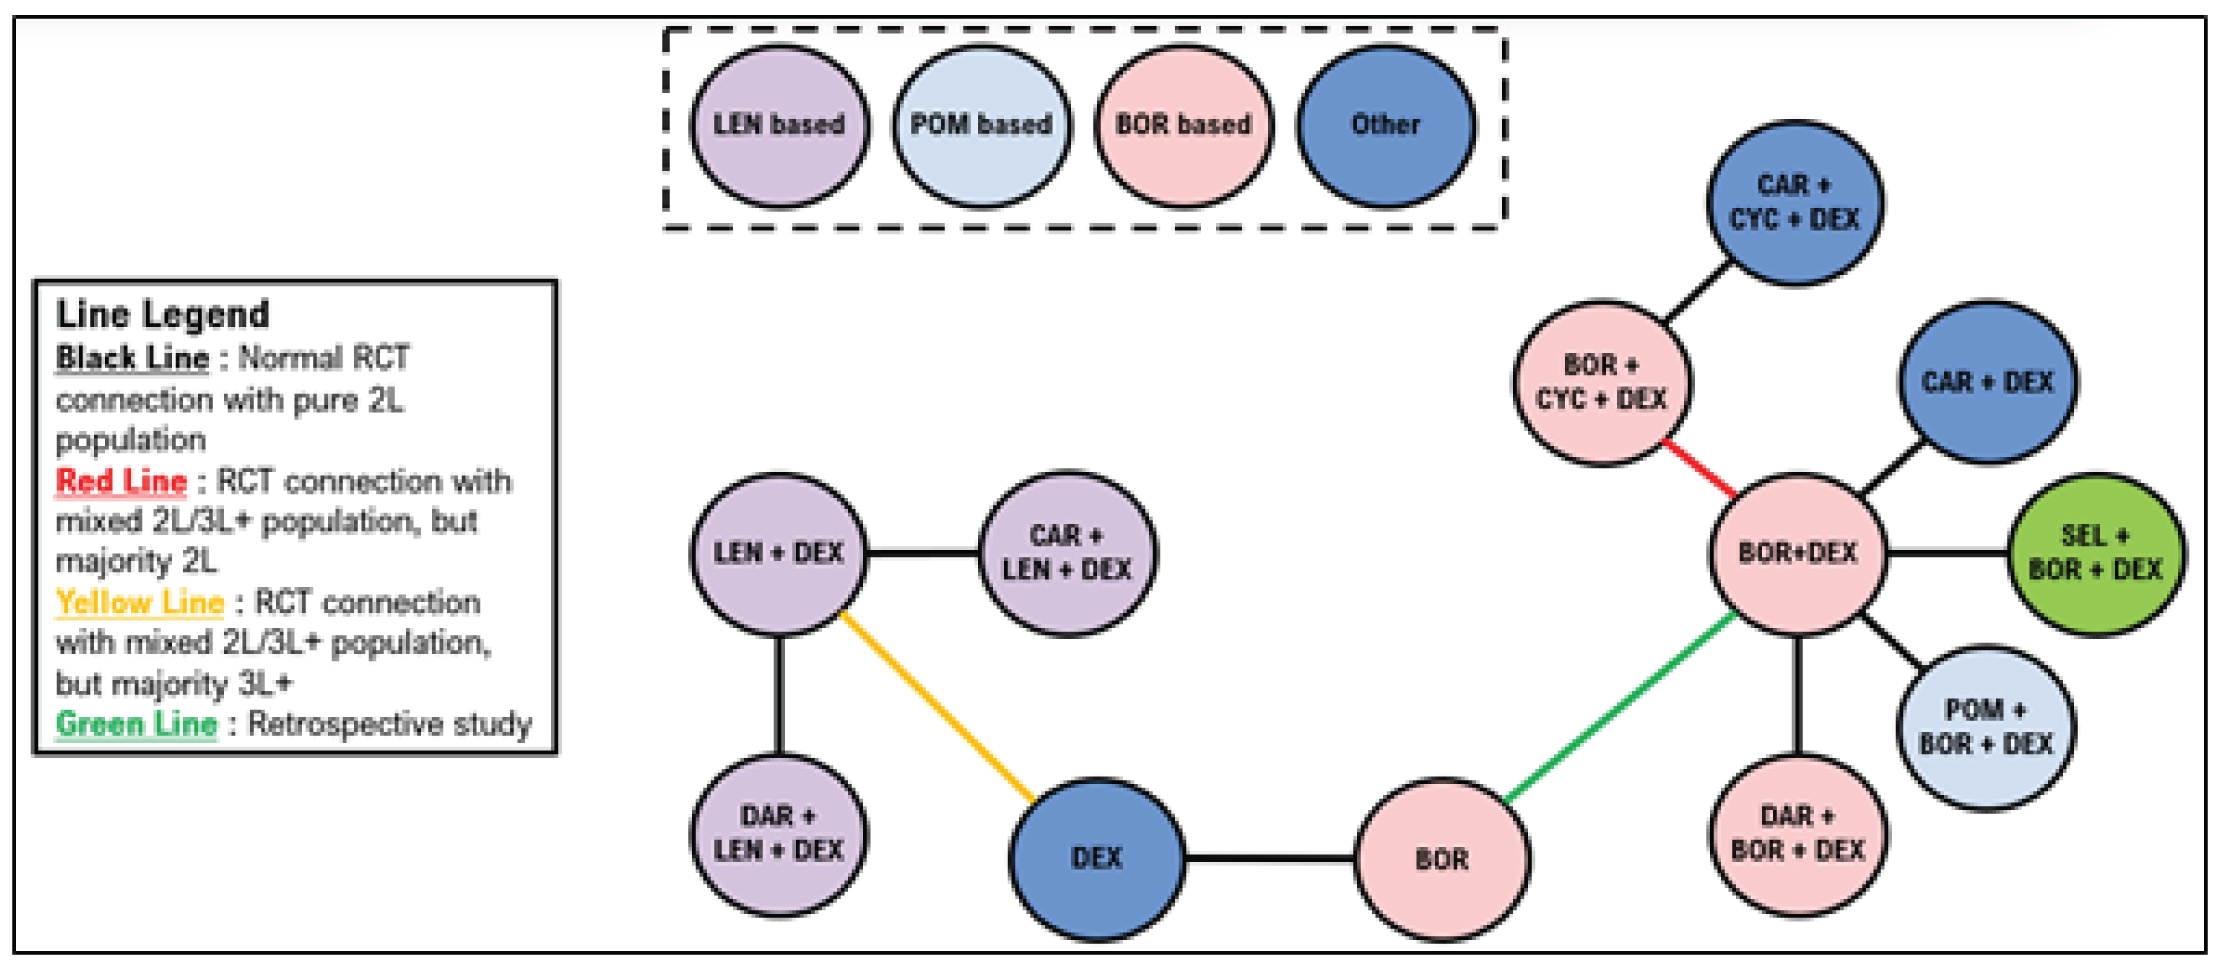
2L = second line; 3L+ = third or later line; BOR = bortezomib; CAR = carfilzomib; CYC = cyclophosphamide; DAR = daratumumab; DEX = dexamethasone; LEN = lenalidomide; PFS = progression-free survival; POM = pomalidomide; RCT = randomized controlled trial; SEL = selinexor.
Source: Sponsor’s indirect treatment comparison.22
Figure 20: OS Treatment Network — Second Line
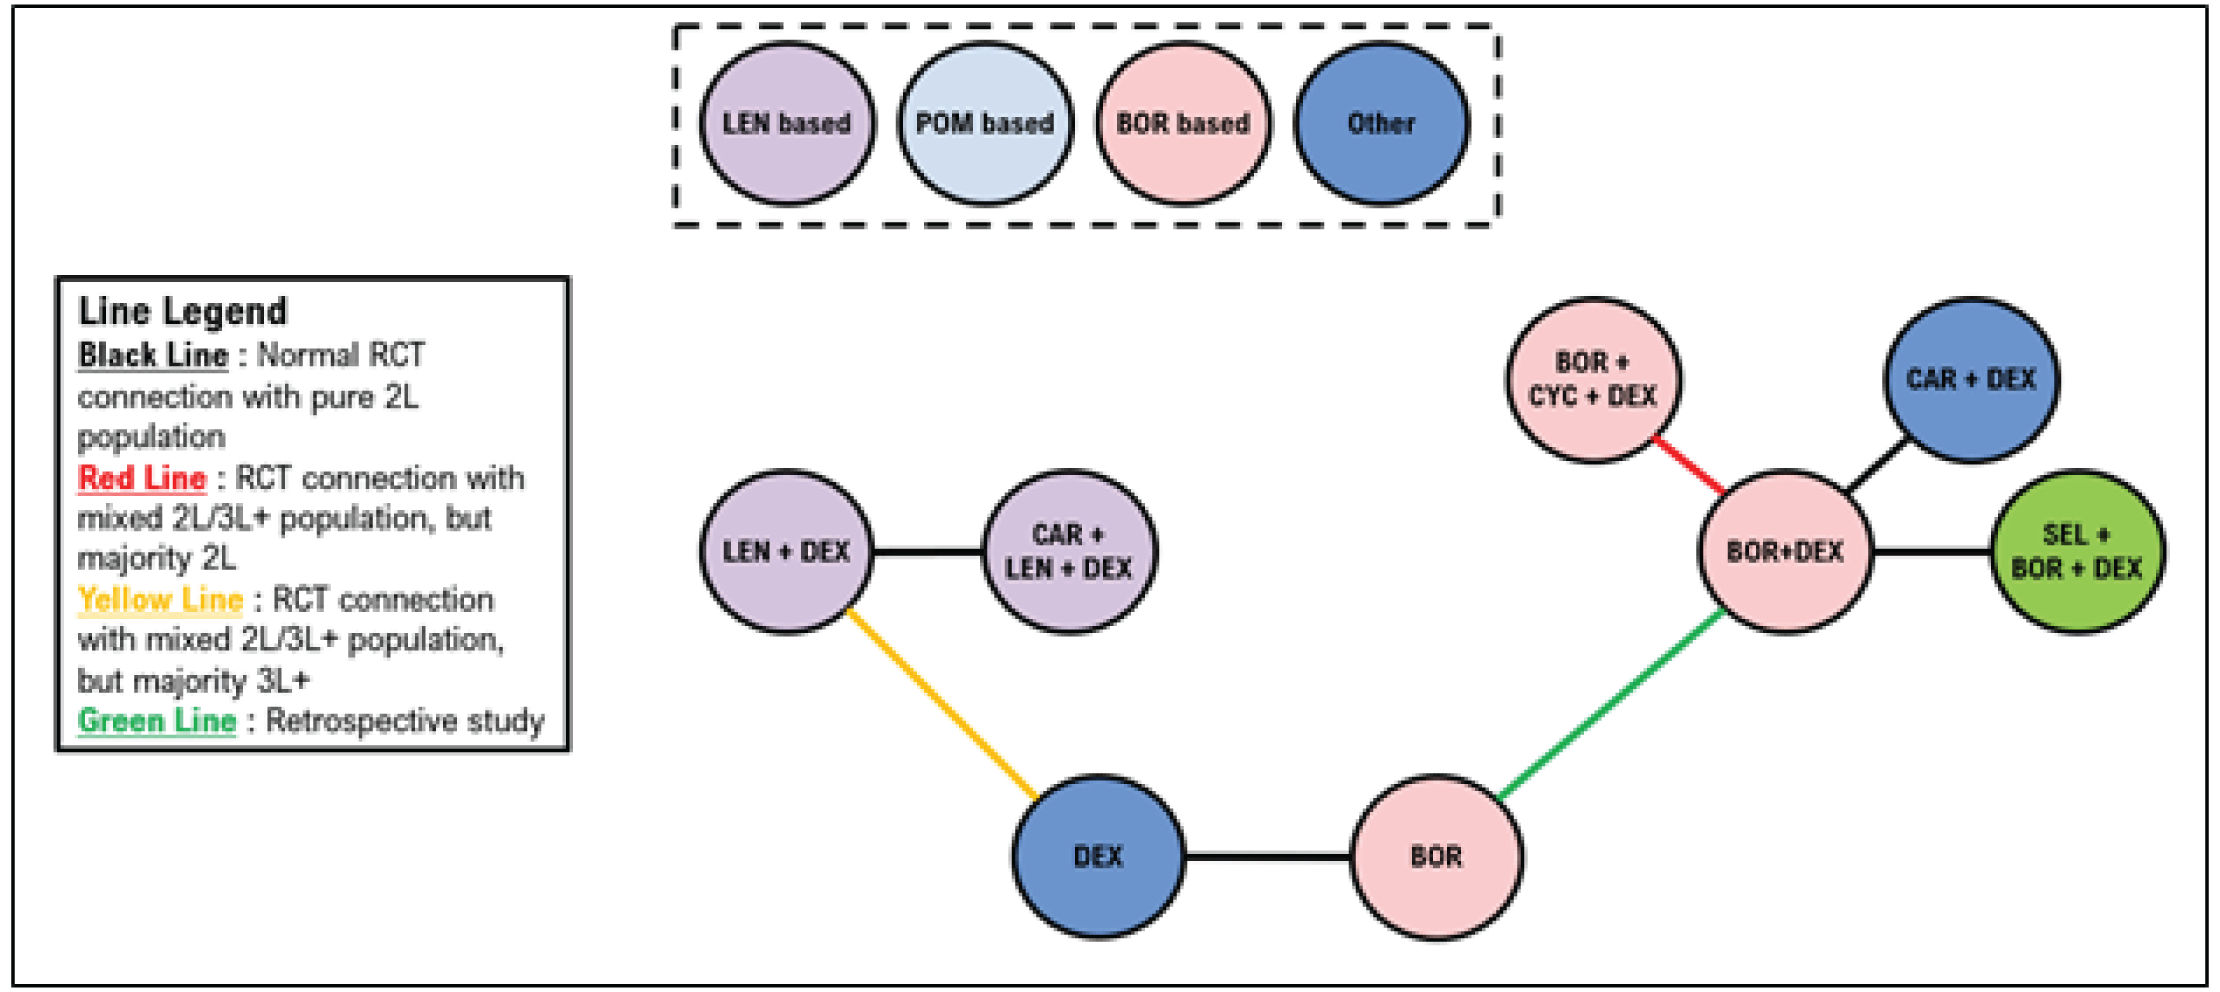
2L = second line; 3L+ = third or later line; BOR = bortezomib; CAR = carfilzomib; CYC = cyclophosphamide; DAR = daratumumab; DEX = dexamethasone; LEN = lenalidomide; OS = overall survival; POM = pomalidomide; RCT = randomized controlled trial; SEL = selinexor.
Source: Sponsor’s indirect treatment comparison.22
Figure 21: Objective Response Rate Treatment Network — Second Line
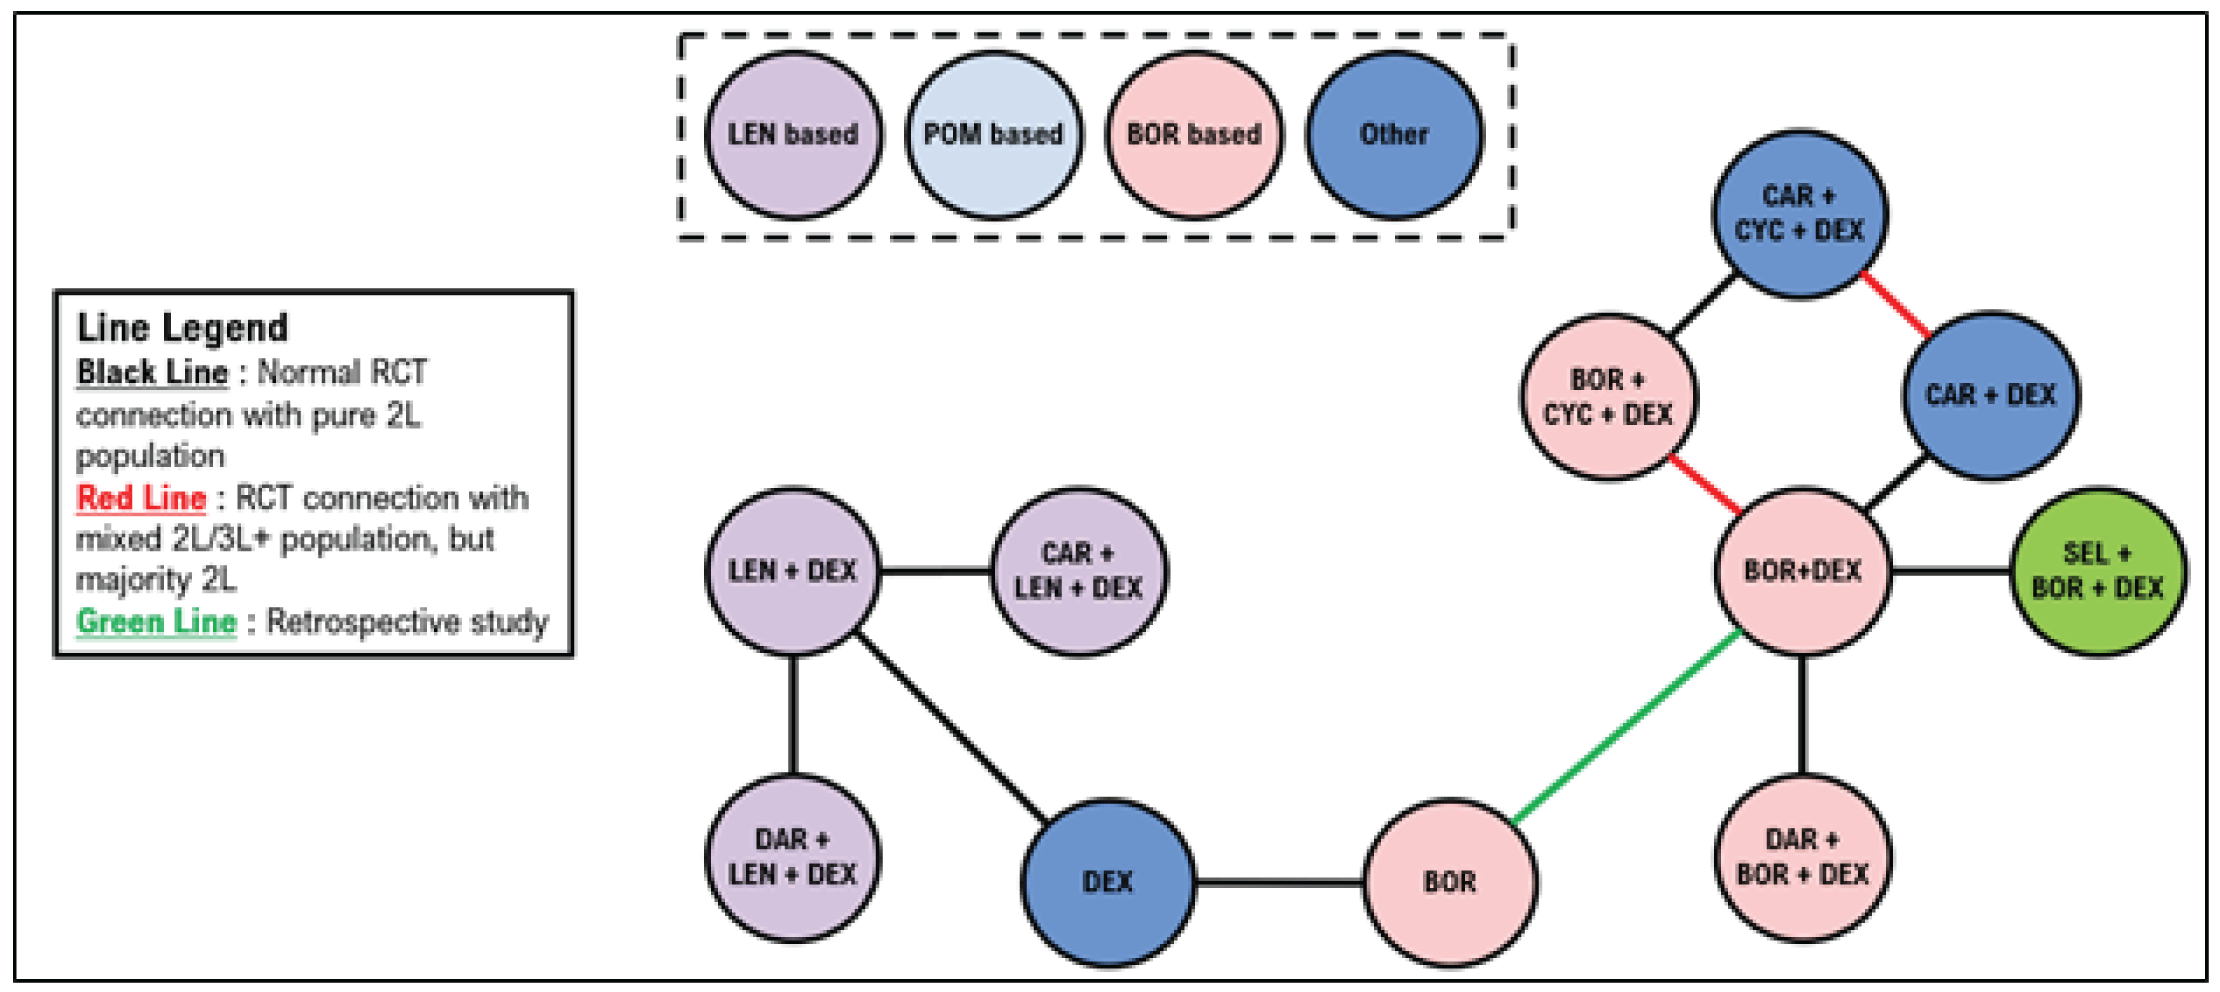
2L = second line; 3L+ = third or later line; BOR = bortezomib; CAR = carfilzomib; CYC = cyclophosphamide; DAR = daratumumab; DEX = dexamethasone; LEN = lenalidomide; ORR = objective response rate; POM = pomalidomide; RCT = randomized controlled trial; SEL = selinexor.
Source: Sponsor’s indirect treatment comparison.22
Figure 22: PFS Treatment Network — Third Line or Later
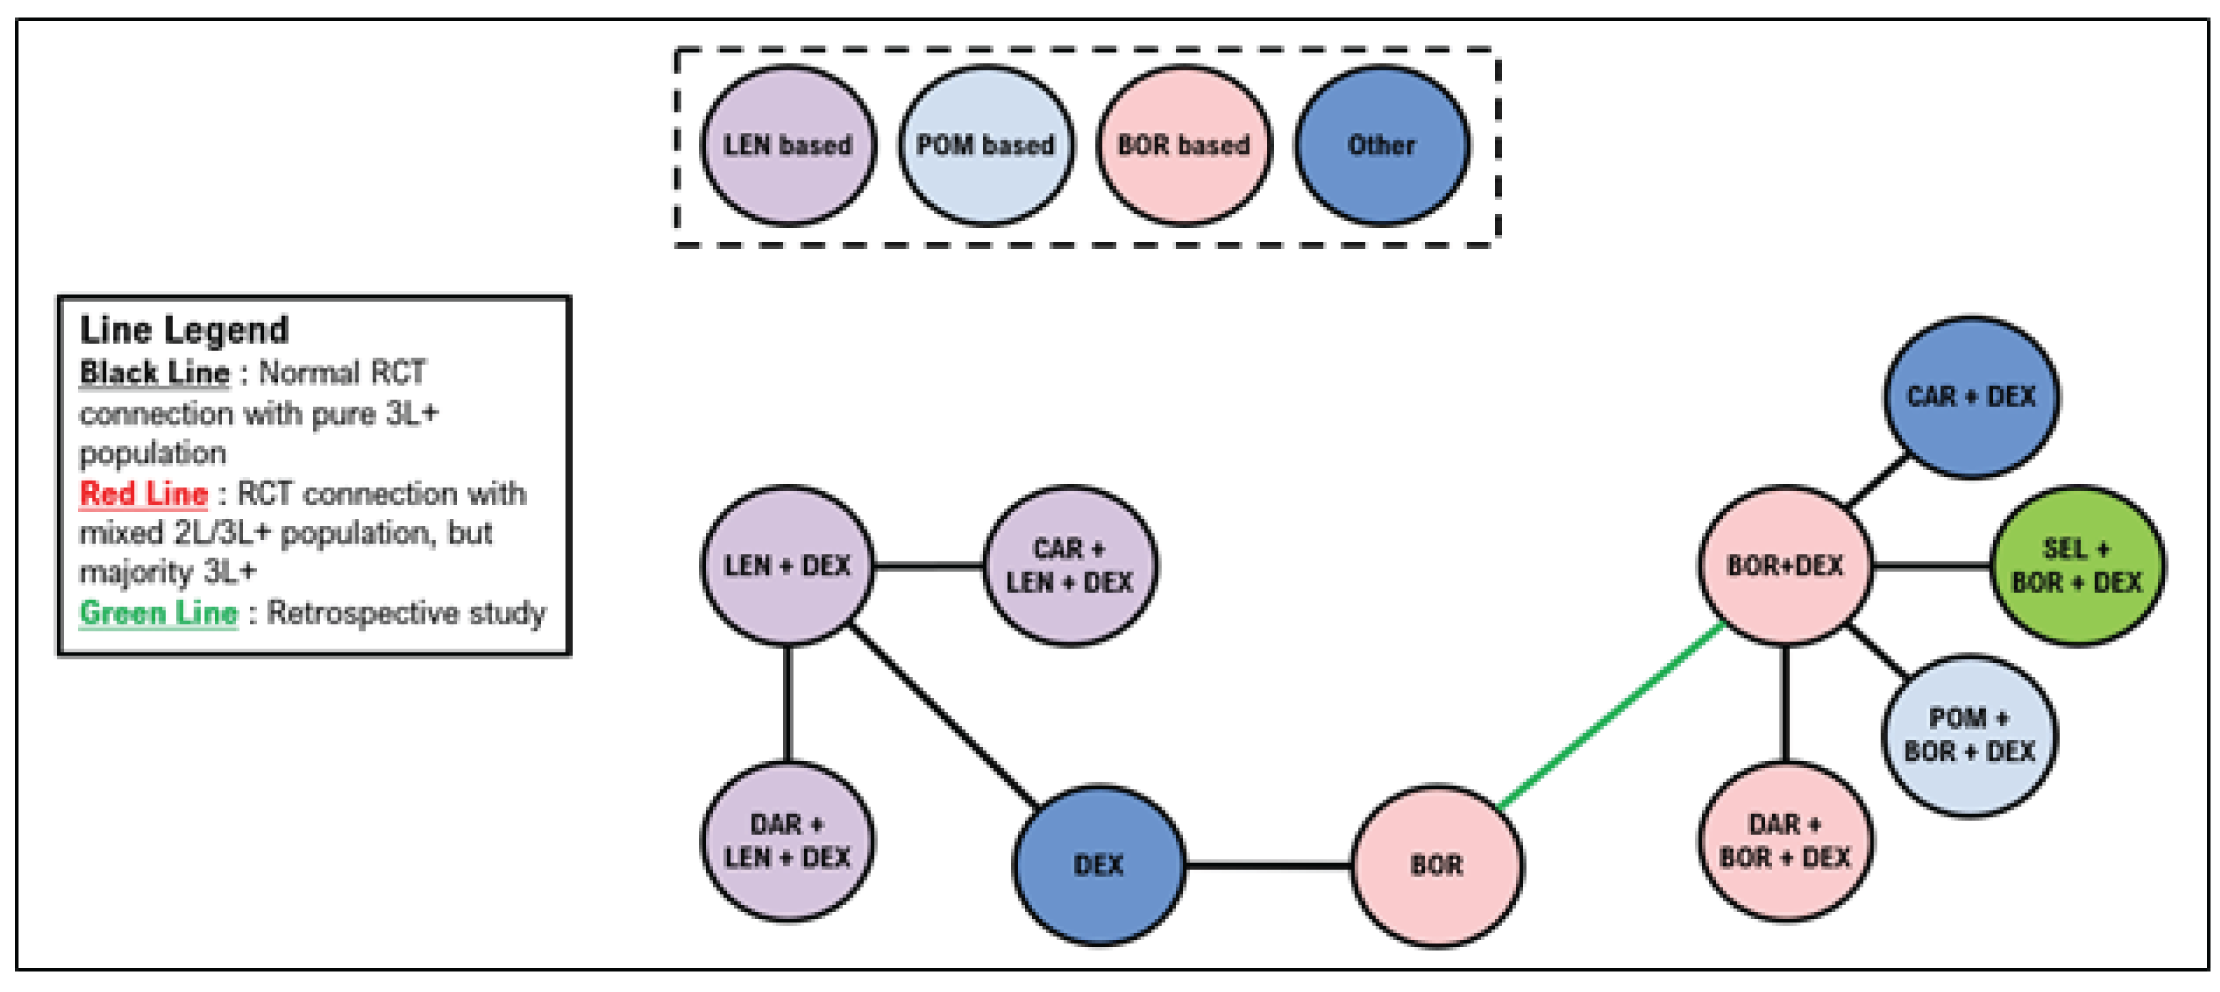
2L = second line; 3L+ = third or later line; BOR = bortezomib; CAR = carfilzomib; CYC = cyclophosphamide; DAR = daratumumab; DEX = dexamethasone; LEN = lenalidomide; PFS = progression-free survival; POM = pomalidomide; RCT = randomized controlled trial; SEL = selinexor.
Source: Sponsor’s indirect treatment comparison.22
Figure 23: OS Treatment Network —Third Line or Later
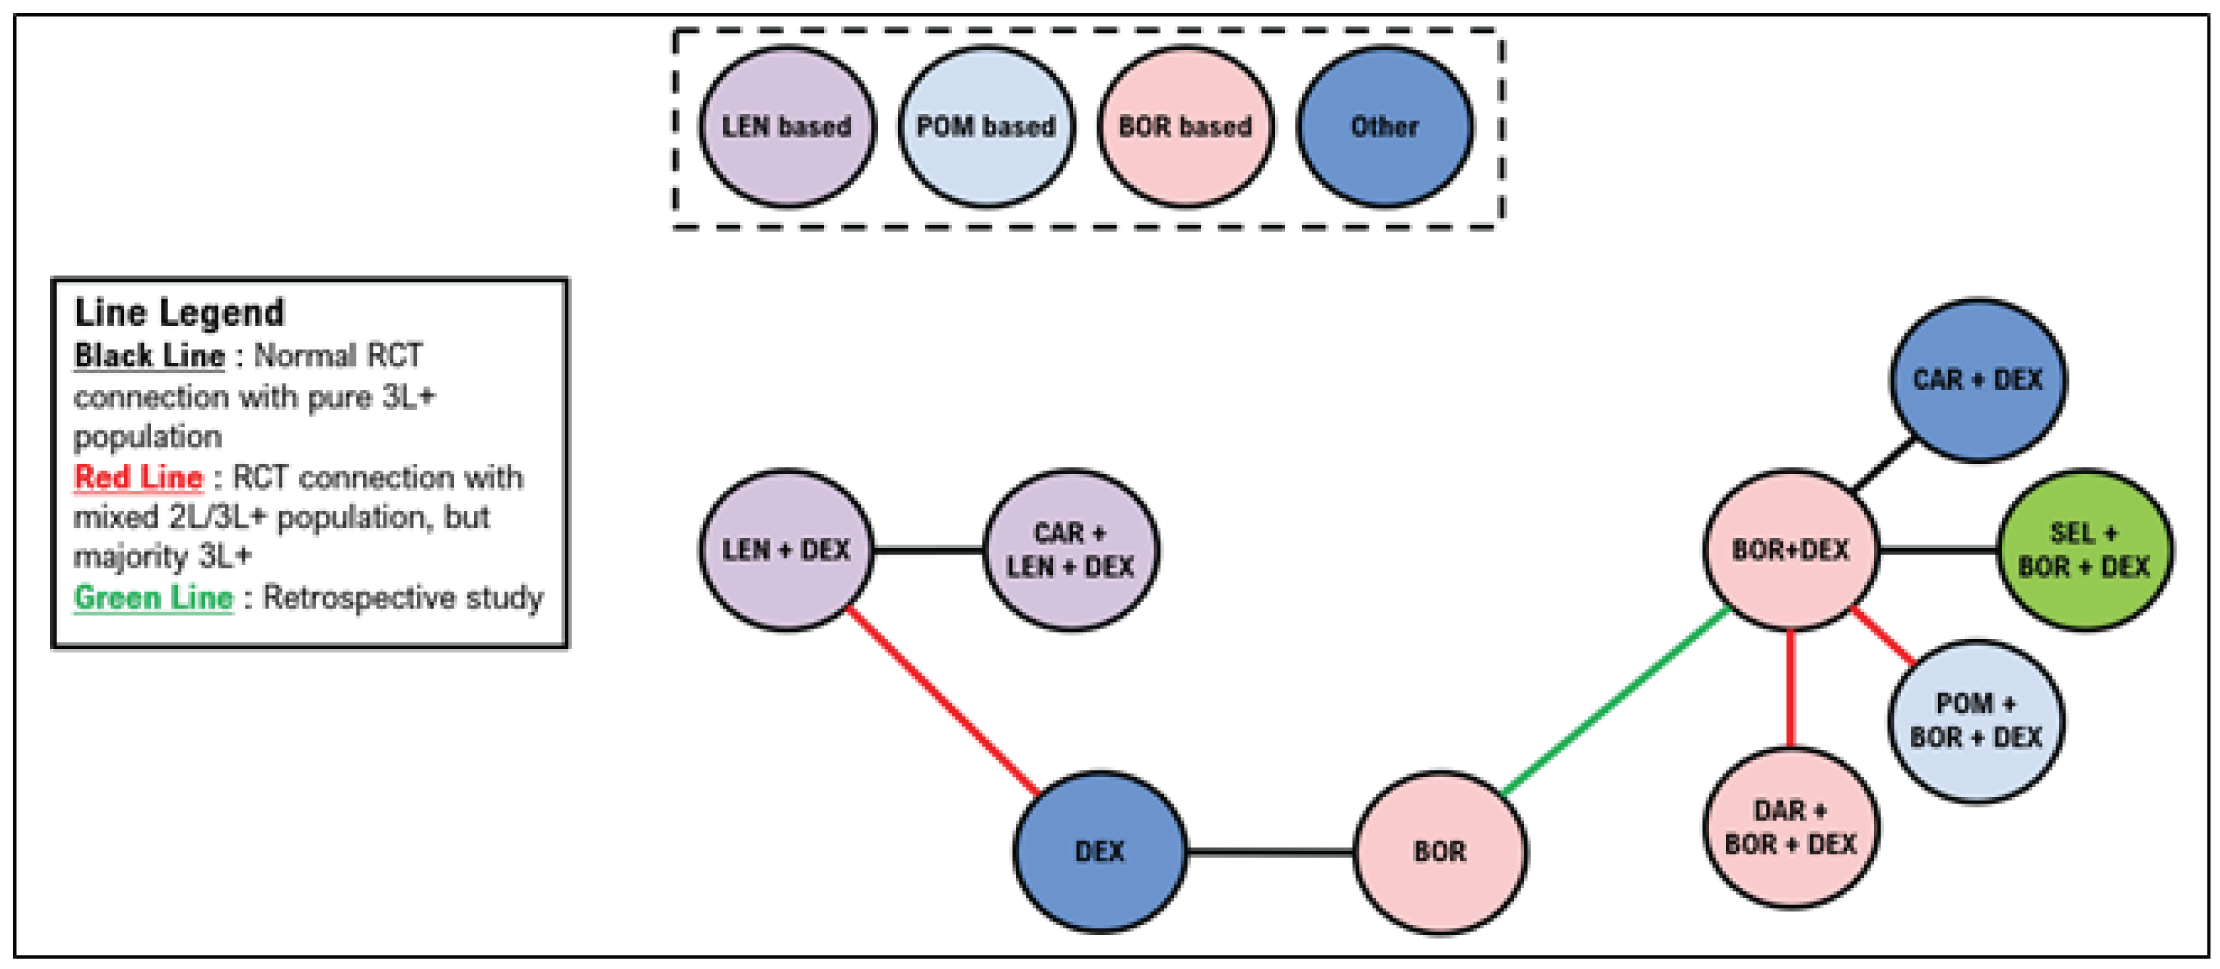
2L = second line; 3L+ = third or later line; BOR = bortezomib; CAR = carfilzomib; CYC = cyclophosphamide; DAR = daratumumab; DEX = dexamethasone; LEN = lenalidomide; OS = overall survival; POM = pomalidomide; RCT = randomized controlled trial; SEL = selinexor.
Source: Sponsor’s indirect treatment comparison.22
Figure 24: Objective Response Rate Treatment Network — Third Line or Later
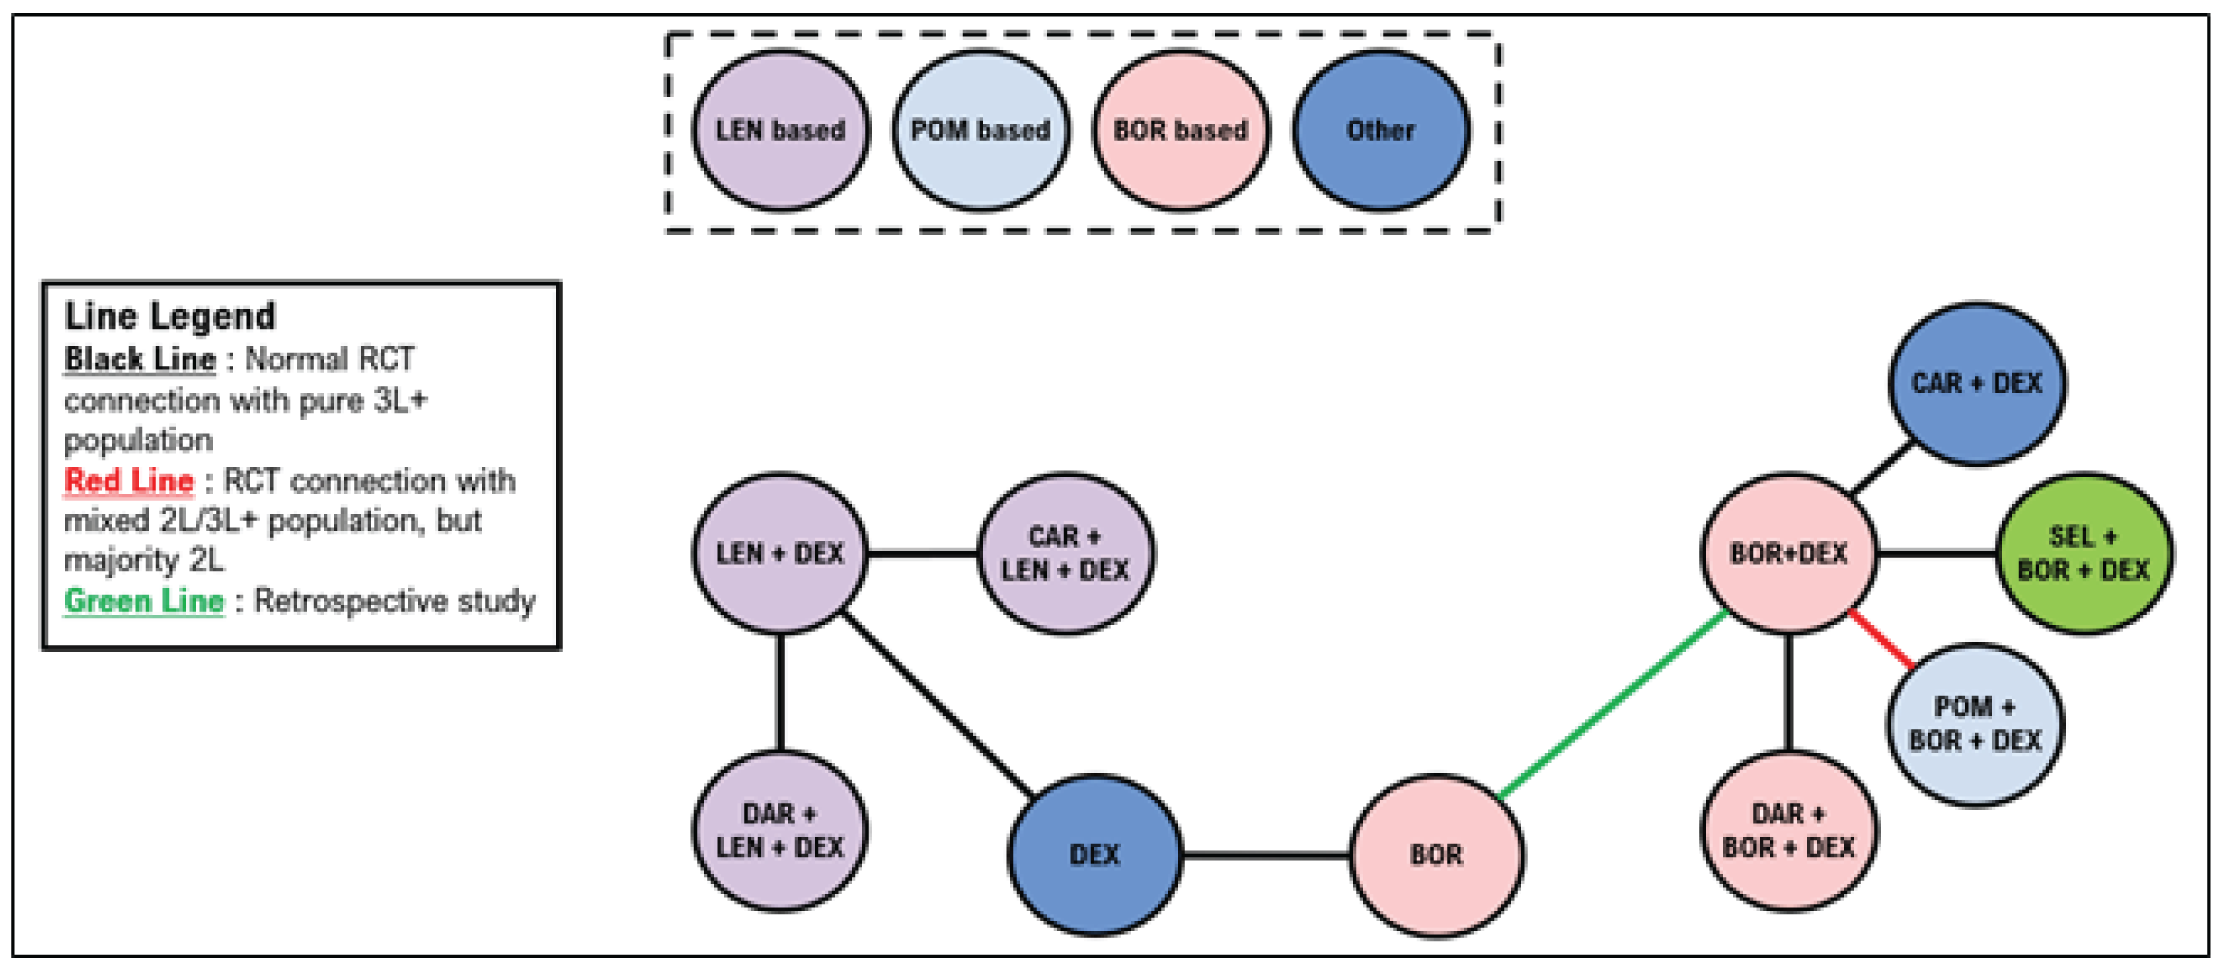
2L = second line; 3L+ = third or later line; BOR = bortezomib; CAR = carfilzomib; CYC = cyclophosphamide; DAR = daratumumab; DEX = dexamethasone; LEN = lenalidomide; ORR = objective response rate; POM = pomalidomide; RCT = randomized controlled trial; SEL = selinexor.
Source: Sponsor’s indirect treatment comparison.22
Results
The analyses conducted by the sponsor includes regimens were not considered relevant by the CADTH team. Only comparisons against regimens specified in the CADTH systematic review protocol will be reported.
Progression-Free Survival
A summary of PFS results in the second line is provided in Table 36. Compared to Vd, ||||||||||||||||||||||||||||||||||||||||||||||||||||||||||||||||||||||||||||||||||||||||||||||||||||||||||||||||||||||||||||||||||||||||||||||||||||||||||||||||||||||||||||||||||||||||||||||||||||||||||||||||||||||||||||||||||||||||||||||||||||||||||||||||||||||||||||||||||||||||||.
Pairwise comparisons are illustrated in Figure 25. Pairwise comparisons against selinexor ||||||||||||||||||||||||||||||||||||||||||||||||||||||||||||||||||||||||||||||||||||||||||||||||||||||||||||||||||||||||||||||||||||||||||||||||||||||||||||||||||||||||||||||||||||||||||.
Table 36: PFS Results of the Sponsor’s NMA — Second Line
Treatment | Treatment abbreviation | Hazard ratio (95% CrI, vs. Vd) |
|---|---|---|
|||||||||||||||||||||||||||||| | |||||||||||||||||||||||||||||| | |||||||||||||||||||||||||||||| |
|||||||||||||||||||||||||||||| | |||||||||||||||||||||||||||||| | |||||||||||||||||||||||||||||| |
|||||||||||||||||||||||||||||| | |||||||||||||||||||||||||||||| | |||||||||||||||||||||||||||||| |
CrI = credible interval; Vd = bortezomib plus dexamethasone.
Source: Sponsor’s indirect treatment comparison.22
Figure 25: Pairwise Comparison of PFS in the Sponsor’s ITC — Second Line

Note: This figure has been redacted as per the sponsor’s request.
Source: Sponsor’s indirect treatment comparison.22
A summary of PFS results in the third line is provided in Table 37. Compared to Vd, ||||||||||||||||||||||||||||||||||||||||||||||||||||||||||||||||||||||||||||||||||||||||||||||||||||||||||||||||||||||||||||||||||||||||||||||||||||||||||||||||||||||||||||||||||||||||||||||||||||||||||||||||||||||||||||||||||||||||||||||||||||||||||||||||||||||||||||||.
Pairwise comparisons are illustrated in Figure 26. Pairwise comparisons against selinexor ||||||||||||||||||||||||||||||||||||||||||||||||||||||||||||||||||||||||||||||||||||||||||||||||||||||||||||||||||||||||.
Table 37: PFS Results of the Sponsor’s NMA — Third Line
Treatment | Treatment abbreviation | Hazard ratio (95% CrI, vs. Vd) |
|---|---|---|
||||||||||||||||||||||||||||||||||| | |||||||||||||| | ||||||||||||||||||||||||||||||||||| |
||||||||||||||||||||||||||||||||||| | |||||||||||||| | ||||||||||||||||||||||||||||||||||| |
||||||||||||||||||||||||||||||||||| | |||||||||||||| | ||||||||||||||||||||||||||||||||||| |
Note: This table has been redacted
Source: Sponsor’s indirect treatment comparison.22
Figure 26: Pairwise Comparison of PFS in the Sponsor’s ITC — Third Line

Note: This figure has been redacted as per the sponsor’s request.
Source: Sponsor’s indirect treatment comparison.22
Overall Survival
A summary of OS results for the second line is provided in Table 38. |||||||||||||||||||||||||||||||||||||||||||||||||||||||||||||||||. Pairwise comparisons are illustrated in Figure 27. |||||||||||||||||||||||||||||||||||||||||||||||||||||||||||||||||||||||||||||||||||||||||||||||||||||||||||||||||||||.
Table 38: Overall Survival Results of the Sponsor’s NMA — Second Line
Treatment | Treatment abbreviation | Hazard ratio (95% CrI, vs. BOR + DEX) |
|---|---|---|
||||||||||||||||||||||||||||||||||| | |||||||||||||| | ||||||||||||||||||||||||||||||||||| |
||||||||||||||||||||||||||||||||||| | |||||||||||||| | ||||||||||||||||||||||||||||||||||| |
||||||||||||||||||||||||||||||||||| | |||||||||||||| | ||||||||||||||||||||||||||||||||||| |
Note: Redacted rows have been deleted.
Source: Sponsor’s indirect treatment comparison.22
Figure 27: Pairwise Comparison of Overall Survival in the Sponsor’s ITC — Second Line

Note: This figure has been redacted as per the sponsor’s request.
Source: Sponsor’s indirect treatment comparison.22
A summary of OS results in the third line is provided in Table 39. Compared to Vd, |||||||||||||||||||||||||||| ||||||||||||||||||||||||||||||||||||||||||||||||||||||||||||||||||||||||||||||||||||. The remaining regimens ||||||||||||||||||||||||||||||||||||||||||||||||||||||||||||||||||||||. Pairwise comparisons are illustrated in Figure 28. Pairwise comparisons against selinexor suggested that ||||||||||||||||||||||||||||||||||||||||||||||||||||||||||||||||||||||||||||||||||||||||||||||||||||||||||||||||.
Table 39: OS Results of the Sponsor’s Network Meta-Analysis — Third Line
Treatment | Treatment abbreviation | Hazard ratio (95% CrI, vs. BOR + DEX) |
|---|---|---|
||||||||||||||||||||||||||||||||||| | |||||||||||||| | ||||||||||||||||||||||||||||||||||| |
||||||||||||||||||||||||||||||||||| | |||||||||||||| | ||||||||||||||||||||||||||||||||||| |
||||||||||||||||||||||||||||||||||| | |||||||||||||| | ||||||||||||||||||||||||||||||||||| |
BOR = bortezomib; CrI = credible interval; DEX = dexamethasone.
Note: Redacted rows have been deleted.
Source: Sponsor’s indirect treatment comparison.22
Figure 28: Pairwise Comparison of OS in the Sponsor’s ITC — Third Line

Note: This figure has been redacted as per the sponsor’s request.
Source: Sponsor’s indirect treatment comparison.22
Objective Response Rate
A summary of ORR results in the second line is provided in Table 40. Compared to Vd, ||||||||||||||||||||||||||||||||||||||||||||||||||||||||||||||||||||||||||||||||||||||||||||||||||||||||||||||||||||||||||||||||||||||||||||||||||||||||||||||||||||||||||||||||||||||||||||||||||||||||||||||||||. Pairwise comparisons for ORR in the second line are illustrated in Figure 24. Pairwise comparisons suggested that ORR were |||||||||||||||||||||||||||||||||||||||||||||||||||||||||||||||||||||||||||||||||||||||||||||||||||||||||||||||||||||||||||||||||||||||||||||||||||.
Table 40: Objective Response Rate Results of the Sponsor’s NMA — Second Line
Treatment | Treatment abbreviation | Odds ratio (95% CrI, vs. BOR + DEX) |
|---|---|---|
||||||||||||||||||||||||||||||||||| | |||||||||||||| | ||||||||||||||||||||||||||||||||||| |
||||||||||||||||||||||||||||||||||| | |||||||||||||| | ||||||||||||||||||||||||||||||||||| |
||||||||||||||||||||||||||||||||||| | |||||||||||||| | ||||||||||||||||||||||||||||||||||| |
BOR = bortezomib; CrI = credible interval; DEX = dexamethasone; NMA = network meta-analysis.
Note: Redacted rows have been deleted.
Source: Network meta-analysis.22
Figure 29: Pairwise Comparison of ORR in the Sponsor’s ITC — Second Line

Note: This figure has been redacted as per the sponsor’s request.
Source: Sponsor’s indirect treatment comparison.22
A summary of ORR results in the third line is provided in Table 41. Compared to Vd, |||||||||||||||||||||||||||||||||||||||||||||||||||||||||||||||||||||||||||||||||||||||||||||||||||||||||||||||||||||||||||||||||||||||||||||||||||||||||||||||||||||||||||||||||||||||||||||. Pairwise comparisons for ORR in the third line are illustrated in Figure 30. Pairwise comparisons suggested that ORR were ||||||||||||||||||||||||||||||||||||||||||||||||||||||||||||||||||||||||||||||||||||||||||||||||||||||||||||||||||||||||||||||.
Table 41: Objective Response Rate Results of the Sponsor’s Network Meta-Analysis — Third Line
Treatment | Treatment abbreviation | Odds ratio (95% CrI, vs. BOR + DEX) |
|---|---|---|
||||||||||||||||||||||||||||||||||| | |||||||||||||| | ||||||||||||||||||||||||||||||||||| |
||||||||||||||||||||||||||||||||||| | |||||||||||||| | ||||||||||||||||||||||||||||||||||| |
||||||||||||||||||||||||||||||||||| | |||||||||||||| | ||||||||||||||||||||||||||||||||||| |
BOR = bortezomib; CrI = credible interval; DEX = dexamethasone; ORR = objective response rate.
Note: Redacted rows have been deleted.
Source: Sponsor’s indirect treatment comparison.22
Figure 30: Pairwise Comparison of Objective Response Rate in the Sponsor’s ITC — Third Line

Note: This figure has been redacted as per the sponsor’s request.
Source: Sponsor’s indirect treatment comparison.22
Critical Appraisal of the Sponsor’s ITC
The sponsor included 17 trials in its ITC. There is likely high heterogeneity across study and patient characteristics. Differences in these study and patient characteristics may result in uncertainty in the analyses as the studies may not necessarily be comparable. For example, the sponsor reported a wide range of treatment durations among the included trials; longer treatment duration may result in longer PFS that may over- and underestimate the treatment effects of certain regimens. In addition, the proportion of patients in different lines of therapy may not be similar across treatment groups within studies and across studies. It is likely that variations in patient characteristics were present in the trials and unaccounted for.
The clinical experts consulted by CADTH for this review also emphasized the importance of considering subgroups of patients who would be lenalidomide-exposed versus lenalidomide-refractory. The sponsor did not conduct any sensitivity analyses to determine the differences in treatment effect for these patient groups. These patient subgroups were highlighted as it is expected that most patients living in Canada will receive a regimen based on lenalidomide in the first line, and subsequent therapy should consider patient’s initial response to first-line therapy.
The systematic review to identify studies for inclusion in the NMA was based on a protocol developed a priori. The original search was conducted in 2020 but updated in October 2021; it is therefore likely that all studies capturing the efficacy of treatments for patients with RRMM were identified. The clinical experts consulted by CADTH for this review also confirmed that it is unlikely that additional evidence published after October 2021 would be identified. However, methodology regarding screening of articles and data extraction were not described in detail.
Networks of evidence were separated by line of therapy (second line and third line or later), which was considered appropriate given that patients in later lines of therapy tend to have worse outcomes. However, within networks, studies that included a mix of patients in multiple lines of therapy were included in networks in which the majority of patients represented patients in either second or later lines of therapy. This may introduce bias as patients in earlier or later lines of therapies can influence each network differently. Patients receiving second-line therapy may overestimate the efficacy of treatments included in studies in the networks of third or later lines of therapy, while patients receiving later lines of therapy may underestimate the efficacy of treatments included in the second-line networks. The clinical experts consulted by CADTH for this review confirmed that line of therapy is an important prognostic factor that can influence patient outcomes, and that patients in earlier lines of therapy are likely to have better outcomes compared with patients in later lines of therapy.
The studies were phase II or III trials, and earlier-phased trials may not be powered to test for hypotheses; the inclusion of phase II trials is expected to introduce bias into the NMAs that may not be present in phase III trials, which are typically designed to detect differences between treatment groups. Also, the retrospective matched-pair analysis was included to link bortezomib to Vd (no RCTs were available for this link). Inclusion of this retrospective study therefore does not satisfy the transitivity assumption of the ITC as all other studies were clinical trials. The sponsor considered the connection between bortezomib and Vd to be necessary, and therefore included this retrospective matched-case analysis to allow for comparisons of included regimens. The inclusion of this retrospective matched-case analysis is expected to introduce considerable uncertainty into the NMAs.
Overall, the networks of the NMAs were complex, leading to a high degree of variability. Methodological limitations are likely to have introduced further uncertainty into the analyses. For example, the sponsor did not conduct adjustments for crossovers. Crossovers to investigational treatment from a control are expected to underestimate the treatment effect observed in that trial and influence the analyses of the ITC. Important effect modifiers were not controlled for, and subgroup analyses were not performed due to the small sample sizes. However, the lack of adjustment may introduce bias that can affect treatment comparisons.
All NMAs were stated to be conducted using random-effects models; however, fixed-effects models were used where there were a small number of studies and in instances of nonconvergence. While fixed-effects models may be appropriate when there is a large amount of heterogeneity across studies, a limited number of studies were used for each comparison, with only 1 study available to inform each comparison in some cases. In addition, some of the studies had small sample sizes. Due to the small number of studies informing each comparison, it is possible that fixed-effects models may have been more appropriate. Fit statistics were not reported for each model run, making it unclear whether the choice of random- or fixed-effects models was appropriate. It is also unclear whether random- or fixed-effects models were used for each network as this information was not reported.
The following end points were assessed in the ITC provided by the sponsor: OS, PFS, and objective response rate. These end points were considered appropriate by the CADTH methods team. The clinical experts confirmed that these end points are relevant for consideration in this treatment space. However, the other end points of safety and HRQoL, which may be important when patients and clinicians consider treatment choice, were not assessed. Without these comparisons, it is not clear how toxicities may influence choice of treatments.
The risk-of-bias assessment showed that, in general, most studies had a low risk of bias across most domains using the Cochrane Collaboration tool. While the sponsor’s assessment of most studies suggests that the risk of bias due to study quality may be low, it is still possible that biases from these studies included in the sponsor’s NMAs influenced the overall networks. The extent of this bias is unclear.
Methods of ITC by Dolph et al.
Objectives
The objective of Dolph et al. (2021)21 was to evaluate the efficacy of once-weekly selinexor with once-weekly bortezomib and low-dose dexamethasone relative to other therapies in patients with previously treated MM.
Study Selection Methods
The authors conducted a systematic review to identify relevant studies for the NMA. A summary of study selection methods is provided in Table 34. The CADTH team noted that the publication by Dolph et al.21 used the same study selection methodology as the ITC submitted to CADTH by the sponsor for this review.
ITC Analysis Methods
Details of the ITC methods conducted by Dolph et al. are reported in Table 42. The sponsor’s ITC and the publication by Dolph et al. conducted similar analyses.
Table 42: Methods for the ITC Analysis by Dolph et al.
Method | Sponsor’s indirect treatment comparison |
|---|---|
Indirect treatment comparison methods | The network meta-analysis used a Bayesian framework |
Priors | Non-informative priors were used and initiated after a burn-in of 40,000 iterations while posterior distributions were based on 200,000 iterations |
Assessment of model fit | Not reported |
Assessment of consistency | Conducted by comparisons of study and patient characteristics |
Assessment of convergence | Not reported |
Outcomes | PFS, OS, and objective response rate |
Construction of nodes | Networks for each outcome were constructed based on studies that included second-line patient only or studies included patients treated in the third-line or after. Studies were included in networks where the proportion of patients represented the majority in a specific line of therapy. For example, studies that contained > 50% of patients in the third line or later were included in the networks for third line. |
Sensitivity analyses | An ad hoc scenario analysis was conducted which limited the studies to those which contained bortezomib-based regimens |
Subgroup analysis | None |
Methods for pairwise meta-analysis | Treatment effects were compared using HRs for PFS and OS end points, and risk ratios for the objective response rate end point with associated credible intervals; all comparisons were made against bortezomib plus dexamethasone |
HR = hazard ratio; OS = overall survival; PFS = progression-free survival.
Source: Dolph et al. (2021).21
Results of ITC by Dolph et al.
Summary of Included Studies
The studies included based on the systematic review conducted by Dolph et al. were the same as those reported for the sponsor’s ITC. Results for the systematic review were reported previously.
A total of 21 studies were included in the network for PFS for the second line, including 14 RCTs with only second-line patients, 5 studies with a mixed population but in which the majority were second-line patients, and 2 studies in which the majority of patients were in the third line or later. The 2 studies with a majority of third-line or later patients were stated to be necessary to connect dexamethasone with Rd. A total of 24 studies were included in the network for PFS in the third line or later, including 19 studies with outcomes reported exclusively in the third line or later. Four studies included patients in the second line and third line or later, and 1 study included exclusively second-line patients but was necessary to link Vd with bortezomib.
A total of 15 studies were included in the network for OS in the second line; 4 of these studies reported only second-line OS information. A mixed population was enrolled for 9 studies in which the majority of patients were in the second-line, and 1 study enrolled primarily patients in the third line or later. A total of 22 studies were included in the network for OS in the third line, including 11 studies that reported outcomes in the third line or later, and 10 studies with a mixed population but in which the majority were in the third line or later. One study reported results exclusively in the second line but was required to connect bortezomib with Vd.
A total of 20 studies were included in the network for objective response rate in the second line, including 12 RCTs reporting outcomes exclusively in the second line. A mixed population was reported in 8 of the studies with a majority of second-line patients. A total of 27 studies were included in the network for objective response rate in the third line, including 17 studies that reported outcomes exclusively in the third line or later. A mixed population was reported for 9 studies with the majority of patients being in the third line or later. One study was included that reported exclusively second-line results but was required to link bortezomib with Vd.
Risk of Bias
A risk-of-bias assessment was not reported.
Results
The authors reported comparisons between many treatments, some of which are not commonly used in Canadian clinical practice. Only results pertaining to interventions specified in the CADTH systematic review protocol are reported here.
Progression-Free Survival
Results for PFS for the second, third, or later line are depicted in Figure 31. In the second line, compared to Vd, the greatest benefit was suggested to be from DVd, followed by DRd, and Kd. There were no differences between the remaining treatments of interest, including SVd. In the third line, compared to Vd, favoured treatments included DRd, DVd, Kd, and PVd. There were no differences between the remaining treatments of interest, including SVd. The specific estimates for comparisons were not provided.
Figure 31: Progression-Free Survival Results Stratified by Treatment Line From Dolph et al. (2021)
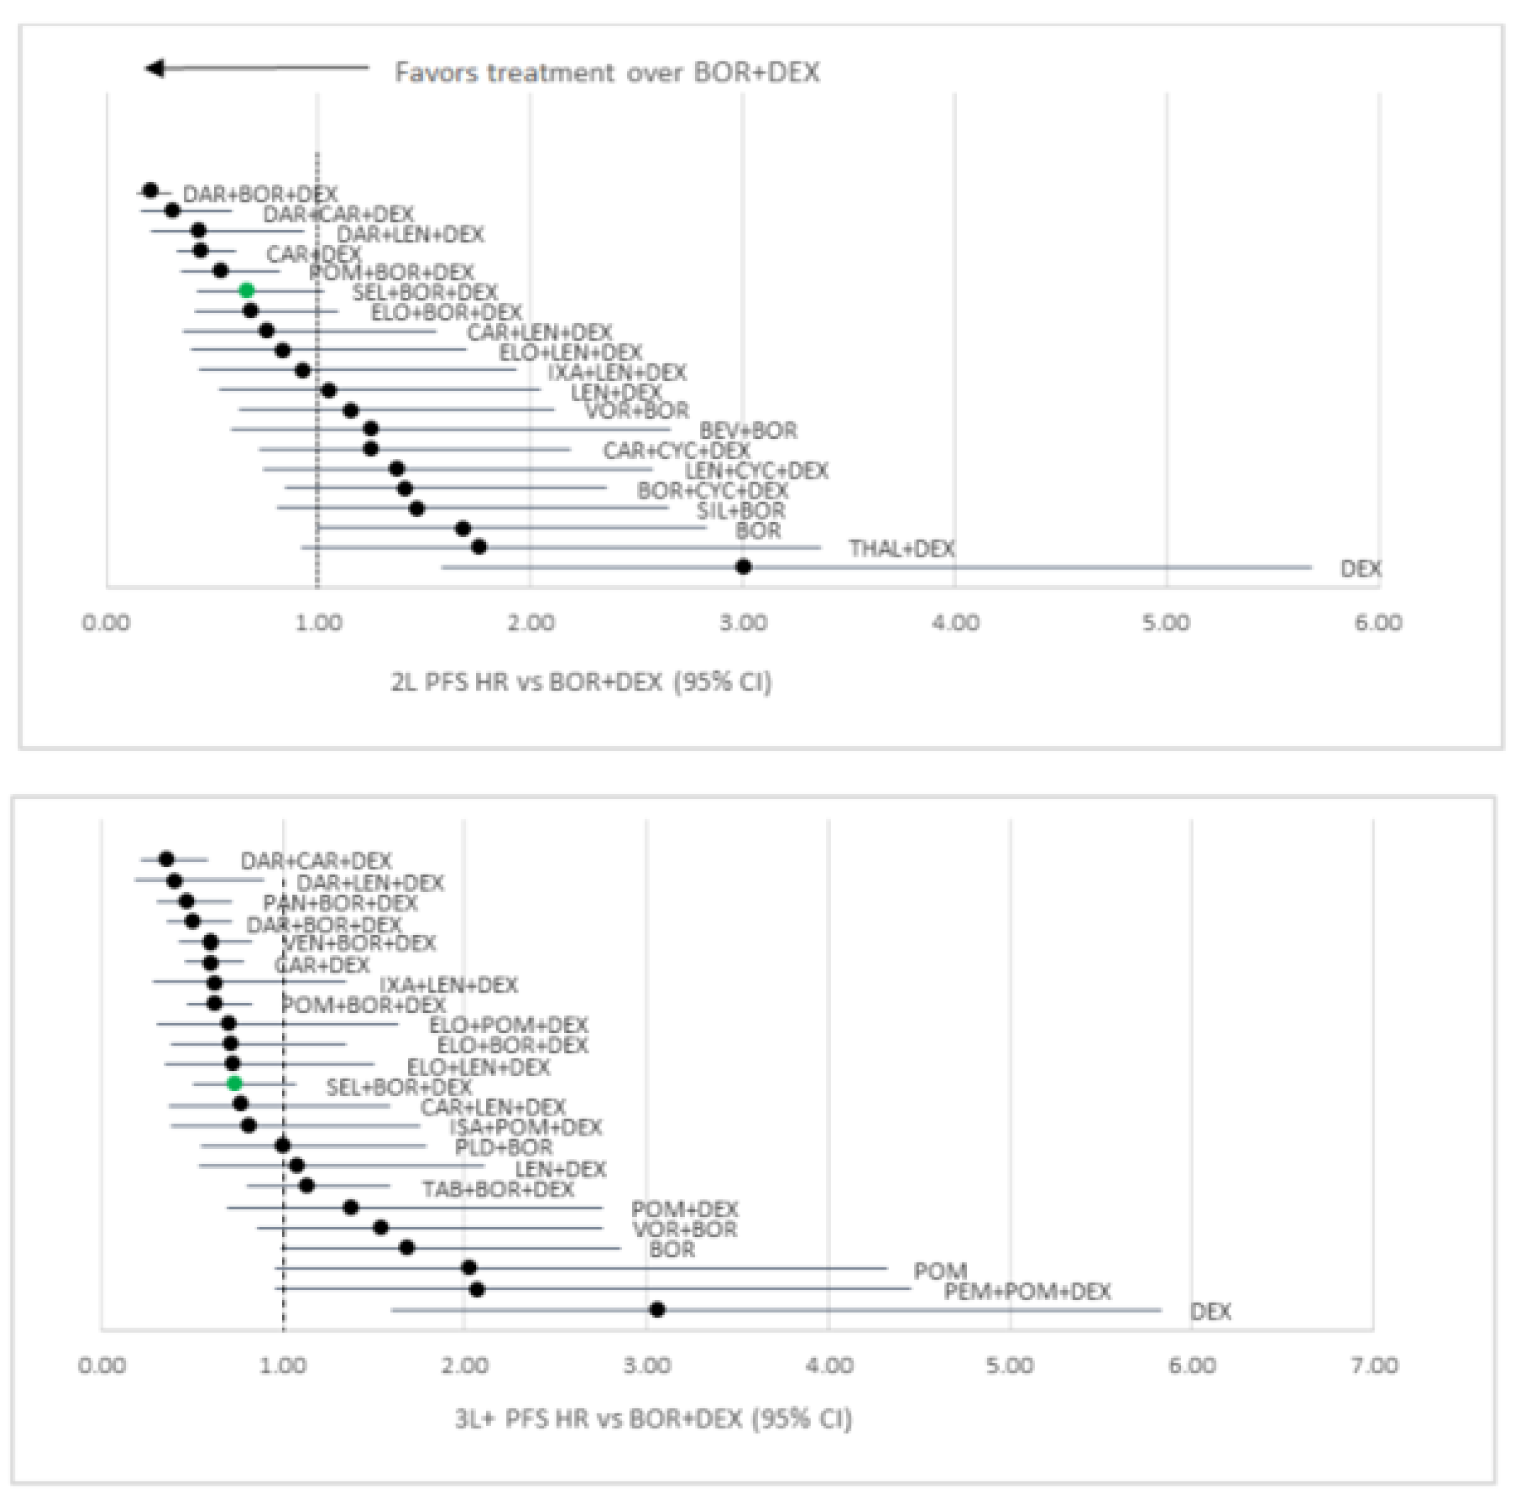
BEV+BOR = bevacizumab plus bortezomib; BOR = bortezomib; BOR+CYC+DEX = bortezomib plus cyclophosphamide plus dexamethasone; BOR+DEX = bortezomib plus dexamethasone; CAR+CYC+DEX = carfilzomib plus cyclophosphamide plus dexamethasone; CAR+DEX = carfilzomib plus dexamethasone; CAR+LEN+DEX = carfilzomib plus lenalidomide plus dexamethasone; DAR+BOR+DEX = daratumumab plus bortezomib plus dexamethasone; DAR+CAR+DEX = daratumumab plus carfilzomib plus dexamethasone; DAR+LEN+DEX = daratumumab plus lenalidomide plus dexamethasone; DEX = dexamethasone; ELO+BOR+DEX = elotuzumab plus bortezomib plus dexamethasone; ELO+LEN+DEX = elotuzumab plus lenalidomide plus dexamethasone; ELO+POM+DEX = elotuzumab plus pomalidomide plus dexamethasone; ISA+POM+DEX = isatuximab plus pomalidomide plus dexamethasone; IXA+LEN+DEX = ixazomib plus lenalidomide plus dexamethasone; LEN+CYC+DEX = lenalidomide plus cyclophosphamide plus dexamethasone; LEN+DEX = lenalidomide plus dexamethasone; PAN+BOR+DEX = panobinostat plus bortezomib plus dexamethasone; PEM+POM+DEX = pembrolizumab plus pomalidomide plus dexamethasone; PLD+BOR = pegylated liposomal doxorubicin plus bortezomib; POM = pomalidomide; POM+BOR+DEX = pomalidomide plus bortezomib plus dexamethasone; POM+DEX = pomalidomide plus dexamethasone; SEL+BOR+DEX = selinexor plus bortezomib plus dexamethasone; SIL+BOR = siltuximab plus bortezomib; TAB+BOR+DEX = tabalumab plus bortezomib plus dexamethasone; THAL+DEX = thalidomide plus dexamethasone; VEN+BOR+DEX = venetoclax plus bortezomib plus dexamethasone; VOR+BOR = vorinostat plus bortezomib.
Source: Dolph et al. (2021).21 This work is licensed under the Attribution 4.0 International Licence (CCBY-4.0).
Overall Survival
Results for OS for the second, third, or later line are depicted in Figure 32. There were no differences between treatments in the second line, including SVd. In the third line, DVd, DKd, and Kd were favoured over Vd. The remaining treatments, including SVd, did not show any differences. The treatment effects were not reported.
Overall Response Rate
Results for ORR for the second, third, or later line are depicted in Figure 33. In the second line, treatments favoured over Vd included DKd, DVd, and SVd. There were no differences among the remaining interventions of interest. In the third line, DVd, DKd, and Kd were favoured over Vd. The remaining treatments, including SVd, did not show any differences. The treatment effects were not reported.
Figure 32: Overall Survival Results Stratified by Treatment Line From Dolph et al. (2021)
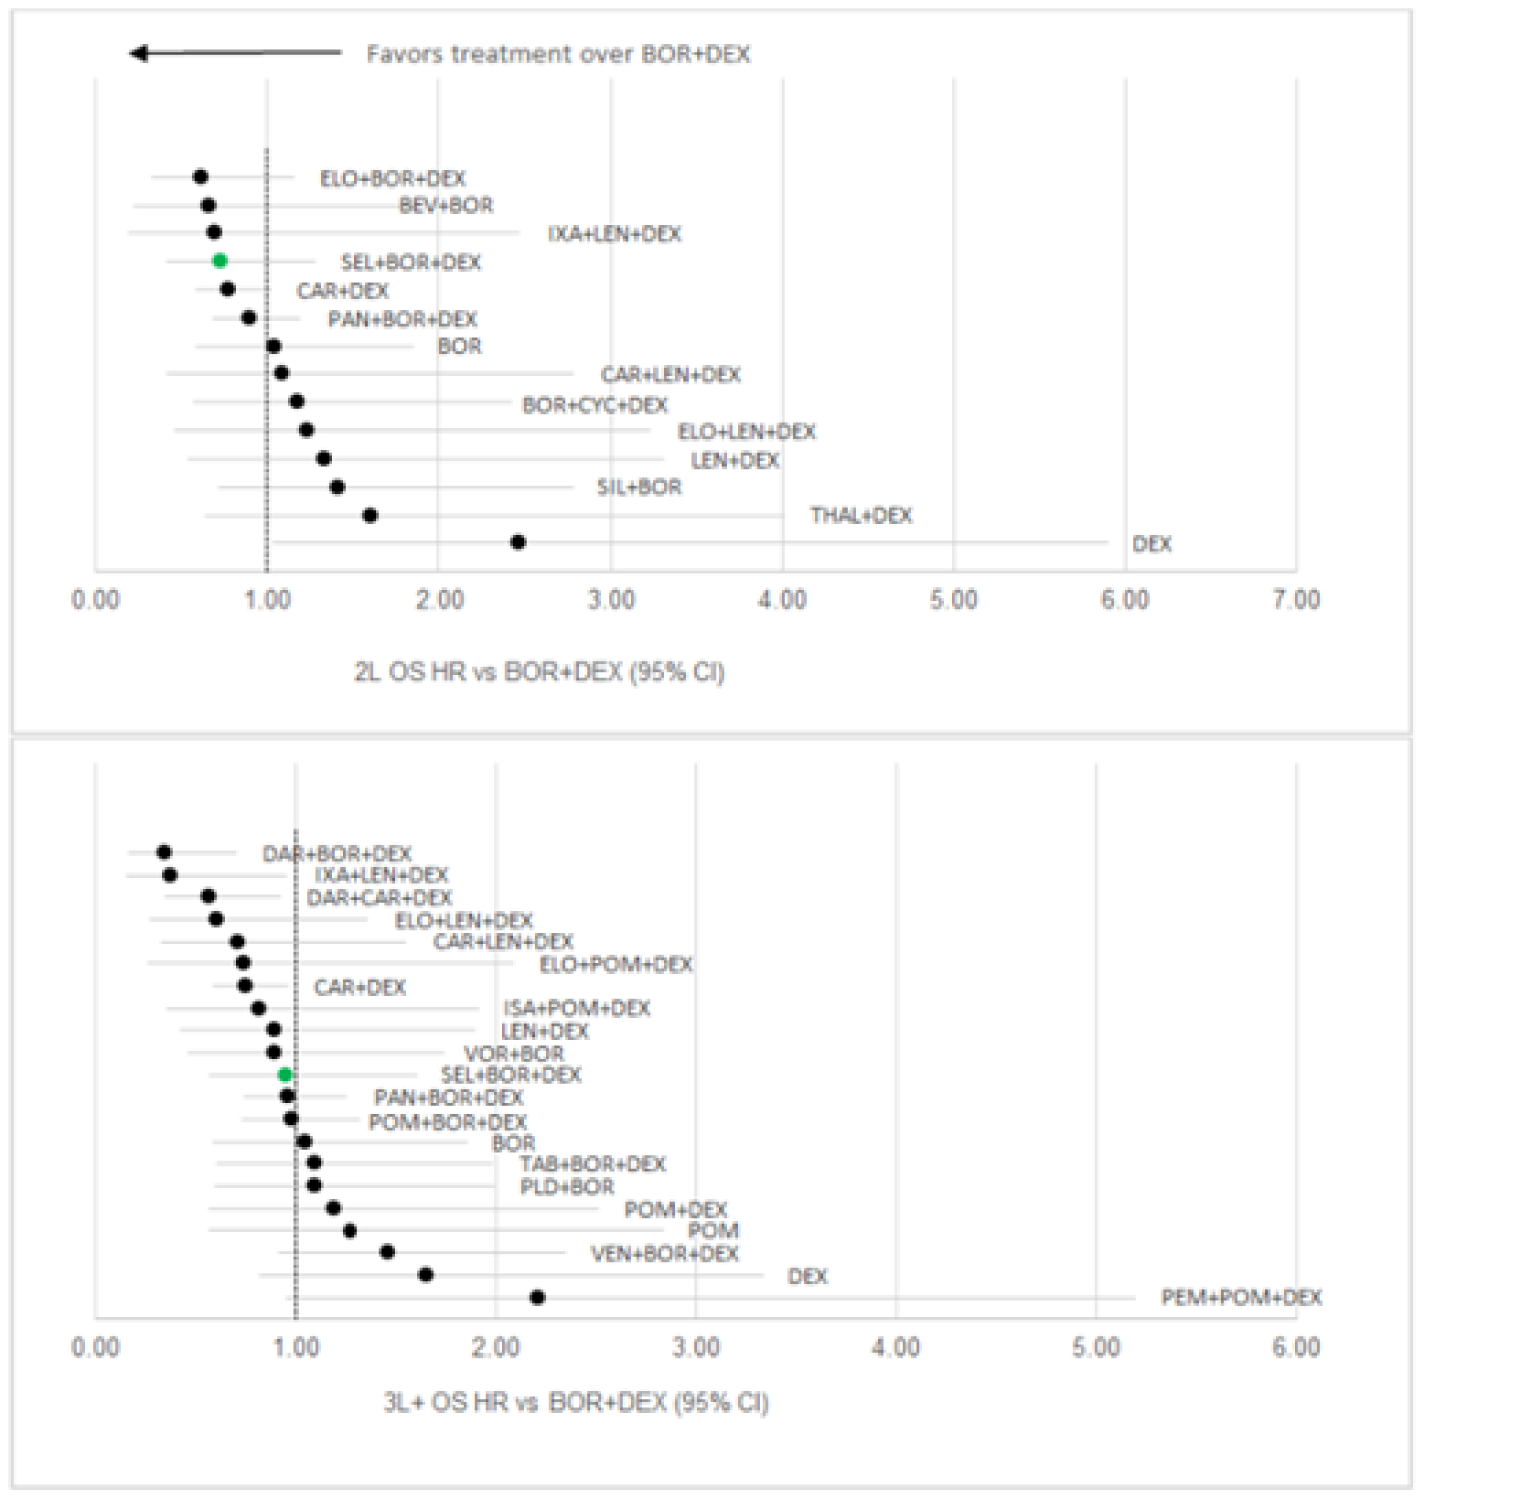
BEV+BOR = bevacizumab plus bortezomib; BOR = bortezomib; BOR+CYC+DEX = bortezomib plus cyclophosphamide plus dexamethasone; BOR+DEX = bortezomib plus dexamethasone; CAR+DEX = carfilzomib plus dexamethasone; CAR+LEN+DEX = carfilzomib plus lenalidomide plus dexamethasone; DAR+BOR+DEX = daratumumab plus bortezomib plus dexamethasone; DAR+CAR+DEX = daratumumab plus carfilzomib plus dexamethasone; DEX = dexamethasone; ELO+BOR+DEX = elotuzumab plus bortezomib plus dexamethasone; ELO+LEN+DEX = elotuzumab plus lenalidomide plus dexamethasone; ELO+POM+DEX = elotuzumab plus pomalidomide plus dexamethasone; ISA+POM+DEX = isatuximab plus pomalidomide plus dexamethasone; IXA+LEN+DEX = ixazomib plus lenalidomide plus dexamethasone; LEN+DEX = lenalidomide plus dexamethasone; PAN+BOR+DEX = panobinostat plus bortezomib plus dexamethasone; PLD+BOR = pegylated liposomal doxorubicin plus bortezomib; POM = pomalidomide; POM+BOR+DEX = pomalidomide plus bortezomib plus dexamethasone; POM+DEX = pomalidomide plus dexamethasone; SEL+BOR+DEX = selinexor plus bortezomib plus dexamethasone; SIL+BOR = siltuximab plus bortezomib; TAB+BOR+DEX = tabalumab plus bortezomib plus dexamethasone; THAL+DEX = thalidomide plus dexamethasone; VEN+BOR+DEX = venetoclax plus bortezomib plus dexamethasone VOR+BOR = vorinostat plus bortezomib.
Source: Dolph et al. (2021).21 This work is licensed under the Attribution 4.0 International Licence (CCBY-4.0).
Figure 33: Objective Response Rate Results Stratified by Treatment Line From Dolph et al. (2021)
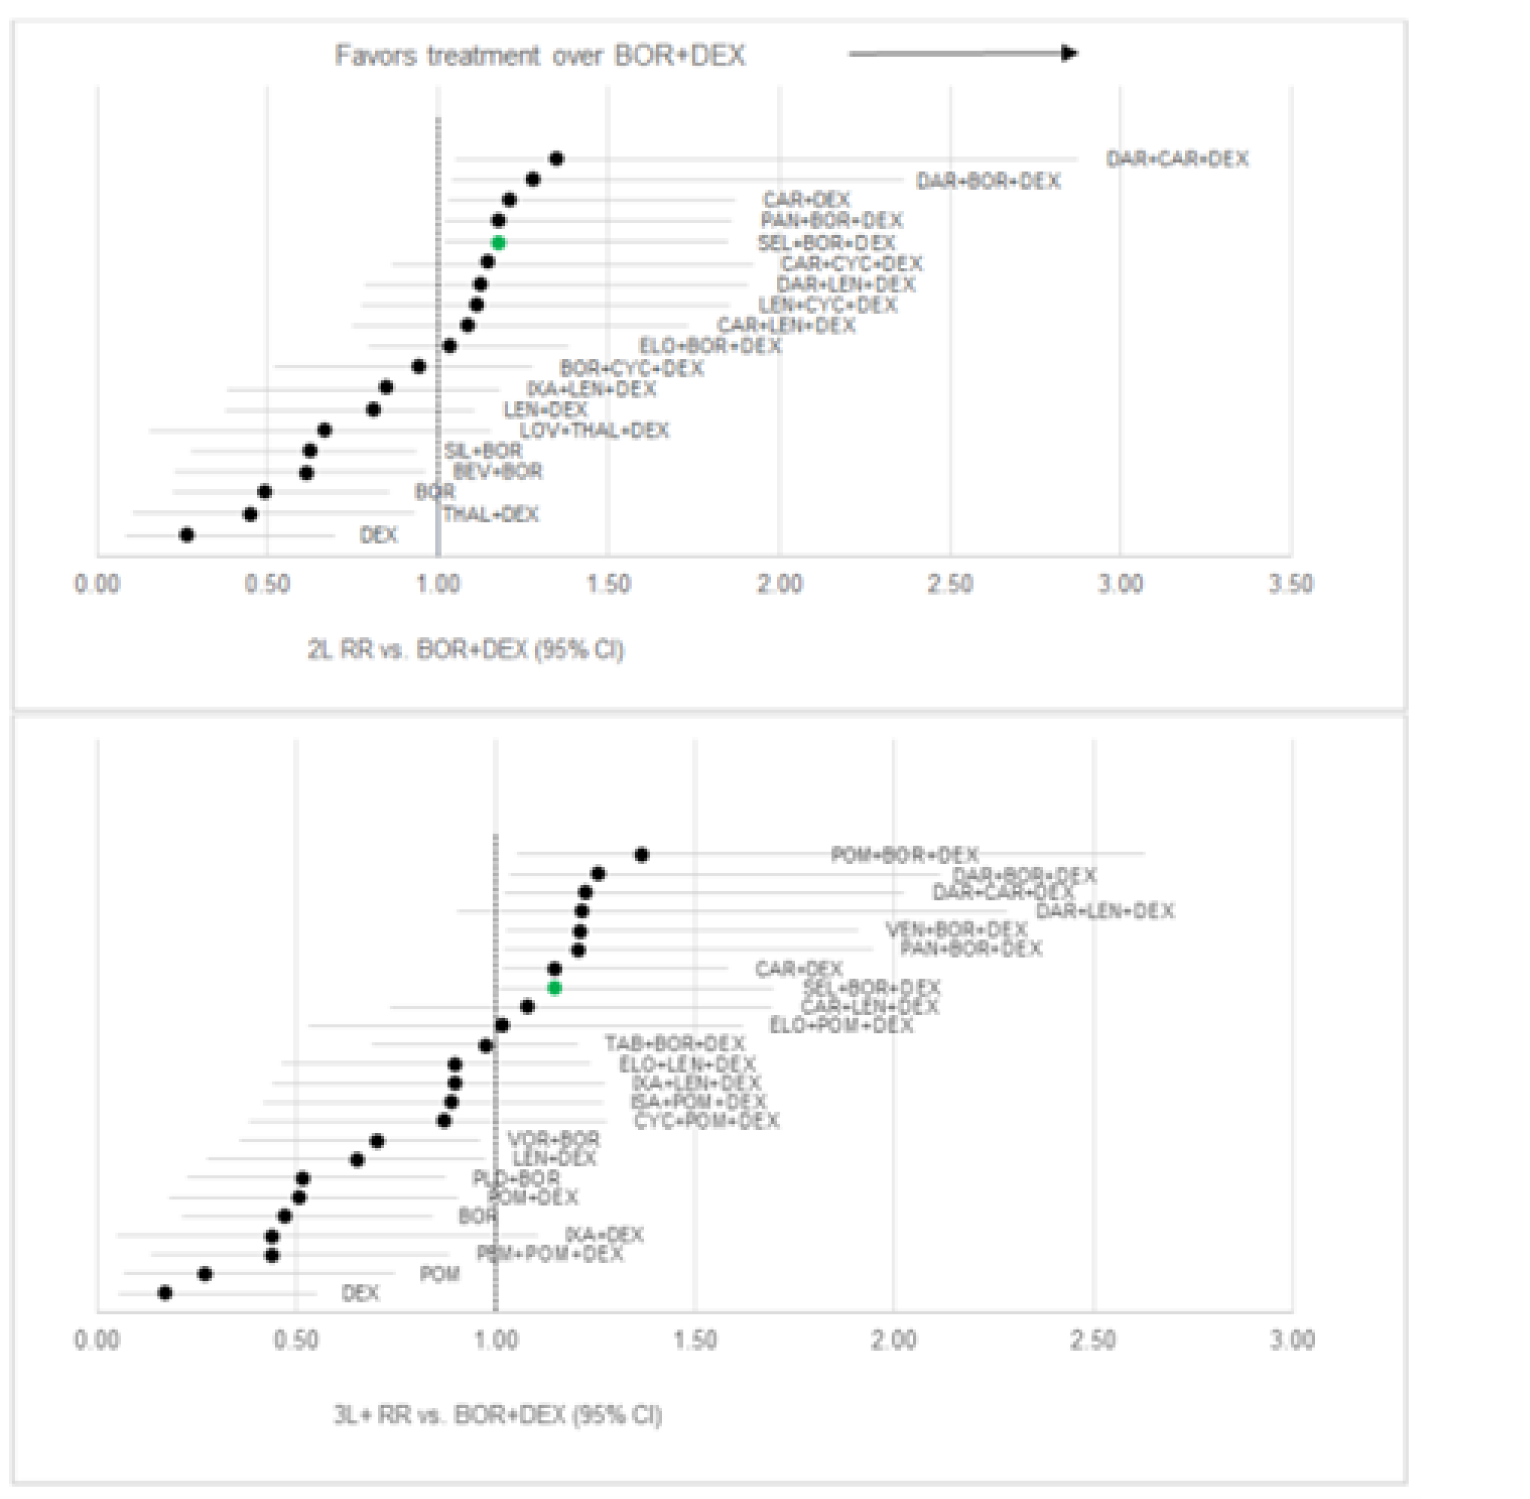
BEV+BOR = bevacizumab plus bortezomib; BOR = bortezomib; BOR+CYC+DEX = bortezomib plus cyclophosphamide plus dexamethasone; BOR+DEX = bortezomib plus dexamethasone; CAR+CYC+DEX = carfilzomib plus cyclophosphamide plus dexamethasone; CAR+DEX = carfilzomib plus dexamethasone; CAR+LEN+DEX = carfilzomib plus lenalidomide plus dexamethasone; CYC+POM+DEX = cyclophosphamide plus pomalidomide plus dexamethasone; DAR+BOR+DEX = daratumumab plus bortezomib plus dexamethasone; DAR+CAR+DEX = daratumumab plus carfilzomib plus dexamethasone; DAR+LEN+DEX = daratumumab plus lenalidomide plus dexamethasone; DEX = dexamethasone; ELO+BOR+DEX = elotuzumab plus bortezomib plus dexamethasone; ELO+LEN+DEX = elotuzumab plus lenalidomide plus dexamethasone; ELO+POM+DEX = elotuzumab plus pomalidomide plus dexamethasone; ISA+POM+DEX = isatuximab plus pomalidomide plus dexamethasone; IXA+DEX = ixazomib plus dexamethasone; IXA+LEN+DEX = ixazomib plus lenalidomide plus dexamethasone; LEN+CYC+DEX = lenalidomide plus cyclophosphamide plus dexamethasone; LEN+DEX = lenalidomide plus dexamethasone; LOV+THAL+DEX = lovastatin plus thalidomide plus dexamethasone; PAN+BOR+DEX = panobinostat plus bortezomib plus dexamethasone; PEM+POM+DEX = pembrolizumab plus pomalidomide plus dexamethasone PLD+BOR = pegylated liposomal doxorubicin plus bortezomib; POM = pomalidomide. POM+BOR+DEX = pomalidomide plus bortezomib plus dexamethasone; POM+DEX = pomalidomide plus dexamethasone; SEL+BOR+DEX = selinexor plus bortezomib plus dexamethasone; SIL+BOR = siltuximab plus bortezomib; TAB+BOR+DEX = tabalumab plus bortezomib plus dexamethasone; VEN+BOR+DEX = venetoclax plus bortezomib plus dexamethasone; VOR+BOR = vorinostat plus bortezomib.
Source: Dolph et al. (2021).21 This work is licensed under the Attribution 4.0 International Licence (CCBY-4.0).
Critical Appraisal of ITC by Dolph et al.
The ITC conducted by Dolph et al. was similar to the ITC provided by the sponsor. As the methodology was very similar to the ITC provided by the sponsor, the comparability of results to the sponsor’s submitted ITC were made. In general, results reported the same or similar conclusions regarding favoured treatments and the efficacy of SVd relative to other interventions. The consistency between these 2 analyses indicates that the analyses conducted by the sponsor and Dolph et al. are replicable. However, limitations associated with the sponsor’s ITC are linked to the ITC conducted by Dolph et al. Critiques of the sponsor’s ITC are reported above and should also be considered for the ITC published by Dolph et al.
In addition to the appraisal points mentioned previously, the authors conducted an additional NMA including only regimens containing Vd. This was preferred methodologically as it did not rely on a retrospective study to link treatments and allowed for comparisons between regimens with 1 shared common anchor; in this case, all regimens were compared to Vd. The authors also stated that this analysis was highly relevant as lenalidomide is used in most patients as a first-line option and would not likely be used in later lines. Therefore, lenalidomide-based regimens are likely not important comparators in the second and later line. The clinical experts consulted by CADTH for this review supported this statement and agreed that lenalidomide-based regimens would most likely be used in the first line and would not be competing with other regimens in the second or later lines. However, the authors did not report specific results; therefore, it is unclear exactly which interventions were favoured over the others.
The authors also reported that the CASTOR study, which was included in some networks, incorporated 2 trial characteristics that were not consistent with usual clinical practice and magnified the effect of daratumumab in the study. Specifically, the CASTOR study administered bortezomib twice weekly when most clinical practice administer bortezomib once weekly, and the trial required that bortezomib be discontinued after 24 weeks in both the DVd and Vd treatment groups, resulting in treatment with daratumumab to be compared to no treatment after the 24 weeks. The clinical experts consulted by CADTH for this review also confirmed that treatment with bortezomib is often administered beyond 24 weeks (or 8 cycles) for patients who can tolerate and respond well to treatment. The CADTH team agreed that this is likely to have amplified the treatment effects of daratumumab, and biased results which did support most daratumumab-based regimens in the NMAs.
A risk-of-bias assessment was not reported by the authors. Therefore, it is not possible to know the extent of bias that could have affected the analyses due to the studies.
Methods of ITC by Arcuri et al.
Objectives
The objective of Arcuri et al. (2021)20 was to conduct an NMA to review available evidence of novel treatments for RRMM in the setting of new drugs, and to identify the most efficacious treatment combinations.
Study Selection Methods
The authors conducted a systematic review to identify relevant studies for the NMA. A summary of study selection methods is provided in Table 34.
ITC Analysis Methods
Details of the ITC methods conducted by Arcuri et al. are reported in Table 43.
Table 43: Methods for the ITC Analysis by Arcuri et al.
Method | Indirect treatment comparison |
|---|---|
ITC methods | An NMA with fixed effects was conducted, unless the I2 values greater than 40%, in which case random-effects models were used; further details regarding the ITC methods were not provided |
Priors | Not reported |
Assessment of model fit | Not reported |
Assessment of consistency | Heterogeneity was assessed using the I2 value |
Assessment of convergence | Not reported |
Outcomes | PFS, OS, SAE, grade 3 and 4 AEs |
Construction of nodes | All studies included in the ITC included the same comparator group which was either Vd or Rd; 3 studies were included with a comparator group of Pd and Kd; all treatments could be compared for each outcome as they were all connected through the “same” comparator group |
Sensitivity analyses | Sensitivity analyses were conducted which categorized the control groups by immunomodulatory agent-based regimens (lenalidomide or pomalidomide) or PIs (bortezomib or carfilzomib) |
Subgroup analysis | None |
Methods for pairwise meta-analysis | Treatment effects were compared using HRs for PFS and OS end points. Odds ratios were used for comparisons of SAEs |
AE = adverse event; HR = hazard ratio; ITC = indirect treatment comparison; HR = hazard ratio; Kd = carfilzomib plus dexamethasone; OS = overall survival; Pd = pomalidomide plus dexamethasone; PFS = progression-free disease; PI = proteosome inhibitor; Rd = lenalidomide plus dexamethasone SAE = serious adverse event; Vd = bortezomib plus dexamethasone.
Source: Arcuri et al. (2021).20
Results of ITC by Arcuri et al.
Summary of Included Studies
A total of 914 records were retrieved through the systematic review. Of all records retrieved through the systematic review, 18 were included for qualitative and quantitative analyses by the authors.
Six studies included lenalidomide in the control group and 8 studies included bortezomib in the control group; only 3 studies did not include either of these treatments, and instead included carfilzomib (n = 1) or pomalidomide (n = 2) in the control group. Interventions assessed in the studies included vorinostat (n = 1), panobinostat (n = 1), pomalidomide (n = 1), pegylated doxorubicin (n = 1), cyclophosphamide (n = 1), elotuzumab (n = 1), pembrolizumab (n = 1), autologous stem cell transplantation (n = 1), venetoclax (n = 1), carfilzomib (n = 2), ixazomib (n = 2), daratumumab (n = 3), isatuximab (n = 1), and selinexor (n = 1). Studies included a range of median follow-ups from 6 months to 36.8 months. The studies also included patient who had received a range of 1 to 3 prior therapies. Studies were published between 2007 and 2020. No further assessment of heterogeneity was conducted by the authors.
Refer to Arcuri et al. (2021)20 for a depiction of the network of evidence used for the indirect comparison.
Risk of Bias
The risk-of-bias assessment conducted by the authors suggested that an overall medium level of bias among the studies was likely. Studies were generally given a low risk of bias assessment regarding selective reporting and allocation concealment. Most studies had a low risk of bias for blinding of outcome assessments, except for a few that were rated as having a high or unclear risk of bias. Many studies were also rated as having an unclear risk of bias regarding random sequence generation. All studies were rated as having an unclear risk of bias regarding incomplete outcome data, and most studies had a high risk of bias regarding blinding of patients and personnel.20
Results
The analyses conducted by Arcuri et al.20 included many treatments. Only the comparisons between treatments specified in the CADTH systematic review protocol are reported here.
Progression-Free Survival
No differences were reported between selinexor and any of the comparators of interest, including carfilzomib (HR = 0.86; 95% credible interval [CrI], 0.50 to 1.48), daratumumab (HR = 0.65; 85% CrI, 0.38 to 1.10), high-dose chemotherapy (HR = 1.24; 95% CrI, 0.65 to 2.38), isatuximab (HR = 0.85; 95% CrI, 0.44 to 1.65), ixazomib (HR = 0.98; 95% CrI, 0.55 to 1.75), and pomalidomide (HR = 0.97; 95% CrI, 0.50 to 1.87). The heterogeneity measured for PFS, as assessed by the I2, was 64%.
Overall Survival
Estimates for comparisons between each treatment were not provided for OS. A forest plot depicting the results for OS are depicted in Arcuri et al. (2021).20 In general, most treatments indicated no difference.
Serious Adverse Events
The analysis for SAEs did not include selinexor; therefore, these results are not reported.
Critical Appraisal of Indirect Treatment Comparison by Arcuri et al.
There is likely high variation in patient characteristics across the trials. The authors did not report a thorough assessment of heterogeneity. However, variations were reported across trial characteristics. Studies were published between 2007 and 2020; treatment practices of 2007 are likely not the same as current treatment practices, and the patient groups being compared are likely not the same, given the introduction of new therapies that alter the treatment pathways for patients and their outcomes. Differences in treatment duration were not accounted for in the analyses. The authors acknowledged that prolonged treatment duration may lead to increased PFS and higher rates of near-complete or complete responses. In addition, the I2 value for analyses of PFS was 64%, suggesting a high rate of heterogeneity. It is possible that effect modifiers that could affect efficacy analyses may be present but unaccounted for. For example, the authors included patients across multiple lines of therapies. The clinical experts consulted by CADTH for this review confirmed that patients in later lines of therapy will likely have poorer outcomes; differences in patients across different lines of therapy may under- or overestimate the treatment effects. Variations in patients across the trials likely introduced bias that was not accounted for, and that considerable uncertainty was present in the analysis, as indicated by the wide confidence intervals of the comparisons of treatment effects.
The risk-of-bias assessment conducted by the authors suggested that methodological considerations may have introduced additional uncertainty to the analyses. For example, most trials were unblinded as they were open-label trials which may introduce bias in favour of investigational therapies over a control group. However, it was unclear if the studies used methods to counter the effects of bias related to open-label trials. For example, the BOSTON trial used an IRC for subjective outcomes, such as PFS, to prevent bias that may occur through analyses conducted by the investigator. The authors did not comment on whether other studies employed similar methods. Many studies were also rated as having an unclear risk of bias regarding random sequence generation. Random sequence generation is used to ensure that patients are randomized to each treatment group in a method that is fair and unbiased. However, the assessment conducted by the authors suggests that some bias related to this could result in over- or underestimation of treatment effects in those studies. Overall, it is likely that there is a risk of bias from these studies that could have affected the analyses of the ITC.
It is unclear how many studies included in the authors’ analyses contained mature data, for OS in particular. Specifically, the BOSTON trial, which assessed SVd, did not have mature OS data. Therefore, comparisons of OS with selinexor are likely biased. The authors also acknowledged that other studies may have had survival data which were not yet mature. The results for OS should be interpreted with caution.
The authors connected studies through a common comparator group of either Rd or Vd based on the assumption that these 2 treatments are equally effective. This allowed the authors to create a single control group and a shorter path for the indirect comparisons. which in turn allowed for greater power to detect differences. However, 3 studies incorporated into this comparison group did not include either Rd or Vd as a comparator, and instead included Kd or Pd. The authors conducted a sensitivity analyses that separated the control group into 2 categories: 1 group including regimens based on lenalidomide and pomalidomide, and a second including regimens based on bortezomib. The authors concluded that the 2 treatments were equivalent, which further supported their decision to group these categories together. The clinical experts consulted by CADTH for this review did not agree with the assumption that Rd and Vd were equally effective treatments. The clinical experts also disagreed that Kd and Pd were equally effective treatments; however, they acknowledged that use of Pd would occur after treatment with Rd, and that Pd would be expected to be less efficacious for patients as it is used in a later line in patients previously treated with an immunomodulatory drug. Therefore, the CADTH team considered comparisons conducted in this ITC to be inappropriate, as data for treatments that are not considered equivalent were combined to create connections between regimens.
In general, details regarding the methodology used by the authors for the ITC were sparse, and it is not possible to provide a full appraisal of these methods. The authors did not report on whether they adjusted for crossover in the trials, although it is unlikely. Treatment crossover could have biased the efficacy analyses of these trials. However, it was reported that the authors conducted NMAs with fixed effects unless the I2 values were greater than 40%, in which case random-effects models were used. The I2 value of the NMA for PFS was 64%, which indicates that a random-effects model was used. The analyses of OS and SAEs were reported to have an I2 value of 0; however, a random-effects model was used for the analysis of OS. The use of random effects was considered appropriate given the number of comparators and the high amount of heterogeneity; however, without an assessment of model convergence and consistency it is not possible to definitively determine which model was best for these analyses.
The authors did not conduct a proportional hazards assessment. Analyses of PFS and OS are typically conducted with Cox models that rely on the assumption of proportional hazards. The validity of results may be questioned when this assumption is violated. It is unclear how many studies included in the ITC showed deviation of this assumption.
The authors conducted comparisons for PFS, OS, and AEs. This was considered appropriate given that physicians and patients consider both the efficacy and toxicities of treatments when determining the best choice of therapy for patients.
Methods of Botta et al.
Objectives
The purpose of the ITC by Botta et al. was to compare direct and indirect evidence on the efficacy of 7 different lenalidomide-sparing regimens (Vd, DVd, Kd, DKd, PVd, Isa-Kd, and SVd) in patients exposed to lenalidomide and in those refractory to lenalidomide to support clinical decision-making.
Study Selection Methods
The details for study selection methods in Botta et al. (2021) were not clearly reported.
ITC Analysis Methods
Details about the ITC methods were not provided in detail by the authors. An NMA was reportedly conducted using frequentist methods.
Results of ITC by Botta et al.
Summary of Included Studies
Six phase III RCTs (CASTOR, ENDEAVOR, OPTIMISM, CANDOR, IKEMA, and BOSTON) were included, representing 1,615 RRMM patients who were previously exposed to lenalidomide and 984 patients who were refractory to lenalidomide.6 The authors reported that studies were well balanced for the presence of patients refractory to lenalidomide; these patients accounted for approximately 70% of patients, except in the CASTOR trial, in which 50% of the patients were refractory to lenalidomide. Studies were also well balanced in terms of exposure to bortezomib, accounting for approximately 65% of patients, except for patients in the IKEMA trial, in which 85% to 93% of the patients had previous exposure to bortezomib. The proportions of patients in second-line therapy were well balanced across trials and accounted for approximately 45% of patients in the trials.6 No further assessment of study and patient characteristics was provided.
Results
Progression-Free Survival
Results for PFS (Figure 34) suggest that hat PFS among lenalidomide-exposed patients was favoured, with Isa-Kd (HR = 0.34; 95% CI, 0.18 to 0.64) followed by KDd (HR = 0.36; 95% CI, 0.22 to 0.61), DVd (HR = 0.38; 95% CI, 0.26 to 0.56), PVD (HR = 0.61; 95% CI, 0.49 to 0.76), SVd (HR = 0.63; 95% CI, 0.41 to 0.96), and Kd (HR = 0.69; 95% CI, 0.52 to 0.92) compared to Vd.6
Among patients who were refractory to lenalidomide, PFS was favoured with treatment with DVd (HR = 0.36; 95% CI, 0.21 to 0.62) followed by KDd (HR = 0.38; 95% CI, 0.21 to 0.68), Isa-Kd (HR = 0.48; 95% CI, 0.25 to 0.92), and PVd (HR = 0.65; 95% CI, 0.50 to 0.84) compared to Vd. There was no difference observed between Kd (HR = 0.80; 95% CI, 0.57 to 1.12) and Vd.6
Figure 34: Network Meta-Analysis Results for PFS by Botta et al.
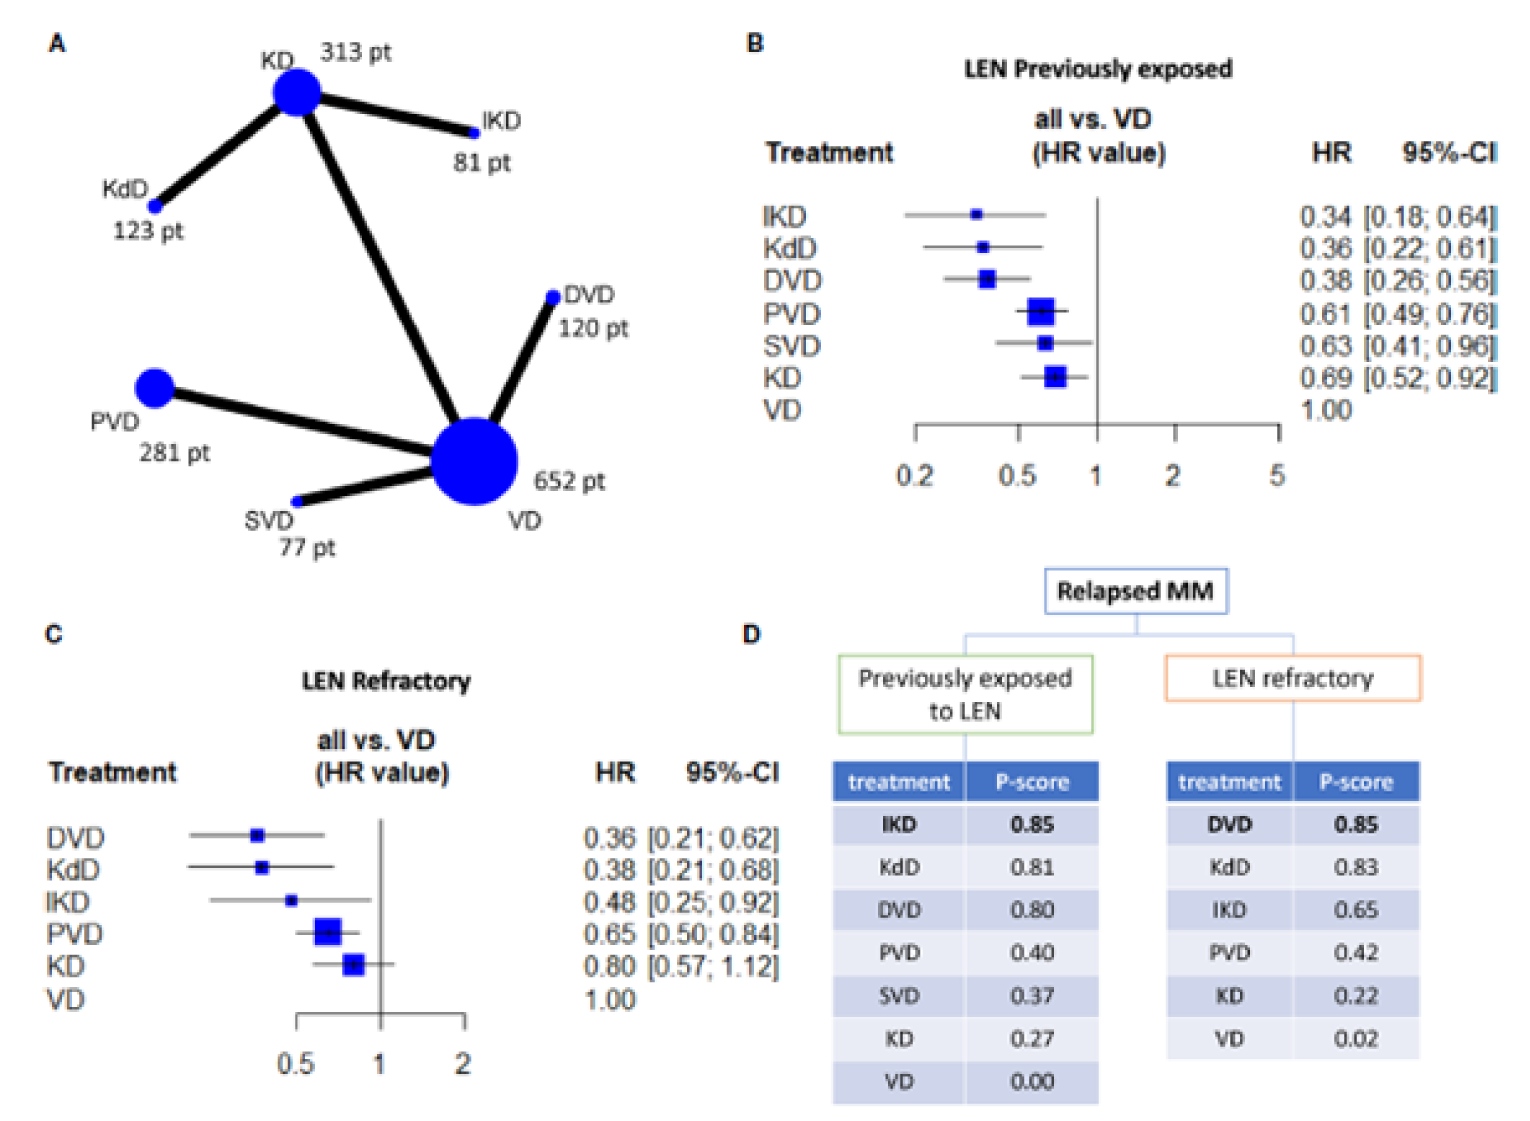
CI = confidence interval; DVD = daratumumab plus bortezomib plus dexamethasone; HR = hazard ratio; IKD = isatuximab plus carfilzomib plus dexamethasone; KD = carfilzomib plus dexamethasone; KdD = daratumumab plus carfilzomib plus dexamethasone; LEN = lenalidomide; MM = multiple myeloma; PFS = progression-free survival; PVD = pomalidomide plus bortezomib plus dexamethasone; SVD = selinexor plus bortezomib plus dexamethasone; VD = bortezomib plus dexamethasone.
Note: A is a network plot showing all the direct comparisons and the number of patients included in each node (i.e., the total number of patients receiving the treatment indicated in the node). B and C are forest plots indicating the efficacy of each regimen (in terms of HR and 95% CIs) by using VD as comparator arms. The ranking charts in D apply to all the evaluated regimens based on the P score and are grouped according to previous exposition or resistance to lenalidomide.
Source: Botta et al. (2021).6 This work is licensed under the Attribution 4.0 International Licence (CCBY-4.0).
Critical Appraisal of ITC by Botta et al.
The authors did not provide any detail regarding the study selection methodology. It is unclear how studies were identified for inclusion in the NMA. Consultation with clinical experts for this CADTH review confirmed that it is unlikely that any important studies for regimens to treat MM were missed. However, the experts also acknowledged that studies that assessed PVd were not included; it is therefore possible that the authors did not consider data for relevant treatments in the setting RRMM, although without detailed information regarding study selection methodology it is not possible to know.
The authors provided a brief assessment of trial patient characteristics, and commented that characteristics, such as proportions of patients who were refractory to lenalidomide, previously exposed to bortezomib, and who were receiving second-line therapy, were well balanced across treatment groups within the studies. No further assessments of heterogeneity, either descriptive or statistical, were provided. Therefore, it is unclear how heterogeneity in patient or trial characteristics could have affected the ITC analyses.
The studies included in the network included patients across multiple lines of therapy. The authors commented that the proportion of patients in the second line was generally well balanced across the trials. However, it is unclear how well balanced the proportions of patients in later lines of therapies were. The clinical experts consulted by CADTH for this review confirmed that patients in later lines of therapy likely will have poorer outcomes. It is unclear how this may have affected the treatment comparisons.
In general, the methodology of the NMA was poorly reported, and it is not possible to appraise its methods. It is known that a frequentist approach, which is a common methodology used for ITCs, was conducted. However, no further details were provided. Due to the lack of reporting, it is not clear whether effect modifiers were considered, or whether treatment crossover was considered.
The authors assessed only PFS. The clinical experts consulted by CADTH for review confirmed that PFS is a meaningful end point for clinicians and patients. It is likely that OS was not mature in the studies and therefore not analyzed; for example, OS was not mature for the BOSTON trial, which was included in the network of evidence for this ITC. However, consideration of other efficacy end points may have provided further context for the efficacy of these treatments. In addition, no analysis of safety was provided, although toxicities of treatments are considered when choosing patient’s treatments. Analyses of efficacy alone may not be enough to determine the optimal treatment choice for patients.
The authors did not conduct a risk-of-bias assessment for the studies included in the network. Therefore, it is not possible to know the extent of bias in the studies and how they could have affected the results of this ITC.
The authors did not conduct a proportional hazards assessment. Analyses of PFS and OS are typically conducted with Cox models that rely on the proportional hazards assumption. The validity of the results may be questioned when this assumption is violated. It is unclear how many studies included in the ITC deviated from this assumption.
Discussion
Summary of Available Evidence
One multi-centre, multinational, open-label, phase III study met the criteria for the CADTH systematic review. A total of 195 patients were randomized to the SVd group and 207 patients were randomized to the Vd group. Enrolled patients included those with histologically confirmed MM with measurable disease per IMWG guidelines who had received between 1 and 3 prior anti-MM regimens and who had an ECOG PS less than or equal to 2. Patients had to have documented evidence of progressive MM on or after their most recent regimen. Patients previously treated with bortezomib or another PI were eligible. Treatment was continued until disease progression, unacceptable toxicity, withdrawal of consent, initiation of subsequent anticancer therapy, or death. The primary outcome of the trial was PFS. Key secondary end points that were part of a statistical hierarchy included ORR, incidence of PN events of grade 2 or higher, and response rates for responses of a VGPR or better based on an IRC assessment. Health-related quality of life was an exploratory end point. Baseline characteristics were similar between the 2 treatment groups. The mean age of patients was 67 years, and most patients were between 51 and 74 years of age. Most patients were White (82%), never smokers (74%), and were nonfrail (67.5%). Most patients were diagnosed with stage II or III disease (60%) and an R-ISS stage of I (27%) or II (60%). The mean number of prior lines of anti-MM therapy was 1.7 in both treatment groups; 51% in the SVd group versus 48% in the Vd group had 1 prior line of therapy, compared to 33% and 31% of patients with 2 prior lines of anti-MM therapy, and 16% versus 21% of patients with 3 prior lines of anti-MM therapy. Most patients (77%) had received prior PI therapy.
In addition to the systematic review, 1 sponsor-submitted ITC and 3 published ITCs were summarized and critically appraised for this review.
Interpretation of Results
Efficacy
The BOSTON trial demonstrated statistically significant improvement with SVd over Vd in PFS among patients with MM. The clinical experts consulted by CADTH for this review confirmed that PFS is a clinically meaningful end point for patients and that the magnitude of benefit was also clinically meaningful. Key secondary end points of ORR, incidence of PN events of grade 2 or higher, and response rates for responses of a VGPR or better based on an IRC assessment, also supported the primary analysis of PFS, and the clinical experts confirmed that these results were supportive of PFS. Critical appraisal of statistical methodology used for the analysis of the primary and key secondary end points revealed that appropriate methods were used to ensure adequate statistical power and reduce the likelihood of type I error. However, informative censoring related to patients discontinuing treatment may have introduced bias into the analysis of PFS. Sensitivity analysis that considered treatment discontinuation as an event did not reveal any statistically significant improvement in PFS for the SVd group over the Vd group, although other sensitivity analyses were supportive of improvement with SVd over Vd. The lack of a difference in TTD was also acknowledged to be potentially influenced by informative censoring related to patients discontinuing treatment differentially across the SVd and Vd treatment groups. The potential for bias introduces complexity to interpretation of PFS results for the BOSTON trial, although the positive results of key secondary end points, other secondary end points, and multiple sensitivity analyses lend further support to the improvement observed with SVd compared to Vd. In addition, while acknowledging the potential for bias in the analysis for PFS, the clinical experts consulted by CADTH for this review were generally in agreement that the BOSTON trial demonstrated efficacy of SVd compared to Vd.
It should be noted that OS, a common end point in oncology trials and an end point considered important by most patients and clinicians, was not included as a primary or key secondary end point. The results of OS were immature at the time of the analysis. In addition, OS was not considered in the hierarchical testing scheme, adding further complexity to the interpretation of the results. However, while OS was not a key end point and data were not yet mature at the time of the analysis, longer-term data may be beneficial in determining the long-term effects of treatment with SVd.
The baseline characteristics of patients in the BOSTON trial showed that 39.5% in the SVd group and 37.2% in the Vd group had previous exposure to lenalidomide. In Canadian clinical practice, lenalidomide would be administered to most of patients as a first-line therapy in metastatic settings. The clinical experts suggested that efficacy analysis should be stratified by patients who were refractory to lenalidomide versus patients who were not. Although subgroup analyses of PFS suggest that patients with previous lenalidomide exposure had improved outcomes when treated with SVd over Vd, these analyses should be interpreted with caution. In addition, an ITC published by Botta et al. conducted a stratified NMA that assessed PFS in patients who were refractory to lenalidomide and patients who exposed to lenalidomide. However, SVd was not included in the analysis of lenalidomide-refractory patients. As most patients would be exposed to lenalidomide in the first line, the clinical experts emphasized that this patient group would be important for analysis and consideration of patient’s future treatment options upon progression.
While the BOSTON trial demonstrated statistically significant improvement of PFS with SVd over Vd, the ideal place in therapy for SVd was considered. As mentioned, the mean number of prior lines of anti-MM therapies in the BOSTON trial was approximately 2. The clinician group input acknowledged the uncertainty in placement of SVd in the current treatment paradigm for MM patients. However, the clinician group inputs and the clinical experts consulted by CADTH for this review suggested that SVd would likely not be used before the third line.
It was acknowledged that the comparator group in the BOSTON trial is not representative of current treatment practices, and that standard of care has changed. Four ITCs were summarized and critically appraised in this CADTH review. All ITCs included a number of comparators, many of which (i.e., DVd, DRd, Kd, PVd, CyBorD, and Isa-Pd) are therapies used in Canadian clinical practice. The results of the indirect evidence were congruent with the results of the BOSTON trial, which found that SVd was favoured over Vd for PFS and ORR. The results of all ITCs suggested that other treatment regimens may be preferred over SVd in the second, third, or later line of therapy for MM patients. In particular, the ITCs appeared to suggest that daratumumab-based regimens would be preferred for RRMM patients; the clinical experts consulted by CADTH for this review agreed that daratumumab-based regimens would likely be used before SVd, especially with funding approvals for DRd in a first- and second-line metastatic setting. However, the ITCs were faced with many methodological limitations that introduce considerable uncertainty into the results. Heterogeneity across patients was noted in all of the ITCs, affecting the consistency of the analyses and resulting in bias. In addition, many studies in the ITCs included patients across many different lines of therapy. As patients progress and receive more lines of therapy, their outcomes are expected to decline, which may also affect the efficacy results. The sponsor’s ITC as well as a published ITC by Dolph et al.21 stratified analyses by line of therapy (second, third, or later). However, patients included in these networks stratified by line of therapy often also included patients in other lines of therapy. Therefore, biases remain pertaining to differences in patient outcomes related to line of therapy. Overall, the uncertainty in the ITCs was indicated by the wide CIs associated with the point estimates. While the overall magnitude of the treatment effects was uncertain, the clinical experts consulted for this review confirmed that the general direction of the effects could be reliable. The methodological limitations and heterogeneity across patients included in the ITCs limit the ability to draw firm conclusions.
Harms
Results for HRQoL generally showed little difference between the SVd and Vd groups during the trial. However, results of the EORTC QLQ-CIPN20 indicated that patients in the SVd group had higher PN symptom burden as assessed through the autonomic subscale. Further breakdown of the subscale revealed that patients in the SVd group had greater symptom burden for blurred vision than did those in the Vd group. Consideration of safety results of the BOSTON trial also revealed a greater incidence of cataracts in the SVd group than in the Vd group at both the primary (21.5% versus 6.4%, respectively) and updated (23.6% versus 7.4%, respectively) analyses. Incidence of grade 3 or higher cataracts was 8.7% in the SVd group versus 1.5% in the Vd group at the primary analysis, and 11.3% versus 2.0%, respectively, at the updated analysis. The clinical experts consulted by CADTH for this review also confirmed that analyses of HRQoL and safety support the consideration that patients may need to be assessed for vision impairment when on treatment with a selinexor-based regimen.
The incidence of AEs of any grade were similar in the SVd (99.5%) and Vd (97.1%) treatment groups. However, a greater proportion of patients in the SVd group experienced the following AEs: thrombocytopenia, nausea, fatigue, anemia, diarrhea, decreased appetite, decreased weight, asthenia, cataracts, and vomiting. A large proportion of patients reported grade 3 or higher AEs, including 85.1% of patients in the SVd group and 61.2% in the Vd group. The most common grade 3 or higher AEs were thrombocytopenia (39.5% in the SVd group versus 17.2% in the Vd group) and anemia (15.9% versus 10.3%, respectively) which were both more common in the SVd group. Clinical experts consulted by CADTH for this review agreed that thrombocytopenia, anemia, fatigue, cataracts, and nausea are important AEs for consideration. However, in general, the clinical experts agreed that most AEs would be manageable through dose modifications. A larger proportion of patients in the SVd group experienced AEs that led to dose modifications compared with those in the Vd group (88.7% versus 76.5%, respectively). However, the proportion of patients experiencing AEs that resulted in treatment discontinuation was lower (21.0% in the SVd group versus 15.7% in the Vd group), further supporting the expectation that most AEs would be manageable through dose modification.
Notable harms pre-specified in the CADTH systematic review protocol included PN, pain, anorexia, nausea, gastrointestinal disturbances, thrombocytopenia, and neutropenia. The incidence of gastrointestinal disorders, thrombocytopenia, nausea, and neutropenia were all more commonly reported in patients in the SVd treatment group. Only PN was more commonly reported among patients in the Vd group. The clinical experts consulted by CADTH for this review confirmed that neutropenia is likely to be an expected AE for patients caused by bortezomib. The greater incidence of neutropenia as well as other AEs indicates that the addition of selinexor can cause additional toxicities.
As previously mentioned, the comparator group used in the BOSTON trial was not considered reflective of current Canadian clinical practice. A summary of harms associated with SVd relative to other comparators would be important for consideration when choosing a patient’s therapy. Four ITCs comparing SVd to other therapies were provided; of these, only 1 published ITC by Arcuri et al. conducted an indirect analysis of safety. However, the network for safety analysis did not include SVd. Therefore, the relative safety profile of SVd to other treatments is not completely known. However, clinicians may have an understanding of the safety profile of other treatments commonly used and can consider those when making treatment decisions for patients. The clinical experts consulted by CADTH for this review noted that the toxicity profile of selinexor differs from that of other treatments for MM and may be beneficial for patients who cannot tolerate other therapies. In addition, side effects common with selinexor, such as nausea and anorexia, were highlighted by the clinical experts, as patients with pre-existing anorexia, weight loss, or nausea may not be good candidates for selinexor.
Conclusions
One multinational, sponsor-funded, open-label RCT, BOSTON, was included in the CADTH review. Treatment with SVd was associated with statistically significant and clinically meaningful improvement in PFS compared to Vd in a population of patients with MM who had received 1 to 3 prior lines of therapy. At the time of the analysis, median OS was not reached; however, other secondary end points (e.g., ORR, DOR, TTR, and TTNT) were supportive of the primary end point of PFS, which demonstrated improved efficacy with SVd over Vd. An updated analysis was conducted that continued to support the improved PFS of SVd over Vd, although these results were considered descriptive. The comparator group of the BOSTON trial, Vd, was not considered appropriate in the current Canadian treatment landscape due to changes in standard of care. Four ITCs, including 1 submitted by the sponsor and 3 published ITCs, compared the efficacy of SVd to other relevant comparators (i.e., DVd, DRd, Kd, PVd, CyBorD, and Isa-Pd). The ITCs were congruent with direct evidence from the BOSTON trial that demonstrated improved PFS and ORR with treatment SVd over Vd. However, the ITCs also suggested that other regimens, such as on daratumumab-based regimens, may be preferred over SVd; this was supported through consultation with clinical experts. However, the methodological limitations and heterogeneity across patients included in the ITCs limit the ability to draw firm conclusions. Data on HRQoL suggested that there were no differences between patients in the SVd and Vd treatment groups; however, HRQoL data also indicated there were effects on patients’ vision in the SVd group, although these should be interpreted with caution given the exploratory nature of the analysis. Detriments to patients’ vision were also observed through harms data, which indicated an increase in cataracts in the SVd group. Notable harms that occurred more frequently in the SVd group included nausea, gastrointestinal disorders, thrombocytopenia, and neutropenia. In general, the clinical experts consulted by CADTH for this review stated the AEs related to SVd are manageable.
References
1.Bergstrom DJ, Kotb R, Louzada ML, Sutherland HJ, Tavoularis S, Venner CP. Consensus Guidelines on the Diagnosis of Multiple Myeloma and Related Disorders: Recommendations of the Myeloma Canada Research Network Consensus Guideline Consortium. Clin Lymphoma Myeloma Leuk. 2020;20(7):e352-e367. PubMed
2.Mikhael J, Ismaila N, Cheung MC, et al. Treatment of Multiple Myeloma: ASCO and CCO Joint Clinical Practice Guideline. J Clin Oncol. 2019;37(14):1228-1263. PubMed
3.Xpovio (selinexor): tablets, 20 mg, oral [product monograph]. Oakville (ON): FORUS Therapeutics Inc; 2021 Dec 10.
4.Clinical Study Report: KCP-330-023. A phase 3 randomized, controlled, open-label study of selinexor, bortezomib, and dexamethasone (SVd) versus bortezomib and dexamethasone (Vd) in patients with relapsed or refractory multiple myeloma (RRMM) [internal sponsor's report]. Newton (MA): Karyopharm Therapeutics Inc.; 2021 Mar 29.
5.FORUS Therapeutics Inc. response to March 21, 2022 DRR request for additional information regarding selinexor DRR review: additional clinical information [internal additional sponsor's information]. Oakville (ON): FORUS Therapeutics Inc.; 2022.
6.Botta C, Martino EA, Conticello C, et al. Treatment of Lenalidomide Exposed or Refractory Multiple Myeloma: Network Meta-Analysis of Lenalidomide-Sparing Regimens. Front Oncol. 2021;11:643490. PubMed
7.Rajkumar SV. Multiple myeloma: 2020 update on diagnosis, risk-stratification and management. Am J Hematol. 2020;95(5):548-567. PubMed
8.Multiple myeloma. Plymouth Meeting (PA): National Comprehensive Cancer Network; 2022: https://www.nccn.org/professionals/physician_gls/pdf/myeloma.pdf. Accessed 2022 Mar 3.
9.Boretezomib (as mannitol boronic ester): sterile powder for injection, 3.5mg bortezomib/vial [product monograph]. Toronto (ON): Teva Canada Limited; 2016: https://pdf.hres.ca/dpd_pm/00035071.PDF. Accessed 2022 Mar 31.
10.Johnson DB LM, Kelley B. Dexamethasone. In: StatPearls [Internet]. Treasure Island (FL): StatPearls Publishing; updated 2021 Sep 5.
11.Canadian Pharmacists Association. e-CPS. 2022; https://www.e-therapeutics.ca. Accessed 2022 Apr 13.
12.McGowan J, Sampson M, Salzwedel DM, Cogo E, Foerster V, Lefebvre C. PRESS Peer Review of Electronic Search Strategies: 2015 guideline statement. J Clin Epidemiol. 2016;75:40-46. PubMed
13.Grey matters: a practical tool for searching health-related grey literature. Ottawa (ON): CADTH; 2019: https://www.cadth.ca/grey-matters. Accessed 2022 Feb 3.
14.Grosicki S, Simonova M, Spicka I, et al. Once-per-week selinexor, bortezomib, and dexamethasone versus twice-per-week bortezomib and dexamethasone in patients with multiple myeloma (BOSTON): a randomised, open-label, phase 3 trial. Lancet. 2020;396(10262):1563-1573. PubMed
15.Committee for Medicinal Products for Human Use. Assessment report: Nexpovio (selinexor). (European public assessment report). Amsterdam (NL): European Medicines Agency; 2021 Jan 28: https://www.ema.europa.eu/en/documents/assessment-report/nexpovio-epar-public-assessment-report_en.pdf. Accessed 2021 Apr 11.
16.Center for Drug Evaluation Research. Multi-discipline review. Xpovio (selinexor). Company: Karyopharm Theraps. Application No 212306. Approval Date: 07/03/2019 (FDA drug approval package). Silver Spring (MD): U.S. Food and Drug Administration; 2019: https://www.accessdata.fda.gov/drugsatfda_docs/nda/2019/212306Orig1s000MultidisciplineR.pdf. Accessed 2022 Apr 11.
17.Kumar S, Paiva B, Anderson KC, et al. International Myeloma Working Group consensus criteria for response and minimal residual disease assessment in multiple myeloma. Lancet Oncol. 2016;17(8):e328-e346. PubMed
18.Drug Reimbursement Review sponsor submission: selinexor, tables, 20 mg, oral [internal sponsor's package]. Oakville (ON): FORUS Therapeutics Inc.; 2022 Jan 14.
19.Clinical Study Report: KCP-330-017. A phase 1B/2 study of selinexor (KPT-330) in combination with backbone treatments for relapsed/refractory and newly diagnosed multiple myeloma: final report for ARM 2 (SVD) (selinexor + bortezomib + dexamethasone) [internal sponsor's report]. Newton (MA): Karyopharm Therapeutics Inc.; 2020 May 14.
20.Arcuri LJ, Americo AD. Treatment of relapsed/refractory multiple myeloma in the bortezomib and lenalidomide era: a systematic review and network meta-analysis. Ann Hematol. 2021;100(3):725-734. PubMed
21.Dolph M, Tremblay G, Gilligan AM, Leong H. Network Meta-Analysis of Once Weekly Selinexor-Bortezomib-Dexamethasone in Previously Treated Multiple Myeloma. J Health Econ Outcomes Res. 2021;8(2):26-35. PubMed
22.Indirect treatment comparisons of selinexor triplet versus comparators in relapsed/refractory multiple myeloma [internal sponsor's report]. In: Drug Reimbursement Review sponsor submission: selinexor, 100mg orally. Newton (MA): Karyopharm Therapeutics; 2021 December 3.
23.Meletios AD, Robert ZO, Thierry F, et al. Retrospective matched-pairs analysis of bortezomib plus dexamethasone versus bortezomib monotherapy in relapsed multiple myeloma. Haematologica. 2015;100(1):100-106. PubMed
24.Osborne TR, Ramsenthaler C, Siegert RJ, Edmonds PM, Schey SA, Higginson IJ. What issues matter most to people with multiple myeloma and how well are we measuring them? A systematic review of quality of life tools. Eur J Haematol. 2012;89(6):437-457. PubMed
25.Frick E, Borasio GD, Zehentner H, Fischer N, Bumeder I. Individual quality of life of patients undergoing autologous peripheral blood stem cell transplantation. Psychooncology. 2004;13(2):116-124. PubMed
26.Kontodimopoulos N, Samartzis A, Papadopoulos AA, Niakas D. Reliability and validity of the Greek QLQ-C30 and QLQ-MY20 for measuring quality of life in patients with multiple myeloma. ScientificWorldJournal. 2012;2012:842867. PubMed
27.Kvam AK, Fayers PM, Wisloff F. Responsiveness and minimal important score differences in quality-of-life questionnaires: a comparison of the EORTC QLQ-C30 cancer-specific questionnaire to the generic utility questionnaires EQ-5D and 15D in patients with multiple myeloma. Eur J Haematol. 2011;87(4):330-337. PubMed
28.Giesinger JM, Kieffer JM, Fayers PM, et al. Replication and validation of higher order models demonstrated that a summary score for the EORTC QLQ-C30 is robust. J Clin Epidemiol. 2016;69:79-88. PubMed
29.Fayers PM, Aaronson NK, Bjordal K, et al. The EORTC QLQ-C30 Scoring Manual (3rd Edition). Brussels (BE): European Organisation for Research and Treatment of Cancer; 2001: https://www.eortc.org/app/uploads/sites/2/2018/02/SCmanual.pdf. Accessed 2022 Apr 14.
30.Aaronson NK, Ahmedzai S, Bergman B, et al. The European Organization for Research and Treatment of Cancer QLQ-C30: a quality-of-life instrument for use in international clinical trials in oncology. J Natl Cancer Inst. 1993;85(5):365-376. PubMed
31.EORTC Quality of Life. Questionnaires: core. https://qol.eortc.org/core/. Accessed 2022 Apr 14.
32.Wettergren L, Sprangers M, Björkholm M, Langius‐Eklöf A. Quality of life before and one year following stem cell transplantation using an individualized and a standardized instrument. Psychooncology. 2008;17(4):338-346. PubMed
33.Strasser‐Weippl K, Ludwig H. Psychosocial QOL is an independent predictor of overall survival in newly diagnosed patients with multiple myeloma. Eur J Haematol. 2008;81(5):374-379. PubMed
34.Molassiotis A, Wilson B, Blair S, Howe T, Cavet J. Unmet supportive care needs, psychological well‐being and quality of life in patients living with multiple myeloma and their partners. Psychooncology. 2011;20(1):88-97. PubMed
35.Gulbrandsen N, Hjermstad MJ, Wisløff F, Group NMS. Interpretation of quality of life scores in multiple myeloma by comparison with a reference population and assessment of the clinical importance of score differences. Eur J Haematol. 2004;72(3):172-180. PubMed
36.Hensel M, Egerer G, Schneeweiss A, Goldschmidt H, Ho A. Quality of life and rehabilitation in social and professional life after autologous stem cell transplantation. Ann Oncol. 2002;13(2):209-217. PubMed
37.Kvam AK, Wisloff F, Fayers PM. Minimal important differences and response shift in health-related quality of life; a longitudinal study in patients with multiple myeloma. Health Qual Life Outcomes. 2010;8:79. PubMed
38.Wisloff F, Hjorth M. Health-related quality of life assessed before and during chemotherapy predicts for survival in multiple myeloma. Nordic Myeloma Study Group. Br J Haematol. 1997;97(1):29-37. PubMed
39.Sirohi B, Powles R, Lawrence D, et al. An open, randomized, controlled, phase II, single centre, two-period cross-over study to compare the quality of life and toxicity experienced on PEG interferon with interferon-α2b in patients with multiple myeloma maintained on a steady dose of interferon-α2b. Ann Oncol. 2007;18(8):1388-1394. PubMed
40.Lee SJ, Richardson PG, Sonneveld P, et al. Bortezomib is associated with better health‐related quality of life than high‐dose dexamethasone in patients with relapsed multiple myeloma: results from the APEX study. Br J Haematol. 2008;143(4):511-519. PubMed
41.Cocks K, King MT, Velikova G, et al. Evidence-based guidelines for interpreting change scores for the European Organisation for the Research and Treatment of Cancer Quality of Life Questionnaire Core 30. Eur J Cancer. 2012;48(11):1713-1721. PubMed
42.Herdman M, Gudex C, Lloyd A, et al. Development and preliminary testing of the new five-level version of EQ-5D (EQ-5D-5L). Qual Life Res. 2011;20(10):1727-1736. PubMed
43.McClure NS, Sayah FA, Xie F, Luo N, Johnson JA. Instrument-defined estimates of the minimally important difference for EQ-5D-5L index scores. Value Health. 2017;20(4):644-650. PubMed
44.Postma TJ, Aaronson NK, Heimans JJ, et al. The development of an EORTC quality of life questionnaire to assess chemotherapy-induced peripheral neuropathy: the QLQ-CIPN20. Eur J Cancer. 2005;41(8):1135-1139. PubMed
45.Lavoie Smith EM, Barton DL, Qin R, Steen PD, Aaronson NK, Loprinzi CL. Assessing patient-reported peripheral neuropathy: the reliability and validity of the European Organization for Research and Treatment of Cancer QLQ-CIPN20 Questionnaire. Qual Life Res. 2013;22(10):2787-2799. PubMed
46.Cohen J. A power primer. Psychol Bull. 1992;112(1):155-159. PubMed
47.Lavoie Smith EM, Haupt R, Kelly JP, et al. The Content Validity of a Chemotherapy-Induced Peripheral Neuropathy Patient-Reported Outcome Measure. Oncol Nurs Forum. 2017;44(5):580-588. PubMed
48.Cavaletti G, Cornblath DR, Merkies ISJ, et al. The chemotherapy-induced peripheral neuropathy outcome measures standardization study: from consensus to the first validity and reliability findings. Ann Oncol. 2013;24(2):454-462. PubMed
49.Yeo F, Ng CC, Loh KWJ, et al. Minimal clinically important difference of the EORTC QLQ-CIPN20 for worsening peripheral neuropathy in patients receiving neurotoxic chemotherapy. Support Care Cancer. 2019;27(12):4753-4762. PubMed
Appendix 1: Literature Search Strategy
Note that this appendix has not been copy-edited.
Clinical Literature Search
Overview
Interface: Ovid
Databases:
MEDLINE All (1946–present)
Embase (1974–present)
Note: Subject headings and search fields have been customized for each database. Duplicates between databases were removed in Ovid.
Date of search: February 15, 2022
Alerts: Biweekly search updates until project completion
Search filters applied: No filters were applied to limit the retrieval by study type.
Limits: Conference abstracts: excluded
Syntax | Description |
|---|---|
/ | At the end of a phrase, searches the phrase as a subject heading |
MeSH | Medical Subject Heading |
* | Before a word, indicates that the marked subject heading is a primary topic; or, after a word, a truncation symbol (wildcard) to retrieve plurals or varying endings |
.ti | Title |
.ot | Original title |
.ab | Abstract |
.hw | Heading word; usually includes subject headings and controlled vocabulary |
.kf | Keyword heading word |
.dq | Candidate term word (Embase) |
.pt | Publication type |
.rn | Registry number |
.nm | Name of substance word (MEDLINE) |
medall | Ovid database code: MEDLINE All, 1946 to present, updated daily |
oemezd | Ovid database code; Embase, 1974 to present, updated daily |
Multi-Database Strategy
(selinexor* or selinxor* or xpovio* or nexpovio* or KPT330 or KPT-330 or ATG010 or "ATG 010" or ONO7705 or ONO 7705 or 31TZ62FO8F).ti,ab,kf,ot,hw,nm,rn.
1 use medall
*selinexor/
(selinexor* or selinxor* or xpovio* or nexpovio* or KPT330 or KPT-330 or ATG010 or "ATG 010" or ONO7705 or ONO 7705).ti,ab,kf,dq.
3 or 4
5 use oemezd
(conference review or conference abstract).pt.
6 not 7
2 or 8
remove duplicates from 9
Clinical Trials Registries
ClinicalTrials.gov
Produced by the US National Library of Medicine. Targeted search used to capture registered clinical trials.
[Search terms – selinexor or Xpovio or Nexpovio]
WHO ICTRP
International Clinical Trials Registry Platform, produced by the World Health Organization. Targeted search used to capture registered clinical trials.
[Search terms – selinexor or Xpovio or Nexpovio]
Health Canada’s Clinical Trials Database
Produced by Health Canada. Targeted search used to capture registered clinical trials.
[Search terms – selinexor or Xpovio or Nexpovio]
EU Clinical Trials Register
European Union Clinical Trials Register, produced by the European Union. Targeted search used to capture registered clinical trials.
[Search terms – selinexor or Xpovio or Nexpovio]
Grey Literature
Search dates: February 3 to February 10, 2022
Keywords: selinexor or Xpovio or Nexpovio
Limits: None
Updated: Search updated prior to the meeting of CADTH pan-Canadian Oncology Drug Review Expert Committee (pERC).
Relevant websites from the following sections of the CADTH grey literature checklist Grey Matters: A Practical Tool for Searching Health-Related Grey Literature were searched:
Health Technology Assessment Agencies
Health Economics
Clinical Practice Guidelines
Drug and Device Regulatory Approvals
Advisories and Warnings
Drug Class Reviews
Clinical Trials Registries
Databases (free)
Health Statistics
Internet Search
Open Access Journals
Appendix 2: Excluded Studies
Note that this appendix has not been copy-edited.
Reference | Reason for exclusion |
|---|---|
Delimpasi S, Mateos MV, Auner HW, et al. Efficacy and tolerability of once-weekly selinexor, bortezomib, and dexamethasone in comparison with standard twice-weekly bortezomib and dexamethasone in previously treated multiple myeloma with renal impairment: Subgroup analysis from the BOSTON study. Am J Hematol. 2022;97(3):E83-E86. | Letter to the editor |
Auner HW, Gavriatopoulou M, Delimpasi S, et al. Effect of age and frailty on the efficacy and tolerability of once-weekly selinexor, bortezomib, and dexamethasone in previously treated multiple myeloma. Am J Hematol. 2021;96(6):708-718. | Retrospective subgroup analysis |
Richard S, Chari A, Delimpasi S, et al. Selinexor, bortezomib, and dexamethasone versus bortezomib and dexamethasone in previously treated multiple myeloma: Outcomes by cytogenetic risk. Am J Hematol. 2021;96(9):1120-1130. | Retrospective subgroup analysis |
Gasparetto C, Schiller GJ, Tuchman SA, et al. Once weekly selinexor, carfilzomib and dexamethasone in carfilzomib non-refractory multiple myeloma patients. Br J Cancer. 2021;20:20. | Wrong intervention |
Abid H, Wu JF, Abid MB. Risk for infections with selinexor in patients with relapsed/refractory multiple myeloma: a systematic review of clinical trials. Eur J Cancer. 2021;154:7-10. | Systematic review |
Al-Zubidi N, Gombos DS, Hong DS, et al. Overview of Ocular Side Effects of Selinexor. Oncologist. 2021;26(7):619-623. | Review |
Chari A, Florendo E, Mancia IS, et al. Optimal Supportive Care With Selinexor Improves Outcomes in Patients With Relapsed/Refractory Multiple Myeloma. Clin Lymphoma Myeloma Leuk. 2021;21(12):e975-e984. | Wrong intervention |
Cornell R, Hari P, Tang S, et al. Overall survival of patients with triple-class refractory multiple myeloma treated with selinexor plus dexamethasone vs standard of care in MAMMOTH. Am J Hematol. 2021;96(1):E5-E8. | Wrong intervention |
Dolph M, Tremblay G, Gilligan AM, Leong H. Network Meta-Analysis of Once Weekly Selinexor-Bortezomib-Dexamethasone in Previously Treated Multiple Myeloma. J. 2021;8(2):26-35. | Indirect treatment comparison |
Jeryczynski G, Bolomsky A, Agis H, Krauth MT. Stratification for RRMM and Risk-Adapted Therapy: Sequencing of Therapies in RRMM. Cancers (Basel). 2021;13(23):23. | Review |
Mouhieddine TH, Parekh S, Cho HJ, et al. Selinexor, bortezomib, and dexamethasone (SVD) in heavily treated relapsed refractory multiple myeloma. Ann Hematol. 2021;100(12):3057-3060. | Letter to the editor |
Prawitz T, Popat R, Suvannasankha A, et al. DREAMM-2: Indirect Comparisons of Belantamab Mafodotin vs. Selinexor + Dexamethasone and Standard of Care Treatments in Relapsed/Refractory Multiple Myeloma. Adv Ther. 2021;38(11):5501-5518. | Indirect treatment comparison |
Rodriguez-Otero P, Ayers D, Cope S, et al. Matching adjusted indirect comparisons of efficacy outcomes for idecabtagene vicleucel (ide-cel, bb2121) versus selinexor + dexamethasone and belantamab mafodotin in relapsed and refractory multiple myeloma. Leuk Lymphoma. 2021;62(10):2482-2491. | Indirect treatment comparison |
Sanchez L, Leleu X, Beaumont JL, et al. Peripheral neuropathy symptoms, pain, and functioning in previously treated multiple myeloma patients treated with selinexor, bortezomib, and dexamethasone. Am J Hematol. 2021;96(10):E383-E386. | Letter to the editor |
Sherbenou D, Stalker M, Forsberg P, Mark TM. Sustained Response to Selinexor-Based Therapy for Triple-Class Refractory Multiple Myeloma with Early Relapse After Allogeneic Stem Cell Transplantation. Clinical Lymphoma, Myeloma and Leukemia. 2021;21(7):e630-e634. | Case report |
Tao Y, Zhou H, Niu T. Safety and Efficacy Analysis of Selinexor-Based Treatment in Multiple Myeloma, a Meta-Analysis Based on Prospective Clinical Trials. Front Pharmacol. 2021;12:758992. | Indirect treatment comparison |
Tremblay G, Daniele P, Breeze J, et al. Quality of life analyses in patients with multiple myeloma: results from the Selinexor (KPT-330) Treatment of Refractory Myeloma (STORM) phase 2b study. BMC Cancer. 2021;21(1):993. | Wrong intervention |
Chari A, Vogl DT, Jagannath S, et al. Selinexor-based regimens for the treatment of myeloma refractory to chimeric antigen receptor T cell therapy. Br J Haematol. 2020;189(4):e126-e130. | Correspondence |
Gavriatopoulou M, Chari A, Chen C, et al. Integrated safety profile of selinexor in multiple myeloma: experience from 437 patients enrolled in clinical trials. Leukemia. 2020;34(9):2430-2440. | Retrospective pooled analysis |
Salcedo M, Lendvai N, Mastey D, et al. Phase I Study of Selinexor, Ixazomib, and Low-dose Dexamethasone in Patients With Relapsed or Refractory Multiple Myeloma. Clin Lymphoma Myeloma Leuk. 2020;20(3):198-200. | Wrong intervention |
Chari A, Vogl DT, Gavriatopoulou M, et al. Oral Selinexor-Dexamethasone for Triple-Class Refractory Multiple Myeloma. N Engl J Med. 2019;381(8):727-738. | Wrong intervention |
Jakubowiak AJ, Jasielec JK, Rosenbaum CA, et al. Phase 1 study of selinexor plus carfilzomib and dexamethasone for the treatment of relapsed/refractory multiple myeloma. Br J Haematol. 2019;186(4):549-560. | Wrong intervention |
Stirrups R. Selinexor-dexamethasone for refractory multiple myeloma. Lancet Oncol. 2019;20(10):e560. | News article |
Stocker N. Selinexor treatment for triple-class refractory multiple myeloma. [French]. Hematologie. 2019;25(6):282-283. | Not English |
Bahlis NJ, Sutherland H, White D, et al. Selinexor plus low-dose bortezomib and dexamethasone for patients with relapsed or refractory multiple myeloma. Blood. 2018;132(24):2546-2554. | Wrong intervention |
Burki TK. Selinexor and dexamethasone in multiple myeloma. Lancet Oncol. 2018;19(3):e146. | News article |
Chen C, Siegel D, Gutierrez M, et al. Safety and efficacy of selinexor in relapsed or refractory multiple myeloma and Waldenstrom macroglobulinemia. Blood. 2018;131(8):855-863. | Study design |
Vogl DT, Dingli D, Cornell RF, et al. Selective Inhibition of Nuclear Export With Oral Selinexor for Treatment of Relapsed or Refractory Multiple Myeloma. J Clin Oncol. 2018;36(9):859-866. | Wrong intervention |
Mateos MV, Gavriatopoulou M, Facon T, et al. Effect of prior treatments on selinexor, bortezomib, and dexamethasone in previously treated multiple myeloma. J Hematol Oncol. 2021;14(1):59. | Letter to the editor |
Appendix 3: Detailed Outcome Data
Note that this appendix has not been copy-edited.
Table 46: Progression-Free Survival Sensitivity Analyses
Analysis | Primary Analysis (February 18, 2020) | |
|---|---|---|
SVd Group (N = 195) | Vd Group (N = 207) | |
Sensitivity analysis: progression-free survival based on IRC assessment with nonstratified log-rank test | ||
Patients with events, n (%) | 80 (41.0) | 124 (59.9) |
PD | 69 (35.4) | 111 (53.6) |
Death | 11 (5.6) | 13 (6.3) |
Hazard ratio (95% CI) | 0.6580 (0.4967 to 0.8718) | |
1-sided P value | 0.0017a | |
Sensitivity analysis: Progression-free survival based on IRC assessment — Censored after 2 or more missed visits | ||
Patients with events, n (%) | 77 (39.5) | 124 (59.9) |
PD | 66 (33.8) | 111 (53.6) |
Death | 11 (5.6) | 13 (6.3) |
Median PFS (95% CI), months | 15.21 (11.76 to NE) | 9.46 (8.11 to 10.78) |
Hazard ratio (95% CI) | 0.6788 (0.5088 to 0.9057)b,c | |
1-sided P value | 0.0042d | |
Sensitivity analysis: Progression-free survival based on IRC assessment — Count treatment discontinuation as an event | ||
Patients with events, n (%) | 158 (81.0) | 173 (83.6) |
PD | 69 (35.4) | 111 (53.6) |
Death | 11 (5.6) | 13 (6.3) |
Treatment Discontinuation | 78 (40.0) | 49 (23.7) |
Median PFS (95% CI), months | 6.70 (5.75 to 7.66) | 6.97 (5.78 to 8.34) |
Hazard ratio (95% CI) | 0.9520 (0.7641 to 1.1862)b,c | |
1-sided P value | 0.3325b | |
Sensitivity analysis: Progression-free survival based on IRC Assessment — Count initiation of new MM therapy as an event | ||
Patients with events, n (%) | 82 (42.1) | 125 (60.4) |
PD | 69 (35.4) | 111 (53.6) |
Death | 11 (5.6) | 13 (6.3) |
Initiation of new MM therapy | 2 (1.0) | 1 (0.5) |
Median PFS (95% CI), months | 13.24 (10.28 to NE) | 9.43 (7.62 to 10.71) |
Hazard ratio (95% CI) | 0.7138 (0.5382 to 0.9468)b,c | |
1-sided P value | 0.0097b | |
Sensitivity analysis: Progression-free survival based on IRC assessment or clinical progression | ||
Patients with events, n (%) | 80 (41.0) | 124 (59.9) |
IRC-confirmed PD | 69 (35.4) | 111 (53.6) |
Clinical progression | 0 | 0 |
Death | 11 (5.6) | 13 (6.3) |
Median PFS (95% CI), months | 13.93 (11.73 to NE) | 9.46 (8.11 to 10.78) |
Hazard ratio (95% CI) | 0.7020 (0.5279 to 0.9335)b,c | |
1-sided P value | 0.0075b | |
Sensitivity analysis: Progression-free survival based on IRC assessment — Censored at next scheduled visit | ||
Patients with events, n (%) | 80 (41.0) | 124 (59.9) |
PD | 69 (35.4) | 111 (53.6) |
Death | 11 (5.6) | 13 (6.3) |
Median PFS (95% CI), months | 13.40 (11.76 to NE) | 9.46 (8.21 to 10.78) |
Hazard ratio (95% CI) | 0.6993 (0.5259 to 0.9298)b,c | |
1-sided P value | 0.0069b | |
Sensitivity analysis: Progression-free survival based on investigator assessment | ||
Patients with events, n (%) | 80 (41.0) | 118 (57.0) |
PD | 70 (35.9) | 105 (50.7) |
Death | 10 (5.1) | 13 (6.3) |
Median PFS (95% CI), months | 13.93 (11.73 to NE) | 9.46 (8.44 to 11.89) |
Hazard ratio (95% CI) | 0.7330 (0.5495 to 0.9777)b,c | |
1-sided P value | 0.0171b | |
Sensitivity analysis: Progression-free survival based on IRC assessment — Not censored at treatment discontinuation | ||
Patients with events, n (%) | 84 (43.1) | 128 (61.8) |
PD | 71 (36.4) | 112 (54.1) |
Death | 13 (6.7) | 16 (7.7) |
Median PFS (95% CI), months | 13.24 (10.28 to NE) | 9.46 (8.11 to 10.78) |
Hazard ratio (95% CI) | 0.7123 (0.5389 to 0.9415)b,c | |
1-sided P value | 0.0086b | |
aNonstratified Log-rank Test.
bStratified for prior PI therapies, number of prior of anti-MM regimens and R-ISS stage at screening.
cBased on stratified Cox Proportional Hazard model with Efron Method of handling ties.
dTwo or more missed visits is defined as a gap of > 46 days (before day 251) or > 74 days (on or after day 251) between visits. The event of disease progression occurred immediately after 2 or more missed visits are censored.
Source: BOSTON Clinical Study Report.4
Figure 35: Subgroup Analysis of Progression-Free Survival Based on IRC Assessment (Primary Analysis)
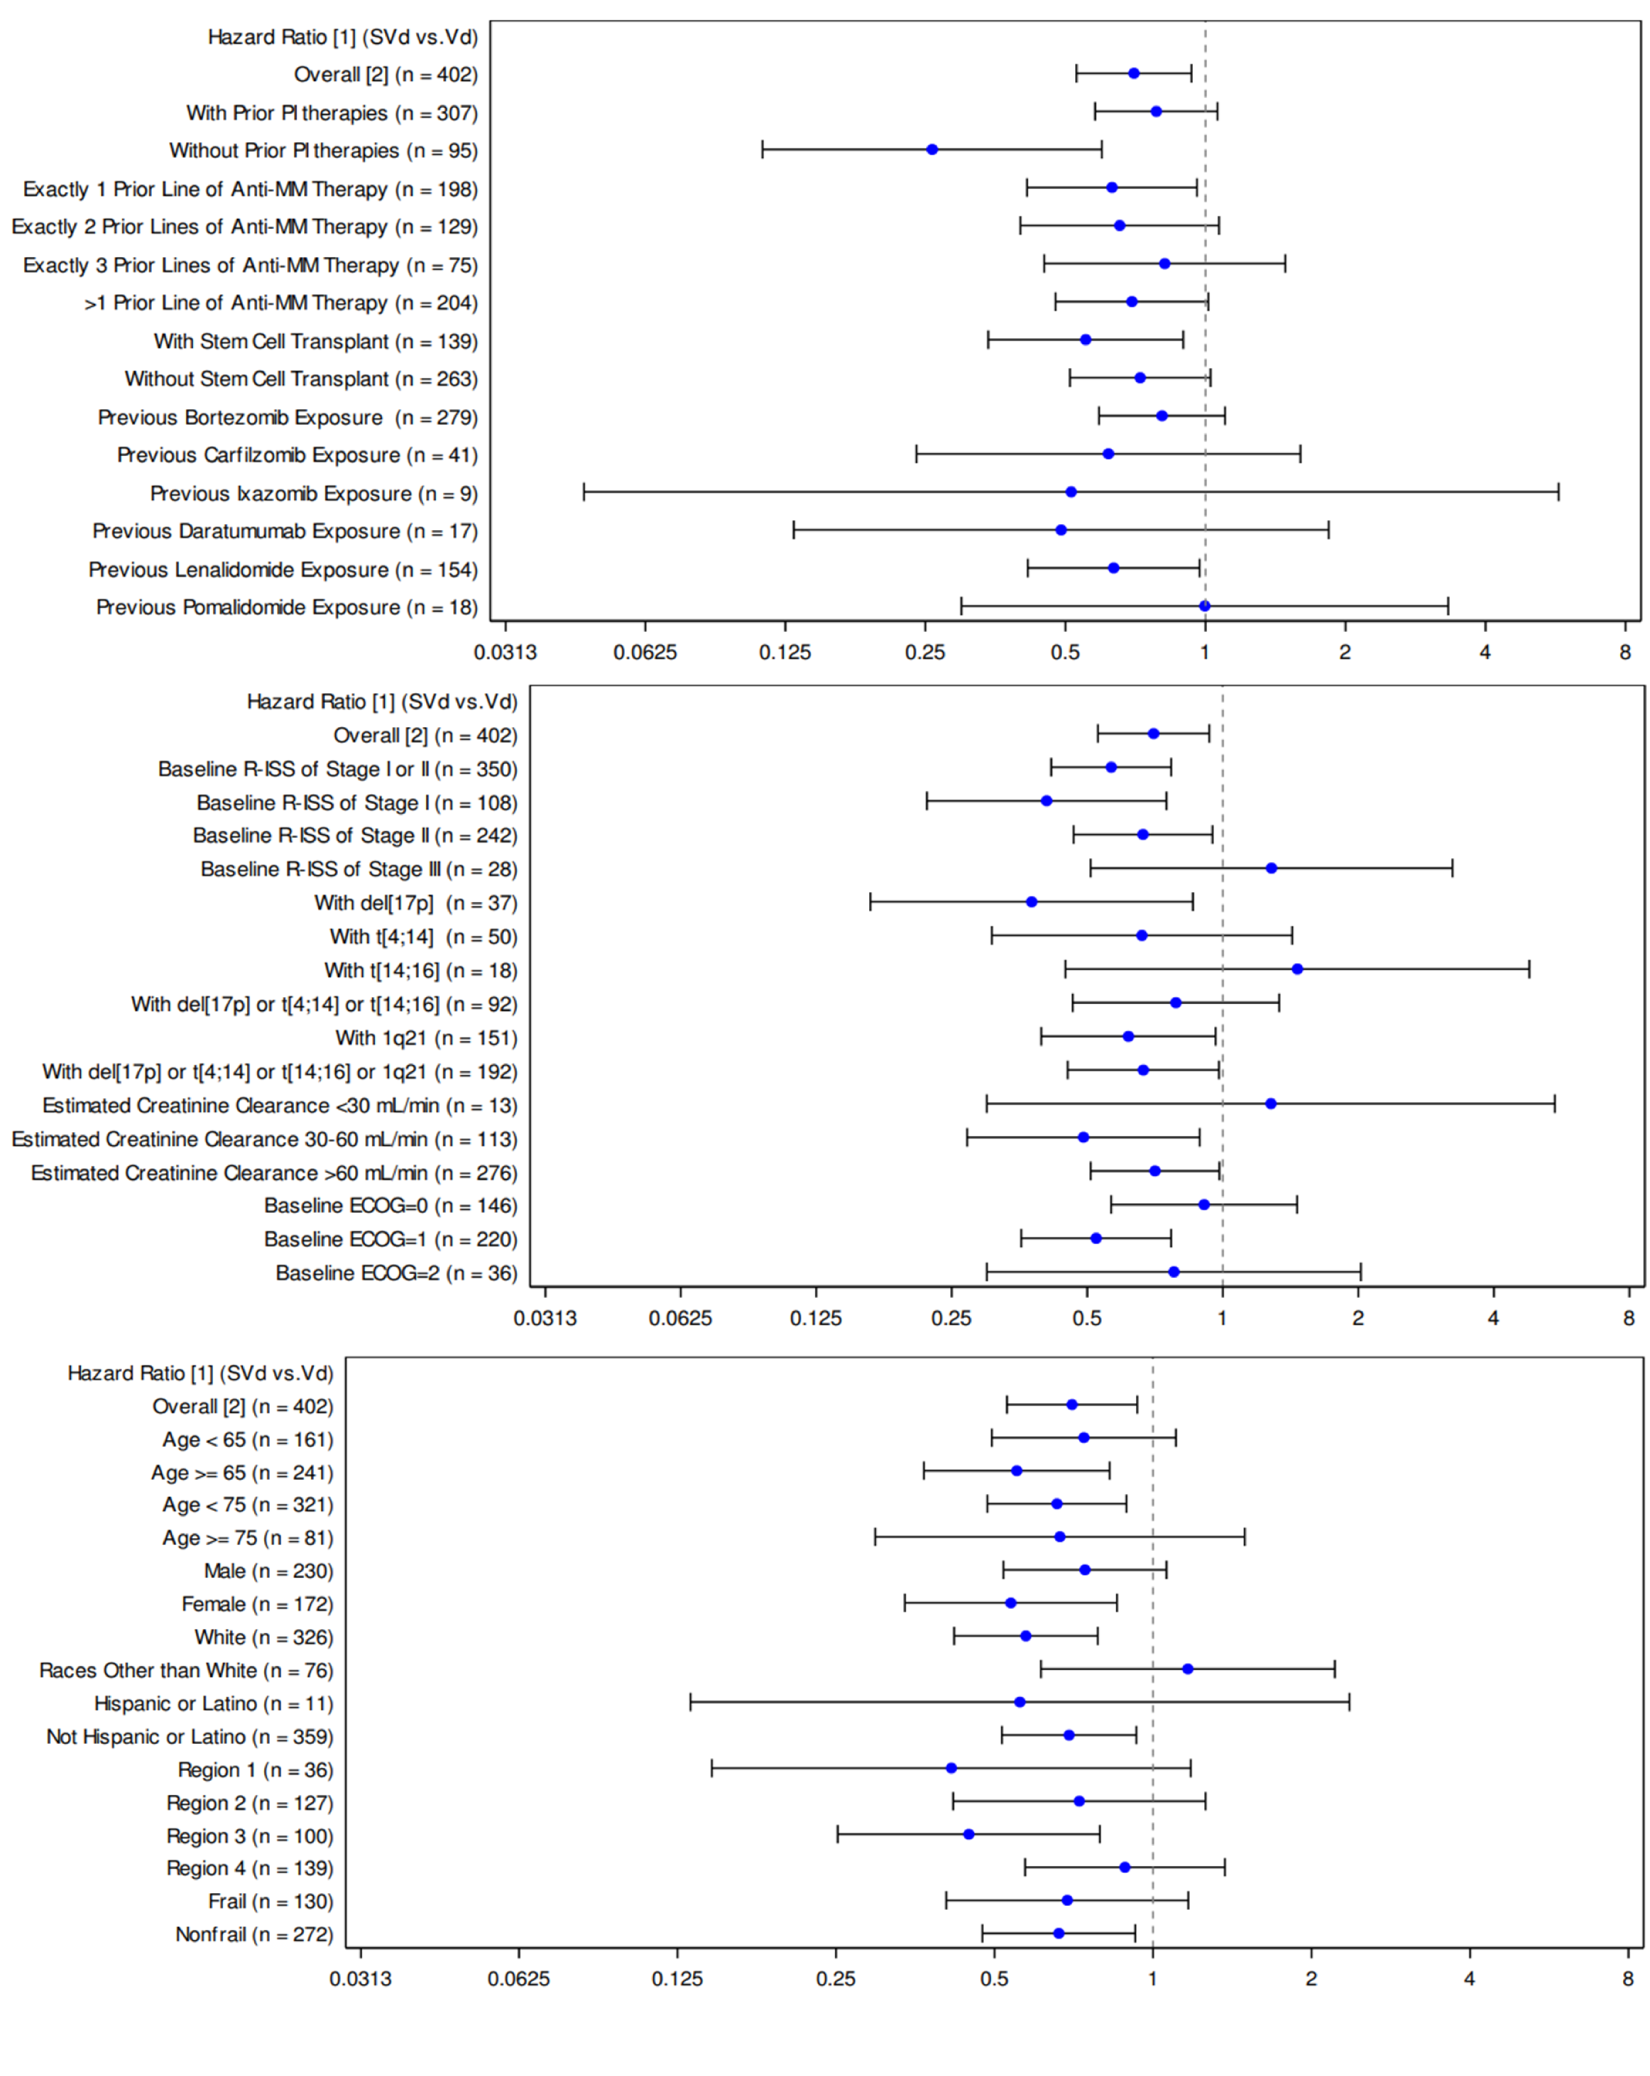
a Based on Cox Proportional Hazard model with Efron method of handling ties.
b Stratified for prior PI therapies, number of prior of anti-MM regimens and R-ISS stage at screening.
Source: BOSTON Clinical Study Report.4
Figure 36: Subgroup Analysis of Progression-Free Survival Based on IRC Assessment (Updated Analysis)
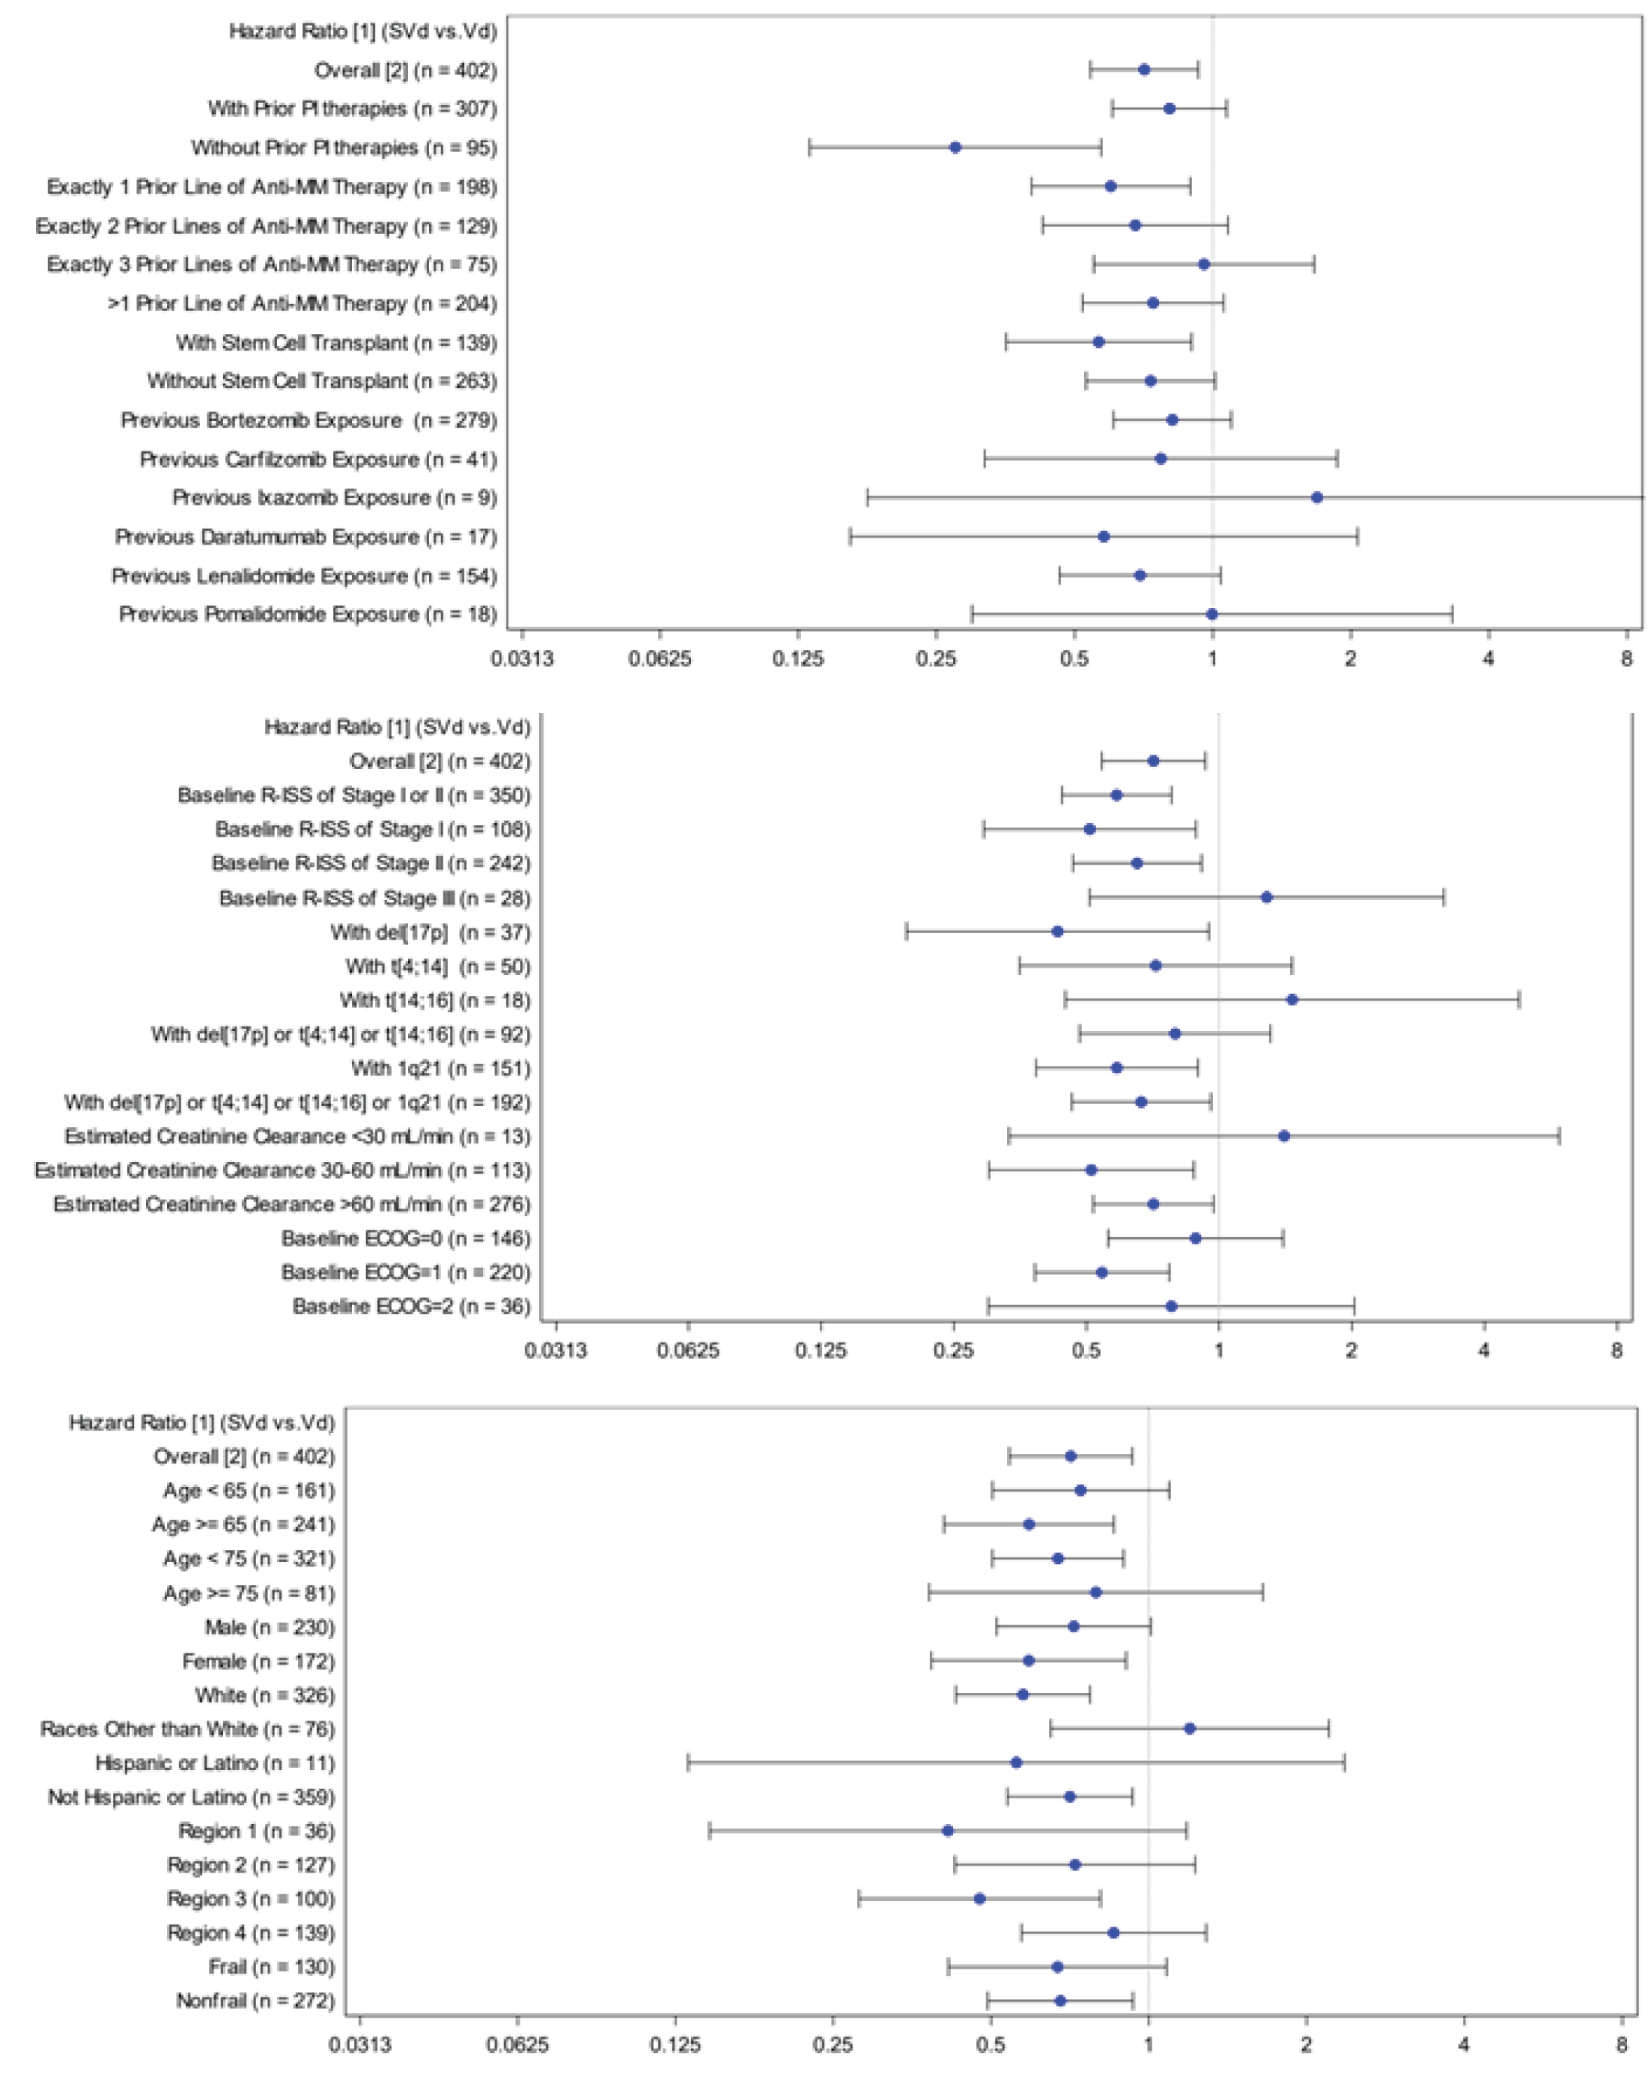
a Based on Cox Proportional Hazard model with Efron method of handling ties.
b Stratified for prior PI therapies, number of prior of anti-MM regimens and R-ISS stage at screening.
Source: Additional information.5
Figure 37: Subgroup Analysis for Overall Survival (Primary Analysis; ITT Population)
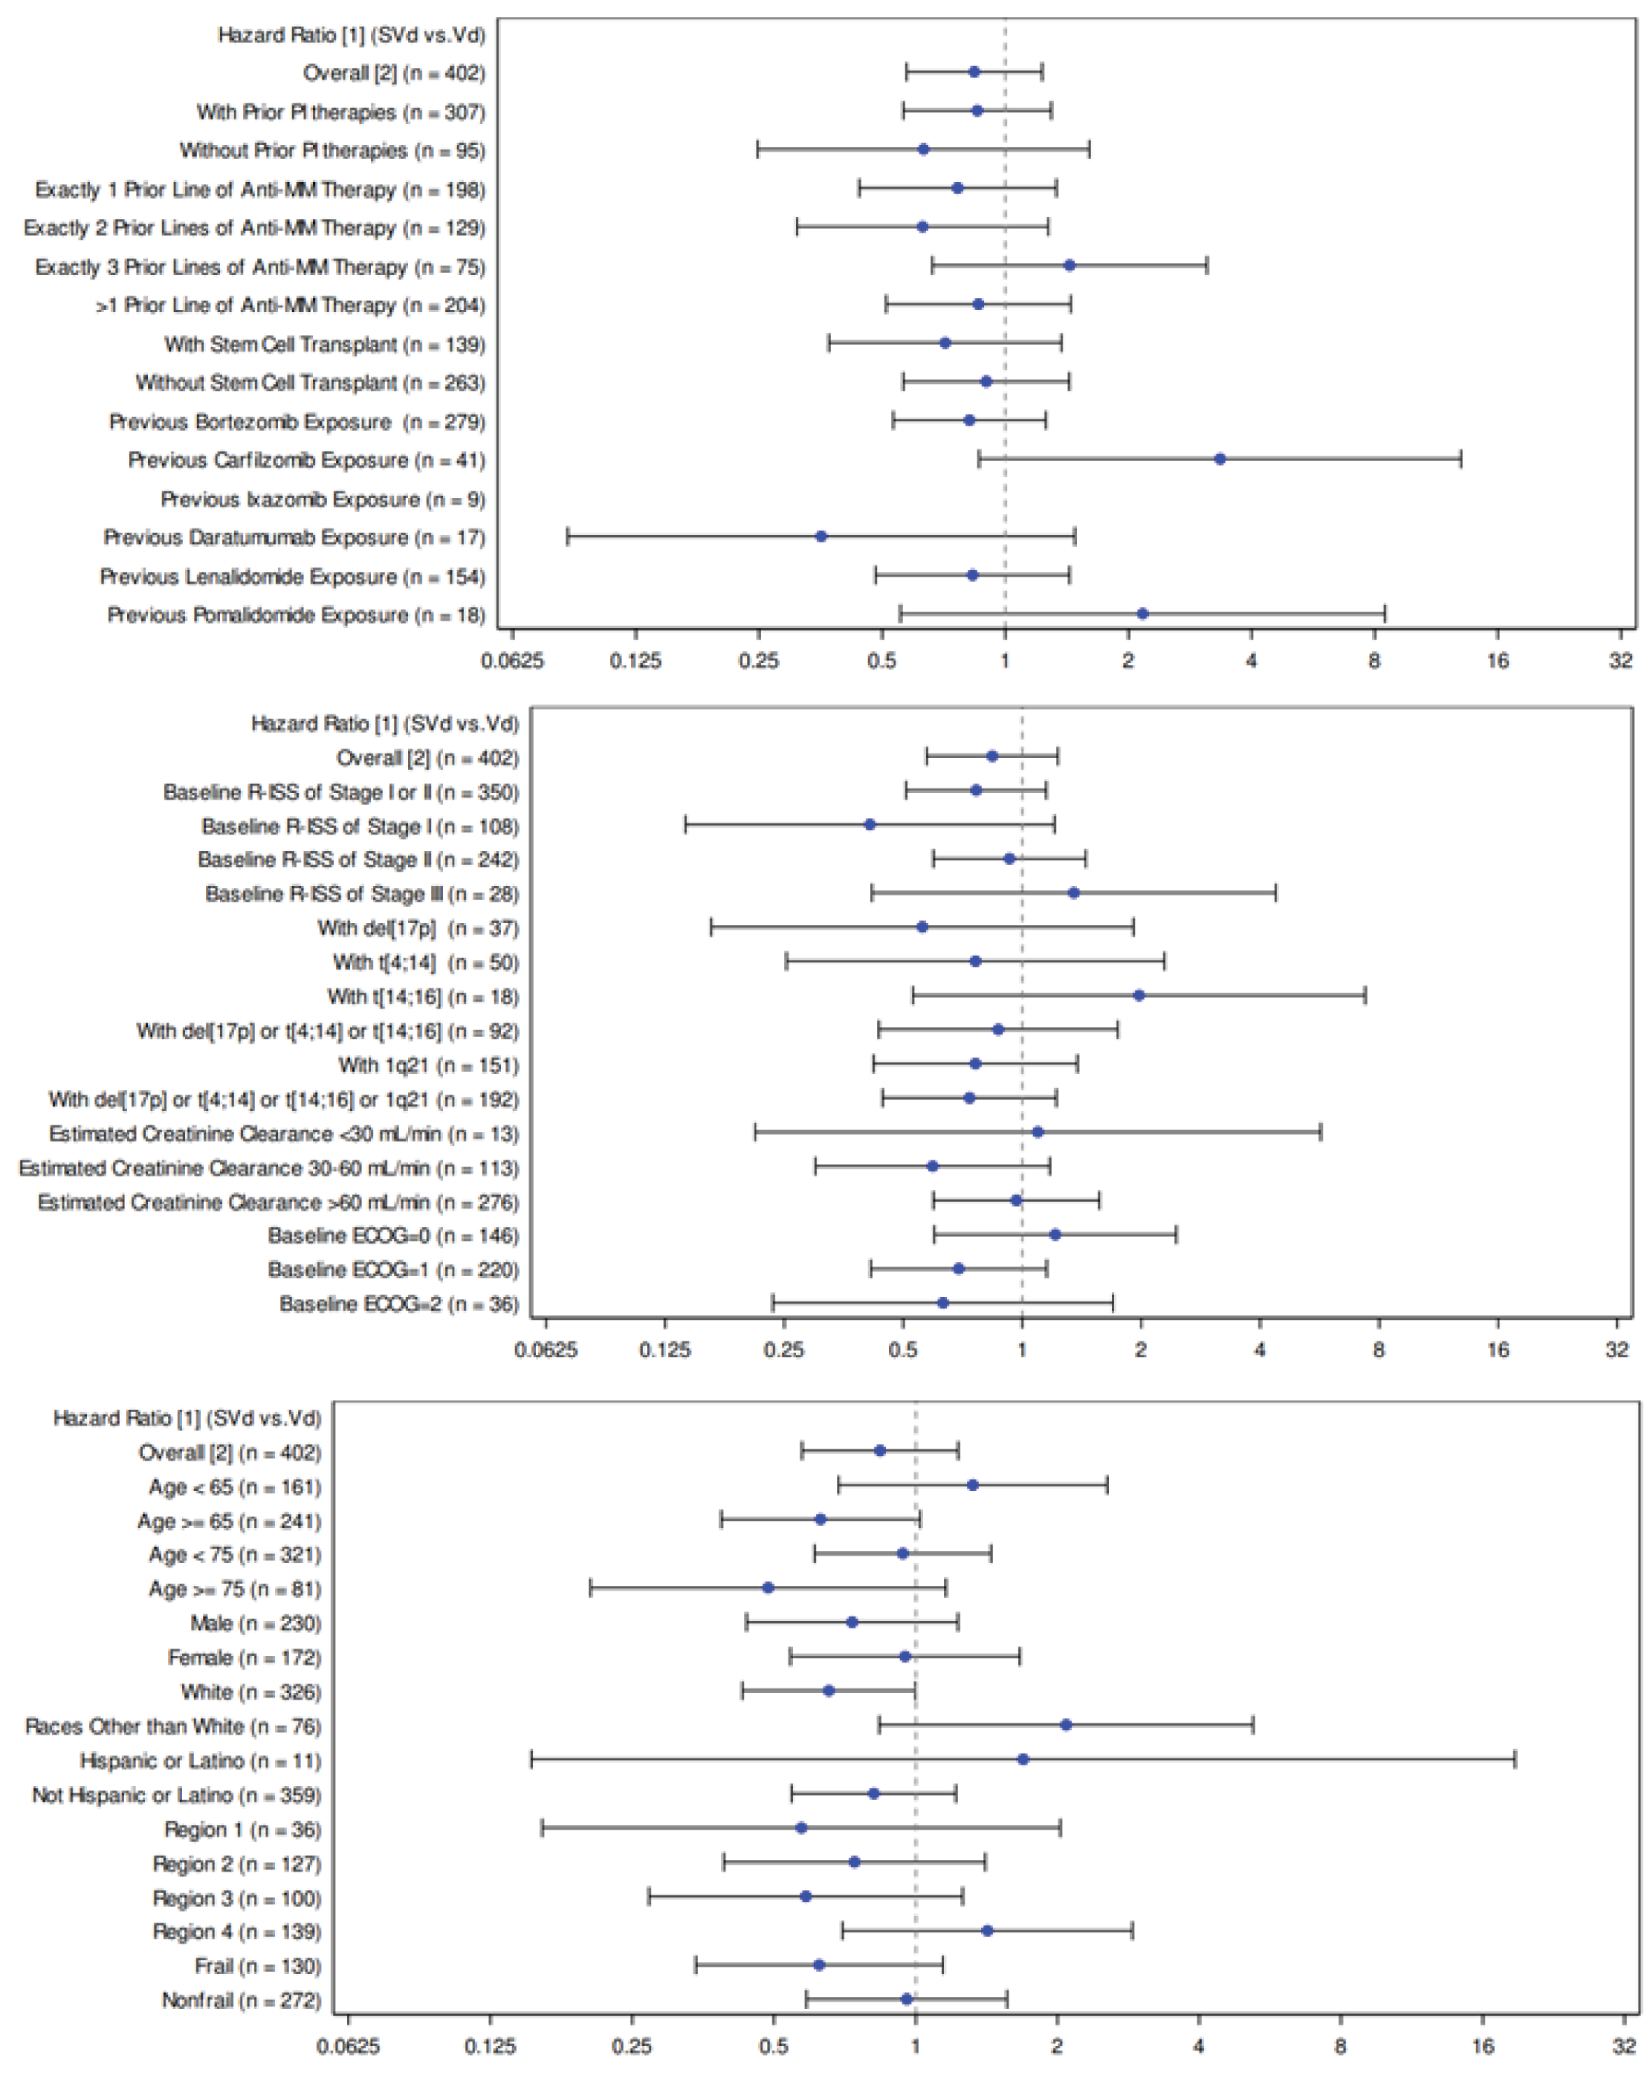
a Based on Cox Proportional Hazard model with Efron method of handling ties.
b Stratified for prior PI therapies, number of prior of anti-MM regimens and R-ISS stage at screening.
Source: BOSTON Clinical Study Report.4
Figure 38: Subgroup Analysis of Overall Response Rate (Partial Response or Better) Based on IRC Assessment
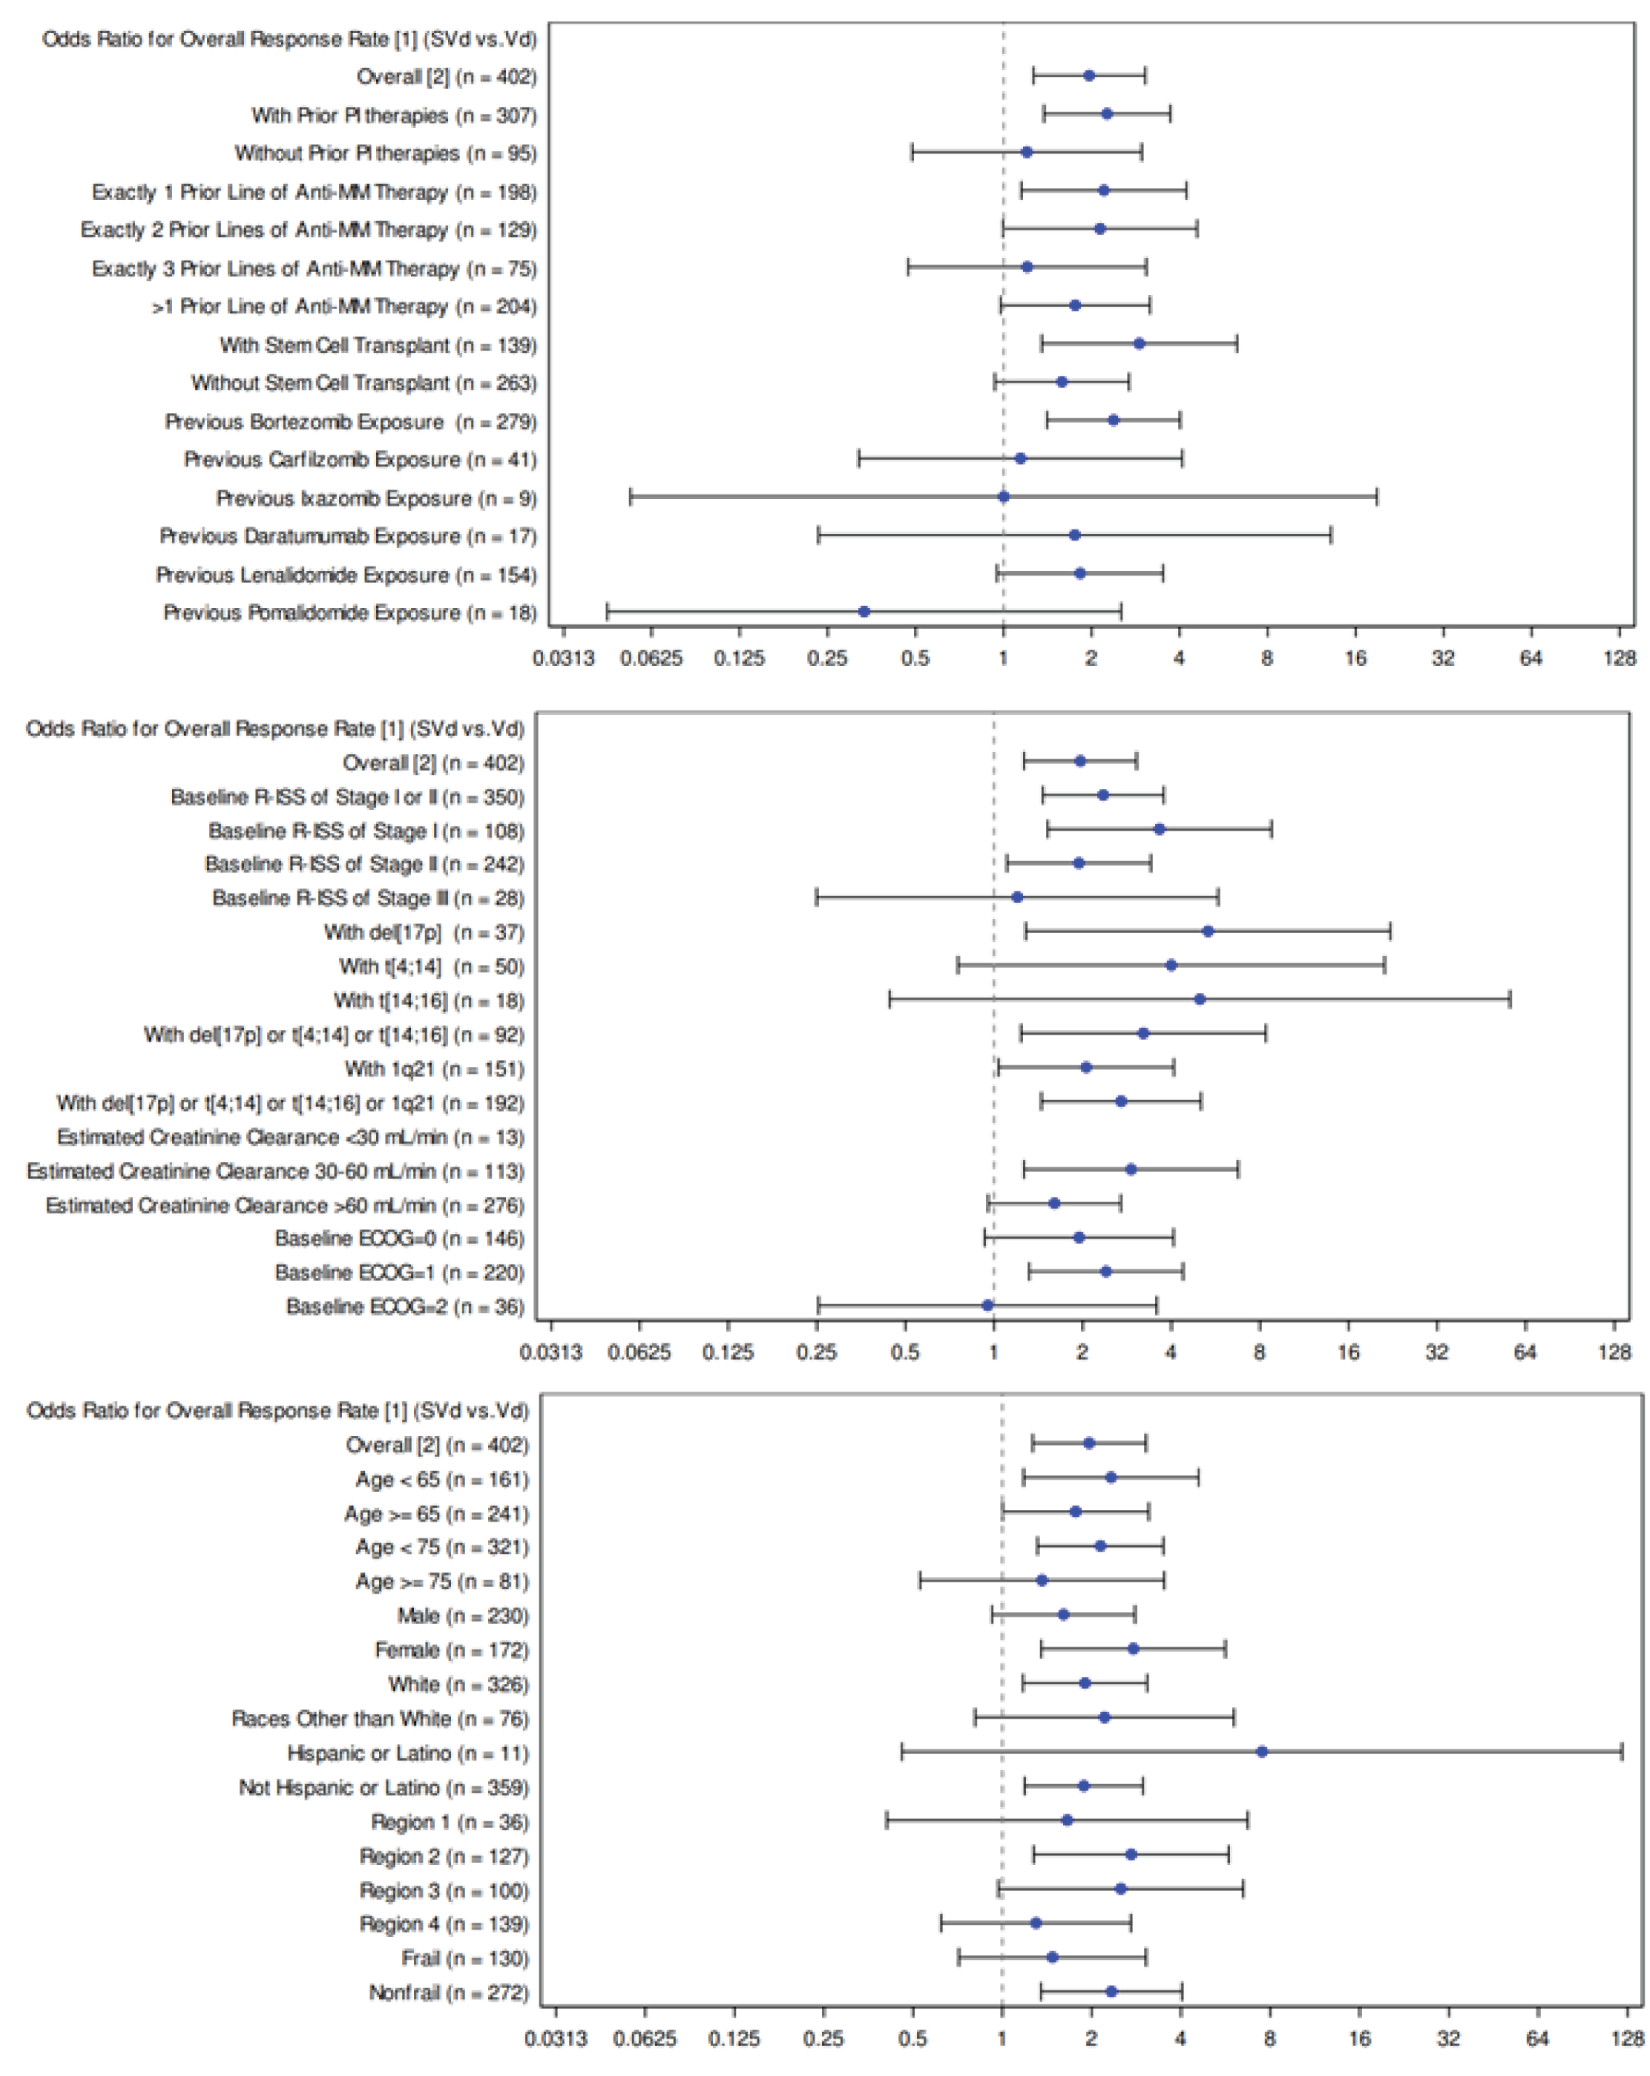
a Overall response rate is the proportion of patients who achieve a partial response or better, before IRC-confirmed PD or initiating a new MM treatment or crossover.
b Stratified for prior PI therapies, number of prior of anti-MM regimens and R-ISS stage at screening.
Source: BOSTON Clinical Study Report.4
Appendix 4: Description and Appraisal of Outcome Measures
Note that this appendix has not been copy-edited.
Aim
To describe the following outcome measures and review their measurement properties (validity, reliability, responsiveness to change, and minimally important difference [MID]):
European Organization for Research and Treatment of Cancer Quality of Life Questionnaire Chemotherapy-induced Peripheral Neuropathy (EORTC QLQ-CIPN20)
European Organization for Research and Treatment of Cancer Core Quality of Life (EORTC QLQ-C30)
European Quality of Life 5 Dimension 5 Level questionnaire (EQ-5D-5L)
Findings
A focused literature search was conducted to identify the psychometric properties and the MID of each of the stated outcome measures. The findings on reliability, validity, responsiveness, and the MID of each outcome measure are summarized in Table 47.
Table 47: Summary of Outcome Measures and Their Measurement Properties
Outcome measure | Type | Conclusions about measurement properties | MID |
|---|---|---|---|
EORTC QLQ-C30 | The EORTC QLQ-C30 is a standardized, patient self-administered questionnaire for evaluating the health-related quality of life of patients with cancer. Consists of functional scales, 3 symptom scales, and 6 single-item scales. | Validity: All subscales shown to be impaired in MM patients compared to population norms.24 No correlation of any subscale with the SEIQoL‐Index, (an instrument which allows patients to select the 5 most important domains for their present QoL and measures their satisfaction in these domains) suggesting independence.25 Reliability: Internal consistency measured using a Cronbach alpha in a study of MM patients: all 5 of the functional scales reported an alpha > 0.7 except for cognitive function (alpha = 0.57).26 Responsiveness: The Global HRQoL scale had SRM values in MM patients who improved (SRM 0.32) and deteriorated (SRM 0.57).27 | Threshold estimates for a small improvement (deterioration) across various cancer sites: Global Health Status GHS/QoL: 5 to 8 (-5 to -10) Function Subscales Cognitive: 3 to 7 (-1 to -7) Emotional: 6 to 9 (-3 to -12) Physical: 2 to 7 (-5 to -10) Role: 6 to 12 (-7 to -14) Social: 3 to 8 (-6 to -11) Symptom Subscales Fatigue: 4 to 9 (-5 to -10) Nausea/vomiting: 3 to 9 (-5 to -11) Pain: 5 to 9 (-3 to -11).43 |
EQ-5D-5L | The EQ-5D-5L is a generic, preference-based, HRQoL measure consisting of 6 questions comprising 5 dimensions (mobility, self-care, usual activities, pain/discomfort, and anxiety/depression) and a VAS which records the subject’s self-rated health. | Responsiveness: SRM values for the EQ-5D-3L in MM patients who improved (SRM 0.43) and deteriorated (SRM 0.45).27 Measurement properties of validity, reliability have not been reported in MM patients. | For the EQ-5D-3L, an absolute change of 0.08 points for improvement and -0.10 points for deterioration in the index score was important to MM patients.42 |
EORTC QLQ-CIPN20 | The QLQ-CIPN20 is a 20-item instrument, self-reported 4-point Likert instrument for evaluating CIPN-related symptoms and functional limitations of patients exposed to potentially neurotoxic chemotherapeutic and/or neuroprotective agents. The questionnaire assesses the severity and functional limitations in sensory (e.g., numbness, tingling, pain), motor (e.g., extremity weakness), and autonomic (e.g., dizziness) subscales. | No evidence was found on the validity, reliability, and responsiveness to change of the EORTC QLQ-CIPN20 in MM patients exclusively, however, studies have assessed the instrument in study populations with an assortment of cancer types (often including a proportion of MM patients). Validity: Convergent validity measured using correlations between baseline QLQ-CIPN20 sensory, Common Toxicity Criteria for Adverse Events, and Brief Pain Inventory-Short Form scores using 2-tailed test. All 3 of the subscales 0.20, 0.20, and 0.03, respectively, all weak. Reliability: Internal consistency reliability measured using a Cronbach alpha in a study: all 3 of the subscales reported an alpha > 0.7. The inter- and intra-rater reliability measured using weighted K Cohen coefficients: all 3 of the functional scales > 0.7, considered acceptable. Responsiveness: Responsiveness to change measured using a Cohen d effect size. The effect size based on the change in sensory scale scores was 0.82 and in motor scale scores was 0.48 (strong and moderate, as per Cohen). There was a moderate correlation between the change scores of the neurotoxicity scale and sensory and motor scales of QLQ-CIPN20 (T2: r = - 0.722, p < 0.001 and r = - 0.518, p < 0.001, respectively; T3: r = - 0.699; p < 0.001 and r = - 0.523, p < 0.001, respectively). The correlation between the change scores of the neurotoxicity scale and the QLQ-CIPN20 autonomic scale was poor (T2: r = - 0.354, p < 0.001; T3: r = 0.286, p < 0.001). | Measurement properties of MID have not been reported in MM patients exclusively. MID for the QLQ-CIPN20 sensory subscale was reported as 2.5-5.9 (6.9% to 16.4% of the subdomain score) and for the motor subscale was 2.6-5.0 (8.1%-15.6% of the subdomain score). |
CIPN20 = Chemotherapy-induced Peripheral; EORTC = European Organization for Research and Treatment of Cancer; HRQoL = health-related quality of life; MID = minimal important difference; QLQ = Quality of Life Questionnaire; SRM = standardized response means; VAS = Visual Analogue Scale.
EORTC QLQ-C30
Description
The EORTC QLQ-C30, is one of the most commonly used patient-reported outcomes measures in oncology clinical trials.28 It is a multi-dimensional, cancer-specific, evaluative measure of HRQoL. The core questionnaire of the EORTC QLQ-C30 consists of 30 questions that are scored to create 6 multi-item functional scales, 2 multi-item symptom scales, 6 single-item symptom scales, and a 2-item QoL scale, as outlined in Table 48.29,30 Version 3.0 of the questionnaire, used in the included trial in this report, is the most current version. The questionnaire is available in more than 100 different languages and has been used in more than 3,000 studies.31
Table 48: Scales of EORTC QLQ-C30
Functional scales (15 questions) | Symptom scales (7 questions) | Single-item symptom scales (6 questions) | Global quality of life (2 questions) |
|---|---|---|---|
Physical function (5) | Fatigue (3) | Dyspnea (1) | Global Quality of Life/Global Health Status (2) |
Role function (2) | Pain (2) | Insomnia (1) | NA |
Cognitive function (2) | Nausea and vomiting (2) | Appetite loss (1) | NA |
Emotional function (4) | NA | Constipation (1) | NA |
Social function (2) | NA | Diarrhea (1) | NA |
NA | NA | Financial impact (1) | NA |
Scoring
The EORTC QLQ-C30 uses a 1-week recall period in assessing function and symptoms. Most questions have 4 response options (“not at all,” “a little,” “quite a bit,” “very much”), with scores on these items ranging from 1 to 4.29 For the 2 items that form the global QoL scale, however, the response format is a 7-point Likert-type scale, with anchors between 1 (very poor) and 7 (excellent).
Raw scores for each scale are computed as the average of the items that contribute to a particular scale.29 This scaling approach is based upon the assumption that it is appropriate to provide equal weighting to each item that comprises a scale. There is also an assumption that, for each item, the interval between response options is equal (for example, the difference in score between “not at all” and “a little” is the same as “a little” and “quite a bit,” at a value of one unit). Each raw scale score is converted to a standardized score that ranges from 0 to 100 using a linear transformation, with a higher score reflecting better function on the function scales, higher symptoms on the symptom scales, and better QoL (i.e., higher scores simply reflect higher levels of response on that scale). Thus, a decline in score on the symptom scale would reflect an improvement, whereas an increase in score on the function and QoL scale would reflect an improvement. According to the EORTC QLQ-C30’s scoring algorithm, if there are missing items for a scale (i.e., the participant did not provide a response), the score for the scale can still be computed if there are responses for at least one-half of the items. In calculating the scale score, the missing items are simply ignored — an approach that assumes that the missing items have values equal to the average of those items for what the respondent completed.
Validity
Osborne et al. (2012)24 assessed the reported construct and criterion validity of the EORTC QLQ-C30. A systematic review was conducted to identify HRQoL tools validated for use in MM; identify issues important to HRQoL from the point of view of patients with myeloma; describe the measurement properties of each HRQoL tool; evaluate the content validity of HRQoL tools in terms of their ability to capture all issues important to patients and to explore the suitability of each HRQoL tool for use in different settings. Results of the systematic review showed that all subscales of patients with MM were shown to be impaired compared to the general population.32-36 General QoL scales significantly improved with increasing time post–hematopoietic stem cell transplant.36 Sixty-seven percent and 43% of patients scored below the 10th percentile for the physical functioning and global QoL subscales, respectively.35 Functional subscales and global QoL were found to be lower in MM than in general hematology populations.34 The subscales for pain, fatigue, physical and global QoL were able to discriminate between those who improved versus those who were stable/deteriorated.37 All subscales except the single-item diarrhea scale discriminated between MM patients with different performance status and response status.38 There were significant differences in global QoL between the different treatment arms in 2 examined trials of patients with MM.39,40 Additionally, there was no correlation of any subscale with the SEIQoL‐Index (an instrument which allows patients to select the 5 most important domains for their present QoL and measures their satisfaction in these domains) suggesting independence.25
Reliability
A sample of MM patients (n = 89) from 2 tertiary hospitals in Greece were surveyed with the EORTC QLQ-C30 and various demographic and disease-related questions.26 Internal consistency of the QLQ-C30 was assessed in this population. The 5 functional scales reported an internal consistency of greater than 0.7 (range, 0.77 to 0.90).7 except for cognitive function (alpha = 0.57). The global health status/HRQoL scale reported an internal consistency (alpha) of 0.92. Of the symptom scales, fatigue (alpha = 0.89), nausea and vomiting (alpha = 0.74) and pain (alpha = 0.80) were assessed for internal consistency, and all were considered acceptable. The 5 symptom scales/items of the core QLQ-C30, that is, nausea/vomiting, appetite loss, constipation, diarrhea, and financial difficulties suffered from high (>50%) floor scores, implying a lack of these symptoms in this sample, but also suggesting an underlying reduced discriminative ability. Conversely, no ceiling effects were observed on the core instrument despite 3 scales being close to the threshold value (role, cognitive, and social functioning).
Responsiveness to Change
One study by Kvam et al. (2011)27 assessed HRQoL in patients with MM (n = 239) in Norway using the global health ⁄ QoL domains of the EORTC QLQ-C30. To assess responsiveness, the study used the global rating of change (GRC) to identify whether MM patients have changed over time. A Wilcoxon signed-rank test for pair differences was used to calculate the significance of differences in the mean score changes between baseline (T1) and after 3 months (T2). Due to the small sample sizes in some of the GRC categories, data were pooled into the categories improved, unchanged, and deteriorated to yield sufficient numbers of cases in each category. “Improved” represented patients ‘who reported themselves as improved’ and similarly for deteriorated and unchanged patients. To assess the magnitude of the difference in scores between patients who improved ⁄ unchanged ⁄ deteriorated, standardized response means (SRMs) were calculated by dividing the mean score changes by the standard deviation (SD) of the change. This was compared against Cohen theory for interpreting the magnitude of mean differences in HRQoL scores, which suggests that a change of 0.20 represents a small change, 0.50 a moderate change, and >0.80 a large change.
In patients rating themselves as unchanged, mean score changes clustered around 0, and the SRMs were negligible.27 MM patients who deteriorated reported lower global QoL scores at T2 compared with T1. The global QoL scale of the EORTC QLQ-C30 was the most responsive in deteriorating patients (SRM 0.57).
Minimal Important Difference
A study41 examined 118 published studies on various types of cancer such as breast, lung, or head and neck as well as clinician expert input to evaluate meaningful differences and magnitude of change in the EORTC QLQ-C30 scores. A meta-analysis was conducted to estimate a weighted average change within each size class for large, medium, small, and trivial changes. Small changes indicated a subtle, clinically relevant change. The calculations or symptom subscales were reversed to achieve consistency in improvement or deteriorations over time across all scales. MIDs for improvement and deterioration for small changes in QoL are shown in Table 19.
One study37 assessed the MID of the EORTC QLQ-C30 by recruiting 239 patients with MM to complete the EORTC QLQ-C30 at baseline (T1) and after 3 months (T2). At T2, patients were asked if they had noticed any change in the domains pain, fatigue, physical function and global QoL. The MID was determined using the mean score changes as observed by the patients stating improvement or deterioration for each domain. A combination anchor and distribution approach were used. The MIDs (SD) for patients rating themselves as improved was 6.2 (15.3) for physical function, -14.7 (35.9) for pain, -13.5 (24.7) for fatigue and 7.6 (23.7) for QoL. Patients reporting deterioration had MIDs (SD) of 8.6 (23.4) for fatigue, 17.3 (23.1) for pain, -12.8 (19.2) for physical function, and -12.1 (21.2) for QoL. However, there was considerable variation in the observed scores.
EQ-5D 5-Levels Questionnaire
Description
The EQ-5D-5L is a generic preference-based HRQoL instrument that has been applied to a wide range of health conditions and treatments including MM. The EQ-5D-5L was developed by the EuroQol Group as an improvement to the EQ-5D 3=Level (EQ-5D-3L), to measure small and medium health changes and reduce ceiling effects. The instrument is comprised of 5 dimensions: mobility, self-care, usual activities, pain/discomfort, and anxiety/depression. Each dimension is rated on 5 levels: level 1 “no problems,” level 2 “slight problems,” level 3 “moderate problems,” level 4 “severe problems,” and level 5 “extreme problems” or “unable to perform.” A total of 3,125 unique health states are possible, with 55555 representing the worst health state and 11111 representing the best state. The corresponding scoring of EQ-5D-5L health states is based on a scoring algorithm that is derived from preference data obtained from interviews using choice-based techniques (e.g., time trade-off) and discrete choice experiment tasks. The lowest score varies depending on the scoring algorithm used. The anchors are 0 (dead) and 1 (full health), however negative values are also allowed to represent health states that a society considers worse than death. As an example, a Canadian scoring algorithm results in a score of -0.148 for health state 55555 (worst health state). Another component of the EQ-5D-5L is a VAS that asks respondents to rate their health on a visual scale from 0 (worst health imaginable) to 100 (best health imaginable).42
The EQ-5D-5L has been extensively validated across countries around the world and in various conditions. However, the psychometric properties of the EQ-5D-5L have not been assessed in patients with MM, therefore its validity, reliability, and responsiveness to change have not been evaluated in this patient population of interest.
Responsiveness
Kvam et al. (2011)27 also assessed the responsiveness of the EQ-5D-3L using the aforementioned methods. The results found that the EQ-5D-3L was the most responsive among improved patients (SRM 0.43). The global QoL scale of the EQ-5D-3L for deteriorating patients had a SRM 0.45. The study also assessed the presence of floor and ceiling effects for EQ-5D-3L. A small floor or ceiling effect was defined as < 15% of patients attaining the worst and best health state and a serious effect was defined as > 15% of patients attaining these states. The results found small floor and ceiling effects for the EQ-5D-3L and noted that 10% of the patients achieved the maximum score (ceiling effect).
Minimal Important Difference
Kvam et al. (2011)27 used both distribution and anchor-based approaches for the whole sample (N = 239) to determine MIDs for the EQ-5D-3L. The distribution-based approach was determined by multiplying the SDs at baseline and expected differences in scores associated with small (0.2), moderate (0.5), or large (0.8) changes as per the Cohen criteria for interpreting the absolute magnitude of a change. From this analysis, using the small effect size as a value of MIDs, the expected MID score was 0.04 for the EQ-5D-3L. The anchor-based approach used the GRC as previously described as the anchor. From this analysis, an MID of 0.08 (95% CI: 0.04 to 0.12) in MM patients who thought their HRQoL improved, and -0.10 (95% CI: -0.16 to -0.04) in those who thought their HRQoL deteriorated.
To estimate the MID values of the EQ-5D-3L for each country-specific scoring algorithm, a simulation-based approach based on instrument-defined single-level transitions has been used. The simulation-based instrument-defined generally accepted MID estimate (mean ± SD) for Canada is 0.056 ± 0.011.43
EORTC QLQ-CIPN20
Description
The EORTC QLQ-CIPN20 is a 20-item self-report questionnaire, aimed to supplement the EORTC QLQ-C30. The questionnaire is a multi-dimensional, cancer-specific tool consisting of 20 items evaluating symptoms and functional limitations related to CIPN symptoms.44 The EORTC QLQ-CPIN20 consists of 3 subscales, including a sensory, motor, and autonomic subscale each containing 9, 8, and 3 items, respectively.
Scoring
The EORTC QLQ-CIPN20 uses a 4-point Likert scale (1 = “not at all,” 2 = “a little,” 3 = “quite a bit,” and 4 = “very much”). Sensory raw scale scores range from 1 to 36, motor raw scale scores range from 1 to 32, and autonomic raw scale scores range from 1 to 12 for males and 1 to 8 for females (erectile-function item is excluded).
All scale scores are linearly converted to a 0–100 scale, with higher scores indicating a higher symptom burden.
Validity
No evidence was found on the validity of the EORTC QLQ-CIPN20 in MM patients exclusively, however, studies have assessed the instrument in study populations with an assortment of cancer types (often including a proportion of MM patients). Based on pre-testing sample reliability the Cronbach alpha coefficient internal consistency was 0.82 for sensory subscale, 0.73 for motor subscale and 0.76 for autonomic subscale in the original development of the questionnaire.44 Lavoie Smith et al. (2013)45 also evaluated the construct and convergent validity of the EORTC QLQ-CIPN20. QLQ-CIPN20 scores were pooled from 4 neuropathy treatment and prevention multi-site cancer cooperative group trials across 125 sites in the US and Canada (N = 575). The QLQ-CIPN20’s construct validity was assessed using exploratory factor analysis. Bartlett’s test of sphericity indicated that the correlation matrix was factorable (χ 2 = 653.81, P > 0.0001). The Kaiser–Meyer–Olkin statistical measure of sampling adequacy was 0.83. Values for measures of sampling adequacy for individual items ranged from 0.74 to 0.93, strong as per Cohen classification.
The QLQ-CIPN20’s convergent validity was evaluated by assessing the correlations between baseline QLQ-CIPN20 sensory, Common Toxicity Criteria for Adverse Events (CTCAE), and Brief Pain Inventory-Short Form (BPI-SF) scores in data from 1 of 4 trials using 2-tailed test. Correlations between the sensory, motor, and autonomic scales and the Common Toxicity Criteria for Adverse Events sensory grading scale scores were −0.20, 0.20, and 0.03, respectively, all weak as per Cohen classification.46 specifically, correlations among 2 QLQ-CIPN20 items assessing burning and shooting pain (items 5 and 6) and the BPI-SF pain severity questions assessing least, worse, and average pain, as well as pain right now were low-moderate. Correlations among QLQ-CIPN20 sensory and motor scale scores and BPI-SF pain severity items were also low-moderate. R range for the aforementioned correlation were reported as 0.30–0.57, P ≤ .0001. The revised 16-Item QLQ-CIPN20 did not correlate with the CTCAE (r range 0.16–0.21, P ≤ .05). Lower extremity sub score correlations with all BPI-SF pain severity items were moderate (r range 0.46–0.55, P ≤0 .0001), while upper extremity score correlations were low (r range 0.25–0.30, P ≤ .001).
Lavoie Smith et al. (2017) also assessed the content validity of a 16-item EORTC QLQ-CIPN20 in cancer patients.47 In this study, 25 cancer patients with CIPN, including 5 with MM completed the instrument and were interviewed using semi-structured cognitive interviewing techniques and a panel of clinical experts rated the questionnaire items at a single academic institution in the US. Per the authors, results from the factor analysis of a prior validity study indicated that the 3 autonomic items addressing orthostatic hypotension, blurred vision, and erectile dysfunction, and a hearing loss item, were not highly correlated with the other questionnaire items (r < 0.3); therefore, these 3 items were excluded from the 16-item version of the EORTC QLQ-CIPN questionnaire. After interviewing patients about the questionnaire, language was tweaked, and an additional question was omitted to create the EORTC QLQ-CIPN15. The authors cited that social desirability was the main factor that led to removal of the question that assessed difficulty using the pedals when driving a car, as patients said they did not think people would answer this question honestly (responses could result in loss of driving privileges). The authors elicited a panel of 5 clinical experts to rate each of the questionnaire items, for the purposes of calculating a content validity index (CVI), where 0.8–1 was considered to be excellent. Overall, the CVI coefficient was 0.8, 1 (p = 0.05) for 12 items and 0.8 for 3 items (about ankle flexion and cramps in the hands and feet), suggesting excellent content validity.
Reliability
No evidence was found assessing the reliability of the EORTC QLQ-CIPN20 in MM patients exclusively, however, studies have assessed the instrument in study populations with an assortment of cancer types (often including a proportion of MM patients).45,48 Lavoie Smith et al. (2013)45 evaluated the internal consistency reliability of the EORTC QLQ-CIPN20. QLQ-CIPN20 scores were pooled from 4 neuropathy treatment and prevention multi-site cancer cooperative group trials across 125 sites in the US and Canada (N = 575). Participants were pooled to create 2 groups (n = 376, 575): those who did versus did not receive neurotoxic chemotherapy. The Cronbach alpha coefficients for the sensory, motor, and autonomic scales were 0.88, 0.88, and 0.78, respectively (almost perfect or substantial). Item-to-total score correlations for most items were reported as “moderate,” ranging from 0.44 to 0.63 and items 16, 17, 18, and 20 had the lowest item-total score correlations (r range 0.33–0.40).
Cavaletti et al. (2013) assessed the reliability of the QLQ-CIPN20.48 281 patients with stable CIPN were asked to complete the VAS, PI-NRS, EORTC QLQ-C30, and QLQ-CIPN20 in a random order. Within 2–3 weeks, subjects returned for visit 2 and both investigators re-examined each participant (for intra-observer comparison) without having access to the previous data. The patient-reported outcome measures were also completed by each patient for a second time (test–retest study). The inter- and intra-rater agreement was evaluated by means of weighted K Cohen coefficients and 95% confidence intervals. Coefficients for the sensory, motor, and autonomic were 0.84, 0.84, and 0.73, respectively (almost perfect or substantial), confidence intervals were not reported.
Responsiveness to Change
No evidence was found assessing the responsiveness to change of the EORTC QLQ-CIPN20 in MM patients exclusively, however, studies have assessed the instrument in study populations with an assortment of cancer types (often including a proportion of MM patients). Lavoie Smith et al. (2013)45 evaluated the responsiveness to change by calculating the Cohen d effect size based on changes in QLQ-CIPN20 scores from individuals participating in 1 of the 4 trials because neuropathy was expected to worsen over time as patients received higher cumulative doses of neurotoxic agents. The effect size based on the change in sensory scale scores was 0.82 and in motor scale scores was 0.48 (strong and moderate, respectively, as per Cohen).46 Yeo et al. (2019) used a distribution-based approach in cancer patients receiving neurotoxic chemotherapy who completed EORTC QLQ-CIPN20 and the Functional Assessment of Cancer Therapy/Gynecologic Oncology Group-Neurotoxicity (FACT/GOG-NTX) at baseline, second cycle of chemotherapy (T2, n = 287), and 12 months after chemotherapy (T3, n = 191). The distribution-based approach used one-third SD, half SD, and 1 standard error of measurement of the total EORTC QLQ-CIPN20 score. There was a moderate correlation between the change scores of the neurotoxicity scale and sensory and motor scales of QLQ-CIPN20 (T2: r = - 0.722, p < 0.001 and r = - 0.518, p < 0.001, respectively; T3: r = - 0.699; p < 0.001 and r = - 0.523, p < 0.001, respectively). The correlation between the change scores of the neurotoxicity scale and the QLQ-CIPN20 autonomic scale was reportedly poor (T2: r = - 0.354, p < 0.001; T3: r = 0.286, p < 0.001).
Minimal Important Difference
No evidence was found assessing the MID of the EORTC QLQ-CIPN20 in MM patients exclusively, however 1 study assessed in cancer patients more broadly.49 Cancer patients receiving neurotoxic chemotherapy completed EORTC QLQ-CIPN20 and the FACT/GOG-NTX at baseline, second cycle of chemotherapy (T2, n = 287), and 12 months after chemotherapy (T3, n = 191). A distribution-based approach used one-third SD, half SD, and 1 standard error of measurement of the total EORTC QLQ-CIPN20 score. The MID for the QLQ-CIPN20 sensory scale was 2.5-5.9 (6.9% to 16.4% of the subdomain score) and for motor scale was 2.6-5.0 (8.1%-15.6% of the subdomain score).
Pharmacoeconomic Review
Abbreviations
AE
adverse event
BIA
budget impact analysis
CyBorD
cyclophosphamide plus bortezomib plus dexamethasone
DRd
daratumumab plus lenalidomide plus dexamethasone
DVd
daratumumab plus bortezomib plus dexamethasone
HR
hazard ratio
HRQoL
health-related quality of life
ICER
incremental cost-effectiveness ratio
ITC
indirect treatment comparison
KCd
carfilzomib plus cyclophosphamide plus dexamethasone
Kd
carfilzomib plus dexamethasone
KRd
carfilzomib plus lenalidomide plus dexamethasone
MM
multiple myeloma
NMA
network meta-analysis
OS
overall survival
PFS
progression-free survival
PSM
partitioned survival model
PVd
pomalidomide plus bortezomib plus dexamethasone
QALY
quality-adjusted life-year
Rd
lenalidomide plus dexamethasone
RRMM
relapse or refractory multiple myeloma
RDI
relative dose intensity
SOC
standard of care
SVd
selinexor plus bortezomib plus dexamethasone
WTP
willingness to pay
Vd
bortezomib plus dexamethasone
Executive Summary
The executive summary comprises 2 tables (Table 1 and Table 2) and a conclusion.
Item | Description |
|---|---|
Drug product | Selinexor (Xpovio), 20 mg oral tablet |
Submitted price | Selinexor, 20 mg: $550.00 per tablet |
Indication | Proposed: In combination with bortezomib and dexamethasone for the treatment of adult patients with multiple myeloma who have received at least 1 prior therapy |
Health Canada approval status | Under review (pre-NOC) |
Health Canada review pathway | Standard |
NOC date | Anticipated: June 2, 2022 |
Reimbursement request | As per indication |
Sponsor | FORUS Therapeutics Inc. |
Submission history | No |
NOC = Notice of Compliance.
Table 2: Summary of Economic Evaluation
Component | Description |
|---|---|
Type of economic evaluation | Cost-utility analysis Partitioned survival model |
Target population | Adult patients with multiple myeloma who have received at least 1 prior therapy |
Treatment | Selinexor in combination with bortezomib and dexamethasone (SVd) |
Comparators | Vd (bortezomib + dexamethasone) PVd (pomalidomide + bortezomib + dexamethasone) KCd (carfilzomib + cyclophosphamide + dexamethasone) Kd (carfilzomib + dexamethasone) CyBorD (cyclophosphamide + bortezomib + dexamethasone) DVd (daratumumab + bortezomib + dexamethasone) DRd (daratumumab + lenalidomide + dexamethasone) Rd (lenalidomide + dexamethasone) KRd (carfilzomib + lenalidomide + dexamethasone) Standard of care (assumed to consist of an equally weighted average of Vd, PVd, KCd, Kd, CyBorD, DVd, DRd, Rd, and KRd) |
Perspective | Canadian publicly funded health care payer |
Outcomes | QALYs, life-years |
Time horizon | 20 years |
Key data source | Network meta-analysis; OS and PFS estimates for SVd informed by the BOSTON trial |
Submitted results | SVd was associated with estimated costs of $238,983 and 3.68 QALYs over a 20-year time horizon. In sequential analysis, SVd was extendedly dominated by CyBorD and DVd. |
Key limitations |
|
CADTH reanalysis results |
|
CyBorD = cyclophosphamide + bortezomib + dexamethasone; DRd = daratumumab + lenalidomide + dexamethasone; DVd = daratumumab + bortezomib + dexamethasone; ICER = incremental cost-effectiveness ratio; KCd = carfilzomib + cyclophosphamide + dexamethasone; Kd = carfilzomib + dexamethasone; KRd = carfilzomib + lenalidomide + dexamethasone; OS = overall survival; PFS = progression-free survival; PVd = pomalidomide + bortezomib + dexamethasone; QALY = quality-adjusted life-year; Rd = lenalidomide + dexamethasone; SVd = selinexor + bortezomib + dexamethasone; Vd = bortezomib + dexamethasone.
Conclusions
Data from the BOSTON trial suggest that selinexor plus bortezomib plus dexamethasone (SVd) improves progression-free survival (PFS) relative to bortezomib plus dexamethasone (Vd) among patients with multiple myeloma (MM) who have received 1 to 3 prior lines of therapy. The effects of SVd on overall survival (OS) are highly uncertain, as is its effect on health-related quality of life (HRQoL). Indirect treatment comparisons (ITCs) suggest that SVd may improve PFS and OS relative to some comparators; however, SVd may have worse PFS and OS outcomes relative to others (i.e., daratumumab-based regimens). Overall, given the methodological limitations with the ITCs and imprecision with the results, the magnitude and direction of the results are highly uncertain.
CADTH undertook a reanalysis, within the constraints of the sponsor’s partitioned survival model (PSM), to assess the cost-effectiveness of SVd relative to Vd, based on data from the BOSTON trial. This reanalysis addressed some limitations in the sponsor’s submission by correcting the price of bortezomib, assuming an equivalent OS for SVd and Vd, adopting the PFS estimate from the BOSTON trial, adopting alternative parametric distributions for OS and PFS, adopting health state utility values based the BOSTON trial, removing the utility benefit for treatment responders, and assuming that all patients receive the full dose of all drugs. CADTH was unable to address the limitations with the chosen modelling approach, the lack of head-to-head comparative clinical data for additional relevant comparators, the cost-effectiveness of SVd in relevant subgroups, and uncertainty associated with the use of subsequent therapy after disease progression. CADTH notes that these exploratory results may underestimate the true incremental cost-effectiveness ratio (ICER).
In the CADTH exploratory reanalysis, SVd had a 0% probability of being cost-effective at a willingness-to-pay (WTP) threshold of $50,000 per quality-adjusted life-year (QALY), with an ICER of $10,884,623 (incremental QALYs: 0.01; incremental costs: $105,010). The key drivers of the ICER are the small incremental QALYs associated with SVd treatment and the cost of selinexor acquisition. Incremental QALYs are small, as no evidence was presented to suggest additional life-years gained with SVd relative to Vd, and evidence from the trial suggested HRQoL improvements are uncertain. In this reanalysis, a 93% price reduction would be required for SVd to be considered optimal at a WTP threshold of $50,000 per QALY compared to Vd. However, this reanalysis assumed that the magnitude of the PFS benefit would be equivalent to the estimate from the BOSTON trial. As noted in the CADTH Clinical Review, it is possible that the PFS estimate from the BOSTON trial is biased in favour of SVd. Should the PFS benefit be lower than anticipated, there will be an even smaller difference in QALYs between SVd and Vd (to 3 decimal places).
The cost-effectiveness of SVd relative to most comparators is unknown due to a lack of robust comparative data, and there is insufficient evidence to suggest that SVd should be priced higher than other treatment regimens for relapsed or refractory multiple myeloma (RRMM). The indirect evidence presented by the sponsor indicates that some drugs (e.g., ||||||||||) may be preferred over SVd in the treatment of RRMM. Using the sponsor’s base case, SVd would not be cost-effective compared to DVd, even with a 100% price reduction for selinexor because of the substantially fewer QALYs gained with SVd compared to DVd. Although this evidence is associated with substantial uncertainty, SVd may need to be priced substantially lower than currently available treatment options to compensate for potential negative effects on health.
Stakeholder Input Relevant to the Economic Review
This section is a summary of the feedback received from the patient groups, registered clinicians, and drug plans that participated in the CADTH review process (specifically, information that pertains to the economic submission).
Patient input was received from Myeloma Canada from patients with myeloma who had received at least 1 prior line of therapy, collected via online surveys. Patients noted the impact of myeloma on their ability to travel, work, exercise, and concentrate, as well as financial implications (e.g., drug costs, parking costs, travel costs, lost income due to work absences, lost income or pensions due to early retirement). Patients noted a desire for a treatment that improves quality of life, has manageable side effects, improves mobility, and can control infections, kidney problems, neuropathy, and fatigue. Some respondents noted that an oral treatment would be preferred over subcutaneous injection or infusion. Respondents who had experience with regimens containing bortezomib and dexamethasone described adverse events (AEs), including fatigue, diarrhea, nausea, anemia, thrombocytopenia, neutropenia with peripheral neuropathy, weight loss, and decreased appetite. (Fatigue and diarrhea were noted to be the least tolerable AEs.) One of the 2 respondents with experience with selinexor (as part of the BOSTON trial) noted that nausea was tolerable, while the other noted that diarrhea, peripheral neuropathy, and vomiting were “somewhat intolerable.”
Clinician input was received from the Canadian Myeloma Research Group and the Ontario Health–Cancer Care Ontario Drug Advisory Committee. The clinician groups indicated that, at present, patients typically receive a lenalidomide-based regimen, such as lenalidomide plus dexamethasone (Rd), lenalidomide plus bortezomib plus dexamethasone (RVd), or daratumumab plus lenalidomide plus dexamethasone (DRd) in the first line, and that second-line therapy depends on the initial treatment received. Second-line treatments may include daratumumab-based regimens (e.g., in combination with bortezomib and dexamethasone [DVd] or with lenalidomide plus dexamethasone [DRd]). Clinicians indicated that third-line therapy may include carfilzomib (e.g., in combination with dexamethasone [Kd] or with dexamethasone and cyclophosphamide [KCd]) or pomalidomide (in combination with dexamethasone [Pd], with dexamethasone and cyclophosphamide [PCd], or with dexamethasone and bortezomib [PVd]). Input from clinician groups noted that the introduction of selinexor is unlikely to affect the current sequencing of treatments and that SVd will be most likely used as a third-line or later treatment. Clinicians noted that the goal of therapy is to extend OS and PFS, as well as reduce myeloma cell burden and disease-related complications (e.g., anemia, ongoing lytic bone destruction, renal failure, and hypercalcemia). Clinicians noted that the availability of an oral treatment may reduce administration-related health care visits and be more convenient for patients.
CADTH-participating drug plans noted considerations related to relevant comparators and potential implementation factors. The plans noted that, in the BOSTON trial, the dosage of selinexor could be increased to 120 mg weekly starting in cycle 3 for patients who did not achieve at least a partial response within the first 2 cycles and who were able to tolerate the 100 mg dose. The plans additionally noted that, in BOSTON, bortezomib was administered twice weekly, which differs from the dosing schedule in most participating jurisdictions (i.e., once weekly) and that the dosing schedule for Vd differs when used in combination with selinexor compared to when used alone. The plans noted that patients taking selinexor may require additional health care resources (e.g., ophthalmologist or oncologist visits) to monitor and address AEs. The drug plans noted that the introduction of selinexor may change the sequencing of treatments in previous and subsequent lines and added that selinexor is a high-cost drug relative to some other treatment options.
Two of these concerns were addressed in the sponsor’s model:
PFS and quality of life were incorporated into the model.
Costs and quality-of-life decrements related to the treatment of AEs of grade 3 or higher were included.
CADTH was unable to address the following concerns raised from stakeholder input:
Although the sponsor provided a network meta-analysis (NMA) of SVd to some relevant comparators (e.g., DVd), the quality of the results was insufficient to support decision-making.
Dose escalation to 120 mg weekly for some patients could not be directly considered because of the structure of the sponsor’s model and a lack of clinical data.
Treatment sequencing could not be addressed because of to the structure of the sponsor’s model.
Economic Review
The current review is for selinexor (Xpovio) for use in combination with SVd for the treatment of adult patients with MM who have received at least 1 prior therapy.1
Economic Evaluation
Summary of Sponsor’s Economic Evaluation
Overview
The proposed indication for selinexor is for use in combination with Vd for the treatment of MM among adult patients who have received at least 1 prior therapy. The sponsor submitted a cost-utility analysis to assess the cost-effectiveness of SVd compared with Vd, PVd, KCd, Kd, CyBorD, DVd, DRd, Rd, KRd, and standard of care (SOC), which was assumed to comprise an equally weighted average of Vd, PVd, KCd, Kd, CyBorD, DVd, DRd, Rd, and KRd.1 The modelled population is consistent with the reimbursement request and is aligned with the BOSTON trial population, an ongoing phase III randomized controlled trial involving adults with RRMM with 1 to 3 prior lines of therapy.
Selinexor is supplied as 20 mg oral tablets ($550.00 per tablet). The recommended dose for selinexor is 100 mg weekly (day 1, 8, 15, 22 of each 28-day cycle) in combination with bortezomib and dexamethasone “until disease progression or unacceptable toxicity,” and prophylactic antiemetics (e.g., 5-HT3 receptor antagonists) should be administered before and during treatment with selinexor.2 The dosage of bortezomib and dexamethasone was based on the BOSTON trial (bortezomib: 1.3 mg/m2 subcutaneous on days 1,8,15 and 22 for 4 weeks, with 1 week off between 28-day cycles; dexamethasone: 20 mg on day 1, 2, 8, 9, 15, 16, 22, 23 of each 28-day cycle). The dosages for other comparators were obtained from the literature. The sponsor’s calculated cost, including relative dose intensity (RDI) based on the BOSTON trial of SVd is $11,172 per 28-day cycle. For comparators, the sponsor incorporated RDI where available; otherwise, the RDI was assumed to be 100%. The sponsor’s estimated 28-day costs for comparators were Vd: $4,300; PVd: $11,132; KCd: $10,008; Kd: $15,052; CyBorD: $3,264; DVd: $13,500; DRd: $17,364; Rd: $5,800; and KRd: $13,744.
The clinical outcomes of interest were QALYs and life-years. The economic analysis was undertaken over a 20-year horizon from the perspective of a publicly funded health care payer. Costs and outcomes were discounted at a rate of 1.5% annually.
Model Structure
The sponsor submitted a PSM with a 1-week cycle length. The model included the following health states: progression-free (on primary treatment, off primary treatment), post-progression, and death. The proportion of patients who were progression-free, experienced disease progression, or dead at any time over the model’s time horizon was derived from non–mutually exclusive survival curves. All patients entered the model in the progression-free and on primary treatment state. The proportion of patients with progressed disease (i.e., in the post-progression state) was derived as the difference between the OS and PFS curves. For Vd, the sponsor extrapolated OS and PFS from the BOSTON trial data over the model horizon. For SVd and other comparators, the sponsor applied hazard ratios (HRs) for OS and PFS derived from an NMA to the Vd-extrapolated data to estimate the proportion of patients in each state. The sponsor applied a per-cycle discontinuation rate, and all patients who discontinued treatment were assumed to receive subsequent therapy (comprising an equally weighted basket of all comparators) for 4 months.
Model Inputs
The modelled cohort’s characteristics were based on the BOSTON trial (mean age = 67 years; body surface area = 1.83 m2) and the COLUMBA trial (mean weight = 73.0 kg).3 The sponsor’s base case reflects a mixed population of patients undergoing second-line and third-line or later treatment, based on a weighted average from the BOSTON trial (49.3% second line, 50.7% third line or later). For Vd, Kaplan–Meier estimates of PFS and OS from the BOSTON trial period were used to fit parametric survival curves to extrapolate the observed trial data (median follow-up = 22 months) over the entire model time horizon (20 years). The sponsor used a regression-adjustment approach to account for patient crossover between Vd and SVd in the BOSTON trial. For SVd and all other comparators, the sponsor estimated HRs for OS and PFS from an NMA and applied these to the extrapolated Vd data to derive estimates of OS and PFS. The sponsor derived the weekly discontinuation rate for each treatment from the median duration of therapy reported in each treatment’s pivotal trial or from PFS as reported in product monographs or cancer agency protocols.4-11
Health state utility values for the progression-free and post-progression states were obtained from the literature.12 The sponsor adjusted these utility values by applying a response benefit for patients deemed to be “complete responders” and by applying disutility values related to AEs. The proportion of patients deemed to be complete responders for each treatment was obtained from the sponsor’s NMA. Disutility values were based on the BOSTON patient-level EQ-5D 5-Levels data adjusted for age, sex, baseline Eastern Cooperative Oncology Group Performance Status (ECOG PS), and duration of diagnosis. If AE data were unavailable from the BOSTON trial, the sponsor assumed that the disutility would be equal to the average of all grade 3 and 4 AEs (−0.0387). The duration of each AE was based on the BOSTON clinical trial patient-level data and ranged from 4 days (constipation) to 116.6 days (cataract).
The model included costs related to drug acquisition and administration, subsequent treatment after disease progression, treatment of AEs, routine care, and end-of-life care. Drug acquisition costs for selinexor were based on the sponsor’s submitted price, while the price of dexamethasone and bortezomib were acquired from past CADTH pan-Canadian Canadian Oncology Drug Review (pCODR) reports.13,14 Acquisition costs for other comparators were obtained from past pCODR reviews and the Ontario Drug Benefit formulary.15 Administration costs were included for drugs administered by subcutaneous injection and intravenously; administration costs were assumed to be zero for oral treatments. RDI for selinexor, bortezomib, and dexamethasone (as part of SVd and Vd) were based on the BOSTON trial, while RDI was based on the pivotal trial for each regimen when available (otherwise assumed to be 100%). A one-time cost for subsequent treatment was estimated based on a weighted average cost of all comparator regimens (excluding SVd). Costs related to the treatment of grade 3 or higher treatment-emergent AEs were included in the model and were assumed to be treated on an outpatient basis (i.e., cost of 1 physician visit) or inpatient basis (i.e., costs obtained from the Ontario Case Costing Initiative) based on the frequency of “severe or greater” treatment-emergent AEs observed in the BOSTON trial. For other regimens, the proportion of patients who experienced AEs was obtained from the literature. Routine care costs included those related to routine medical resource use in the progression-free and post-progression health states, and included hematologist visits, full blood counts, biochemistry lab tests, immunoglobulin tests, protein electrophoresis, urinary light chain excretion, red blood cell transfusions, and platelet transfusions. The frequency of resource use was obtained from the literature and from clinician input, and unit costs were obtained from the Ontario Schedule of Benefits for Physician Services16 and Laboratory Services17 and the Ontario Regional Blood Coordinating Network.18
Summary of Sponsor’s Economic Evaluation Results
The sponsor’s base-case analyses were run probabilistically (1,000 iterations); scenario analyses were run for 100 iterations. The deterministic and probabilistic results were similar. The probabilistic findings are presented in the following section. Additional results from the sponsor’s submitted economic evaluation base case are presented in Appendix 3.
Base-Case Results
The sponsor’s base-case analysis was based on a weighted average of use in the second line (49.3%) and third line or later (50.7%), with the same comparators adopted in both subgroups. In the base-case analysis, SVd was associated with estimated costs of $238,983 and 3.68 QALYs over a 20-year time horizon. SVd was dominant (i.e., less costly and produced more QALYs) over KCd, PVd, SOC, and KRd, while SVd was less effective (produced fewer QALYs) and less costly compared to DVd, DRd, and Kd.
In a sequential analyses, SVd was extendedly dominated by CyBorD and DVd, such that it would not be chosen as the optimal treatment strategy regardless of a decision-maker’s WTP threshold. There was a 1.8% probability that SVd would be the optimal treatment strategy at a WTP threshold of $50,000 per QALY.
Results were driven by the predicted differences in total life-years between SVd and comparators and the drug acquisition costs associated with SVd (Appendix 3). The sponsor’s model estimated 0.06 incremental QALYs with SVd versus Vd during the BOSTON trial period (median follow-up = 22 months), indicating that approximately 92% of the incremental benefit is accrued during the post-trial period. A substantial amount of incremental benefit is derived from additional life-years for patients receiving SVd versus Vd.
Table 3: Summary of the Sponsor’s Economic Evaluation Results
Drug | Total costs ($) | Incremental costs vs. CyBorD ($) | Total QALYs | Incremental QALYs vs. CyBorD | ICER vs. CyBorD ($/QALY) | Sequential ICER ($/QALY) |
|---|---|---|---|---|---|---|
CyBorD | 167,672 | Reference | 2.62 | Reference | Reference | Reference |
Vd | 173,482 | 5,810 | 2.90 | 0.28 | 21,075 | 21,075 |
DVd | 346,471 | 178,799 | 8.09 | 5.47 | 33,320 | 33,320 |
Dominated therapies | ||||||
Rd | 198,930 | 31,258 | 2.85 | 0.23 | 136,498 | Dominated |
SVd | 238,983 | 71,311 | 3.68 | 1.05 | 67,657 | Extended dominance |
KCd | 244,551 | 76,879 | 2.44 | −0.18 | 417,821 | Dominated |
PVd | 274,455 | 106,783 | 3.49 | 0.87 | 123,306 | Dominated |
SoC | 292,730 | 125,058 | 3.37 | 0.75 | 166,522 | Dominated |
Kd | 332,618 | 164,946 | 3.97 | 1.35 | 122,092 | Extended dominance |
KRd | 465,103 | 297,431 | 3.58 | 0.96 | 309,180 | Dominated |
DRd | 557,737 | 390,065 | 6.09 | 3.47 | 112,573 | Dominated |
CyBorD = cyclophosphamide + bortezomib + dexamethasone; DRd = daratumumab + lenalidomide + dexamethasone; DVd = daratumumab + bortezomib + dexamethasone; ICER = incremental cost-effectiveness ratio; KCd = carfilzomib + cyclophosphamide + dexamethasone; Kd = carfilzomib + dexamethasone; KRd = carfilzomib + lenalidomide + dexamethasone; PVd = pomalidomide + bortezomib + dexamethasone; QALY = quality-adjusted life-year; Rd = lenalidomide + dexamethasone; SVd = selinexor + bortezomib + dexamethasone; Vd = bortezomib + dexamethasone; vs. = versus.
Note: The submitted analysis is based on the publicly available prices of the comparator treatments.
Source: Sponsor’s pharmacoeconomic submission.1
Sensitivity and Scenario Analysis Results
The sponsor provided several scenario and sensitivity analyses, including scenarios that adopted alternative OS and PFS distributions for SVd; however, sequential analyses were not provided (i.e., SVd was compared to each other treatment in a pairwise fashion), limiting the interpretation of the findings.
CADTH Appraisal of the Sponsor’s Economic Evaluation
CADTH identified several key limitations to the sponsor’s analysis that have notable implications on the economic analysis:
Comparative effectiveness and safety of SVd to relevant comparators is highly uncertain. The relative effectiveness and safety of selinexor is uncertain for several reasons. First, there have been no head-to-head trials of SVd to key comparators (e.g., DVd). In the absence of comparative evidence from clinical trials for most comparators, the sponsor undertook an NMA to inform OS and PFS in its pharmacoeconomic model. Although the BOSTON trial directly compared SVd and Vd, this evidence was not directly used in the sponsor’s pharmacoeconomic submission (i.e., all comparative estimates in the sponsor’s pharmacoeconomic model were based on the NMA findings). As noted in the CADTH Clinical Review, important methodological limitations affect the validity and interpretation of the sponsor’s NMA results. As a result of these limitations, CADTH concluded in the clinical report that the magnitude of the OS and PFS benefits with SVd relative to other comparators cannot be confirmed with confidence, and the sponsor’s NMA suggests that the ||||||||||||||||||||||||||||||||||||||||||||||||||||||||||||||||||||||||||||||||||||||||||||||||||||||||||||||||||||||||||||||||||||||||||||||||||||||||||||||||||||||||||||||||||||||||||||||.
Second, as noted in the sponsor’s submission, a number of trials included in the NMA did not have data for both OS and PFS. If these data were missing, the sponsor assumed in the pharmacoeconomic model that the OS benefit, with respect to HRs, would be equal to that of PFS (or vice versa). This assumption lacks face validity as it assumes a perfect correlation between PFS and OS. Third, the sponsor incorporated AEs and treatment discontinuation in the pharmacoeconomic model based on naive comparisons between trials. CADTH notes that because of the direct use of clinical trial data, it is not possible to determine if any observed differences in AEs and treatment discontinuation between therapies are due to the treatment or, rather, due to bias or confounding (e.g., differences in study populations, definitions of outcomes, or study designs). This introduces substantial uncertainty into the analyses.
Given the lack of head-to-head evidence for SVd relative to other relevant comparators and the concerns with interpretation of the sponsor’s submitted comparative efficacy data, CADTH was unable to include additional comparators as part of its reanalyses or as part of scenario analyses. As such, it is highly uncertain whether SVd provides a net benefit above any funded regimen outside of what was used in the trial (i.e., Vd).
Limitations associated with the sponsor’s chosen modelling approach. The sponsor submitted a PSM in which treatment efficacy was represented by PFS and OS curves. In the model, PFS and OS for the Vd group from the BOSTON trial (median follow-up: OS = 28.65 months; PFS = 24.48 months) were extrapolated over the model’s time horizon (20 years), and the sponsor applied HRs for SVd and other comparators from the NMA to these extrapolated data. In addition to the limitations noted with the sponsor’s NMA, this approach is additionally limited by the assumption that the treatment effect observed in clinical trials will remain constant over the model horizon (proportional hazards assumption). The sponsor did not test or justify this assumption. While the proportional hazards assumption may hold for the trial duration, it is unlikely to hold over a lifetime horizon.19
The sponsor’s base case predicts a survival advantage with SVd compared to Vd (incremental gain = 0.86 discounted life-years), which is not supported by data from the BOSTON trial. As noted in the CADTH Clinical Review, the BOSTON trial was not powered to detect differences in OS between SVd and Vd, and the median OS data were not reached, which introduces considerable additional uncertainty into the long-term extrapolation. Additionally, there is overlap between the survival curves for SVd and Vd from the BOSTON trial (Figure 1). The OS benefit with SVd predicted in the sponsor’s base case is not supported by the observed clinical trial data. The sponsor noted that gains in PFS will translate to OS, although the inherent assumption of a PSM is that PFS and OS are sampled independently. In other words, the parametric functions used to fit OS data do not consider which parametric function was fit for PFS. Given the lack of evidence from the trial to suggest an OS benefit, a Markov model would be a more appropriate approach to explore the effect PFS may have on OS because it explicitly models the correlation between progression and survival.
Additional uncertainty is associated with the parametric curves used to extrapolate PFS and OS in the model. The sponsor selected the exponential distribution for OS and the log-normal distribution for PFS on the basis of statistical fit (i.e., Akaike information criterion and Bayesian information criterion). Statistical fit applies only to the fit of the predicted data to the observed data within the trial period, not to the validity of the predicted data to the extrapolated period; as such, the choice of parametric distribution for the extrapolation period should be based on clinical plausibility. CADTH notes that, based on the exponential distribution chosen by the sponsor for OS, between 0.4% (those who receive KCd) and 34% (those who receive DVd) of patients are predicted to remain alive 20 years after initiating second-line treatment, which lacks face validity given that the median OS for patients in Canada from the time of initiating first-line treatment is 54 months for patients who do not undergo autologous stem cell transplant (ASCT) (122 months for patients who do) and decreases with each subsequent line of treatment.20 Further, the log-normal distribution chosen by the sponsor for PFS makes the implicit assumption that the rate of disease progression slows in the SVd treatment group over time. This assumption is not supported by data and likely biases the findings in favour of SVd.
In CADTH’s exploratory reanalyses, OS was assumed to be equal between SVd and Vd (i.e., HR = 1.0), and alternative distributions were chosen for the long-term extrapolation of observed data for PFS and OS for Vd from the BOSTON trial (PFS: exponential distribution; OS: Weibull distribution). CADTH notes that the assumption of proportional hazards over the patient’s lifetime may overestimate the benefit seen in the trial and assumes no waning of effect, and this may bias the results in favour of SVd.
Uncertainty related to subsequent treatment. There are several sources of uncertainty related to subsequent treatment. First, in the pharmacoeconomic model, the sponsor assumed that all patients who discontinued their initial treatment in the model would receive subsequent treatment. As the sponsor modelled treatment discontinuation separately from disease progression, the receipt of subsequent treatment was not correlated with disease progression, which lacks face validity. Further, the clinical experts consulted by CADTH for this review indicated that it is highly unlikely that all patients would receive subsequent treatment and that this is influenced by factors such as prior receipt of a stem cell transplant, age, performance status, frailty, and the availability of additional and suitable funded options.
Second, the sponsor assumed that subsequent therapy would comprise an equally weighted basket of model comparators (Vd, PVd, KCd, Kd, CyBorD, DVd, DRd, Rd, and KRd) after second-line treatment or after third-line or later treatment. As noted previously, the treatment of MM is highly individualized and depends on previous treatments received. Therefore, the sponsor’s assumption implies that patients could be re-treated with the same regimen immediately after disease progression in many cases. Clinical experts consulted by CADTH noted that, in Canadian clinical practice, the majority of patients receive lenalidomide-based regimens in the first line and would not receive a lenalidomide-based regimen as part of subsequent treatment. The sponsor acknowledges this issue in its pharmacoeconomic report (“R [lenalidomide] is commonly used in first-line until disease progression and would no longer be appropriate for later-line use”). However, this issue has not been appropriately considered in the sponsor’s pharmacoeconomic submission.
Third, subsequent treatment was assumed to affect costs only, while the effects of subsequent treatment on OS were not considered. The sponsor additionally assumed that subsequent therapy would be received for 4 months, regardless of the line of therapy. These assumptions were not justified by the sponsor.
CADTH was unable to address uncertainty related to the impact of subsequent treatments on the cost-effectiveness estimates because of the structure of the sponsor’s model and a lack of data.
Treatment discontinuation associated with selinexor is highly uncertain. In the sponsor’s model, PFS and treatment discontinuation were modelled separately, such that there was no correlation between treatment discontinuation and disease progression, which lacks face validity. Clinical experts consulted by CADTH indicated that these parameters are correlated, with the most common reason for treatment discontinuation being disease progression (i.e., with the initiation of a subsequent treatment). Further, the selinexor product monograph indicates that treatment should be administered until disease progression or unacceptable toxicity. CADTH notes that, in the sponsor’s model, a higher discontinuation rate was incorporated for SVd compared to all comparator regimens, which indicates that SVd is either less tolerable or less effective than comparators. As noted in the CADTH Clinical Review, a sensitivity analysis that considered treatment discontinuations as PFS events found no statistically significant difference in PFS between SVd and Vd (HR = 0.95; 95% confidence interval, 0.764 to 1.186). Finally, treatment discontinuation was informed by a naive comparison between treatments, with discontinuation based on median duration of treatment for some therapies and based on PFS for others, which lacks internal consistency. Because of the direct use of clinical trial data in the sponsor’s base case, it is not possible to determine if any observed differences between therapies are due to the treatment or due to bias or confounding.
In the CADTH reanalyses, treatment discontinuation was informed by sponsor-provided data from BOSTON trial for SVd and Vd. The impact of uncertainty in the PFS estimate on the ICER was explored in scenario analysis.
The effect of SVd on quality of life is uncertain. As noted in the CADTH Clinical Review, HRQoL was included as an exploratory outcome in the BOSTON trial; however, the results did not suggest any differences between treatment groups and were subject to bias. HRQoL was not included in the sponsor’s NMA and there is a lack of comparative data pertaining to the impact of SVd on quality of life relative to other comparators. Further, CADTH identified several issues in the modelled utility estimates. First, the utilities values incorporated in the sponsor’s model were obtained from the literature12; however, the sponsor did not state how these utility values were identified and did not justify the use of these utilities over others available for MM. These utilities were based on data from the ASPIRE trial, which compared KRd and Rd in relapsed MM. CADTH notes that the sponsor provided multiple utility estimates, including those derived from the BOSTON trial, and that the ICER is sensitive to the utility values adopted.
Second, the sponsor incorporated a utility benefit (+ 0.17) for patients deemed to be treatment responders. This benefit was sourced from the literature21 and was applied to the proportion of complete responders for each treatment. This may have resulted in double counting, as patients in the progression-free health state were already assumed to have higher utility (0.81) than those in the post-progression state (0.64). Additionally, the estimated proportion of patients deemed to be complete responders was derived from the sponsor’s NMA based on the objective response rate. However, there is considerable uncertainty associated with the sponsor’s NMA.
In CADTH reanalyses, health state utility values were based on EQ-5D data from the BOSTON trial and the additional response benefit was excluded.
Relative dose intensity may not correlate well with drug costs. In the calculation of drug costs, the sponsor incorporated the RDI for each drug used as part of the SVd and Vd regimens based on observations from the BOSTON trial, which may not reflect clinical practice. For comparators, RDI was based on observations from clinical trials or assumed to be 100%, depending on the availability of published data. Within the SVd regimen, RDI was assumed to be 80% for selinexor, which was calculated based on the median selinexor dose received per week (80 mg) relative to the prescribed dose (100 mg). CADTH notes that, based on the draft product monograph for selinexor, dosage reductions and interruptions for selinexor are recommended for patients experiencing AEs, which may contribute to a reduced RDI. However, in the sponsor’s model, AEs, dose reductions, and treatment discontinuations were modelled separately, which does not account for correlation between these parameters, and dose interruptions were not considered. The method of adjusting drug costs by RDI is associated with substantial uncertainty, particularly when viewed independently from AEs, drug interruptions, and treatment discontinuation. As such, the use of an RDI of less than 1 may inappropriately reduce the cost of selinexor in the sponsor’s pharmacoeconomic model, which may bias the ICER in its favour.
CADTH additionally notes that, in the BOSTON trial, the dose of selinexor was increased to 120 mg for patients who did not achieve at least a partial response (and were tolerating SVd well with grade 2 or higher AEs) in the first 2 cycles. In total, 23.1% of patients in the SVd arm underwent dose escalation to 120 mg weekly. This increased dose is not captured in the sponsor’s estimated drug acquisition costs for selinexor; however, the PFS and OS data incorporated within the model include patients receiving this higher dose. Further, the sponsor applied a median RDI rather than a mean, which is inappropriate; as such, the drug acquisition costs of selinexor are underestimated, biasing the ICER in favour of SVd.
In CADTH reanalyses, an RDI of 100% was adopted for all treatments.
The model lacked flexibility to assess relevant subgroups. The choice of treatment at a given line of therapy (as well as subsequent treatment after disease progression) depends, at least in part, on the number and type of prior treatments received. In the BOSTON trial, 49.3% of patients had received 1 prior line of therapy, while 32.1% and 18.6% had received 2 or 3 prior lines of therapy, respectively, and 38.3% of patients had prior exposure to lenalidomide. Other clinically relevant subgroups include both patients who are eligible for a transplant and those who are not, which may confound the interpretation of OS. Notably, 31% of BOSTON participants had previously received an autologous transplant.
CADTH could not assess the cost-effectiveness of SVd based on the type of prior treatments received because of the structure of the sponsor’s model and a lack of clinical data. Similarly, CADTH could not evaluate the cost-effectiveness of SVd among patients who had or had not received a prior stem cell transplant. Consequently, the cost-effectiveness of SVd in such subgroups, including among those with lenalidomide-refractory disease, is unknown. Thus, the cost-effectiveness in the full Health Canada population is highly uncertain as this heterogeneity is not considered.
CADTH notes there was an option in the sponsor’s pharmacoeconomic model to explore the impact of SVd in the second- and third-line settings, but this option did not take into account the impact that line of therapy has on subsequent treatments. For example, the sponsor assumes no impact on subsequent therapy use if a drug is used in the second-line or third-line or later setting. Likewise, CADTH notes the model produced inconsistent results when this option was tested. This analysis was therefore explored as a scenario analysis.
Limited generalizability of model comparators. CADTH identified multiple issues that limit the generalizability of modelled comparators to the indicated population. First, as noted above, the sponsor’s submitted a comparison of SVd to 10 regimens (Vd, PVd, KCd, Kd, CyBorD, DVd, DRd, Rd, KRd, and SOC), and the relevant comparators were assumed by the sponsor to be the same in the second line and in the third and later lines, which lacks clinical relevance. As noted by the clinical experts consulted by CADTH for this review, second-line and later treatment of MM is highly individualized and depends on the treatment received in the first line. Clinical experts noted that up to 90% of patients with MM receive a lenalidomide-based regimen in the first line and that patients progressing to second-line treatment are not likely to be re-treated with this agent (i.e., patients considered to have lenalidomide-refractory disease). At the second line, clinical experts noted that daratumumab-based regimens (i.e., DVd and DRd) are the most likely comparators to SVd, with the choice between these based on whether the patient’s disease was lenalidomide-refractory. At the third line, relevant comparators may include PVd, Vd, KCd, Kd, KRd, and CyBorD, depending on prior treatments received and funding, which may vary by jurisdiction. Additional treatments, including isatuximab (Isa)-based regimens (e.g., IsaKd and IsaPd) (Table 8) may be considered. Although Isa is not currently reimbursed on provincial formularies, it did receive a conditional positive reimbursement recommendation from the CADTH pCODR Expert Review Committee (pERC) in 2021 for use in combination with carfilzomib and pomalidomide (IsaPd) for patients with RRMM who have received at least 2 prior therapies, including lenalidomide and a proteasome inhibitor (i.e., third line or later) and in combination with carfilzomib and dexamethasone (IsaKd) for patients with RRMM who have received 1 to 3 prior lines of therapy (i.e., second line or later).
CADTH was unable to address this limitation because of the structure of the sponsor’s model and a lack of clinical data. The treatments deemed to be relevant comparators to SVd will depend on line of therapy, prior treatment(s) received, and treatment funding status, which may vary by jurisdiction. In CADTH reanalyses, only a comparison to Vd could be made given the uncertainty of evidence presented and model structure used.
Model lacked transparency. The sponsor’s submitted model included numerous IFERROR statements, which lead to situations in which the parameter value is overwritten with an alternative value without alerting the user to the automatized overwriting. The systematic use of IFERROR statements makes thorough auditing of the sponsor’s model impractical, as it remains unclear whether the model is running inappropriately by overriding errors.
CADTH was unable to address this limitation and notes that a thorough validation of the sponsor’s model was not possible.
An additional limitation was identified, but it was not considered to be a key limitation:
The cost of branded bortezomib was adopted in the sponsor’s submission, despite the availability of generic versions.
In CADTH’s reanalysis, the generic price of bortezomib was used.
Additionally, the key assumptions presented in Table 4 were made by the sponsor and have been appraised by CADTH.
Table 4: Key Assumptions of the Submitted Economic Evaluation
Sponsor’s key assumption | CADTH comment |
|---|---|
Patients enrolled in the BOSTON trial were assumed to be representative of patients in Canada and would be eligible for SVd (mean age = 67 years, 57.2% male, mean body surface area = 1.83 m2). | Reasonable, although patients enrolled in the BOSTON trial were generally younger than those with relapsed and/or refractory multiple myeloma in clinical practice, as the mean age at the time of multiple myeloma diagnosis in Canada is 70 years.22 |
Pre-medication costs were not included. | Inappropriate, although unlikely to have an important effect on the ICER. The draft selinexor monograph recommends administration of prophylactic antiemetics (serotonin 5-HT3 receptor antagonists and other anti-nausea agents) before and during treatment with selinexor. In the SVd arm of the BOSTON trial, 88.2% of patients received 5-HT3 receptor antagonists. |
Drug wastage was excluded (i.e., vial sharing was assumed). | Uncertain. Drug wastage is unlikely with selinexor, as it is supplied as a 20 mg tablet and dosage reductions are recommended in 20 mg increments. For drugs supplied as single-use vials (e.g., bortezomib), a combination of wastage and vial sharing is likely, with the extent of sharing dependent on the practice centre (e.g., greater sharing may occur be at larger centres). |
ICER = incremental cost-effectiveness ratio; SVd = selinexor + bortezomib + dexamethasone.
CADTH Reanalyses of the Economic Evaluation
Several limitations with the sponsor’s submission could not be adequately addressed due to structural or data limitations, including the notable limitations associated with sponsor’s chosen modelling approach (i.e., a PSM). The use of a PSM structure in the current review is inappropriate, given that PSMs rely on mature PFS and OS data to produce reliable cost-effectiveness estimates, and the long-term extrapolation of OS and PFS is highly uncertain. CADTH was unable to address the lack of head-to-head comparative clinical data for additional relevant comparators, the cost-effectiveness of SVd in relevant subgroups, and uncertainty associated with the influence of subsequent therapy after disease progression on OS. As a result, CADTH was unable to conduct a base-case reanalysis of the sponsor’s model, given that any estimate of incremental effectiveness would be misleading.
Exploratory Results
CADTH undertook reanalyses that addressed limitations within the model, as summarized in Table 5. CADTH exploratory reanalysis was derived by making changes in model parameter values and assumptions, in consultation with clinical experts.
Table 5: CADTH Revisions to the Submitted Economic Evaluation
Stepped analysis | Sponsor’s value or assumption | CADTH value or assumption |
|---|---|---|
Corrections to sponsor’s base case | ||
1. Drug prices | Bortezomib: $1,402.42 per 3.5 mg (branded) | Bortezomib: $654.31 per 3.5 mg (IQVIA, generic) |
Changes to derive the CADTH exploratory reanalysis | ||
1. Hazard ratio for OS | Based on indirect estimates from sponsor-provided NMAs | Hazard ratio for OS set to 1.0 for SVd compared to Vd |
2. Hazard ratio for PFS | Based on indirect estimates from sponsor-provided NMAs (HR = 0.67 vs. Vd) | Based on direct evidence for SVd compared to Vd from the BOSTON trial (HR = 0.71 vs. Vd) |
3. Extrapolation of OS | Exponential distribution | Weibull distribution |
4. Extrapolation of PFS | Log-normal distribution | Exponential distribution |
5. Health state utility values | Obtained from the literature12 | Based on EQ-5D data from the BOSTON trial (provided by the sponsor); utilities assumed to be equal for the pre-progression health state, regardless of treatment received |
6. Utility response benefit | Patients deemed to be complete responders were given an additional response benefit (0.17) | Excluded |
7. Relative dose intensity | Assumed a reduction in drug costs due to reduced dose intensity | Assumed no reduction in dose intensity |
CADTH exploratory reanalysis: 1 + 2 + 3 + 4 + 5 + 6 + 7 | — | — |
HR = hazard ratio; OS = overall survival; NMA = network meta-analysis; PFS = progression-free survival; SVd = selinexor + bortezomib + dexamethasone; Vd = bortezomib + dexamethasone.
CADTH undertook a stepped analysis, incorporating each change proposed in Table 5 to the sponsor’s base case to highlight the impact of each change (Table 6; disaggregated results are presented in Appendix 4; Table 11 and Table 12).
Table 6: Summary of the Stepped Analysis of the CADTH Reanalysis Results
Stepped analysis | Drug | Total costs ($) | Total QALYs | ICER ($/QALY) |
|---|---|---|---|---|
Sponsor’s base casea,b | CyBorD | 165,556 | 2.42 | Reference |
Vd | 173,795 | 2.89 | 17,336 | |
SVd | 239,469 | 3.54 | Extended dominance | |
DVd | 347,751 | 7.99 | 34,093 | |
Sponsor’s corrected base caseb | CyBorD | 142,327 | 2.42 | Reference |
Vd | 145,957 | 2.89 | 7,638 | |
SVd | 224,358 | 3.54 | Extended dominance | |
DVd | 326,116 | 7.99 | 35,308 | |
Sponsor’s corrected base case only, including Vd | Vd | 145,957 | 2.89 | Reference |
SVd | 224,358 | 3.54 | 121,050 | |
CADTH reanalysis 1: Equal OS (HR = 1.0) | Vd | 145,957 | 2.89 | Reference |
SVd | 223,852 | 3.11 | 359,367 | |
CADTH reanalysis 2: PFS from BOSTON trial (HR = 0.7096) | Vd | 145,957 | 2.89 | Reference |
SVd | 224,414 | 3.50 | 129,403 | |
CADTH reanalysis 3: OS extrapolation | Vd | 145,300 | 2.42 | Reference |
SVd | 223,964 | 2.95 | 148,855 | |
CADTH reanalysis 4: PFS extrapolation | Vd | 146,053 | 2.82 | Reference |
SVd | 224,609 | 3.35 | 147,305 | |
CADTH reanalysis 5: Health state utility values | Vd | 145,957 | 3.23 | Reference |
SVd | 224,358 | 3.79 | 138,890 | |
CADTH reanalysis 6: Responder benefit | Vd | 145,957 | 2.88 | Reference |
SVd | 224,358 | 3.51 | 123,456 | |
CADTH reanalysis 7: Relative dose intensity | Vd | 145,601 | 2.89 | Reference |
SVd | 250,984 | 3.54 | 162,710 | |
CADTH exploratory reanalysis | Vd | 145,469 | 2.64 | Reference |
SVd | 250,479 | 2.65 | 10,884,623 |
CyBorD = cyclophosphamide + bortezomib + dexamethasone; DVd = daratumumab + bortezomib + dexamethasone; HR = hazard ratio; ICER = incremental cost-effectiveness ratio; OS = overall survival; PFS = progression-free survival; QALY = quality-adjusted life-year; SVd = selinexor + bortezomib + dexamethasone; Vd = bortezomib + dexamethasone.
Note: All analyses were deterministic, unless otherwise noted.
aProbabilistic analysis.
bOnly treatments on the cost-effectiveness frontier (and the drug under review [SVd]) are shown.
In CADTH’s exploratory reanalysis, SVd was associated with higher costs (incremental $105,010) compared to Vd, with minimal difference in QALYs (incremental 0.01) over a 20-year horizon, resulting in an ICER of $10,884,623. There was a 0% probability that SVd would be optimal compared to Vd at a WTP threshold of $50,000 per QALY. Drug costs for selinexor are key drivers of the ICER, with the cost of SVd representing 99.8% of the total incremental costs compared to Vd.
Scenario Analysis Results
A price reduction analysis was performed based on the sponsor’s base case and CADTH’s reanalysis (Table 7). For the sponsor’s base case, only a comparison of SVd to Vd was made to allow comparability to the CADTH base case. This deterministic analysis was subject to the key limitations of the sponsor’s model as noted in the CADTH Appraisal of the Sponsor’s Economic Evaluation section. Based on the CADTH exploratory analysis, a reduction in the price of selinexor by 93% would be required for SVd to be cost-effective compared to Vd at a WTP threshold of $50,000 per QALY.
CADTH notes that, in the sponsor’s base case, a 100% price reduction of selinexor would not be sufficient to ensure that SVd would be cost-effectiveness compared to DVd because of the substantially fewer QALYs gained with SVd compared to DVd. This analysis relies on estimates from the sponsor-conducted NMA and assumes that all patients receive the same subsequent therapy regardless of which prior treatments they failed on.
Table 7: CADTH Price Reduction Analyses
Analysis | ICERs for SVd ($/QALY) | |
|---|---|---|
Price reduction | Corrected sponsor base casea (vs. Vd for comparison to the CADTH exploratory analysis) | CADTH exploratory analysis (vs. Vd) |
No price reduction | 121,050 | 10,843,347 |
10% | 107,166 | 9,683,359 |
20% | 93,283 | 8,523,370 |
30% | 79,400 | 7,363,382 |
40% | 65,516 | 6,203,393 |
50% | 51,633 | 5,043,405 |
60% | 37,749 | 3,883,416 |
70% | 23,866 | 2,723,428 |
80% | 9,982 | 1,563,439 |
90% | Dominant (SVd is more effective and less costly than Vd) | 403,450 |
93.1% | Dominant (SVd is more effective and less costly than Vd) | 43,854 |
ICER = incremental cost-effectiveness ratio; QALY = quality-adjusted life-year; SVd = selinexor + bortezomib + dexamethasone; Vd = bortezomib + dexamethasone; vs. = versus.
Note: All analyses in this table are deterministic and are subject to limitations within the sponsor’s economic model.
aUsing the correct price of bortezomib ($654.31 per 3.5 mg vial)
Several scenario and sensitivity analyses conducted on the CADTH base case by line of therapy are described in detail in Table 12. These scenario analyses explored the impact of the following model parameters and assumptions:
Assuming second-line use or third-line and later use (separate analyses by line of therapy).
Assuming a reduced PFS benefit (based on a sponsor-provided sensitivity analysis).
Adopting alternative utility values for PFS and post-progression.12
The results of these analyses are presented in Table 13. The ICER is highly sensitive to the PFS estimate, as well as health state utility values. Notably, if the PFS benefit is lower than anticipated, SVd is equally effective but more costly than Vd. While the main PFS analyses from the BOSTON trial suggest that there is a PFS benefit with SVd compared to Vd, the magnitude of this benefit is highly uncertain because of potential bias introduced by informative censoring that may have resulted from patients discontinuing treatment before disease progression. In both the CADTH base case (which adopted the primary analysis of the BOSTON PFS data) and the scenario that assumed a minimal difference in PFS, the incremental QALYs gained with SVd compared to Vd were minimal.
Issues for Consideration
Generic submissions of pomalidomide are currently under review by Health Canada, and the patent protection for carfilzomib ends in 2024. The introduction of generic formulations may result in a discounted cost of the branded drugs.
Overall Conclusions
Data from the BOSTON trial suggest that SVd improves PFS relative to Vd among patients with MM who have received 1 to 3 prior lines of therapy. The effect of SVd on OS is highly uncertain, as is its effect on HRQoL. ITCs suggest that SVd may improve PFS and OS relative to some comparators; however, PFS and OS outcomes relative to others (i.e., daratumumab-based regimens) may be worse. Overall, given the methodological limitations with the ITCs and imprecision with the results, the magnitude and direction of the results are highly uncertain.
CADTH undertook a reanalysis, within the constraints of the sponsor’s PSM model, to assess the cost-effectiveness of SVd relative to Vd, based on data from the BOSTON trial. This reanalysis addressed some limitations in the sponsor’s submission by correcting the price of bortezomib, assuming equivalent OS for SVd and Vd, adopting the PFS estimate from the BOSTON trial, adopting alternative parametric distributions for OS and PFS, adopting health state utility values based the BOSTON trial, removing the utility benefit for treatment responders, and assuming that all patients receive the full dose of all drugs. CADTH was unable to address the limitations with the chosen modelling approach, the lack of head-to-head comparative clinical data for additional relevant comparators, the cost-effectiveness of SVd in relevant subgroups, and uncertainty associated with the use of subsequent therapy after disease progression. CADTH notes that these exploratory results may underestimate the true ICER.
In the CADTH exploratory reanalysis, SVd had a 0% probability of being cost-effective at a WTP threshold of $50,000 per QALY with an ICER of $10,884,623 (incremental QALYs = 0.01; incremental costs = $105,010). The key drivers of the ICER are small incremental QALYs associated with SVd treatment and the cost of selinexor acquisition. Incremental QALYs are small as no evidence was presented that would suggest additional life-years gained with SVd relative to Vd, and evidence from the trial suggested HRQoL improvements are uncertain. In this reanalysis, a 93% price reduction would be required for SVd to be considered optimal at a WTP threshold of $50,000 per QALY compared to Vd. However, this reanalysis assumed that the magnitude of the PFS benefit would be equivalent to the estimate from the BOSTON trial. As noted in the CADTH Clinical Review, it is possible that the PFS estimate from the BOSTON trial is biased in favour of SVd. Should the PFS benefit be lower than anticipated, there will be an even smaller difference in QALYs between SVd and Vd (to 3 decimal places).
The cost-effectiveness of SVd relative to most comparators is unknown because of a lack of robust comparative data, and there is insufficient evidence to suggest that SVd should be priced higher than other treatment regimens for RRMM. The indirect evidence presented by the sponsor indicates that some drugs (e.g., ||||||||||) may be preferred over SVd in the treatment of RRMM. Using the sponsor’s base case, SVd would not be cost-effective compared to DVd, even with a 100% price reduction for selinexor, because of the substantially fewer QALYs gained with SVd compared to DVd. Although this evidence is associated with substantial uncertainty, SVd may need to be priced substantially lower than currently available treatment options to compensate for potential negative effects on health.
References
1.Pharmacoeconomic evaluation [internal sponsor's report]. In: Drug Reimbursement Review sponsor submission: selinexor, tables, 20mg, oral [internal sponsor's package]. Oakville (ON): FORUS Therapeutics Inc.; 2022 Jan 14.
2.Xpovio (selinexor): tablets, 20 mg, oral [product monograph]. Oakville (ON): FORUS Therapeutics Inc; 2021 Dec 10.
3.Mateos M-V, Usmani SZ, Grosicki S, et al. Randomized, Open-Label, Non-Inferiority, Phase 3 Study of Subcutaneous (SC) Versus Intravenous (IV) Daratumumab (DARA) Administration in Patients (Pts) with Relapsed or Refractory Multiple Myeloma (RRMM): Body Weight Subgroup Analysis of Columba. Blood. 2019;134:1906.
4.Kyprolis (carfilzomib for injection): powder for solution, 10, 30, 60 mg per vial [product monograph]. Mississauga (ON): Amgen Canada Inc.; 2016: https://pdf.hres.ca/dpd_pm/00059826.PDF. Accessed 2021 Nov 11.
5.Revlimid (lenalidomide capsules): 2.5 mg, 5 mg, 10 mg, 15 mg, 20 mg and 25 mg [product monograph]. Mississauga (ON): Celgene Inc.; 2019: https://pdf.hres.ca/dpd_pm/00052749.PDF. Accessed 2021 Nov 11.
6.BC Cancer protocol summary for therapy of multiple myeloma using carfilzomib and dexamethasone with or without cyclophosphamide. Vancouver (BC): BC Cancer; 2021: http://www.bccancer.bc.ca/chemotherapy-protocols-site/Documents/Lymphoma-Myeloma/UMYCARDEX_Protocol.pdf. Accessed 2021 Dec 11.
7.Dimopoulos MA, San-Miguel J, Belch A, et al. Daratumumab plus lenalidomide and dexamethasone versus lenalidomide and dexamethasone in relapsed or refractory multiple myeloma: updated analysis of POLLUX. Haematologica. 2018;103(12):2088-2096. PubMed
8.Moreau P, Joshua D, Chng WJ, et al. Impact of prior treatment on patients with relapsed multiple myeloma treated with carfilzomib and dexamethasone vs bortezomib and dexamethasone in the phase 3 ENDEAVOR study. Leukemia. 2017;31(1):115-122. PubMed
9.Reece DE, Trieu Y, Masih-Khan E, et al. Cyclophosphamide and Bortezomib With Prednisone or Dexamethasone for the Treatment of Relapsed and Refractory Multiple Myeloma. Clin Lymphoma Myeloma Leuk. 2016;16(7):387-394. PubMed
10.Richardson PG, Oriol A, Beksac M, et al. Pomalidomide, bortezomib, and dexamethasone for patients with relapsed or refractory multiple myeloma previously treated with lenalidomide (OPTIMISMM): a randomised, open-label, phase 3 trial. Lancet Oncol. 2019;20(6):781-794. PubMed
11.Spencer A, Lentzsch S, Weisel K, et al. Daratumumab plus bortezomib and dexamethasone versus bortezomib and dexamethasone in relapsed or refractory multiple myeloma: updated analysis of CASTOR. Haematologica. 2018;103(12):2079-2087. PubMed
12.Jakubowiak AJ, Campioni M, Benedict Á, et al. Cost-effectiveness of adding carfilzomib to lenalidomide and dexamethasone in relapsed multiple myeloma from a US perspective. J Med Econ. 2016;19(11):1061-1074. PubMed
13.pCODR Expert Review Committee (pERC) Final Recommendation: bortezomib (Velcade) for the treatment of patients with multiple myeloma pre-autologous stem cell transplantation in combination therapy and post-autologous stem cell transplantation as monotherapy. Ottawa (ON): CADTH; 2013 Feb 21: https://www.cadth.ca/sites/default/files/pcodr/pcodr-velcademm-fn-rec.pdf. Accessed 2022 Feb 10.
14.pCODR Expert Review Committee (pERC) Final Recommendation: daratumumab (Darzalex) plus lenalidomide and dexamethasone for the treatment of patients with newly diagnosed multiple myeloma who are ineligible for autologous stem cell transplant. Ottawa (ON): CADTH; 2020 Feb 20: https://www.cadth.ca/sites/default/files/pcodr/Reviews2020/10189DaratumumabNDMM_fnRec_2020-03-03_ApprovedbyChair_Post_05Mar2020_final.pdf. Accessed 2022 Feb 10.
15.Ontario Ministry of Health, Ontario Ministry of Long-Term Care. Ontario drug benefit formulary/comparative drug index. 2021; https://www.formulary.health.gov.on.ca/formulary/. Accessed 2022 Feb 24.
16.Schedule of benefits for physician services under the Health Insurance Act: effective October 1, 2021. Toronto (ON): Ontario Ministry of Health; 2021: https://www.health.gov.on.ca/en/pro/programs/ohip/sob/physserv/sob_master.pdf. Accessed 2022 Feb 24.
17.Schedule of benefits for laboratory services: effective July 1, 2020. Toronto (ON): Ontario Ministry of Health; 2020: https://www.health.gov.on.ca/en/pro/programs/ohip/sob/lab/lab_mn2020.pdf. Accessed 2022 Feb 24.
18.Provincial platelet audit report. Toronto (ON): Ontario Regional Blood Coordinating Network; 2017: https://transfusionontario.org/wp-content/uploads/2020/06/Plt-Audit-Report_final-1-2.pdf. Accessed 2022 Feb 24.
19.Guyot P, Ades AE, Beasley M, Lueza B, Pignon J-P, Welton NJ. Extrapolation of Survival Curves from Cancer Trials Using External Information. Med Decis Making. 2016;37(4):353-366. PubMed
20.Mian H, Reece D, Masih-Khan E, et al. Survival and Outcomes of Newly Diagnosed Multiple Myeloma Patients Stratified by Transplant Status 2007-2018: Retrospective Analysis from the Canadian Myeloma Research Group Database. Clin Lymphoma Myeloma Leuk. 2022. PubMed
21.Fragoulakis V, Kastritis E, Psaltopoulou T, Maniadakis N. Economic evaluation of therapies for patients suffering from relapsed-refractory multiple myeloma in Greece. Cancer Manag Res. 2013;5:37-48. PubMed
22.Tsang M, Le M, Ghazawi FM, et al. Multiple myeloma epidemiology and patient geographic distribution in Canada: A population study. (1097-0142 (Electronic)).
23.Exceptional Access Program (EAP). Toronto (ON): Ontario Ministry of Health; Ontario Ministry of Long-Term Care; 2021: https://www.health.gov.on.ca/en/pro/programs/drugs/odbf/odbf_except_access.aspx. Accessed 2022 Feb 24.
24.Sarclisa (isatuximab for injection): concentrate for solution for infusion (20 mg/mL) [product monograph]. Mississauga (ON): sanofi-aventis Canada Inc.: https://pdf.hres.ca/dpd_pm/00062897.PDF. Accessed 2022 Mar 3.
25.Drug Reimbursement Review: isatuximab (Sarclisa) for multiple myeloma. Ottawa (ON): CADTH; 2021 Apr 1: https://www.cadth.ca/isatuximab-sarclisa-multiple-myeloma-details. Accessed 2022 Mar 3.
26.pCODR Expert Review Committee (pERC) Final Recommendation: ixazomib (Ninlaro). Ottawa (ON): CADTH; 2019 Jun 20: https://www.cadth.ca/sites/default/files/pcodr/Reviews2019/10164IxazomibMM_fnRec_2019-07-05_ChairApproved_Post_05Jul2019_final.pdf. Accessed 2022 Mar 30.
27.pCODR Expert Review Committee (pERC) Final Recommendation: daratumumab (Darzalex) plus lenalidomide and dexamethasone, or bortezomib and dexamethasone, for the treatment of patients with multiple myeloma who have received at least one prior therapy. Ottawa (ON): CADTH; 2017 Sep 21: https://www.cadth.ca/sites/default/files/pcodr/pcodr_daratumumab_darzalex_mm_2ndln_fn_rec.pdf. Accessed 2022 Feb 10.
28.pCODR Expert Review Committee (pERC) Final Recommendation: carfilzomib (Kyprolis) with dexamethasone in the treatment of patients with relapsed multiple myeloma who have received one to three prior lines of therapy. Ottawa (ON): CADTH; 2017 Mar 16: https://cadth.ca/sites/default/files/pcodr/pcodr_carfilzomib_kyprolis_mm_rel_fn_rec.pdf. Accessed 2022 Feb 10.
29.pCODR Expert Review Committee (pERC) Final Recommendation: pomalidomide (Pomalyst) in combination with dexamethasone and bortezomib for the treatment of patients with relapsed or refractory multiple myeloma who have received at least one prior treatment regimen including lenalidomide. Ottawa (ON): CADTH; 2019 Sep 18: https://www.cadth.ca/sites/default/files/pcodr/Reviews2019/10165PomalidomideBortezomibMM_fnRec_EarlyConv_18Sep2019_final.pdf. Accessed 2022 Feb 10.
30.Canadian cancer statistics: 2021. Ottawa (ON): Canadian Cancer Society, Government of Canada; 2021: https://cdn.cancer.ca/-/media/files/research/cancer-statistics/2021-statistics/2021-pdf-en-final.pdf?rev=2b9d2be7a2d34c1dab6a01c6b0a6a32d&hash=01DE85401DBF0217F8B64F2B7DF43986&_ga=2.19204728.1746145040.1644590657-1110207523.1644590657. Accessed 2022 Feb 11.
31.CADTH Reimbursement Recommendation (Draft): isatuximab (Sarclisa). Ottawa (ON): CADTH; 2021 Dec: https://www.cadth.ca/sites/default/files/DRR/2021/PC0256%20Sarclisa%20-%20Draft%20CADTH%20Recommendation%20December%2023,%202021_for%20posting.pdf. Accessed 2022 Feb 11.
32.pan-Canadian Pharmaceutical Alliance. Sarclisa (isatuximab). 2021; https://www.pcpacanada.ca/negotiation/21444. Accessed 2021 Aug 25.
33.Tsang M, Le M, Ghazawi FM, et al. Multiple myeloma epidemiology and patient geographic distribution in Canada: A population study. Cancer. 2019;125(14):2435-2444. PubMed
34.Canadian Cancer Society. Past editions: Canadian cancer statistics. 2022; https://cancer.ca/en/research/cancer-statistics/past-editions. Accessed 2022 Apr 14.
Appendix 1: Cost Comparison Table
Note that this appendix has not been copy-edited.
The comparators presented in the following table have been deemed to be appropriate based on feedback from clinical expert(s). Comparators may be recommended (appropriate) practice or actual practice. Existing product listing agreements are not reflected in the table and as such, the table may not represent the actual costs to public drug plans.
Table 8: CADTH Cost Comparison Table for Relapsed Multiple Myeloma
Treatment | Strength or concentration | Form | Price ($) | Recommended dosage | Daily cost ($) | Average |
|---|---|---|---|---|---|---|
Selinexor + bortezomib + dexamethasone (SVd)a | ||||||
Selinexor (Xpovio) | 20 mg | Tab | 550.0000 | 100 mg once weekly | 393 | 11,000 |
Bortezomib (generic) | 3.5 mg | Powder in vial (for infusion) | 654.31 | 1.3 mg/m2 on days 1, 8,15, 22 | 93 | 2,617 |
Dexamethasone (generic) | 0.5 mg 4 mg | Tab | 0.1564b 0.3046b | 20 mg on days 1, 2, 8, 9, 15, 16, 22, 23 | 0.44 | 12 |
SVd | 487 | 13,629 | ||||
Bortezomib + dexamethasone (Vd) | ||||||
Bortezomib (generic) | 3.5 mg | Powder in vial (for infusion) | 654.31 | 1.3 mg/m2 on days 1, 8,15, 22 | 93 | 2,617 |
Dexamethasone (generic) | 0.5 mg 4 mg | Tab | 0.1564b 0.3046b | 40 mg once weekly | 0.44 | 12 |
Vd | 94 | 2,629 | ||||
Carfilzomib + dexamethasone (Kd) | ||||||
Carfilzomib (Kyprolis) | 2 mg/mL | 10 mg 30 mg 60 mg Powder for IV infusion | 255.5500 766.6590 1,533.3300 | Cycle 1: 20 mg/m2 on days 1, 2; 56 mg/m2 on days 8, 9, 15, 16 Cycles 2+: 56 mg/m2 on days 1, 2, 8, 9, 15, 16 | Cycle 1: 439 Cycle 2+: 548 | Cycle 1: 12,267 Cycle 2+: 15,333 |
Dexamethasone (generic) | 0.5 mg 4 mg | Tab | 0.1564b 0.3046b | 20 mg on days 1, 2, 8, 9, 15, 16, 22, 23 | 0.44 | 12 |
Kd | Cycle 1: 439 Cycle 2+: 548 | Cycle 1: 12,279 Cycle 2+:15,345 | ||||
Carfilzomib + cyclophosphamide + dexamethasone (KCd) | ||||||
Carfilzomib (Kyprolis) | 2 mg/mL | 10 mg 30 mg 60 mg Powder for IV infusion | 255.5500 766.6590 1,533.3300 | Cycle 1: 20 mg/m2 on day 1; 70 mg/m2 on days 8, 15 Cycles 2+: 70 mg/m2 on days 1, 8, 15 | Cycle 1: 201 Cycle 2+: 356 | Cycle 1: 5,622 Cycle 2+: 9,967 |
Cyclophosphamide | 25 mg 50 mg | Tab | 0.3545b 0.4773b | 300 mg/m2 on days 1, 8, 15, 22 | 0.75 | 21 |
Dexamethasone (generic) | 0.5 mg 4 mg | Tab | 0.1564b 0.3046b | 40 mg on days 1, 8, 15, 22 | 0.44 | 12 |
KCd | Cycle 1: 202 Cycle 2+: 357 | Cycle 1: 5,655 Cycle 2+:10,000 | ||||
Lenalidomide + dexamethasone (Rd) | ||||||
Lenalidomide (generic) | 2.5 mg 5 mg 10 mg 15 mg 20 mg 25 mg | Cap | 214.1750b 221.0000b 234.6500b 248.300b 261.9500b 275.6000b | 25 mg on days 1 to 21 | 207 | 5,778 |
Dexamethasone | 0.5 mg 4 mg | Tab | 0.1564b 0.3046b | 40 mg on days 1, 8, 15, 22 | 0.44 | 12 |
Rd | 207 | 5,800 | ||||
Pomalidomide + dexamethasone (Pd) | ||||||
Pomalidomide (Pomalyst) | 1 mg 2 mg 3 mg 4 mg | Cap | 500.0000c | 4 mg on days 1 to 21 | 375 | 10,500 |
Dexamethasone | 0.5 mg 4 mg | Tab | 0.1564b 0.3046b | 40 mg on days 1, 8, 15, and 22 | 0.44 | 12 |
Pd | 375 | 10,512 | ||||
Carfilzomib + lenalidomide + dexamethasone (KRd) | ||||||
Carfilzomib (Kyprolis) | 2 mg/mL | 10 mg 30 mg 60 mg Powder for IV infusion | 255.5500 766.6590 1,533.3300 | Cycle 1: 20 mg/m2 on days 1, 2; 27 mg/m2 on days 8, 9, 15, 16 Cycles 2 to 12: 27 mg/m2 on days 1, 2, 8, 9, 15, 16 Cycle 13 to 18: 27 mg/m2 on days 1, 2, 15, 16 | Cycle 1: 256 Cycle 2 to 12: 274 Cycle 13 to 18: 183 | Cycle 1: 7,155 Cycle 2 to 12: 7,667 Cycle 13 to 18: 5,111 |
Lenalidomide (generic) | 2.5 mg 5 mg 10 mg 15 mg 20 mg 25 mg | Cap | 214.1750b 221.0000b 234.6500b 248.300b 261.9500b 275.6000b | 25 mg/d on days 1 to 21 | 207 | 5,788 |
Dexamethasone | 0.5 mg 4 mg | Tab | 0.1564b 0.3046b | 40 mg on days 1, 8, 15, 22 | 0.44 | 12 |
KRd | Cycle 1: 463 Cycle 2 to 12: 481 Cycle 13 to 18: 390 | Cycle 1: 12,955 Cycle 2 to 12: 13,466 Cycle 13 to 18: 10,911 | ||||
Cyclophosphamide + bortezomib + dexamethasone (CyBorD) | ||||||
Cyclophosphamide | 25 mg 50 mg | Tab | 0.3545b 0.4773b | 300 mg/m2 on days 1, 8, 15, 22 | 0.75 | 21 |
Bortezomib (generic) | 3.5 mg | Powder in vial (for infusion) | 654.31 | 1.5 mg/m2 on days 1, 8, 15, 22 | 93 | 2,617 |
Dexamethasone | 0.5 mg 4 mg | Tab | 0.1564b 0.3046b | Cycle 1 and 2: 40 mg on days 1 to 4, 9-12, 17-20 Cycles 3+: 40 mg on days 1, 8, 15, 22 | Cycle 1 to 2: 1.31 Cycle 3+: 0.44 | Cycle 1 and 2: 37 Cycle 3+: 12 |
CyBorD | Cycle 1 and 2: 96 Cycle 3+: 95 | Cycle 1 and 2: 2,675 Cycle 3+: 2,650 | ||||
Daratumumab + bortezomib + dexamethasone (DVd) | ||||||
Daratumumab (Darazalex) | 20 mg/mL | 5 mL vial 20 mL vial Concentrate solution for infusion | 598.0200 2,392.0800 | Cycle 1 to 3: 16 mg/kg on days 1, 8, 15 (21-day cycle) Cycle 4+: 16 mg/kg, on day 1 (21-day cycle for cycles 1–8, 28-day cycle for cycle 9+) | Cycle 1 to 3: 1,025 Cycle 4 to 8: 342 Cycle 9+: 256 | Cycle 1 to 3: 28,705 Cycle 4 to 8: 9,568 Cycle 9+: 7,176 |
Bortezomib | 3.5 mg | Powder in vial (for infusion) | 654.3100 | Cycle 1 to 8: 1.3 mg/m2 days 1, 4, 8, 11 (21-day cycle); not administered past cycle 8 | Cycle 1 to 8: 125 | Cycle 1 to 8: 3,490 |
Dexamethasone | 0.5 mg 4 mg | Tab | 0.1564b 0.3046b | Cycle 1 to 8: 20 mg on days 1, 2, 4, 5, 8, 9, 11, 12 (21-day cycle) | Cycle 1 to 8: 0.58 | Cycle 1 to 8: 16 |
DVd | Cycle 1 to 3: 1,150 Cycle 4 to 8: 467 Cycle 9+: 256 | Cycle 1-3: 32,211 Cycle 4 to 8: 13,074 Cycle 9+: 7,176 | ||||
Daratumumab + lenalidomide + dexamethasone (DRd) | ||||||
Daratumumab | 20 mg/mL | 5 mL vial 20 mL vial Concentrate solution for infusion | 598.0200 2,392.0800 | Cycle 1 to 2: 16 mg/kg on days 1, 8, 15 Cycle 3 to 6: 16 mg/kg on days 1, 15 Cycles 7+: 16 mg/kg on day 1 | Cycle 1 to 2: 1,025 Cycle 3 to 6: 513 Cycle 7+: 256 | Cycle 1 to 2: 28,705 Cycle 3 to 6: 14,352 Cycle 7+: 7,176 |
Lenalidomide (generic) | 2.5 mg 5 mg 10 mg 15 mg 20 mg 25 mg | Cap | 214.1750b 221.0000b 234.6500b 248.3000b 261.9500b 275.6000b | 25 mg/d on days 1 to 21 | 207 | 5,788 |
Dexamethasone | 0.5 mg 4 mg | Tab | 0.1564b 0.3046b | 40 mg on days 1, 8, 15, 22 | 0.44 | 12 |
DRd | Cycle 1 to 2: 1,232 Cycle 3 to 6: 720 Cycle 7+: 463 | Cycle 1 to 2: Cycle 3 to 6: 20,152 Cycle 7+: 12,976 | ||||
Isatuximab + carfilzomib + dexamethasone (IsaKd)d | ||||||
Isatuximab (Sarclisa) | 20 mg/mL | 100 mg vial 500 mg vial | 757.9000 3,789.4900 | Cycle 1: 10 mg/kg on days 1, 8, 15, 22 Cycle 2+: 10 mg/kg on days 1 and 15 | Cycle 1: 866 Cycle 2+: 433 | Cycle 1: 24,253 Cycle 2+: 12,126 |
Carfilzomib (Kyprolis) | 2 mg/mL | 10 mg 30 mg 60 mg Powder for IV infusion | 255.5500 766.6590 1,533.3300 | Cycle 1: 20 mg/m2 days 1, 2; 56 mg/m2 on days 8, 9, 15, 16 Cycles 2+: 56 mg /m2 on days 1, 2, 8, 9, 15, 16 | Cycle 1: 438 Cycle 2+: 548 | Cycle 1: 12,267 Cycle 2+: 15,333 |
Dexamethasone (generic) | 0.5 mg 4 mg | Tab | 0.1564b 0.3046b | 20 mg on days 1, 2, 8, 9, 15, 16, 22, 23 | 0.44 | 12 |
IsaKd | Cycle 1: 1,305 Cycle 2+: 981 | Cycle 1: 36,532 Cycle 2+: 27,472 | ||||
Isatuximab + pomalidomide + dexamethasone (IsaPd) | ||||||
Isatuximab (Sarclisa) | 20 mg/mL | 100 mg vial 500 mg vial | 757.9000 3,789.4900 | Cycle 1: 10 mg/kg on days 1, 8, 15, 22 Cycle 2+: 10 mg/kg on days 1, 15 | Cycle 1: 866 Cycle 2+: 433 | Cycle 1: 24,253 Cycle 2+: 12,126 |
Pomalidomide (Pomalyst) | 1 mg 2 mg 3 mg 4 mg | Cap | 500.0000c | 4 mg on days 1-21 | 375 | 10,500 |
Dexamethasone | 0.5 mg 4 mg | Tab | 0.1564b 0.3046b | 40 mg on days 1, 8, 15, 22 | 0.44 | 12 |
IsaPd | Cycle 1: 1,242 Cycle 2+: 809 | Cycle 1: 34,765 Cycle 2+: 22,639 | ||||
Lenalidomide + cyclophosphamide + dexamethasone (CRd) | ||||||
Lenalidomide (generic) | 2.5 mg 5 mg 10 mg 15 mg 20 mg 25 mg | Cap | 214.1750b 221.0000b 234.6500b 248.300b 261.9500b 275.6000b | 25 mg/d on days 1 to 21 | 207 | 5,788 |
Cyclophosphamide | 25 mg 50 mg | Tab | 0.3545b 0.4773b | 300 mg/m2 on days 1, 8, 15 | 0.56 | 16 |
Dexamethasone | 0.5 mg 4 mg | Tab | 0.1564b 0.3046b | 40 mg on days 1, 8, 15, 22 | 0.44 | 12 |
CRd | 208 | 5,816 | ||||
Pomalidomide + bortezomib + dexamethasone (PVd) | ||||||
Pomalidomide (Pomalyst) | 1 mg 2 mg 3 mg 4 mg | Cap | 500.0000c | 4 mg on days 1 to 14 (21-day cycle) | 333 | 9,333 |
Bortezomib (generic) | 3.5 mg | Powder in vial (for infusion) | 654.3100 | Cycles 1 to 8: 1.3 mg/m2 on days 1, 4, 8, 11 (21-day cycle) Cycles 9+: 1.3 mg/m2 on days 1, 8 (21-day cycle) | Cycle 1 to 8: 125 Cycle 9+:62 | Cycle 1 to 8: 3,490 Cycle 9+: 1,745 |
Dexamethasone | 0.5 mg 4 mg | Tab | 0.1564b 0.3046b | Cycle 1 to 8: 20 mg on days 1, 2, 4, 5, 8, 9, 11, 12 (21-day cycle) Cycles 9+: 20 mg on days 1, 2, 8, 9 (21-day cycle) | Cycle 1 to 8: 0.58 Cycle 9+: 0.29 | Cycle 1 to 8: 16 Cycle 9+: 8 |
PVd | Cycle 1 to 8: 459 Cycle 9+: 396 | Cycle 1 to 8: 12,839 Cycle 9+: 11,086 | ||||
Pomalidomide + cyclophosphamide + dexamethasone (PCd) | ||||||
Pomalidomide (Pomalyst) | 1 mg 2 mg 3 mg 4 mg | Cap | 500.0000c | 4 mg on days 1 to 21 | 375 | 10,500 |
Cyclophosphamide | 25 mg 50 mg | Tab | 0.3545b 0.4773b | 400 mg on days 1, 8, 15 | 0.41 | 11 |
Dexamethasone | 0.5 mg 4 mg | Tab | 0.1564b 0.3046b | 40 mg on days 1, 8, 15, 22 | 0.44 | 12 |
PCd | 376 | 10,524 | ||||
Ixazomib + pomalidomide + dexamethasone (IxaPd) | ||||||
Ixazomib (Ninlaro) | 2.3 mg 3 mg 4 mg | Cap | 2,964.6500e | 4 mg on days 1, 8, 15 | 318 | 8,894 |
Pomalidomide (Pomalyst) | 1 mg 2 mg 3 mg 4 mg | Cap | 500.0000c | 4 mg on days 1 to 21 | 375 | 10,500 |
Dexamethasone | 0.5 mg 4 mg | Tab | 0.1564b 0.3046b | 40 mg on days 1, 8, 15, 22 | 0.44 | 12 |
IxaPd | 693 | 19,406 | ||||
Ixazomib + dexamethasone (IxaDex) | ||||||
Ixazomib (Ninlaro) | 2.3 mg 3 mg 4 mg | Cap | 2,964.6500e | 4 mg on days 1, 8, 15 | 318 | 8,894 |
Dexamethasone | 0.5 mg 4 mg | Tab | 0.1564b 0.3046b | 40 mg on days 1, 8, 15, 22 | 0.44 | 12 |
IxaDex | 318 | 8,906 | ||||
Ixazomib + dexamethasone + cyclophosphamide (IxaCd) | ||||||
Ixazomib (Ninlaro) | 2.3 mg 3 mg 4 mg | Cap | 2,964.6500e | 4 mg on days 1, 8, 15 | 318 | 8,894 |
Dexamethasone | 0.5 mg 4 mg | Tab | 0.1564b 0.3046b | 40 mg on days 1, 8, 15, 22 | 0.44 | 12 |
Cyclophosphamide | 25 mg 50 mg | Tab | 0.3545b 0.4773b | 300 mg on days 1, 8, 15 | 0.41 | 11 |
IxaCd | 318 | 8,915 | ||||
Ixazomib + lenalidomide + dexamethasone (IxaRd) | ||||||
Ixazomib (Ninlaro) | 2.3 mg 3 mg 4 mg | Cap | 2,964.6500e | 4 mg on days 1, 8, 15 | 318 | 8,894 |
Lenalidomide (Revlimid) | 2.5 mg 5 mg 10 mg 15 mg 20 mg 25 mg | Cap | 214.1750b 221.0000b 234.6500b 248.300b 261.9500b 275.6000b | 25 mg/d on days 1 to 21 | 207 | 5,788 |
Dexamethasone | 0.5 mg 4 mg | Tab | 0.1564b 0.3046b | 40 mg on days 1, 8, 15, 22 | 0.44 | 12 |
IxaRd | 525 | 14,694 | ||||
Note: All prices are from the Delta IQVIA database (accessed March 2022), unless otherwise indicated, and do not include dispensing fees. Recommended dosage is based on Cancer Care Ontario monographs, unless otherwise indicated. For dosing that depends on weight or body surface area, CADTH assumed 75 kg or 1.83 m2 based on the BOSTON trial and the sponsor’s pharmacoeconomic submission. Total cost estimates per regimen are based on the cheapest combination of the component drugs, with wastage considered for single-use vials.
aSelinexor price on the sponsor’s submission. Dosage based on the draft selinexor product monograph,2 for use in combination with bortezomib and dexamethasone.
bOntario Drug Benefit Formulary.15
cOntario Exceptional Access Program.23
dRecommended dosage based on the isatuximab product monograph24 and CADTH Reimbursement Reviews.25
epCODR Expert Review Committee (pERC) Final Recommendation: Ixazomib (Ninlaro).26
Appendix 2: Submission Quality
Note that this appendix has not been copy-edited.
Description | Yes/No | Comments |
|---|---|---|
Population is relevant, with no critical intervention missing, and no relevant outcome missing | No | Relevant interventions (e.g., IsaPd, IsaKd) were not included as part of the economic analysis. The cost-effectiveness of SVd relative to these interventions is unknown. |
Model has been adequately programmed and has sufficient face validity | No | The model includes numerous IFERROR statements. The systematic use of IFERROR statements makes thorough auditing of the sponsor’s model impractical, as it remains unclear whether the model is running inappropriately by overriding errors. CADTH also notes some parameters, such as bortezomib cost, were overridden when the PSA was conducted. It is unclear why this occurs and CADTH had to correct many aspects of the PSA to ensure results were functional. |
Model structure is adequate for decision problem | No | A partitioned-free survival model was used which introduced structural constraints. A Markov model would have been more appropriate. Relevant subgroups (e.g., line of therapy, type of prior therapy) could not be considered. |
Data incorporation into the model has been done adequately (e.g., parameters for probabilistic analysis) | No | For some model parameters, the sponsor arbitrarily incorporated uncertainty using a standard deviation equal to +/-20% of the mean value (e.g., percentage of patients experiencing an adverse event, relative dose intensity, health care costs, adverse event costs), which does not reflect the true uncertainty around the model’s parameters possible. values. |
Parameter and structural uncertainty were adequately assessed; analyses were adequate to inform the decision problem | Yes | No comment. |
The submission was well organized and complete; the information was easy to locate (clear and transparent reporting; technical documentation available in enough details) | No | Errors were noted in the pharmacoeconomic report (e.g., transposed OS and PFS hazard ratios). |
Appendix 3: Additional Information on the Submitted Economic Evaluation
Figure 1: Kaplan-Meier Plot From the BOSTON Trial and Extrapolations for Overall Survival for SVd and Vd
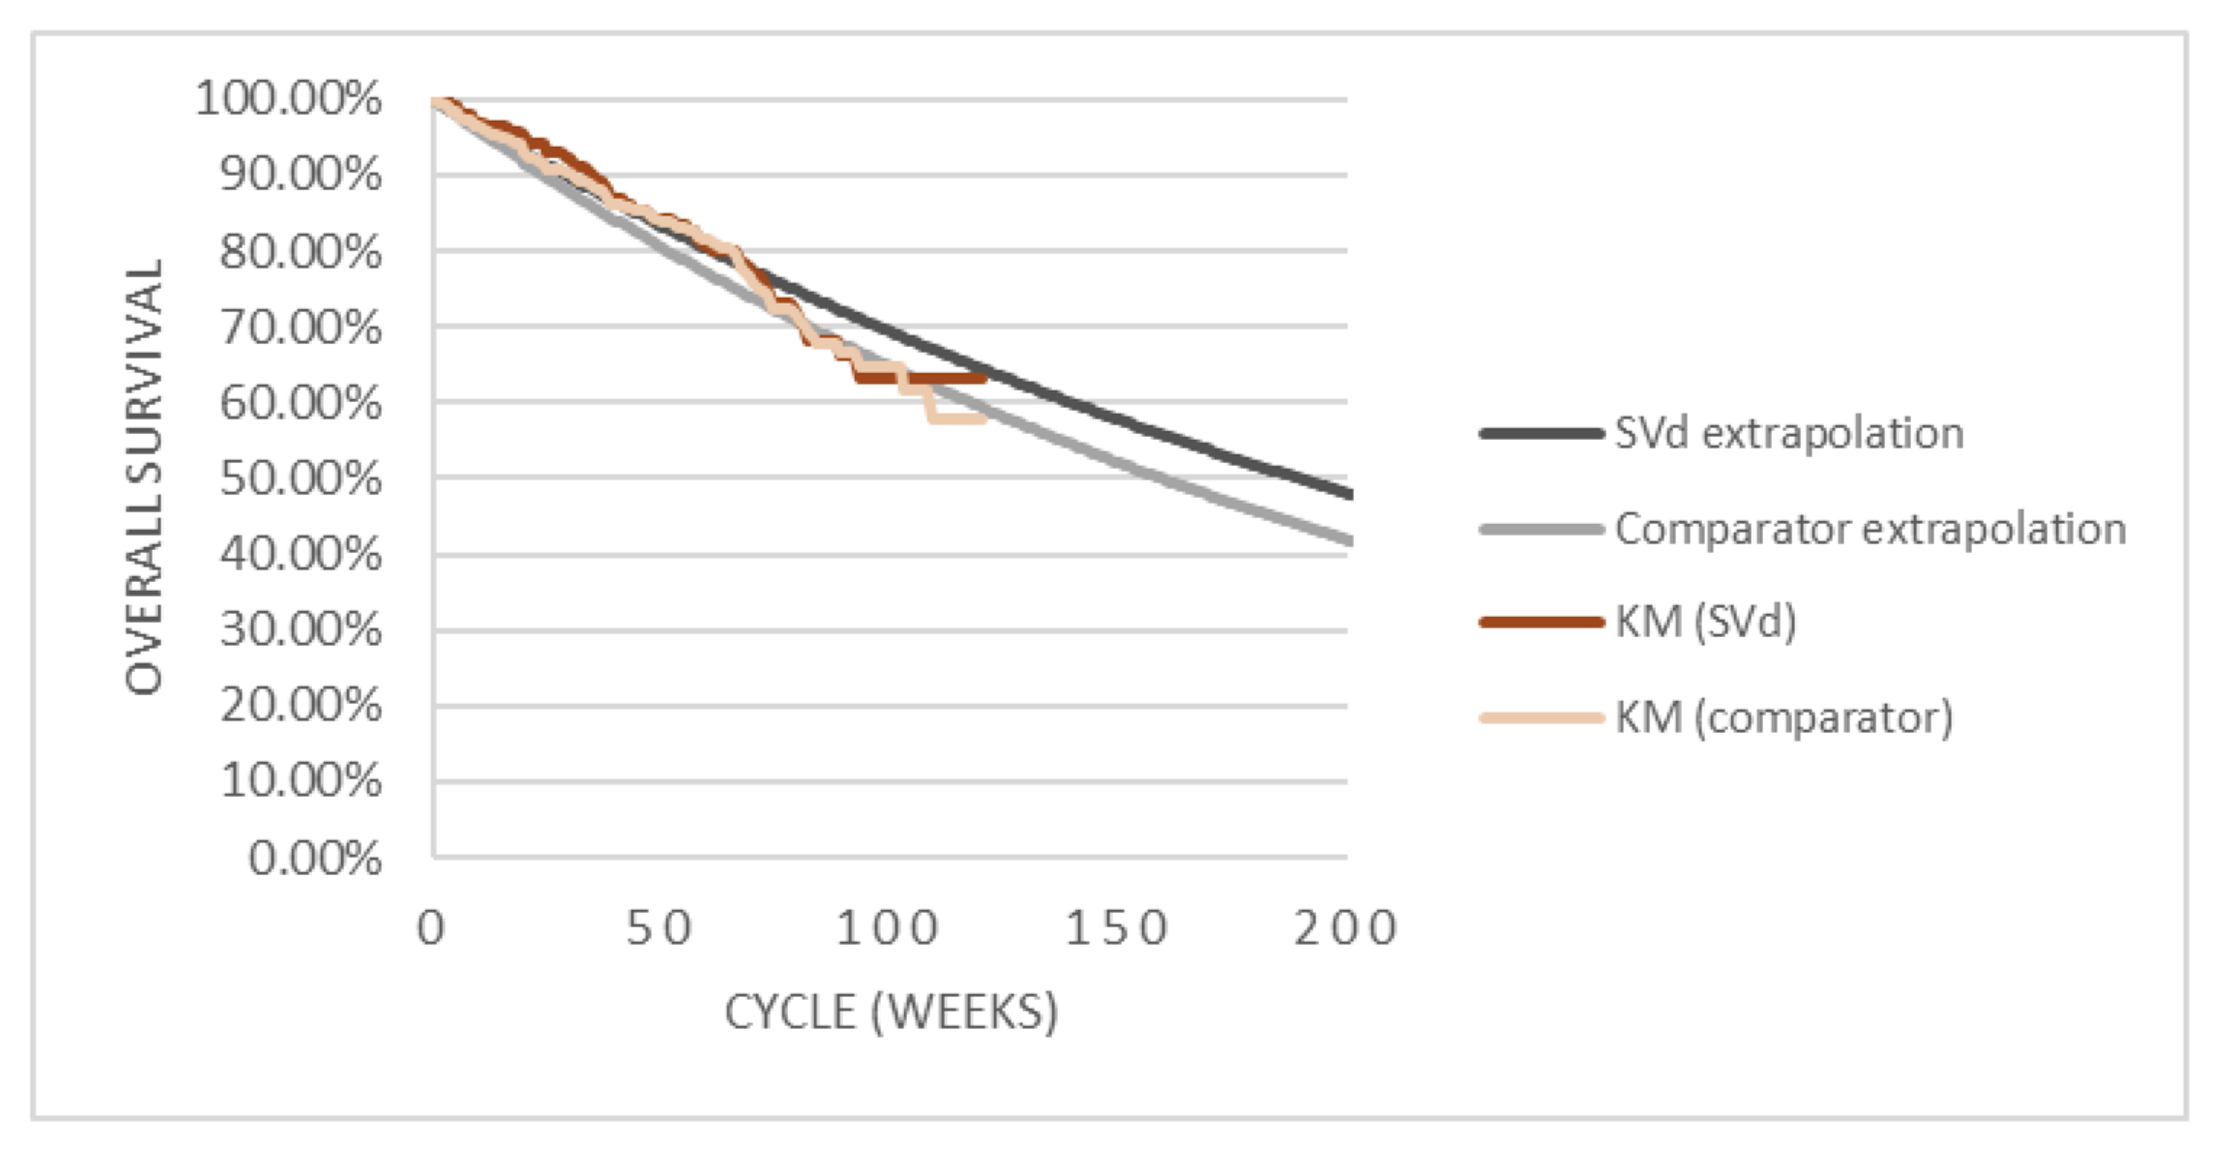
KM = Kaplan-Meier; SVd = selinexor + bortezomib + dexamethasone.
Note: Figure shows the first 200 weeks of the 20-year horizon. Comparator refers to bortezomib + dexamethasone. Note that this figure has not been copy-edited.
Source: Sponsor’s pharmacoeconomic submission.1
Table 10: Detailed Results of the Sponsor’s Base Case
Parameter | SVd | Vd | KCd | Kd | CyBorD | DVd | DRd | Rd | KRd | PVd | SOC |
|---|---|---|---|---|---|---|---|---|---|---|---|
Discounted LYs | |||||||||||
Progression-free | 2.81 | 1.54 | 1.19 | 3.65 | 1.04 | 5.69 | 4.85 | 1.54 | 2.38 | 3.13 | 2.06 |
Post-progression | 2.15 | 2.57 | 2.29 | 1.58 | 2.78 | 5.26 | 3.26 | 2.51 | 2.55 | 1.36 | 2.64 |
Total | 4.96 | 4.11 | 3.48 | 5.23 | 3.82 | 10.95 | 8.11 | 4.05 | 4.93 | 4.49 | 4.70 |
Discounted QALYs | |||||||||||
Progression-free | 2.30 | 1.26 | 0.97 | 2.96 | 0.84 | 4.73 | 4.01 | 1.25 | 1.95 | 2.62 | 1.69 |
Post-progression | 1.38 | 1.64 | 1.46 | 1.01 | 1.78 | 3.36 | 2.08 | 1.60 | 1.63 | 0.87 | 1.69 |
Total | 3.68 | 2.90 | 2.44 | 3.97 | 2.62 | 8.09 | 6.09 | 2.85 | 3.58 | 3.49 | 3.37 |
Discounted costs ($) | |||||||||||
Drug costsa | |||||||||||
Initial therapy | 114,154 | 49,027 | 117,237 | 205,347 | 42,538 | 230,044 | 435,345 | 74,933 | 341,272 | 149,730 | 166,936 |
Subsequent therapy | 46,395 | 46,331 | 46,315 | 46,216 | 46,242 | 46,030 | 45,593 | 46,250 | 45,599 | 46,222 | 46,088 |
Adverse events | 803 | 581 | 4,164 | 3,351 | 1,785 | 982 | 1,105 | 688 | 1,007 | 1,061 | 1,849 |
Medical care | |||||||||||
Progression-free | 6,985 | 3,817 | 2,952 | 9,066 | 2,574 | 14,143 | 12,068 | 3,823 | 5,918 | 7,773 | 5,106 |
Post-progression | 5,876 | 7,006 | 6,237 | 4,312 | 7,583 | 14,360 | 8,896 | 6,831 | 6,953 | 3,709 | 7,198 |
Mortality | 64,770 | 66,720 | 67,646 | 64,326 | 66,950 | 40,912 | 54,731 | 66,405 | 64,355 | 65,959 | 65,554 |
Total | 238,983 | 173,482 | 244,551 | 332,618 | 167,672 | 346,471 | 557,737 | 198,930 | 465,103 | 274,455 | 292,730 |
CyBorD = cyclophosphamide + bortezomib + dexamethasone; DRd = daratumumab + lenalidomide + dexamethasone; DVd = daratumumab + bortezomib + dexamethasone; ICER = incremental cost-effectiveness ratio; KCd = carfilzomib + cyclophosphamide + dexamethasone; Kd = carfilzomib + dexamethasone; KRd = carfilzomib + lenalidomide+ dexamethasone; LY= life-year; PVd = pomalidomide + bortezomib + dexamethasone; QALY = quality-adjusted life-year; Rd = lenalidomide + dexamethasone; SOC = standard of care; SVd = selinexor + bortezomib + dexamethasone; Vd = bortezomib + dexamethasone.
Note: This table has not been copy-edited.
aIncludes drug acquisition costs, as well as administration costs for drugs administered by subcutaneous injection or intravenous infusion.
Source: Sponsor’s pharmacoeconomic submission.1
Appendix 4: Additional Details on the CADTH Reanalyses and Sensitivity Analyses of the Economic Evaluation
Note that this appendix has not been copy-edited.
Detailed Results of CADTH Exploratory Reanalysis
Table 11: Disaggregated Summary of CADTH’s Exploratory Economic Evaluation Results
Parameter | SVd | Vd | Incremental (vs. Vd) |
|---|---|---|---|
Discounted LYs | |||
Progression-free | 1.59 | 1.14 | 0.46 |
Post-progression | 1.78 | 2.23 | –0.46 |
Total | 3.37 | 3.37 | 0 |
Discounted QALYs | |||
Progression-free | 1.27 | 0.91 | 0.36 |
Post-progression | 1.37 | 1.72 | −0.35 |
Total | 2.64 | 2.62 | 0.01 |
Discounted costs ($) | |||
Drug costsa | 171,951 | 67,058 | 104,893 |
Initial therapy | 128,892 | 24,059 | 97,395 |
Subsequent therapy | 43.059 | 42,999 | 61 |
Adverse events | 806 | 584 | 222 |
Medical care | 8,773 | 8,878 | −105 |
Progression-free | 3,955 | 2,826 | 1,129 |
Post-progression | 4,818 | 6,025 | −1,234 |
Mortality | 68,949 | 68,949 | 0 |
Total | 250,479 | 145,469 | 105,010 |
ICER ($/QALY) | 10,884,623 | ||
ICER = incremental cost-effectiveness ratio; LY= life-year; QALY = quality-adjusted life-year; SVd = selinexor + bortezomib + dexamethasone; Vd = bortezomib + dexamethasone.
aIncludes drug acquisition costs, as well as administration costs for drugs administered by subcutaneous injection or intravenous infusion.
Scenario Analyses
Table 12: CADTH Scenario Analyses
Scenario analyses | CADTH base case | CADTH scenarioa |
|---|---|---|
1. Population | Weighted cost-effectiveness analysis reflecting use at second and later lines | Separate cost-effectiveness analyses for second-line and third-line and later use |
2. PFS | Based on BOSTON trial (IRC assessment; ITT population) | Based on sponsor-provided BOSTON trial sensitivity analysis, in which treatment discontinuation was treated as an event in the PFS analysis (HR 0.9520 for SVd versus Vd) |
3. Utility values | EQ-5D-5L values from the BOSTON trial; assumed equal regardless of treatment received | Obtained from the literature12 |
IRC = independent review committee; ITT = intention-to-treat; HR = hazard ratio; PFS = progression-free survival; SVd = selinexor + bortezomib + dexamethasone; Vd = bortezomib + dexamethasone.
Table 13: CADTH Scenario Analyses Results
Drug | Total costs ($) | Total QALYs | ICER ($/QALY) |
|---|---|---|---|
CADTH exploratory analysisa | |||
Vd | 145,036 | 2.64 | Reference |
SVd | 250,117 | 2.65 | 10,843,347 |
Scenario 1a: Population = 2La,b | |||
Vd | 144,803 | 2.54 | Reference |
SVd | 249,783 | 2.56 | 5,130,503 |
Scenario 1b: Population = 3L+a,c | |||
Vd | 144,959 | 2.615 | Reference |
SVd | 250,045 | 2.622 | 16,451,233 |
Scenario 2: PFS (HR 0.95)a | |||
Vd | 145,036 | 2.64 | Reference |
SVd | 250,213 | 2.64 | Dominated |
Scenario 3: Health state utility values (Jakubowiak [2016]12)a | |||
Vd | 145,036 | 2.34 | Reference |
SVd | 250,117 | 2.42 | 1,371,456 |
ICER = incremental cost-effectiveness ratio; QALY = quality-adjusted life-year; Ref. = reference; SVd = selinexor + bortezomib + dexamethasone; Vd = bortezomib + dexamethasone.
aDeterministic analysis.
bPFS HR 0.5997.
cPFS HR 0.7416.
Appendix 5: Submitted Budget Impact Analysis and CADTH Appraisal
Note that this appendix has not been copy-edited.
Table 14: Summary of Key Take-Aways
Key take-aways of the BIA |
|---|
|
Summary of Sponsor’s Budget Impact Analysis
The sponsor submitted a budget impact analysis (BIA) estimating the incremental budget impact of reimbursing selinexor for use in combination with bortezomib plus dexamethasone (SVd) for the treatment of multiple myeloma among patients who have received at least one prior therapy. The BIA was undertaken from the perspective of the Canadian public drug plans over a 3-year time horizon, and the sponsor’s pan-Canadian estimates reflect the aggregated results from provincial budgets (excluding Quebec). Key inputs to the BIA are documented in Table 15.
The sponsor estimated the eligible population using an epidemiologic approach. In the reference scenario, patients were assumed to receive daratumumab plus bortezomib plus dexamethasone (DVd), carfilzomib plus dexamethasone (Kd), carfilzomib plus cyclophosphamide plus dexamethasone (KCd), cyclophosphamide plus bortezomib plus dexamethasone (CyBorD), bortezomib plus dexamethasone (Vd), lenalidomide plus dexamethasone (Rd), daratumumab plus lenalidomide plus dexamethasone (DRd), carfilzomib plus lenalidomide plus dexamethasone (KRd), or pomalidomide plus bortezomib plus dexamethasone (PVd). In the new drug scenario, selinexor was assumed to be reimbursed and prescribed as second- or later-line therapy as part of selinexor plus bortezomib plus dexamethasone (SVd). Market share in the reference scenario (i.e., in the absence of SVd) was based on sponsor-commissioned “market research of Canadian practice patterns for MM.” The market share captured by SVd was assumed to vary by line of therapy (Table 15), with market share taken from DVd, KCd, Kd, CyBorD, and Vd based on clinician input.
In the sponsor’s base case, costs related to drug acquisition were captured, with dosing, RDI, and cycles of therapy based on clinical trial data, product monographs, and cancer agencies. In the sponsor’s base case, wastage was assumed, such that unused portions of drug vials would be discarded. The duration of treatment for SVd was assumed by the sponsor to be 30 weeks (6 cycles). Duration of treatment for comparators ranged from 27 to 88 weeks, based on median duration of treatment in clinical trials, maximum number of cycles allowed per protocol, mean time to progression, or PFS. The cost of selinexor was based on the sponsors submitted price ($550.00 per 20 mg tablet). The cost of bortezomib was based on that submitted by the sponsor in a previous pCODR review.13 Drug costs of other components regimens were obtained from the Ontario Drug Benefit Formulary15 or previous pCODR reviews.14,27-29 Costs related to dispensing, markup, administration, or subsequent therapy were not included.
Table 15: Summary of Key Model Parameters
Parameter | Sponsor’s estimate (year 1 / year 2 / year 3) | |||
|---|---|---|---|---|
Target population | Second line | Third line | Fourth+ line | |
Prevalence of multiple myelomaa,b | 3,263 / 3,311 / 3,359 | 1,958 / 1,986 / 2,015 | 1,305 / 1,324 / 1,344 | |
Proportion who receive a comparator to SVdc | 3,093 / 3,138 / 3,183 | 1,350 / 1,369 / 1,389 | 821 / 833 / 845 | |
Number of eligible patients for pan-Canadian jurisdictions excluding Quebec | 2,406 / 2,445 / 2,484 | 1,050 / 1,067 / 1,084 | 639 / 649 / 660 | |
Market uptake (3 years) | ||||
Uptake (reference scenario) | Second line | Third line | Fourth+ line | |
SVd | 0% / 0% / 0% | 0% / 0% / 0% | 0% / 0% / 0% | |
DVd | 19% / 18% / 17% | 30% / 25% / 22% | 0% / 0% / 0% | |
Kd | 6% / 9% / 13% | 20% / 28% / 36% | 38% / 41% / 44% | |
KCd | 2% / 6% / 13% | 14% / 20% / 25% | 38% / 41% / 44% | |
CyBorD | 4% / 4% / 4% | 2% / 2% / 2% | 5% / 5% / 5% | |
Vd | 0% / 0% / 0% | 0% / 0% / 0% | 0% / 0% / 0% | |
DRd | 48% / 44% / 37% | 25% / 18% / 10% | 17% / 12% / 7% | |
Rd | 21% / 19% / 16% | 4% / 3% / 1% | 2% / 2% / 1% | |
KRd | 1% / 1% / 1% | 2% / 2% / 2% | 0% / 0% / 0% | |
PVd | 0% / 0% / 0% | 2% / 2% / 2% | 0% / 0% / 0% | |
Uptake (new drug scenario) | Second line | Third line | Fourth+ line | |
SVd | |||||||||||||||||||| | |||||||||||||||||||| | |||||||||||||||||||| | |
DVd | 15% / 12% / 8% | 12% / 16% / 21% | 0% / 0% / 0% | |
Kd | 3% / 6% / 7% | 8% / 12% / 15% | 29% / 30% / 31% | |
KCd | 1% / 4% / 7% | 2% / 6% / 13% | 29% / 30% / 31% | |
CyBorD | 3% / 2% / 1% | 2% / 2% / 1% | 4% / 2% / 1% | |
Vd | 0% / 0% / 0% | 2% / 2% / 1% | 0% / 0% / 0% | |
DRd | 48% / 44% / 37% | 25% / 18% / 10% | 17% / 12% / 7% | |
Rd | 21% / 19% / 16% | 4% / 3% / 1% | 2% / 2% / 1% | |
KRd | 1% / 1% / 1% | 2% / 2% / 2% | 0% / 0% / 0% | |
PVd | 0% / 0% / 0% | 2% / 2% / 2% | 0% / 0% / 0% | |
Treatment cost, per patient | Cost per 28-day cycled | Total cost over the estimated treatment durationd | ||
SVd | $16,625 | $99,749 | ||
DVd | $41,503 | $188,500 | ||
Kd | $33,745 | $217,879 | ||
KCd | $24,561 | $135,212 | ||
CyBorD | $5,651 | $84,767 | ||
Vd | $11,247 | $50,600 | ||
DRd | $56,033 | $305,331 | ||
Rd | $5,836 | $58,095 | ||
KRd | $30,333 | $274,795 | ||
PVd | $15,429 | $150,004 | ||
CyBorD = cyclophosphamide + bortezomib + dexamethasone; DRd = daratumumab + lenalidomide + dexamethasone; DVd = daratumumab + bortezomib + dexamethasone; KCd = carfilzomib + cyclophosphamide + dexamethasone; Kd = carfilzomib + dexamethasone; KRd = carfilzomib + lenalidomide + dexamethasone; PVd = pomalidomide + bortezomib + dexamethasone; Rd = lenalidomide + dexamethasone; SVd = selinexor + bortezomib + dexamethasone; Vd = bortezomib + dexamethasone.
aBased on an estimated 12,500 patients with multiple myeloma in 2020, to which a 1.015% growth rate was applied (based on Canadian population growth between 2016 and 2020). The sponsor estimates a total of 13,053 patients with multiple myeloma across all lines of therapy in year 1, 13,243 patients in in year 2, and 13,435 patients in year 3.
bThe sponsor assumed that, of prevalent patients in any given year, 50% would be receiving first-line treatment, 25% would be receiving second-line treatment, 15% would be receiving third-line treatment, and 10% would be receiving fourth- or later-line therapy.
cThe sponsor assumed that in each year, a proportion of patients would receive a regimen deemed to not be a comparator to SVd (year 1: 5%; year 2: 31%; year 3: 37%). These include regimens received as part of clinical trials, as well as regimens deemed by the sponsor to not be comparators to SVd.
dThe sponsor’s estimated costs are adjusted for RDI, excludes drug wastage, and includes administration costs for drugs administered by subcutaneous injection or intravenous infusion.
eThe sponsor’s estimated total costs incorporate an estimated duration of treatment for each regimen.
Summary of the Sponsor’s BIA Results
The sponsor estimated the reimbursement of SVd for the full Health Canada indication to result in cost savings of $178,015,589 over 3-year budget period (year 1: −$41,035,480; year 2: −$57,914,786; year 3: −$79,065,323).
The sponsor estimates that the 3-year budget impact of reimbursing SVd as second-line treatment to be a savings of$80,538,339 (year 1: −$15,243,502; year 2: −$24,223,731; year 3: −$41,071,106). The 3-year budget impact of reimbursing SVd as a third-line therapy was estimated to be a savings of$66,713,540 (year 1: −$17,773,158; year 2: −$23,298,397; year 3: −$25,641,984), and the impact of reimbursing SVd as fourth- or later-line therapy was estimated to be a savings $30,763,710 (year 1: −$8,018,819; year 2: −$10,392,658; year 3: −$12,352,233).
CADTH Appraisal of the Sponsor’s BIA
CADTH identified several key limitations to the sponsor’s analysis that have notable implications on the results of the BIA:
The estimate of prevalence is uncertain. The sponsor used an epidemiological approach to estimate the target population size. They looked at incident cases of MM from 2010 to 2021 and assume a certain percentage of patients live an additional year, up to 10 years, to calculate prevalence in 2020. Data suggests that 5-year survival for MM is 50% which is slightly higher than the value used by the sponsor (46%). This would mean a slight underestimation of prevalence. The sponsor also assumes that no one diagnosed with MM prior to 2010 appears in the prevalent MM population of 2020, which also likely underestimates prevalence. Using this methodology, the sponsor calculates that in 2020 there will be 12,504 prevalent cases of MM in Canada. New cases of MM beyond that were assumed to be a result of population growth, which is inappropriate as the incidence of MM in Canada appears to be increasing over time, with incidence rates increasing by about 2.65% per year since 2007 per year among men and1.6% per year among women since 2005.30 As such, the use of only population growth to estimate new cases of MM beyond 2020 underestimates the prevalence. In 2021, an estimated 3,800 people were newly diagnosed with MM (age-standardized incidence rate: 8.4 per 100,000 people).30 The sponsor acknowledges this data and one can calculate that the prevalence of MM would be 13,375 in 2021 using the same methodology as described above. However, in the sponsors analysis, they inflate the 2020 prevalence value by Canadian population growth leading to a lower prevalence estimate of 12,683 prevalent cases of MM in Canada in 2021.
The estimate of prevalence is uncertain as it uses assumptions that do not use the best available Canadian data.
The number of patients receiving therapy is uncertain: The sponsor takes the prevalent population and splits it into what proportion are receiving first-line, second-line, third-line, or forth-line+ therapy. Given the Health Canada indication, SVd would not be used in the first-line setting. Therefore, the sponsor removed all patients receiving first-line therapy and assumes only the remaining patients will be eligible for treatment with SVd. Limited details are provided into how the sponsor derived the distribution of treatment across different lines. More importantly, the sponsor does not consider incident cases different from prevalent cases. This would indicate that patients currently receiving second-line therapy may switch to SVd. This is unlikely to occur in practice if a patient is responding to their current therapy. Therefore, only patients who fail 1L therapy once SVd is available will likely be considered. Patients currently on 2L therapy would only be considered for SVd once they fail their current therapy and therefore require 3L therapy.
Newly diagnosed cases of MM make up a substantial proportion of prevalent cases. As noted, in 2021, there were 3,800 newly diagnosed cases of MM. This represents 30% of prevalent cases using the sponsors estimation of prevalence in 2021 (12,682). The majority of patients will not require 2L therapy in their first year of diagnosis. Data from Mian et al20 shows that, in Canada, median time to 2L therapy is 15 months for those who are transplant-ineligible and 25.4 months for those who are transplant-eligible. Therefore, the proportion of patients who will be eligible for 2L therapy will depend on the year of diagnosis, same for subsequent lines as well.
The analysis should differentiate prevalent cases from incident cases to determine the likely uptake of SVd. This is not explicitly considered in the sponsors analysis, and it is unclear whether this has been accounted for in market uptake. CADTH has provided additional calculations to explore the impact of this in the reanalysis section.
Unclear market shares for current comparators: the sponsor further reduced the size of the eligible population who could receive SVd by 5% in the second-line, 31% in the third line, and by 37% in the fourth line, assuming that these patients would get “non-comparator regimens” and be ineligible to receive SVd. These regimens include: KPd, PCd, IsaPd, Pd, RCd, RVd, SelVd, VMP, VTd, Ixa-based regimens, “other” daratumumab-based regimens, and regimens received as part of clinical trials. Reducing the number of eligible patients according to treatment received artificially underestimates the number of patients eligible for SVd treatment, given that the requested reimbursement population includes all patients with MM who have at least one prior therapy. A more appropriate method would be to include these comparators in the market share estimates and assume 0% uptake. Given the lack of transparency in the sponsors approach, it is unclear why this approach was taken.
The number of patients eligible for SVd is uncertain. CADTH was unable to validate the proportion of patients who receive a “non-comparator regimen” and notes that such patients may be eligible to receive SVd.
All relevant comparators were not considered. The sponsor’s BIA considered costs related to SVd, DVd, Kd, KCd, CyBorD, Vd, DRd, Rd, KRd, and PVd. As shown in Table 8, there are additional relevant comparators that may be considered in this population, including isatuximab-based regimens (i.e., IsaPd, IsaKd). Isatuximab received conditional positive reimbursement recommendations from pERC in 2021 for relapsed and refractory MM in patients who have received at least 2 prior therapies including lenalidomide and a proteasome inhibitor (IsaPd)25 and in patients who have received 1-3 prior lines of therapy (IsaKd).31 Isatuximab is currently undergoing negotiations with the pan-Canadian Pharmaceutical Alliance.32 Should isatuximab become publicly reimbursed during the 3-year BIA analysis horizon, IsaPd and IsaKd would considered relevant comparators (depending on line of therapy and prior treatment experience).
As noted by clinical experts consulted by CADTH for this review, the treatment of MM after first-line therapy is highly individualized and depends, at least in part, on prior treatments received. Clinical experts indicated that the majority of patients receive lenalidomide in the first-line setting and would not be rechallenged with lenalidomide-based regimens in the second or later line. However, lenalidomide-containing regimens would be considered relevant comparators at the second-line among those whose MM was not refractory to first-line lenalidomide.
CADTH was unable to consider the impact of including costs related to additional relevant treatment comparators, owing to the structure of the sponsor’s model and a lack of data (e.g., proportion of lenalidomide-refractory patients, eligible patients, market share). The budget impact of reimbursing selinexor will depend on part on the funding of comparators, which varies by jurisdiction.
Uncertainty regarding the uptake of SVd. The sponsor assumed that, in the second-line setting, the market share for SVd would be ||||||||||||||||||| in year 1, year 2, and year 3, respectively. Initial uptake was assumed to be higher in the third and later lines (3L: |||||||||||||||||||; 4L+: |||||||||||||||||||). The sponsor assumed that SVd would take market share only from DVd, KCd, Kd, CyBorD, and Vd. Clinical experts consulted by CADTH for this review indicated that, of the comparators included in the sponsor’s BIA, SVd may also take market share from PVd and KRd in the third-line setting. Clinical experts consulted by CADTH noted that the sponsor’s estimated market uptake may be overestimated owing to the availability of other treatments and may differ among patients with or without prior lenalidomide exposure.
CADTH was unable to consider the impact of including costs related to additional relevant treatment comparators, owing to the structure of the sponsor’s model and a lack of data (e.g., proportion of lenalidomide-refractory patients, eligible patients, market share). The budget impact of reimbursing selinexor will depend on part on the funding of comparators, which varies by jurisdiction. CADTH was unable to separately model the uptake of SVd among patients with previous exposure to lenalidomide. The number of patients receiving SVd may be lower than the sponsor’s analysis suggests if there is reduced uptake.
Costs related to selinexor treatment were underestimated. Costs related to the use of selinexor were underestimate in several ways. First, In the calculation of drug costs, the sponsor assumed that patients would receive SVd for 6 cycles. This is in contrast with the product monograph, which recommends that selinexor be administered until disease progression or unacceptable toxicity.2 In the BOSTON trial, the mean treatment duration with SVd was 40 weeks (min: 1 week; max 120 weeks), and 35.9% of patients received SVd for 48 or more weeks (12 or more cycles). Further, the sponsor’s pharmacoeconomic model suggests that, at the end of the first 3 years of treatment, 29.9% of patients will remain on SVd treatment. Thus, it is likely that the sponsor’s BIA underestimates the duration of time that patients will receive SVd, thus underestimating the total drug costs associated the reimbursement of selinexor. Second, the sponsor adjusted drug acquisition costs by RDI observed in the BOSTON trial for selinexor and in other clinical trials for model comparators. The use of trial-based RDI may not reflect the use of cancer regimens in clinical practice. Third, pre-medication costs were excluded from the BIA. The draft selinexor monograph recommends that prophylactic 5-HT3 antagonists and/or other anti-nausea agents be provided prior to and during treatment with selinexor.2 Finally, as noted below, costs related to subsequent treatment after SVd discontinuation were not included in the BIA, which underestimates that total cost of treatment.
Drug costs associated with selinexor acquisition are likely higher than quoted by the sponsor. If patients receive SVd for a mean duration of 40 weeks at a cost of $13,629 per 28-days, SVd treatment cost will be $136,290 over the full duration of therapy. Of this $110,000 will be attributable to selinexor. This estimate does not include the cost of subsequent treatment after SVd discontinuation.
Uncertainty related to subsequent treatment after discontinuation of SVd. Costs related to subsequent treatment after discontinuation of SVd and comparators were not considered in the BIA, despite these costs being relevant under the drug plan perspective and their inclusion in the sponsor’s CUA. The exclusion of costs related to subsequent treatment lacks face validity, as clinical experts consulted by CADTH for this review noted that, in clinical practice, approximately 50%–75% of patients whose disease progresses on SVd would be likely to receive subsequent treatment.
CADTH was unable to address this limitation owing to the structure of the sponsor’s model.
The inclusion of costs associated with subsequent treatments after SVd would increase the costs associated with the reimbursement of selinexor.
No consideration of public coverage. In Canada, many jurisdictions do not offer 100% public coverage for oral cancer drugs that are taken at home. In Ontario for example, patients must rely on the Ontario Drug Benefit program and other programs to access oral cancer medication. Although the mean age of diagnosis of MM is over 70,33 there will be a proportion of patients under the age of 65 who would not be eligible for public coverage of SVd. This is not explicitly considered in the sponsor’s analysis, and it is unclear whether this is reflected in the market uptake rates.
CADTH was unable to address this limitation owing to the lack of transparency with the sponsor’s model.
Additional limitations were identified but were not considered to be key limitations.
CADTH notes that the sponsor’s BIA included the cost of branded bortezomib, despite the availability of a generic version.
In the calculation of drug costs, the sponsor assumed that only the largest vial size would be used (regardless of the availability of smaller and less costly vials for some drugs) to achieve the required mg per dose (e.g., for carfilzomib). As a result, the drug acquisition costs of some comparators are overestimated.
CADTH Reanalyses of the Budget Impact Analysis
Given the high degree of uncertainty associated with each aspect of the sponsors BIA, lack of transparency, and inflexibility of the modelling approach, CADTH does not consider the budget impact estimates provided by the sponsor to be informative for decision-making. Additional calculations and statements are provided below to provide further insight, although a base-case estimate could not be derived.
Considerations
Market Size
Using data from Mian20 and Canadian Cancer Society statistics,34 CADTH calculated the number of patients who would likely require 2L therapy in 2023, 2024, and 2025 to see how these compared to sponsor estimates.
Table 16: CADTH Estimate of Patients Requiring Second-Line Therapy
Year | New diagnoses MM | Number who receive 2L total | Number who require 2L in 2023 | Number who require 2L in 2024 | Number who require 2L in 2025 |
|---|---|---|---|---|---|
2017 | 2,900a | 1,676 | 49 | 0 | 0 |
2018 | 3,100a | 1,792 | 53 | 53 | 0 |
2019 | 3,300a | 1,907 | 151 | 56 | 56 |
2020 | 3,400a | 1965 | 237 | 156 | 58 |
2021 | 3,800a | 2,196 | 349 | 265 | 174 |
2022 | 4,028b | 2,328 | 630 | 370 | 281 |
2023 | 4,270b | 2,468 | 770 | 668 | 392 |
2024 | 4,526b | 2,616 | NA | 816 | 708 |
2025 | 4,797b | 2,773 | NA | NA | 865 |
Total (all Canada) | 2,239 | 2,383 | 2,533 | ||
Total (only CADTH-participating jurisdictions) | 1,746 | 1,859 | 1,976 | ||
Estimates used by sponsor | 2,406 | 2,445 | 2,484 | ||
aTaken from Canadian Cancer Society.34
bExtrapolated using data from prior 5 years, equates to a 6% increase in incident cases relative to the prior year.
Data from the Canadian Cancer Society34 provides incident cases of multiple myeloma by year up to 2021. To predict future incident cases, CADTH extrapolated by predicting that the linear increase in multiple myeloma cases would continue, due to an aging population and an increase in multiple myeloma risk factors.
Data from Mian20 suggests that in Canada 57.8% receive second-line therapy. This accounts for those who die prior to requiring a 2L therapy as well as other factors such as patient choice. Therefore, if we look at incident cases of MM by year, we can estimate what proportion will eventually require 2L therapy. In 2017 for example 2,900 cases were diagnosed. Eventually, we expect that 1,679 (57.8%) of these patients will require 2L therapy.
The paper by Mian20 also details at what point in time patients move to 2L therapy. For example, after 1 year 31% of patients move from 1L to 2L. After 6 years very few patients move onto 2L therapy (0% for those who are transplant-ineligible and less than 5% for those who are transplant-eligible). For simplicity CADTH assumed 0% would require 2L therapy after 6 years. Using these estimates CADTH could calculate the number of patients who move to 2L therapy in 2023 (the year the sponsor’s BIA starts) to 2025 (the year the BIA ends). For example, in 2023 we would expect 49 patients of the 1,679 who were diagnosed in 2017 to require 2L. Every patient diagnosed in 2017 who would eventually receive 2L therapy would have received it by 2024. Therefore, we would not expect SVd to be used in the 2L setting in patients diagnosed prior to 2016 as they would have died, already be on a 2L therapy or, will have moved onto later lines.
In total, considering all patients diagnosed in and prior to 2023, we would expect 2,239 Canadians with MM to require 2L therapy, this increases to 2,383 in 2024 and 2,533 in 2025. If we only look at populations covered by CADTH-participating jurisdictions, these values fall to 1,747, 1,859, and 1,976 in years 2023, 2024, and 2025, respectively. These are substantially lower than the estimates used by the sponsor (2,406, 2,445, and 2,484 in years 2023, 2024, and 2025, respectively). The primary reason for this is that the CADTH estimate excludes those in 2023 who are already on a 2L therapy, as it is unlikely that they would switch to SVd. As the sponsor does not explicitly address this, it is unclear whether this is accounted for, making the analysis highly uncertain.
Drug Cost
With regards to drug costs, assuming a mean duration of therapy of 40 weeks (as per the BOSTON trial), the cost of selinexor will be $110,000 per patient. The cost of the full SVd regimen, including bortezomib and dexamethasone costs, is $136,290 over the full expected duration of therapy. Further drug costs will be incurred after treatment discontinuation for patients who move onto a subsequent line of therapy. The extent of these costs will depend on what therapy the patient receives after SVd, which will be dictated by what therapy was previously received (i.e., in prior lines) and which therapies are funded in each jurisdiction.
Market Uptake
With regards to market uptake, according to CADTH clinical experts, SVd is unlikely to be used extensively in the second-line setting, given the presence of daratumumab-based regimens. Therefore, market uptake in this setting will likely be below 10% after 3 years in the second-line setting. In the third-line setting and beyond, SVd may be utilized in up to 30% of patients after 3 years.
Conclusion
Overall, SVd may generate cost savings if it displaces higher-cost alternative regimens. However, the cost of current therapies will depend on length of use. Given the lack of robust comparative data identified in this review, the relative mean duration of therapies in comparison to SVd is highly uncertain. Likewise, the impact of subsequent therapy costs will need to be accounted for and this will depend on what regimens are funded and what prior therapies the patient has received. Finally, CADTH notes the volume of drug costs associated with SVd is highly uncertain utilizing the sponsors approach as it does not differentiate incident cases from prevalent cases. Calculations by CADTH show that potential market size is considerably smaller when only incident cases are accounted for in the second-line setting.
Stakeholder Input
Patient Input
Myeloma Canada
About Myeloma Canada
See registration information www.myeloma.ca
Information Gathering
Over the years, Myeloma Canada has collected data on the impact of myeloma and its treatments on patients and caregivers, by conducting several patient and caregiver surveys. Myeloma Canada is sharing patient input from one such survey regarding the combination of once-weekly oral selinexor (Xpovio) with subcutaneous bortezomib (Velcade) and dexamethasone (referred to as oral Q1 XVd(l)). Our survey was available from December 7, 2021, to January 19, 2022, and shared with patients and caregivers across Canada, via email and social media. 255 responses were received from Alberta (31), British Columbia (47), Manitoba (6), New Brunswick (9), Newfoundland and Labrador (4), Nova Scotia (4), Ontario (98), Quebec (49), Saskatchewan (4), and (3) from outside of Canada (France).
For the strictly patient portion of the survey eligibility was determined by patients having received at least one prior line of therapy. All patients and caregivers were asked some questions regarding disease experience, but were divided into subsets and posed different questions based on the following criteria.
Subset A.1: Responding patients who have received, or are currently receiving, treatment with selinexor (100 mg or less once weekly), bortezomib (1.3 mg/m2 once weekly), and dexamethasone (20 mg twice weekly), through participation in the ongoing phase 3 BOSTON clinical trial, which began in June 2017. (2)
Subset B: Responding patients who have received one to three prior lines of therapy, including a proteasome inhibitor; but have no experience with the treatment combination under review, or the two-drug combination of bortezomib and dexamethasone. (146)
Subset C: Patients who has received, or are currently receiving, treatment with the two-drug combination of bortezomib and dexamethasone. (29)
Subset A.2: Caregivers who have cared for or are currently caring for someone who has received treatment with oral Q1 XVd(l) through participation in the ongoing, phase 3 BOSTON clinical trial. (1)
Disease Experience
This section presents data from all survey respondents: all patient subsets combined.
Every day, 9.4 Canadians are diagnosed with myeloma. Despite its growing prevalence, the disease remains relatively unknown, and its cause(s) undetermined. To date, myeloma has no known cure. With myeloma, abnormal plasma cells (also known as myeloma cells) interfere with the production of normal healthy blood cells in the bone marrow and overproduce inactive clones of abnormal antibodies that can negatively affect different parts of the body such as the bones and kidneys. Myeloma is a relapsing-remitting cancer which alternates between periods of remission that require no treatment, and symptomatic periods in which complications arise that require treatment, but will ultimately always return to the latter.
When asked, “How important it is for you to control various aspects of myeloma (Please rate on a scale of 1 ‘Not important,’ to 5 ‘Extremely important’)”, 195 patients identified the following symptoms most frequently as ‘ 5 - extremely important’: infections (111), kidney problems (103), mobility (88) and neuropathy (78).
When asked, “Rate on a scale of 1–5 (1 is ‘Not at all,’ and 5 is ‘Significant impact’), how symptoms associated with myeloma impact or limit your day-to-day activities and quality of life,” patients (195) said it ‘significantly impacted’ their abilities to travel (76), to work (63), to exercise (52), and to concentrate (45). When asked, “How important it is to you to have access to effective treatments for myeloma (Please rate on a scale of 1—Not important to 5—Very important)”, 154 respondents (of 160) selected “5—extremely important.”
Respondents (226) were asked, “What have been the most significant financial implications of myeloma treatment for you or your household?” and they identified parking costs (83), travel costs (70), drug costs (63), lost income due to absence from work (47), and lost income/pension due to early retirement (45) to be the most significant treatment-related financial implications. It should be noted that when considered together, the two ‘lost income’ options received the most responses (92). 12 respondents selected ‘other’ and provided comments, many of which indicated being on disability due to their myeloma, and the costs of supportive care treatments to manage side effects.
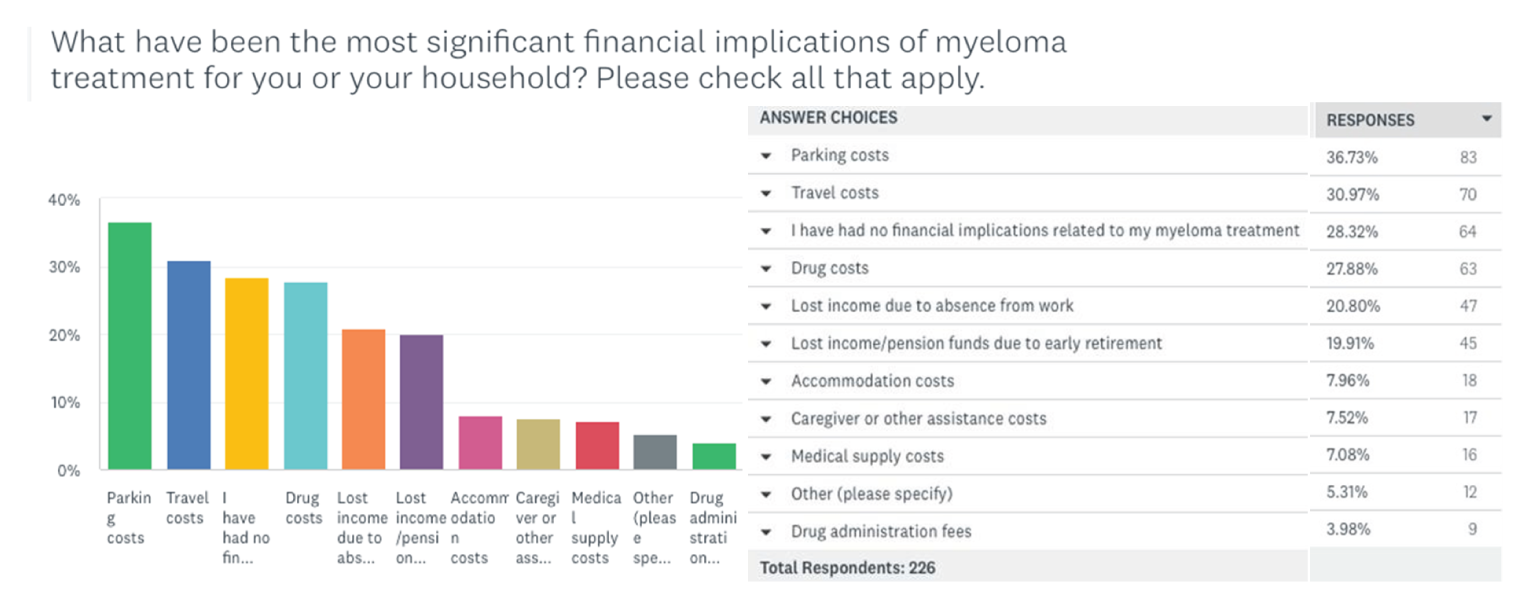
When all patient subsets (A.1,B,C) (187) were asked, “Do you need the support of a caregiver or family member to help you manage your myeloma or your treatment-related symptoms?” 50% said ‘No,’ 39% said ‘Yes,’ and 4% said ‘Yes, but I am unable to access the support I need.’
Experiences With Currently Available Treatments
When all subsets were asked, “If you are currently receiving a treatment for your myeloma, or you care for someone who is, please indicate how often it is necessary to visit a cancer centre/hospital,” respondents (222) indicated visiting ‘once a month’ (37%), then ‘once a week’ (21%). ‘Other’ was chosen by 16% of respondents who provided comments within which, the recurring answers were biweekly, and twice monthly visits.
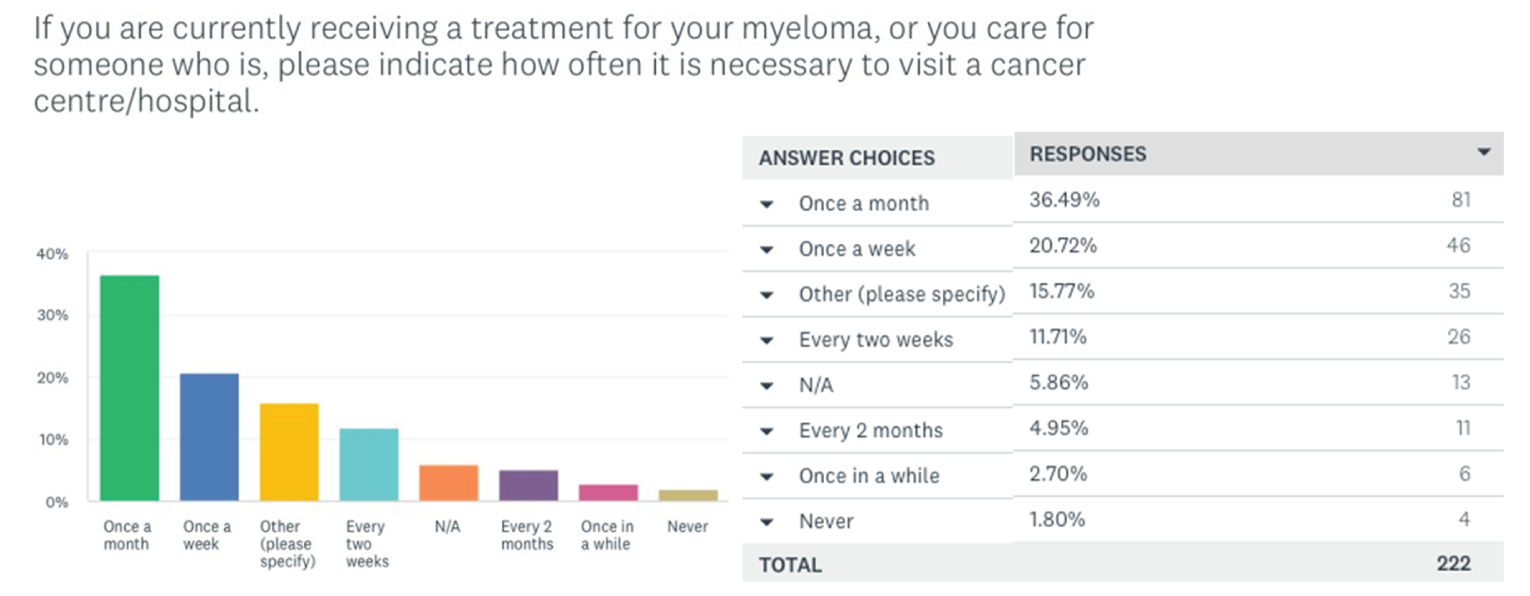
When Subset C was asked, “How would you rate the common side effects that you have experienced with bortezomib (Velcade) and dexamethasone? 1 being ‘totally unbearable,’ and 5 being ‘extremely bearable’” respondents (23) indicated the most ‘totally unbearable’ side effects are fatigue (3), and diarrhea (2) nausea; while the most tolerable were anaemia (5) and thrombocytopenia (4).
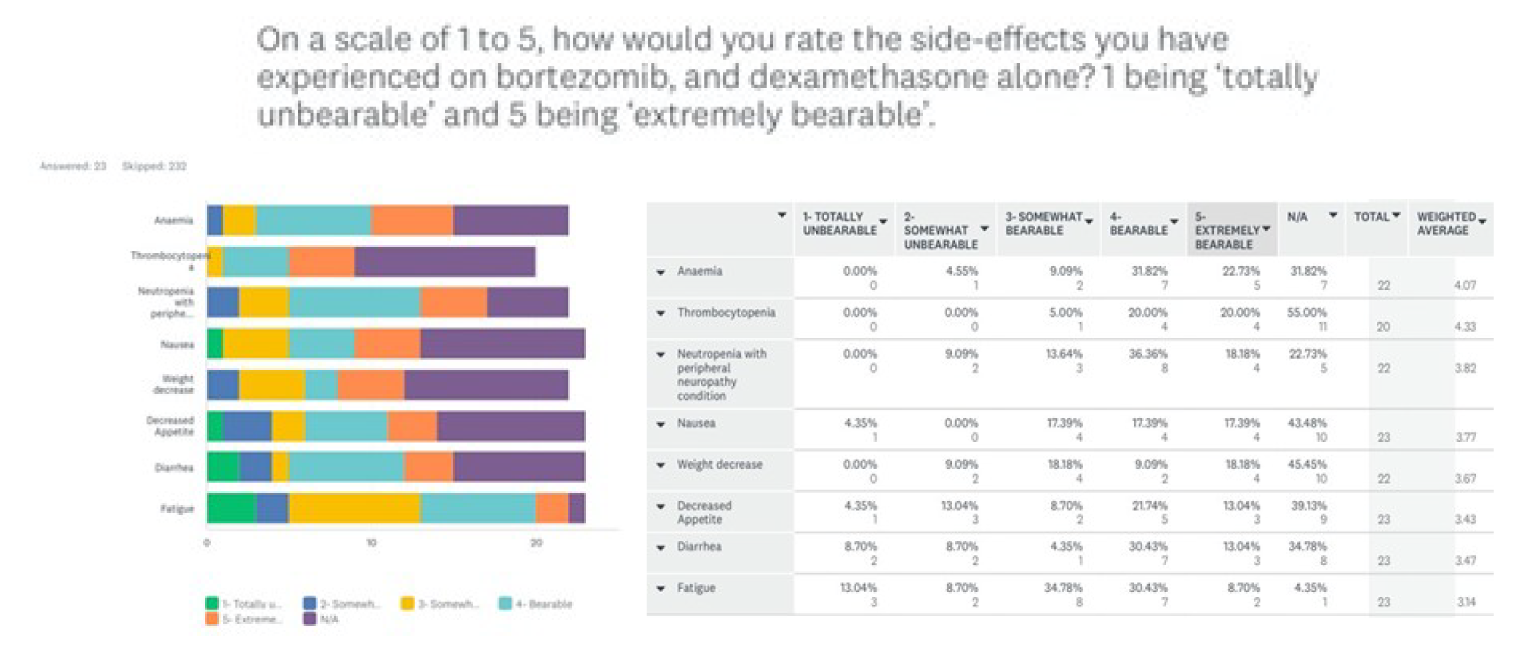
When asked to rate on the same scale, how bearable overall the side effects from bortezomib (Velcade) and dexamethasone are, Subset C patients (23) most frequently indicated them to be ‘3-somewhat bearable’ (7) and ‘4-bearable’ (7).
All subsets (202) were asked, “From your personal experience with myeloma, or caring for someone with myeloma, what factors do you consider to be most important to (any) myeloma treatment? Please provide comments.” Respondents most frequently mentioned effectiveness of treatment, quality of life, accessibility/portability of treatment, manageable side effects and having a supportive and communicative care team accessible, to be important to them. Here are some comments: “Management of side effects. Ensuring consistency of oncology team - oncologist changed 3 times in first year. Palliative care team to management side effects”; “effective treatment against myeloma, fewer side effects and having less monitoring, Oral chemo, and less trips to cancer agency”; “The drugs save my life… but being on bort and dex was not a life. I’m thankful to be off that now.”; “Quality of life; medical professionals don't seem to take seriously the life impacting side effects the meds cause.”; "It's just a side effect of the drugs is the only response we get with no help to get around or mitigate those side effects.”
When all subsets (222) were asked, “Would fewer trips to a cancer centre/hospital for treatment impact your quality of life?” 47% (105) chose ‘Yes,’ 35% (77) chose ‘No’ and 18% (40) stated ‘I am unsure.’ Comments provided by ‘Yes’ respondents frequently mentioned fewer trips would help them have more time for themselves and family, being more comfortable at home, and the stress of travel. For example: “Now that my husband only has to be at cancer care once a month, plus blood work and goo[sic] appointment we are able to plan around that time. Whether it is me leaving him to see my elderly parents or a small local trip to our cabin. Mentally not being in cancer care each week my husband can forget about his illness and focus on life so mentally it makes a difference too”; “On the mental health point of view, going to the hospital less often is being reminded that I am a cancer patient less often. There is also significant time involvement in the biweekly hospital visit as I am still working full-time”; “Reduced travel for treatments in hospital means I would have more time in my home residence and community.”; “It takes 2 days out of our week. The weather is an issue also.” Among those who chose ‘No’ many stated they live near their treatment centre, were unbothered by their current number of hospital trips, and/or felt these trips were important to feeling confident in their treatment/treatment team. For example: “Seeing and speaking with an Expert Dr. is important for your well-being.”; “Easier to make fewer trips, but don’t want to feel uncared for if I’m at home all the time.”
Improved Outcomes
To the question, “When considering any myeloma treatment for yourself, how important is it for that treatment to improve your overall quality of life? Rate on a scale of 1 - 5, 1 is "not important" and 5 is "extremely important," 58.29% (109) of 187 patient respondents from all subsets felt it was ‘extremely important’ and 32.62% (61) answered, ‘4- very important’ and no patients felt it was ‘not important.’
Patients from all subsets were asked, “When considering a treatment for your myeloma, which side effects do you most want to avoid? Please rank on the scale below, from 1 (the least important to avoid) to 11 (the most important to avoid)”. The side effects patients (186) most frequently ranked 11 (most important to avoid) were infections (33) and vomiting (33), pain (21), confusion (16), decreased appetite (13) and neuropathy (9).
All patients, Subsets A.1, B and C (187), were asked, “If you could choose how your treatment was administered, what route would you most prefer?” The vast majority (166) of patients indicated a preference for orally administered treatment. Subcutaneous injection was preferred by 8%(15) and only 3%(6) of respondents chose infusion.
Patients from Subset C were asked, “If you experience neutropenia, and/or neutropenia with peripheral neuropathy due to your current treatment with bortezomib, and dexamethasone alone; how important is it to you to control this side effect?” 19 (of 23) respondents indicated experiencing peripheral neuropathy as a side effect of their treatment, and 53% of these patients felt it was ‘4-important.’ Similarly, when asked, “How important to you is reducing the severity of the side effects you are experiencing while receiving treatment with bortezomib and dexamethasone alone? Please rate on the scale below, 1 being ‘not important’ and 5 being ‘very important’” Subset C’s most frequent response was ‘4-important’ (7).
Patients from Subsets B and C were asked, “If you were eligible to receive [oral Q1 XVd(l)], what do you believe the benefits would be for you, compared to the type of treatment you are currently receiving, or have received?” The 158 respondents’ most widely expected benefits were prolonged remission—where myeloma is not present (61), better quality of life (45), and fewer visits to hospital/cancer centre (41). The majority of comments provided by those who selected ‘Other’ indicated they were unsure how to answer, or lacked the information to answer confidently.
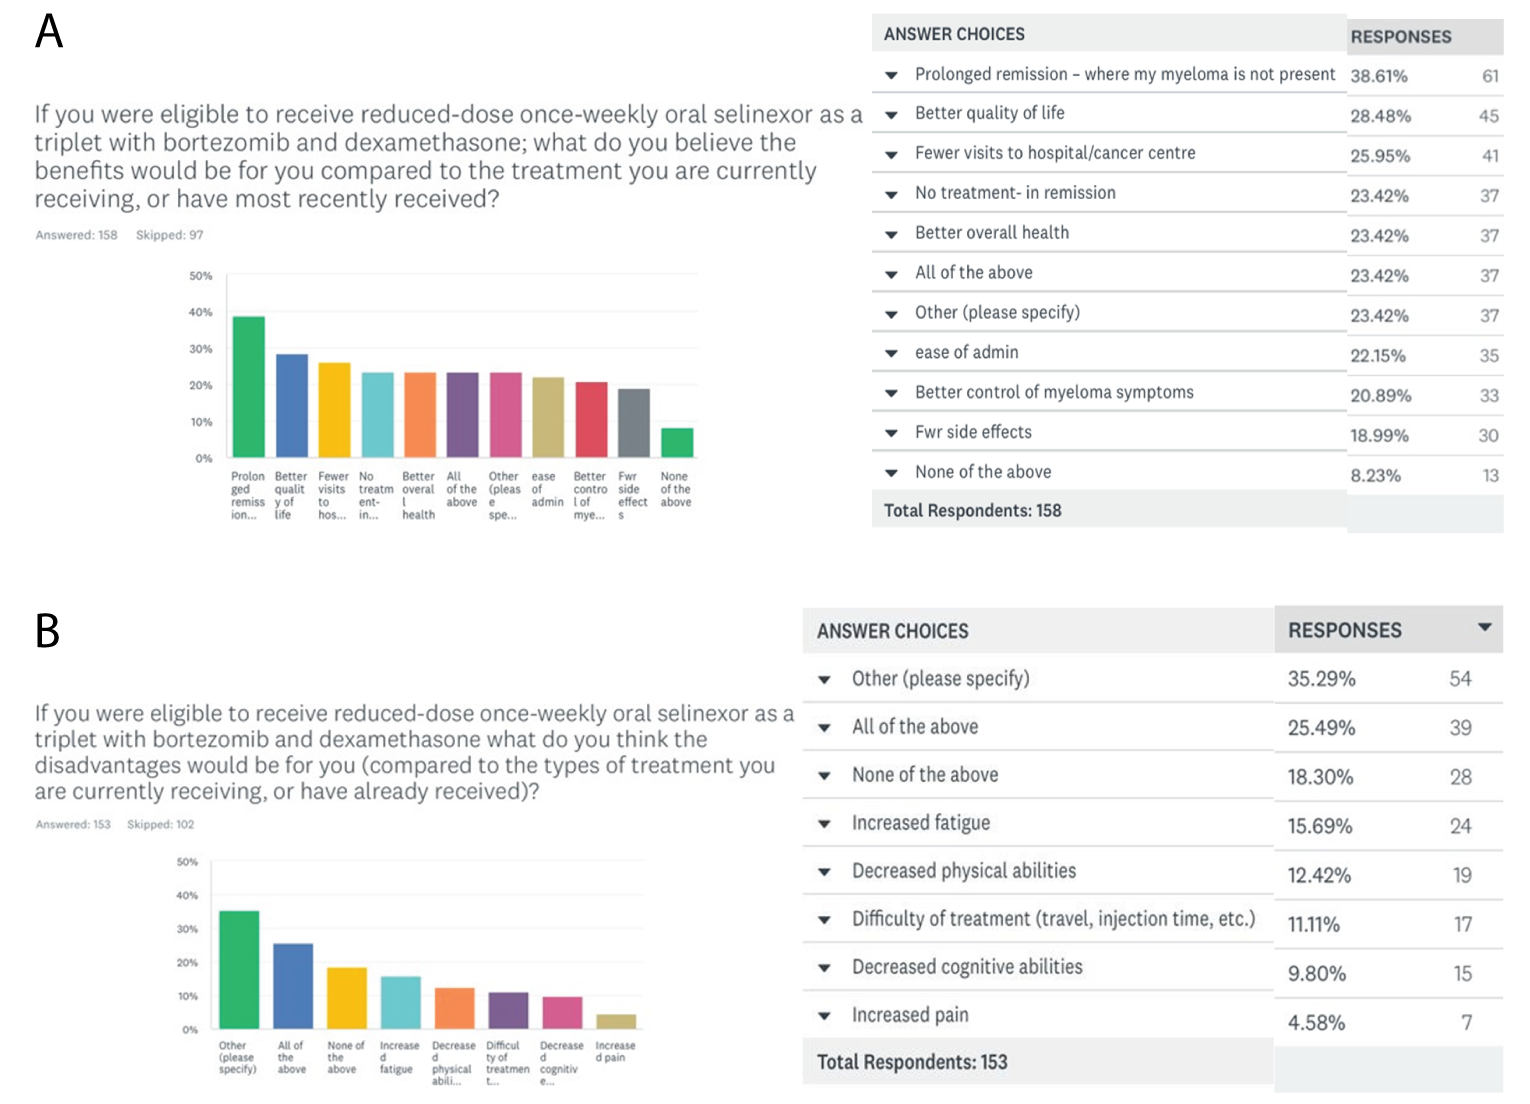
Subsets B and C were asked, “If you were eligible to receive [oral Q1 XVd(l)], what do you think the disadvantages would be for you (compared to the type of treatment you are currently receiving, or have already received)?” Responding patients (153) most frequently chose ‘Other’(54), providing the same comments as those left in the previous question— and described above; followed by ‘All of the above’(39), and ‘None of the above’ (28). Similarly, when asked if they felt oral Q1 XVd(l) could improve their overall health outlook (158), or their overall quality of life (157), or improve their health and wellbeing (158), over 65% of respondents chose ‘I don’t know” for all three questions.
Responding to the question, “Based on what you know now about [oral Q1 XVd(l)]; would you be interested in taking this treatment for your myeloma, if it were available to you?”, 63% of 158 patients from Subsets B and C indicated they would if their doctor felt it was the best option, while 24 respondents said ‘Yes,’ and 19 said they needed more information to make a decision. All comments provided by respondents (7) who selected ‘Other’ conveyed they would be interested in the future when their current treatment ceases to work.
Finally, when Subsets B and C were asked, “If you were eligible to receive reduced-dose once- weekly oral selinexor as a triplet with subcutaneous bortezomib and dexamethasone, would these routes of administration (oral, subcutaneous injection) impact your quality of life, compared to how your current treatment is administered?” 50% were unsure, 23% felt their quality of life would be improved, and 16% felt these routes of administration would negatively impact their quality of life.
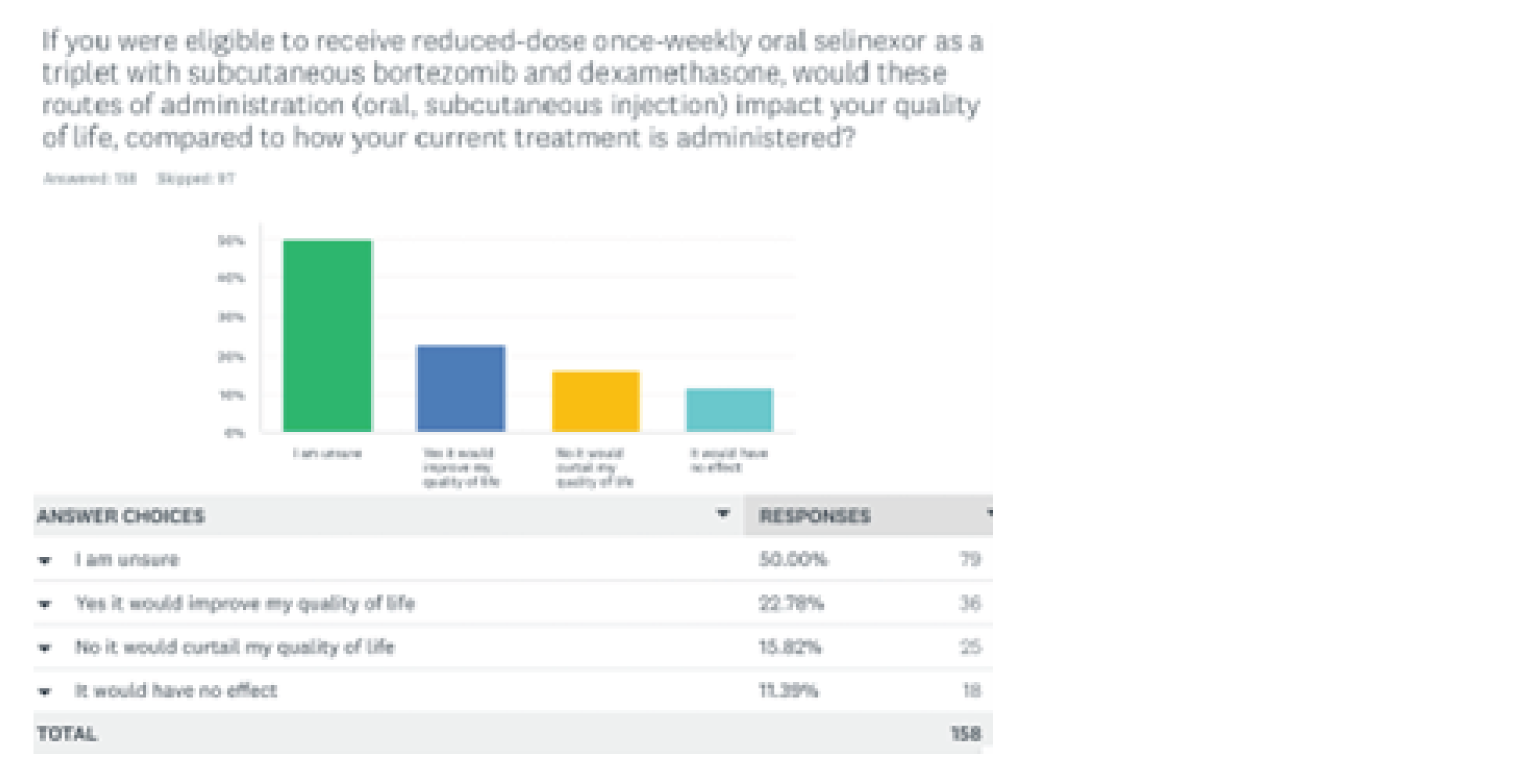
When asked, “If you had received treatment with [oral Q1 XVd(l)] — compared to your experience with the standard dose BOSTON regimen, what do you think the benefits would have been for you?” the Subset A.1 respondents (2) selected ‘fewer side effects’ and ‘not having to take a treatment because my myeloma is under remission.’ Subset A.1 was asked to rate on a scale of 1-5, 1 being ‘significantly worse’ and 5 being ‘significantly better,’ what they thought their quality of life would have looked like if they had received the treatment combination under review instead of the higher-dose BOSTON trial regimen; the sole response was “4- somewhat better”. Subset A.1 was also asked, “Based on what you know now about [oral Q1 XVd(l)]; would you be interested in having your selinexor dose reduced, if it were still an option for you?” one respondent said “Yes” and one indicated it was no longer an option for them.
Experience with Drug Under Review — BOSTON regimen (Subsets A.1 and A.2)
This section presents results from Subsets A.1 and A.2. It must be noted that in the treatment combination under review, selinexor (Xpovio) will be administered at a lower dose than was administered to patients who participated in the BOSTON trial, to the intended effect of reducing side effects.
When asked if they (Subset A.1) had relapsed since participation in the BOSTON trial indicated, 2 respondents said they had not relapsed since receiving the BOSTON trial regimen; one is currently receiving a different treatment, and one caregiver of a BOSTON trial participant indicated the person they cared for had relapsed, within 1-3 months.
Based on their experience of the BOSTON trial regimen or caring for someone receiving this regimen, patients and caregivers in Subsets A.1 and A.2 were asked, on a scale of 1 – 5 (1 being ‘not effective’ and 5 ‘extremely effective’) “…how would you rate the effectiveness of this treatment in helping to control… myeloma?” Subset A.2 (1) indicated it was ‘4- very effective,’ and Subset A.1 (1) responded ‘2-somewhat ineffective.’ Subsets A.1 and A.2 were asked to rate the tolerability of side effects they experienced (from a list of those most commonly seen in BOSTON regimen patients), on a scale 1-5 (1 being totally intolerable and 5 being tolerable). One respondent indicated that nausea was ‘4- somewhat tolerable,’ while diarrhea, peripheral neuropathy, and vomiting were ‘2- somewhat intolerable.’
Caregivers (Subset A.2) were provided a list of common side effects of the BOSTON trial regimen, and asked if during treatment with the BOSTON trial “…the person you care/cared for experience any [side effects] that required increased care, from you or their treatment team? Please check all that apply.” The sole respondent reported this was the case for flowing symptoms: thrombocytopenia, anemia, fatigue, decreased appetite, and weight decrease.
When Subset A.1 was asked, “Did your treatment team provide appropriate supportive care measures to minimize the number and/or severity of the side effects you experienced while on the BOSTON regimen? (e.g., other medications/therapies to treat nausea, loss of appetite, vomiting, etc.)”, the sole respondent indicated they were unsure. To the question “Did your myeloma treatment with reduced-dose Q1 oral Selinexor (Xpovio) as a triplet with bortezomib and dexamethasone improve your overall quality of life,” the only respondent from Subset A.1 answered, “too soon to tell’. When asked if oral Q1 XVd(l) had met their expectations in treating their myeloma, the same respondent said “Yes.”
Anything Else?
The survey subsets were created with the intention of parsing opinions/feelings about oral Q1 XVd(l) from the different patient populations. The Subset C patients who are currently receiving bortezomib and dexamethasone would have the option to add Xpovio (selinexor), as this regimen has been shown to reduce side effects such as peripheral neuropathy, which Subset C patients indicated a desire to minimize. Respondents throughout the survey conveyed confusion regarding selinexor itself, having difficulties extrapolating from the descriptive text and study quotes provided, what their own experience with oral Q1 XVd(l) might be, and/or expressed
concerns regarding their ability to provide ‘accurate’ answers due to the heterogeneity of individual responses to any myeloma treatment. Still, many patients were able to respond confidently when independently asked how they felt about certain features of the combination under review. The majority of respondents felt that fewer trips to the cancer centre would positively impact their quality of life, and that oral Q1 XVd(l) would reduce the frequency of these trips for many patients. Depending on their location and the treatments available in their province or territories, patients don’t have access to the same kind of healthcare services and treatment options or sequencing. An option that would minimize patients’ time at the hospital is valuable for them, as well as for the healthcare system, especially in a pandemic world. And for patients who have received 3 previous lines of therapy, the treatment under review would now be available to them as a 4th line therapy, and represent one of the only treatment options they have left.
Patient Group Conflict of Interest Declaration — Myeloma Canada
Did you receive help from outside your patient group to complete this submission? If yes, please detail the help and who provided it.
No
Did you receive help from outside your patient group to collect or analyze data used in this submission? If yes, please detail the help and who provided it.
No
List any companies or organizations that have provided your group with financial payment over the past two years AND who may have direct or indirect interest in the drug under review.
Amgen, Sanofi, Janssen, BMS, Celgene, Takeda, Merck, Pfizer, Karyopharm, Novartis, GSK, Leo and Rapid Novor.
Clinician Input
Canadian Myeloma Research Group
About Canadian Myeloma Research Group
The Canadian Myeloma Research Group (CMRG) is a Canada-wide network of researchers aiming to develop better treatments for extending life of myeloma patients, enhancing the quality of life for those living with myeloma and related disorders and working to find a cure for these diseases and other plasma cell disorders.
Website: www.cmrg.ca
Information Gathering
Please describe how you gathered the information included in the submission.
Information to support the use of selinexor in patients with multiple myeloma was gathered by conducting extensive literature reviews and reviewing current and ongoing clinical trials involving selinexor among patients with relapsed/refractory multiple myeloma. In addition, Canadian hematologists’ have rather extensive clinical experience with selinexor in the STOMP and BOSTON trials, as well as by using the ongoing SAP to obtain this drug; such direct experience assisted our assessment of this agent in the real-world Canadian context.
Current Treatments
Describe the current treatment paradigm for the disease.
Focus on the Canadian context. Please include drug and non-drug treatments. Drugs without Health Canada approval for use in the management of the indication of interest may be relevant if they are routinely used in Canadian clinical practice. Are such treatments supported by clinical practice guidelines? Treatments available through special access programs are relevant. Do current treatments modify the underlying disease mechanism? Target symptoms?
Younger, fit patients (transplant-eligible [TI] patients) with multiple myeloma in Canada are treated initially with a triplet bortezomib-based induction followed by an autologous stem cell transplant (ASCT) followed by maintenance with lenalidomide until disease progression, while transplant-ineligible patients (TE) typically received a lenalidomide-based regimen (Rd, RVd or potentially Dara-Rd when funded) in which lenalidomide is continued until progression. A smaller proportion of TE patients receive a bortezomib triplet such as VMP or CyBorD as a “fixed duration” regimen for approximately 9 cycles. Therefore, the majority of newly diagnosed patients experience their first relapse on lenalidomide and are considered refractory to this important and effective agent. Currently, second- line therapy in the majority of patients consists of daratumumab paired with either bortezomib + dex (as per the CASTOR trial) or lenalidomide + dex (as per the POLLUX trial) depending on the initial regimen. Third-line therapy is most often based either on carfilzomib (with dex and/or cyclophosphamide) or pomalidomide (with dex +/- cyclophosphamide or dex +/- bortezomib). Carfilzomib is most suitable for patients without cardiac comorbidities. Clinical trials, drugs procured via an SAP or palliation represent the next line of therapy in the usual instance. Of note, clinical trials almost exclusively require prior exposure to a PI, IMiD and anti-CD38 monoclonal antibodies. Agents currently available via an SAP are selinexor and the anti-BCMA antibody drug conjugate bela-maf. These options differ considerably in terms of route of administration, side-effects and supportive care needs and both are often sought by Canadian hematologists as many patients will still benefit from further effective treatment after progressing through the funded options and are not yet candidates for palliative care only. Specifically, selinexor is oral and mainly requires attention to GI and hematology toxicity while bela-maf is given by the intravenous route and requires eye clinic assessments before each dose to monitor for keratopathy. The eye toxicity is reversible but bothersome to the patient and may necessitate dose holds.
The availability and use of sequential regimens has allowed control of the disease and its symptoms (discussed below) for meaningful periods of time between relapsed, and therefore has improved virtually all myeloma outcomes, including overall survival.
The use of selinexor is supported by the use of clinical practice guidelines and selinexor is available in Canada through the Special Access Program.
Selinexor works by another mechanism of action than glucocorticoids, immunomodulators, proteasome inhibitors and monoclonal antibodies. Selinexor, a first in class oral nuclear transplant inhibitor, targets clonal plasma cells by blocking tumor suppressor proteins from being exported out of the nucleus. (Mikhael et al, Clinical Lymphoma, Myeloma and Leukemia, 20(6): 351-357). Selinexor leads to selective induction of apoptosis of cancer cells. Selinexor works by modifying the underlying disease mechanism. As it acts to reduce tumour burden, it impacts symptoms in patients with refractory/relapsed multiple myeloma.
BOSTON, a randomized, open-label, phase 3 trial at 123 sites in 21 countries, examined the clinical benefit of weekly selinexor, bortezomib and dexamethasone versus standard bortezomib and dexamethasone in patients with previously treated multiple myeloma. These patients had received 1-3 prior lines of therapy. Median progression-free survival was 13.93 months with selinexor, bortezomib and dexamethasone and 9.46 months with bortezomib and dexamethasone. (Grosicki et al, The Lancet, November 2020).
Treatment Goals
What are the most important goals that an ideal treatment would address?
Examples: Prolong life, delay disease progression, improve lung function, prevent the need for organ transplant, prevent infection or transmission of disease, reduce loss of cognition, reduce the severity of symptoms, minimize adverse effects, improve health-related quality of life, increase the ability to maintain employment, maintain independence, reduce burden on caregivers.
The ideal treatment reduces the myeloma cell burden as low as possible as responses are closely linked to the resolution of myeloma-related organ damage and symptoms (anemia, ongoing lytic bone destruction, renal failure and hypercalcemia). Although a deep response such as a complete or very good partial response (PR) or PR is highly desirable, given the variety of specific disease manifestations in an individual patient, an incomplete response (minimal response or even stable disease) may afford symptom control or improvement, which is a high priority with this disease.
The longer the disease is controlled, the longer the patient may be free of further lytic skeletal destruction, renal damage that can lead to dialysis, anemia with fatigue and associated poor performance status. All of these improvements lead to less resource utilization to treat myeloma complications (for example, fewer hospital admissions for pain control, treatment of hypercalcemia, radiotherapy, orthopedic surgery, spinal cord compression, dialysis) and less caregiver burden in terms of caring for a debilitated patient with potentially crippling skeletal destruction and loss of ambulation. (Of note, although skeletal damage can usually be arrested, fractures stabilized and pain controlled, the lytic lesions themselves do not fully heal and the affected bones remain at risk for future fracture simply from weakened cortical structure. Hence prevention or minimization of lytic damage is key.)
Selinexor in combination with bortezomib and dexamethasone would help increase progression-free survival in multiple myeloma, prolong life and delay disease progression. Selinexor treatment would reduce the severity of symptoms and would help improve health-related quality of life, increase the ability to maintain employment and reduce burden on caregivers.
Treatment Gaps (Unmet Needs)
Considering the treatment goals, please describe goals (needs) that are not being met by currently available treatments.
Examples: Not all patients respond to available treatments; Patients become refractory to current treatment options; No treatments are available to reverse the course of disease; No treatments are available to address key outcomes; Treatments are needed that are better tolerated; Treatment are needed to improve compliance; Formulations are needed to improve convenience.
Multiple myeloma is an incurable cancer and patients experience repeated relapses until the disease ultimately become refractory to all currently available treatment options and succumb to the disease. Improvements in patient outcomes to date has been achieved by the availability of new agents and combinations that produce high response rates of variable duration, that can be applied sequentially. The identification of new classes of anti-myeloma drugs has been central to having as many different regimens to use in sequence. Thus, optimal management of patients requires serial treatments in order to reduce the myeloma burden each time the disease progresses. Another consideration relates to the fact that myeloma patients need therapy almost continuously throughout the disease course, so that issues of toxicity and convenience must be considered. Availability of oral agents-- such as selinexor-- or those requiring as few visits to the cancer centre as possible—such as the weekly bortezomib schedule which is specifically included in the Boston Trial-- are important practical factors to optimize care.
Selinexor is an oral therapy which may improve compliance and convenience.
Which patients have the greatest unmet need for an intervention such as the drug under review?
Would these patients be considered a subpopulation or niche population? Describe characteristics of this patient population. Would the drug under review address the unmet need in this patient population?
Several groups of myeloma patients have important unmet needs. These include those with multiply relapsed/refractory myeloma, those with significant renal insufficiency as well as patients earlier in the disease course who are refractory to lenalidomide and/or daratumumab, have poor risk features such as high-risk cytogenetics, extramedullary disease (disease outside the bone marrow) or highly proliferative disease.
Patients who have the greatest unmet need for a selinexor-based regimen are those with advanced, refractory multiple myeloma. Particularly, those who are triple-class refractory--those who have progressed post-three lines of therapy with IMiDs (immunomodulatory derivatives), PIs, (proteasome inhibitors) and CD 38 monoclonal antibodies (daratumumab, isatuximab)--would benefit from access to selinexor.
The ability to use selinexor in patients with marked renal insufficiency is also an advantage as it is metabolized largely via the liver. Renal insufficiency is not uncommon in advanced relapsed and patients with a creatinine clearance of less than 45 ml/min, or at times 30 mL/min, are typically excluded from promising clinical trials and have very limited options in advanced disease.
Currently funded treatments for first relapse (DaraVd and Kd) have shown suboptimal results in patients progressing on lenalidomide—a common scenario in the Canadian environment. Specifically, these treatments have not shown a PFS beyond approximately 9-11 months. The Boston trial reported a PFS of 10.2 months in lenalidomide-refractory patients with a time to next treatment of 13.0 months. For those who have received daratumumab as part of first-, second- or third-line therapy, the situation is even more challenging and no standard regimen effective regimen has been identified in Canada. In the Boston study, patients with prior daratumumab therapy experienced a PFS of 12.22 months. Outcomes in the Boston trial were also preserved in individuals with high-risk features such as the FISH aberrations del 17 and, t(4;14) as well as +1q21, the latter of which has emerged as an important adverse prognostic factor. The efficacy of selinexor in these high-risk settings has been attributed to the unique and novel mechanism of action of selinexor.
In addition to its convenience, it should be mentioned that the weekly administration of bortezomib in the Boston study is another advantage as the incidence of peripheral neuropathy was shown to be lower that the biweekly dose schedule in the control arm. The oral formulation of selinexor also improves convenience and may help compliance, as noted above.
Place in Therapy
How would the drug under review fit into the current treatment paradigm?
The mechanism of action for selinexor would complement other available treatments as it has a different mechanism of action compared to other anti-myeloma therapeutics such as IMiDs, PIs and monoclonal antibodies. It would likely be utilized most commonly in triple-refractory/exposed patients.
Please indicate whether or not it would be appropriate to recommend that patients try other treatments before initiating treatment with the drug under review. Please provide a rationale from your perspective.
If so, please describe which treatments should be tried, in what order, and include a brief rationale.
Most patients would continue the current sequencing, with the use of the Boston regimen after IMiDs, a PI and an anti-CD38 antibody.
How would this drug affect the sequencing of therapies for the target condition?
If appropriate for this condition, please indicate which treatments would be given after the therapy has failed and specify whether this is a significant departure from the sequence employed in current practice. Would there be opportunity to treat patients with this same drug in a subsequent line of therapy? If so, according to what parameters?
It would not significantly impact the treatment sequence employed in current practice. Patients would likely be treated in fourth or later lines of therapy.
Which patients would be best suited for treatment with the drug under review?
Which patients are most likely to respond to treatment with the drug under review? Which patients are most in need of an intervention? Would this differ based on any disease characteristics (e.g., presence or absence of certain symptoms, stage of disease)?
Patients with triple class refractory multiple myeloma would be most likely to benefit from the drug under review.
How would patients best suited for treatment with the drug under review be identified?
Examples: Clinician examination or judgement, laboratory tests (specify), diagnostic tools (specify). Is the condition challenging to diagnose in routine clinical practice? Are there any issues related to diagnosis? (e.g., tests may not be widely available, tests may be available at a cost, uncertainty in testing, unclear whether a scale is accurate or the scale may be subjective, variability in expert opinion.) Is it likely that misdiagnosis occurs in clinical practice (e.g., underdiagnosis)? Should patients who are pre-symptomatic be treated considering the mechanism of action of the drug under review?
Patients would be identified by their treating hematologist.
Which patients would be least suitable for treatment with the drug under review?
Newly diagnosed patients with multiple myeloma would be least suitable for treatment.
Is it possible to identify those patients who are most likely to exhibit a response to treatment with the drug under review? If so, how would these patients be identified?
Patients would be identified by their treating hematologist.
What outcomes are used to determine whether a patient is responding to treatment in clinical practice? Are the outcomes used in clinical practice aligned with the outcomes typically used in clinical trials?
Outcomes would be determined by examining responses through regular blood and urine examinations to measure M protein, quantitative immunoglobulins, free light chains and immunofixation. Patients with oligosecretory or non-secretory disease would be examined by imaging and/or bone marrow biopsies.
What would be considered a clinically meaningful response to treatment?
Examples: Reduction in the frequency or severity of symptoms (provide specifics regarding changes in frequency, severity, and so forth); Attainment of major motor milestones; Ability to perform activities of daily living; Improvement in symptoms; Stabilization (no deterioration) of symptoms. Consider the magnitude of the response to treatment. Is this likely to vary across physicians?
In the setting of advanced disease, a minimum 50% reduction in the measurable disease (i.e. M protein or reduction in oligosecretory disease lesion) would be considered a clinically meaningful response to treatment. However, as discussed before, depending on the severity of myeloma-related organ damage, a lesser response might be acceptable as long as the disease stopped progressing.
How often should treatment response be assessed?
Treatment response will be assessed monthly.
What factors should be considered when deciding to discontinue treatment?
Examples: Disease progression (specify; e.g., loss of lower limb mobility); Certain adverse events occur (specify type, frequency, and severity); Additional treatment becomes necessary (specify) Disease progression, adverse events (i.e. intolerance).
What settings are appropriate for treatment with the drug under review?
Examples: Community setting, hospital (outpatient clinic), specialty clinic
This can be administered in outpatient clinics, hematology clinics and in hospitals.
For non-oncology drugs, is a specialist required to diagnose, treat, and monitor patients who might receive the drug under review? If so, which specialties would be relevant? Is there any additional information you feel is pertinent to this review?
N/A
Conflict of Interest Declarations — Canadian Myeloma Research Group (CMRG)
To maintain the objectivity and credibility of the CADTH drug review programs, all participants in the drug review processes must disclose any real, potential, or perceived conflicts of interest. This conflict of interest declaration is required for participation.
Declarations made do not negate or preclude the use of the clinician group input. CADTH may contact your group with further questions, as needed. Please see the Procedures for CADTH Drug Reimbursement Reviews (section 6.3) for further details.
Did you receive help from outside your clinician group to complete this submission? If yes, please detail the help and who provided it.
No
Did you receive help from outside your clinician group to collect or analyze any information used in this submission? If yes, please detail the help and who provided it.
No
List any companies or organizations that have provided your group with financial payment over the past two years AND who may have direct or indirect interest in the drug under review. Please note that this is required for each clinician who contributed to the input — please add more tables as needed (copy and paste). It is preferred for all declarations to be included in a single document.
Declaration for Clinician 1
Name: Dr. Sita Bhella
Position: Hematologist, Princess Margaret Cancer Centre
Date: 09-02-2022
Table 1: Conflict of Interest Declaration for CMRG — Clinician 1
Company | Check Appropriate Dollar Range | |||
|---|---|---|---|---|
$0 to 5,000 | $5,001 to 10,000 | $10,001 to 50,000 | In Excess of $50,000 | |
Gilead | X | — | — | — |
Novartis | X | — | — | — |
Sanofi | X | — | — | — |
Amgen | X | — | — | — |
Celgene/Bristol Myers Squibb | X | — | — | — |
Declaration for Clinician 2
Name: Dr. Martha L. Louzada
Position: Hematologist, London Reginal Cancer Program
Date: 09-02-2022
Table 2: Conflict of Interest Declaration for CMRG — Clinician 2
Company | Check Appropriate Dollar Range | |||
|---|---|---|---|---|
$0 to 5,000 | $5,001 to 10,000 | $10,001 to 50,000 | In Excess of $50,000 | |
Celgene/BMS | X | — | — | — |
Janssen | X | — | — | — |
Declaration for Clinician 3
Name: Dr. Rodger Tiedemann
Position: Consultant Hematologist, Princess Margaret Cancer Centre, University Health Network
Date: 09-02-2022
Table 3: Conflict of Interest Declaration for CMRG — Clinician 3
Company | Check Appropriate Dollar Range | |||
|---|---|---|---|---|
$0 to 5,000 | $5,001 to 10,000 | $10,001 to 50,000 | In Excess of $50,000 | |
No COI | — | — | — | — |
Declaration for Clinician 4
Name: Dr. Arleigh McCurdy
Position: Hematologist, The Ottawa Hospital
Date: 09-02-2022
Table 4: Conflict of Interest Declaration for CMRG — Clinician 4
Company | Check Appropriate Dollar Range | |||
|---|---|---|---|---|
$0 to 5,000 | $5,001 to 10,000 | $10,001 to 50,000 | In Excess of $50,000 | |
Janssen | X | — | — | — |
Sanofi | X | — | — | — |
BMS | X | — | — | — |
Amgen | X | — | — | — |
Declaration for Clinician 5
Name: Dr. Heather Sutherland
Position: Hematologist, Vancouver General Hospital
Date: 09-02-2022
Table 5: Conflict of Interest Declaration for CMRG — Clinician 5
Company | Check Appropriate Dollar Range | |||
|---|---|---|---|---|
$0 to 5,000 | $5,001 to 10,000 | $10,001 to 50,000 | In Excess of $50,000 | |
Forus | X | — | — | — |
Declaration for Clinician 6
Name: Dr. Darrell White
Position: Hematologist, Dalhousie University and QEII Health Sciences Centre
Date: 09-02-2022
Table 6: Conflict of Interest Declaration for CMRG — Clinician 6
Company | Check Appropriate Dollar Range | |||
|---|---|---|---|---|
$0 to 5,000 | $5,001 to 10,000 | $10,001 to 50,000 | In Excess of $50,000 | |
BMS | — | X | — | — |
Janssen | — | — | X | — |
Declaration for Clinician 7
Name: Dr. Kevin Song
Position: Hematologist, Vancouver General Hospital
Date: 09-02-2022
Table 7: Conflict of Interest Declaration for CMRG — Clinician 7
Company | Check Appropriate Dollar Range | |||
|---|---|---|---|---|
$0 to 5,000 | $5,001 to 10,000 | $10,001 to 50,000 | In Excess of $50,000 | |
Bristol Myers Squibb | — | X | — | — |
Janssen | — | X | — | — |
Amgen | — | X | — | — |
Declaration for Clinician 8
Name: Dr. Christine Chen
Position: Hematologist, Princess Margaret Cancer Centre
Date: 09-02-2022
Table 8: Conflict of Interest Declaration for CMRG — Clinician 8
Company | Check Appropriate Dollar Range | |||
|---|---|---|---|---|
$0 to 5,000 | $5,001 to 10,000 | $10,001 to 50,000 | In Excess of $50,000 | |
Janssen | — | — | X | — |
Beigene | X | — | — | — |
Astrazeneca | X | — | — | — |
Gilead | X | — | — | — |
Novartis | X | — | — | — |
Declaration for Clinician 9
Name: Dr. Vishal Kukreti
Position: Hematologist/ Oncologist
Date: 09-02-2022
Table 9: Conflict of Interest Declaration for CMRG — Clinician 9
Company | Check Appropriate Dollar Range | |||
|---|---|---|---|---|
$0 to 5,000 | $5,001 to 10,000 | $10,001 to 50,000 | In Excess of $50,000 | |
Amgen | X | — | — | — |
Kirin Kyoto | X | — | — | — |
Declaration for Clinician 10
Name: Dr. Irwindeep Sandhu
Position: MD, Associate Professor Dept of Oncology University of Alberta
Date: 09-02-2022
Table 10: Conflict of Interest Declaration for CMRG — Clinician 10
Company | Check Appropriate Dollar Range | |||
|---|---|---|---|---|
$0 to 5,000 | $5,001 to 10,000 | $10,001 to 50,000 | In Excess of $50,000 | |
Celgene/BMs | X | — | — | — |
Janssen | X | — | — | — |
Amgen | X | — | — | — |
Takeda | X | — | — | — |
Sanofi | X | — | — | — |
Kite/Gilead | X | — | — | — |
Declaration for Clinician 11
Name: Dr. Julie Stakiw
Position: Oncologist
Date: 08-02-2022
Table 11: Conflict of Interest Declaration for CMRG — Clinician 11
Company | Check Appropriate Dollar Range | |||
|---|---|---|---|---|
$0 to 5,000 | $5,001 to 10,000 | $10,001 to 50,000 | In Excess of $50,000 | |
Sanofi | X | — | — | — |
Janssen | X | — | — | — |
BMS | X | — | — | — |
Forus | X | — | — | — |
Pfizer | X | — | — | — |
Biagene | X | — | — | — |
Declaration for Clinician 12
Name: Dr. Suzanne Trudel
Position: Oncologist
Date: 09-02-2022
Table 12: Conflict of Interest Declaration for CMRG — Clinician 12
Company | Check Appropriate Dollar Range | |||
|---|---|---|---|---|
$0 to 5,000 | $5,001 to 10,000 | $10,001 to 50,000 | In Excess of $50,000 | |
Forus | X | — | — | — |
Janssen | X | — | — | — |
Declaration for Clinician 13
Name: Dr. Donna Reece
Position: Chief Medical Officer, CMRG
Date: 09-02-2022
Table 13: Conflict of Interest Declaration for CMRG — Clinician 13
Company | Check Appropriate Dollar Range | |||
|---|---|---|---|---|
$0 to 5,000 | $5,001 to 10,000 | $10,001 to 50,000 | In Excess of $50,000 | |
BMS/ Celgene | — | — | X | — |
Janssen | — | — | X | — |
Amgen | — | — | X | — |
Sanofi | X | — | — | — |
GSK | X | — | — | — |
Takeda | X | — | — | — |
OH-CCO Hematology Drug Advisory Committee
About OH-CCO Hematology Drug Advisory Committee
OH-CCO’s Drug Advisory Committees provide timely evidence-based clinical and health system guidance on drug-related issues in support of CCO’s mandate, including the Provincial Drug Reimbursement Programs (PDRP) and the Systemic Treatment Program.
Information Gathering
This input was jointly discussed via Drug Advisory Committee meeting and email.
Current Treatments
In the current treatment paradigm for rrMM, most patients would receive isatuximab or daratumumab as second line therapy.
Treatment Goals
Prolong life, improvement of overall survival, progression free survival and disease related symptoms.
Treatment Gaps (Unmet Needs)
Considering the treatment goals, please describe goals (needs) that are not being met by currently available treatments.
There is currently no unmet need in second line. The greatest unmet need would be patients who failed daratumumab on second line and would have the option to use this regimen as third line.
Which patients have the greatest unmet need for an intervention such as the drug under review?
Patients who are refractory to anti-CD38, IMID, and PI.
Place in Therapy
How would the drug under review fit into the current treatment paradigm?
Unsure where xVD would fit into the current treatment paradigm.
Please indicate whether or not it would be appropriate to recommend that patients try other treatments before initiating treatment with the drug under review. Please provide a rationale from your perspective.
Clinicians would be recommending daratumumab (or isatuximab) regimens as second line therapy prior to recommending xVD.
How would this drug affect the sequencing of therapies for the target condition?
This drug regimens wouldn’t affect the sequencing of therapies.
Which patients would be best suited for treatment with the drug under review?
Difficulty identifying a patient population that would be best suited.
How would patients best suited for treatment with the drug under review be identified?
Routine practices within myeloma treating physicians.
Which patients would be least suitable for treatment with the drug under review?
No specific criteria for exclusion.
Is it possible to identify those patients who are most likely to exhibit a response to treatment with the drug under review?
Not possible to identify patients who are most likely to exhibit a response.
What outcomes are used to determine whether a patient is responding to treatment in clinical practice?
Conventional myeloma response criteria.
What would be considered a clinically meaningful response to treatment?
Conventional myeloma response criteria.
How often should treatment response be assessed?
Each cycle.
What factors should be considered when deciding to discontinue treatment?
Progression on therapy and toxicity.
What settings are appropriate for treatment with the drug under review?
Hospital (outpatient clinic).
For non-oncology drugs, is a specialist required to diagnose, treat, and monitor patients who might receive the drug under review?
N/A
Additional Information
The inclusion of bortezomib adds a layer of uncertainty in this regimen. This regimen cannot be applied to triple refractory patients because of the need to be bortezomib sensitive.
Conflict of Interest Declarations — OH-CCO Hematology Drug Advisory Committee
To maintain the objectivity and credibility of the CADTH drug review programs, all participants in the drug review processes must disclose any real, potential, or perceived conflicts of interest. This conflict of interest declaration is required for participation. Declarations made do not negate or preclude the use of the clinician group input. CADTH may contact your group with further questions, as needed. Please see the Procedures for CADTH Drug Reimbursement Reviews (section 6.3) for further details.
Did you receive help from outside your clinician group to complete this submission? If yes, please detail the help and who provided it.
OH-CCO provided secretariat support to the DAC in completing this input.
Did you receive help from outside your clinician group to collect or analyze any information used in this submission? If yes, please detail the help and who provided it.
No.
List any companies or organizations that have provided your group with financial payment over the past two years AND who may have direct or indirect interest in the drug under review. Please note that this is required for each clinician who contributed to the input — please add more tables as needed (copy and paste). It is preferred for all declarations to be included in a single document.
Declaration for Clinician 1
Name: Dr. Tom Kouroukis
Position: OH-CCO Hematology Cancer Drug Advisory Committee Lead
Date: 14/01/2022
Table 14: Conflict of Interest Declaration for OH-CCO Hematology Drug Advisory Committee — Clinician 1
Company | Check Appropriate Dollar Range | |||
|---|---|---|---|---|
$0 to 5,000 | $5,001 to 10,000 | $10,001 to 50,000 | In Excess of $50,000 | |
No COI | — | — | — | — |
Declaration for Clinician 2
Name: Dr. Pierre Villeneuve
Position: OH-CCO Hematology Cancer Drug Advisory Committee Member
Date: 14/01/2022
Table 15: Conflict of Interest Declaration for OH-CCO Hematology Drug Advisory Committee — Clinician 2
Company | Check Appropriate Dollar Range | |||
|---|---|---|---|---|
$0 to 5,000 | $5,001 to 10,000 | $10,001 to 50,000 | In Excess of $50,000 | |
No COI | — | — | — | — |
Declaration for Clinician 3
Name: Dr. Jordan Herst
Position: OH-CCO Hematology Cancer Drug Advisory Committee Member
Date: 14/01/2022
Table 16: Conflict of Interest Declaration for OH-CCO Hematology Drug Advisory Committee — Clinician 3
Company | Check Appropriate Dollar Range | |||
|---|---|---|---|---|
$0 to 5,000 | $5,001 to 10,000 | $10,001 to 50,000 | In Excess of $50,000 | |
No COI | — | — | — | — |
Declaration for Clinician 4
Name: Dr. Lee Mozessohn
Position: OH-CCO Hematology Cancer Drug Advisory Committee Member
Date: 14/01/2022
Table 17: Conflict of Interest Declaration for OH-CCO Hematology Drug Advisory Committee — Clinician 4
Company | Check Appropriate Dollar Range | |||
|---|---|---|---|---|
$0 to 5,000 | $5,001 to 10,000 | $10,001 to 50,000 | In Excess of $50,000 | |
No COI | — | — | — | — |
Declaration for Clinician 5
Name: Dr. Joanna Graczyk
Position: OH-CCO Hematology Cancer Drug Advisory Committee Member
Date: 14/01/2022
Table 18: Conflict of Interest Declaration for OH-CCO Hematology Drug Advisory Committee — Clinician 5
Company | Check Appropriate Dollar Range | |||
|---|---|---|---|---|
$0 to 5,000 | $5,001 to 10,000 | $10,001 to 50,000 | In Excess of $50,000 | |
No COI | — | — | — | — |
Declaration for Clinician 6
Name: Dr. Selay Lam
Position: OH-CCO Hematology Cancer Drug Advisory Committee Member
Date: 14/01/2022
Table 19: Conflict of Interest Declaration for OH-CCO Hematology Drug Advisory Committee — Clinician 6
Company | Check Appropriate Dollar Range | |||
|---|---|---|---|---|
$0 to 5,000 | $5,001 to 10,000 | $10,001 to 50,000 | In Excess of $50,000 | |
No COI | — | — | — | — |
Declaration for Clinician 7
Name: Dr. Guillaume Richard-Carpentier
Position: OH-CCO Hematology Cancer Drug Advisory Committee Member
Date: 14/01/2022
Table 20: Conflict of Interest Declaration for OH-CCO Hematology Drug Advisory Committee — Clinician 7
Company | Check Appropriate Dollar Range | |||
|---|---|---|---|---|
$0 to 5,000 | $5,001 to 10,000 | $10,001 to 50,000 | In Excess of $50,000 | |
No COI | — | — | — | — |
ISSN: 2563-6596
Disclaimer: The information in this document is intended to help Canadian health care decision-makers, health care professionals, health systems leaders, and policy-makers make well-informed decisions and thereby improve the quality of health care services. While patients and others may access this document, the document is made available for informational purposes only and no representations or warranties are made with respect to its fitness for any particular purpose. The information in this document should not be used as a substitute for professional medical advice or as a substitute for the application of clinical judgment in respect of the care of a particular patient or other professional judgment in any decision-making process. The Canadian Agency for Drugs and Technologies in Health (CADTH) does not endorse any information, drugs, therapies, treatments, products, processes, or services.
While care has been taken to ensure that the information prepared by CADTH in this document is accurate, complete, and up-to-date as at the applicable date the material was first published by CADTH, CADTH does not make any guarantees to that effect. CADTH does not guarantee and is not responsible for the quality, currency, propriety, accuracy, or reasonableness of any statements, information, or conclusions contained in any third-party materials used in preparing this document. The views and opinions of third parties published in this document do not necessarily state or reflect those of CADTH.
CADTH is not responsible for any errors, omissions, injury, loss, or damage arising from or relating to the use (or misuse) of any information, statements, or conclusions contained in or implied by the contents of this document or any of the source materials.
This document may contain links to third-party websites. CADTH does not have control over the content of such sites. Use of third-party sites is governed by the third-party website owners’ own terms and conditions set out for such sites. CADTH does not make any guarantee with respect to any information contained on such third-party sites and CADTH is not responsible for any injury, loss, or damage suffered as a result of using such third-party sites. CADTH has no responsibility for the collection, use, and disclosure of personal information by third-party sites.
Subject to the aforementioned limitations, the views expressed herein are those of CADTH and do not necessarily represent the views of Canada’s federal, provincial, or territorial governments or any third party supplier of information.
This document is prepared and intended for use in the context of the Canadian health care system. The use of this document outside of Canada is done so at the user’s own risk.
This disclaimer and any questions or matters of any nature arising from or relating to the content or use (or misuse) of this document will be governed by and interpreted in accordance with the laws of the Province of Ontario and the laws of Canada applicable therein, and all proceedings shall be subject to the exclusive jurisdiction of the courts of the Province of Ontario, Canada.
The copyright and other intellectual property rights in this document are owned by CADTH and its licensors. These rights are protected by the Canadian Copyright Act and other national and international laws and agreements. Users are permitted to make copies of this document for non-commercial purposes only, provided it is not modified when reproduced and appropriate credit is given to CADTH and its licensors.
Redactions: Confidential information in this document may be redacted at the request of the sponsor in accordance with the CADTH Drug Reimbursement Review Confidentiality Guidelines
Stakeholder Input: The views expressed in each submission are those of the submitting organization or individual; not necessarily the views of CADTH or of other organizations. As such, they are independent of CADTH and do not necessarily represent or reflect the view of CADTH. No endorsement by CADTH is intended or should be inferred. By filing with CADTH, the submitting organization or individual agrees to the full disclosure of the information. CADTH does not edit the content of the submissions.
CADTH does use reasonable care to prevent disclosure of personal information in posted material; however, it is ultimately the submitter’s responsibility to ensure no identifying personal information or personal health information is included in the submission. The name of the submitting organization or individual and all conflict of interest information are included in the submission; however, the name of the author, including the name of an individual patient or caregiver submitting the patient input, are not posted.
Accessibility: CADTH is committed to treating people with disabilities in a way that respects their dignity and independence, supports them in accessing material in a timely manner, and provides a robust feedback process to support continuous improvement. All materials prepared by CADTH are available in an accessible format. Where materials provided to CADTH by a submitting organization or individual are not available in an accessible format, CADTH will provide a summary document upon request. More details on CADTH’s accessibility policies can be found here.
About CADTH: CADTH is an independent, not-for-profit organization responsible for providing Canada’s health care decision-makers with objective evidence to help make informed decisions about the optimal use of drugs, medical devices, diagnostics, and procedures in our health care system.
Funding: CADTH receives funding from Canada’s federal, provincial, and territorial governments, with the exception of Quebec.