CADTH Reimbursement Review
Lenvatinib and Pembrolizumab (Lenvima and Keytruda)
Sponsor: Eisai Limited
Therapeutic area: Advanced or metastatic renal cell carcinoma
This multi-part report includes:
Clinical Review
Pharmacoeconomic Review
Stakeholder Input
Clinical Review
Abbreviations
AE
adverse event
AXI
axitinib
CI
confidence interval
CR
complete response
CrI
credible interval
DCR
disease control rate
DIC
deviance information criterion
DOR
duration of response
ECOG
Eastern Cooperative Oncology Group
EMA
European Medicines Agency
EORTC QLQ-C30
European Organisation for Research and Treatment of Cancer Quality of Life Questionnaire Core 30
FE
fixed effects
FKSI-DRS
Functional Assessment of Cancer Therapy Kidney Symptom Index – Disease Related Symptoms
FLT
FMS-like tyrosine kinase
HR
hazard ratio
HRQoL
health-related quality of life
IIR
independent imaging review
IMDC
International Metastatic Renal Cell Carcinoma Database Consortium
IPI
ipilimumab
ITC
indirect treatment comparison
ITT
intention to treat
IxRS
interactive voice and web response system
KCC
Kidney Cancer Canada
KCRNC
Kidney Cancer Research Network of Canada
KPS
Karnofsky Performance Status
LEN
lenvatinib
MID
minimal important difference
MSKCC
Memorial Sloan Kettering Cancer Center
NIVO
nivolumab
NMA
network meta-analysis
OH-CCO
Ontario Health (Cancer Care Ontario)
OR
odds ratio
ORR
objective response rate
OS
overall survival
PAZO
pazopanib
PD-1
programmed cell death 1 protein
PD-L1
programmed cell death 1 ligand 1
PD-L2
programmed cell death 1 ligand 2
PEM
pembrolizumab
PFS
progression-free survival
PPE
palmar-plantar erythrodysesthesia
PR
partial response
QoL
quality of life
RCC
renal cell carcinoma
RCT
randomized controlled trial
RE
random effects
RECIST 1.1
Response Evaluation Criteria in Solid Tumours Version 1.1
RTK
receptor tyrosine kinase
SAE
serious adverse event
SUN
sunitinib
TEAE
treatment-emergent adverse event
TRAE
treatment-related adverse event
TTD
time to first deterioration
TUDD
time until definitive deterioration
VEGFR
vascular endothelial growth factor receptor
Executive Summary
An overview of the submission details for the drug under review is provided in Table 1.
Item | Description |
|---|---|
Drug product | Lenvima (lenvatinib) 20 mg (two 10 mg capsules) orally once daily in combination with Keytruda (pembrolizumab) administered as an IV infusion over 30 minutes every 3 weeks. |
Indication | In combination with pembrolizumab, for the treatment of adult patients with advanced (not amenable to curative surgery or radiation) or metastatic RCC with no prior systemic therapy for metastatic RCC. |
Reimbursement request | As per indication |
Health Canada approval status | NOC |
Health Canada review pathway | Standard |
NOC date | May 5, 2022 |
Sponsor | Eisai Limited |
NOC = Notice of Compliance; RCC = renal cell carcinoma; TBD = to be determined.
Source: Lenvatinib product monograph.1
Introduction
Renal cell carcinoma (RCC) is the most common form of kidney cancer, accounting for more than 85% of all cases around the world.2 RCCs are further classified into different subtypes based on histology (clear cell, papillary, chromophobe, clear cell papillary, collecting duct, medullary, and unclassified). The clear cell component is the most prevalent form of RCC and represents more than 70% of all RCC cases in practice.3,4 More than 33% of cases identified at initial diagnosis have metastatic disease5 due to the fact that most patients experience few or no symptoms at earlier stages, which restricts the number of cases identified with early disease.6 Common symptoms are blood in urine, dull pain around the flank region that does not go away, fullness in the upper abdomen or a lump in this area, fever, appetite loss, nausea, vomiting, constipation, weakness, fatigue, anemia, polycythemia, and unexplained weight loss.3,4,6 Projected estimates in Canada in 2021 show that kidney and renal pelvis cancers were the seventh most diagnosed cancers in men (5,200 new cases; 2.8% of disease-related deaths) and the 12th most diagnosed cancers in women (2,600 new cases; 1.7% of disease-related deaths). The predicted 5-year age-standardized survival rate was 73% for both sexes. Established risk factors include smoking, hypertension, obesity, medications (over-the-counter pain killers, phenacetin-containing compounds, and diuretics), family history of RCC, and genetic conditions (von Hippel-Lindau disease) or hereditary papillary RCC.3,4,6
Treatment selection in practice is based on prognostic risk models, particularly the International Metastatic Renal Cell Carcinoma Database Consortium (IMDC) risk group classification (favourable, intermediate, and poor).7 For patients in the favourable risk group, preferred therapies outlined by the Kidney Cancer Research Network of Canada (KCRNC) practice guideline include pembrolizumab (PEM) plus axitinib (AXI), and nivolumab (NIVO) plus cabozantinib. Other options include sunitinib (SUN) and pazopanib (PAZO). For patients in the intermediate- or poor risk groups, the preferred options include ipilimumab (IPI) plus NIVO, AXI-PEM, and NIVO plus cabozantinib. Other available options for patients in the intermediate and poor risk groups include SUN, PAZO, and cabozantinib (cabozantinib received market approval from Health Canada on October 6, 2021, as a first-line treatment option for patients with advanced RCC who are in the intermediate or poor IMDC risk group).
Lenvatinib (LEN) is a multiple-receptor tyrosine kinase (RTK) inhibitor that selectively inhibits kinase activities of vascular endothelial growth factor receptor 1 (VEGFR1), FMS-like tyrosine kinase 1 [FLT1], VEGFR2 [KDR], and VEGFR3 [FLT4]), in addition to other proangiogenic and oncogenic pathway–related RTKs. PEM is a high-affinity antibody against programmed cell death 1 protein (PD-1), which exerts dual ligand blockade of the PD-1 pathway, including programmed cell death 1 ligand 1 (PD-L1) and programmed cell death1 ligand 2 (PD-L2), on antigen-presenting or tumour cells. PEM is a solution for IV infusion available in a 100 mg per 4 mL vial. The Health Canada–approved dose is 20 mg (two 10 mg capsules) of LEN orally once daily in combination with PEM 200 mg administered as an IV infusion over 30 minutes every 3 weeks, or 400 mg every 6 weeks. This is continued until unacceptable toxicity or disease progression or for up to 24 months, or until administration of thirty-five 200 mg doses or eighteen 400 mg doses, whichever is longer. After completing combination therapy, LEN may be administered as a single drug until disease progression or unacceptable toxicity.
The objective of this report was to perform a systematic review of the beneficial and harmful effects of LEN combined with PEM for the treatment of adult patients with advanced or metastatic RCC who have not received prior systemic therapy for metastatic RCC.
Stakeholder Perspectives
The information in this section is a summary of input provided by the patient groups who responded to CADTH’s call for patient input and from clinical experts consulted by CADTH for the purpose of this review.
Patient Input
Two patient groups, CanCertainty and Kidney Cancer Canada (KCC), provided input for this submission. The full patient group input is included in the stakeholder section of this review.
The CanCertainty group expressed concerns related to inconsistent provincial coverage for oncology treatment regimens containing orally administered drugs and the resulting financial burden on vulnerable patients.
The KCC group included 2 online surveys of patients with kidney cancer and caregivers conducted in 2018 (the KCC survey) and the 2020 International Kidney Cancer Coalition (IKCC) survey of 241 Canadian respondents (47% with no evidence of disease, 6% with local disease, and 35% with advanced or metastatic disease) and 1 patient telephone interview conducted on November 26, 2021. In the IKCC survey, patients reported that having no access to up-to-date treatment or equipment is 1 of the top barriers to treatment. The side effects of kidney cancer therapies that were reported most often in the KCC survey included fatigue or lack of energy, diarrhea, loss of appetite, hand-foot syndrome, skin problems (including itching and rash), nausea or vomiting, pain, shortness of breath, and bleeding. Approximately one-quarter of respondents indicated the treatment was difficult to tolerate. Patients highlighted that improvement to their physical condition, such as tumour response and symptom control (breathing and pain), quality of life (QoL) improvement, and the chance for long-term disease control, are highly important considerations when deciding to take a new therapy. One clinical trial participant who was interviewed about their experience with LEN and PEM for metastatic RCC described the treatment as effective, very tolerable, and with manageable side effects (e.g., total body rash [managed with prednisone], nausea, fatigue, reduced appetite), and a reasonable QoL.
Clinician Input
Input From the Clinical Experts Consulted by CADTH
The clinical experts consulted during this CADTH review considered prolonged overall survival (OS), progression-free survival (PFS), reduction in metastatic lesions (objective response rate [ORR]), and improved QoL as the most important treatment goals. The experts noted that not all patients respond to treatments and some patients become resistant to therapy in the long run.
The experts considered ORR, PFS, and OS clinically meaningful to patients with metastatic RCC. According to the experts, a clinically meaningful response to treatment will be associated with a reduction in the size of metastatic disease by CT, reduction in pain from local metastases, and generally improved well-being of the patient. The clinical experts stated that CT imaging, history, and physical examination are commonly used in practice to assess patient response to therapy and assessments are conducted every 2 to 3 months. The clinical experts highlighted disease progression or serious autoimmune side effects related to PEM as deciding factors for treatment discontinuation. The clinical experts consulted thought that LEN-PEM will offer an additional therapy to patients with metastatic RCC in the first-line setting and patients in all IMDC risk groups will benefit from LEN-PEM.
One clinical expert highlighted that the significant benefit of the LEN-PEM treatment versus AXI-PEM is the much lower liver toxicity associated with LEN, noting that the incidence of liver toxicity with AXI-PEM is between 22% and 29%.8 In the opinion of the experts, differentiating liver toxicity in practice following the use of AXI instead of immunotherapy is challenging, and is often responsible for prolonged breaks from all therapy. As highlighted by 1 expert, the toxicity may be lower with LEN-PEM in terms of hepatotoxicity; however, the full toxicity profile of the combinations will only be evident in their use outside of the clinical trial setting.
Clinician Group Input
This section was prepared by CADTH staff based on the input provided by patient groups. The full clinician group input is included in the stakeholder section of this review.
Two clinician groups provided input for this CADTH review. The Ontario Health (Cancer Care Ontario) (OH-CCO) Genitourinary Drug Advisory Committee is a group that provides timely evidence-based clinical and health system guidance on drug-related issues in support of OH-CCO’s mandate, including the provincial drug reimbursement programs and the Systemic Treatment Program. The KCRNC is a virtual and inclusive national network of researchers committed to the facilitation of kidney cancer research to enhance the knowledge of kidney cancer and its treatment.
Both clinician groups highlighted improved OS and PFS, reduction in tumour size (measured as ORR), and improved QoL as treatment goals. Both clinician groups identified treatment options that were consistent with those listed by KCRNC practice guidelines for kidney cancer management. Both clinician groups identified poor response and resistance to treatment as issues faced by patients and clinicians with current treatment options. Both clinician groups anticipated that LEN-PEM will be an effective first-line option for patients with advanced RCC. Both groups considered the PFS and ORR findings from the CLEAR trial clinically significant.
Drug Program Input
The drug plans anticipate that LEN-PEM will change the comparator drug status and shift subsequent line therapies in the Canadian setting. The drug plans anticipate dose modifications in practice. The drug plans noted that LEN is available as 4 mg and 10 mg capsules, with packaging flexibility for dispensing for different treatment durations. The drug plans highlighted a potential for drug wastage for any previously dispensed supply of LEN if dose reductions are required in prescription fills (e.g., mid-cycle), as the drug cannot be re-dispensed. The implementation questions and corresponding responses from the clinical experts consulted by CADTH are summarized in Table 4.
Clinical Evidence
Pivotal Studies and Protocol-Selected Studies
Description of Studies
The CLEAR trial is an ongoing multi-centre, randomized, parallel-arm, open-label, phase III study with a primary objective to compare the efficacy and safety of LEN in combination with either everolimus or PEM versus SUN as first-line treatment in adult patients with advanced RCC. The study enrolled patients who were 18 years and older with a histologically or cytologically confirmed diagnosis of RCC with a clear cell component and documented evidence of advanced disease. Patients were also required to have at least 1 measurable target lesion assessed using Response Evaluation Criteria in Solid Tumours Version 1.1 (RECIST 1.1) criteria; adequate liver, bone marrow, blood coagulation, and renal function; a Karnofsky Performance Status (KPS) score of 70 or greater; and an adequately controlled blood pressure with or without antihypertensive medications.
The primary outcome investigated in the CLEAR trial was PFS measured by independent imaging review (IIR) using the RECIST 1.1 criteria. Secondary and exploratory outcomes included OS, ORR, health-related quality of life (HRQoL) (from 3 questionnaires: the Functional Assessment of Cancer Therapy Kidney Symptom Index – Disease Related Symptoms [FKSI-DRS], the European Organisation for Research and Treatment of Cancer Quality of Life Questionnaire Core 30 [EORTC QLQ-C30], and the EuroQol 5-Dimensions 3-Levels questionnaire [EQ-5D-3L] with the associated EuroQol Visual Analogue Scale), safety and tolerability, duration of response (DOR), and disease control rate (DCR).9
Patients were randomized into 3 study arms (the LEN-PEM, LEN plus everolimus, and SUN arms) in a 1:1:1 ratio based on 2 stratification factors: geographic region and the Memorial Sloan Kettering Cancer Center (MSKCC) prognostic risk groups. This CADTH review focuses on the comparison between LEN-PEM and SUN as per the sponsor’s reimbursement request and the Health Canada indication. There were more than 200 participating sites across North America (including 6 sites in Canada), Europe, Asia, and Australia.9 Patients received either 20 mg of LEN orally once daily plus 200 mg of PEM administered intravenously every 3 weeks, or 50 mg of SUN taken orally once daily for 4 weeks followed by 2 weeks off treatment, until the investigator discontinued treatment for the patient, the patient withdrew consent, or the patient moved into the follow-up phase.
By the third interim analysis data cut-off (August 28, 2020), a total of 1,417 patients had been screened, of which 1,069 were randomized to receive a study treatment in 1 of the 3 study arms. In total, 355 patients were randomized into the LEN-PEM arm and 357 in the SUN arm. The median age of patients enrolled in CLEAR was 62 years, more males were enrolled compared with females, and the majority of patients were White or Asian. Baseline characteristics were equally distributed among the 2 study arms except for age; more patients randomized into the SUN arm were younger than 65 years compared with the LEN-PEM arm (Table 7). More patients discontinued treatment in the SUN arm (76.5%) compared with the LEN-PEM arm (59.2%), and more patients in the SUN arm (57.7%) received subsequent systemic anti-cancer medication during survival follow-up compared with the LEN-PEM arm (33%).9
Efficacy Results
Table 2 provides a summary of findings for the outcomes of interest identified in the CADTH protocol.
Table 2: Summary of Key Results From Pivotal and Protocol-Selected Studies (August 28, Data Cut-Off)
Detail | LEN-PEM (n = 355) | SUN (n = 357) |
|---|---|---|
PFS | ||
Patients with events, n (%) | 160 (45.1) | 205 (57.4) |
Median PFS (95% CI), months | 23.9 (20.8 to 27.7) | 9.2 (6.0 to 11.0) |
Hazard ratio (95% CI)a,b | 0.39 (0.32 to 0.49) | |
Log-rank test P valueb | < 0.0001 | |
Median duration of follow-up (95% CI), monthsc,d | 22.3 (21.1 to 25.6) | 16.6 (13.1 to 18.5) |
Objective response rate | ||
Objective response rate (CR + PR), n (%) | 252 (71.0) | 129 (36.1) |
95% CIe | (66.3 to 75.7) | (31.2 to 41.1) |
Difference (%) (95% CI)e | 34.9 (28.0 to 41.7) | |
Odds ratio (95% CI)f | 4.35 (3.16 to 5.97) | |
P valuef | < 0.0001 | |
OS | ||
Median OS (95% CI), monthsc | NE (33.6 to NE) | NE (NE to NE) |
Hazard ratio (95% CI)a,b | 0.66 (0.49 to 0.88) | |
Log-rank test P valueb | 0.0049 | |
Median duration of follow-up (95% CI), monthsc,g | 26.7 (25.9 to 27.4) | 26.3 (25.4 to 27.2) |
OS follow-up analysis (March 31, 2021, data cut-off) | ||
Median OS (95% CI), monthsc | NE (41.5 to NE) | NE (38.4 to NE) |
Hazard ratio (95% CI)a,b | 0.72 (0.55 to 0.93) | |
Median duration of survival follow-up (95% CI), monthsc,f | 33.7 (32.8 to 34.4) | 33.4 (32.5 to 34.1) |
DOR | ||
Patients with objective response,h n | 252 | 129 |
Median duration of response, months (95% CI) | 25.8 (22.1 to 27.9) | 14.6 (9.4 to 16.7) |
DCR (CR, PR, and stable disease) | ||
Patients with disease control, n | 320 | 265 |
% (95% CI)e | 90.1 (87.0 to 93.2) | 74.2 (69.7 to 78.8) |
Difference (%) (95% CI)e | 15.9 (10.4 to 21.4) | |
Odds ratio (95% CI)f | 3.26 (2.13 to 5.00) | |
P valuef | < 0.0001 | |
Harms: safety analysis set, n, (%) | ||
All AEs | 351 (99.7) | 335 (98.5) |
Serious AEsi | 178 (50.6) | 113 (33.2) |
AEs with fatal outcomej | 27 (7.7) | 23 (6.8) |
AEs leading to study drug discontinuationk | 131 (37.2) | 49 (14.4) |
AEs leading to dose reductionk | 242 (68.8) | 171 (50.3) |
AEs leading to study drug interruptionk | 276 (78.4) | 183 (53.8) |
AEs leading to dose modificationl | 308 (87.5) | 239 (70.3) |
All deaths | 78 (22.2) | 99 (29.1) |
Deaths during the survival follow-up period | 51 (14.5) | 76 (22.4) |
Notable harms (%) | ||
Hypertension | 56.3 | 42.6 |
Hypothyroidism | 56.8 | 32.1 |
Hepatotoxicity | 27.3 | 24.1 |
Proteinuria | 29.5 | 12.6 |
Hemorrhage | 27.3 | 26.5 |
Palmar-plantar erythrodysesthesia syndrome | 29.5 | 37.9 |
Renal events | 22.2 | 17.6 |
QT prolongation | 6.5 | 3.8 |
Arterial thromboembolic events | 5.4 | 2.1 |
Gastrointestinal perforation | 1.4 | 0.9 |
Hypocalcemia | 1.4 | 2.6 |
Cardiac dysfunction | 2.6 | 2.1 |
Fistula formation | 0.6 | 0.6 |
Posterior reversible encephalopathy syndrome | 0.6 | 0.3 |
AE = adverse event; CI = confidence interval; CR = complete response; DCR = disease control rate; DOR = duration of response; EORTC = European Organisation for Research and Treatment of Cancer; IxRS = interactive voice and web response system; LEN = lenvatinib; MSKCC = Memorial Sloan Kettering Cancer Center; NE = not estimable; OS = overall survival; PEM = pembrolizumab; PFS = progression-free survival; PR = partial response; SUN = sunitinib.
Note: Results are from the August 28, 2020, data cut-off unless specified otherwise.
aHazard ratio is based on a Cox proportional hazard model including treatment group as a factor. The Efron method is used for ties.
bStratified by geographic region (region 1 = Western Europe and North America; region 2 = rest of the world) and MSKCC prognostic groups (favourable, intermediate, and poor risk) in IxRS.
cQuartiles are estimated by Kaplan-Meier method, and the 95% CIs are estimated with a generalized Brookmeyer and Crowley method.
dEstimates for progression-free survival follow-up time are calculated in the same way as the Kaplan-Meier estimate of PFS but with the meaning of “censor” and “event” status indicator reversed.
eThe 95% CI is constructed using the method of normal approximation.
fOdds ratio and nominal P value are calculated using the Cochran-Mantel-Haenszel method, stratified by IxRS stratification factors.
gEstimates for survival follow-up time are calculated in the same way as the Kaplan-Meier estimate of OS but with the meaning of “censor” and “event” status indicator reversed.
hQuartiles are estimated by Kaplan-Meier method, and the 95% CIs are estimated with a generalized Brookmeyer and Crowley method.
iEach patient may be counted in multiple categories.
jInclude Medical Dictionary for Regulatory Activities preferred terms “neoplasm progression,” “malignant neoplasm.”
kLEN or SUN. Dose reduction is not applicable for PEM.
lDose modification includes dose reduction or drug interruption.
Source: Clinical Study Report.9
Progression-Free Survival
By the third interim data cut-off (August 28, 2020), a total of 365 PFS events had occurred and the median PFS was 23.9 months (95% confidence interval [CI], 20.8 to 27.7) in the LEN-PEM arm and 9.2 months (95% CI, 6.0 to 11.0) in the SUN arm. The hazard ratio (HR) obtained between the LEN-PEM arm versus the SUN arm was 0.39 (95% CI, 0.32 to 0.49; P < 0.0001). The median estimated PFS follow-up was 22.3 months (95% CI, 21.1 to 25.6) in the LEN-PEM arm and 16.6 months (95% CI, 13.1 to 18.5) in the SUN arm.9
The PFS in the subgroups of interest (risk groups according to the IMDC prognostic model) was as follows:
Favourable risk group: The median estimated PFS was 28.1 months in the LEN-PEM arm and 12.9 months in the SUN arm. The HR between the LEN-PEM arm versus the SUN arm was 0.41 (95% CI, 0.28 to 0.62).
Intermediate risk group: The median estimated PFS in the LEN-PEM arm was 22.1 months and 7.1 months in the SUN group. The HR obtained between the LEN-PEM arm and the SUN arm was 0.39 (95% CI, 0.29 to 0.52).
Poor risk group: The median estimated PFS in the LEN-PEM arm was 22.1 months and 4 months in the SUN arm. The HR between the LEN-PEM arm versus the SUN arm was 0.28 (95% CI, 0.13 to 0.60).
Objective Response Rate
The ORR estimated by IIR in the LEN-PEM arm at the August 28, 2020, data cut-off was 71% (95% CI, 66.3 to 75.7). In total, 16.1% of patients receiving LEN-PEM had a confirmed complete response (CR) and 54.9% had a confirmed partial response (PR). In the SUN arm, the estimated ORR was 36.1% (95% CI, 31.2 to 41.1). In total, 4.2% of patients receiving SUN had a confirmed CR and 31.9% had a confirmed PR. The estimated odds ratio (OR) in the LEN-PEM arm versus the SUN arm was 4.35 (95% CI, 3.16 to 5.97) in favour of LEN-PEM.9
Overall Survival
The median OS by IIR was not estimable in either treatment arm at the August 28, 2020, data cut-off (interim analysis 3), and at the subsequent follow-up analysis performed on March 31, 2021. The HR estimated between the LEN-PEM arm versus the SUN arm was 0.66 (95% CI, 0.49 to 0.88; P = 0.0049).
The median duration of follow-up at the August 28, 2020, data cut-off was 26.7 months (95% CI, 25.9 to 27.4) in the LEN-PEM arm and 26.3 months (95% CI, 25.4 to 27.2) in the SUN arm. At the March 31, 2021, data cut-off, median OS was not estimable. The HR estimated between the LEN-PEM arm and the SUN arm was 0.72 (95% CI, 0.55 to 0.93). The median duration of follow-up was 33.7 months (95% CI, 32.8 to 34.4) in the LEN-PEM arm and 33.4 months (95% CI, 32.5 to 34.1) in the SUN arm.9
Duration of Response
By the August 28, 2020, data cut-off, the median DOR observed in patients with a response was 25.8 months (95% CI, 22.1 to 27.9) in the LEN-PEM arm and 14.6 months (95% CI, 9.4 to 16.7) in the SUN arm.9
Health-Related Quality of Life
HRQoL assessments between the LEN-PEM arm and the SUN arm for the EORTC QLQ-C30 questionnaire were as follows:
The overall least squares mean difference assessments after 46 weeks of treatment for physical function was 3.01 (95% CI, 0.48 to 5.54).
For the symptom scales, the least squares mean differences were −2.8 for fatigue (95% CI, −5.52 to −0.08), −2.79 for dyspnea (95% CI, −5.53 to −0.25), and −2.19 for constipation (95% CI, −4.19 to −0.18).
Time to First Deterioration Assessments
EORTC QLQ-C30 questionnaire: In physical functioning, the median time to first deterioration (TTD) in weeks in the LEN-PEM arm was 15.29 (95% CI, 12.29 to 21.43), while in the SUN arm, median TTD was 12.71 (95% CI, 9.29 to 18.14; nominal log-rank difference P = 0.03). The median TTD obtained in the dyspnea subscale was 39.29 (95% CI, 24.43 to 51) in the LEN-PEM arm and 21.14 (95% CI, 15.43 to 32.71) in the SUN arm (nominal log-rank difference P value = 0.02). In the appetite loss subscale, the median TTD in the LEN-PEM arm was 18.29 (95% CI, 15.14 to 21.71), while in the SUN arm, the median TTD was 9.14 (95% CI, 6.29 to 15.14). The nominal P value of the log-rank test was 0.03.
EQ-5D-3L Visual Analogue Scale: The median TTD in weeks obtained in the Visual Analogue Scale was 9.43 (95% CI, 6.43 to 12.29) in the LEN-PEM arm and, in the SUN arm, the median TTD was 9.14 (95% CI, 6.29 to 12.0). A nominal P value of 0.04 was obtained in the log-rank difference.9
Time Until Definitive Deterioration
FKSI-DRS total score: In the LEN-PEM arm, the median time until definitive deterioration (TUDD) in weeks was 134.14 (95% CI, 120 to not estimable), while in the SUN arm, the TUDD in weeks was 117.43 (95% CI, 90.14 to 131.29). The nominal P value obtained was less than 0.01.
EORTC QLQ-C30: The median TUDD in the global health status/QoL scale in weeks in the LEN-PEM arm was 114.29 (95% CI, 102.14 to 153.29), while in the SUN arm, the median TUDD in weeks was 75.14 (95% CI, 57.29 to 105.14). The nominal P value obtained was less than 0.0001.
In the physical function domain of the EORTC, the median TUDD in weeks in the LEN-PEM arm was 134.14 (95% CI, 109.14 to not estimable), while in the SUN arm, the median TUDD in weeks was 78.14 (95% CI, 63.14 to 111.0). The nominal P value obtained from the log-rank difference was less than 0.0001.
EQ-5D-3L Visual Analogue Scale: The median TUDD in weeks obtained in the LEN-PEM arm was 124.86 (95% CI, 94.71 to 134.57), while in the SUN arm, the median TUDD in weeks was 74.86 (95% CI, 54.14 to 94.0). The nominal P value obtained was less than 0.01.9
Disease Control Rate
By the August 28, 2020, data cut-off, the DCR observed in the LEN-PEM arm was 90.1%, while in the SUN arm, the DCR was 74.2%.9
Time to Treatment Discontinuation
This outcome was not investigated in the CLEAR trial.
Harms
Overall, the proportions of patients reporting at least 1 adverse event (AE) were comparable in both study arms (99.7% in the LEN-PEM arm and 98.5% in the SUN arm) in the CLEAR study by the August 28, 2020, data cut-off. Diarrhea, hypertension, hypothyroidism, decreased appetite, fatigue, nausea, and stomatitis were the most common AEs reported in the LEN-PEM arm, and diarrhea, hypertension, stomatitis, palmar-plantar erythrodysesthesia (PPE) syndrome, fatigue, nausea, and decreased appetite were the most commonly reported for SUN.
Serious AEs (SAEs) were reported in 50.6% of patients in the LEN-PEM arm compared with 33.2% in the SUN arm. There were more AEs leading to drug discontinuations (37.2% versus 14.4%), dose reductions (68.8% versus 50.3%), drug interruptions (78.4% versus 53.8%), and dose modifications (87.5% versus 70.3%) in the LEN-PEM arm compared with the SUN arm, respectively. Overall, more deaths were reported in the SUN arm (29.1%) compared with the LEN-PEM arm (22.2%).
The following notable harms were reported in the LEN-PEM arm and SUN arm. The notable harms observed in the LEN-PEM arm versus the SUN arm, respectively, were: hypertension (56.3% versus 42.6%), hypothyroidism (56.8% versus 32.1%), hepatotoxicity (27.3% versus 24.1%), proteinuria (29.5% versus 12.6%), hemorrhage (27.3% versus 26.5%), PPE syndrome (29.5% versus 37.9%), renal events (22.2% versus 17.6%), QT prolongation (6.5% versus 3.8%), arterial thromboembolic events (5.4% versus 2.1%), gastrointestinal perforation (1.4% versus 0.9%), hypocalcemia (1.4% versus 2.6%), cardiac dysfunction (2.6% versus 2.1%), fistula formation (0.6% versus 0.6%), and posterior reversible encephalopathy syndrome (0.6% versus 0.3%)SUN.9
Critical Appraisal
The CLEAR trial is a randomized, parallel-arm study. The randomization scheme implemented minimized the risk of bias owing to unknown confounders, including known and unknown prognostic factors. Baseline and demographic characteristics were balanced across the 2 study arms of interest for this review (except for age), suggesting that randomization was successful. The open-label design was the key limitation of the CLEAR trial because it increases the risk of assessment and reporting bias, especially for subjective outcomes such as HRQoL and safety. The primary outcome (PFS) and secondary outcomes (ORR, DOR, and DCR) were assessed by an IIR team using the RECIST 1.1 criteria, thus minimizing assessment bias. The time-to-event outcomes (OS, PFS) and other secondary outcomes (ORR, DOR, DCR, HRQoL, and safety) investigated in the trial were considered clinically meaningful by the clinical experts and reflective of outcomes assessed in clinical practice. The magnitude of the effect of LEN-PEM on HRQoL is uncertain because of the potential bias in reporting and attrition (the questionnaire completion rate went below 50% at cycle 26 for LEN-PEM and cycle 12 for SUN). The concomitant medications permitted (including subsequent anti-cancer therapies permitted in the follow-up phase) were also considered appropriate by the clinical experts and reflective of treatments used in Canadian practice. Several interim analyses and subgroup analyses were pre-specified in the protocol before the third interim data cut-off (August 28, 2020). The final OS analysis will take place after approximately 304 deaths are observed in the LEN-PEM arm and the SUN arm. Adjustments were made to account for alpha spending during the interim analysis. Multiplicity adjustments were implemented adequately for the analysis of PFS, OS, and ORR, and sensitivity analyses were also conducted for PFS. The findings from the sensitivity analyses were consistent with the primary intention-to-treat (ITT) analyses. No multiplicity adjustments were made during the analysis of DOR, DCR, HRQoL, and defined subgroups; thus, the findings were considered exploratory. The study was considered adequately powered to detect changes in PFS between the LEN-PEM arm versus the SUN arm. The threshold margin defined by the sponsor for PFS (including the OS), and the ORR was considered clinically significant by the clinical experts consulted.
The clinical experts consulted considered the baseline characteristics and the findings of the CLEAR trial generalizable to adult patients with untreated advanced or metastatic RCC with a clear cell component in the Canadian setting. The dosage of LEN and PEM used in the trial aligns with the Health Canada indication. SUN was considered an appropriate comparator. The experts noted that treatment options such as AXI-PEM were not available in practice for patients at the time of the trial initiation; at that time, SUN was the standard-of-care option for untreated RCC patients with advanced or metastatic disease in Canada. According to the clinical experts consulted, patients with brain metastases who had received prior treatment for brain metastasis can benefit and are eligible to receive treatment, except in cases of uncontrolled disease. Patients recruited in the CLEAR trial had better access to disease assessments and follow-up procedures compared with patients in real-world practice. The frequency of disease assessments and follow-up procedures in the CLEAR trial were considered appropriate by the clinical experts.
Indirect Comparisons
Description of Studies
One network meta-analysis (NMA) submitted by the sponsor and 4 published indirect treatment comparisons (ITCs) identified in the literature were summarized for this review. The objectives of the sponsor-submitted NMA and published ITCs were to assess the comparative clinical efficacy and/or safety of LEN-PEM compared with other first-line treatments for advanced RCC based on evidence from randomized controlled trials (RCTs).
The network informing the NMA submitted by the sponsor was composed of 24 phase II and phase III RCTs. The trials included adults with advanced or metastatic RCC who received first-line systemic treatments for advanced or metastatic RCC administered alone or in combination, best supportive care, or placebo. The studies enrolled patients between 1992 and 2019 and the study sample sizes ranged from 101 patients to 1,110 patients. A total of 18 studies reported on the timing of response assessments, which varied across studies from every 6 weeks to every 12 weeks. Among the 24 trials, the median age of the study populations ranged from 55 years to 68 years. Patients were described by risk category using the MSKCC criteria (16 studies), IMDC criteria (5 studies), or both (2 studies). Where baseline risk was reported (in all but 1 study), 23.5% to 81% of patients in each treatment group were categorized as intermediate risk. In most of the studies included in the network (21 studies), the majority of patients had either a Karnofsky score of at least 70 or an Eastern Cooperative Oncology Group (ECOG) score of 0 or 1 (less than 13% of patients included in 4 studies had an ECOG score of 2 and 80% to 83% of patients included in 1 study had a Karnofsky score of 70 or less). In all studies that reported information regarding histology (21 studies), the most common histological RCC subtype was clear cell, with at least 78% of patients possessing clear cell or predominantly clear cell histology location.
The studies included in the published ITCs were also included in the sponsor-submitted NMA. The methodology used for the published ITCs lacked important details, which hindered the ability to appropriately interpret the reported results. Further, individual estimates of treatment effects for the indirect comparisons of LEN-PEM versus other combination therapies were not reported for any outcomes. The NMA submitted by the sponsor was the most comprehensive assessment of indirect evidence among these studies and, as such, it is the focus of the following summary. The published ITCs were considered supportive of the sponsor-submitted NMA.
Efficacy Results
The summary of results herein focuses on comparisons between LEN-PEM versus the comparators included in the CADTH systematic review protocol (AXI-PEM, NIVO-IPI, PAZO, and SUN). For each of these comparators, the evidence was based on a single (different) RCT.
Progression-Free Survival
The base-case analysis of PFS (FDA censoring) used a random-effects (RE) model and included 18 comparators from 21 RCTs. The reported HR for LEN-PEM compared with the following comparators was 0.44 (95% credible interval [CrI], 0.23 to 0.82) versus NIVO-IPI, 0.57 (95% CrI, 0.31 to 1.08) versus AXI-PEM, and 0.38 (0.21 to 0.67) versus PAZO. The author indicated that the point estimates of the fixed-effects (FE) model were similar to the RE model, although the CrIs were narrower ||||||||||||||||||||||||||||||||||||||||||||||||||||||||||||||||||||||||||||||||||||||||||||||||||||||||||||||||||||||||||||||||||||||||||||||||||||||||||||||||||||||||||||||||||||||||||||||||||||||||||||||||||||||||||||||||||||||||||||||||||||||||||||||||||||||||||||||||||||||||||||||||||||||||||||. For PFS, based on an RE model, LEN-PEM showed benefit compared with NIVO-IPI and compared with PAZO. The RE model did not show a difference for the comparison with AXI-PEM, whereas the results for the FE model favoured LEN-PEM.
Overall Response Rate
The base-case analysis of ORR used an FE model and included 13 comparators from 14 RCTs. The OR for LEN-PEM was 3.24 (95% CrI, 2.18 to 4.85) compared with NIVO-IPI, 1.86 (95% CrI, 1.23 to 2.84) compared with AXI-PEM, and 3.00 (95% CrI, 2.02 to 4.47) compared with PAZO. The author reported that the CrIs were larger in the RE model, which only impacted the comparison of AXI-PEM ||||||||||||||||||||||||||||||||||||||||||||||||||||||||||||. Similar to the results for PFS, the results of the analysis of ORR based on an FE model showed a benefit of LEN-PEM when compared with other treatments.
Overall Survival
The base-case analysis of OS was performed using an FE model only and included 13 comparators from 12 RCTs. The HR for comparisons of LEN-PEM was 1.04 (95% CrI, 0.77 to 1.42) when compared with NIVO-IPI, 0.99 (95% CrI, 0.71 to 1.37) compared with AXI-PEM, and 0.78 (95% CrI, 0.58 to 1.06) compared with PAZO. These results suggest that the analysis of OS did not show a difference for LEN-PEM compared with other treatments.
Harms Results
All-Cause Grade 3 or Greater AEs
||||||||||||||||||||||||||||||||||||||||||||||||||||||||||||||||||||||||||||||||||||||||||||||||||||||||||||||||||||||||||||||||||||||||||||||||||||||||||||||||||||||||||||||||||||||||||||||||||||||||||||||||||||||||||||||||||||||||||||||||||||||||||||||||||||||||||||||||||||||||||||||||||||||||||||||||||||||||||||||||||||||||||||||||||||||||||||||||||||||||||||||||||||||||||||||||||||||||||||||||||||||||||||||||||||||||||||||||||||||||||||||||||||||||||||||||||||||||||||||||||||||||||||||||||||||||||||||||||||||||||||||||||||||||||||||||||||||||||||||||||||||||||||||||||||||||||||||||||||||||||||||||||||||||||||||||||||||||||||||||||||||||||||||||||||||||||||||||||||||||||||||||||||||||||||||||||||||||||||||||||||||||||||||||||||||||||||||||||||||||||||||||||
Treatment Discontinuation Due to AEs
|||||||||||||||||||||||||||||||||||||||||||||||||||||||||||||||||||||||||||||||||||||||||||||||||||||||||||||||||||||||||||||||||||||||||||||||||||||||||||||||||||||||||||||||||||||||||||||||||||||||||||||||||||||||||||||||||||||||||||||||||||||||||||||||||||||||||||||||||||||||||||||||||||||||||||||||||||||||||||||||||||||||||||||||||||||||||||||||||||||||||||||||||||||||||||||||||||||||||||||||||||||||||||||||||||||||||||||||||||||||||||||||||||||||||||||||||||||||||||||||||||||||||||||||||||||||||||||||||||||||||||||||||||||||||||||||||||||||||||||||||||||||||||||||||||||||||||||||||||||||||||||||||||||||||||||||||||||||||||||||||||||||||||||||||||||||||||||||||||||||||||||||||||||||||||||||||||||||||||||||||||||||||||||||||||||||||||||||||
Critical Appraisal
The methodology used for the study selection in the systematic literature review was pre-specified and used an appropriate set of criteria in terms of the study characteristics for a systematic review, the databases searched, the data extraction process, and the quality assessment. The literature review was comprehensive and was expected to have captured the relevant studies of interest. Despite an inclusive literature search, most of the connections within the network were limited to 1 study. Comparisons of interest (due to their relevance in the Canadian treatment setting) within the network were limited to indirect estimates only and based on 1 open-label RCT; therefore, inconsistency could not be assessed in these connections. Based on a qualitative review of the populations of the included studies, there were some concerns regarding potential bias due to effect modifiers. This included some differences between study populations in terms of number of metastases, prior nephrectomy, presence of sarcomatoid features, and distribution of patients by risk status that may warrant further review. This remains a source of uncertainty in the network. The quality of the included studies was assessed using Cochrane risk-of-bias tool 2.0, but information about the results of the quality assessment of the individual studies was not reported. Additionally, information about study withdrawal or dropouts was not reported, therefore limiting the ability to evaluate the internal validity of included studies.
The clinical experts consulted by CADTH indicated that the sponsor-submitted NMA considered all relevant comparators in the Canadian context. Information about the dosing of the treatments included in all of the trials that were included in the network was limited, with details regarding relative dose intensity, compliance, or missed dosing either not reported or poorly reported. The efficacy and safety outcomes included in the NMA were clinically relevant, but HRQoL was not included, which was a limitation of the sponsor-submitted NMA. Some of the patient characteristics were inconsistently reported across trials and, in particular, details about race and ethnicity, PD-L1 status, and cancer staging were infrequently reported. In general, heterogeneity that was identified as a limitation was not adjusted for, but some sensitivity and subgroup analyses were performed. Subgroup analyses were limited by sample size (patients in the poor- and favourable risk subgroups represented a small proportion of patients in the overall population). Overall, the interpretation of the results for the subgroup analyses of the NMA is limited.
Differences in time point assessments and actual treatment duration were also acknowledged as a limitation of the NMA, as was the impact of a lack of data maturity on efficacy assessments. A sensitivity analysis was conducted where trials with a follow-up period of less than 12 months were excluded; however, no adjustments were made for the variation in follow-up duration in studies where the duration was greater than 12 months. For reference, in the CLEAR trial,10 the analysis of OS was based on data with a median follow-up of approximately 33 to 34 months and the analysis of PFS was based on a median follow-up of 26 to 27 months. The results for OS and PFS were based on a median follow-up of 43 months in the KEYNOTE-426 trial,11 and a minimum of 48 months in CheckMate-214.12 The impact of the heterogeneity in the follow-up duration on these outcomes is unknown.
The sponsor-submitted ITC included justification of model selection (FE versus RE) based on an assessment of model fit or a lower deviance information criterion (DIC), although reported differences were very small. Assessments of heterogeneity based on I2 and inconsistency were also considered, although most connections were formed by a single RCT and there were few closed loops. The RE model used an informative before stabilize estimates of between-study variance. The prior was based on plausible values, and sensitivity analyses were conducted. There was uncertainty in the results, with wide CrIs. This is likely due to the sparsity of the network. The results for the ORR had very wide CrIs and the results for OS and all-cause AEs of grade 3 or higher included CrIs that crossed 1 and included values suggesting a strong treatment effect, limiting interpretation of these results. The analysis of treatment discontinuation due to AEs was also associated with a lack of precision and uncertainty from wide CrIs that crossed 1 while including values suggesting a strong treatment effect, although the FE model improved precision.
Conclusions
One pivotal study and 5 ITCs provided evidence for the CADTH systematic review. This review focused on the comparison between LEN-PEM versus SUN investigated in the CLEAR trial as per the sponsor’s reimbursement request and the Health Canada indication. No other evidence directly comparing LEN-PEM with other standard therapies for advanced or metastatic RCC was identified. In CLEAR, the median PFS estimated by IIR at the final interim analysis for PFS (August 28, 2020) was 23.9 months in patients receiving LEN-PEM compared with 9.2 months in patients receiving SUN. The HR estimated for PFS between LEN-PEM against SUN was considered statistically and clinically significant. The median OS was not estimable in both study arms at the data cut-off for interim analysis 3 and at the follow-up analysis data cut-off of March 31, 2021. However, the HR estimated between LEN-PEM against SUN was considered statistically significant. The ORR estimated in the LEN-PEM arm was also considered statistically significant. The HRQoL assessments were considered exploratory due to the lack of multiplicity adjustments in the analysis and the potential for reporting bias. The findings of the CLEAR trial were considered by the clinical experts consulted during the review to be meaningful for patients with advanced or metastatic RCC and were aligned with outcomes of importance to patients. In the opinion of the clinical experts, clinical judgment is required to evaluate LEN-PEM’s clinical benefit and management of AEs in practice. The experts anticipate that the treatment-related adverse events (TRAEs) resulting from the use of LEN-PEM will be managed in practice using similar strategies already in place for other treatment options (frequent AE monitoring and dose adjustments, reductions, and modifications are anticipated for this treatment). The open-label design was a key limitation of the CLEAR trial, and the OS data are interim. The study was randomized and adjustments for multiplicity were conducted for key outcomes (PFS, OS, and ORR), which minimized bias in the study. The clinical experts considered the baseline characteristics and the findings from the CLEAR trial generalizable to patients in Canada diagnosed with advanced or metastatic RCC in the first-line setting with at least a clear cell component.
No direct evidence was available to assess the relative efficacy of LEN-PEM versus other current standard-of-care therapies. Indirect evidence of LEN-PEM for first-line treatment of patients with advanced or metastatic RCC was available based on 5 ITCs: 1 NMA submitted by the sponsor and 4 ITCs identified in published literature. The sponsor-submitted NMA of LEN-PEM compared with other available therapies showed benefit for LEN-PEM for PFS and ORR but not for OS, compared with other therapies. Sources of uncertainty identified during the review included heterogeneity in the RCTs, a sparse network, and a lack of data maturity (shorter follow-up duration) for the CLEAR trial. The sponsor-submitted NMA results of the analysis of treatment discontinuation due to AEs ||||||||||||||||||||||||||||||||||||||||||||||||||||||||||||||||||||||||||||||||||||||||||||||||||||||||||||||||||||||||||||||||||||||||, although these results were limited by a lack of precision in addition to a number of assumptions made about the outcome that cause uncertainty in the results. Findings of OS, PFS, and ORR obtained from 4 additional published ITCs assessed in this review were consistent with the results of the sponsor-submitted NMA. However, the methodology used for the analyses lacked important details, which hindered the ability to appropriately interpret the reported results.
Introduction
Disease Background
RCC is the most common form of kidney cancer, accounting for more than 85% of all cases across the world.2 RCCs are further classified into different subtypes based on histology (clear cell, papillary, chromophobe, clear cell papillary, collecting duct, medullary, and unclassified). The clear cell component is the most prevalent form of RCC and represents more than 70% of all RCC cases in practice.3,4 More than 33% of cases identified at initial diagnosis include metastatic disease5 due to the fact that most patients experience few or no symptoms at earlier stages, which restricts the number of cases of early disease identified.6 Common symptoms are blood in urine, dull pain around the flank region that does not go away, fullness in the upper abdomen or a lump in this area, fever, appetite loss, nausea, vomiting, constipation, weakness, fatigue, anemia, polycythemia, and unexplained weight loss.3,4,6 In metastatic disease, patients may experience additional symptoms such as bone pain, adenopathy and pulmonary symptoms, anemia, or varicocele.2 Disease staging at diagnosis predicts prognosis and facilitates treatment choice in real-world settings.2,3 CT scans, MRIs, X-rays, and bone scans are common diagnostic methods used for identifying and characterizing tumours and assessing disease progression in patients in both real-world and clinical trial settings.2,3
Projected estimates in Canada in 2021 showed that kidney and renal pelvis cancers were the seventh most diagnosed cancers in males (accounting for 5,200 new cases and 2.8% of disease-related deaths) and the 12th most diagnosed in females (2,600 new cases and 1.7% of disease-related deaths). The predicted 5-year age-standardized survival rate was 73% for both sexes. The predicted net survival was higher (92%) for patients aged 15 to 44 years compared with patients 85 years and older (33%).13 The 5-year survival rate is said to be highly dependent on key factors such as tumour stage, grade, and local extent of tumour; the presence of regional nodal metastasis and evidence of metastatic disease at presentation are key determinants. The 5-year relative survival for localized (stage I) kidney and renal pelvis cancer was 92.7% and falls to 13.9% for patients with metastatic disease.14 Established risk factors include smoking, hypertension, obesity, medications (over-the-counter pain killers, phenacetin-containing compounds, and diuretics), family history of RCC, and genetic conditions (von Hippel-Lindau disease) or hereditary papillary RCC.3,4,6
The KCRNC practice guideline recommends the use of prognostic models, particularly the IMDC model for managing patients with advanced or metastatic RCC and for treatment selection in the first-line setting.2,7 The IMDC model relies on 6 clinical parameters to characterize patients into 3 risk groups (favourable, intermediate, and poor) which are stratified based on hemoglobin less than the lower limit of normal; serum-corrected calcium greater than the upper limit of normal (ULN); KPS of less than 80%, time from initial diagnosis to initiation of therapy of less than 1 year, absolute neutrophil count greater than ULN, and platelets greater than ULN. Patients are classified into the favourable risk group if they possess none of these 6 factors, the intermediate risk group if they have 1 or 2 factors, and the poor risk group if they have 3 to 6 adverse factors. Clinical decision-making for individualized therapy relies on a patient’s risk category.2,7
Standards of Therapy
Treatment options for RCC are based on the IMDC risk group classification, which is supported by available evidence from clinical trials and real-world data.7 The KCRNC guidelines outline the following options for untreated RCC patients with advanced disease.
For patients who fall under the favourable risk category, the “preferred” options outlined include AXI-PEM and NIVO plus cabozantinib. “Other” options include SUN and PAZO. Of note, therapies classified as “other” have studies that demonstrated PFS and not necessarily OS survival, and those labelled as “preferred” have studies that demonstrated improvement in OS.
For patients in the intermediate or poor risk category, the preferred options outlined include NIVO-IPI, AXI-PEM, and NIVO plus cabozantinib. Other available options for this risk group include SUN, PAZO, and cabozantinib. Of note, cabozantinib received market approval from Health Canada on October 6, 2021, as a first-line treatment option for patients with advanced RCC who fall under the intermediate or poor IMDC risk group.
Treatment options identified by the clinical experts and clinician groups consulted during this CADTH review were consistent with those outlined in the 2021 KCRNC consensus guidelines.
Drug
LEN is a multiple-RTK inhibitor that selectively inhibits kinase activities of VEGFR1 (FLT1), VEGFR2 (KDR), and VEGFR3 (FLT4), in addition to other proangiogenic and oncogenic pathway–related RTKs. LEN also inhibits other kinases that have been implicated in pathogenic angiogenesis, tumour growth, and cancer progression in addition to their normal cellular functions, including fibroblast growth factor (FGF) receptors (FGFR) 1, 2, 3, and 4; platelet-derived growth factor receptor alpha (PDGFRA), RTK (KIT proto-oncogene, RTK [KIT]), and rearranged during transfection (RET). LEN also exhibits antiproliferative activity in hepatocellular carcinoma cell lines dependent on activated FGFR signalling with concurrent inhibition of FGFR substrate 2 alpha phosphorylation. In syngeneic mouse tumour models, LEN treatment decreased the tumour-associated macrophage population and increased activated cytotoxic T-cell populations, leading to antitumour activity. The antitumour activity of the combination of LEN and an anti–PD-1 monoclonal antibody was greater than that of monotherapy.9
PD-1 is an immune-checkpoint receptor that limits the activity of T lymphocytes in peripheral tissues. The PD-1 pathway is an immune-control checkpoint that may be engaged by tumour cells to inhibit active T-cell immune surveillance. PEM is a high-affinity antibody against PD-1, which exerts dual ligand blockade of the PD-1 pathway, including PD-L1 and PD-L2, on antigen-presenting or tumour cells. By inhibiting the PD-1 receptor from binding to its ligands, PEM reactivates tumour-specific cytotoxic T lymphocytes in the tumour microenvironment.15
LEN underwent a standard review by Health Canada and received a Notice of Compliance on May 5, 2022, for the following indication: in combination with PEM, for the treatment of adult patients with advanced (not amenable to curative surgery or radiation) or metastatic RCC with no prior systemic therapy for metastatic RCC. The Health Canada–approved dose is 20 mg (two 10 mg capsules) of LEN taken orally once daily in combination with PEM 200 mg administered as an IV infusion over 30 minutes every 3 weeks or 400 mg every 6 weeks. This is continued until unacceptable toxicity or disease progression or for up to 24 months, or until administration of thirty-five 200 mg doses or eighteen 400 mg doses, whichever is longer. After completing combination therapy, LEN may be administered as a single drug until disease progression or unacceptable toxicity.
Table 3: Key Characteristics of Lenvatinib, Pembrolizumab, and Sunitinib
Characteristic | Lenvatinib1 | Pembrolizumab15 | Sunitinib16 |
|---|---|---|---|
Mechanism of action | Lenvatinib is an RTK inhibitor that selectively inhibits the kinase activities of VEGF receptors VEGFR1 (FLT1), VEGFR2 (KDR), and VEGFR3 (FLT4), in addition to other proangiogenic and oncogenic pathway–related RTKs, including fibroblast growth factor (FGF) receptors FGFR1, 2, 3, and 4; the platelet-derived growth factor (PDGF) receptor PDGFRA; KIT; and RET. | Pembrolizumab is a high-affinity antibody against PD-1, which exerts dual ligand blockade of the PD-1 pathway, including PD-L1 and PD-L2, on antigen-presenting or tumour cells. By inhibiting the PD-1 receptor from binding to its ligands, pembrolizumab reactivates tumour-specific cytotoxic T lymphocytes in the tumour microenvironment. | Sunitinib malate is a small molecule that inhibits multiple-RTKs, some of which are implicated in tumour growth, pathologic angiogenesis, and metastatic progression of cancer. Sunitinib was evaluated for its inhibitory activity against a variety of kinases (> 80 kinases) and was identified as a potent inhibitor of platelet-derived growth factor receptors (PDGFRA and PDGFRB), vascular endothelial growth factor receptors (VEGFR1, VEGFR2, and VEGFR3), stem cell factor receptor (KIT), FMS-like tyrosine kinase 3 (FLT3), colony-stimulating factor 1 receptor (CSF1R), and the glial cell line– derived neurotrophic factor receptor (RET). |
Indicationa | In combination with pembrolizumab, for the treatment of adult patients with advanced (not amenable to curative surgery or radiation) or metastatic RCC with no prior systemic therapy for metastatic RCC. | In combination with pembrolizumab, for the treatment of adult patients with advanced or metastatic RCC with no prior systemic therapy for metastatic RCC. | Indicated for the treatment of metastatic renal cell carcinoma of clear cell histology. |
Route of administration | Oral capsule | IV infusion | Oral capsule |
Recommended dose | 20 mg (two 10 mg capsules) of lenvatinib orally once daily in combination with pembrolizumab 200 mg administered as an IV infusion over 30 minutes every 3 weeks, or 400 mg every 6 weeks, until unacceptable toxicity or disease progression, or for up to 24 months or 35 doses of 200 mg or 18 doses of 400 mg, whichever is longer. | Pembrolizumab 200 mg administered as an IV infusion every 21-day cycle. | 50 mg (4 weeks on, 2 weeks off). |
Serious adverse effects or safety issues | Boxed warnings:
| Immune-mediated adverse reactions such as:
| Boxed warnings:
|
Other | Notice of Compliance received on May 5, 2022 | ||
FGFR = fibroblast growth factor receptor; FLT = FMS-like tyrosine kinase; KDR = kinase insert domain receptor; KIT = KIT proto-oncogene, receptor tyrosine kinase; PD-1 = programmed cell death 1 protein; PD-L1 = programmed cell death 1 ligand 1; PD-L2 = programmed cell death 1 ligand 2; PDGF = platelet-derived growth factor; PDGFRA = platelet-derived growth factor receptor alpha; PDGFRB = platelet-derived growth factor receptor beta; RCC = renal cell carcinoma; RET = rearranged during transfection; RTK = receptor tyrosine kinase; VEGF = vascular endothelial growth factor; VEGFR1, VEGFR2, VEGFR3 = vascular endothelial growth factor receptor 1, 2, 3.
aHealth Canada–approved indication.
Source: Product monographs for Keytruda,15 lenvatinib,1 and sunitinib.16
Stakeholder Perspectives
Patient Group Input
This section was prepared by CADTH staff based on the input provided by patient groups. The full patient group input is included in the Stakeholder Input section of this review.
Two patient groups, CanCertainty and KCC, provided input for this submission. The CanCertainty Coalition is the united voice of more than 30 Canadian patient groups, cancer health charities, and caregiver organizations from across the country joining together with oncologists and cancer care professionals to significantly improve the affordability and accessibility of cancer treatment. The KCC group is a national community of patients, caregivers, and health professionals who work to provide every Canadian touched by kidney cancer with support, education, and advocacy for their care pathways and treatment options.
The CanCertainty group expressed concerns related to inconsistent provincial coverage for oncology treatment regimens containing orally administered drugs and the resulting financial burden on vulnerable patients.
The KCC group included 2 online surveys of patients with kidney cancer and caregivers conducted in 2018 (the KCC survey) and the 2020 IKCC survey (comprising 241 Canadian respondents: 47% with no evidence of disease, 6% with local disease, and 35% with advanced or metastatic disease) and 1 patient telephone interview conducted on November 26, 2021. In the IKCC survey, patients reported that having no access to up-to-date treatment or equipment is 1 of the top barriers to treatment. The side effects of kidney cancer therapies that were reported most often in the KCC survey include fatigue or lack of energy, diarrhea, loss of appetite, hand-foot syndrome, skin problems (including itching and rash), nausea or vomiting, pain, shortness of breath, and bleeding. Approximately one-quarter of respondents indicated the treatment was difficult to tolerate. Patients highlighted that improvement to their physical condition, such as tumour response and symptom control (breathing and pain), QoL improvement, and the chance for long-term disease control are highly important considerations before deciding to take a new therapy. One clinical trial participant who was interviewed about their experience with LEN and PEM for metastatic RCC described the treatment as effective, very tolerable, and with manageable side effects (e.g., total body rash [managed with prednisone], nausea, fatigue, reduced appetite), and a reasonable QoL.
Clinician Input
Input From the Clinical Experts Consulted by CADTH
All CADTH review teams include at least 1 clinical specialist with expertise regarding the diagnosis and management of the condition for which the drug is indicated. Clinical experts are a critical part of the review team and are involved in all phases of the review process (e.g., providing guidance on the development of the review protocol, assisting in the critical appraisal of clinical evidence, interpreting the clinical relevance of the results, and providing guidance on the potential place in therapy). The following input was provided by 2 clinical specialists with expertise in the diagnosis and management of RCC.
Unmet Needs
Prolonged OS, PFS, reduction in the size of metastatic lesions, and improved QoL were considered by the clinical experts to be the most important treatment goals for patients with advanced metastatic RCC. In the opinion of the clinical experts, not all patients respond to treatment in current practice and those who respond often become resistant to therapy in the long run.
Place in Therapy
According to the clinical experts consulted, LEN-PEM will provide an additional first-line treatment option, in addition to AXI-PEM, NIVO-IPI, SUN, and PAZO, for the treatment of patients with advanced or metastatic RCC in Canada. The clinical experts highlighted that since the CLEAR trial was designed to investigate LEN-PEM against SUN in the first-line setting, the therapy would only be appropriate for patients in the first-line setting.
Patient Population
In the opinion of the clinical experts consulted, patients in all IMDC prognostic risk groups will benefit from the LEN-PEM therapy. The experts cited that the diagnosis of metastatic RCC is based on imaging and histology confirmation, neither of which is challenging to perform, and both are associated with a low probability of misdiagnosis. The clinical experts noted that patients with metastasis often present with asymptomatic disease; therefore, it is very unlikely that a treating oncologist will wait for symptom presentation before initiating treatment in patients. The experts noted there are no clear contraindications to LEN-PEM except in patients with pre-existing autoimmune disorders; these patients may have a higher risk of developing AEs with any form of immunotherapy and thus are less suited to receive LEN-PEM in practice. The experts also noted that although some patients may do better on treatment with NIVO-IPI, owing to the absence of biomarkers, predicting which patients will be least suitable for treatment or who will likely exhibit a response to LEN-PEM is uncertain.
Assessing Response to Treatment
The clinical experts highlighted CT imaging, history, and physical examination as common diagnostic methods used to assess response to treatment in real-world practice. The experts considered the outcomes of ORR, PFS, and OS to be clinically meaningful for patients. As cited by the experts, a favourable outcome following treatment is 1 that is associated with a reduction in the size of metastatic disease (assessed by CT), a reduction in pain from local metastases, and a general improvement in patient well-being. The clinical experts stated that treatment response is assessed every 2 to 3 months in real-world settings.
Discontinuing Treatment
According to the clinical experts, disease progression or serious autoimmune AEs related to PEM will be considered when deciding treatment discontinuation in patients. The experts further noted that SAEs from LEN are rare and can be managed with dose reduction.
Prescribing Conditions
The clinical experts consulted during the review thought that it will be appropriate for patients to be generally seen and treated by a medical oncologist experienced in using both tyrosine kinase inhibitors and immunotherapy, as considerable clinical judgment is required in evaluating clinical benefit and managing toxicities. The experts noted there is a small number of oncology urologists in Canada who administer systemic therapy and have the required experience and expertise to administer this therapy.
Additional Considerations
One clinical expert highlighted that the significant benefit of the LEN-PEM treatment over AXI-PEM is the much lower liver toxicity associated with LEN, noting that the incidence of liver toxicity with AXI-PEM is between 22% to 29%.8 In the opinion of the experts, differentiating liver toxicity in practice following the use of AXI instead of immunotherapy is challenging and it is often responsible for prolonged breaks from all therapies. As highlighted by the other expert, the toxicity may be lower with LEN-PEM in terms of hepatotoxicity; however, the full toxicity profile of the combinations will only be evident in their use outside of the clinical trial setting.
Clinician Group Input
This section was prepared by CADTH staff based on the input provided by clinician groups. The full clinician group input is included in the stakeholder input section of this review.
Two clinician groups, the OH-CCO Genitourinary Drug Advisory Committee and the KCRNC, provided input for this CADTH review. The OH-CCO’s Drug Advisory Committee provides timely evidence-based clinical and health system guidance on drug-related issues in support of OH-CCO’s mandate, including the provincial drug reimbursement programs and the Systemic Treatment Program. The KCRNC is a virtual and inclusive national network of researchers committed to the facilitation of kidney cancer research to enhance the knowledge of kidney cancer and its treatment.
The OH-CCO and the KCRNC clinician groups both highlighted improved OS and PFS, reduction in tumour size (measured as ORR), and improved QoL as treatment goals. Both clinician groups identified treatment options that were consistent with the Canadian guidelines for kidney cancer management. Both clinician groups identified poor response and resistance to treatment as issues with current treatment options. The OH-CCO group added that patients with advanced RCC are not routinely cured by current therapies and, as such, have developed resistance to treatment over time, causing patients to die of the disease. Treatment options for refractory disease were identified as an important unmet need by the clinician groups. Both clinician groups anticipated that LEN-PEM will be an effective first-line option for patients with advanced RCC across all IMDC risk groups. The clinician groups consulted considered the ORR (71%) and CR rate (16%) obtained in the LEN-PEM arm to be the highest compared with the other immunotherapy and tyrosine kinase inhibitor combinations available in practice. The clinician groups also considered the PFS (23.9 months) in the LEN-PEM arm the longest PFS and clinically significant.
According to the OH-CCO group, a patient’s IMDC group classification, suitability for immunotherapy, tumour burden, and preference will be assessed when deciding treatment discontinuation. The OH-CCO clinician group stated that it will be uncommon to recommend other systemic therapies before starting LEN-PEM. Both clinician groups consulted considered improved or stable clinical status, stable disease, reduction in pain from local metastases, and shrinkage (reduction in the size) of the disease based on radiographic imaging (i.e., CT scan) to be clinically meaningful. Both groups noted that, consistent with other funded treatment options, patients will be assessed for a response based on history, physical examination, and radiographic imaging (most commonly CT scans, usually every 2 to 3 months). Both clinician groups highlighted that disease progression, SAEs from PEM (such as high-grade immune-related AEs) or high-grade AEs from LEN (despite dose reduction or schedule change), will be considered when deciding treatment discontinuation.
Additional Considerations
The KCRNC group highlighted that a significant benefit of LEN-PEM versus the AXI-PEM combination is the much lower probability of liver toxicity with LEN. The KCRNC group cited that the incidence of liver toxicity with AXI-PEM is 22% to 29%.8 As underlined by the clinician group, liver toxicity is often responsible for prolonged breaks from all therapy and, in practice, it is challenging to differentiate liver toxicity resulting from AXI versus immunotherapy.
Drug Program Input
The drug programs provide input on each drug being reviewed through CADTH’s reimbursement review processes by identifying issues that may impact their ability to implement a recommendation. The implementation questions and corresponding responses from the clinical experts consulted by CADTH are summarized in Table 4.
Table 4: Summary of Drug Plan Input and Clinical Expert Response
Drug program implementation questions | Clinical expert response |
|---|---|
Relevant comparators | |
The comparator in the CLEAR trial was SUN. What is the comparative effectiveness of LEN-PEM vs. PAZO, AXI-PEM, and NIVO-IPI? | For pERC consideration. |
Is there a preferred first-line treatment for specific patient populations? | Experts were unable to advise on the preferred first-line treatment due to the lack of comparative evidence. |
Considerations for initiation therapy | |
Should patients with stable CNS metastases be eligible for LEN-PEM? | Experts indicated that, based on the trial’s inclusion criteria, patients with stable CNS metastases were included in the CLEAR trial. However, patients with new, and unstable CNS metastasis are not eligible to receive therapy. |
In the CLEAR trial, patients who received prior systemic anti-cancer therapy for RCC (including adjuvant therapy) were excluded. Should patients who complete or discontinue PEM in the adjuvant setting without disease progression, and who have a disease-free interval of 6 months or greater, be eligible for LEN-PEM? | Experts agreed that such patients should be eligible for treatment, although there is no available evidence. The clinical expert noted that it would be reasonable to reinitiate treatment if a patient had a break between therapy longer than 6 months but not less than 6 months. |
Should patients who complete 2 years of PEM and experience disease progression or recurrence off PEM treatment be eligible for up to 1 year (17 cycles) of re-treatment? | There is no evidence to support the use of therapy in this situation. The clinical experts highlighted that it would be appropriate to follow the same procedures outlined in the protocol for the CLEAR trial. |
Considerations for discontinuation of therapy | |
If 1 drug in the combination treatment is discontinued for reasons other than progression (e.g., discontinued due to toxicity), should the other drug be continued? | The clinical experts noted that in practice, patients can continue with 1 drug (in a combination therapy) if the other drug in the treatment is not well tolerated or discontinued. |
Considerations for prescribing of therapy | |
Some jurisdictions may implement a weight-based dose up to a maximum dose for PEM (i.e., 2 mg/kg up to a maximum of 200 mg every 3 weeks). Should PEM 4 mg/kg (up to a maximum of 400 mg) IV every 6 weeks be an option? | In the opinion of the clinical experts, PEM dosing of 4 mg/kg (up to a maximum of 400 mg) IV every 6 weeks should be made available as an option for provincial drug plans. |
Generalizability | |
The CLEAR trial eligibility criteria limited enrolment to patients with a clear cell component. Are the results of the CLEAR trial generalized to patients with non–clear cell mRCC? | According to the experts, the results are not generalizable. Patients in the CLEAR trial were required to have a clear cell component histology. In practice, patients having some clear cell component should benefit from the treatment. |
The CLEAR trial was stratified based on MSKCC prognostic group. Is there a prognostic risk group more likely to derive benefit from LEN-PEM? | The clinical experts thought that all 3 risk groups would benefit equally from the treatment, as with the case of AXI-PEM in practice. |
Should patients currently receiving alternate first-line therapy, who have not yet progressed, be eligible to switch to LEN-PEM? | The clinical experts noted that no switching should be required if a patient is responding adequately, although it may depend on the therapy a patient is currently receiving. Clinician judgment should be exercised. |
Funding algorithm | |
Drug may change place in therapy of comparator drugs. | For pERC consideration. |
Drug may change place in therapy of drugs reimbursed in subsequent lines. | For pERC consideration. |
Care provision issues | |
LEN capsules are available as 4 mg and 10 mg capsules. The variety of potential daily doses are available from the manufacturer, packaged in blister cards of 5-day increments. This packaging provides flexibility for dispensing different durations of therapy, though may require pharmacies to carry multiple blister cards of different strengths to anticipate the multiple doses that may be clinically indicated. Dose modifications for LEN in clinical practice are anticipated to be common due to the high frequency of dose modifications reported on the CLEAR trial (84.4% of patients required LEN dose modifications). In addition, if dose reductions are required in between prescription fills (e.g., mid-cycle), drug wastage would occur for any previously dispensed supply of LEN, as these cannot be re-dispensed. | For pERC consideration. |
System and economic issues | |
Confidential pricing agreements exist for all publicly funded first-line treatment options (i.e., for PAZO, PEM, AXI, NIVO, IPI and, in some jurisdictions, SUN). | For pERC consideration. |
AXI = axitinib; CNS = central nervous system; IPI = ipilimumab; LEN = lenvatinib; PAZO = pazopanib; PEM = pembrolizumab; mRCC = metastatic renal cell carcinoma; MSKCC = Memorial Sloan Kettering Cancer Center; pERC = CADTH pan-Canadian Oncology Drug Review Expert Review Committee; RCC = renal cell carcinoma; SUN = sunitinib.
Clinical Evidence
The clinical evidence included in the review of LEN-PEM is presented in 3 sections. The first section, the systematic review, includes pivotal studies provided in the sponsor’s submission to CADTH and Health Canada, as well as those studies that were selected according to an a priori protocol. The second section includes indirect evidence from the sponsor and indirect evidence selected from the literature that met the selection criteria specified in the review. The third section includes additional relevant studies that were considered to address important gaps in the evidence included in the systematic review.
Systematic Review (Pivotal and Protocol-Selected Studies)
Objectives
To evaluate the efficacy and safety of LEN 20 mg, taken orally once daily, in combination with PEM (200 mg IV administered once every 3 weeks), for the treatment of adult patients with advanced or metastatic RCC with no prior systemic therapy for metastatic RCC.
Methods
Studies selected for inclusion in the systematic review included pivotal studies provided in the sponsor’s submission to CADTH and Health Canada, as well as those meeting the selection criteria presented in Table 5. Outcomes included in the CADTH review protocol reflect outcomes considered to be important to patients, clinicians, and drug plans.
Of note, the systematic review protocol presented in Table 5 was established before the granting of a Notice of Compliance from Health Canada.
Table 5: Inclusion Criteria for the Systematic Review
Criteria | Description |
|---|---|
Population | Adult patients with advanced or metastatic renal cell carcinoma (RCC) with no prior systemic therapy for metastatic RCC Subgroups: Prognostic groups (e.g., IMDC) |
Intervention | LEN 20 mg (orally, once daily) plus PEM 200 mg (IV) every 3 weeks |
Comparators |
|
Outcomes | Efficacy outcomesb
Harms outcomes
Notable harms
|
Study designs | Published and unpublished III, and IV RCTs |
IMDC = International Metastatic Renal Cell Carcinoma Database Consortium; LEN = lenvatinib; NIVO-IPI = nivolumab plus ipilimumab; PAZO = pazopanib; PEM = pembrolizumab; PEM-AXI = pembrolizumab plus axitinib; RCC = renal cell carcinoma; RCT = randomized controlled trial; SUN = sunitinib.
aFor poor and intermediate risk groups.
bThese outcomes were identified as being of particular importance to patients in the input received by CADTH from patient groups.
Two CADTH clinical reviewers independently selected studies for inclusion in the review based on titles and abstracts, according to the predetermined protocol. Full-text articles of all citations considered potentially relevant by at least 1 reviewer were acquired. Reviewers independently made the final selection of studies to be included in the review, and differences were resolved through discussion.
The literature search for clinical studies was performed by an information specialist using a peer-reviewed search strategy according to the PRESS Peer Review of Electronic Search Strategies tool.17
Published literature was identified by searching the following bibliographic databases: MEDLINE All (1946‒) through Ovid and Embase (1974‒) through Ovid. All Ovid searches were run simultaneously as a multi-file search. Duplicates were removed using Ovid deduplication for multi-file searches, followed by manual deduplication in Endnote. The search strategy comprised both controlled vocabulary, such as the National Library of Medicine’s MeSH (Medical Subject Headings), and keywords. The main search concepts were lenvatinib (Lenvima) and pembrolizumab (Keytruda). Clinical trials registries were searched: the US National Institutes of Health’s clinicaltrials.gov, the WHO’s International Clinical Trials Registry Platform (ICTRP) search portal, Health Canada’s Clinical Trials Database, and the European Union Clinical Trials Register.
No filters were applied to limit the retrieval by study type. Retrieval was not limited by publication date or by language. Conference abstracts were excluded from the search results. See Appendix 1 for the detailed search strategies.
The initial search was completed on December 9, 2021. Regular alerts updated the search until the meeting of the CADTH pan-Canadian Oncology Drug Review Expert Committee (pERC) on April 13, 2022.
Grey literature (literature that is not commercially published) was identified by searching relevant websites from the Grey Matters: A Practical Tool For Searching Health-Related Grey Literature tool.18 Included in this search were the websites of regulatory agencies (FDA and European Medicines Agency [EMA]). Google was used to search for additional internet-based materials. See Appendix 1 for more information on the grey literature search strategy.
These searches were supplemented by reviewing bibliographies of key papers and through contacts with appropriate experts. In addition, the manufacturer of the drug was contacted for information regarding unpublished studies.
Findings From the Literature
Two reports of a single study were identified from the literature for inclusion in the systematic review (Figure 1). The included studies are summarized in Table 6.
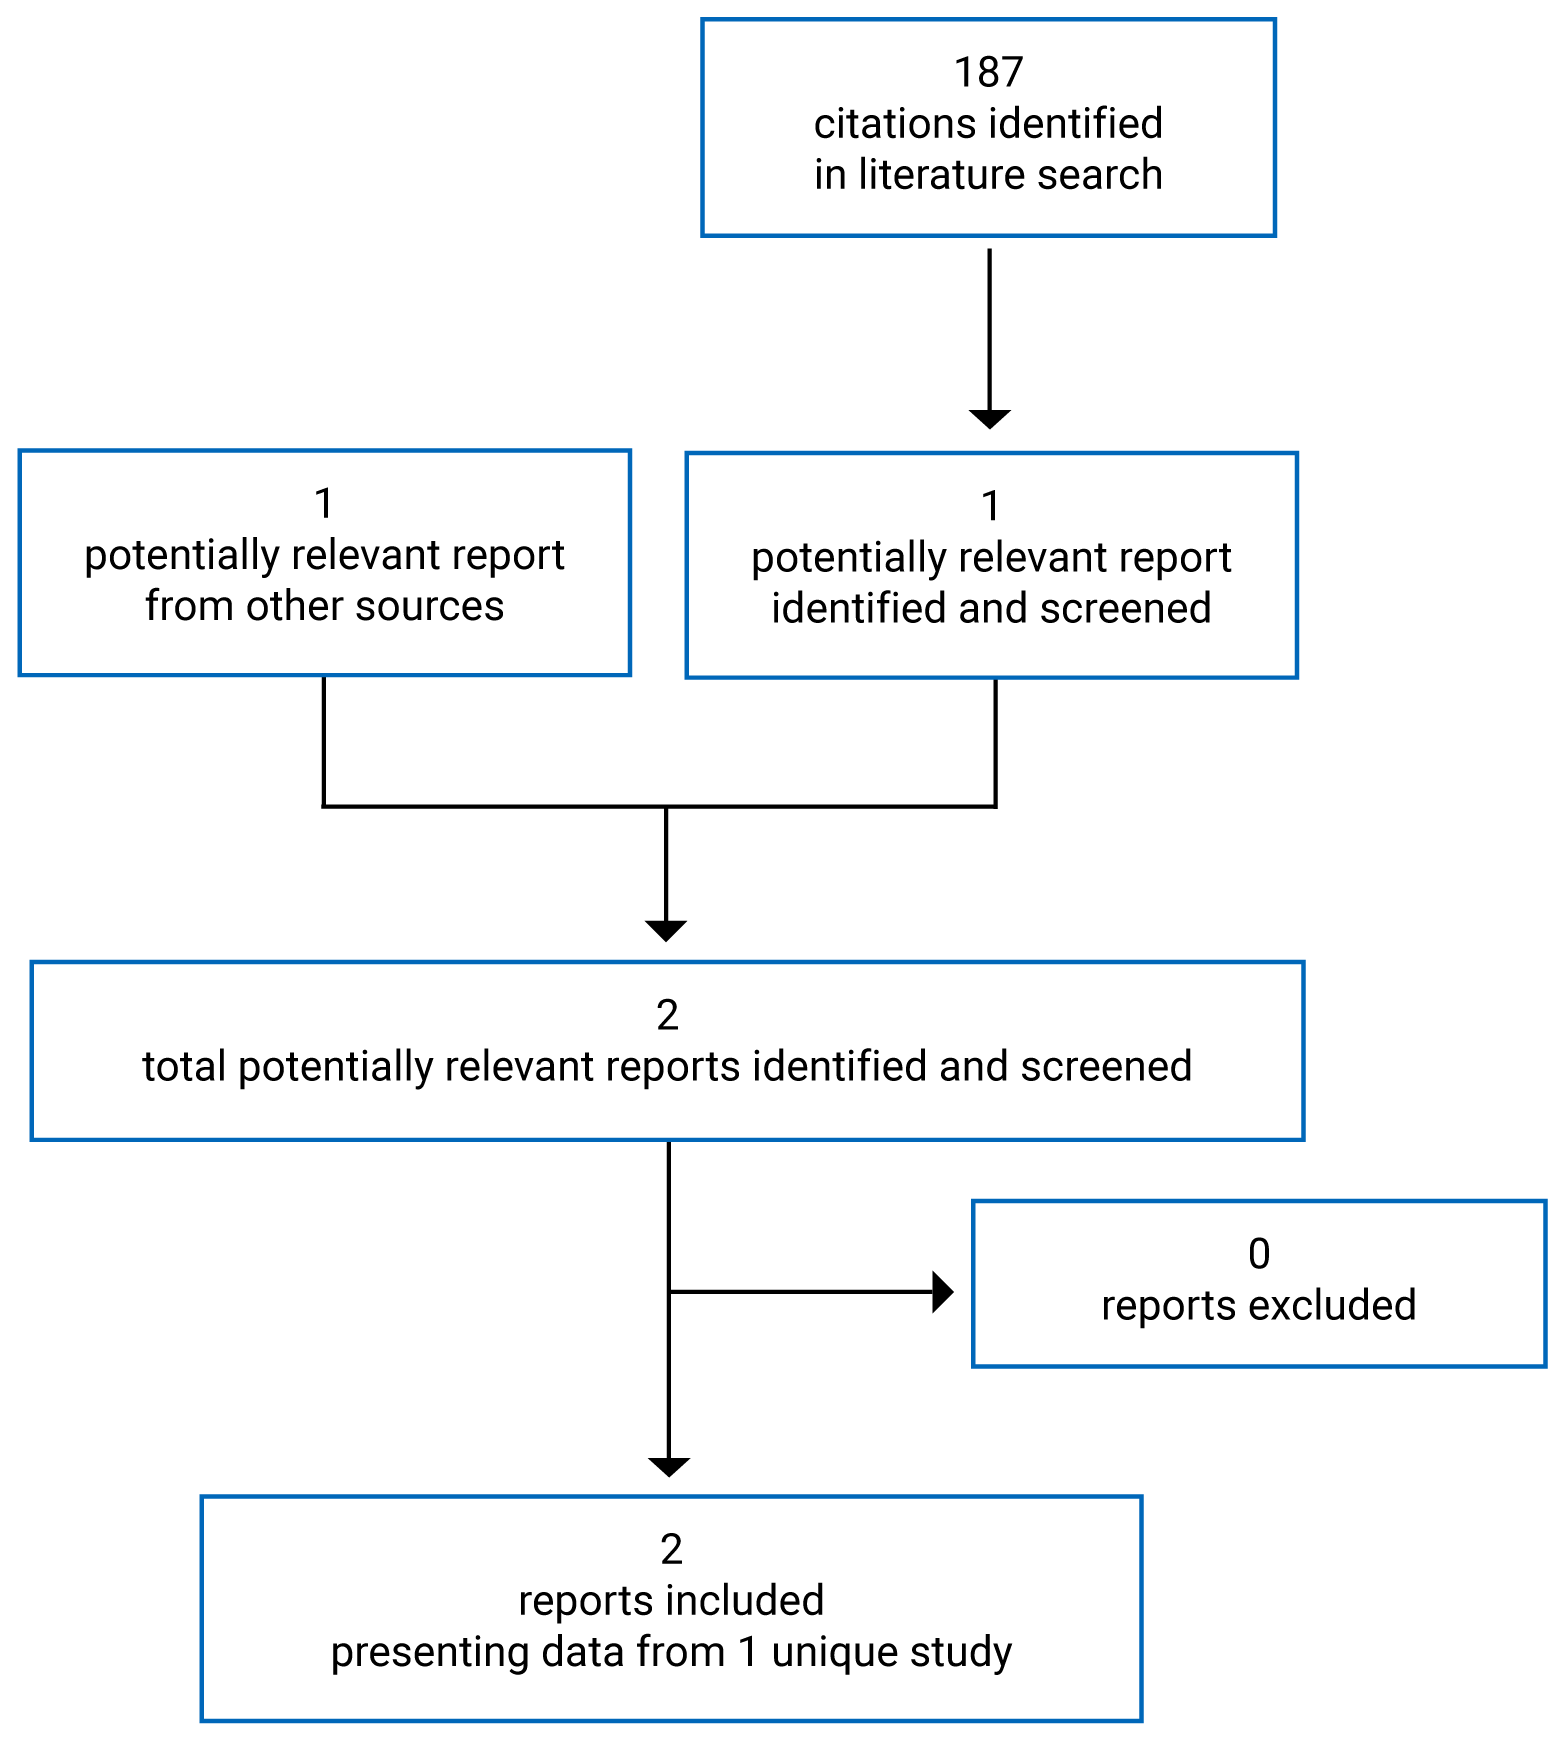
Table 6: Details of the CLEAR Study
Detail | CLEAR trial |
|---|---|
Design and population | |
Study design | Multi-centre, open-label, parallel-arm, randomized, phase III trial |
Locations | North America (41, including 6 in Canada), Europe (93), Asia (41), and Australia (6) |
Study duration |
|
Data cut-off date | Interim analyses
|
Randomized (N) | 1,069 total:
|
Inclusion criteria |
|
Exclusion criteria |
|
Drugs | |
Intervention | Arm B: LEN 20 mg orally once daily plus PEM 200 mg intravenously every 3 weeks |
Comparator |
|
Duration | |
Phase | |
Pre-randomization phase | 28 days |
Randomization phase | Time of randomization of first patient until August 28, 2020 (interim analysis 3 cut-off) |
Extension phase | Ongoing |
Outcomes | |
Primary end point | PFS by RECIST 1.1 (assessed by IIR) |
Secondary and exploratory end points | Secondary end points:
Exploratory end points:
Safety:
Notable harms:
|
Notes | |
Publications | Motzer et al. (2021)10 |
AE = adverse event; CNS = central nervous system; CR = complete response; DCR = disease control rate; DOR = duration of response; ECOG PS = Eastern Cooperative Oncology Group Performance Score; HRQoL = health-related quality of life; IA = interim analysis; IIR = independent imaging review; LEN = lenvatinib; ORR = objective response rate; OS = overall survival; PD = pharmacodynamic; PEM = pembrolizumab; PFS = progression-free survival; PFS2 = PFS with next line of therapy; PK = pharmacokinetics; RCC = renal cell carcinoma; RECIST 1.1 = Response Evaluation Criteria in Solid Tumours Version 1.1; SUN = sunitinib; TBD = to be determined.
Note: Other reports were included in the review: FDA19 and European Medicines Agency20 reports and the proposed Canadian product monograph.1
Description of Studies
CLEAR is an ongoing multi-centre, randomized, open-label, parallel-arm, phase III study with a primary objective to compare the efficacy and safety of LEN in combination with either everolimus or PEM versus SUN as a first-line treatment for adult patients with advanced RCC. Patients enrolled at baseline were 18 years and older with a histologically or cytologically confirmed diagnosis of RCC with a clear cell component, documented evidence of advanced disease, and at least 1 measurable target lesion according to RECIST 1.1 criteria. Patients were also eligible if they had adequate liver, bone marrow, blood coagulation, and renal function; a KPS score of 70 or greater; and adequately controlled blood pressure with or without antihypertensive medications.9 The primary outcome (PFS), was assessed by an IIR and tumour response assessments were based on RECIST 1.1 guidelines. Other secondary and exploratory outcomes of interest for the CADTH review included OS, ORR, HRQoL, safety and tolerability, DOR, and DCR. Stratified randomization using an interactive voice and web response system (IxRS) was implemented across participating trial sites. Patients were stratified based on 2 predefined factors:
geographic region: region 1 (Western Europe and North America) and region 2 (rest of the world)
MSKCC prognostic groups: favourable, intermediate, and poor risk
In total, 1,417 patients were screened at baseline and 1,069 were randomized in a 1:1:1 ratio to receive 1 of 3 therapies (LEN-PEM, LEN plus everolimus, or SUN) in planned parallel treatment arms, as presented in Figure 2.
The study was first initiated on October 13, 2016, and is currently ongoing in more than 200 centres across North America (6 sites in Canada), Europe, Asia, and Australia. CLEAR is an open-label study with patients and investigators aware of the treatments being administered. Blinding of the sponsor’s personnel (Eisai clinical, biostatistics, and imaging core laboratory personnel) was achieved, and data integrity was maintained using a data integrity protection plan and an operational and communication plan. The study was conducted in 3 phases: a pre-randomization phase (with a screening and a baseline period), a randomization phase (with treatment and follow-up period), and an extension phase, which are further described subsequently.9 Figure 2 summarizes the study design of the CLEAR trial.
This CADTH review focuses on comparisons between arm B (LEN-PEM) and arm C (SUN) as outlined in the sponsor’s reimbursement request and the Health Canada indication.9
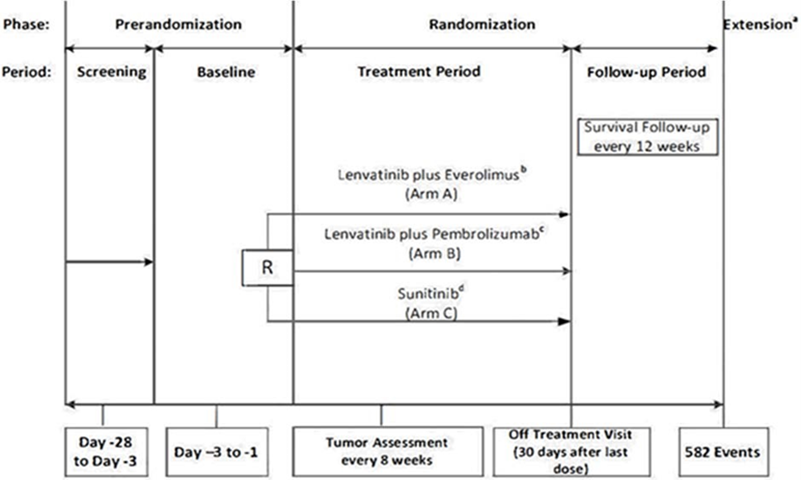
R = randomization.
a Extension phase includes a treatment and follow-up period. all patients still on treatment at the end of the randomization phase will enter the extension phase and continue to receive the same study treatment they received in the randomization phase.
b Lenvatinib 18 mg plus everolimus 5 mg given orally once daily.
c Lenvatinib 20 mg once daily plus pembrolizumab 200 mg intravenously every 3 weeks.
d Sunitinib 50 mg once daily on a schedule of 4 weeks on treatment followed by 2 weeks off.
Source: Clinical Summary Report.9
Study Phases
Pre-Randomization Phase
This phase lasted no longer than 28 days. It included a screening period (which occurred between day −28 and day −3) that allowed investigators to obtain patient consent and establish patient eligibility. The baseline period was also included in this phase and allowed confirmation of patient eligibility and establishment of baseline disease characteristics.9
Randomization
The randomization phase began when the first patient was randomized to any treatment arm in the study and ended at the data cut-off for the third planned interim analysis (final PFS analysis) on August 28, 2020. The randomization phase included a treatment period and a follow-up period.9
Treatment Period
This period began for each patient after randomization and ended with the completion of the off-treatment visit, which occurred within 30 days after the final dose of study treatment. Study treatment was administered in a 21-day cycle and these cycles were counted continuously irrespective of any dose interruptions.9
Follow-Up Period
This phase began the day after a patient had completed their off-treatment visit. This period continued if the patient was alive, unless the patient withdrew consent, was lost to follow-up, or the sponsor terminated the study. Patients were followed every 12 weeks (± 1 week) for PFS with the next line of therapy (PFS2), survival, and all subsequent anti-cancer and local standard-of-care treatments received from the investigator. Patients who had discontinued the study treatment before disease progression underwent tumour assessments every 8 weeks and a bone scan every 24 weeks until disease progression was documented and confirmed by IIR, or a new anti-cancer therapy was initiated, unless the patient withdrew consent or was lost to follow-up.9
Extension Phase
The extension phase consisted of patients still receiving study treatments (in any of the arms) or those who had transitioned into the follow-up phase by the interim data cut-off. The extension phase was divided into a treatment and follow-up period. In the treatment phase, patients still receiving a study drug at the interim analysis 3 cut-off continued treatment in the extension phase, while the follow-up phase was made up of patients whose disease had progressed during the randomization phase and patients who had discontinued any of the study drugs. Patients remained in the follow-up phase if they were alive, unless they withdrew consent, were lost to follow-up, or the study was terminated by the sponsor.9
Populations
Inclusion and Exclusion Criteria
The patients enrolled were 18 years or older and had a histologically or cytologically confirmed diagnosis of RCC with a clear cell component with documented evidence of advanced disease. They were required to have at least 1 measurable target lesion according to RECIST 1.1 guidelines; adequate liver, bone marrow, blood coagulation, and renal function; a KPS score of 70 or greater; and adequately controlled blood pressure with or without antihypertensive medications.
Patients who had received prior systemic cancer therapy for RCC, had a history of a significant cardiac impairment within the past 12 months, had a history of or current non-infectious pneumonitis that required steroid treatment, had a history of organ allograft, or had tested positive for HIV, hepatitis B, or hepatitis C were excluded from the CLEAR trial. Those with central nervous system (CNS) metastases were eligible if they had received local therapy (e.g., whole brain radiation therapy, surgery, or radiosurgery) and had discontinued the use of corticosteroids for at least 4 weeks before the initiation of study treatment.9
Baseline Characteristics
At the third interim analysis data cut-off (August 28, 2020), the median age of the patients randomized into the CLEAR study was 62 years; more males were enrolled compared with females and a majority of patients were White or of Asian descent. There were more patients with a KPS score of 80 or greater in the 2 arms of interest compared with patients with a KPS score of less than 80. Baseline characteristics were balanced across the 2 study arms with the exception of age (more patients randomized in the SUN arm were younger than 65 years compared with the LEN-PEM arm). Table 7 presents the baseline summary in the ITT population.
Table 7: Summary of Baseline Demographic and Disease Characteristics (ITT Population)
Characteristic | LEN-PEM (n = 355) | SUN (n = 357) |
|---|---|---|
Age (years), median (range) | 64 (34 to 88) | 61 (29 to 82) |
< 65 years, n (%) | 194 (54.6) | 225 (63.0) |
≥ 65 years n (%) | 161 (45.4) | 132 (37.0) |
Sex, n (%) | ||
Male | 255 (71.8) | 275 (77.0) |
Female | 100 (28.2) | 82 (23.0) |
Race, n (%) | ||
White | 263 (74.1) | 270 (75.6) |
Black or African American | 2 (0.6) | 3 (0.8) |
Asian | 81 (22.8) | 67 (18.8) |
Other | 4 (1.1) | 7 (2.0) |
Missing | 5 (1.4) | 10 (2.8) |
Body mass index (kg/m2) | ||
Mean (SD) | 27.5 (5.2) | 28.29 (5.81) |
Median | 26.9 | 27.45 |
Geographic region, n (%) | ||
Western Europe or North America | 198 (55.8) | 199 (55.7) |
Rest of the world | 157 (44.2) | 158 (44.3) |
RCC diagnosis classification, n (%) | ||
Clear cell | 354 (99.7) | 357 (100) |
Clear cell with additional featuresa | ||
Papillary | 23 (6.5) | 21 (5.9) |
Chromophobe | 2 (0.6) | 1 (0.3) |
Sarcomatoid | 28 (7.9) | 21 (5.9) |
Other | 17 (4.8) | 28 (7.8) |
Other (not clear cell) | 1 (0.3) | 0 (0.0) |
Time since diagnosis of advanced or metastatic RCC to randomization (months) | ||
Mean (SD) | 7.9 (20.8) | 9.0 (20.9) |
Median | 2.10 | 2.30 |
Karnofsky performance status score, n (%)b | ||
100 to 90 | 295 (83.1) | 294 (82.4) |
80 to 70 | 60 (16.9) | 62 (17.4) |
MSKCC prognostic risk group, n (%)c | ||
Favourable | 96 (27.0) | 97 (27.2) |
Intermediate | 227 (63.9) | 228 (63.9) |
Poor | 32 (9.0) | 32 (9.0) |
IMDC prognostic risk group, n (%)d | ||
Favourable | 110 (31.0) | 124 (34.7) |
Intermediate | 210 (59.2) | 192 (53.8) |
Poor | 33 (9.3) | 37 (10.4) |
Could not be evaluated | 2 (0.6) | 4 (1.1) |
PD-L1 combined positive score, n (%)e | ||
≥ 1 | 107 (30.1) | 119 (33.3) |
< 1 | 112 (31.5) | 103 (28.9) |
Not available | 136 (38.3) | 135 (37.8) |
Number of metastatic organs or sites, n (%)f | ||
0 | 5 (1.4) | 6 (1.7) |
1 | 119 (33.5) | 114 (31.9) |
2 | 129 (36.3) | 127 (35.6) |
≥ 3 | 102 (28.7) | 109 (30.5) |
Missing | 0 (0.0) | 1 (0.3) |
Site of metastasis, n (%)g | ||
Lung | 249 (70.1) | 239 (66.9) |
Lymph node | 170 (47.9) | 159 (44.5) |
Bone | 85 (23.9) | 97 (27.2) |
Liver | 60 (16.9) | 61 (17.1) |
Previous nephrectomy, n (%) | 262 (73.8) | 275 (77.0) |
Stage of cancer at diagnosis, n (%) | ||
I | 50 (14.1) | 35 (9.8) |
II | 16 (4.5) | 21 (5.9) |
III | 60 (16.9) | 67 (18.8) |
IV | 178 (50.1) | 195 (54.6) |
Not assigned | 51 (14.4) | 39 (10.9) |
IMDC = International Metastatic Renal Cell Carcinoma Database Consortium; ITT = intention to treat; LEN = lenvatinib; MSKCC = Memorial Sloan Kettering Cancer Center; PD-L1 = programmed cell death 1 ligand 1; PEM = pembrolizumab; RCC = renal cell carcinoma; SD = standard deviation; SUN = sunitinib.
Note: Percentages may not total 100 because of rounding. One patient in the LEN-PEM group had carcinoma without a clear cell component. Data cut-off date: August 28, 2020.
aPatients may be represented in more than 1 category.
bKarnofsky Performance Status scores range from 0 to 100, with lower scores indicating greater disability. Scores were missing for 2 patients: 1 in the LEN plus everolimus group and 1 in the SUN group.
cAn MSKCC score of 0 indicates favourable risk, a score of 1 or 2 indicates intermediate risk, and a score of 3 or higher indicates poor risk.
dAn IMDC score of 0 indicates favourable risk, a score of 1 or 2 indicates intermediate risk, and a score of 3 to 6 indicates poor risk.
ePD-L1 expression was assessed with the PD-L1 immunohistochemistry 22C3 pharmDx assay (Agilent Technologies) and reported as the combined positive score, defined as the number of PD-L1–staining cells (tumour cells, lymphocytes, and macrophages) divided by the total number of viable tumour cells, multiplied by 100.
fKidneys were not included in the number of metastatic organs or sites. The only tumour location in the kidney applied to 3 patients (0.8%) in the LEN plus everolimus group, 4 patients (1.1%) in the LEN-PEM group, and 3 patients (0.8%) in the SUN group.
gFour common sites of metastasis are shown. Patients may have had metastasis at more than 1 site.
Source: Clinical Study Report9 and Motzer et al. (2021).10
Interventions
Patients were randomized to receive treatments in 1 of 3 study arms:
LEN plus everolimus (arm A), consisting of LEN 18 mg orally once daily plus everolimus 5 mg orally once daily in each 21-day cycle
LEN-PEM (arm B), consisting of LEN 20 mg orally once daily plus PEM 200 mg IV every 3 weeks during each 21-day cycle
SUN (arm C), consisting of SUN 50 mg orally once daily taken for 4 weeks on treatment followed by 2 weeks off.
In the LEN-PEM treatment arm, the starting dose of LEN was 20 mg per day. Planned LEN dose reductions were designed to occur in succession based on the patient’s previous dose level (14 mg, 10 mg, and 8 mg per day and so forth). The starting dose of PEM was 200 mg per administration. PEM was withheld, interrupted, or discontinued in the event of a drug-related toxicity and severe or life-threatening AEs. In the SUN treatment arm, the starting dose of SUN was 50 mg per day based on 4 weeks on and 2 weeks off treatment schedule. SUN dose reductions were allowed in succession based on the patient’s previous dose level (37.5 mg per day or 25 mg per day on a schedule of 4 weeks on and 2 weeks off treatment). Once a dose of a study drug had been reduced, it was not increased at a later date unless the dose had been mistakenly decreased; in that situation, the sponsor’s approval was required to increase the dose.9
Treatment Discontinuation Criteria
Patients received the study drugs during the treatment period until disease progression confirmed by independent review, loss of clinical benefit based on investigator assessment (upon confirmation by IIR and imaging core laboratory), development of unacceptable toxicity, patient request, withdrawal of consent, completion of 35 treatments (approximately 2 years) with PEM, or study termination by the sponsor.
Treatment discontinuation during the treatment period was allowed for patients who had:
attained a confirmed CR
been treated for at least 8 cycles (at least 24 weeks) with PEM
received at least 2 treatments with PEM beyond the date when the initial CR was declared.
In the presence of clinical benefit, patients in the LEN-PEM arm who had discontinued PEM were allowed to continue treatment with LEN alone unless any of the other discontinuation criteria applied. Patients were also permitted to continue receiving PEM alone after discontinuing LEN. Patients were permitted to continue the study treatment beyond RECIST 1.1–defined disease progression as long as the treating investigator considered that the patient was tolerating the study drug and had clinical benefit. Patients who discontinued treatment owing to disease progression or loss of clinical benefit could receive alternative treatment at the investigator’s discretion.9
Concomitant Medication
Concomitant medications were permitted and properly documented in the CLEAR trial (Table 14). Patients were prohibited from using other anti-cancer therapies during the treatment phase of the trial. Prohibited therapies included chemotherapy, tyrosine kinase inhibitors, antitumour interventions, cancer immunotherapy, and radiotherapy (except for palliative radiotherapy for up to 2 painful pre-existing, non-target bone metastases). Patients were also discouraged from receiving other concurrent investigational drugs, live vaccines, and systemic glucocorticoids (except for the purpose of modulating AE symptoms of immunologic etiology) during the screening and treatment phase. Physiologic doses of corticosteroids (up to 10 mg per day) were permitted.9
Outcomes
A list of the efficacy end points identified in the CADTH review protocol that were assessed in the CLEAR trial and included in this review is provided in Table 8. These outcomes are standard outcomes approved by regulatory agencies (Health Canada, FDA,21 and EMA22) for oncology trials. They were also considered clinically meaningful to patients by the clinical experts and clinician groups consulted during the review.
Table 8: Summary of Outcomes of Interest Identified in the CADTH Review Protocol
Outcome measure | CLEAR trial end point | Definition | Included in hierarchical multiple-testing procedure |
|---|---|---|---|
PFS | Primary | Defined as the time from the date of randomization to the date of the first documentation of disease progression or death (whichever occurred first) using RECIST 1.1. | Yes |
ORR | Secondary | Defined as the proportion of patients who have a best overall response of CR or PR as determined by IIR using RECIST 1.1. ORR was calculated for confirmed CR and PR, and for confirmed and unconfirmed CR and PR. Confirmed CR and PR will be primary for ORR analysis. | Yes |
OS | Secondary | Defined as the time from the date of randomization to the date of death from any cause. Patients who are lost to follow-up and those who are alive at the date of data cut-off will be censored at the date the patient was last known to be alive or the data cut-off date, whichever occurs first. | Yes |
DOR | Exploratory | Defined as the time from the date of a CR or PR response by IIR and investigator assessment was first documented until the date of the first documentation of disease progression or date of death from any case. | No |
HRQoL | Secondary | The Functional Assessment of Cancer Therapy Kidney Syndrome Index – Disease Related Symptoms (FKSI-DRS), the European Organisation for Research and Treatment of Cancer (EORTC) QLQ-C30 and the EQ-5D-3L instruments were used to measure quality of life in patients taking part in the CLEAR trial. | No |
DCR | Exploratory | The proportion of patients who have a best overall response of CR or PR or stable disease by IIR and investigator assessment. Stable disease must be achieved at ≥ 7 weeks after randomization to be considered a best overall response. | No |
Time to treatment discontinuation | Exploratory | Not investigated in the trial. | No |
Safety | Secondary | Safety was assessed by summarizing the incidence of TEAEs and SAEs together with all other safety parameters. The proportion of patients who discontinued treatment due to toxicity was investigated in the safety analysis. It was defined as the proportion of patients who discontinued study treatment due to TEAEs. | No |
CR = complete response; DCR = disease control rate; DOR = duration of objective response; HRQoL = health-related quality of life; IIR = independent imaging review; ORR = objective response rate; OS = overall survival; QLQ-C30 = Quality of Life Questionnaire Core 30; PFS = progression-free survival; PR = partial response; RECIST 1.1 = Response Evaluation Criteria in Solid Tumours Version 1.1; SAE = serious adverse event; TEAE = treatment-emergent adverse event.
Source: Clinical Study Report.9
Efficacy Measurement for Primary and Secondary Outcomes
Tumour assessments (consisting of CT scans of the chest and CT or MRI scans of the abdomen, pelvis, and other known or suspected sites of disease) were performed at pre-randomization, every 8 weeks from the date of randomization in treatment cycles in the randomization phase, and as per investigator decision in the extension phase. For each patient, the same imaging modality and image-acquisition protocol was used consistently across all time points. Bone scans were performed within 6 weeks before randomization, and those performed within a target of 1 week but no more than 2 weeks following a CR were assessed by the investigator. Brain scans were performed at screening and as clinically indicated thereafter, and within a target of 1 week but no more than 2 weeks following achievement of a CR. For patients with a history of protocol-eligible treated brain metastases, a brain scan was required at all tumour assessment time points.9
All patients were permitted to continue treatment beyond initial RECIST 1.1–defined progression as long as the investigator believed that the patient was still receiving clinical benefit and was tolerating the study drug treatment. Clinical benefit was defined as:
absence of signs and symptoms of disease progression (including laboratory results)
no decline in performance status
absence of rapid progression of disease
absence of progressive tumour(s) at critical sites requiring urgent intervention (e.g., spinal cord compression).
Patients who discontinued study treatment without disease progression in the randomization phase were allowed to continue to undergo tumour assessments every 8 weeks and bone scans every 24 weeks in the follow-up period until disease progression was documented or another anti-cancer therapy was initiated.
Patients who discontinued study treatment without tumour progression in the extension phase had tumour assessments performed as clinically indicated following the prevailing local standard of care, at the investigator’s discretion. Copies of tumour assessment scans were no longer required to be sent to the imaging core laboratory and an independent review was not conducted in the extension phase.9
Health-Related Quality of Life
HRQoL measures were assessed using the generic cancer HRQoL instrument (EORTC QLQ-C30), the RCC-specific HRQoL instrument (FKSI-DRS), and the generic HRQoL instrument, EQ 5D-3L. A detailed discussion and critical appraisal of these outcomes is available in Appendix 2.
Functional Assessment of Cancer Therapy Kidney Symptom Index – Disease Related Symptoms
The FKSI-DRS is a kidney cancer–specific, patient-reported instrument that evaluates disease-related symptoms.23 The questionnaire consists of 9 questions that assess the symptoms of kidney cancer deemed by patients and clinicians to be the most important to monitor (lack of energy, pain, weight loss, bone pain, fatigue, shortness of breath, cough, fever, blood in urine) when treating advanced kidney cancer.23 Evidence of convergent validity and discriminative validity, internal reliability, and adequate responsiveness to change has been demonstrated in patients with RCC. The minimal important difference (MID) estimated using different anchors ranged from 0.62 to 3 points.
EORTC Quality of Life Questionnaire Core 30
The EORTC QLQ-C30 is 1 of the most commonly used patient-reported outcome measures in oncology clinical trials.24 It is a cancer-specific, multi-dimensional measure of HRQoL that is designed to assess the change in HRQoL in clinical trial participants in response to treatments.25 The QLQ-C30 consists of 30 questions that are scored to create 5 multi-item function scales (physical, role, cognitive, emotional, and social), 3 multi-item symptom scales (fatigue, pain, nausea and vomiting), 6 single-item symptom scales (dyspnea, insomnia, appetite loss, constipation, diarrhea, and financial impact) and a 2-item global health status/QoL scale.26 The validity, reliability, and responsiveness of the EORTC QLQ-C30 has not been evaluated in patients with advanced RCC.
EQ-5D-3L
The EQ-5D-3L is a generic, utility-based measure of HRQoL comprising 2 components: the EuroQol descriptive system and the EuroQol VAS.27 For the EuroQol descriptive system, respondents are assigned a 5-digit descriptive health state based on their report on 5 health status dimensions that day (mobility, self-care, usual activities, pain/discomfort, and anxiety/depression).27 Three response options are available for each dimension to reflect the 3 possible levels of functioning (level 1 = no problems, level 2 = some problems, level 3 = extreme problems). An index score is then calculated by applying a population-specific (e.g., UK, US) utility function to the health state vector. A score of 0 represents the health state “dead” and 1.0 reflects “perfect health.” A negative score represents the health state that society considers to be “worse than dead.”27 The validity, reliability, and responsiveness of the EQ-5D-3L has not been evaluated in patients with advanced RCC.
Patients enrolled in the CLEAR trial completed questionnaires at baseline, cycle 2 day 1, cycle 3 day 1, and cycle 4 day 1 to day 1 of the last cycle, and when they were off treatment. Change of QoL from baseline to different cycle dates was assessed using a mixed-model analysis. The least squares mean change from baseline with the 95% CI was calculated.
TTD was defined as the number of weeks between randomization and the first deterioration event. A deterioration event for any particular HRQoL outcome was defined as a detrimental change in score, relative to baseline, that exceeded the MID for that score. TTD was calculated and compared using the Kaplan-Meier method stratified log-rank tests. TUDD was defined as the number of weeks between randomization and the earliest deterioration event with no subsequent recovery above the deterioration threshold or no subsequent HRQoL assessment data.
Thresholds defined in the study:
FKSI-DRS: Decrease of 3 points or greater
EORTC QLQ-C30 functional and the global health status/QoL score: Decrease of 10 points or greater
EORTC QLQ-C30 symptom scores: Increase of 10 points or greater
EQ-5D-3L index: Decrease of 0.08 points or greater; EQ-5D-3L Visual Analogue Scale: decrease of 7 points or greater.
No adjustments for multiplicity were performed during the analysis. All P values obtained were 2-sided and the CIs were nominal and descriptive. All randomized patients with available HRQoL data who had received at least 1 dose of the study treatment were included in the analysis unless otherwise specified.
Harms Outcomes
All safety analyses were performed on the safety analysis set. Safety data presented by treatment groups were summarized on an “as treated” basis using descriptive statistics. Safety variables assessed included treatment-emergent adverse events (TEAEs), clinical laboratory parameters, vital signs, 12-lead electrocardiogram results, and echocardiogram results, including left ventricular ejection fraction. Categorical variables were summarized by number and percentage. Continuous variables were summarized using descriptive statistics. Due to the longer period of follow-up at interim analysis 3 (August 28, 2020, data cut-off and final PFS analysis) compared with interim analysis 2 (November 15, 2019, data cut-off), safety analyses presented in this report are based on the August 28, 2020, cut-off.9
Statistical Analysis
Sample Size and Power Calculation
The sample size for the study was estimated based on the primary end point, PFS, and it was estimated that approximately 1,050 patients would be randomized into the 3 arms in a 1:1:1 ratio and stratified based on geographic regions (Western Europe and North America versus Other) and MSKCC prognostic groups (favourable, intermediate, and poor risk).9
The same treatment effect was assumed for the 2 planned primary comparisons between the 3 study arms (LEN plus everolimus [arm A] and LEN-PEM [arm B], each compared with SUN alone [arm C]). Based on the assumption that a median PFS of 12.3 months would be obtained in the SUN arm, and an HR of 0.714 estimated between the LEN plus everolimus versus SUN and lenvatinib plus PEM versus SUN arms, the sponsor presumed that this would correspond to a 40% improvement (4.9 months) in median PFS from 12.3 months to 17.2 months in both the LEN plus everolimus versus SUN and LEN-PEM versus SUN comparisons. A yearly loss of PFS event rate of 22% was assumed.
For the 2 PFS comparisons (1 for each test arm), an alpha of 0.0499 (2-sided) was split, as initial allocations, into an alpha of 0.045 for the comparison between LEN-PEM and SUN, and an alpha of 0.0049 for the comparison between LEN plus everolimus versus SUN.9
The study was designed to achieve 90% power at an alpha of 0.045 to detect a statistically significant difference in PFS between LEN-PEM and SUN. A total of 388 PFS events were expected to occur over both the LEN-PEM and the SUN arms for the final PFS analysis and the same number (388) for the final PFS analysis comparison between LEN plus everolimus versus SUN (the same number of events were expected to occur over both arms).
The power to detect a statistically significant difference in PFS between LEN plus everolimus versus SUN was approximately 70% at the initial assigned alpha of 0.0049. It was expected to be at least 90% after alpha reallocation when the hypothesis tests of PFS and OS in the comparison of LEN-PEM and SUN were considered statistically significant.
In the calculation of power for the PFS analysis, the sponsor assumed that 1 interim analysis of PFS would be performed at the 80% information fraction and a Lan-DeMets spending function with an O’Brien-Fleming boundary would be used between the interim and final analysis of PFS. The analysis was planned for approximately 4 months after the last patient was randomized when approximately 310 PFS events should have occurred in the LEN-PEM arm and the SUN arm.
For the OS analysis, a total of 304 deaths in each comparison (456 death events among the 3 arms) were expected in the final OS analysis. For the OS testing, it was assumed that when the corresponding PFS testing was considered statistically significant at the initial assigned alpha, the study would provide 80% power to detect a statistically significant difference at an alpha level of 0.045 for the comparison between LEN-PEM and SUN, and 50% power at an alpha level of 0.0049 for the comparison between LEN plus everolimus versus SUN. The following assumptions were made for the OS power calculations:
The HR assumed was 0.70 (a median OS of 54.1 months in the LEN plus everolimus arm or LEN-PEM arm, and 37.9 months in the SUN arm)
interim analyses occurred when the information fraction for death events was approximately 45%, 60%, and 80%
a Lan-DeMets spending function with Pocock boundary was used in the sponsor’s analysis to control alpha levels
the yearly rate for loss to follow-up was assumed to be 3%
Based on the planned sample size and given assumptions, the final analysis of OS was expected to occur approximately 69 months after the first patient was randomly assigned to treatment.
The ORR was obtained by assuming an ORR of 32% in arm C and 48% in the LEN plus everolimus arm or the LEN-PEM arm; the study was expected to provide at least a 95% power to detect a difference with alpha reallocation when testing for PFS and OS was positive for each comparison of LEN-PEM versus SUN, and LEN plus everolimus versus SUN.9
Analyses, Multiple-Testing Procedure, and Alpha Spending
Multiplicity testing adjustments were made using the overall familywise error rate for the primary outcome (PFS) and 2 secondary outcomes (OS and ORR). The Maurer and Bretz approach presented in Figure 3 was implemented for the primary end point and key secondary end points (OS and ORR). Multiplicity adjustments were not made for other secondary end points or exploratory analyses. Subgroup analyses were considered exploratory outcomes and, thus, were not accounted for multiplicity (no adjustments made). An alpha of 0.0001 was subtracted from the total alpha of 0.05 to account for the interim analysis of ORR from the LEN-PEM arm. Figure 3 shows the initial alpha allocation (the remaining alpha was 0.0499) for each hypothesis and the graphical approach for multiple analyses of PFS, OS, and ORR.9
Figure 3: Graphical Approach to Control Familywise Error Rate for Testing Primary and Key Secondary End Points
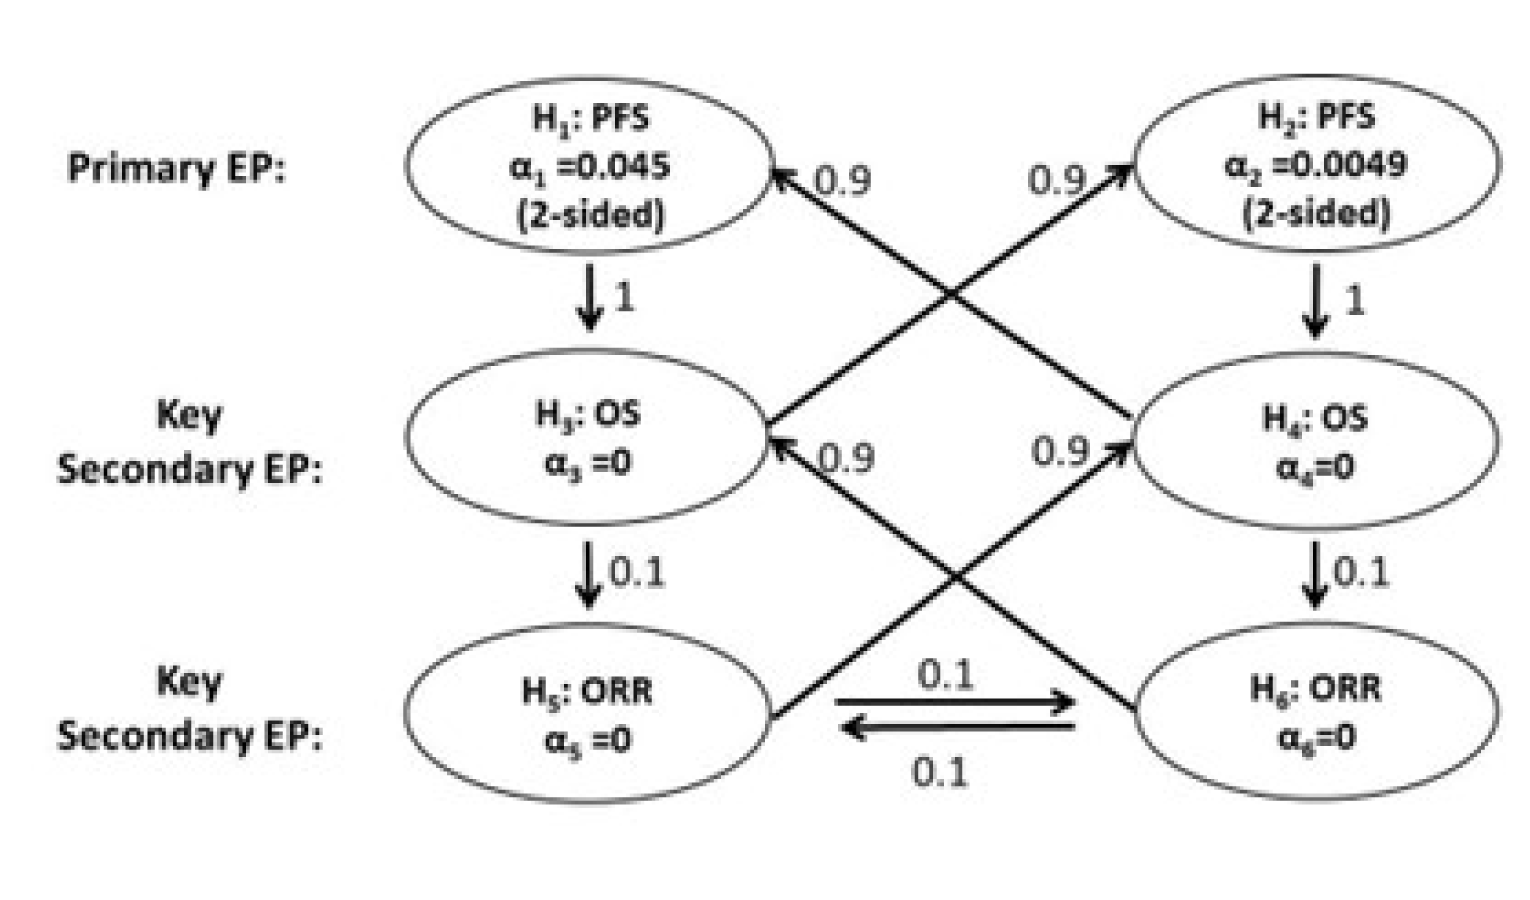
α = alpha; EP = end point; ORR = objective response rate; OS = overall survival; PFS = progression-free survival.
Note: Hypothesis 1 (H1): The PFS of the lenvatinib plus pembrolizumab arm is superior to that of the sunitinib arm. Hypothesis 2 (H2): The PFS of the lenvatinib + everolimus arm is superior to that of the sunitinib arm. Hypothesis 3 (H3): The OS of the lenvatinib plus pembrolizumab arm is superior to that of the sunitinib arm. Hypothesis 4 (H4): The OS of the lenvatinib plus everolimus arm is superior to that of the sunitinib arm. Hypothesis 5 (H5): The ORR of the lenvatinib plus pembrolizumab arm is superior to that of the sunitinib arm. Hypothesis 6 (H6): The ORR of the lenvatinib plus everolimus arm is superior to that of the sunitinib arm.
Source: Clinical Study Report.9
Adjustments for Covariates
Cox proportional hazard models and log-rank tests were obtained for PFS and OS, and the Cochrane-Mantel-Haenszel test was used to determine the ORR, stratified by region (Western Europe and North America, rest of world), and MSKCC risk group (favourable, intermediate, and poor risk). Analyses of PFS included other covariates of interest based on the subgroups.
Planned Analyses
There were 4 planned interim analyses and 1 planned final study analysis, which are summarized in Table 9. These interim efficacy analyses were conducted by an independent statistical group with no other responsibilities for the study. The safety monitoring was conducted by an independent data management committee (DMC) that had exclusive access to data with treatment information.9 The frequency of the safety reviews was defined in the DMC charter. The safety monitoring and interim analyses for PFS and OS were planned to assess whether to stop the trial based on the review of the safety and efficacy findings with treatment information.
Table 9: Summary of Interim and Final Efficacy Analyses
Interim analysis number | Analysis | End point(s) | Data cut-off date | Timing | Estimated time after first patient randomized |
|---|---|---|---|---|---|
1 | Interim analysis of ORR and DOR (the first 88 patients from arm B) 89 patients identified | ORR, DOR | December 6, 2018 | Median follow-up of 12 months and a minimum DOR follow-up of 6 months | ~28 months |
2 | Interim analysis of PFS; interim analysis of OS | PFS, OS, ORRa | November 15, 2019 | Trigger: ~4 months after the last patient randomized and ~310 (80% IF) PFS events observed in arms B and C (estimated to have ~140 [45% IF] deaths observed for each comparison) | ~38 months |
3 | Final analysis of PFS; interim analysis of OS | PFS, OS | August 28, 2020 | Trigger: ~388 PFS events observed for each comparison (estimated to have 182 [60% IF] deaths observed for each comparison) | ~45 months |
4 | Interim analysis of OS | OS | TBD | Trigger: ~243 (80% IF) deaths observed for each comparison | ~57 months |
5 | Final analysis of OS | OS | TBD | Trigger: ~304 deaths observed for each comparison | ~69 months |
DOR = duration of response; IF = information fraction; OS = overall survival; ORR = objective response rate; progression-free survival; TBD = to be determined.
aThe P value for hypothesis testing of ORR will be based on the ORR data at analysis number 2.
Source: Clinical Study Report.9
Primary Outcome Analysis
PFS was assessed by IIR using the RECIST 1.1 guidelines. The Lan-DeMets spending function with an O’Brien-Fleming boundary was used to determine the nominal alpha level for each PFS comparison at the first interim analysis of PFS (corresponds to interim analysis 2) (nominal alpha for hypothesis 1 [H1] = 0.0216 and H2 = 0.0014) and final analysis of PFS at interim analysis 3 (nominal alpha = 0.0386 for H1 and 0.0046 for H2). For each comparison, statistical significance could be claimed based on either the interim analysis or final analysis for PFS at the specified alpha levels (Table 9).9 Statistical significance was observed at interim analysis 2 and was consistent with PFS findings at interim analysis 3.
The PFS curve in each treatment group was estimated using the Kaplan-Meier method and the difference in PFS for each of the 2 primary comparisons was tested by stratified log-rank test. The tests were stratified by geographic region and MSKCC prognostic groups. The HR (for LEN plus everolimus relative to SUN and for LEN-PEM relative to SUN) and the corresponding 95% CIs were estimated using the Cox regression model and the Efron method for ties, stratified by the factors used for stratified randomization. The median PFS, and the PFS rates at various time points, were calculated using the Kaplan-Meier product-limit estimates for each treatment arm and presented with 2-sided 95% CIs.
The final analysis of PFS was performed when approximately 388 PFS events assessed by the IIR were observed for each comparison. A graphical approach was used to control the familywise error rate at a 2-sided alpha of 0.0499 for multiple comparisons, including PFS, OS, and ORR comparisons of LEN-PEM versus SUN and LEN plus everolimus versus SUN. For each comparison, a statistical significance was claimed based on either the interim or final analysis of PFS at specified alpha levels.
PFS censoring rules and the definition of progression date were based on FDA guidance21 and EMA guidelines.22 The ITT dataset was used to determine the primary outcome, and the secondary efficacy outcomes analyses were based on the per-protocol dataset. Censoring rules for PFS are captured in Table 10.
Table 10: Censoring Rules for Derivation of Progression-Free Survival
Situation | Date of progression or censoring | Outcome |
|---|---|---|
No baseline or post-baseline tumour assessments | Date of randomization | Censored |
Progression documented between scheduled visits | Date of first radiologic PD assessment | Progressed |
No progression at the time of data cut-off | Date of last adequate radiologic assessment before or on date of data cut-off | Censored |
New anti-cancer treatment started | Date of last adequate radiologic assessment before or on date of new anti-cancer treatment | Censored |
Death before first PD assessment | Date of death | Progressed |
Death between adequate assessmenta | Date of death | Progressed |
Death or progression after more than 1 missed visit or tumour assessmentb | Date of last adequate radiologic assessment before missed tumour assessments | Censored |
CR = complete response; PD = progressive disease; PFS = progression-free survival; PR = partial response; SD = stable disease.
aAdequate tumour assessment is a radiologic assessment of CR, PR, SD, non-CR or non-PD, or PD as determined by investigators at regular intervals as defined in the protocol. Any tumour assessments after new anti-cancer treatment starts will be removed in the definition of PFS.
bMore than 1 missed visit or adequate tumour assessment is defined as a duration between the last adequate tumour assessment and PD or death of longer than 16 weeks plus 10 days (tumour assessment window) minus 1 day, which is 121 days for patients on every 8-week tumour assessment schedule in this study.
Source: Clinical Study Report.9
Sensitivity Analyses
Sensitivity analyses were performed using an unstratified log-rank test for the comparisons of the PFS of LEN plus everolimus versus SUN alone, and LEN-PEM versus SUN alone, as well as using the unstratified Cox proportional hazards model with the Efron method used for ties, including treatment arms as a single covariate for the estimation of the HR.
The additional sensitivity analyses performed included the following:
The actual reported date of progression by IIR or death was used to define PFS, regardless of missing assessments or use of new anti-cancer therapy (as per the EMA guidance document).22
The radiologic assessment data (as assessed by the investigator) and death were used to define PFS.
The different derivation rule was used when a patient had more than 1 consecutive missed visit or tumour assessment and death or progression followed immediately after more than 1 missed visit or tumour assessment (i.e., if a patient missed 2 or more tumour assessments right before disease progression or death), the patient was censored on the date of the last adequate tumour assessment before disease progression or death. If a patient was censored by both this criterion and the anti-cancer treatment criterion, the earliest censoring date was used.
Subgroup Analyses
HRs and 2-sided 95% CIs were derived for comparing PFS, OS, and ORR (by the IIR and investigator) in the study arms (the LEN plus everolimus arm versus SUN, or the LEN-PEM arm versus SUN). Forest plots with the median PFS and corresponding 95% CIs were constructed for each predefined subgroup analysis. Similar summary statistics and plots were determined for the OS. The OR and a 2-sided 95% CI for comparing ORR as assessed by IIR was also summarized and presented in forest plots. The following subgroups were investigated in the CLEAR trial:
age group (< 65 years, ≥ 65 years)
sex (male, female)
race (White, Asian, all others)
geographic region (Western Europe and North America, rest of world) per IxRS
MSKCC risk group (favourable, intermediate, poor) per IxRS
IMDC risk group (favourable, intermediate, poor)
number of metastatic sites per IIR (0, 1, 2, ≥ 3)
KPS score group (100 to 90, 80 to 70)
baseline bone metastasis (yes, no)
baseline liver metastasis (yes, no)
baseline lung metastasis (yes, no)
PD-L1 status (combined positive score ≥ 1, < 1, or not available)
prior nephrectomy (yes, no)
histologic clear component featuring sarcomatoid (yes, no).
This CADTH review identified 3 subgroups of interest in the protocol that were based on the IMDC prognostic model (favourable, intermediate, and poor risk).
Secondary Outcome Analysis
Table 11 presents the statistical analyses of the key efficacy outcomes investigated in the CLEAR trial.9
Table 11: Statistical Analysis of Efficacy End Points in the CLEAR Trial
End point | Statistical model | Adjustment factors | Sensitivity analyses |
|---|---|---|---|
PFS | Cox proportional hazards models and log-rank tests | Yes | Unstratified log-rank tests; unstratified Cox proportional hazards model with Efron method used for ties |
ORR |
| Yes | None |
OS | Cox proportional hazards models and log-rank tests | Yes | None |
DOR | None | No | None |
HRQoL | None | No | None |
Disease control rate | None | No | None |
CI = confidence interval; DOR = duration of response; HRQoL = health-related quality of life; KM = Kaplan-Meier; NR = not reported; ORR = objective response rate; OS = overall survival; PFS = progression-free survival.
Source: Clinical Study Report.9
Overall Survival
The OS between treatment arms was determined using the stratified log-rank test with geographic region and MSKCC prognostic groups as strata. The HR and its 95% CI comparing LEN plus everolimus versus SUN and LEN-PEM versus SUN was estimated using the stratified Cox proportional hazards model and the Efron method for ties, stratified by geographic region and MSKCC prognostic groups. Median OS and the OS rate at various time points with 2-sided 95% CIs were calculated using the Kaplan-Meier product-limit estimates for each treatment arm, and Kaplan-Meier estimates of OS were plotted over time. The Lan-DeMets spending function with Pocock boundary was used to control alpha levels in the interim and final analyses of OS. In the first 2 interim analyses, the OS was determined based on approximately 45% and 60% of the information fractions on OS events (Table 9). All events related to death were included irrespective of whether patients were on therapy or had discontinued. Patients still alive at data cut-off were censored, including those who were discontinued because they were lost to follow-up or withdrew consent (censored at their last date known to be alive).
Objective Response Rate
The ORR (CR plus PR) was estimated based on tumour response according to IIR assessment using the RECIST 1.1 guidelines. It was calculated with an exact 95% CI using the Clopper and Pearson method. Differences between treatment arms (the LEN plus everolimus arm versus SUN, and the LEN-PEM arm versus SUN) were tested using the Cochran-Mantel-Haenszel test, stratified by geographic region and MSKCC prognostic groups. A 2-sided 95% CI for the OR and the difference in ORR were calculated. A P value was calculated for the hypothesis test based on the ORR data at the time of the PFS analysis.
Duration of Response
The median DOR among responders for each treatment arm was determined along with corresponding 2-sided 95% CIs. Censoring rules for DOR were the same as those for PFS.
Disease Control Rate
DCR was calculated with exact 95% CIs using the Clopper and Pearson method. The differences and ORs of the previously described rates (OS, ORR, DOR) between treatment arms and corresponding 2-sided 95% CIs were calculated. These analyses were performed based on both IIR and investigator assessments. The null hypothesis of no difference in DCR and clinical benefit rate comparing the LEN plus everolimus arm versus the SUN and LEN-PEM arm versus SUN alone was tested using the Cochran-Mantel-Haenszel test stratified by geographic region and MSKCC prognostic groups.9
Handling of Missing Data, Dropouts, and Outliers
AEs with incomplete start dates were considered treatment-emergent if the:
day and month are missing and the year is equal to or after the year of the first dose date
day is missing and the year is after the year of the first dose
day is missing and the year is equal to the year of the first dose date and the month is equal to or after the month of the first dose date
year is missing
complete date is missing.
Medications were considered concomitant if the:
day and month are missing and the year is equal to or after the year of the first dose date
day is missing and the year is after the year of the first dose
day is missing and the year is equal to the year of the first dose date and the month is equal to or after the month of the first dose date
year is missing
complete date is missing.
For incomplete dates involving efficacy and other safety data, a conservative imputation was calculated as needed.9
Analysis Populations
Full analysis set: used for all efficacy analyses (ITT population) and consisted of all randomized patients regardless of the treatment received.
Per-protocol set: used for all secondary analyses for efficacy end points. It was composed of patients who had received at least 1 dose of the study drug, had no major protocol deviations, and had a baseline and at least 1 post-baseline tumour assessment
Safety analysis set: consisted of patients who had received at least 1 dose of any study drug and the analysis was based on the as-treated principle.
HRQoL analysis set: all patients who had any HRQoL data and received at least 1 dose of the study treatment.
Protocol Amendments
The original protocol (v.1.0) was approved on June 22, 2016.28 There were 7 protocol amendments made by the August 28, 2020, data cut-off date.
Amendment 1 (September 16, 2016): This included secondary end points and updates to the exclusion criteria. The proportion of patients who discontinued treatment due to toxicity and time to treatment failure due to toxicity were added as a new secondary end point. The characterization of the population pharmacokinetics of PEM was added as an exploratory objective.
Amendment 2 (February 03, 2017): This included updates to the follow-up period and the inclusion of secondary end points. The assessment of PFS by investigator was added as a secondary objective. A pregnancy assessment was added to the follow-up period.
Amendment 3 (January 30, 2018): This made revisions to the exclusion criteria and added dose modifications. Exclusion criterion 15 was updated (the cardiovascular impairment window was extended from 6 months to 12 months). Revisions were made to the management of notable outcomes proteinuria, hypertension, and hemorrhage.
Amendment 4 (June 30, 2018): This updated the planned patient enrolment number and made revisions to the exclusion criteria. The planned enrolment was increased to 1,050 patients (approximately 350 patients per arm) to address slow enrolment in the first 12 months and the high loss of PFS events and to provide adequate power for intergroup comparisons of OS. Two interim analyses were added. For the primary analysis of PFS, the alpha was decreased to 0.0499 for all comparisons due to the addition of an interim analysis for which an alpha of 0.0001 was allocated. For the multiplicity adjustment, the P value thresholds for the primary analysis of PFS were changed because of the addition of an interim analysis.
Amendment 5 (December 19, 2018): This updated the interim analysis outcomes (ORR and DOR) and clarified that the results may be considered for an early submission to regulatory agencies in regions outside of EMA jurisdiction.
Amendment 6 (September 10, 2019): The protocol for the interim analysis of OS and the multiplicity strategy was updated. The sponsor added the interim analysis of PFS, OS, and ORR.
Amendment 7 (August 6, 2020): The sponsor removed an exploratory objective to assess PFS using immune-related RECIST criteria in patients treated with LEN-PEM.
All protocol amendments were submitted to the appropriate health authorities and institutional review boards or independent ethics committees for information and approval in accordance with local requirements.9
Changes to the Planned Analyses
All changes to the planned analyses outlined in the original protocol were documented in the final statistical analysis plan (version 3.0) (August 14, 2020). The 95% CI for the ORR and DCR was calculated for each treatment arm using the normal approximation method as opposed to the Clopper and Pearson method because, in the sponsor’s opinion, the sample size was large enough to use normal approximation.
Post Hoc Analyses
To evaluate the impact of subsequent anti-cancer medication received post-treatment (during the follow-up phase) on the treatment effect of LEN-PEM versus SUN on OS, Kaplan-Meier plots of LEN-PEM versus SUN were constructed in patients treated with and without subsequent anti-cancer medication.9
Results
Patient Disposition
Enrolment in the CLEAR study was completed on July 24, 2019. By the third interim data cut-off (August 28, 2020), a total of 1,417 patients had been screened and 1,069 randomized to receive a study treatment in any 1 of the 3 study arms. Of the total who were screened out, 268 patients (18.9%) failed to meet the inclusion criteria or met exclusion criteria, 34 (2.4%) withdrew consent, 10 (0.7%) had AEs, 2 (0.1%) were lost to follow-up, and 34 (2.4%) failed for reasons categorized as “other.” Only the findings in study arm B (LEN-PEM) and arm C (SUN) are reported in this CADTH review.
In total, 142 patients (40%) in the LEN-PEM arm, and 67 patients (18.8%) in the SUN arm were still receiving treatment at the data cut-off for interim analysis 3 (August 28, 2020). The total number of patients who discontinued treatment was higher in the SUN arm (n = 273) compared with the LEN-PEM arm (n = 210). Table 12 presents the patient disposition in the LEN-PEM and SUN arms in the CLEAR trial.9
Category | LEN-PEM (n = 355) n (%) | SUN (n = 357) n (%) |
|---|---|---|
Randomized | 355 (100) | 357 (100) |
Not treated | 3 (0.8) | 17 (4.8) |
Treated | 352 (99.2) | 340 (95.2) |
Ongoing in study at data cut-off datea | 254 (71.5) | 222 (62.2) |
Treatment ongoing at data cut-off dateb | 142 (40.0) | 67 (18.8) |
On both study drugs | 60 (16.9) | NA |
On lenvatinib only | 78 (22.0) | NA |
On pembrolizumab only | 4 (1.1) | NA |
Completed 35 cycles of pembrolizumab | 7 (2.0) | NA |
Discontinued treatmentb | 210 (59.2) | 273 (76.5) |
Primary reason for discontinuation from treatmentc | ||
Radiological disease progression | 97 (27.3) | 174 (48.7) |
Clinical disease progression | 19 (5.4) | 22 (6.2) |
Adverse event | 60 (16.9) | 41 (11.5) |
Patient choice | 17 (4.8) | 23 (6.4) |
Lost to follow-up | 0 (0.0) | 1 (0.3) |
Withdrawal of consent | 4 (1.1) | 9 (2.5) |
Other | 13 (3.7) | 3 (0.8) |
Discontinued treatment but remained in survival follow-up at data cut-off date | 112 (31.5) | 153 (42.9) |
Discontinued from studyd | 101 (28.5) | 135 (37.8) |
Reason for discontinuation from study | ||
Death | 80 (22.5) | 101 (28.3) |
Lost to follow-up | 7 (2.0) | 6 (1.7) |
Withdrawal of consent | 14 (3.9) | 28 (7.8) |
LEN = lenvatinib; PEM = pembrolizumab; NA = not applicable; SUN = sunitinib.
Note: Percentages are based on the total number of patients in the full analysis set within the relevant treatment group. Data cut-off date: August 28, 2020.
aAs reported in the Patient Disposition section of the electronic case report form.
b“Treatment ongoing” is based on data available in the database at the time of data cut-off. Patients receiving SUN or at least 1 study drug in combination therapy are deemed to have treatment ongoing in absence of an off-treatment visit, or with a treatment ongoing at data cut-off in the patient disposition (randomization phase) section of the electronic case report form.
cTreatment discontinuation includes patients who discontinued SUN or both study drugs in combination therapy.
dDiscontinued from study refers to patients who were no longer followed up for survival as of the cut-off date.
Source: Clinical Study Report.9
Major Protocol Deviations
Major protocol deviations were as follows:
Exclusion criteria (2 patients: 1 in the LEN-PEM arm): One patient was enrolled with active CNS metastasis and 1 patient had significant cardiovascular impairment.
Inclusion criteria: 1 patient was enrolled without histological confirmation of RCC with a clear cell component (in the LEN-PEM arm).
1 patient in the LEN-PEM arm had other prohibited concomitant medications or procedures.
Prohibited concomitant nondrug therapy: 10 patients received a prohibited anti-cancer procedure (tumour resection or radiation therapy: n = 3 in the LEN-PEM arm; n = 4 in the SUN arm) during the study, leading to tumour assessments that were not evaluable and the censoring of PFS events by IIR.
Tumour assessment: 5 patients (n = 2 in the LEN-PEM arm; n = 2 in the SUN arm) missed more than 1 consecutive tumour assessment scan, leading to censoring of PFS events by IIR.9
Exposure to Study Treatments
Treatment duration was defined as the duration between the start date of the first study drug and the end date of the last study drug. Exposure to treatment was obtained from the safety analysis set. The median duration on treatment observed by data cut-off (August 28, 2020) was 17 months in the LEN-PEM arm and 7.84 months in the SUN arm. Exposure to treatments in the LEN-PEM arm was 2.5 times longer than patient exposure in the SUN arm. Table 13 presents treatment exposure to study drugs for the LEN-PEM arm (arm B) in comparison with SUN (arm C) in the CLEAR trial.9
Table 13: Exposure to Study Treatments
Response with confirmation | LEN-PEM (n = 352) | SUN (n = 340) |
|---|---|---|
Overall: Duration of treatment (months)a | ||
Mean (SD) | 17.29 (9.575) | 11.33 (9.463) |
Median | 17.00 | 7.84 |
LEN: Duration of treatment (months)a | LEN 20 mg | — |
Mean (SD) | 16.45 (9.839) | NA |
Median | 16.13 | NA |
PEM or SUN: Duration of treatment (months)a | PEM | SUN |
Mean (SD) | 14.45 (8.562) | 11.33 (9.463) |
Median | 15.08 | 7.84 |
LEN = lenvatinib; PEM = pembrolizumab; NA = not applicable; SD = standard deviation; SUN = sunitinib.
Note: Percentages are based on the total number of patients in the safety analysis set within the relevant treatment group. Data cut-off date: August 28, 2020.
aDuration of treatment (months) = (date of last dose of study drug minus date of the first dose of the study drug plus 1) divided by 30.4375. Overall duration of treatment is defined as the duration between the earliest first dose start date of either medication or the latest last dose end date of either medication.
Source: Clinical Study Report.9
Concomitant Medications
Overall, 96.4% of patients received at least 1 concomitant medication during the study and this rate was comparable in the 2 arms of interest (Table 14). The most frequently administered prior medications were in the Anatomical Therapeutic Chemical (ATC) pharmacologic subclasses of plain lipid-modifying drugs (25.9%) and antithrombotic drugs (22.8%).9 Table 14 lists the concomitant medications reported in at least 30% of patients enrolled in either arm in the CLEAR trial.
Table 14: Concomitant Medications Reported in Patients in Any Treatment Arm by Pharmacologic Subclass — Full Analysis Set
Concomitant medications based on anatomical class (ATC level 1) pharmacological subclass (ATC level 3) | LEN-PEM (n = 355) n (%) | SUN (n = 357) n (%) |
|---|---|---|
Patients with at least 1 concomitant medication | 351 (98.9) | 331 (92.7) |
Patients with at least 1 concomitant medication (excluding antihypertensive, antidiarrheal medications, and corticosteroids for systemic use) reported in at least 30% of patients | 343 (96.6) | 319 (89.4) |
Anti-inflammatory and antirheumatic products, non-steroids | 113 (31.8) | 83 (23.2) |
Antithrombotic drugs | 145 (40.8) | 106 (29.7) |
Beta-lactam antibacterial, penicillins | 97 (27.3) | 61 (17.1) |
Drugs for constipation | 105 (29.6) | 79 (22.1) |
Drugs for peptic ulcer and gastro-esophageal reflux disease | 208 (58.6) | 167 (46.8) |
Lipid-modifying drugs, plain | 12 (3.4) | 7 (2.0) |
Opioids | 128 (36.1) | 124 (34.7) |
Other analgesics and antipyretics | 193 (54.4) | 159 (44.5) |
Stomatological preparations | 94 (26.5) | 90 (25.2) |
Thyroid preparations | 192 (54.1) | 123 (34.5) |
Concomitant medications (antihypertensive, antidiarrheal medications, and corticosteroids for systemic use) reported in at least 3% of patients in any treatment arm | ||
Patients with at least 1 concomitant antihypertensive medication | 292 (82.3) | 244 (68.3) |
Patients with at least 1 concomitant antidiarrheal medication | 143 (40.3) | 97 (27.2) |
Patients with at least 1 concomitant corticosteroid for systemic use | 181 (51.0) | 58 (16.2) |
ATC = Anatomical Therapeutic Chemical; LEN = lenvatinib; PEM = pembrolizumab; SUN = sunitinib.
Note: Percentages are based on the total number of patients in the full analysis set within the relevant treatment group. Concomitant medications include medications that either: started before the first dose of the study drug and were continuing at the time of the first dose of study drug, or started on or after the date of the first dose of the study drug up to 30 days after the patient’s last dose. Patients with 2 or more medications within an ATC level (or drug name) are counted only once within that ATC level (or drug name). Medications were coded using the WHO Drug Dictionary version WHODDMAR20B3G. Data cut-off date: August 28, 2020.
Source: Clinical Study Report.9
Anti-Cancer Medications Received by Patients During the Follow-Up Phase
The use of post-treatment anti-cancer medications was permitted at the survival follow-up phase after study treatment had been discontinued in patients. The proportion of patients receiving subsequent anti-cancer medications was higher in the SUN arm (57.7%) compared with the LEN-PEM arm (33.0%). The most common were anti-VEGF therapies (n = 328; 30.7%) and PD-1 and PD-L1 checkpoint inhibitors (n = 309; 28.9%). Use of PD-1 and PD-L1 checkpoint inhibitors was greatest in the SUN arm (43.1%) when compared with the LEN-PEM arm (8.2%).28 Table 15 presents a summary of anti-cancer treatments received by patients in the LEN-PEM arm versus the SUN arm during the survival follow-up phase of CLEAR.9
Table 15: Anti-Cancer Medications Approved During Survival Follow-Up at Interim Analysis 3 — Full Analysis Set
Category | LEN-PEM (n = 355) | SUN (n = 357) |
|---|---|---|
Patients started study treatment, n (%) | 352 (99.2) | 340 (95.2) |
Patients discontinued study treatment, n (%) | 210 (59.2) | 273 (76.5) |
Patients who received any subsequent systemic anti-cancer medication during survival follow-up by type, n (%) | 117 (33.0) | 206 (57.7) |
Anti-VEGF therapy | 108 (30.4) | 120 (33.6) |
PD-1 or PD-L1 checkpoint inhibitora | 29 (8.2) | 154 (43.1) |
MTOR inhibitor | 6 (1.7) | 17 (4.8) |
CTLA-4 inhibitora | 6 (1.7) | 18 (5.0) |
Other | 12 (3.4) | 20 (5.6) |
Duration of first anti-cancer regimen during survival follow-up (months) | ||
n | 116 | 200 |
Mean (SD) | 6.84 (5.953) | 8.65 (7.281) |
Median | 5.16 | 6.82 |
CTLA-4 = cytotoxic T-lymphocyte-associated protein 4; LEN = lenvatinib; MTOR = mammalian target of rapamycin; PD-1 = programmed cell death 1 protein; PD-L1 = programmed cell death 1 ligand 1; PEM = pembrolizumab; SD = standard deviation; SUN = sunitinib; VEGF = Visual Analogue Scale.
Note: Percentages are based on the total number of patients in the full analysis set within the relevant treatment group. Patients with 2 or more anti-cancer medications may be counted in multiple categories. Medications were coded using WHO Drug Dictionary version WHODDMAR20B3G. Data cut-off date: August 28, 2020.
aMapping/coding is based on verbatim = XmAb20717, which is a bi-specific antibody for PD-1 and CTLA-4.
Source: Clinical Study Report.9
Efficacy
Only those efficacy outcomes and analyses of subgroups identified in the review protocol are reported subsequently. The findings presented were obtained at interim analysis 3 (August 28, 2020, data cut-off).
Progression-Free Survival (By Independent Imaging Review)
By the August 28, 2020, data cut-off (which also corresponds to the third and final interim analysis of PFS), a total of 365 PFS events had occurred in the LEN-PEM and SUN arms. The median PFS estimated by IIR was 23.9 months (20.8 to 27.7) in the LEN-PEM arm and 9.2 months (6.0 to 11.0) in the SUN arm. The HR between the LEN-PEM versus SUN arms was 0.39 (95% CI, 0.32 to 0.49; P < 0.0001).9 The sponsor reviewed PFS data at interim analysis 2 (November 15, 2019, data cut-off) retrospectively, and statistical significance was observed. Findings at interim analysis 2 were consistent with the estimates obtained at the data cut-off for interim analysis 3. Table 16 provides a summary of PFS by IIR per RECIST 1.1 criteria in the LEN-PEM arm versus the SUN arm. Figure 4 presents the Kaplan-Meier plot of PFS at the data cut-off for interim analysis 3.
Table 16: Progression-Free Survival at Interim Analysis 3 — Full Analysis Set
Detail | LEN-PEM (n = 355) | SUN (n = 357) |
|---|---|---|
Patients with events, n (%) | ||
Total | 160 (45.1) | 205 (57.4) |
Progressive disease | 145 (40.8) | 196 (54.9) |
Death | 15 (4.2) | 9 (2.5) |
Censored, n (%) | 195 (54.9) | 152 (42.6) |
No baseline tumour assessment | 0 (0.0) | 1 (0.3) |
No adequate post-baseline tumour assessment | 6 (1.7) | 22 (6.2) |
No progression and alive at the time of data cut-off | 146 (41.1) | 52 (14.6) |
New anti-cancer treatment started | 37 (10.4) | 71 (19.9) |
Death or progression after more than 1 missing assessment | 6 (1.7) | 6 (1.7) |
Follow-up time for progression-free survival (months),a,b median (95% CI) | 22.3 (21.1 to 25.6) | 16.6 (13.1 to 18.5) |
Progression-free survival (months)a | ||
Median (95% CI) | 23.9 (20.8 to 27.7) | 9.2 (6.0 to 11.0) |
Hazard ratio (95% CI)c,d | 0.39 (0.32 to 0.49) | |
Log-rank test P valued | < 0.0001 | |
Progression-free survival rate (%) (95% CI)e | ||
At 6 months | 84.9 (80.6 to 88.3) | 57.0 (51.1 to 62.5) |
At 12 months | 70.6 (65.3 to 75.2) | 38.4 (32.4 to 44.3) |
At 18 months | 57.4 (51.5 to 62.8) | 31.2 (25.4 to 37.2) |
At 24 months | 48.9 (42.7 to 54.9) | 20.7 (15.0 to 26.9) |
CI = confidence interval; IxRS = interactive voice and web response system; LEN = lenvatinib; MSKCC = Memorial Sloan Kettering Cancer Center; PEM = pembrolizumab; SUN = sunitinib.
Note: Percentages are based on the total number of patients in the full analysis set within the relevant treatment group. Data cut-off date: August 28, 2020.
aQuartiles are estimated by Kaplan-Meier method, and the 95% CIs are estimated with a generalized Brookmeyer and Crowley method.
bEstimates for progression-free survival follow-up time are calculated in the same way as the Kaplan-Meier estimate of progression-free survival but with the meaning of “censor” and “event” status indicator reversed.
cHazard ratio is based on a Cox proportional hazard model including treatment group as a factor, Efron method is used for ties.
dStratified by geographic region (region 1: Western Europe and North America; region 2: rest of the world) and MSKCC prognostic groups (favourable, intermediate, and poor risk) in IxRS.
eProgression-free survival rate and 95% CIs are calculated using Kaplan-Meier product-limit method and Greenwood formula.
Source: Clinical Study Report.9
PFS Subgroup Analyses
Risk Groups Based on the IMDC Prognostic Model: The CADTH review protocol identified 3 subgroups — the IMDC prognostic model risk groups (favourable, intermediate, and poor) — for the systematic review. Results are presented for the LEN-PEM versus SUN comparison.
Favourable risk group: By the August 28, 2020, data cut-off, a total of 43 patients out of 110 in the LEN-PEM arm had events, and the median PFS was 28.1 months. In the SUN arm, a total of 67 patients out of 124 had events, and the estimated median PFS was 12.9 months. The HR between the LEN-PEM arm and the SUN arm in the favourable risk group was 0.41 (95% CI, 0.28 to 0.62).
Intermediate risk group: By the August 28, 2020, data cut-off, a total of 97 patients out of 210 had events in the LEN-PEM arm and the estimated median PFS was 22.1 months. In the SUN arm, 110 of 192 patients had events and the estimated median PFS was 7.1 months. The HR obtained between the LEN-PEM arm and the SUN arm was 0.39 (95% CI, 0.29 to 0.52).
Figure 4: Kaplan-Meier Plot of Progression-Free Survival at Interim Analysis 3 — Full Analysis Set
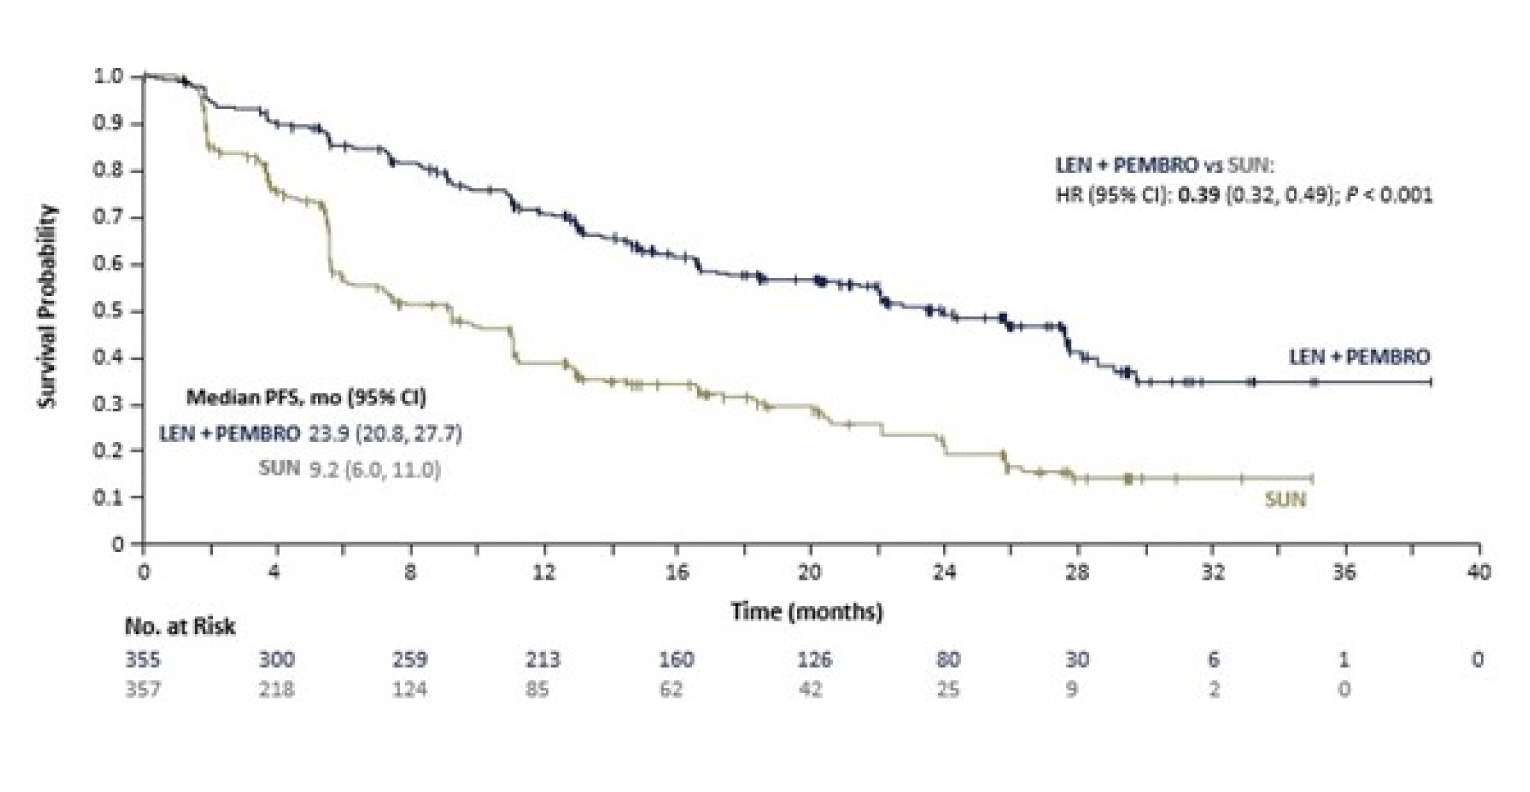
+ = censored observations; CI = confidence interval; HR = hazard ratio; IxRS = interactive voice and web response system. LEN+PEMBRO = lenvatinib + pembrolizumab; mo = months; SUN = sunitinib; RECIST = Response Evaluation Criteria in Solid Tumours; PFS = progression-free survival; vs = versus.
Note: Median is estimated by Kaplan-Meier method, and the 95% CIs are estimated with a generalized Brookmeyer and Crowley method. HR is estimated from a Cox proportional hazard model including treatment group as a factor and stratified by IxRS stratification factors; the Efron method is used for ties. P value is calculated using log-rank test stratified by IxRS stratification factors. Data cut-off date: August 28, 2020.
Source: Clinical Study Report.9
Poor risk group: By the August 28, 2020, data cut-off, a total of 18 patients out of 32 had events in the LEN-PEM arm at a median PFS of 22.1 months. In the SUN arm, 26 of the 37 patients in this group had events, with an estimated median PFS of 4.0 months. The HR obtained between LEN-PEM and SUN was 0.28 (95% CI, 0.13 to 0.60).
The subgroup analysis of PFS indicated that LEN-PEM showed a benefit over SUN in the 3 risk groups. All subgroup analyses were considered exploratory because no adjustments for multiplicity were made.9
PFS Sensitivity Analysis
By the August 28, 2020, data cut-off, the unstratified HR obtained from the unstratified Cox regression model was 0.42 (95% CI, 0.34 to 0.52; P < 0.0001) for the LEN-PEM versus SUN comparison. The sensitivity analysis was consistent with the findings observed in the primary analysis of PFS and showed that the benefit of using LEN-PEM was maintained over SUN. Three additional sensitivity analyses for PFS were conducted and showed results that were consistent with the primary analysis.9
Objective Response Rate
By the August 28, 2020, data cut-off, the ORR estimated by IIR in the LEN-PEM arm was 71.0% (95% CI, 66.3 to 75.7). In total, 16.1% of patients receiving LEN-PEM had a confirmed CR and 54.9% had a confirmed PR. In the SUN arm, the ORR estimated was 36.1% (95% CI, 31.2 to 41.1). In total, 4.2% of patients receiving SUN had a confirmed CR and 31.9% of patients had a confirmed PR. The difference between the 2 treatment arms was 34.9% (95% CI, 28.0 to 41.7). The estimated OR between the LEN-PEM arm and the SUN arm was 4.35 (95% CI, 3.16 to 5.97; P < 0.0001) in favour of LEN-PEM.9 Table 17 presents a summary of the ORR estimated by IIR in the LEN-PEM arm versus the SUN arm.
Table 17: Objective Response Rate at Interim Analysis 3 — Full Analysis Set
Detail | LEN-PEM (n = 355) | SUN (n = 357) |
|---|---|---|
Objective response rate (CR + PR), n (%) | 252 (71.0) | 129 (36.1) |
95% CIa | (66.3 to 75.7) | (31.2 to 41.1) |
Difference, % (95% CI)a | 34.9 (28.0 to 41.7) | |
Odds ratio (95% CI)b | 4.35 (3.16 to 5.97) | |
P valueb | < 0.0001 | |
Best overall response, n (%) | ||
CR | 57 (16.1) | 15 (4.2) |
PR | 195 (54.9) | 114 (31.9) |
Stable disease | 68 (19.2) | 136 (38.1) |
PD | 19 (5.4) | 50 (14.0) |
Unknown or not evaluable | 16 (4.5) | 42 (11.8) |
Time to first objective response (months) | ||
Patients with objective response only, n | 252 | 129 |
Mean (SD) | 3.30 (2.635) | 3.36 (2.600) |
Median | 1.94 | 1.94 |
CI = confidence interval, CR = complete response; IxRS = interactive voice and web response system; LEN = lenvatinib; PEM = pembrolizumab; PD = progressive disease; PR = partial response; SD = standard deviation; SUN = sunitinib.
Note: Percentages are based on the total number of patients in the full analysis set within the relevant treatment group. Stable disease must be ≥ 7 weeks after randomization. Durable stable disease must be ≥ 23 weeks after randomization. Time to first objective response (months) = (date of first objective response minus date of randomization plus 1) multiplied by 12 divided by 365.25, for patients with best overall response of CR or PR. It is censored for patients without a best overall response of CR or PR. Data cut-off date: August 28, 2020.
a95% CI is constructed using the method of normal approximation.
bOdds ratio and P value are calculated using the Cochran-Mantel-Haenszel method, stratified by IxRS stratification factors.
Source: Clinical Study Report.9
Overall Survival
By the August 28, 2020, data cut-off (which also corresponds to the second interim analysis for OS), the median OS was not estimable. An HR of 0.66 (95% CI, 0.49 to 0.88; P = 0.0049) was estimated based on IIR interpretation, representing a 34% reduction in the risk of death in the LEN-PEM arm compared with the SUN arm at any particular time point. The median duration of OS follow-up was 26.7 months (95% CI, 25.9 to 27.4) for LEN-PEM and 26.3 months (95% CI, 25.4 to 27.2) for SUN.9 Table 18 presents a summary of OS findings by IIR estimated for LEN-PEM and SUN. Figure 5 presents the Kaplan-Meier plot of the OS at the data cut-off for interim analysis 3.9
The sponsor considered that the use of post-treatment anti-cancer medication by patients in the survival follow-up phase may have confounded OS estimates at the August 28, 2020, data cut-off. A post hoc sensitivity analysis was conducted to assess the impact on OS (Appendix 3).
Table 18: Overall Survival at Interim Analysis 3 — Full Analysis Set
Category | LEN-PEM (n = 355) | SUN (n = 357) |
|---|---|---|
Death, n (%) | 80 (22.5) | 101 (28.3) |
Censored, n (%) | 275 (77.5) | 256 (71.7) |
Lost to follow-up | 7 (2.0) | 6 (1.7) |
Withdrawal of consent | 14 (3.9) | 28 (7.8) |
Alive | 254 (71.5) | 222 (62.2) |
Overall survival (months)a | ||
Median (95% CI) | NE (33.6 to NE) | NE (NE to NE) |
Stratified hazard ratio (95% CI)b,c | 0.66 (0.49 to 0.88) | |
Stratified log-rank test P valuec | 0.0049 | |
Duration of survival follow-up (months),a,d median (95% CI) | ||
Overall survival rate, % (95% CI)e | ||
At 12 months | 91.4 (87.9 to 93.9) | 80.2 (75.5 to 84.1) |
At 18 months | 87.1 (83.1 to 90.3) | 74.4 (69.3 to 78.8) |
At 24 months | 79.2 (74.1 to 83.3) | 70.4 (65.0 to 75.2) |
CI = confidence interval; IxRS = interactive voice and web response system; LEN = lenvatinib; MSKCC = Memorial Sloan Kettering Cancer Center; NE = not estimable; PEM = pembrolizumab; SUN = sunitinib.
Note: Percentages are based on the total number of patients in the full analysis set within the relevant treatment group. Data cut-off date: August 28, 2020.
aQuartiles are estimated by Kaplan-Meier method, and the 95% CIs are estimated with a generalized Brookmeyer and Crowley method.
bHazard ratio is based on a Cox proportional hazard model including treatment group as a factor; the Efron method is used for ties.
cStratified by geographic region (region 1: Western Europe and North America or region 2: rest of the world) and MSKCC prognostic groups (favourable, intermediate, and poor risk) in IxRS.
dEstimates for survival follow-up time are calculated in the same way as the Kaplan-Meier estimate of overall survival but with the meaning of “censor” and “event” status indicator reversed.
eOverall survival rate and 95% CIs are calculated using the Kaplan-Meier product-limit method and Greenwood formula.
Source: Clinical Study Report.9
Figure 5: Kaplan-Meier Plot of Overall Survival at Interim Analysis 3 — Full Analysis Set
+ = censored observations; CI = confidence interval; HR = hazard ratio; IxRS = interactive voice and web response system; LEN+PEMBRO = lenvatinib + pembrolizumab; mo = months; NE = not evaluable; NR = not reached; OS = overall survival; SUN = sunitinib; vs = versus.
Note: Median was estimated by Kaplan-Meier method, and the 95% CIs were estimated using a generalized Brookmeyer and Crowley method. HR was estimated from a Cox proportional hazard model including treatment group as a factor and stratified by IxRS stratification factors; the Efron method was used for ties. Data cut-off date: August 28, 2020.
Source: Clinical Study Report.9
The sponsor conducted a follow-up analysis for OS 7 months after the August 28, 2020, data cut-off (i.e., March 31, 2021) (Appendix 3). The findings were consistent with the results obtained at interim analysis 3.
Duration of Response
By the August 28, 2020, data cut-off, the median DOR estimated by IIR in patients with a response was 25.8 months (95% CI, 22.1 to 27.9) in the LEN-PEM arm and 14.6 months (95% CI, 9.4 to 16.7) in the SUN arm.
Table 19 presents a summary of the DOR by IIR in the LEN-PEM arm versus the SUN arm.9
Table 19: Duration of Response at Interim Analysis 3 — Full Analysis Set
Category | LEN-PEM (n = 355) | SUN (n = 357) |
|---|---|---|
Patients with objective response,a n | 252 | 129 |
Duration of objective response (months), median (95% CI) | 25.8 (22.1 to 27.9) | 14.6 (9.4 to 16.7) |
CI = confidence interval; LEN = lenvatinib; PEM = pembrolizumab; SUN = sunitinib
Note: Duration of objective response (months) = (date of progressive disease, death, or censor date minus date of first objective response plus 1) multiplied by (12 divided by 365.25) for patients with an objective response. Data cut-off date: August 28, 2020.
aQuartiles were estimated by Kaplan-Meier method; 95% confidence intervals were estimated using a generalized Brookmeyer and Crowley method.
Source: Clinical Study Report.9
Health-Related Quality of Life
The completion and compliance rates observed for patients were greater than 90% at baseline across groups. Rates of questionnaire completion declined below 50% at cycle 26 for LEN-PEM and at cycle 12 for SUN because of treatment discontinuation. The adherence rates were greater than 80% up until cycle 51 across the treatment arms, while the adherence rate at the off-treatment visit was greater than 78% across the study arms.9
Overall Least Squares Mean Difference
Patients enrolled in the LEN-PEM arm had better maintenance of HRQoL and less severe symptoms compared with those who received SUN. The overall mean difference estimated favoured LEN-PEM for the EORTC QLQ-C30 physical functioning scale as well as for symptoms of fatigue, dyspnea, and constipation. Figure 6 presents the overall least squares mean difference estimated for the LEN-PEM arm versus SUN.
Figure 6: Overall Least Squares Mean Difference — LEN-PEM Versus SUN
CI = confidence interval; EORTC QLQ-C30 = European Organisation for Research and Treatment of Cancer Quality of Life Questionnaire Core 30; FKSI-DRS = Functional Assessment of Cancer Therapy Kidney Symptom Index - Disease Related Symptoms; GHS/QoL = global health status/quality of life; LEN = lenvatinib; LS = least squares; PEMBRO = pembrolizumab; SUN = sunitinib.
Note: Data cut-off date is August 28, 2020.
Source: Sponsor’s submission report.9
Time to First Deterioration
At the August 28, 2020, data cut-off, the longitudinal analysis of change from baseline for the different QoL scales was estimated after a mean follow-up time of 46 weeks.
In the EORTC QLQ-C30, physical functioning, dyspnea, and appetite loss showed improvement in patients receiving LEN-PEM (Figure 7 and Figure 8). The TTD assessed showed improvement in patients receiving LEN-PEM for every scale except cognitive functioning and financial difficulties. Figure 8 summarizes TTD in the LEN-PEM arm versus the SUN arm.
EORTC QLQ-C30 Questionnaire
In physical functioning, the median TTD in the LEN-PEM arm was 15.29 (95% CI, 12.29 to 21.43), while in the SUN arm, median TTD in weeks was 12.71 (95% CI, 9.29 to 18.14; nominal log-rank difference P value = 0.03).
The median TTD obtained in the dyspnea subscale was 39.29 (95% CI, 24.43 to 51) in the LEN-PEM arm and 21.14 (95% CI, 15.43 to 32.71) in the SUN arm (nominal log-rank difference P value = 0.02).
In the appetite loss subscale, the median TTD in weeks in the LEN-PEM arm was 18.29 (95% CI, 15.14 to 21.71), while in the SUN arm, the median TTD in weeks was 9.14 (95% CI, 6.29 to 15.14). The nominal P value of the log-rank test was 0.03.
EQ-5D-3L VAS
The median TTD in weeks obtained in the Visual Analogue Scale was 9.43 (95% CI, 6.43 to 12.29) in the LEN-PEM arm and, in the SUN arm, the median TTD in weeks was 9.14 (95% CI, 6.29 to 12.0). Nominal P value of 0.04 was obtained in the log-rank difference.
Figure 7: Time to First Deterioration Forest Plot — LEN-PEM Versus SUN
CI = confidence interval; EORTC QLQ-C30 = European Organisation for Research and Treatment of Cancer Quality of Life Questionnaire Core 30; FKSI-DRS = Functional Assessment of Cancer Therapy Kidney Symptom Index – Disease Related Symptoms; GHS/QoL = global health status/quality of life; L + P/S = lenvatinib + pembrolizumab versus sunitinib; LEN = lenvatinib; PEMBRO = pembrolizumab; pt = patient; SUN = sunitinib.
Note: Data cut-off date is August 28, 2020.
Source: Sponsor’s submission report.9
Figure 8: Time to First Deterioration Survival Analyses — LEN-PEM Versus SUN
CI = confidence interval; EORTC QLQ-C30 = European Organisation for Research and Treatment of Cancer Quality of Life Questionnaire Core 30; FKSI-DRS = Functional Assessment of Cancer Therapy Kidney Symptom Index – Disease Related Symptoms; LEN = lenvatinib; PEMBRO = pembrolizumab; SUN = sunitinib; TTD = time to first deterioration.
Note: Data cut-off date was August 28, 2020.
Source: Sponsor’s submission report.9
Time Until Definitive Deterioration
Prolonged TUDD in physical functioning, role functioning, social functioning, fatigue, insomnia, dyspnea, nausea and vomiting, pain, appetite loss, and diarrhea was observed in patients receiving LEN-PEM compared with those receiving SUN (Figure 9 and Figure 10).9
FKSI-DRS Total Score
In the LEN-PEM arm, the median TUDD in weeks was 134.14 (95% CI, 120 to not estimable), while in the SUN arm, the TUDD in weeks was 117.43 (95% CI, 90.14 to 131.29). The nominal P value obtained was less than 0.01 (Figure 9 and Figure 10).
EORTC Quality of Life Questionnaire Core 30
The median TUDD in weeks in the global health status/QoL scale in the LEN-PEM arm was 114.29 (95% CI, 102.14 to 153.29) while, in the SUN arm, the median TUDD in weeks was 75.14 (95% CI, 57.29 to 105.14). The nominal P value obtained was less than 0.0001.
Figure 9: Time Until Definitive Deterioration Forest Plot — LEN-PEM Versus SUN
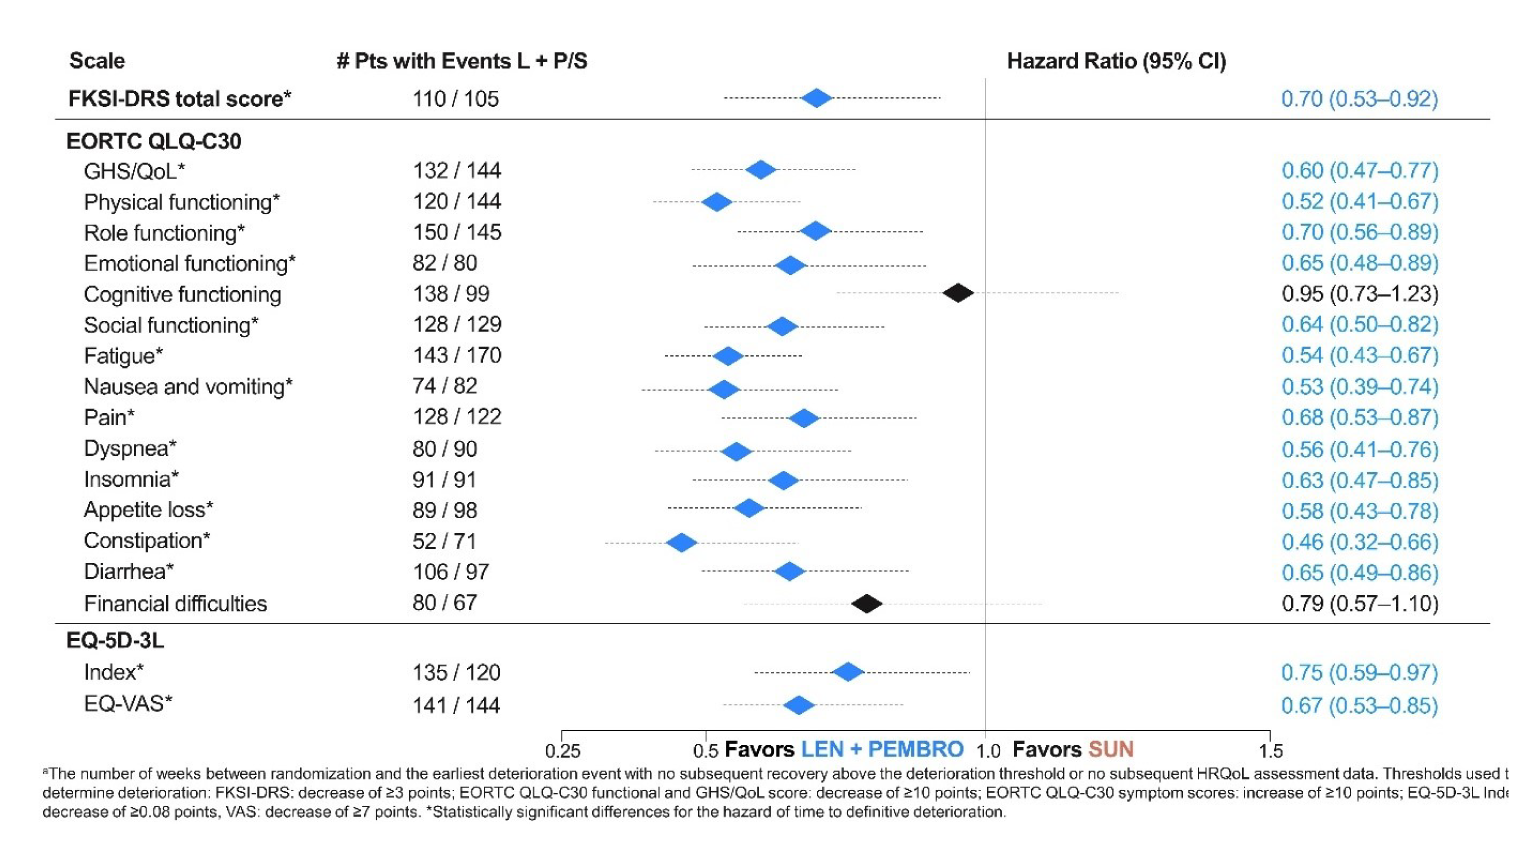
CI = confidence interval; EORTC = European Organisation for Research and Treatment of Cancer; FKSI-DRS = Functional Assessment of Cancer Therapy Kidney Symptom Index - Disease Related Symptoms; GHS/QoL = global health status/quality of life; L + P/S = lenvatinib + pembrolizumab versus sunitinib; LEN = lenvatinib; PEMBRO = pembrolizumab; pt = patient; SUN = sunitinib; TUDD = time until definitive deterioration.
Data cut-off date: August 28, 2020.
Source: Sponsor’s submission report.9
In the physical function domain of the EORTC, the median TUDD in weeks in the LEN-PEM arm was 134.14 (95% CI, 109.14 to not estimable), while in the SUN arm, the median TUDD in weeks was 78.14 (95% 63.14 to 111.0). The nominal P value obtained from the log-rank difference was less than 0.0001.
EQ-5D-3L Visual Analogue Scale
The median TUDD in weeks obtained in the LEN-PEM arm was 124.86 (95% CI, 94.71 to 134.57) while, in the SUN arm, the median TUDD in weeks was 74.86 (95% CI, 54.14 to 94.0). The nominal P value obtained was less than 0.01 (Figure 9 and Figure 10).
Figure 10: Time Until Definitive Deterioration — LEN-PEM Versus SUN
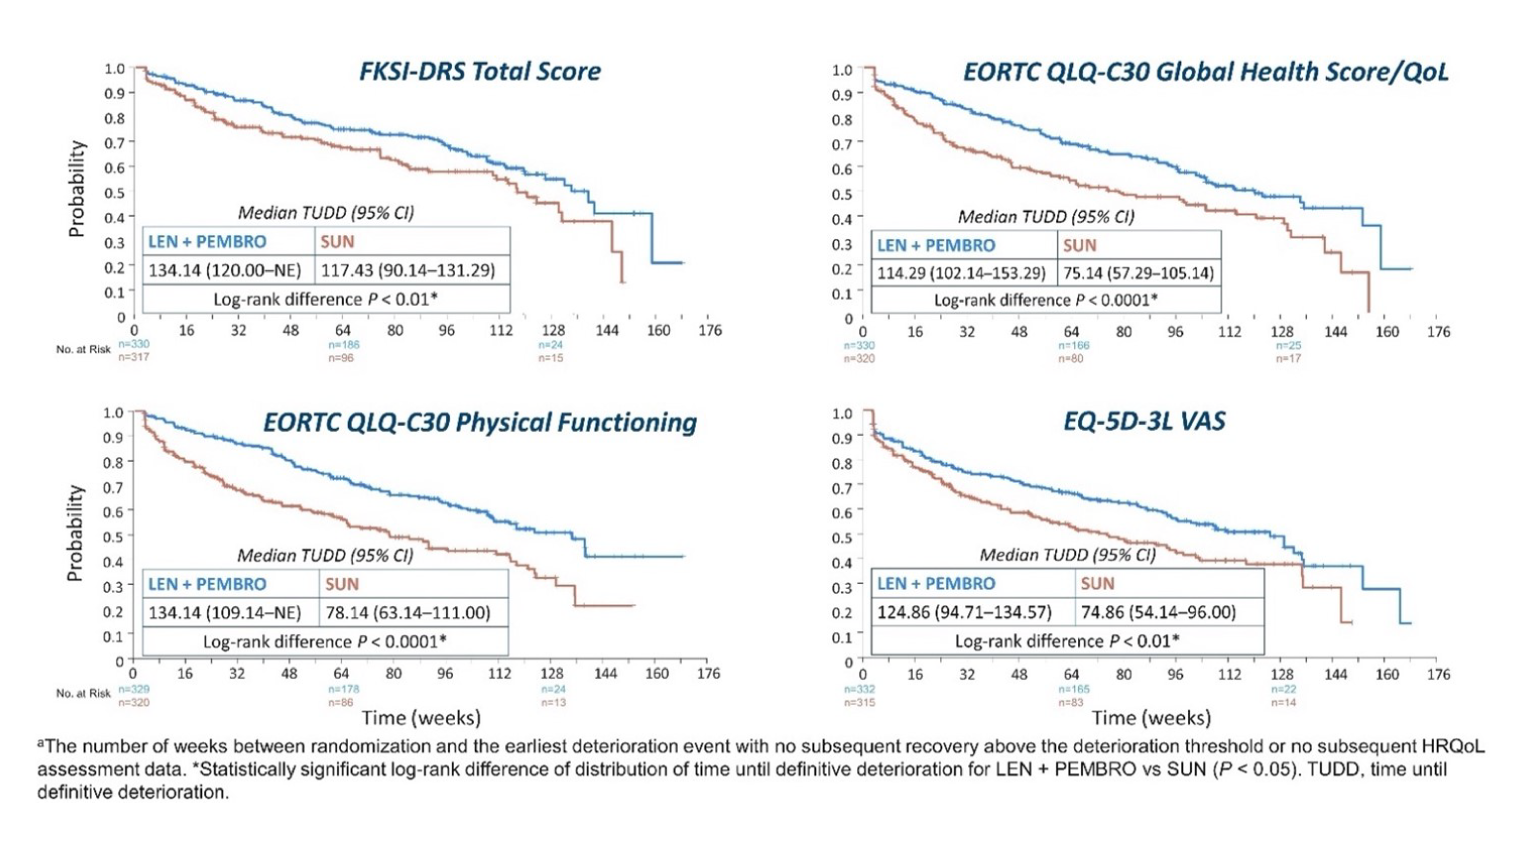
CI = confidence interval; EORTC QLQ-C30 = European Organisation for Research and Treatment of Cancer Quality of Life Questionnaire Core 30; FKSI-DRS = Functional Assessment of Cancer Therapy Kidney Symptom Index – Disease Related Symptoms; GHS/QoL = global health status/quality of life; HRQoL = health-related quality of life; LEN = lenvatinib; PEMBRO = pembrolizumab; NE = not estimable; SUN = sunitinib; TUDD = time until definitive deterioration; vs = versus.
Data cut-off date: August 28, 2020.
Source: Sponsor’s submission report.9
Disease Control Rate
By the August 28, 2020, data cut-off, the DCR observed in the LEN-PEM arm was 90.1%, while in the SUN arm, the DCR was 74.2%. The clinical benefit rate was 84.2% in the LEN-PEM arm and 59.4% in the SUN arm.9 Table 20 summarizes findings of the DCR estimated by IIR in the LEN-PEM arm versus the SUN arm at interim analysis 3.
Table 20: Disease Control Rate at Interim Analysis 3 — Full Analysis Set
Response with confirmation | LEN-PEM (n = 355) | SUN (n = 357) |
|---|---|---|
Disease control rate (CR, PR, and stable disease), n (%) | 320 (90.1) | 265 (74.2) |
95% CIa | (87.0 to 93.2) | (69.7 to 78.8) |
Difference, % (95% CI)a | 15.9 (10.4 to 21.4) | |
Odds ratio (95% CI)b | 3.26 (2.13 to 5.00) | |
P valueb | < 0.0001 | |
CI = confidence interval; CR = complete response; IxRS = interactive voice and web response system; LEN = lenvatinib; PEM = pembrolizumab; PR = partial response; SUN = sunitinib.
Note: Percentages are based on the total number of patients in the full analysis set within the relevant treatment group. Data cut-off date: August 28, 2020.
a95% CI is constructed using the method of normal approximation.
bOdds ratio and nominal P value are calculated using the Cochran-Mantel-Haenszel method, stratified by IxRS stratification factors.
Source: Clinical Study Report.9
Harms
Only those harms identified in the CADTH review protocol are reported subsequently. The safety evaluation focuses on the data from the LEN-PEM and SUN arms obtained at the August 28, 2020, data cut-off.9
Adverse Events
Overall, 99.7% of patients enrolled in the LEN-PEM arm and 98.5% in the SUN arm reported at least 1 TEAE by the August 28, 2020, data cut-off. AEs of grade 3 or higher occurred in 82.4% of patients in the LEN-PEM arm and 71.8% in the SUN arm. Table 21 presents an overview of TEAEs in the LEN-PEM arm and the SUN arm.9
By the August 28, 2020, data cut-off, the most frequently reported AEs occurring in more than 30% of patients receiving treatment in the LEN-PEM arm were diarrhea, hypertension, hypothyroidism, decreased appetite, fatigue, nausea, and stomatitis. In the SUN arm, diarrhea, hypertension, stomatitis, PPE syndrome, fatigue, nausea, and decreased appetite were the most frequently reported events. Table 22 summarizes the AEs occurring in at least 10% of patients receiving LEN-PEM or SUN in the CLEAR trial.9
Table 21: Summary of AEs at Interim Analysis 3 — Safety Analysis Set
Category | LEN-PEM (N = 352) n (%) | SUN (N = 340) n (%) |
|---|---|---|
Any AEs | 351 (99.7) | 335 (98.5) |
AEs with worst CTCAE grade of: | ||
≥ 3 | 290 (82.4) | 244 (71.8) |
3 | 223 (63.4) | 201 (59.1) |
4 | 52 (14.8) | 32 (9.4) |
5 | 15 (4.3) | 11 (3.2) |
Any serious AEsa | 178 (50.6) | 113 (33.2) |
Any fatal TEAEs | 15 (4.3) | 11 (3.2) |
Any nonfatal serious AEs | 176 (50.0) | 111 (32.6) |
AEs Leading to study drug discontinuationb | 131 (37.2) | 49 (14.4) |
Discontinuation of LENc | 90 (25.6) | NA |
Discontinuation of PEMd | 101 (28.7) | NA |
Discontinuation of both LEN and PEMe | 47 (13.4) | NA |
AEs leading to dose reductionb | 242 (68.8) | 171 (50.3) |
AEs leading to study drug interruptionb | 276 (78.4) | 183 (53.8) |
Interruption of LENc | 257 (73.0) | NA |
Interruption of PEMd | 194 (55.1) | NA |
Interruption of LEN and PEMe | 138 (39.2) | NA |
AEs leading to dose modification,b,f | 308 (87.5) | 239 (70.3) |
Modification of LENc | 298 (84.7) | NA |
Modification of PEMd | 194 (55.1) | NA |
Modification of both LEN and PEMe | 153 (43.5) | NA |
AE = adverse event; CTCAE = Common Terminology Criteria for Adverse Events; LEN = lenvatinib; MedDRA = Medical Dictionary for Regulatory Activities; NA = not applicable; PEM = pembrolizumab; SUN = sunitinib; TEAE = treatment-emergent adverse event.
Note: Percentages are based on the total number of patients in the safety analysis set within the relevant treatment group. MedDRA preferred terms “neoplasm progression,” “malignant neoplasm progression,” and “disease progression,” which are unrelated to the study drug are excluded. For each row category, patients with 2 or more AEs in that category were counted only once. For serious TEAEs, the follow-up window is 120 days after the last dose date. AEs were graded using CTCAE version 4.03. Data cut-off date: August 28, 2020.
aEach patient can be counted in multiple categories.
bLEN or PEM (or SUN). Dose reduction is not applicable for PEM.
cRegardless of action taken for PEM.
dRegardless of action taken for lenvatinib.
eDue to the same AE.
fDose modification includes dose reduction or drug interruption.
Source: Clinical Study Report.9
Table 22: Adverse Events Occurring in at Least 10% of Patients on LEN-PEM and SUN in the CLEAR Trial at Interim Analysis 3 — Safety Analysis Set
AEs (MedDRA preferred terms) | LEN-PEM (n = 355) n (%) | SUN (n = 357) n (%) |
|---|---|---|
Patients with any TEAE | 351 (99.7) | 335 (98.5) |
Diarrhea | 216 (61.4) | 168 (49.4) |
Hypertension | 195 (55.4) | 141 (41.5) |
Hypothyroidism | 166 (47.2) | 90 (26.5) |
Decreased appetite | 142 (40.3) | 105 (30.9) |
Fatigue | 141 (40.1) | 125 (36.8) |
Nausea | 126 (35.8) | 113 (33.2) |
Stomatitis | 122 (34.7) | 131 (38.5) |
Dysphonia | 105 (29.8) | 14 (4.1) |
Weight decreased | 105 (29.8) | 31 (9.1) |
Proteinuria | 104 (29.5) | 43 (12.6) |
Palmar-plantar erythrodysesthesia syndrome | 101 (28.7) | 127 (37.4) |
Arthralgia | 99 (28.1) | 52 (15.3) |
Rash | 96 (27.3) | 47 (13.8) |
Vomiting | 92 (26.1) | 68 (20.0) |
Constipation | 89 (25.3) | 64 (18.8) |
Headache | 80 (22.7) | 55 (16.2) |
Asthenia | 78 (22.2) | 61 (17.9) |
Abdominal pain | 74 (21.0) | 28 (8.2) |
Cough | 70 (19.9) | 53 (15.6) |
Lipase increased | 64 (18.2) | 44 (12.9) |
Amylase increased | 63 (17.9) | 28 (8.2) |
Back pain | 59 (16.8) | 52 (15.3) |
Pruritus | 58 (16.5) | 26 (7.6) |
Myalgia | 56 (15.9) | 12 (3.5) |
Dyspnea | 54 (15.3) | 34 (10.0) |
Pyrexia | 54 (15.3) | 44 (12.9) |
Blood creatinine increased | 48 (13.6) | 34 (10.0) |
Musculoskeletal pain | 48 (13.6) | 21 (6.2) |
Anemia | 43 (12.2) | 66 (19.4) |
Dysgeusia | 43 (12.2) | 95 (27.9) |
Alanine aminotransferase increased | 42 (11.9) | 35 (10.3) |
Hypertriglyceridemia | 42 (11.9) | 41 (12.1) |
Edema peripheral | 42 (11.9) | 35 (10.3) |
Pain in extremity | 41 (11.6) | 33 (9.7) |
Nasopharyngitis | 40 (11.4) | 25 (7.4) |
Aspartate aminotransferase increased | 39 (11.1) | 37 (10.9) |
Blood thyroid-stimulating hormone increased | 39 (11.1) | 21 (6.2) |
Dyspepsia | 39 (11.1) | 55 (16.2) |
Insomnia | 38 (10.8) | 21 (6.2) |
Dry mouth | 36 (10.2) | 11 (3.2) |
Epistaxis | 25 (7.1) | 37 (10.9) |
Platelet count decreased | 22 (6.3) | 61 (17.9) |
Thrombocytopenia | 15 (4.3) | 53 (15.6) |
Neutropenia | 9 (2.6) | 46 (13.5) |
Neutrophil count decreased | 8 (2.3) | 40 (11.8) |
AE = adverse event; LEN = lenvatinib; MedDRA = Medical Dictionary for Regulatory Activities; PEM = pembrolizumab; SUN = sunitinib; TEAE = treatment-emergent adverse event.
Note: Percentages are based on the total number of patients in the safety analysis set within the relevant treatment group. AEs categorized under the MedDRA preferred terms “neoplasm progression,” “malignant neoplasm progression,” and “disease progression” that were unrelated to the study drug were excluded. Patients with 2 or more TEAEs reported under the same preferred term were counted only once. MedDRA-categorized AEs were included if the incidence rate was 5% or higher in any treatment group. For the LEN-PEM group, AEs categorized by preferred term were sorted in decreasing order of incidence. If the incidence rates of AEs in 2 or more categories of terms were identical, the preferred terms were sorted alphabetically. AE terms were coded using MedDRA version 23.0. Data cut-off: August 28, 2020.
Source: Clinical Study Report.9
Serious Adverse Events
The SAEs of grade 3 and higher reported in at least 1% of patients at the August 28, 2020, cut-off are presented in Table 23. SAEs of grade 3 and higher were more frequently reported in the LEN-PEM arm compared with the SUN arm (82.4% of patients receiving LEN-PEM versus 71.8% receiving SUN) by the August 28, 2020, data cut-off. The most reported SAEs (occurring in ≥ 2% of patients in either arm) were diarrhea, vomiting, pneumonitis, acute kidney injury, hypertension, pneumonia, dyspnea, adrenal insufficiency, and pyrexia.9 Table 24 summarizes the SAEs reported in patients receiving either study treatment.
Table 23: Grade 3 or Higher TEAEs Occurring in at Least 1% of Patients in Any Treatment Arm — Safety Analysis Set
TEAEs (MedDRA preferred terms) | LEN-PEM (n = 352) n (%) | SUN (n = 340) n (%) |
|---|---|---|
Patients with any TEAEs of grade 3 or higher | 290 (82.4) | 244 (71.8) |
Hypertension | 97 (27.6) | 64 (18.8) |
Diarrhea | 34 (9.7) | 18 (5.3) |
Hypertriglyceridemia | 17 (4.8) | 22 (6.5) |
Proteinuria | 27 (7.7) | 10 (2.9) |
Fatigue | 15 (4.3) | 15 (4.4) |
Weight decreased | 28 (8.0) | 1 (0.3) |
Decreased appetite | 14 (4.0) | 5 (1.5) |
Stomatitis | 6 (1.7) | 7 (2.1) |
Asthenia | 19 (5.4) | 15 (4.4) |
Lipase increased | 45 (12.8) | 30 (8.8) |
Platelet count decreased | 4 (1.1) | 21 (6.2) |
Anemia | 7 (2.0) | 18 (5.3) |
Pneumonia | 7 (2.0) | 6 (1.8) |
Thrombocytopenia | 2 (0.6) | 19 (5.6) |
Hyponatremia | 17 (4.8) | 17 (5.0) |
Hypophosphatemia | 8 (2.3) | 8 (2.4) |
Palmar-plantar erythrodysesthesia syndrome | 14 (4.0) | 13 (3.8) |
Vomiting | 12 (3.4) | 5 (1.5) |
Abdominal pain | 7 (2.0) | 3 (0.9) |
Alanine aminotransferase increased | 15 (4.3) | 8 (2.4) |
Hypokalemia | 4 (1.1) | 1 (0.3) |
Nausea | 9 (2.6) | 2 (0.6) |
Aspartate aminotransferase increased | 11 (3.1) | 3 (0.9) |
Cholecystitis acute | 2 (0.6) | 1 (0.3) |
Dyspnea | 9 (2.6) | 8 (2.4) |
Gamma-glutamyltransferase increased | 4 (1.1) | 2 (0.6) |
Pulmonary embolism | 6 (1.7) | 5 (1.5) |
Acute kidney injury | 8 (2.3) | 5 (1.5) |
Blood creatine phosphokinase increased | 4 (1.1) | 7 (2.1) |
Cholecystitis | 2 (0.6) | 1 (0.3) |
Dehydration | 3 (0.9) | 4 (1.2) |
Hyperglycemia | 7 (2.0) | 3 (0.9) |
Hyperkalemia | 12 (3.4) | 7 (2.1) |
Arthralgia | 5 (1.4) | 1 (0.3) |
Back pain | 4 (1.1) | 7 (2.1) |
Blood alkaline phosphatase increased | 3 (0.9) | 1 (0.3) |
Blood triglycerides increased | 4 (1.1) | 4 (1.2) |
Electrocardiogram QT prolonged | 10 (2.8)) | 4 (1.2) |
Urinary tract infection | 3 (0.9) | 2 (0.6) |
Amylase increased | 32 (9.1) | 10 (2.9) |
Cancer pain | 2 (0.6) | 2 (0.6) |
Gastroenteritis | 3 (0.9) | 2 (0.6) |
General physical health deterioration | 1 (0.3) | 3 (0.9) |
Headache | 2 (0.6) | 3 (0.9) |
Hypercalcemia | 0 (0.0) | 2 (0.6) |
Hypoalbuminemia | 0 (0.0) | 0 (0.0) |
Hypotension | 3 (0.9) | 2 (0.6) |
Neutropenia | 2 (0.6) | 20 (5.9) |
Neutrophil count decreased | 6 (1.7) | 19 (5.6) |
Pain | 1 (0.3) | 0 (0.0) |
Syncope | 4 (1.1) | 5 (1.5) |
Tooth infection | 2 (0.6) | 0 (0.0) |
Blood cholesterol increased | 4 (1.1) | 0 (0.0) |
Blood creatinine increased | 4 (1.1) | 2 (0.6) |
Hypercholesterolemia | 5 (1.4) | 1 (0.3) |
Hypomagnesemia | 3 (0.9) | 5 (1.5) |
Myocardial infarction | 6 (1.7) | 1 (0.3) |
Renal failure | 5 (1.4) | 1 (0.3) |
Hyperlipasemia | 5 (1.4) | 0 (0.0) |
Hypothyroidism | 5 (1.4) | 0 (0.0) |
Pleural effusion | 3 (0.9) | 4 (1.2) |
Sepsis | 3 (0.9) | 4 (1.2) |
Lymphopenia | 1 (0.3) | 4 (1.2) |
Pancreatitis | 5 (1.4) | 0 (0.0) |
Pneumonitis | 7 (2.0) | 0 (0.0) |
Rash | 13 (3.7) | 2 (0.6) |
Acute myocardial infarction | 6 (1.7) | 0 (0.0) |
Adrenal insufficiency | 4 (1.1) | 0 (0.0) |
Blood bilirubin increased | 4 (1.1) | 2 (0.6) |
Hematuria | 0 (0.0) | 4 (1.2) |
Immune-mediated hepatitis | 4 (1.1) | 0 (0.0) |
Leukopenia | 0 (0.0) | 9 (2.6) |
Lymphocyte count decreased | 4 (1.1) | 2 (0.6) |
Mental status changes | 4 (1.1) | 0 (0.0) |
Rash maculopapular | 4 (1.1) | 0 (0.0) |
White blood cell count decreased | 1 (0.3) | 6 (1.8) |
LEN = lenvatinib; MedDRA = Medical Dictionary for Regulatory Activities; PEM = pembrolizumab; SUN = sunitinib; TEAE = treatment-emergent adverse event.
Note: Percentages are based on the total number of patients in the safety analysis set within the relevant treatment group. TEAEs categorized under the MedDRA preferred terms “neoplasm progression,” “malignant neoplasm progression,” and “disease progression” that were unrelated to the study drug were excluded. The TEAEs in the lenvatinib and everolimus group are listed in the table by decreasing order of frequency. Patients with 2 or more TEAEs reported under the same preferred term were counted only once. Adverse event terms were coded using MedDRA version 23.0 and graded using Common Terminology Criteria for Adverse Events version 4.03. Data cut-off date: August 28, 2020.
Source: Clinical Study Report.9
Table 24: Serious Adverse Events of Any Grade Occurring in Patients in Any Treatment Arm — Safety Analysis Set
Serious TEAEs (MedDRA referred terms) | LEN-PEM (n = 352) n (%) | SUN (n = 340) n (%) |
|---|---|---|
Patients with any serious TEAEs | 341 (96.9) | 313 (92.1) |
Diarrhea | 192 (54.5) | 151 (44.4) |
Stomatitis | 113 (32.1) | 127 (37.4) |
Hypertension | 184 (52.3) | 133 (39.1) |
Fatigue | 113 (32.1) | 109 (32.1) |
Decreased appetite | 123 (34.9) | 84 (24.7) |
Proteinuria | 97 (27.6) | 41 (12.1) |
Nausea | 94 (26.7) | 94 (27.6) |
Hypothyroidism | 150 (42.6) | 79 (23.2) |
Dysphonia | 87 (24.7) | 9 (2.6) |
Palmar-plantar erythrodysesthesia syndrome | 99 (28.1) | 122 (35.9) |
Vomiting | 56 (15.9) | 45 (13.2) |
Weight decreased | 70 (19.9) | 19 (5.6) |
Rash | 77 (21.9) | 37 (10.9) |
Hypertriglyceridemia | 30 (8.5) | 23 (6.8) |
Dysgeusia | 38 (10.8) | 88 (25.9) |
Platelet count decreased | 20 (5.7) | 57 (16.8) |
Asthenia | 71 (20.2) | 54 (15.9) |
Epistaxis | 18 (5.1) | 30 (8.8) |
Headache | 38 (10.8) | 28 (8.2) |
Anemia | 20 (5.7) | 44 (12.9) |
Aspartate aminotransferase increased | 33 (9.4) | 30 (8.8) |
Arthralgia | 60 (17.0) | 22 (6.5) |
Pruritus | 47 (13.4) | 19 (5.6) |
Abdominal pain | 39 (11.1) | 12 (3.5) |
Alanine aminotransferase increased | 34 (9.7) | 30 (8.8) |
Thrombocytopenia | 13 (3.7) | 51 (15.0) |
Blood cholesterol increased | 12 (3.4) | 7 (2.1) |
Edema peripheral | 17 (4.8) | 17 (5.0) |
Cough | 19 (5.4) | 8 (2.4) |
Hypercholesterolemia | 18 (5.1) | 2 (0.6) |
Dyspepsia | 26 (7.4) | 42 (12.4) |
Blood creatinine increased | 23 (6.5) | 17 (5.0) |
Dry skin | 17 (4.8) | 21 (6.2) |
Constipation | 24 (6.8) | 20 (5.9) |
Blood thyroid-stimulating hormone increased | 38 (10.8) | 17 (5.0) |
Dermatitis acneiform | 2 (0.6) | 3 (0.9) |
Hyperglycemia) | 8 (2.3) | 8 (2.4) |
Abdominal pain upper | 16 (4.5) | 16 (4.7) |
Dry mouth | 28 (8.0) | 10 (2.9) |
Dyspnea | 23 (6.5) | 11 (3.2) |
Hypophosphatemia | 9 (2.6) | 7 (2.1) |
Rash maculopapular | 24 (6.8) | 5 (1.5) |
Hypokalemia | 12 (3.4) | 3 (0.9) |
Myalgia | 38 (10.8) | 8 (2.4) |
Blood triglycerides increased | 14 (4.0) | 7 (2.1) |
Lipase increased | 50 (14.2) | 34 (10.0) |
Oropharyngeal pain | 7 (2.0) | 8 (2.4) |
Pneumonitis | 18 (5.1) | 0 (0.0) |
Pyrexia | 16 (4.5) | 18 (5.3) |
Insomnia | 6 (1.7) | 4 (1.2) |
Malaise | 17 (4.8) | 11 (3.2) |
Abdominal discomfort | 7 (2.0) | 3 (0.9) |
Amylase increased | 53 (15.1) | 26 (7.6) |
Blood creatine phosphokinase increased | 9 (2.6) | 9 (2.6) |
Gamma-glutamyltransferase increased | 8 (2.3) | 4 (1.2) |
Neutrophil count decreased | 8 (2.3) | 39 (11.5) |
Oral pain | 5 (1.4) | 7 (2.1) |
Dizziness | 12 (3.4) | 11 (3.2) |
Hypomagnesemia | 13 (3.7) | 7 (2.1) |
Musculoskeletal pain | 12 (3.4) | 4 (1.2) |
Blood alkaline phosphatase increased | 10 (2.8) | 8 (2.4) |
Neutropenia | 8 (2.3) | 42 (12.4) |
Pneumonia | 3 (0.9) | 1 (0.3) |
LEN = lenvatinib; MedDRA = Medical Dictionary for Regulatory Activities; PEM = pembrolizumab; SUN = sunitinib; TEAE = treatment-emergent adverse event.
Note: Percentages are based on the total number of patients in the safety analysis set within the relevant treatment group. AEs categorized under the MedDRA preferred terms “neoplasm progression,” “malignant neoplasm progression,” and “disease progression” that are unrelated to the study drug were excluded. Treatment-related TEAEs include those considered by the investigator to be related to the study drug and those with a missing causality. The treatment-related TEAEs in the LEN plus everolimus group are listed in the table by decreasing order of frequency. Patients with 2 or more TEAEs reported under the same preferred term were counted only once. Adverse events were coded using MedDRA version 23.0. Data cut-off: August 28, 2020.
Source: Clinical Study Report.9
Mortality
By the August 28, 2020, data cut-off, all death-related events, other than “malignant neoplasm progression,” were included in the frequency counts for fatal AEs.
In total, 78 deaths (22.2%) were reported in the LEN-PEM arm and 99 deaths (29.1%) were reported in the SUN arm. Deaths that occurred during the survival follow-up phase were not reported as AEs. During that phase, there were 51 deaths (14.5%) reported in the LEN-PEM arm and 76 deaths (22.2%) in the SUN arm; in both study arms, most deaths were attributed to disease progression.9 Table 25 summarizes the number of deaths in the LEN-PEM arm versus the SUN arm.
Table 25: Summary of Deaths at Interim Analysis 3 — Safety Analysis Set
Category | LEN-PEM (n = 352) n (%) | SUN (n = 340) |
|---|---|---|
All deaths | 78 (22.2) | 99 (29.1) |
TEAEs with fatal outcomea | 27 (7.7) | 23 (6.8) |
Malignant neoplasm progression | 12 (3.4) | 12 (3.5) |
Other fatal eventsb | 15 (4.3) | 11 (3.2) |
Treatment-related | 4 (1.1) | 1 (0.3) |
Due to PD | 5 (1.4) | 9 (2.6) |
Not related to treatment or PD | 6 (1.7) | 1 (0.3) |
Deaths during the survival follow-up periodc | 51 (14.5) | 76 (22.4) |
LEN = lenvatinib; PD = progressive disease; PEM = pembrolizumab; SUN = sunitinib; TEAE = treatment-emergent adverse event.
Note: Percentages are based on the total number of patients in the safety analysis set within the relevant treatment group. Data cut-off date: August 28, 2020.
aIncludes TEAEs categorized under Medical Dictionary for Regulatory Activities preferred terms “neoplasm progression,” “malignant neoplasm progression,” and “disease progression” that were not related to the study drug.
bIncludes 4 patients (3 on LEN plus everolimus and 1 on SUN) who took new anti-cancer therapy and died more than 30 days after but within 120 days after the last dose of the study drug.
cDeaths occurred during the survival follow-up period.
Source: Clinical Study Report.9
Withdrawals, Dose Reduction, or Interruptions Due to AEs
Discontinuation Due to AEs
Overall, 13.4% of patients receiving LEN-PEM and 14.4% receiving SUN discontinued all study drugs due to TEAEs. In total, 37.2% of patients in the LEN-PEM arm discontinued a study drug due to AEs, most of which included pneumonitis, diarrhea, rash, acute myocardial infarction, proteinuria, myocardial infarction, acute kidney injury, and renal failure, which occurred in at least 1% of patients in either arm.9
In total, 25.6% of patients receiving LEN-PEM discontinued LEN due to AEs. AEs commonly associated with LEN discontinuation (in > 1% of patients) were proteinuria (1.7%), diarrhea (1.4%), myocardial infarction (1.1%), and acute myocardial infarction (1.1%). A total of 28.7% of patients discontinued PEM treatment in the LEN-PEM arm. The AEs commonly associated with discontinuation of PEM (in > 1% of patients) were pneumonitis (2.8%), rash (1.7%), diarrhea (1.1%), and alanine aminotransferase increased (1.1%).9
In total, 14.4% of patients discontinued SUN. The most common AEs associated with discontinuation of SUN were nausea (0.9%), asthenia (0.9%), fatigue (0.9%), acute kidney injury (0.9%), and metastases to CNS (0.9%).9
Dose Reduction or Interruptions Due to AEs
More patients (68.8%) receiving LEN-PEM experienced AEs leading to dose reduction compared with those receiving SUN (50.3%). The most common AEs associated with the reduction of LEN were diarrhea (15.9%), hypertension (11.6%), proteinuria (10.2%), PPE (8.8%), decreased appetite (7.7%), and nausea (5.1%).
In total, 73% of patients enrolled in the LEN-PEM arm experienced AEs leading to interruption of LEN compared with the patients receiving SUN (53.8%). The most common AEs leading to interruption of LEN were diarrhea (17.6%), hypertension (8.2%), proteinuria (7.7%), asthenia (6.3%), lipase increased (5.4%), and fatigue (5.1%). AEs leading to dose interruption of PEM were reported in 55.1% of patients in the LEN-PEM arm. The AEs that commonly led to dose interruption of PEM were diarrhea (10.2%), lipase increased (5.1%), asthenia (4.5), alanine aminotransferase increased (3.4%), amylase increased (4%), aspartate aminotransferase increased (2.6%), and fatigue (2.6%).9 The most common AEs leading to dose modifications in patients receiving SUN were PPE (12.6%), hypertension (9.7%), platelet count decreased (10%), diarrhea (8.2%), fatigue (8.2%), thrombocytopenia (7.1%), stomatitis (6.2%), and neutropenia (6.2%). Dose reduction of SUN was commonly associated with platelet decrease (8.8%), diarrhea (5%), hypertension (4.7%), asthenia (3.8%), and fatigue (6.8%).
Notable Harms
The notable harms identified in both the LEN-PEM arm and the SUN arm in the CLEAR trial included hypertension, hypothyroidism, hepatotoxicity, proteinuria, hemorrhage, renal events, PPE events, QT prolongation, gastrointestinal perforation, arterial thromboembolic events, hypocalcemia, cardiac dysfunction, arterial thromboembolic events, posterior reversible encephalopathy syndrome, and fistula formation. Table 26 presents a summary of the proportion of patients reporting these AEs in the LEN-PEM arm versus the SUN arm. A higher proportion of reports was observed in the LEN-PEM arm for hypertension, hypothyroidism, hepatotoxicity, proteinuria, and QT prolongation compared with the SUN arm.9
Table 26: Notable Harms Common in the LEN-PEM and SUN Arm at Interim Analysis 3 — Safety Analysis Set
Notable harms, n (%) | LEN-PEM (n = 352) | SUN (n = 340) | ||
|---|---|---|---|---|
All events | Grade ≥ 3 | All events | Grade ≥ 3 | |
Hypertension | 198 (56.3) | 101 (28.7) | 145 (42.6) | 66 (19.4) |
Hypothyroidism | 200 (56.8) | 5 (1.4) | 109 (32.1) | 0 |
Hepatotoxicity | 96 (27.3) | 35 (9.9) | 82 (24.1) | 18 (5.3) |
ALT increased, % | 11.9 | NR | 10.3 | NR |
AST increased, % | 11.1 | NR | 10.9 | NR |
Blood bilirubin increased, % | 4.0 | NR | 4.4 | NR |
Gamma-glutamyl transferase increased, % | 3.4 | NR | 1.5 | NR |
Proteinuria | 104 (29.5) | 27 (7.7) | 43 (12.6) | 10 (2.9) |
Hemorrhage | 96 (27.3) | 18 (5.1) | 90 (26.5) | 13 (3.8) |
Palmar-plantar erythrodysesthesia syndrome | 104 (29.5) | 14 (4.0) | 129 (37.9) | 13 (3.8) |
Renal events | 78 (22.2) | 20 (5.7) | 60 (17.6) | 8 (2.4) |
QT prolongation | 23 (6.5) | 10 (2.8) | 13 (3.8) | 4 (1.2) |
Arterial thromboembolic events | 19 (5.4) | 13 (3.7) | 7 (2.1) | 2 (0.6) |
Gastrointestinal perforation | 5 (1.4) | 4 (1.1) | 3 (0.9) | 1 (0.3) |
Hypocalcemia | 5 (1.4) | 1 (0.3) | 9 (2.6) | 1 (0.3) |
Cardiac dysfunction | 9 (2.6) | 6 (1.7) | 7 (2.1) | 4 (1.2) |
Fistula formation | 2 (0.6) | 0 | 2 (0.6) | 1 (0.3) |
Posterior reversible encephalopathy syndrome | 2 (0.6) | 2 (0.6) | 1 (0.3) | 0 |
ALT = alanine aminotransferase; AST = aspartate aminotransferase; LEN = lenvatinib; NR = not reported; PEM = pembrolizumab; QT = heart rate QT interval; SUN = sunitinib.
Note: Data cut-off date was August 28, 2020.
Source: Clinical Study Report.9
Critical Appraisal
Internal Validity
The CLEAR trial is a randomized, parallel-arm design. Treatment allocation was performed centrally using an IxRS, allowing patients to be randomly assigned to any 1 of the predefined study arms in a 1:1:1 ratio. The study was stratified based on 2 factors: geographic region and the MSKCC prognostic risk groups. The baseline and demographic characteristics were balanced within the 2 study arms of interest, other than a slight imbalance in age between the LEN-PEM and SUN arms (i.e., there were more patients younger than 65 years old in the SUN arm and more patients older than 65 years in the LEN-PEM arm), suggesting that randomization was implemented successfully.
The CLEAR trial is an open-label trial that is open to patients and investigators. The pre-specified dosage of lenvatinib is different for each study arm, and the treatment administration schedules between everolimus, PEM, and SUN are also different. The open-label design introduces a potential bias in the assessment of PFS, ORR, DOR, and DCR, and a potential reporting bias of subjective outcomes such as HRQoL and safety. To minimize the risk of differential measurement error, the sponsor performed tumour assessments using RECIST 1.1 criteria and radiographic scans were assessed by an IIR team. The RECIST guideline was considered appropriate by the CADTH reviewers, given that it has been used in many oncology trials and in real-world settings by regulatory agencies, including Health Canada, to assess tumour changes.29 Tumour scans and assessments were also performed by an approved independent core laboratory.
There was a low risk of bias owing to the use of non-protocol interventions. Patients were permitted to receive anti-cancer therapy only in the follow-up phase (after study treatments had been discontinued). More patients in the SUN arm (57.7%) received post-treatment anti-cancer therapies compared with the LEN-PEM arm (33%), which may have introduced bias in the assessment of OS. A post hoc analysis of survival conducted by the sponsor at the August 28, 2020, data cut-off suggested that anti-cancer medications received post-treatment might have biased the OS estimates in the opposite direction (did not favour the LEN-PEM treatment). CADTH considered the post hoc analysis appropriate to assess the impact of subsequent anti-cancer therapy on OS.
CADTH found there was a low risk of selective reporting bias in the CLEAR study, as the sponsor analyzed data in accordance with the pre-specified statistical plan, which was finalized before the unblinded data were available for the analyses. The sponsor reported findings for all pre-specified analyses outlined in the study protocol. All safety data occurring in the treatment arms were also reported.
The PFS and OS investigated during the CLEAR trial were considered appropriate outcomes for patients with advanced and metastatic RCC, according to the clinical experts consulted. The censoring rules for PFS were pre-specified based on guidance documents,21,22 and sample size and power calculations were based on PFS. The Cox proportional hazard model, which relies on the assumption of proportional hazards in both treatment groups, was used. A violation of the proportional hazard assumption may lead to bias in estimates in the regression model. It was not clearly stated in the sponsor’s statistical analysis plan whether the proportional hazard assumption was assessed formally and whether it was violated or not. It is also unclear whether adjustments were made to meet the proportional hazard assumption in the study. The visual assessment of the PFS survival curves did not suggest any violation of the proportional hazard assumption. Survival curves were estimated using the Kaplan-Meier model. The median OS was not estimated in either treatment arm at the 2 data cut-offs (August 28, 2020, and March 31, 2021). CADTH considered the benefit of LEN-PEM in improving OS in patients with advanced RCC to be uncertain, owing to data immaturity in the trial.
HRQoL was assessed as a secondary outcome in the CLEAR trial using the FKSI-DRS, EORTC QLQ-C30, and EQ-5D-3L questionnaires. There is a potential for reporting bias owing to the open-label nature of the trial. The FKSI-DRS questionnaire has been validated in patients with RCC with evidence of reliability and responsiveness. Although the EORTC QLQ-C30 and EQ-5D-3L have been widely used in oncology trials in different cancer populations, these questionnaires have not been validated in patients with advanced or metastatic RCC. The clinical experts consulted highlighted that all 3 scales were appropriate for assessing patient-reported outcomes in RCC patients. In the opinion of the clinical experts, these scales are most sensitive to changes in symptoms related to RCC but are not sensitive to detecting changes in symptoms due to TRAEs. HRQoL outcomes had missing data at later time points, as evidenced by the declined rates of questionnaire completion: below 50% at cycle 26 for LEN-PEM and at cycle 12 for the SUN arm owing to treatment discontinuation, thus impacting the interpretability of trends over time and raising the potential for biased results from patients who remained in the trial. The sponsor did not provide details on how missing data were handled during the analyses. It is unclear whether the methods used for handling missing data introduced bias in the findings presented. The benefit of LEN-PEM in improving HRQoL over time was considered uncertain by the CADTH reviewers, owing to the potential of reporting and attrition bias.
The sponsor assumed that a median PFS of 12.3 months in the SUN arm and an HR of 0.714 in the comparisons between the study arms (LEN-PEM against SUN and LEN plus everolimus against SUN) and SUN in their hypothesis tests. According to the sponsor, this corresponds to a 40% improvement (4.9 months) in median PFS (from 12.3 months to 17.2 months) in both study arms (LEN plus everolimus and LEN-PEM) against the SUN arm. The sponsor also provided threshold margins for the ORR and OS outcomes. The sponsor did not provide a rationale for using the margins for PFS, OS, and ORR in the statistical plan. The clinical experts consulted during the review considered the threshold margins for PFS, ORR, and OS to be clinically meaningful.
The PFS, OS, and ORR estimates obtained at the August 28, 2020, cut-off (including the OS follow-up analysis of March 31, 2021) were considered robust because multiplicity adjustments were performed during analysis. The type I error rate was adjusted using the overall familywise error rate approach, which was considered appropriate by the CADTH reviewers. Sensitivity analyses and adjustments of covariates were conducted for PFS, and the findings were consistent with the primary analysis in the ITT set. Multiplicity adjustments were not conducted for other secondary and exploratory end points (DOR, DCR, and HRQoL), including the analysis of subgroups.
All subgroup analyses were pre-specified in the protocol. No statistical tests of interaction were conducted for subgroups to test whether treatment effects differed among subgroups and other exploratory outcomes. The sample size for the subgroup analyses (IMDC prognostic risk groups) was small and possibly underpowered to detect a statistically meaningful difference between the study arms. Multiplicity adjustments were not made in these analyses; therefore, the P values reported were considered nominal. The magnitude of efficacy for subgroups was considered uncertain.
All interim analyses conducted were planned a priori, and stopping rules were pre-specified in the protocol. Alpha levels were properly accounted for in each of the analyses conducted. The approaches used to preserve alpha and the power in the interim analyses were considered appropriate by the CADTH reviewers.
More patients discontinued study treatment in the SUN arm (76.5%) compared with the LEN-PEM arm (59.5%). Patients were not allowed to cross over from 1 arm to the other in the CLEAR trial, which reduced bias. Treatment discontinuations had minimal impact on the analysis of PFS and OS because missing values and dropouts were handled using conservative approaches (patients who discontinued study treatments were censored for the PFS analysis but remained in the follow-up phase and were assessed for OS unless they withdrew consent). The ITT and per-protocol sets were used to assess the primary and secondary outcomes to account for missing data and unbalanced treatment discontinuations between study arms. Consistency in the results between both analysis sets was assessed by the sponsor and no major differences were reported between both sets. The CADTH reviewers considered that appropriate methods were used to control attrition for the analysis of the primary and key secondary outcomes.
Reduced drug exposure due to nonadherence and reduced dose intensity could potentially underestimate AEs and efficacy, leading to an overestimation of dose intensity.30 CADTH considered that there was a low risk of bias owing to nonadherence to protocol interventions in the CLEAR trial because few patients were reported as having major protocol deviations and these numbers were equally distributed across the 2 study arms of interest. All protocol deviations led to a censoring event for PFS by IIR. According to the sponsor’s dose intensity calculations presented, adherence bias was not considered a potential issue by the CADTH reviewers, given that all dose adjustments for study drugs were pre-specified in the protocol and recorded for each study drug. CADTH noted that patients in the LEN-PEM arm had longer exposure to treatment (mean = 17.29 months) compared with patients receiving SUN (mean = 11.33 months), which may have influenced the reporting of AEs in both study arms.
External Validity
Table 27 summarizes the generalizability of the evidence from the CLEAR trial. The population requested for the reimbursement aligns with the Health Canada indication. The clinical experts consulted during the CADTH review agreed that the inclusion and exclusion criteria of the CLEAR trial were appropriate for the RCC population under consideration. The experts also noted that the baseline characteristics of patients in the CLEAR trial are generalizable to patients in the Canadian setting.
LEN 20 mg, taken orally once daily, was administered with PEM 200 mg IV every 3 weeks following a 21-day cycle. The dosage aligns with the Health Canada indication. In the CLEAR trial, patients were also allowed to discontinue either 1 of the study drugs in the treatment phase. Dose adjustments or modifications were allowed in the trial and the methods were outlined in the protocol. According to the clinical experts consulted, dose adjustments or modifications are anticipated in a clinical practice setting to manage AEs while maintaining drug benefit. The clinical experts also noted that the discontinuation of 1 treatment while the patient continues another is frequently observed in practice for drug combinations.
SUN is an approved treatment option for untreated patients with metastatic RCC in Canada. It was considered an appropriate comparator because it was available as a standard-of-care option for RCC patients in the first-line setting when the CLEAR trial was initiated. As noted by the clinical experts, AXI-PEM and other standard-of-care treatments were not available when the CLEAR trial was initiated.
Table 27: Assessment of Generalizability of Evidence for LEN-PEM
Domain | Factor | Evidence | CADTH’s assessment of generalizability |
|---|---|---|---|
Population | CNS metastasis | Patients with CNS metastasis (except patients with locally treated CNS metastases who had discontinued related corticosteroid therapy ≥ 4 weeks before initiation of study treatment) were excluded from the trial. | The magnitude of benefit of LEN-PEM is uncertain for patients with active disease. The clinical experts consulted during the review noted that patients identified in practice having new or unstable CNS metastasis will not be eligible to receive treatment as per the eligibility criteria of the CLEAR trial. However, the experts indicated that patients who had been previously treated for brain metastasis may benefit from the treatment. |
Prior systemic therapy | Patients that had received prior systemic anti-cancer therapy for RCC were excluded from the trial. | The magnitude of benefit of LEN-PEM in this population is uncertain. However, this population is outside the indication submitted to Health Canada. | |
Significant cardiac impairment | Patients with a history of a significant cardiac impairment within the past 12 months. | The magnitude of benefit of LEN-PEM in this population is uncertain. | |
KPS score | Only patients with a KPS score of ≥ 70 were recruited in the CLEAR trial. | According to the clinical experts consulted, patients with a KPS < 70 have poor performance status and will generally not benefit from the treatment. The magnitude of benefit in this population is uncertain. | |
Histology | Patients were expected to have at least a clear cell component in tumour histology to be eligible for the CLEAR trial. | The clinical experts noted that patients were eligible for the CLEAR trial if they had at least a clear cell component in tumour histology. Therefore, patients in clinical practice could benefit from therapy if they have an identified clear cell histology in addition to other features. | |
Frequency of disease assessments and follow-up duration | Patients in the CLEAR trial underwent frequent assessments for tumour and safety outcomes. Tumour assessments were conducted every 8 weeks, including bone scans (performed every 24 weeks), until documented disease progression or initiation of new anti-cancer therapy, withdrawal of consent, or lost to follow-up. In the CLEAR trial, patients were followed when they went off treatment. They were followed every 12 weeks for PFS2, survival, and subsequent anti-cancer therapy. | The clinical experts consulted during the review indicated that the frequency and duration of the trial assessments and the follow-up frequencies implemented were appropriate to investigate the outcomes. In the real-world setting, the clinical experts consulted noted that tumour assessments are conducted less frequently, although patients are constantly monitored for treatment-related AEs. The clinician group consulted highlighted that assessments in practice are based on patient history, physical examination, and radiographic imaging (most commonly CT scans, usually taken every 2 to 3 months). | |
Subsequent anti-cancer medications and concomitant non-cancer medications | Concomitant non-cancer medications were allowed in the trial. Subsequent anti-cancer therapies were administered to patients in both groups during the follow-up phase of the trial. | The concomitant medications allowed during the trial and subsequent anti-cancer therapies administered to patients in the follow-up phase were considered appropriate by the clinical experts consulted, and reflective of medications administered in the Canadian setting. The clinical experts acknowledged that patients are likely to receive concomitant therapies in practice to treat AEs and may require subsequent anti-cancer therapies consistent with those outlined in the CLEAR study protocol. The clinical experts did not identify any medications that may confound the results obtained in both groups. | |
Intervention | LEN-PEM | LEN 20 mg orally, once daily, with PEM 200 mg IV every 3 weeks or on a 21-day cycle. | According to the clinical experts consulted, the PFS estimated in the LEN-PEM arm was double that obtained in the SUN arm. The clinical experts considered the tumour response in the LEN-PEM arm to be large compared with the SUN arm. The clinical experts considered LEN-PEM comparable with AXI-PEM, which is used in practice. According to the clinical expert consulted, the probability of choosing LEN-PEM over AXI-PEM in practice would be 50/50 if funding for LEN-PEM were granted. Given the similarities in the safety profile of LEN-PEM vs. AXI-PEM (as noted by the clinician expert, both treatments require frequent monitoring of AEs and an anticipated dose adjustment, as seen for other treatments used in this setting), the clinical expert expressed that the main strength of the LEN-PEM treatment is the substantial tumour response observed against SUN. The clinical experts did not identify any major AEs that would lead to the selection of LEN-PEM over AXI-PEM in practice. |
Comparator | SUN | SUN (50 mg orally once daily) was administered to patients for 4 weeks followed by 2 weeks off. Other relevant treatment regimens (listed in the systematic review protocol) are not considered in the CLEAR trial. An indirect treatment comparison was submitted by the sponsor. | The treatment dose administered during the trial aligns with the Health Canada–approved dosing. Adjustments were allowed for patients receiving SUN during the trial. According to the clinical experts, adjustments are common for SUN in the Canadian practice setting. The magnitude of benefit for LEN in combination with PEM compared with other relevant treatment regimens available in practice has been investigated through the sponsor’s indirect treatment comparison submitted. |
Outcomes | PFS, OS, ORR, DOR, DCR, and HRQoL | PFS was the primary outcome, while OS and ORR were the key secondary outcomes investigated. All 3 outcomes had a formal hypothesis testing performed and type I error rate accounted for. The ITT set was used to assess the outcomes. | The clinical experts consulted during the CADTH review highlighted that the PFS and tumour response (ORR and DCR) were clinically meaningful and doubled that expected of SUN in practice. They considered the results clinically relevant. The experts highlighted that the safety profile of SUN and LEN-PEM arm seemed comparable. The clinical expert also noted similarities in the safety profile of LEN-PEM with AXI-PEM, which is currently used in practice. The clinical expert indicated that treatment-related toxicity from LEN-PEM will require similar strategies to those already in place (frequent monitoring of AEs, dose adjustments, modifications, or discontinuations) for other options (SUN, AXI-PEM). |
Setting | Multinational, multi-centre study | More than 200 sites in North America (41), Europe (93), Asia (41), and Australia (6); there were 6 sites in Canada. | There were 6 sites in Canada. The clinical experts acknowledge that these findings are generalizable to Canadian patients. |
AE = adverse event; AXI = axitinib; CNS = central nervous system; DCR = disease control rate; DOR = duration of response; HRQoL = health-related quality of life; ITT = intention to treat; KPS = Karnofsky Performance Status; LEN = lenvatinib; ORR = objective response rate; OS = overall survival; PEM = pembrolizumab; PFS = progression-free survival; PFS2 = PFS with next line of therapy; SUN = sunitinib.
Indirect Evidence
Objectives and Methods for the Summary of Indirect Evidence
The aim of this section was to appraise the indirect evidence used to inform the pharmacoeconomic model and to identify indirect comparisons that fill gaps in the evidence from the systematic review. Although direct evidence is available on the efficacy and safety of LEN-PEM versus SUN, comparative efficacy studies versus other first-line treatments for advanced or metastatic RCC of interest were not identified in the systematic literature search.
A focused literature search for NMAs dealing with at least 1 of the following search terms, “renal carcinoma” or “lenvatinib” in combination with “pembrolizumab,” was run in MEDLINE All (1946–) on December 9, 2021. No limits were applied.
Four potentially relevant ITCs were identified in the literature in addition to the sponsor-submitted NMA. This section will appraise the sponsor-submitted NMA, and the following section will appraise published ITCs.
Description of Sponsor-Submitted NMA
The sponsor submitted an ITC that evaluated the efficacy and safety of LEN-PEM in patients with advanced RCC.
Objectives
The objective of the sponsor-submitted ITC was to assess the comparative clinical efficacy and safety of LEN-PEM compared with other first-line treatments currently approved, recommended, or under development in advanced RCC, based on evidence from RCTs.
Study Selection Methods
The selection of studies used to inform the NMA was based on a systematic literature review, described in Table 28. The review included phase II and III RCTs in adults with advanced or metastatic RCC without prior lines of systemic therapy who received first-line systemic treatments for advanced or metastatic RCC administered alone or in combination (Table 28), best supportive care, or placebo, and reported on 1 of the efficacy outcomes (PFS, OS, ORR, PD, DOR, time to next treatment) or safety outcomes of interest (patients with discontinuations, treatment discontinuation due to AEs, total all-cause grade 3 or higher AEs, total grade 3 or higher TRAEs, duration on intervention, and subsequent treatments). Studies were limited to English-language reports and excluded trials based on the exclusion criteria described in Table 28. The literature search included multiple electronic databases (up to June 2021) and other sources such as grey literature, bibliography review, and client results. Reports were screened independently by 2 researchers, with disagreements resolved by a third reviewer. Data were extracted by 1 researcher and verified by another. The quality assessment of all RCTs was conducted using the Cochrane risk-of-bias assessment tool (version 2.0).
Table 28: Study Selection Criteria and Methods for Sponsor-Submitted NMA
Criteria | Sponsor-submitted NMA |
|---|---|
Population | Adults with advanced RCC with no prior lines of systemic therapy Subgroups: Histology, risk level, mutation status (all SLRs), progression status (SLRs 3 and 4 only) |
Interventiona | First-line systemic treatments for advanced RCC administered alone or in combination, including:
|
Comparator | BSC, placebo, and other first-line treatments alone or in combination (see intervention) |
Outcome | Efficacy: PFS, OS, ORR, PD, DOR, and time to next treatment Safety and treatment patterns: Patients with discontinuations, treatment discontinuation due to AEs, total all-cause grade 3+ AEs, total grade 3+ TRAEs; duration on intervention and subsequent treatments |
Study design | RCTs (a minimum of 2-arm parallel phase II or III trials) |
Publication characteristics | English-language only |
Exclusion criteria | Population: Pediatric populations, early-stage or locally advanced disease, carcinomas other than RCC or kidney cancer, prior systemic treatment experience Interventions: Second- or later-lines of systemic treatment, surgery, radiotherapy, adjuvant or neo-adjuvant chemotherapy, treatments for symptom management Comparators: Surgery, radiotherapy, or other comparators that are not first-line systemic treatments for advanced RCC Study design: Single-arm trials, non-randomized trials, and other study designs not listed for each review |
Databases searched | Embase, PubMed, Cochrane Database of Systematic Review, and CENTRAL (conducted on March 27, 2019, updated 3 times, most recently in June 2021) Other sources: Grey literature, bibliography review, client results |
Selection process | Abstract (level 1) and full-text (level 2) publications were screened independently by 2 researchers. Disagreements were resolved by a third reviewer |
Data extraction process | Information from the accepted studies was extracted into a pre-specified data extraction form by 1 researcher and reviewed by another researcher |
Quality assessment | Cochrane risk-of-bias assessment tool 2.0 |
AE = adverse event; BSC = best supportive care; CENTRAL = Cochrane Central Register of Controlled Trials; DOR = duration of response; NMA = network meta-analysis; ORR = overall response rate; OS = overall survival; PD = progressive disease; PFS = progression-free survival; RCC = renal cell carcinoma; RCT = randomized controlled trial; SLR = systematic literature review; TRAE = treatment-related adverse event.
aDosing was not specified in the study selection protocol.
bInterventions include: Axitinib, avelumab plus axitinib, atezolizumab plus bevacizumab, bevacizumab, bevacizumab plus erlotinib, bevacizumab plus everolimus, bevacizumab plus interferon, bevacizumab plus low-dose interferon, cabozantinib, erlotinib, everolimus, high-dose interleukin-2, lenvatinib plus everolimus, nivolumab, nivolumab plus cabozantinib, nivolumab plus ipilimumab, pazopanib, pembrolizumab plus axitinib, sorafenib, sunitinib, temsirolimus, and tivozanib.
cGrey literature, bibliography review, client results.
Source: Sponsor-submitted indirect treatment comparison (Evidera).31
Methods of Sponsor-Submitted NMA
ITC Analysis Methods
A feasibility assessment was conducted to determine whether a connected network comparing the treatments of interest using the outcomes of interest could be constructed, and if any differences in the characteristics of the included RCTs, including common comparators and network connections, patient characteristics (histology, cancer stage, risk score, other patient characteristics), or trial outcomes (outcome assessment, survival analysis, subgroup definitions, and follow-up duration) may be modifiers.
A Bayesian NMA using an FE or RE model was conducted due to the presence of multiple studies per comparison to account for potential substantial heterogeneity of the network. Model fit was assessed by comparing the DIC and the posterior mean of the residual deviance for the FE and RE models. A substantially better-fitting model was identified by DICs that are lower by more than 5 points. An FE model was run for every scenario and chosen as the basis for the interpretation of results when only single-study comparisons existed within the network; RE models were considered based on the goodness-of-fit assessment (DIC greater than 3 to 5 points), heterogeneity (I2 > 50% for any direct comparison), or statistically significant inconsistency between results from direct evidence versus indirect evidence within closed loops in a network. Of note, the author reported that the RE model was considered the default in networks with at least 2 instances of comparisons of at least 2 studies, given that the FE model assumption of homogeneity is unrealistic.
All Bayesian NMAs used a non-informative prior (N) of N(0 to 10,000) for the baseline effects and treatment effects. The RE NMAs used somewhat informative priors with a uniform distribution (U) for the standard deviations, specifically, U(0 to 0.4) for PFS and OS, and U(0 to 1) for binary outcomes. These were chosen to allow for a moderate to large variation, but to discourage the estimation of extreme values. Sensitivity analyses explored the influence of these priors. All Bayesian analyses used Markov chain Monte Carlo simulations with a 100,000 iteration burn-in and 3 sets of 100,000 iterations (posterior samples) for parameter estimation. Model convergence was assessed through inspection of ratios of Monte Carlo error to standard deviations of the posteriors. Where necessary, convergence was confirmed using plots of 3 chains. Issues related to convergence were handled by increasing the run-in and/or examination of other factors, such as choice of prior and starting values.
Inconsistency was assessed by comparing the results of the Bucher ITCs with that of direct evidence. Of note, comparators of interest to this review were not involved in a closed loop within the network. Heterogeneity for each comparison was assessed by conducting classical pairwise meta-analyses and calculating I2. Where statistical heterogeneity was identified, study and patient characteristics were further reviewed to determine whether there were any clinically relevant effect modifiers. Potential effect modifiers were reviewed and handled by either study exclusion, sensitivity analysis, or subgroup analysis. Sensitivity analyses were planned that assessed the difference across potential effect modifiers, such as the differences between the enrolment of patient populations with 100% clear cell histology and differences in follow-up durations (based on a cut-off of less than 12 months or more than 12 months). Additionally, sensitivity analyses that considered the equivalence of SUN, PAZO, and tivozanib (treated as 1 node) were also performed. The planned subgroup analyses were to assess outcomes by risk subgroup. More specifically, sensitivity analysis 3 (risk subgroups: MSKCC = IMDC) and sensitivity analysis 11 (risk subgroups: IMDC = MSKCC) evaluated the assumption that the IMDC and MSKCC risk score definitions were equivalent. If both the IMDC and MSKCC definitions were available for a single trial, MSKCC was prioritized in sensitivity analysis 3 and IMDC was prioritized in sensitivity analysis 11. Two subgroup analyses, where only trials reporting IMDC definitions were included (sensitivity analysis 4) or only trials reporting MSKCC definitions were included (sensitivity analysis 5), were also performed.
For base-case analyses, separate nodes were used for interventions and comparators within the networks and only treatment and associated standard dosing were inputted into the model. Differences in time point assessments and actual treatment duration were acknowledged as a limitation; no studies were excluded, and sensitivity analyses were conducted that excluded 2 studies with a follow-up duration of less than 12 months. The excluded studies did not involve comparators of interest for this review.
Regarding the handling of missing data, 1 study digitized a Kaplan-Meier curve for PFS to estimate the HR (and standard errors of the log HR), which was not provided in the publication. No other studies were missing data related to OS or PFS. The ITT denominator was used for response outcomes and no calculations were applied to exclude unknown or unevaluable responses if included in the ITT denominator.
Table 29: Sponsor-Submitted NMA Analysis Methods
Analysis methods | Sponsor-submitted NMA |
|---|---|
ITC methods |
|
Priors |
|
Assessment of model fit | Explored by comparing DIC and the posterior mean of the residual deviance for the FE and RE models. A difference of greater than 3 to 5 points was considered meaningful (Dias, 2013); non-meaningful goodness of fit was not, in and of itself, considered a justifiable reason for selection of an FE or RE model |
Assessment of consistency | Inconsistency assessed by comparing the results of the Bucher ITCs with that of direct evidence |
Assessment of convergence | Inspection of the ratios of Monte Carlo error to the standard deviations of the posteriors; where necessary, convergence will be confirmed through the use of plots of the 3 chains |
Outcomes |
|
Follow-up time points |
The varying time points were acknowledged as a limitation, but none of the studies were excluded, as the studies with durations of follow-up that were outliers are necessary to make comparisons to tivozanib |
Construction of nodes | Comparators: Different IFN alpha-2a treatments were considered equivalent; sunitinib and pazopanib were assessed as a single treatment node |
Sensitivity analyses | 11 sensitivity analyses were performed to assess:
|
Subgroup analysis | Subgroup analyses were conducted by risk subgroups defined by MSKCC and IMDC criteria |
Methods for pairwise meta-analysis | Used to assess heterogeneity by calculating I2 |
AE = adverse event; DIC = deviance information criterion; EMA = European Medicines Agency; FE = fixed effects; IFN = interferon; IMDC = International Metastatic Renal Cell Carcinoma Database Consortium; IRC = independent review committee; ITC = indirect treatment comparison; MSKCC = Memorial Sloan Kettering Cancer Center; NMA = network meta-analysis; OS = overall survival; PFS = progression-free survival; PD-L1 = programmed cell death 1 ligand 1; RE = random effects; RECIST 1.1 = Response Evaluation Criteria in Solid Tumours version 1.1; SD = standard deviation.
aPFS, according to FDA censoring criteria, included progression date assigned to the earliest date when any RECIST 1.1–defined disease progression is observed without missing more than 1 adequate radiologic assessment (FDA, 2018).
bPFS, according to EMA censoring criteria, included using the actual date of progression reported by an independent imaging review or death to define PFS, regardless of missing assessments, or use of a new anti-cancer therapy (EMA, 2019).
Source: Sponsor-submitted ITC (Evidera).31
Results of Sponsor-Submitted NMA
Summary of Included Studies
Twenty-four trials were included in the network informing the NMA. Most of the studies were phase II or phase III open-label RCTs (19 studies), 2 were phase III double-blind RCTs, and 3 were phase II or III studies that did not report blinding. The studies enrolled patients between 1992 and 2019 and the study sample sizes ranged from 101 to 1,110 patients. A total of 18 studies reported on the timing of response assessments, which varied across studies from every 6 weeks to every 12 weeks. One study (Negrier [1998]) was excluded from the base-case analysis due to differences in the response criteria. The sponsor indicated that PFS was consistently defined as the time to disease progression or death assessed by investigator or IRC review. The follow-up duration varied between trials, with multiple outcome assessment times according to different data cut-offs. The sponsor indicated that most studies reported outcomes at follow-up durations of 20 to 25 months, with the exception of a few outliers, and acknowledged this as a limitation.
A summary of the patient characteristics of included trials is presented in Appendix 4 (Table 39). Among the 24 trials, the median age of the study populations ranged from 55 years to 68 years, and more than half of patients were male (range, 56.5% to 83.5%). From the 8 studies that reported information about ethnicity, the majority of patients were White (69% to 97%), followed by Asian (1% to 25%) or Black (0% to 3%). Trials included in the network described patients by risk category using the MSKCC criteria (16 studies), IMDC criteria (5 studies), or both (2 studies). Where baseline risk was reported (in all but 1 study), 23.5% to 81% of patients in each treatment group were classified as intermediate risk. Three studies recruited only patients who were classified as intermediate or poor risk (Choueiri [2017]; Hudes [2007]; Zurita [2018]). Performance status was reported using the Karnofsky scale (11 studies) and the ECOG scale (12 studies) or not reported (1 study). In most of the studies included in the network (21 studies), the majority of patients had either a Karnofsky score of at least 70 or an ECOG score of 0 or 1 (less than 13% of patients included in 4 studies had an ECOG score of 2, and 80% to 83% of patients in 1 study had a Karnofsky score of 70 or less). In all studies that reported information regarding histology (21 studies), the most common histological RCC subtype was clear cell, with at least 78% of patients possessing clear cell or predominantly clear cell histology location. All included studies enrolled patients with metastatic or advanced metastatic cancer. Ten studies specified the American Joint Committee on Cancer (AJCC) cancer stage; at least 95% of the patients enrolled in 8 studies had stage IV cancer while, in the remaining 2 studies (including CLEAR), 40% to 55% had stage IV cancer. In 11 studies, between 56.5% and 89% of patients had at least 2 metastases; the lungs were the most common site of metastasis, representing more than 50% of the metastatic sites in the 17 studies that reported metastasis location. Lastly, 6 studies reported PD-L1 expression status at baseline and the proportion of patients with less than 1% PD-L1–positive cells ranged from 29% to 77%.
Table 30: Assessment of Homogeneity for Sponsor-Submitted NMA
Assessment | Description and handling of potential effect modifiers |
|---|---|
Disease severity: Risk status |
|
Disease severity: Staging |
|
Treatment history | Eligibility criteria specified patients with no prior lines of systemic therapy; however, some studies included a mix of patients who had received first-line and second-line treatment |
Clinical trial eligibility criteria | Approximately one-third of studies exclusively enrolled patients with metastatic cancer as opposed to patients with advanced or metastatic |
Dosing of comparators |
|
Definitions of end points |
|
Timing of end point evaluation or trial duration | The timing of response assessments varied across the 18 studies providing these details (q.6.w, q.8.w, q.12.w). One study (Negrier, 1998) provided a response assessment only at 10 weeks and was excluded from the base-case analysis |
Withdrawal frequency | Not reported |
Clinical trial setting | Not reported |
Study design |
|
IFN = interferon; IMDC = International Metastatic Renal Cell Carcinoma Database Consortium; MSKCC = Memorial Sloan Kettering Cancer Center; NMA = network meta-analysis; PD-L1 = programmed cell death 1 ligand 1; PFS = progression-free survival; q.6.w. = every 6 weeks; q.8.w. = every 8 weeks; q.12.w. = every 12 weeks; RECIST = Response Evaluation Criteria in Solid Tumours; RCC = renal cell carcinoma; RCT = randomized controlled trial.
Source: Sponsor-submitted indirect treatment comparison (Evidera).31
Results
A global network diagram for the NMA is presented in Figure 11. The network included 22 comparators from 24 RCTs (N = 12,577, based on the sum of the reported study sample sizes, excluding 1 study that did not report sample size.)
Figure 11: Network Diagram for Sponsor-Submitted NMA
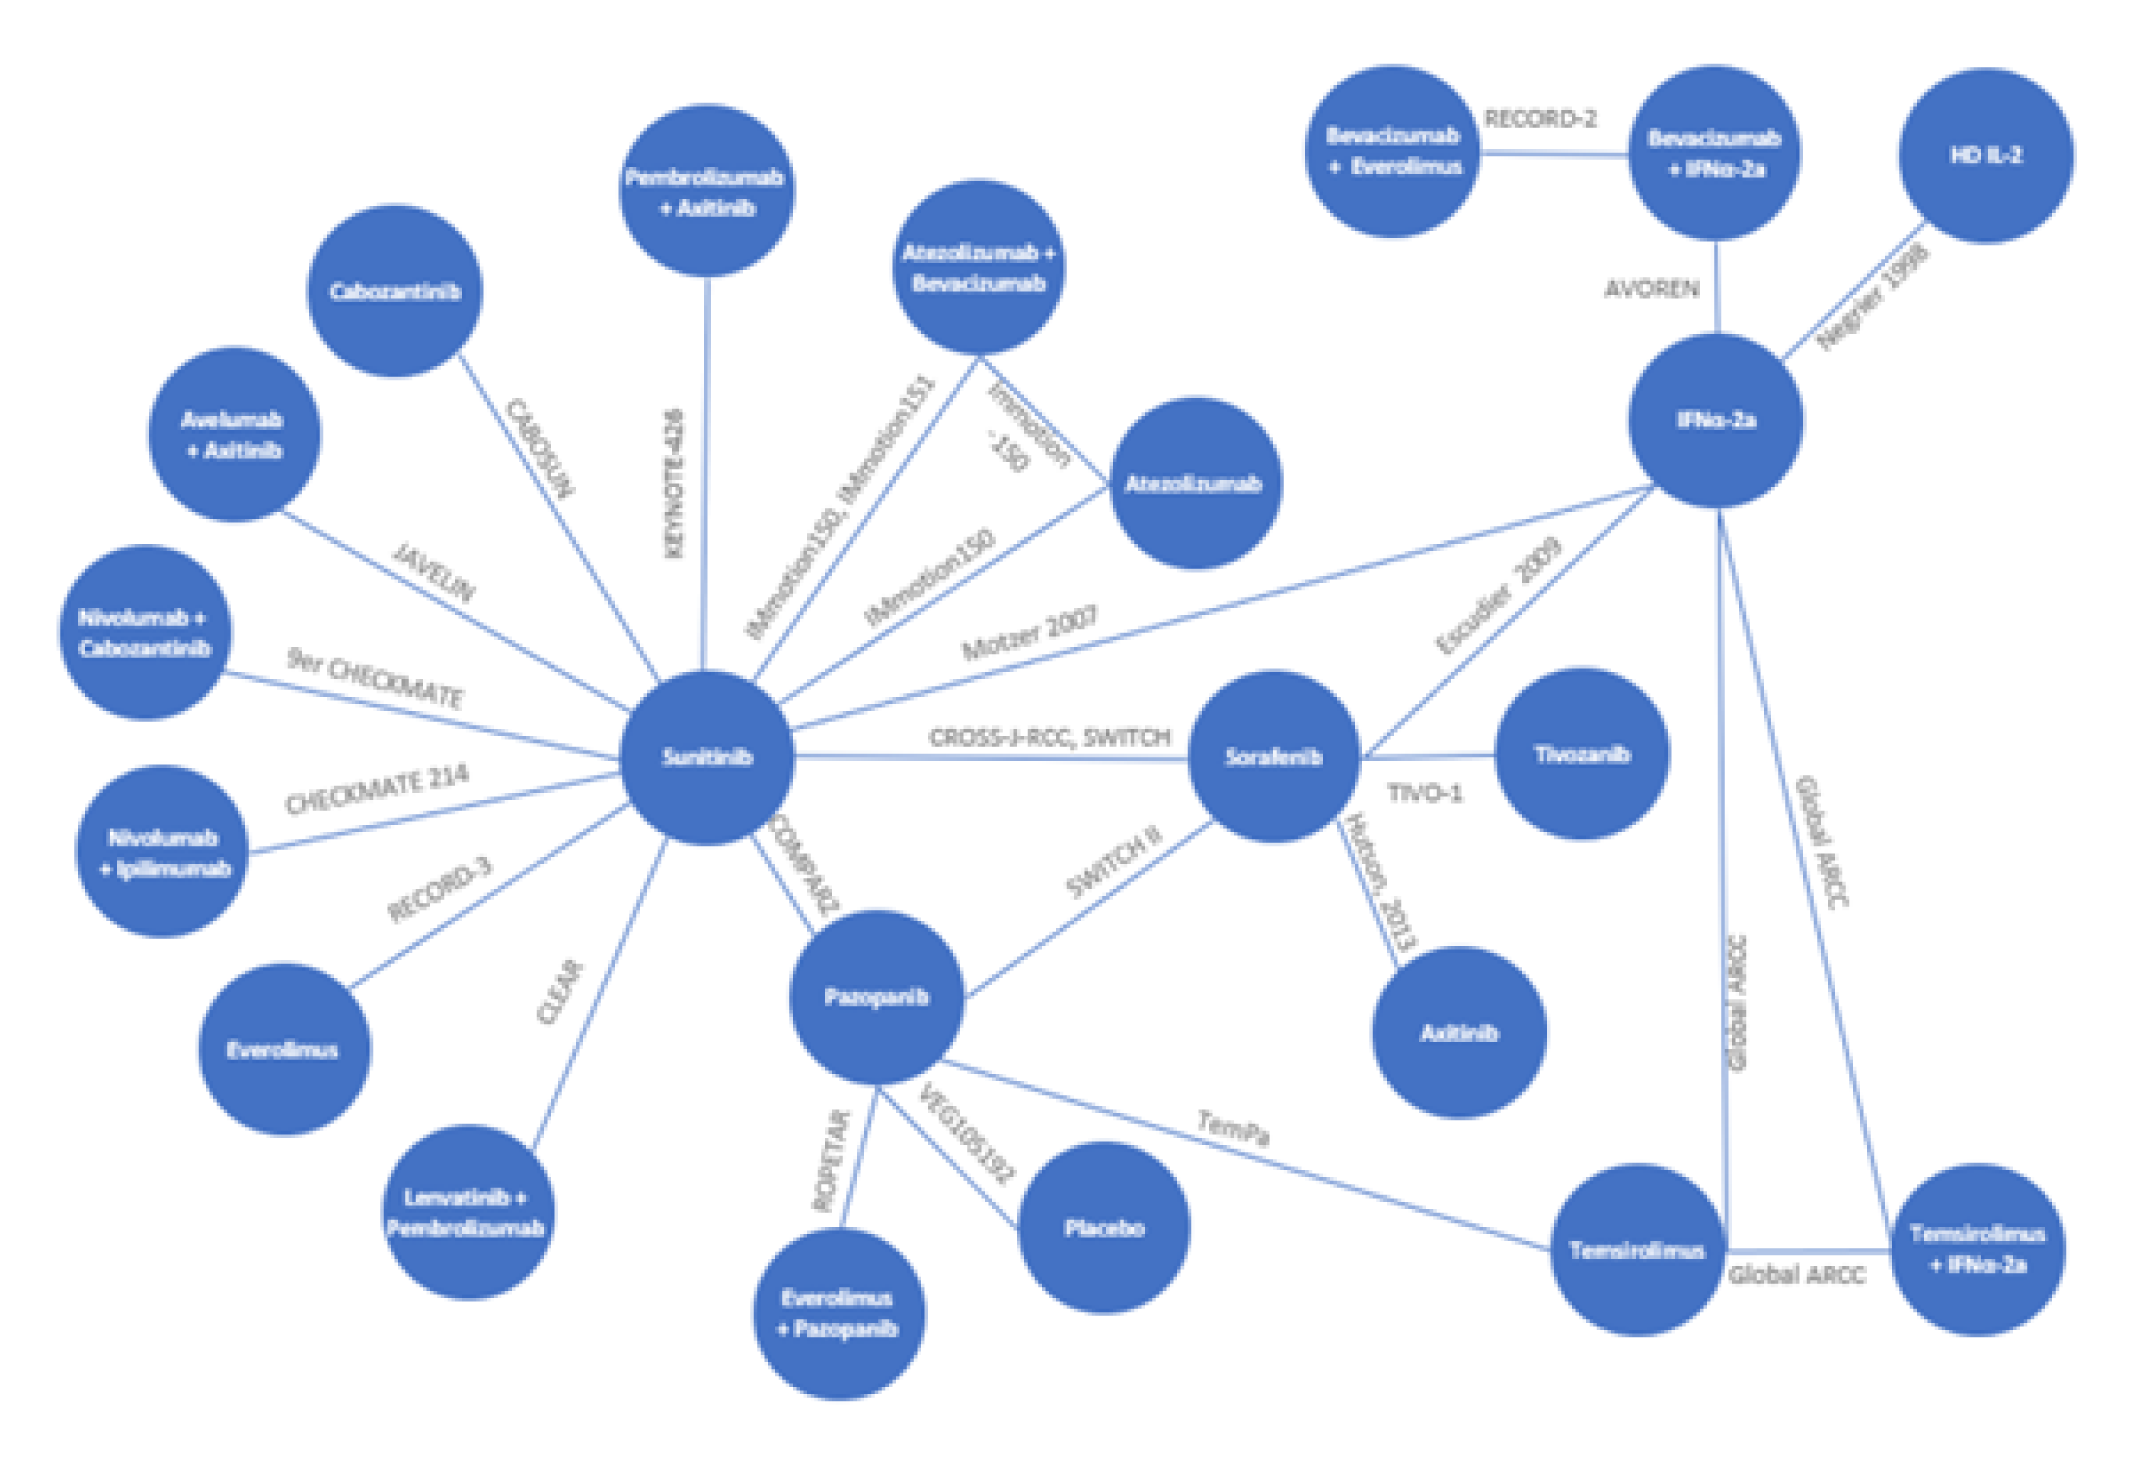
HD IL-2 = high-dose interleukin-2; IFN = interferon.
Note: Because the CBOSUN, Global ARCC, and TemPa trials enrolled only patients with an intermediate or poor risk profile, those studies were not included in the base-case analyses but were included in the risk subgroup analyses. Only a treatment-naive subgroup of patients from the TIVO-1 trial was included.
Source: Sponsor-submitted indirect treatment comparison.31
Progression-Free Survival
PFS was evaluated using FDA censoring criteria and EMA censoring in the CLEAR trial and assessed as such in the sponsor-submitted NMA (Figure 12 and Figure 13). The CLEAR trial was the only included study that reported PFS assessments by FDA or EMA censoring criteria; therefore, only data from the CLEAR trial differs between the 2 analyses.
The base-case analysis of PFS (FDA censoring) included 18 comparators from 21 RCTs. This included comparisons of LEN-PEM, AXI-PEM, NIVO-IPI, and PAZO versus SUN, each informed by evidence from 1 trial (CLEAR, KEYNOTE-426, CheckMate-214, and COMPARZ, respectively). Of note, the data informing the PFS results from the KEYNOTE-42632 and CheckMate-21433 trials are based on a 42-month follow-up and 4-year follow-up, respectively. The author reported that an RE model was selected because the DIC was lower (42.6 versus 42.9), although they noted the difference was within the 5 points and, therefore, was not considered meaningful. The results of the base-case analysis of PFS (FDA censoring) are presented in Figure 12. The reported HR for LEN-PEM was 0.44 (95% CrI, 0.23 to 0.82) compared with NIVO-IPI, 0.57 (95% CrI, 0.31 to 1.08) compared with AXI-PEM, and 0.38 (95% CrI, 0.21 to 0.67) compared with PAZO. The author indicated that the point estimates of the FE model were similar to the RE model, although the CrIs were narrower ||||||||||||||||||||||||||||||||||||||||||||||||||||||||||||||||||||||||||||||||||||||||||||||||||||||||||||||||||||||||||||||||||||||||||||||||||||||||||||||||||||||||||||||||||||||||||||||||||||||||||||||||||||||||||||||||||||||||||||||||||||||||||||||||||||||||||||||||.
Figure 12: PFS (FDA Censoring) Results — LEN-PEM Versus Other Treatments (Base Case, RE)
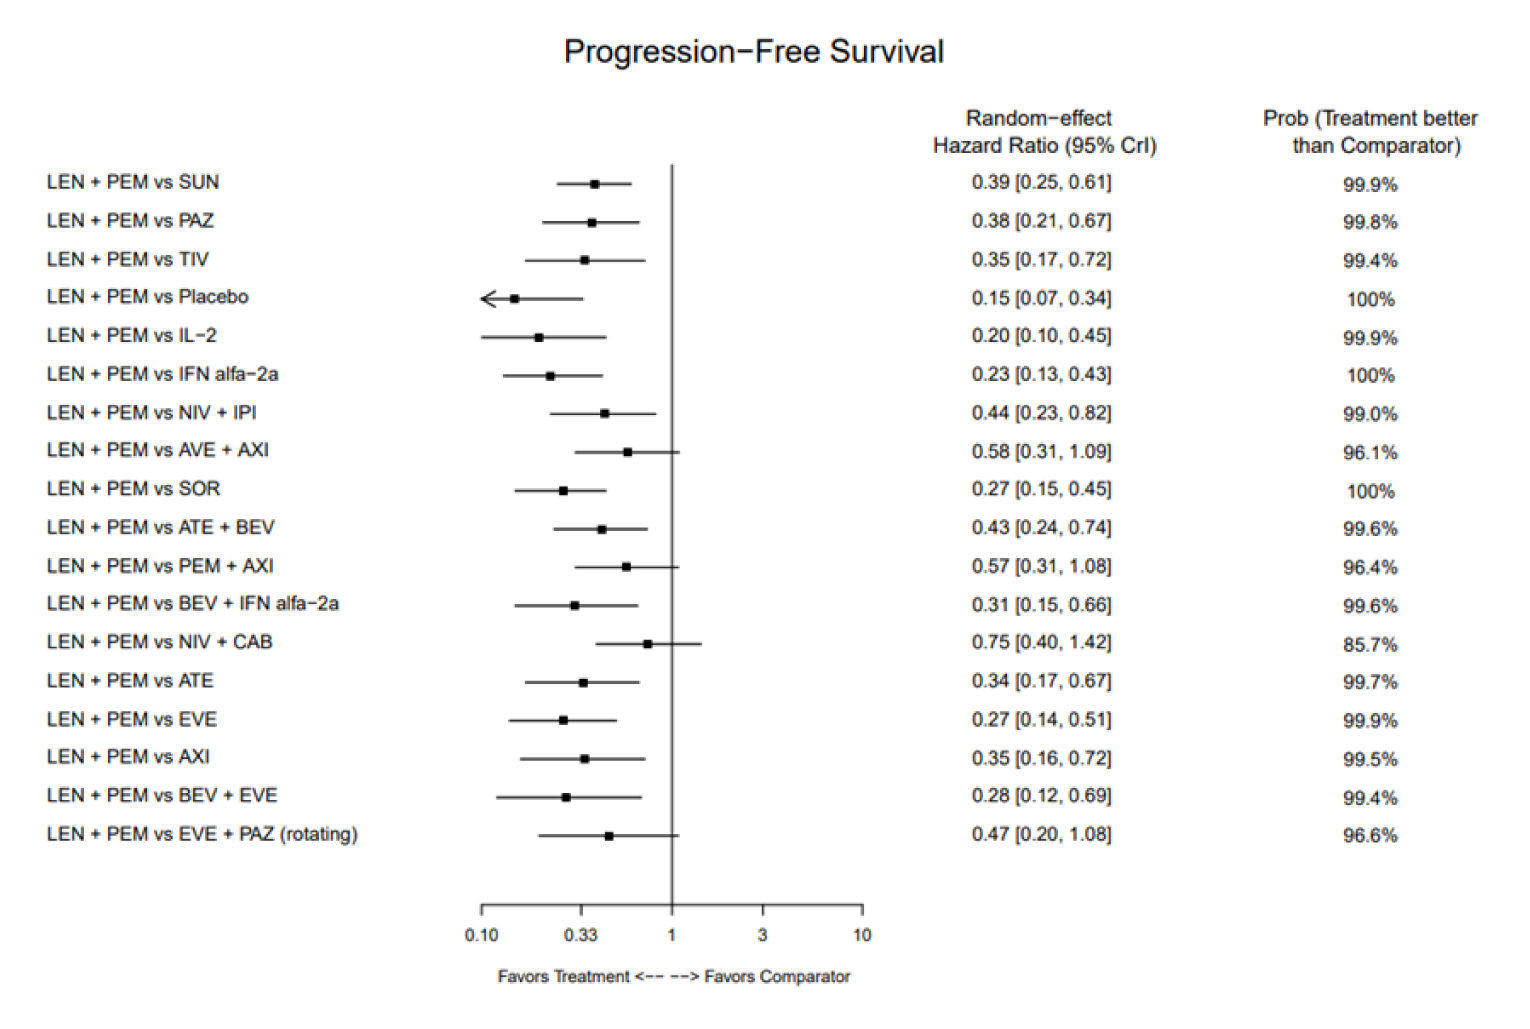
ATE = atezolizumab; AVE = avelumab; AXI = axitinib; BEV = bevacizumab; CAB = cabozantinib; CrI = credible interval; EVE = everolimus; IFN = interferon; IL = interleukin; IPI = ipilimumab; LEN = lenvatinib; NIV = nivolumab; PAZ = pazopanib; PEM = pembrolizumab; PFS = progression-free survival; prob = probability; RE = random effects; SOR = sorafenib; SUN = sunitinib; TIV = tivozanib.
Source: Sponsor-submitted indirect treatment comparison.31
The results of the base-case analysis of PFS (EMA censoring) were similar to the results of the base-case analysis using FDA censoring. An RE model was selected for the analysis of PFS (EMA censoring) based on the same rationale for PFS (FDA censoring). The base-case analysis included 19 comparators from 21 RCTs. |||||||||||||||||||||||||||||||||||||||||||||||||||||||||||||||||||||||||||||||||||||||||||||||||||||||||||||||||||||||||||||||||||||||||||||||||||||||||||||||||||||||||||||||||||||||||||||||||||||||||||||||||||||||||||||||||||||||||||||||||||||||||||||||||||||||||||||||||||||||||||||||||||||||||||||||||||||||||||||||||||||||||||||||||||||||||||||||||||||||||||||||||||||||||||||||||||||||||||||||||||||||||||||||||||||||||||||||||||||||||||||||||||||||||||||||||||||||||||||||||||||||||||||||||||||||||||||||||||||||||||||||.
Analysis of PFS (FDA censoring) by risk status was considered feasible under the assumption that the MSKCC and IMDC risk status definitions were equivalent. This was analyzed using 2 sensitivity analyses: the first (sensitivity analysis 3) prioritized MSKCC assessments from trials that provided MSKCC and IMDC results, and the second (sensitivity analysis 11) prioritized IMDC assessments from trials that provided IMDC and MSKCC results. The results for relevant comparisons are presented by risk subgroup in Table 31. The analysis of PFS by risk subgroup was also performed based on the data using the EMA censoring rules. The results were similar to the results presented in Table 31 for PFS by risk subgroup (FDA censoring), with the exception of the comparison with AXI-PEM performed in the poor risk subgroup. |||||||||||||||||||||||||||||||||||||||||||||||||||||||||||||||||||||||||||||||||||||||||||||||||||||||||||||||||||||||||||||||||||||||||||||||||||||||||||||||||||||||||||||||||||||||||||||||||||||||||||||||||||||||||||||||||||||||||||||||||||||||||||||||
|||||||||||||||||||||||||||||||||| | |||||||||||||||||||||||||||||||||||||||||||||||||||||||||||||||||||||||||||||||||||||||||||||||||||||| |
|---|---|
|||||||||||||||||||||||||||||| | |||||||||||||||||||||||||||||||||||||||||||||||||||||||||||||||||||||||||||||||||||||||||||||||||||||||||||||||||||||||||||||||||||||||| |
|||||||||||||||||||||||||||||||||| | ||||||||||||||||||||||||||||||||||||||||||||||||||||||||||||||||||||||||||||||||||||||||||||||||||||||||||||||||||||||||||||||||||||||||||||||||||||||||| |
Note: Table and title redacted as per sponsor’s request.
Overall Response Rate
The base-case analysis of ORR included 13 comparators from 14 RCTs, including comparisons of LEN-PEM, AXI-PEM, NIVO-IPI, and PAZO versus SUN (each informed by evidence from 1 trial). The author reported that an FE model was selected based on a DIC that was lower for the FE model (DIC = 55.5) than the RE model (DIC = 55.8). A summary of the results is presented in Figure 13. The OR for LEN-PEM was 3.24 (95% CrI, 2.18 to 4.85) compared with NIVO-IPI, 1.86 (95% CrI, 1.23 to 2.84) compared with AXI-PEM, and 3.00 (95% CrI, 2.02 to 4.47) compared with PAZO. The author reported that the CrIs were larger in the RE model, which only impacted the comparison with AXI-PEM |||||||||||||||||||||||||||||||||||||||||||||||||||.
Overall Survival
The base-case analysis of OS included 13 comparators from 12 RCTs, including comparisons of LEN-PEM, AXI-PEM, NIVO-IPI, and PAZO versus SUN (each informed by evidence from 1 trial). Of note, the data informing the OS results of the CLEAR trial are based on follow-up data from a conference abstract and the results for the KEYNOTE-42632 and CheckMate-21433 trials are based on a 42-month follow-up and 4-year follow-up, respectively. The author reported that FE models were used for all analyses of OS due to sparse networks with only 1 trial per connection; RE models were not run for this outcome. The sponsor also reported that the OS network was sparser than the PFS network due to the exclusion of the 6 trials with planned or sequential crossover designs. These trials included patients who had crossed over to receive a second treatment as part of the planned study design; therefore, the OS results were ineligible for inclusion in the NMA, as they pertain to second-line treatment.31 The HR for comparisons of LEN-PEM with NIVO-IPI was 1.04 (95% CrI, 0.77 to 1.42); for AXI-PEM, the HR was 0.99 (95% CrI, 0.71 to 1.37), and for PAZO, the HR was 0.78 (95% CrI, 0.58 to 1.06).
Figure 13: ORR Results — LEN-PEM Versus Other Treatments (Base Case, Fixed Effects)
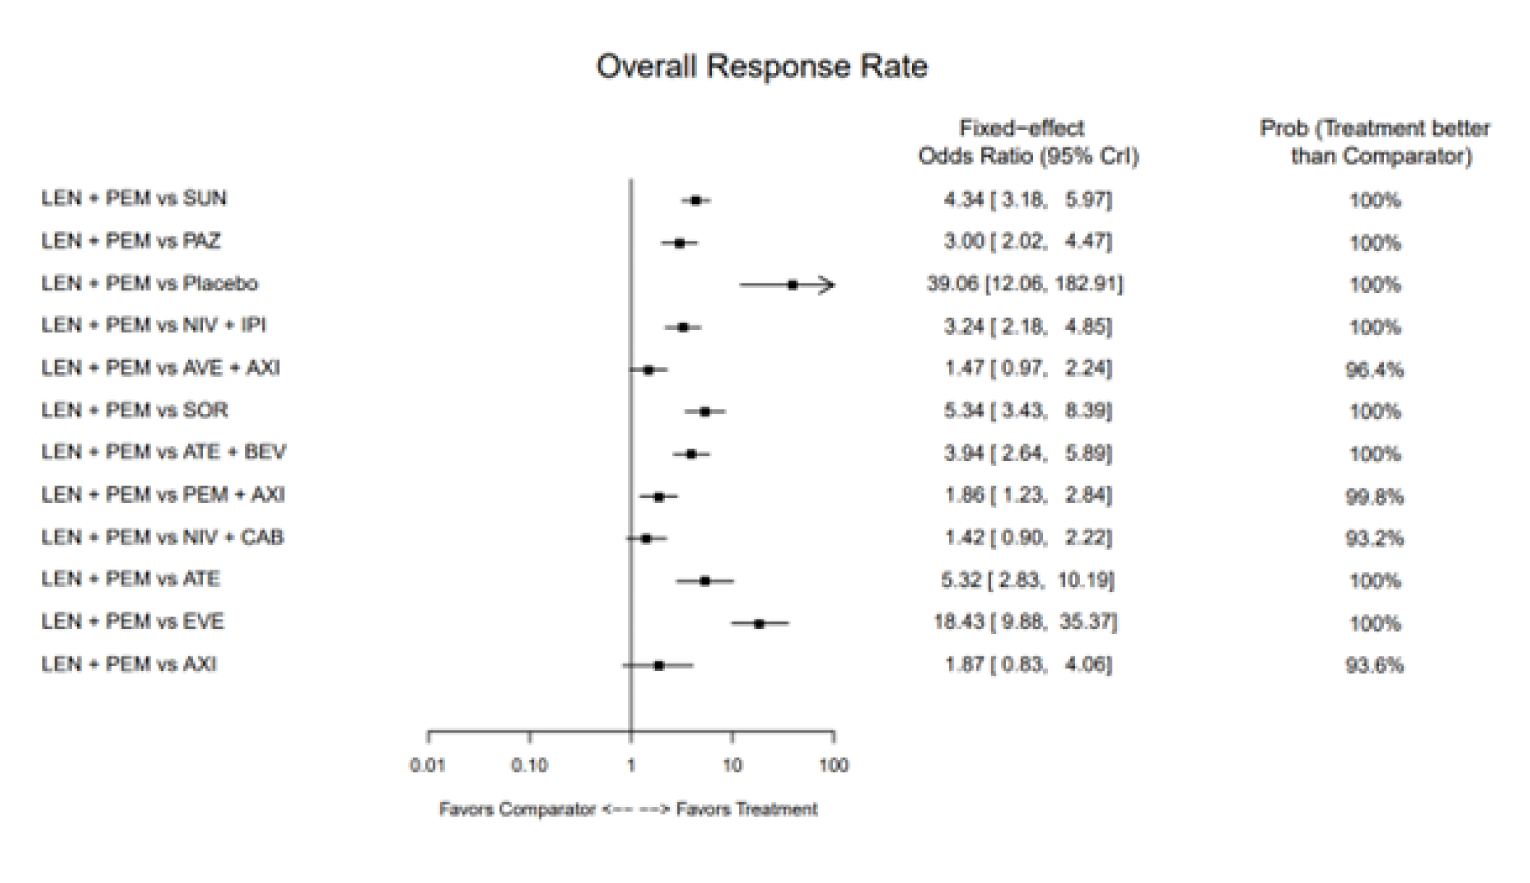
ATE = atezolizumab; AVE = avelumab; AXI = axitinib; BEV = bevacizumab; CAB = cabozantinib; CrI = credible interval; EVE = everolimus; IPI = ipilimumab; LEN = lenvatinib; NIV = nivolumab; ORR = objective response rate; PAZ = pazopanib; PEM = pembrolizumab prob = probability; PEM = pembrolizumab; SOR = sorafenib; SUN = sunitinib.
Source: Sponsor-submitted indirect treatment comparison.31
Figure 14: OS Results — Lenvatinib Plus Pembrolizumab Versus Other Treatments (Base Case, Fixed Effects)
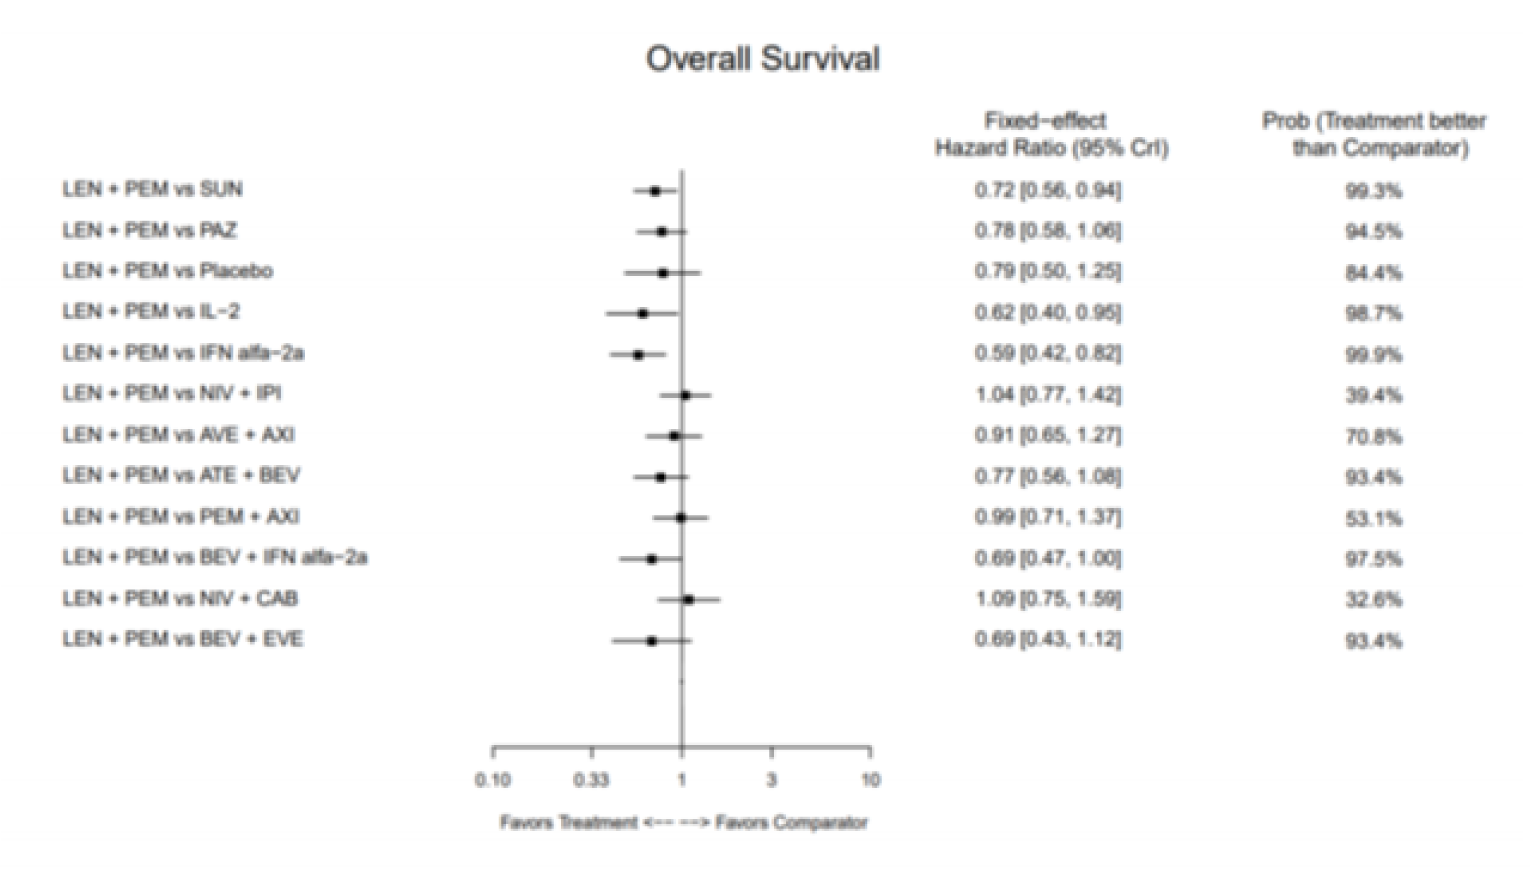
ATE = atezolizumab; AVE = avelumab; AXI = axitinib; BEV = bevacizumab; CAB = cabozantinib; CrI = credible interval; EVE = everolimus; IFN = interferon; IL = interleukin; IPI = ipilimumab; LEN = lenvatinib; NIV = nivolumab; PAZ = pazopanib; PEM = pembrolizumab prob = probability; SUN = sunitinib.
Source: Sponsor-submitted indirect treatment comparison.31
Similar to the analysis of PFS, the analysis of OS by risk status was considered feasible under the assumption that the MSKCC and IMDC risk status definitions were equivalent and analyzed using sensitivity analysis 3 and sensitivity analysis 11, as previously described. The results for relevant comparisons are presented by risk subgroup in Table 32.
|||||||||||||||||||||||||||||||||| | |||||||||||||||||||||||||||||||||||||||||||||||||||||||||||||||||||| | |||||||||||||||||||||||||||||||||| |
|---|---|---|
||||||||||||||||||||||||||||||||||||||||| | ||||||||||||||||||||||||||||||||||||||||||||||||||| | |||||||||||||||||||||||||||||||||| |
|||||||||||||||||||||||||||||||||| | |||||||||||||||||||||||||||||||||||||||||||||||||||||||||||||||||||| | |||||||||||||||||||||||||||||||||| |
Note: Table and title redacted as per sponsor’s request.
All-Cause Grade 3 and Higher AEs
The base-case analysis of all-cause grade 3 and higher AEs included evidence from 13 trials that involved 12 comparators, including LEN-PEM, AXI-PEM, and PAZO. Each of these interventions was compared with SUN and informed by evidence from 1 trial. Both an FE and RE model were run, and the FE model was selected based on a lower DIC (46.5 versus 47.4), no comparisons that included more than 2 studies, no statistical heterogeneity, and no evidence of inconsistency within the closed loop of the network. |||||||||||||||||||||||||||||||||||||||||||||||||||||||||||||||||||||||||||||||||||||||||||||||||||||||||||||||||||||||||||||||||||||||||||||||||||||||||||||||||||||||||||||||||||||||||||||||||||||||||||||||||||||||||||||||||||||||||||||||||||||||||||||||||||||||||||||||||||||||||||||||||||||||||||||||||||||||||||||||||||.

Treatment Discontinuation Due to AE
The base-case analysis included 14 comparators from 19 RCTs, including comparisons of the following interventions versus SUN: LEN-PEM, AXI-PEM, NIVO-IPI, and PAZO (each informed by evidence from 1 trial). An RE model was selected for analysis based on a lower DIC (68.3 versus 69.2). |||||||||||||||||||||||||||||||||||||||||||||||||||||||||||||||||||||||||||||||||||||||||||||||||||||||||||||||||||||||||||||||||||||||||||||||||||||||||||||||||||||||||||||||||||||||||||||||||||||||||||||||||||||||||||||||||||||||||||||||||||||||||||||||||||||||||||||||||||||||||||||||||||||||||||||||||||||||||||||||||||||||||||||||||||||||||||||||||||||||||||||||||||||||||||||||||||||||

Critical Appraisal of Sponsor-Submitted NMA
The methodology used for the study selection in the systematic literature review was pre-specified and used an appropriate set of criteria in terms of the study characteristics for a systematic review, databases searched, data extraction process, and quality assessment. The literature review was comprehensive and was expected to have captured the relevant studies of interest. Based on the systematic literature review, a total of 34 RCTs had eligible populations, comparators, and outcomes of interest for the NMA; however, 10 were excluded from the NMA because they did not form a connected network, did not report a clear cell histology subgroup, did not include interventions of interest, or because of the study design (such as the inclusion of an open-label run-in phase or having varying drug regimens for different patient subgroups). The rationale for the exclusion of these RCTs was reasonable. Despite an inclusive literature search, most of the connections within the network were limited to 1 study. Comparisons of interest (due to their relevance in the Canadian treatment setting) within the network were limited to indirect estimates only and based on 1 open-label RCT; therefore, inconsistency could not be assessed in these connections. Where appropriate, inconsistency was assessed by comparing the results of the Bucher ITCs with that of direct evidence. Areas of inconsistency within the network were explored through sensitivity analyses. Based on a qualitative review of the populations of the included studies, there were some concerns regarding potential bias due to effect modifiers. This included some differences between study populations in terms of the number of metastases, prior nephrectomy, presence of sarcomatoid features, and distribution of patients by risk status that may warrant further review. This remains a source of uncertainty in the network. The quality of included studies was assessed using the Cochrane risk-of-bias assessment tool (2.0), but information about the results of the quality assessment of individual studies was not reported. Additionally, information about study withdrawal or dropouts was not reported, therefore limiting the ability to evaluate the internal validity of the included studies.
The clinical experts consulted by CADTH indicated that the sponsor-submitted NMA considered all relevant comparators in the Canadian context. Specifically, NIVO-IPI, AXI-PEM, and PAZO were identified as the most relevant comparators against LEN-PEM and were therefore included in the evidence informing the NMA. Information about the dosing of treatments included in all of the trials in the network was limited, with details regarding relative dose intensity, compliance, or missed dosing either not reported or poorly reported. Both efficacy (OS, PFS, ORR, CR) and safety (all-cause grade 3 or higher AEs, treatment-related grade 3 or higher AEs, and treatment discontinuation due to AEs) outcomes were assessed in the NMA. All outcomes were reported here except for CR and analyses of treatment-related grade 3 or higher AEs. HRQoL was not included as an outcome in the sponsor-submitted NMA.
As part of the feasibility assessment, the sponsor identified the following parameters as potential effect modifiers a priori: histology, cancer stage, risk score, other patient characteristics, outcome assessment, survival analysis, subgroup definitions, and follow-up duration. The sponsor reported a summary of related findings, assumptions, and recommendations, and whether or not the exclusion of a study, or a sensitivity or subgroup analysis, was required. Some of the patient characteristics were reported inconsistently across trials and, in particular, details about race and ethnicity, PD-L1 status, and cancer staging were reported infrequently. In general, heterogeneity that was identified as a limitation was not adjusted for, but some sensitivity and subgroup analyses were performed. Sensitivity analyses that explored the equivalence of certain comparators (SUN, PAZO, and tivozanib), differences in clear cell histology (included studies reporting on patients with 100% clear cell histology) and in PD-L1 positivity (included studies reporting on subgroups with a PD-L1 expression of at least 1%), were consistent with the base-case analyses. Subgroup analyses were also performed by risk group and risk group definition (IMDC and MSKCC risk scoring). Stratification by risk status at randomization was not reported in the NMA, but a review of the published CLEAR,10 KEYNOTE-426,11 and CheckMate-21412 trials indicated that patients were stratified by risk status at randomization. Patients enrolled in COMPARZ34 were not stratified by risk status. Additionally, patients in the poor risk and favourable risk subgroups represented a small proportion of patients in the overall population and, therefore, a small sample size in the trials. Some of the results of the subgroup analyses by risk status were inconsistent with the base-case analyses, particularly among the favourable- and poor risk groups, which are subject to the limitations that have been described. Overall, the interpretation of the results for the subgroup analyses of the NMA is limited.
The sponsor also noted some heterogeneity in terms of race (notably, the proportion of Asian patients ranged from 1% to 25% in trials) and the number of metastases (for example, the proportion of patients with at least 2 metastases ranged from 57% to 89%) among the included trials and reported this as a limitation. Additionally, the proportion of patients with sarcomatoid features was lower in the CLEAR trial (6% to 8%) than in the KEYNOTE-426 trial (18% based on patients with data available) as was the proportion of patients with a history of nephrectomy (74% to 77% for CLEAR, 80% to 83% in KEYNOTE-426 and CheckMate-214). This may suggest the patient population enrolled in CLEAR had less severe disease than in other trials of interest (also, the proportion of patients with poor risk status was lower in CLEAR than in KEYNOTE-426 and CheckMate-214). Differences in time point assessments and actual treatment duration were also acknowledged as a limitation of the NMA, as was the impact of a lack of data maturity on efficacy assessments. A sensitivity analysis was conducted where trials with a follow-up period of less than 12 months were excluded; however, no adjustments were made for the variation in follow-up duration in studies where the duration was greater than 12 months. For reference, in the CLEAR trial,10 the analysis of OS was based on data with a median follow-up of approximately 33 to 34 months, and the analysis of PFS was based on a median follow-up of 26 to 27 months. The results for OS and PFS were based on a median follow-up of 43 months in the KEYNOTE-426 trial11 and a minimum of 48 months in CheckMate-214.12 The impact of the heterogeneity in the follow-up duration on these outcomes is unknown.
The sponsor-submitted ITC included justification of model selection (FE versus RE) based on an assessment of model fit or a lower DIC, although reported differences were very small. Assessments of heterogeneity based on I2 and inconsistency were also considered, although most connections were formed by a single RCT and there were few closed loops. The RE model used an informative before stabilize estimates of between-study variance. The prior was based on plausible values, and sensitivity analyses were conducted. There was uncertainty in the results, with wide CrIs. This is likely due to the sparsity of the network. The results for the ORR had very wide CrIs and the results for OS and all-cause grade 3 or higher AEs included CrIs that crossed 1 and included values suggesting a strong treatment effect, thus limiting the interpretation of these results. The analysis of treatment discontinuation due to AEs was also associated with a lack of precision and uncertainty due to wide CrIs that crossed 1 while including values suggesting a strong treatment effect, although the FE model improved precision.
Description of Published Indirect Comparisons
Four ITCs that evaluated the efficacy and safety of LEN-PEM in patients with advanced or metastatic RCC were identified in the literature and summarized for this review.35-38
Objectives
The objective of the ITC published by Quhal et al. (2021a)35 was to perform indirect comparisons of efficacy and safety of first-line immune-checkpoint inhibitor (ICI)-based combination therapies for metastatic RCC.
The objective of the ITC published by Quhal et al. (2021b)36 was to compare the safety profiles of systemic ICI-based combination therapies that were evaluated in the first-line setting for the management of patients with advanced or metastatic RCC.
The objective of the ITC published by Cattrini et al. (2021)37 was to address the lack of head-to-head comparisons and the uncertainty of the benefit from immunotherapy-based combinations in all of the IMDC subgroups.
The objective of the ITC published by Nocera et al. (2021)38 was to provide formal comparisons among immune-oncology combinations in terms of OS, PFS, ORR, and TRAEs.
Study Selection Methods
A summary of the study selection methods for each of the published ITCs is presented in Table 33. All of the published ITCs included RCTs that studied patients with advanced or metastatic clear cell RCC who received first-line treatment with an ICI-based combination. The comparators were SUN or standard of care. Three of the ITCs35,37,38 included outcomes related to efficacy (such as OS and PFS) and safety (TRAEs and treatment discontinuation), and 1 ITC36 included only studies that reported safety outcomes (TRAEs, treatment discontinuation, and treatment-related mortality).
All of the published ITCs conducted their literature search using PubMed. Other databases used included Web of Science, Scopus, Embase, and Cochrane Library. The bibliographies of included studies and/or relevant conference abstracts were also searched in 2 of the ITCs.35,38 Where reported, studies were selected by 2 independent reviewers based on title and abstract screening with disagreements resolved by consensus. Details about study selection were not provided for 1 of the published ITCs.36 Two of the published ITCs reported details of the data extraction process either performed or verified in duplicate by 2 independent reviewers.35,37 Details of the data extraction process were not provided for the other 2 published ITCs.36,38 In 3 of the 4 published ITCs, the Cochrane risk-of-bias tool was used to assess study quality and, in 1 ITC, study quality was assessed using the Jadad score.
Table 33: Study Selection Criteria and Methods for Published ITCs
Criteria | Quhal et al. (2021) | Quhal et al. (2021) | Cattrini et al. (2021) | Nocera et al. (2021) |
|---|---|---|---|---|
Population | Patients with advanced or metastatic clear cell RCC | |||
Intervention | First-line ICI-based combinations | |||
Comparator | Sunitinib 50 mg | Tyrosine kinase monotherapy (corresponding to the prior standard of care) | Standard of care (sunitinib) | |
Outcome |
| TRAEs, treatment discontinuation, and treatment-related mortality |
|
|
Study design | Phase III RCTs | RCT | ||
Publication characteristics | English-language only, published up until February 2021 (Quhal et al. [2021a]35) or March 2021 (Quhal et al. [2021b]36) | NR | English-language only, published between January 2016 and March 2021 | |
Exclusion criteria |
|
|
|
|
Databases searched | PubMed, Web of Science, and Scopus databases Relevant abstracts presented in major conferences, including ASCO and European Society for Medical Oncology conferences | PubMed, Web of Science, and Scopus databases | PubMed, Embase, and Cochrane Library from database inception to March 8, 2021 | PubMed Bibliographies of included studies were hand-searched to ensure completeness. Meeting abstracts of relevant medical societies (up to and including the 2021 ASCO Genitourinary Cancers Symposium) were searched to complement the systematic review |
Selection process |
| NR | Two authors performed study selection independently and disagreements were resolved by consensus |
|
Data extraction process | Two independent authors extracted the information from the included articles | NR | One author extracted data, with independent verification by 2 other authors | NR |
Quality assessment | Cochrane risk-of-bias assessment tool 2.0; assessed independently by 2 authors and resolved by consultation | Cochrane risk-of-bias assessment tool (version not specified); assessed by 2 authors | The Jadad score was used for the quality assessment of the included studies | Cochrane risk-of-bias tool (version not specified) |
AE = adverse event; ASCO = American Society of Clinical Oncology; BSC = best supportive care; CENTRAL = Cochrane Central Register of Controlled Trial; CRR = complete response rate; ICI = immune-checkpoint inhibitor; IMDC = International Metastatic Renal Cell Carcinoma Database Consortium; ITC = indirect treatment comparison; NA = not applicable; NR = not reported; ORR = overall response rate; OS = overall survival; PD-L1 = programmed cell death 1 ligand 1; PFS = progression-free survival; RCC = renal cell carcinoma; RCT = randomized controlled trial; TRAE = treatment-related adverse event.
aExcluded study designs: observational studies, reviews, letters, editorials, replies from authors, case reports.
bExcluded study designs: observational studies, review articles, commentaries, editorials, and articles without peer review.
Source: Quhal et al. (2021a),35 Quhal et al. (2021b),36 Cattrini et al. (2021),37 Nocera et al. (2021).38
Methods of Published Indirect Comparisons
ITC Analysis Methods
All of the published ITCs reported only limited details about the ITC analysis methods used (Table 34). All of the published ITCs reported that an NMA was conducted using both RE and FE models. The 2 ITCs published by Quhal et al. (2021) did not specify whether a Bayesian or frequentist approach was used; however, they did note whether contrast-based analyses or arms-based analyses were used for specific outcomes (described in Table 34). The ITC published by Cattrini et al. (2021) reported the use of a Bayesian approach and the ITC published by Nocera et al. (2021) reported the use of a frequentist approach. No information about priors or convergence was reported. Inconsistency was not assessed, as the networks did not include any closed loops (all comparisons were made to SUN). The only study that reported information about the assessment of model fit was the Cattrini et al. (2021) ITC, which used heterogeneity assessed by I2 to determine model fit. Additional information about the assessment of model fit was not provided.
Table 34: ITC Analysis Methods
Method | Quhal et al. (2021) | Quhal et al. (2021) | Cattrini et al. (2021) | Nocera et al. (2021) |
|---|---|---|---|---|
ITC methods |
|
| NMA using RE and FE models and using a Bayesian approach | NMA using mixed-effect models and a frequentist approach |
Priors | NR | NR | NR | NR |
Assessment of model fit | NR | NR | Based on heterogeneity assessed using I2 | NR |
Assessment of consistency | NR | NR | NR | NR |
Assessment of convergence | NR | NR | NR | NR |
Outcomes | OS, PFS, CRR, ORR | Treatment-related mortality, treatment discontinuation due to AEs, grade 3+ TRAEs | OS (overall and by subgroup), grade 3+ AEs | OS, PFS, CR, PR, SD, AEs |
Follow-up time points | Median ranged from NR to 26.6 months | NR | Median ranged from 18.1 to 55.0 months | Median ranged from 18 to 55 months |
Construction of nodes | NA | NR | NR | NR |
Sensitivity analyses | NR | NR | NR | NR |
Subgroup analysis | By risk groups (according to the IMDC definitions), where applicable, and based on PD-L1 expression status | NR | OS by IMDC risk group and PD-L1 expression status | None |
Methods for pairwise meta-analysis | NR | NR | NR | NR |
AE = adverse event; CR = complete response; CRR = complete response rate; FE = fixed effects; IMDC = International Metastatic Renal Cell Carcinoma Database Consortium; ITC = indirect treatment comparison; NA = not applicable; NMA = network meta-analysis; NR = not reported; ORR = objective response rate; OS = overall survival; PD-L1 = programmed cell death 1 ligand 1; PFS = progression-free survival; RE = random effects; SD = stable disease; TRAE = treatment-related adverse event.
Source: Quhal et al. (2021a),35 Quhal et al., (2021b),36 Cattrini et al. (2021),37 Nocera et al. (2021).38
The 4 published ITCs estimated the relative ranking of alternative treatments by outcome using a P-score or a surface under the cumulative ranking (SUCRA) analysis. All outcomes that were reported in the published ITCs were pre-specified, which include:
Quhal et al. (2021a): OS, PFS, CRR, and ORR
Quhal et al. (2021b): Treatment-related morality, treatment discontinuation due to AEs, grade 3 and higher TRAEs
Cattrini et al. (2021): OS, OS by subgroups (IMDC risk status, PD-L1 expression status) and grade 3 and higher AEs
Nocera et al. (2021): OS, PFS, CR, any response (CR + PR) and no progression rate (CR + PR + stable disease), and grade 3+ TRAEs
As noted, Cattrini (2021) evaluated OS by subgroup, which was indicated as a secondary outcome of the NMA. The authors reported that if data were not available for the risk subgroups, the estimate for the poor and intermediate subgroup was obtained by pooling the HRs and 95% CIs (or performing a meta-analysis) of the estimates from the poor and intermediate subgroups. Information about the subgroup analyses in the Quhal et al. (2021a) ITC was limited. None of the ITCs reported sensitivity analyses and no steps were taken to address potential sources of heterogeneity.
Results of Published Indirect Comparisons
Summary of Included Studies
A summary of the studies included in the published ITCs is provided in Table 35. A total of 6 phase III open-label RCTs were included in the Quhal (2021a), Quhal (2021 b), and Cattrini (2021) ITCs. In the Nocera (2021) ITC, 4 of the 6 ITCs were included (all except IMmotion 151 and JAVELIN Renal 101). All of the trials included in the published ITCs were also included in the sponsor-submitted NMA described in the previous section. The following interventions were included in the 4 common RCTs: LEN-PEM, AXI-PEM, NIVO-IPI, and NIVO plus cabozantinib. The additional 2 RCTs included the 3 published ITCs evaluated atezolizumab plus bevacizumab and avelumab plus AXI. All RCTs included SUN as the comparator.
Table 35: Studies Included in the Published ITCs
Included studies | Intervention | Quhal et al. (2021) first line | Quhal et al. (2021) AEs | Cattrini et al. (2021) | Nocera et al. (2021) |
|---|---|---|---|---|---|
CLEAR | Lenvatinib plus pembrolizumab | Yes | Yes | Yes | Yes |
KEYNOTE-426 | Pembrolizumab plus axitinib | Yes | Yes | Yes | Yes |
CheckMate-214 | Nivolumab plus ipilimumab | Yes | Yes | Yes | Yes |
CheckMate 9ER | Nivolumab plus cabozantinib | Yes | Yes | Yes | Yes |
Immotion 151 | Atezolizumab plus bevacizumab | Yes | Yes | Yes | No |
JAVELIN Renal 101 | Avelumab plus axitinib | Yes | Yes | Yes | No |
AE = adverse event; ITC = indirect treatment comparison.
Source: Quhal et al. (2021a),35 Quhal et al. (2021b),36 Cattrini et al. (2021),37 Nocera et al. (2021).38
The main study characteristics were poorly reported in all of the published ITCs except Cattrini et al. (2021), which the following information is derived from. Among the 6 included RCTs, the number of patients enrolled ranged from 651 to 1,096 and the median follow-up for OS ranged from 18.1 months to 55.0 months. The primary end point included PFS in all studies, in addition to OS in 4 of the RCTs and ORR in 1 of the RCTs. Using the IMDC risk status, the proportion of patients with a favourable risk status ranged from 18.8% to 32.9%, intermediate ranged from 56.5% to 64.1%, and poor risk status ranged from 9.8% to 19.8%.
Results
A network diagram was reported for the Quhal et al. (2021a) and Nocera et al. (2021) ITCs, as presented in Figure 17 and Figure 18, respectively. The network described for Quhal et al. (2021a) should apply to the remaining 2 ITCs (Quhal et al. [2021b]; Cattrini et al. [2021]). Each connection was informed by 1 RCT and all comparisons between interventions were based on indirect evidence only.
Figure 17: Network Plots for Overall Survival and Progression-Free Survival
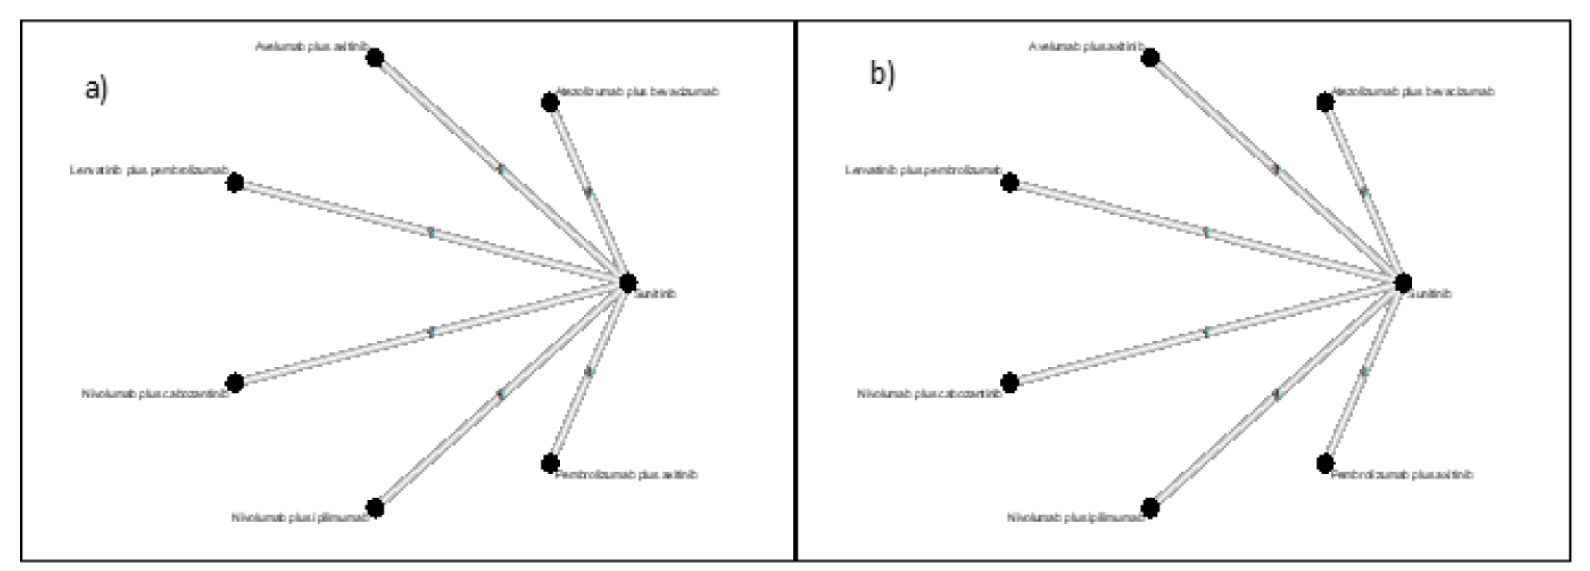
Source: Quhal et al. (2021a).35
Figure 18: Network Diagram for Overall Survival and Progression-Free Survival
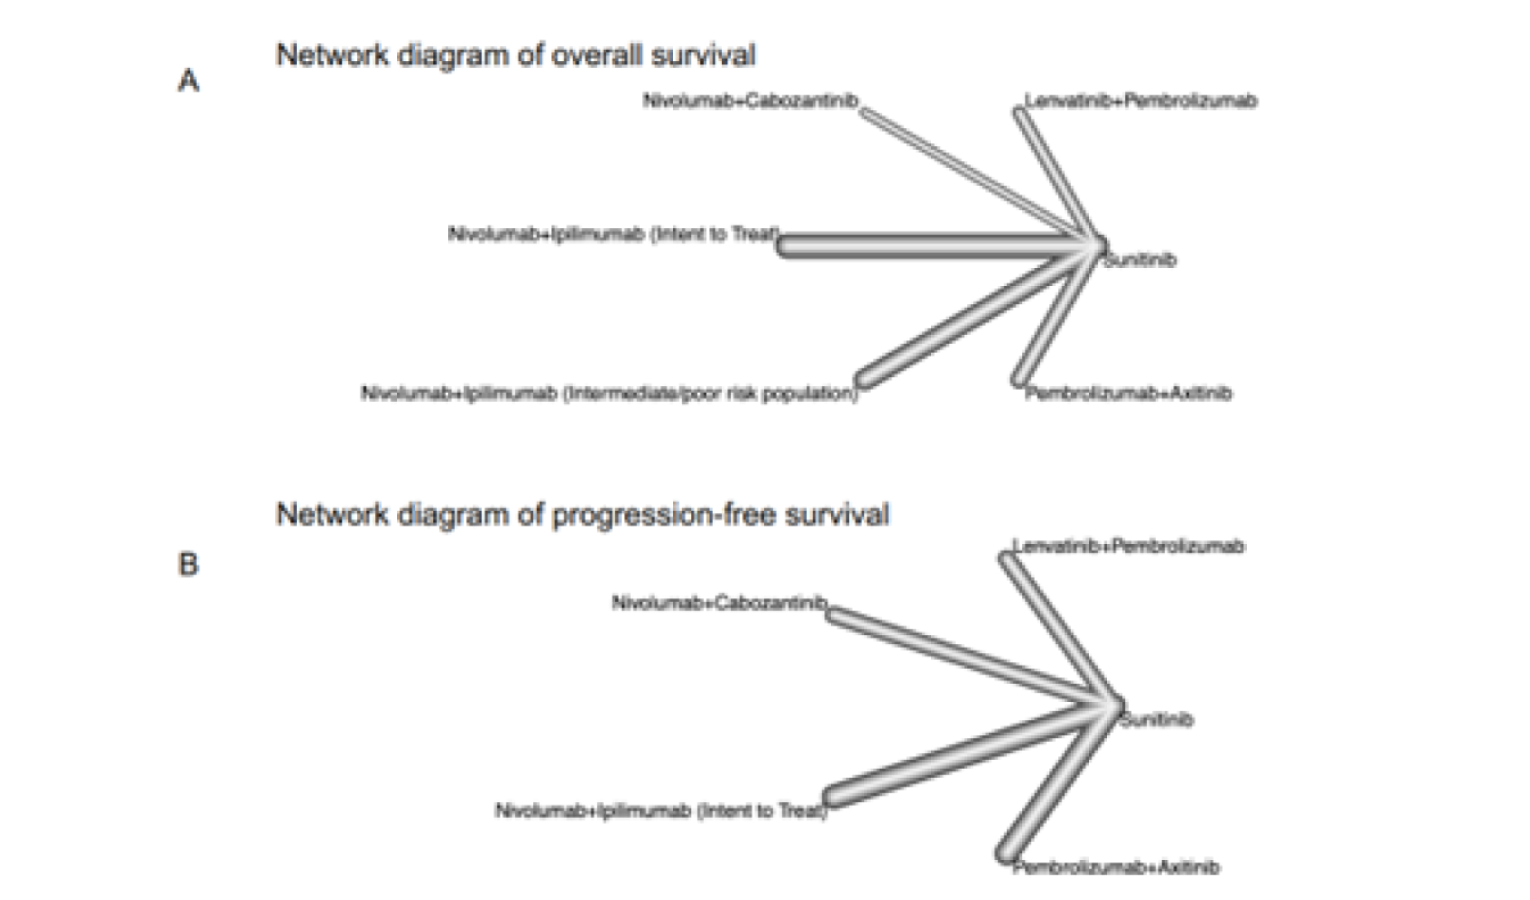
Source: Nocera et al. (2021).38
Efficacy Outcomes
In all of the published ITCs, outcomes were assessed by ranking the comparisons made between the interventions and SUN. Individual estimates of treatment effects for the indirect comparisons involving LEN-PEM versus other combination therapies were not reported for any outcomes. Due to the lack of robustness associated with the networks and the lack of estimates of the treatment effects of interest, a detailed description of the results of these analyses has not been presented. Briefly, in the 3 ITCs35,37,38 that analyzed OS, all treatments demonstrated benefit in OS compared with SUN. None of the ITCs reported LEN-PEM as the preferred treatment based on the ranking results for OS. In the 2 ITCs35,38 that analyzed PFS, all comparisons demonstrated benefit in PFS compared with SUN except for NIVO-IPI, and LEN-PEM was the preferred treatment based on the ranking results for PFS. In the 2 ITCs35,38 that analyzed ORR, all comparisons demonstrated benefit compared with SUN except for NIVO-IPI, which yielded different results in the ITCs. Both ITCs reported that LEN-PEM was the preferred treatment in terms of ORR based on the ranking results.
Safety Outcomes (Treatment Discontinuation Due to AEs and Grade 3 and Higher AEs)
The ITC published by Quhal et al. (2021b)36 analyzed treatment discontinuation due to AEs, and LEN-PEM was reported as being associated with the highest likelihood of discontinuation relative to other treatments based on ranking results, including AXI-PEM and NIVO-IPI. The ITC published by Cattrini et al. (2021)37 analyzed grade 3 and higher AEs based on a ranking of comparisons to SUN. LEN-PEM was not reported as being the preferred treatment based on grade 3 and higher AEs.
Critical Appraisal of Published Indirect Comparisons
The systematic literature review informing the published ITCs was limited in terms of the databases searched; however, key trials of relevance to the review of LEN-PEM were identified and included in each of the 4 published ITCs. The included trials were based on studies of acceptable quality as assessed by the Cochrane risk-of-bias tool (version 2.0 or not reported) or the Jadad score, although the risk of bias was driven predominantly by the open-label study designs of the included RCTs. Each of the publications acknowledged heterogeneity among the included trials resulting from variation in patient characteristics and follow-up duration. Additionally, the small number of studies informing indirect comparisons was a weakness of the networks.
The methodology used for the analyses reported in the published ITCs lacked important details, which hindered the ability to appropriately interpret the reported results. All of the published ITCs evaluated outcomes based on comparisons between the interventions and SUN and the subsequent ranking of comparisons to determine the preferred treatment. Individual estimates of treatment effects for the indirect comparisons of LEN-PEM versus other combination therapies were not reported for any outcomes. Due to issues related to the methodology and robustness of the networks, this method of analysis does not adequately provide evidence of the relative efficacy and safety of LEN-PEM compared with the other treatments assessed in the network.
Discussion
Summary of Available Evidence
The CADTH systematic review included evidence from 1 pivotal study (CLEAR trial) and 5 ITCs (1 sponsor-submitted ITC and 4 ITCs identified from published literature). Additional input from patient groups, clinician groups, drug plans, and the clinical experts consulted was considered during the review.
The CLEAR trial is an ongoing multi-centre, randomized, parallel-arm, open-label, phase III study comparing the efficacy and safety of LEN in combination with either everolimus or PEM versus SUN as a first-line treatment option in adult patients with advanced RCC. The study enrolled patients who were 18 years and older with a histologically or cytologically confirmed clear cell component and documented evidence of advanced disease. Patients were randomized in a 1:1:1 ratio into 3 treatment arms (LEN-PEM, LEN plus everolimus, and SUN) based on 2 stratification factors: geographic region and the MSKCC prognostic risk groups. The primary outcome of the CLEAR trial, PFS, was measured by IIR using RECIST v.1.1 criteria. Other secondary and exploratory outcomes investigated included OS, ORR, HRQoL, safety and tolerability, DOR, DCR, and so forth.28
Patients in the CLEAR trial received either 20 mg of LEN orally once daily plus 200 mg of PEM administered intravenously every 3 weeks, or 50 mg of SUN orally once daily for 4 weeks followed by a 2-week off-treatment period until the investigator discontinued treatment, patient withdrew consent, or patient moved into the follow-up phase.28 The median age of patients randomized into the CLEAR study was 62 years; more males were enrolled compared with females and the majority of patients were White or of Asian descent. There were more patients with a KPS score of 80 or greater in the LEN-PEM and SUN arms compared with patients with a KPS score of less than 80. Baseline characteristics were balanced across the 2 study arms with the exception of age (more patients randomized in the SUN arm were younger than 65 years compared with those in the LEN-PEM arm).
The sponsor’s submission included an NMA to support the evidence generated in the CLEAR trial. The NMA presented comparative evidence between LEN-PEM and other approved therapies, other than SUN, and was appraised for this review. Four additional published ITCs that evaluated the efficacy and safety of LEN-PEM in patients with advanced or metastatic RCC were summarized and appraised for this review.
Interpretation of Results
Efficacy
Both the clinical experts and clinician groups consulted during the CADTH review highlighted improved OS and PFS, reduction in tumour size (ORR), and improved QoL as treatment goals for untreated patients with metastatic or advanced RCC. The patient groups highlighted the need for more treatment options that allow oncologists to set up individualized treatment plans for patients. Improved OS, reduction in disease progression, and control drug resistance were some of the goals cited by the patient groups consulted.
The CADTH review protocol identified PFS, ORR, OS, DOR, HRQoL, DCR, time to treatment discontinuation, and improvement in 3 subgroups (the IMDC prognostic risk groups: poor, intermediate, and favourable), as important outcomes for patients. These outcomes were pre-specified in the CLEAR trial before the data cut-off for interim analysis 3 (August 28, 2020) and the type I error rate was adequately controlled for PFS, OS, and ORR. Sensitivity analyses were conducted for PFS and the findings obtained were consistent with the primary PFS findings. Analyses of other outcomes such as HRQoL, DOR, and DCR were not adjusted for multiplicity during the analysis.
The study was powered to detect a 40% difference in PFS between the 2 treatment arms. The primary outcome was statistically significant at the data cut-off for the final PFS analysis (interim analysis 3). The median PFS estimated by IIR was 23.9 months (95% CI, 20.8 to 27.7) in the LEN-PEM arm while, in the SUN arm, the median PFS estimated was 9.2 months (95% CI, 6.0 to 11.0). The HR between the LEN-PEM and SUN arms was 0.39 (95% CI, 0.32 to 0.49; P < 0.0001), corresponding to a 61% reduction in the risk of disease progression or death at any given time for LEN-PEM compared with SUN. The clinical experts consulted considered the tumour response in the LEN-PEM arm to be large compared with the SUN arm. The experts acknowledged that the findings were clinically meaningful and important to patients in the Canadian practice setting. The PFS findings were consistent across the IMDC prognostic groups (poor, intermediate, and favourable), suggesting that LEN-PEM treatment was beneficial to patients in all 3 groups; this finding was consistent with the primary analysis. The clinical experts considered these PFS estimates to be clinically meaningful.
The ORR estimated by IIR was 71% (95% CI, 66.3 to 75.7) in the LEN-PEM arm, with 16.1% of patients achieving a CR and 54.9% achieving a PR. In the SUN arm, the estimated ORR was 36.1% (95% CI, 31.2 to 41.1) with 4.2% of patients achieving a CR and 31.9% achieving a PR. The findings were considered statistically significant. The clinical experts consulted considered the tumour response in the LEN-PEM arm to be considerably large compared with the SUN arm and clinically meaningful. The experts noted the tumour response observed in the LEN-PEM arm was larger than responses observed from the use of the other treatment options available in practice. The DCR rate (CR plus PR plus stable disease) estimated by IIR in the LEN-PEM arm was 90.1% (95% CI, 87.0 to 93.2) and 74.2% (95% CI, 69.7 to 78.8) in the SUN arm. The OR estimated between LEN-PEM and SUN was 4.35 (95% CI, 3.16 to 5.97). The experts mentioned that the DCR observed in patients receiving SUN in practice was lower compared with the estimates observed in the CLEAR trial. The OR obtained between LEN-PEM and SUN was 3.26 (95% CI, 2.13 to 5.0). The median DOR estimated in the LEN-PEM arm was 25.8 months (95% CI, 22.1 to 27.9) and, in the SUN arm, it was 14.6 months (95% CI, 9.4 to 16.7).9
The median OS was not estimable at either the August 28, 2020, data cut-off or the follow-up data cut-off (March 31, 2021). The HR estimated between the LEN-PEM arm and the SUN arm was 0.66 (95% CI, 0.49 to 0.88; P = 0.0049), representing a 34% reduction in the risk of death in the LEN-PEM arm compared with the SUN arm at the August 28, 2020, data cut-off, and an HR of 0.72 (95% CI, 0.55 to 0.93) at the follow-up data cut-off (March 31, 2021), representing a 28% reduction in risk of death in the LEN-PEM arm versus the SUN arm.9 The HR findings were considered statistically significant. The final OS result is planned to be obtained at another interim analysis, once a pre-specified number of events have accrued.
The clinical experts consulted highlighted that patients with advanced or metastatic RCC with a clear cell component will benefit from the treatment even if they have additional clinical features (other histologies in addition to the clear cell component). The clinical experts acknowledged that patients with KPS scores of less than 70 will not likely benefit from the treatment because of their poor performance status.
The clinician and patient groups consulted during the CADTH review highlighted HRQoL as an important treatment goal. In the CLEAR trial, HRQoL was assessed using 3 questionnaires. The FKSI-DRS has been validated in RCC populations, with MIDs identified in the literature that range from 0.62 to 3 points based on calculations using different anchors. Although the EORTC QLQ-C30 and EQ-5D-3L instruments have been validated in other cancers, no studies evaluating the validity, reliability, and responsiveness of these instruments in patients with advanced or metastatic RCC were identified in published literature. The clinical experts highlighted that these questionnaires were appropriate for the RCC patient population. In their opinion, these scales are most sensitive to symptom-related changes due to RCC (if the therapy is active with associated improvements in symptoms) but not as sensitive to changes in symptoms owing to TRAEs. The rates of questionnaire completion declined below 50% at cycle 26 for LEN-PEM and at cycle 12 for the SUN arm owing to treatment discontinuation. The sponsor did not provide information on how missing data were handled during the analyses. It is therefore uncertain whether the methods used to address missing data were appropriate and free of bias. Further, no adjustments for multiplicity were made in the analyses; thus, the results were considered descriptive. It is uncertain whether LEN-PEM improves HRQoL in patients with advanced RCC, given the limitations identified in the analyses.
There was no direct evidence available to assess the relative efficacy of LEN-PEM versus other current standard-of-care therapies. Indirect evidence of LEN-PEM for first-line treatment of patients with advanced or metastatic RCC was available based on 5 ITCs: 1 NMA submitted by the sponsor and 4 ITCs identified in the published literature.35-38
The sponsor-submitted NMA was designed to evaluate the efficacy of LEN-PEM compared with other available therapies. The relative efficacy was assessed as OS, PFS, ORR, and safety outcomes (HRQoL was not included as an outcome) using a Bayesian NMA approach. All comparators included in the NMA were considered relevant by the clinical experts consulted; NIVO-IPI, AXI-PEM, and PAZO were identified as the most relevant. For PFS, based on an RE model, LEN-PEM showed benefit compared with NIVO-IPI and PAZO. The RE model did not show a difference for the comparison with AXI-PEM, whereas the results for the FE model favoured LEN-PEM. Similarly, the results of the analysis of ORR based on an FE model showed a benefit with LEN-PEM when compared with other treatments. The analysis of OS did not show a difference for LEN-PEM compared with other treatments. The demonstration of a benefit with LEN-PEM in terms of PFS but not in OS was not consistent with the expectations of the clinical experts consulted by CADTH. Sources of heterogeneity between the included RCTs, a sparse network, and a lack of data maturity (shorter follow-up duration) for the CLEAR trial are potential sources of uncertainty that limit the analysis.
The 4 published ITCs included a subset of studies that were included in the sponsor-submitted NMA. Limited details about the methodology used for the published ITCs were provided, preventing an adequate interpretation of the results. Estimates of indirect treatment effects between LEN-PEM and other combinations were not reported. Despite the limitations, the results that were available, including an assessment of efficacy based on the rankings for OS, PFS, and ORR, as well as safety outcomes, were consistent with the results observed in the sponsor-submitted NMA.
Harms
Overall, the proportion of patients reporting at least 1 AE was comparable in both study arms (99.7% in the LEN-PEM arm and 98.5% in the SUN arm). Diarrhea, hypertension, hypothyroidism, decreased appetite, fatigue, nausea, and stomatitis were the most common AEs reported in patients receiving LEN-PEM while, in the SUN arm, diarrhea, hypertension, stomatitis, PPE syndrome, fatigue, nausea, and decreased appetite were the most common AEs.
SAEs were reported in 50.6% of patients receiving LEN-PEM compared with 33.2% of patients receiving SUN. There were more AEs leading to drug discontinuations (37.2% versus 14.4%), dose reductions (68.8% versus 50.3%), drug interruptions (78.4% versus 53.8%), and dose modifications (87.5% versus 70.3%) in the LEN-PEM arm compared with the SUN arm, respectively. Overall, more deaths were reported in the SUN arm (29.1%) compared with the LEN-PEM arm (22.2%). Of note, patients receiving LEN-PEM had longer exposures to the study treatment (mean = 17.29 months) compared with patients receiving SUN (mean = 11.33 months), which may have influenced the reporting of AEs.9
The most common notable harms reported in the 2 arms were hypertension, hypothyroidism, hepatotoxicity, proteinuria, hemorrhage, PPE, renal events, QT prolongation, arterial thromboembolic events, gastrointestinal perforation, hypocalcemia, cardiac dysfunction, fistula formation, and posterior reversible encephalopathy syndrome. More AEs associated with hypertension, hypothyroidism, hepatotoxicity, proteinuria, and QT prolongation were reported in patients receiving LEN-PEM compared with patients receiving SUN.
The clinical experts indicated that the safety profiles of LEN-PEM and SUN in the CLEAR trial were similar and are consistent with the safety profiles of current treatment options in practice. The experts considered the safety profile of LEN-PEM to be acceptable and manageable in practice. The experts noted similarities in the notable harms reported in both treatment arms and indicated that these were consistent with the AEs reported for other treatment options used in practice. As noted by the clinical experts, patients receiving current treatment options require frequent monitoring and dose adjustments (reductions, modifications, or withdrawal of a drug) to manage TRAEs (e.g., hypertensive, hepatotoxic, and immune-related events) related to treatments with PEM combinations. The clinical experts anticipated implementing intensive strategies similar to those currently used in practice to manage AEs from LEN-PEM.
The indirect evidence available for the comparison of LEN-PEM versus the other treatments for advanced or metastatic RCC that were previously described also included an analysis of safety outcomes. ||||||||||||||||||||||||||||||||||||||||||||||||||||||||||||||||||||||||||||||||||||||||||||||||||||||||||||||||||||||||||||||||||||||||||||||||||||||||||||||||||||||||||||||||||||||||||||||||||||||||||||||||||||||||||||||||||||||||||||||||||||||||||||||||||||||||||||||||||||||||||||||||||||||||||||||||||||||||||||||||||||||||||||||||||||||||||||||||||||||||||||||||||||||||||||||||||||||||||||||||||||||||||||||||||||||||||||||||||||||||||||||||||||||||||||||||||||||||||||||||||||||||||||||||||||||||||||||||||||||||||||||||||||||||||||||||. The 4 published ITCs were subject to substantial uncertainty, but the results of the assessment of safety were consistent with the results observed in the sponsor-submitted NMA.
Conclusions
One pivotal study and 5 ITCs provided evidence for the CADTH systematic review. This review focused on the comparison between LEN-PEM and SUN investigated in the CLEAR trial as per the sponsor’s reimbursement request and the Health Canada indication. No other evidence directly comparing LEN-PEM with other standard therapies for advanced or metastatic RCC was identified. In CLEAR, the median PFS estimated by IIR at the final interim analysis for PFS (August 28, 2020) was 23.9 months in patients receiving LEN-PEM compared with 9.2 months in patients receiving SUN. The HR estimated for PFS between LEN-PEM against SUN was considered statistically and clinically significant. The median OS was not estimable in either study arm at the data cut-off for interim analysis 3 (August 28, 2020) or at the data cut-off for the follow-up analysis (March 31, 2021). However, the HR estimated between LEN-PEM against SUN was considered statistically significant. The ORR estimated in the LEN-PEM arm was also considered statistically significant. The HRQoL assessments were considered exploratory due to the lack of multiplicity adjustments in the analysis and the potential for reporting bias. The findings of the CLEAR trial were considered by the clinical experts consulted during the review to be meaningful for patients with advanced or metastatic RCC and were aligned with outcomes of importance to patients. In the opinion of the clinical experts, clinical judgment is required to evaluate the clinical benefit of LEN-PEM and the management in practice of AE . The experts anticipate that the TRAEs resulting from the use of LEN-PEM will be managed in practice using strategies similar to those already in place for other treatment options (frequent AE monitoring and dose adjustments, reductions, and modifications are anticipated for the treatment). The open-label design was a key limitation of the CLEAR trial, and the OS data are interim. The study was randomized and adjustments for multiplicity were conducted for key outcomes (PFS, OS, and ORR), which minimized bias in the study. The clinical experts considered the baseline characteristics and the findings from the CLEAR trial to be generalizable to patients diagnosed in the first-line setting in Canada with advanced or metastatic RCC with at least a clear cell component.
No direct evidence was available to assess the relative efficacy of LEN-PEM versus other current standard-of-care therapies. Indirect evidence of LEN-PEM for the first-line treatment of patients with advanced or metastatic RCC was available based on 5 ITCs: 1 NMA submitted by the sponsor and 4 ITCs identified in published literature. The sponsor-submitted NMA of LEN-PEM compared with other available therapies showed benefit for LEN-PEM for PFS and ORR but not for OS compared with other therapies. Sources of uncertainty identified during the review included heterogeneity in the RCTs, sparse network, and lack of data maturity (shorter follow-up duration) for the CLEAR trial. The sponsor-submitted NMA results of the analysis of treatment discontinuation due to AEs ||||||||||||||||||||||||||||||||||||||||||||||||||||||||||||||||||||||||||||||||||||||||||||||||||||||||||||||||||||||||||||||||||||||||||||||||||||||||||||||||||||||||||, although these results were limited by a lack of precision in addition to a number of assumptions made about the outcome that cause uncertainty in the results. The OS, PFS, and ORR findings obtained from the 4 additional published ITCs assessed in this review were consistent with the results of the sponsor-submitted NMA. However, the methodology used for the analyses lacked important details, which hindered the ability to appropriately interpret the reported results.
References
1.Lenvima (lenvatinib capsules), 4 mg and 10 mg lenvatinib (as lenvatinib mesylate) [product monograph]. Mississauga (ON): Eisai Limited; 2021 May 3.
2.Kidney cancer, version 4.2022. (NCCN Clinical Practice Guidelines in Oncology). Plymouth Meeting (PA): National Comprehensive Cancer Network; 2021 Dec 21: https://www.nccn.org/professionals/physician_gls/pdf/kidney.pdf (free registration required). Accessed 2022 Jan 23.
3.National Cancer Institute. Renal Cell Cancer Treatment (PDQ®) – Patient Version 2021; https://www.cancer.gov/types/kidney/patient/kidney-treatment-pdq#section/all. Accessed 2022 Jan 23.
4.National Comprehensive Cancer Network (NCCN). Kidney cancer - guidelines for patients. 2022; https://www.nccn.org/patients/guidelines/content/PDF/kidney-patient.pdf. Accessed 2022 Jan 23.
5.Flanigan RC, Campbell SC, Clark JI, Picken MM. Metastatic renal cell carcinoma. Curr Treat Options Oncol. 2003;4(5):385-390. PubMed
6.BC Cancer Agency. Kidney cancer. 2022; http://www.bccancer.bc.ca/health-info/types-of-cancer/urinary/kidney. Accessed 2022 Jan 23.
7.Canil C, Kapoor A, Basappa NS, et al. Management of advanced kidney cancer: Kidney Cancer Research Network of Canada (KCRNC) consensus update 2021. Can Urol Assoc J. 2021;15(4):84-97. PubMed
8.Rini BI, Atkins MB, Plimack ER, et al. Characterization and management of treatment-emergent hepatic toxicity in patients with advanced renal cell carcinoma receiving first-line pembrolizumab plus axitinib. Results from the KEYNOTE-426 trial. Eur Urol Oncol. 2021. PubMed
9.Drug Reimbursement Review sponsor submission: Lenvima (lenvatinib) in combination with pembrolizumab (Keytruda), 4 mg and 10 mg lenvatinib mesylate capsules [internal sponsor's package]. Mississauga (ON): Eisai Limited; 2021 Nov.
10.Motzer R, Alekseev B, Rha SY, et al. Lenvatinib plus pembrolizumab or everolimus for advanced renal cell carcinoma. N Engl J Med. 2021;384(14):1289-1300. PubMed
11.Rini BI, Plimack ER, Stus V, et al. Pembrolizumab plus axitinib versus sunitinib for advanced renal-cell carcinoma. N Engl J Med. 2019;380(12):1116-1127. PubMed
12.Motzer RJ, Tannir NM, McDermott DF, et al. Nivolumab plus ipilimumab versus sunitinib in advanced renal-cell carcinoma. N Engl J Med. 2018;378(14):1277-1290. PubMed
13.Canadian Cancer Statistics Advisory Committee. Canadian Cancer Statistics 2021. In collaboration with the Canadian Cancer Society, Statistics Canada, and the Public Health Agency of Canada. 2021; https://cdn.cancer.ca/-/media/files/research/cancer-statistics/2021-statistics/2021-pdf-en-final.pdf. Accessed 2022 Jan 23.
14.National Cancer Institute Surveillance Epidemiomology and End Results Program (SEER). Cancer Stat Facts: Kidney and renal pelvis cancer. 2021; https://seer.cancer.gov/statfacts/html/kidrp.html. Accessed 2022 Jan 23.
15.Keytruda® (pembrolizumab), solution for infusion 100 mg/4 mL vial [product monograph]. Kirkland (QC): Merck Canada Inc; 2021 Nov 24: https://www.merck.ca/static/pdf/KEYTRUDA-PM_E.pdf. Accessed 2022 Feb 7.
16.Sutent® (sunitinib capsules), 12.5 mg, 25 mg, 37.5 mg, 50 mg sunitinib per capsule (as sunitinib malate) [product monograph]. Kirkland (QC): Pfizer Canada; 2019 Jul 11: https://pdf.hres.ca/dpd_pm/00052172.PDF. Accessed 2022 Feb 7.
17.McGowan J, Sampson M, Salzwedel DM, Cogo E, Foerster V, Lefebvre C. PRESS Peer Review of Electronic Search Strategies: 2015 guideline statement. Journal of clinical epidemiology. 2016;75:40-46. PubMed
18.Grey matters: a practical tool for searching health-related grey literature. Ottawa (ON): CADTH; 2019: https://www.cadth.ca/grey-matters. Accessed 2021 Dec 3.
19.Center for Drug Evaluation R. Medical review(s). Lenvima (lenvatinib), oral capsules 24 mg daily. Company: Eisai Inc. Application No.:206947. Approval date: 2/13/2015 (FDA approval package). Silver Spring (MD): U.S. Food and Drug Administration (FDA); 2015: https://www.accessdata.fda.gov/drugsatfda_docs/nda/2015/206947Orig1s000MedR.pdf. Accessed 2021 Dec 3.
20.Committee For Medicinal Products For Human Use. Assessment report: Kisplyx (lenvatinib). (European public assessment report). Amsterdam (Netherlands): European Medicines Agency; 2021 Oct 14: https://www.ema.europa.eu/en/documents/variation-report/kisplyx-h-c-004224-ii-0045-epar-assessment-report_en.pdf.
21.U.S. Food and Drug Administration. Clinical trial endpoints for the approval of cancer drugs and biologics - guidance for industry. 2018; https://www.fda.gov/regulatory-information/search-fda-guidance-documents/clinical-trial-endpoints-approval-cancer-drugs-and-biologics. Accessed 2022 Jan 28.
22.European Medicines Agency. Evaluation of anticancer medicinal products in man. EMA/CHMP/205/95 Rev.6. 2020; https://www.ema.europa.eu/en/evaluation-anticancer-medicinal-products-man. Accessed 2022 Jan 28.
23.Cella D, Yount S, Brucker PS, et al. Development and validation of a scale to measure disease-related symptoms of kidney cancer. Value Health. 2007;10(4):285-293. PubMed
24.Giesinger JM, Kieffer JM, Fayers PM, et al. Replication and validation of higher order models demonstrated that a summary score for the EORTC QLQ-C30 is robust. Journal of clinical epidemiology. 2016;69:79-88. PubMed
25.EORTC Quality of Life Group. EORTC QLQ-C30 - FAQ. 2021; https://qol.eortc.org/faq. Accessed 2021 Dec 23.
26.EORTC Quality of Life Group, Fayers P, Aaronson N, et al. The EORTC QLQ-C30 Scoring Manual, 3rd ed. Brussels (Belgium): European Organisation for Research and Treatment of Cancer (EORTC); 2001: https://www.eortc.org/app/uploads/sites/2/2018/02/SCmanual.pdf. Accessed 2021 Dec 23.
27.Van Reenen M, Oppe M, K.S. B, et al. EQ-5D-3L User Guide. Basic information on how to use the EQ-5D-3L instrument (version 6.0). Rotterdam (Netherlands): EuroQol Research Foundation; 2018: https://euroqol.org/publications/user-guides/. Accessed 2021 Dec 12.
28.Zhao B, Han Y, Wang Y, et al. A Bayesian network meta-analysis regarding the comparative efficacy of therapeutics for ALK-positive, brain metastatic non-small cell lung cancer. Pharmacol Res. 2021:105931. PubMed
29.Schwartz LH, Litière S, de Vries E, et al. RECIST 1.1-Update and clarification: From the RECIST Committee. European journal of cancer (Oxford, England: 1990). 2016;62:132-137.
30.Engle JA, Traynor AM, Campbell TC, et al. Assessment of adherence and relative dose intensity with oral chemotherapy in oncology clinical trials at an academic medical center. J Oncol Pharm Pract. 2018;24(5):348-353. PubMed
32.Clinical Study Report: E7080-G000-307/KEYNOTE 581. Study E7080-G000-307/KN 581 overall survival follow-up as of 31 March 2021 [internal sponsor's report]. Woodcliff Lake (NJ): Eisai Inc; 2021 May 20.
33.Albiges L, Tannir NM, Burotto M, et al. Nivolumab plus ipilimumab versus sunitinib for first-line treatment of advanced renal cell carcinoma: extended 4-year follow-up of the phase III CheckMate 214 trial. ESMO Open. 2020;5(6):e001079. PubMed
34.Motzer RJ, Hutson TE, Cella D, et al. Pazopanib versus sunitinib in metastatic renal-cell carcinoma. N Engl J Med. 2013;369(8):722-731. PubMed
35.Quhal F, Mori K, Bruchbacher A, et al. First-line immunotherapy-based combinations for metastatic renal cell carcinoma: A systematic review and network meta-analysis. Eur Urol Oncol. 2021;4(5):755-765. PubMed
36.Quhal F, Mori K, Remzi M, Fajkovic H, Shariat SF, Schmidinger M. Adverse events of systemic immune-based combination therapies in the first-line treatment of patients with metastatic renal cell carcinoma: systematic review and network meta-analysis. Curr Opin Urol. 2021;31(4):332-339. PubMed
37.Cattrini C, Messina C, Airoldi C, et al. Is there a preferred first-line therapy for metastatic renal cell carcinoma? A network meta-analysis. Ther Adv Urol. 2021;13:17562872211053189. PubMed
38.Nocera L, Karakiewicz PI, Wenzel M, et al. Clinical outcomes and adverse events after first-line treatment in metastatic renal cell carcinoma: A systematic review and network meta-analysis. J Urol. 2021:101097JU0000000000002252.
39.FACIT Group. FKSI-DRS: Overview. 2021; https://www.facit.org/measures/FKSI-DRS. Accessed 2021 Dec 23.
40.FACIT Group. FKSI-DRS Scoring Menu. Functional Assessment of Cancer Therapy – Kidney Symptom Index – Disease Related Symptoms (FKSI-DRS). Scoring guidelines (version 4). 2021; https://www.facit.org/measures-scoring-downloads/fksi-drs-scoring-downloads. Accessed 2021 Dec 23.
41.Cella D, Motzer RJ, Rini BI, et al. Important group differences on the Functional Assessment of Cancer Therapy-Kidney Symptom Index Disease-Related Symptoms in patients with metastatic renal cell carcinoma. Value Health. 2018;21(12):1413-1418. PubMed
Appendix 1: Literature Search Strategy
Note this appendix has not been copy-edited.
Clinical Literature Search
Overview
Interface: Ovid
Databases:
MEDLINE All (1946–present)
Embase (1974–present)
Note: Subject headings and search fields have been customized for each database. Duplicates between databases were removed in Ovid.
Date of search: December 9, 2021.
Alerts: Biweekly search updates until the pERC meeting in April 2022.
Search filters applied: None.
Limits: Conference abstracts were excluded.
Syntax | Description |
|---|---|
/ | At the end of a phrase, searches the phrase as a subject heading |
MeSH | Medical Subject Heading |
exp | Explode a subject heading |
* | Before a word, indicates that the marked subject heading is a primary topic; or, after a word, a truncation symbol (wildcard) to retrieve plurals or varying endings |
.ti | Title |
.ot | Original title |
.ab | Abstract |
.hw | Heading word; usually includes subject headings and controlled vocabulary |
.kf | Keyword heading word |
.dq | Candidate term word (Embase) |
.pt | Publication type |
.rn | Registry number |
.nm | Name of substance word (MEDLINE) |
medall | Ovid database code: MEDLINE All, 1946 to present, updated daily |
oemezd | Ovid database code; Embase, 1974 to present, updated daily |
Multi-Database Strategy
(lenvatinib* or Lenvima* or Kisplyx* or E-7080 or E7080 or ER-203492-00 or L01EX08 or EE083865G2 or 3J78384F61).ti,ab,kf,ot,hw,rn,nm.
(pembrolizumab* or lambrolizumab* or Keytruda* or HSDB-8257 or HSDB8257 or Merck 3475 or Merck3475 or MK-3475 or MK3475 or SCH-900475 or SCH900475 or L01XC18 or DPT0O3T46P).ti,ab,kf,ot,hw,rn,nm.
1 and 2
3 use medall
*lenvatinib/
(lenvatinib* or Lenvima* or Kisplyx* or E-7080 or E7080 or ER-203492-00 or L01EX08).ti,ab,kf,dq.
5 or 6
*pembrolizumab/
(pembrolizumab* or lambrolizumab* or Keytruda* or HSDB-8257 or HSDB8257 or Merck 3475 or Merck3475 or MK-3475 or MK3475 or SCH-900475 or SCH900475 or L01XC18).ti,ab,kf,dq.
8 or 9
7 and 10
11 use oemezd
12 not (conference abstract or conference review).pt.
4 or 13
remove duplicates from 14
Clinical Trials Registries
ClinicalTrials.gov
Produced by the US National Library of Medicine. Targeted search used to capture registered clinical trials.
[Search — trials on lenvatinib AND pembrolizumab]
WHO ICTRP
ICTRP, produced by the World Health Organization. Targeted search used to capture registered clinical trials.
[Search terms -- trials on lenvatinib AND pembrolizumab mentioning renal or kidney(s)]
Health Canada’s Clinical Trials Database
Produced by Health Canada. Targeted search used to capture registered clinical trials.
[Search terms -- trials on lenvatinib AND pembrolizumab mentioning renal or kidney(s)]
EU Clinical Trials Register
European Union Clinical Trials Register, produced by the European Union. Targeted search used to capture registered clinical trials.
[Search terms -- trials on lenvatinib AND pembrolizumab mentioning renal or kidney(s)]]
Grey Literature
Search dates: December 1 to 7, 2021
Keywords: lenvatinib, Lenvima, Kisplyx (in combination with pembrolizumab, Keytruda); renal cell carcinoma (RCC)
Limits: No date limits.
Updated: Search updated the week of the pERC meeting in April 2022.
Relevant websites from the following sections of the CADTH grey literature checklist Grey Matters: A Practical Tool for Searching Health-Related Grey Literature were searched:
Health Technology Assessment Agencies
Health Economics
Clinical Practice Guidelines
Drug and Device Regulatory Approvals
Advisories and Warnings
Drug Class Reviews
Clinical Trials Registries
Databases (free)
Internet Search
Appendix 2: Description and Appraisal of Outcome Measures
Note this appendix has not been copy-edited.
Aim
To describe the following outcome measures and review their measurement properties (validity, reliability, responsiveness to change, MID):
FKSI-DRS, a secondary end point in the CLEAR study
EORTC QLQ-C30, a secondary end point in the CLEAR study
EQ-5D-3L, a secondary end point in the CLEAR study
Findings
Table 37: Summary of Outcome Measures and Their Measurement Properties
Outcome measure | Type | Conclusions about measurement properties | MID |
|---|---|---|---|
FKSI-DRS | A 9-item, patient-reported, renal cancer–specific measure of disease-related symptoms | Acceptable level of internal reliability (Cronbach alpha: 0.75 to 0.78) and test-retest reliability (intraclass correlation coefficient: 0.85) Evidence of convergent validity and discriminative validity demonstrated Adequate responsiveness to change with a moderate to large effect size (0.6 to 1.4) using GRCS as an anchor | Estimates ranging between 0.62 to 3 points have been reported in patients with advanced renal cancer using different anchors |
EORTC QLQ-C30 | A 30-item, patient-reported, cancer-specific, HRQoL questionnaire using 4- and 7-point Likert scale | The validity, reliability, or responsiveness in patients with RCC have not been evaluated | Not evaluated in patients with RCC |
EQ-5D-3L | A patient-reported, generic measure of HRQoL using a 3-point ordinal scale to assess health in 5 dimensions | The validity, reliability, or responsiveness in patients with RCC have not been evaluated | Not evaluated in patients with RCC |
FKSI-DRS = Functional Assessment of Cancer Therapy Kidney Cancer Symptom Index - Disease Related Symptoms; EORTC QLQ-C30 = European Organisation for Research and Treatment Cancer Quality of Life Questionnaire Core 30; EQ-5D-3L = EuroQol 5-Dimensions 3-Levels questionnaire; HRQoL = health-related quality of life; MID = minimal important difference; GRCS = Global Rating of Change Scale.
Functional Assessment of Cancer Therapy Kidney Cancer Symptom Index - Disease Related Symptoms
The FKSI-DRS is a kidney cancer–specific, patient-reported instrument that evaluates disease-related symptoms.23 The questionnaire consists of 9 questions that assess the symptoms of kidney cancer deemed to be the most important to monitor by patients and clinicians (lack of energy, pain, weight loss, bone pain, fatigue, shortness of breath, cough, fever, blood in urine), when treating advanced kidney cancer.23
The FKSI-DRS uses a 1-week recall period.39 All questions on the questionnaire have 5 response options: “not at all,” “a little bit,” “somewhat,” “quite a bit,” and “very much,” which correspond to scores ranging from 0 to 4.40 To compute the scale score, each item response first undergoes a score reversal. The sum of the reversed scores is then multiplied by 9 and divided by the number of items answered to give the total score, which can range from 0 (severely symptomatic) to 36 (asymptomatic).40
Cella et al. outlined the validity assessment of FKSI-DRS conducted in 141 kidney cancer patients.23 The Cronbach alpha was 0.75 to 0.78 and the intraclass correlation coefficient was 0.85, indicating an acceptable level of internal reliability and test-retest reliability, respectively.23
Convergent validity was assessed by measuring the strength of correlation with the Functional Assessment of Cancer Therapy-General (FACT-G) domains.23 Strong correlations (r > 0.05) were observed between the FKSI-DRS and the functional (FWB) and physical (PWB) domains, while moderate-to-strong correlations (r = 0.30 to 0.52) were observed between the FKSI-DRS and emotional (EWB) and social (SWB) domains. Based on cross-sectional analyses, the FKSI-DRS could differentiate patients grouped by ECOG PS (P < 0.0001), supporting the discriminant validity of FSKI-DRS in kidney cancer.23
Responsiveness to change, which was assessed by using the Global Rating of Change Scale (GRCS) as an anchor, was deemed to be adequate with a moderate to large effect size (0.6 to 1.4).23
Cella et al. estimated the MID to range from 2 to 3 points using an anchor-based approach with the GRCS as an anchor.23 A distribution-based approach was also used which suggested a broader range of MIDs between 1 to 3 points, with most estimates in the 2 to 3 point range. The study concluded that the most reasonable MID range was estimated to be 2 to 3 points.23
A more recent study41 provided MID estimates with multiple anchor-based analyses of clinical trial participants with metastatic RCC (n = 1,473). When the FKSI-19 item (“I am bothered by side effects of treatment” score and EQ-5D utility score were used as anchors, MID estimates were 1.2 to 1.3 points and 0.62 to 0.63 points respectively (r > 0.3). When a TEAE was used as an anchor, MID was estimated to range between 0.62 to 0.74 points (r < 0.3).
EORTC QLQ-C30
The EORTC QLQ-C30 is one of the most commonly used patient-reported outcome measures in oncology clinical trials.24 It is a cancer-specific, multi-dimensional measure of HRQoL that is designed to assess the change in HRQoL in clinical trial participants, in response to treatments.25
The core questionnaire of the EORTC QLQ-C30 consists of 30 questions that are scored to create 5 multi-item function scales (physical, role, cognitive, emotional, and social), 3 multi-item symptom scales (fatigue, pain, nausea and vomiting),6 single-item symptom scales (dyspnea, insomnia, appetite loss, constipation, diarrhea, and financial impact) and a 2-item QoL scale (global QoL).26
The EORTC QLQ-C30 uses a 1-week recall period.26 Most questions have 4 response options (“not at all,” “a little,” “quite a bit,” “very much”), with scores on these items ranging from 1 to 4. For the 2 items that form the global QoL scale, the response format is a 7-point Likert-type scale, with anchors of 1 (very poor) and 7 (excellent).26
Raw scores for each scale are computed as the average of the items that contribute to a particular scale.26 Each raw scale score is converted to a standardized score that ranges from 0 to 100, with a higher score reflecting better function on the function scales, higher symptoms on the symptom scales and better QoL. If items are missing for a scale, the score for the scale can still be computed if there are responses for at least one-half of the items. The scale score is then computed by disregarding the missing items with the assumption that the missing items have values equal to the average of those items for what the respondent completed.26
No literature that assesses the validity, reliability, responsiveness of change, or MID of EORTC QLQ-C30 in patients with RCC was identified.
EuroQol 5-Dimensions 3-Levels Questionnaire
The EQ-5D-3L is a generic, utility-based measure of HRQoL comprising 2 components: the EuroQol descriptive system and the EuroQol Visual Analogue Scale.27
For the EuroQol descriptive system, respondents are assigned a 5-digit descriptive health state based on their report on 5 health status dimensions that day (mobility, self-care, usual activities, pain/discomfort, and anxiety/depression).27 Three response options are available for each dimension to reflect the 3 possible levels of functioning (level 1: no problems, level 2: some problems, level 3: extreme problems). For example, an individual with no health problem on any dimension would a have a health profile of 11111, while a person with extreme problems on all dimensions would have a health profile of 33333. There are 243 unique health profiles that exist for the EQ-5D-3L.27 An index score is then calculated by applying a population-specific (e.g., UK, US) utility function to the health state vector. A score of 0 represents the health state “dead” and 1.0 reflects “perfect health.” A negative score represents the health state that the society considers to be “worse than dead.”27
For the Visual Analogue Scale component, respondents are asked to rate their health that day on a vertical line, with anchors labelled “worst imaginable health state” at 0 and “best imaginable health state” at 100.27
No literature that assesses the validity, reliability, responsiveness of change, or MID of EQ-5D-3L in patients with RCC was identified.
Appendix 3: Additional Analyses — Overall Survival
Note this appendix has not been copy-edited.
Post Hoc Survival Analysis of OS for LEN-PEM Versus SUN
The sponsor considered that the use of post-treatment anti-cancer by patients in the survival follow-up phase may have confounded OS estimates at the August 28, 2020, data cut-off. A post hoc sensitivity analysis was conducted to assess the impact on OS.
When the OS analysis was adjusted to exclude patients who received subsequent anti-cancer medication, the HR obtained in the LEN-PEM versus SUN was (HR = 0.44 [95% CI, 0.27 to 0.72]; HR in the FAS = 0.66, [95% CI, 0.49 to 0.88; P = 0.0049).9 The Kaplan-Meier plots constructed for OS in patients who did, and did not receive any subsequent systemic anti-cancer medication are presented in Figure 19 and Figure 20, respectively.
Overall, fewer patients received subsequent anti-cancer medication during survival follow-up in the LEN-PEM arm (33.0%) compared with patients in the SUN arm (57.7%). In total, 8.2% of patients received subsequent PD-1/PD-L1 checkpoint inhibitor therapy in the LEN-PEM arm compared with the SUN (43.1%). The use of subsequent anti-VEGF therapy was 30.4% and 33.6% in the LEN-PEM and SUN arms, respectively.9
Figure 19: Kaplan-Meier Plot of Overall Survival (Patients Receiving Subsequent Anti-Cancer Medication) at Interim Analysis 3 — Full Analysis Set
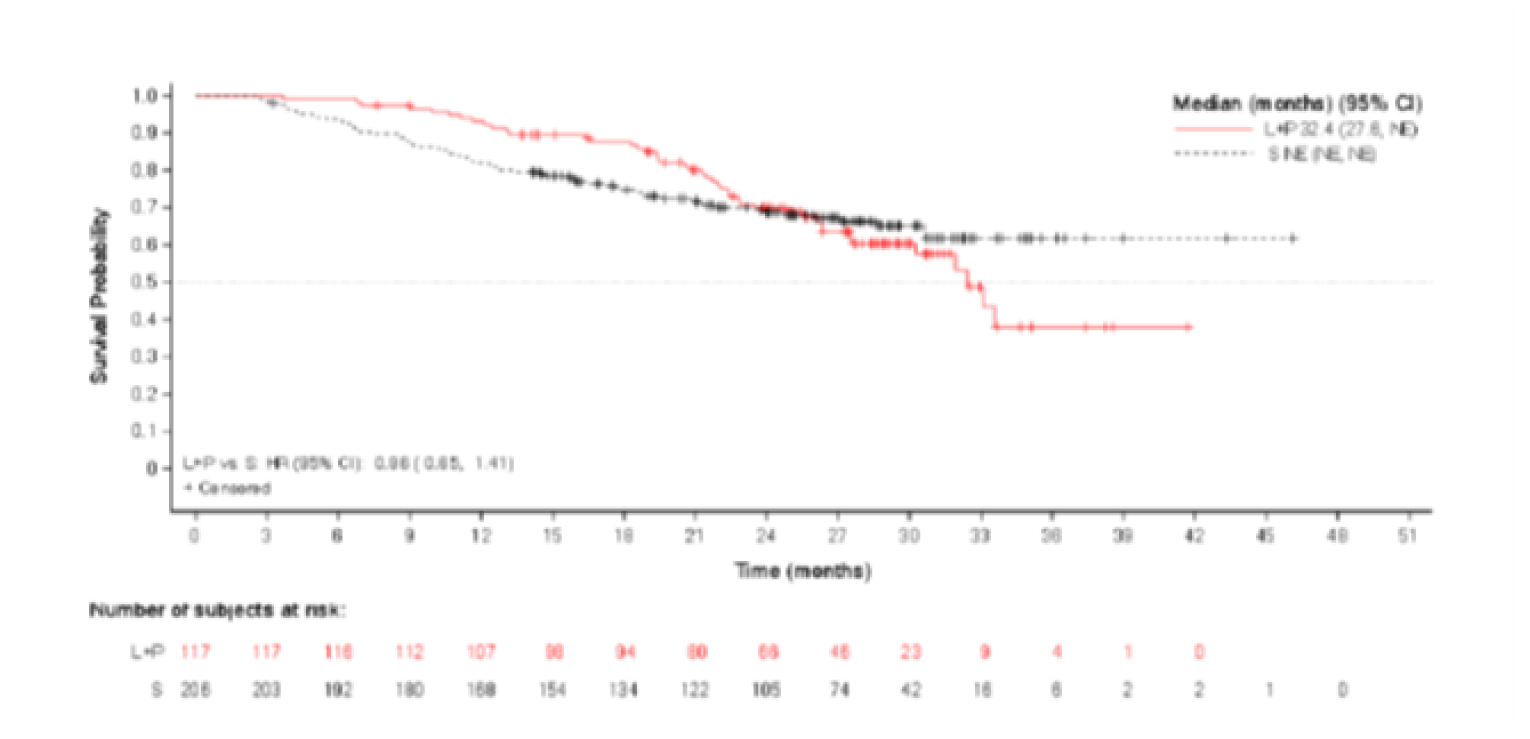
CI = confidence interval, HR = hazard ratio; L = lenvatinib, L+E = lenvatinib plus everolimus; L+P = lenvatinib plus pembrolizumab; NE = not estimable, P = pembrolizumab; S = sunitinib.
Data cut-off date: August 28, 2020.
Source: Clinical Study Report.9
Figure 20: Kaplan-Meier Plot of Overall Survival (Patients Not Receiving Subsequent Anti-Cancer Medication) at Interim Analysis 3 — Full Analysis Set
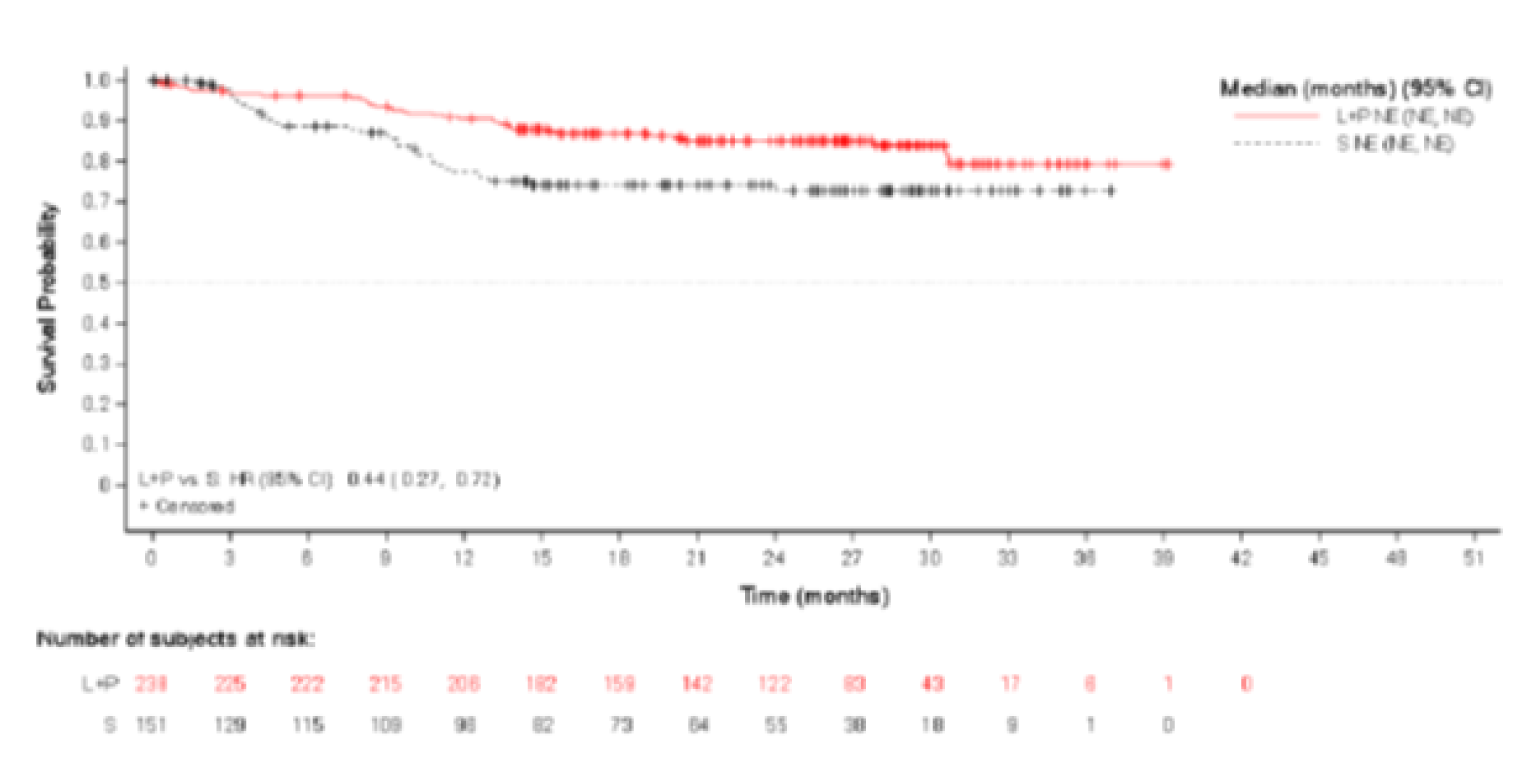
Data cut-off date: August 28, 2020.
CI = confidence interval; HR = hazard ratio; L = lenvatinib, L+E = lenvatinib plus everolimus, L+P = lenvatinib plus pembrolizumab = NE = not estimable; P = pembrolizumab; S = sunitinib.
Source: Clinical Study Report.9
Follow-Up Analysis of OS (March 31, 2021, Cut-Off)
The sponsor conducted a follow-up analysis for OS 7 months (cut-off March 31, 2021) after the August 28, 2020, data cut-off. At the March 31, 2021, data cut-off, 163 patients were still on treatment of which 114 were reported in the LEN-PEM arm and 49 in the SUN arm.
The median OS was not estimable in both study arms at the subsequent data cut-off (March 31, 2021). The HR estimated by IIR between the LEN-PEM arm and the SUN arm was HR = 0.72 (95%CI, 0.55 to 0.93), representing a 28% reduction in the risk of death for the LEN-PEM treatment. The median OS was not estimable in either treatment arms. The median OS follow-up was similar for both arms (LEN-PEM: 33.7 (95% CI, 32.8 to 34.4); SUN: 33.4 (95% CI, 32.5 to 34.1).9 Table 38 presents a summary of OS by IIR in the LEN-PEM versus SUN and Figure 21 presents the Kaplan-Meier plot of OS at the March 31, 2021, data cut-off.
Table 38: Overall Survival Follow-up Analysis — Full Analysis Set (March 31, 2021, Data Cut-Off)
Category | LEN-PEM (n = 355) n (%) arm B | SUN (n = 357) n (%) arm C |
|---|---|---|
Death, n (%) | 105 (29.6) | 122 (34.2) |
Censored, n (%), reason for censoring | 250 (70.4) | 235 (65.8) |
Lost to follow-up | 10 (2.8) | 8 (2.2) |
Withdrawal of consent | 15 (4.2) | 30 (8.4) |
Alive | 225 (63.4) | 197 (55.2) |
Overall survival (months)a | ||
Median (95% CI) | NE (41.5 to NE) | NE (38.4 to NE) |
Stratified hazard ratio (95% CI)b,c | 0.72 (0.55 to 0.93) | |
Duration of survival follow-up (months),a,e median (95% CI) | 33.7 (32.8 to 34.4) | 33.4 (32.5 to 34.1) |
Overall survival rate (%) (95% CI)a-d | ||
12 months | 91.4 (87.9 to 93.9) | 80.2 (75.5 to 84.1) |
18 months | 86.9 (82.9 to 90.1) | 73.8 (68.7 to 78.2) |
24 months | 80.2 (75.5 to 84.1) | 69.7 (64.4 to 74.3) |
CI = confidence interval; IxRS = interactive voice and web response system; LEN = lenvatinib; MSKCC = Memorial Sloan Kettering Cancer Center; NE = not estimable; PEM = pembrolizumab; Q = quartile; SUN = sunitinib.
Note: Percentages are based on the total number of patients in the full analysis set within the relevant treatment group. Data cut-off date: March 31, 2021.
aQuartiles are estimated by Kaplan-Meier method, and the 95% CIs are estimated with a generalized Brookmeyer and Crowley method.
bHazard ratio is based on a Cox proportional hazard model including treatment group as a factor; the Efron method is used for ties.
cStratified by geographic region (Region 1: Western Europe and North America or Region 2: rest of the world) and MSKCC prognostic groups (favourable, intermediate, and poor risk) in IxRS.
dOverall survival rate and 95% CIs are calculated using Kaplan-Meier product-limit method and Greenwood formula.
eEstimates for survival follow-up time are calculated in the same way as the Kaplan-Meier estimate of overall survival but with the meaning of “censor” and “event” status indicator reversed.
Source: Clinical Study Report.9
Figure 21: Kaplan-Meier Plot of Overall Survival Follow-Up Analysis — FAS (March 31, 2021)
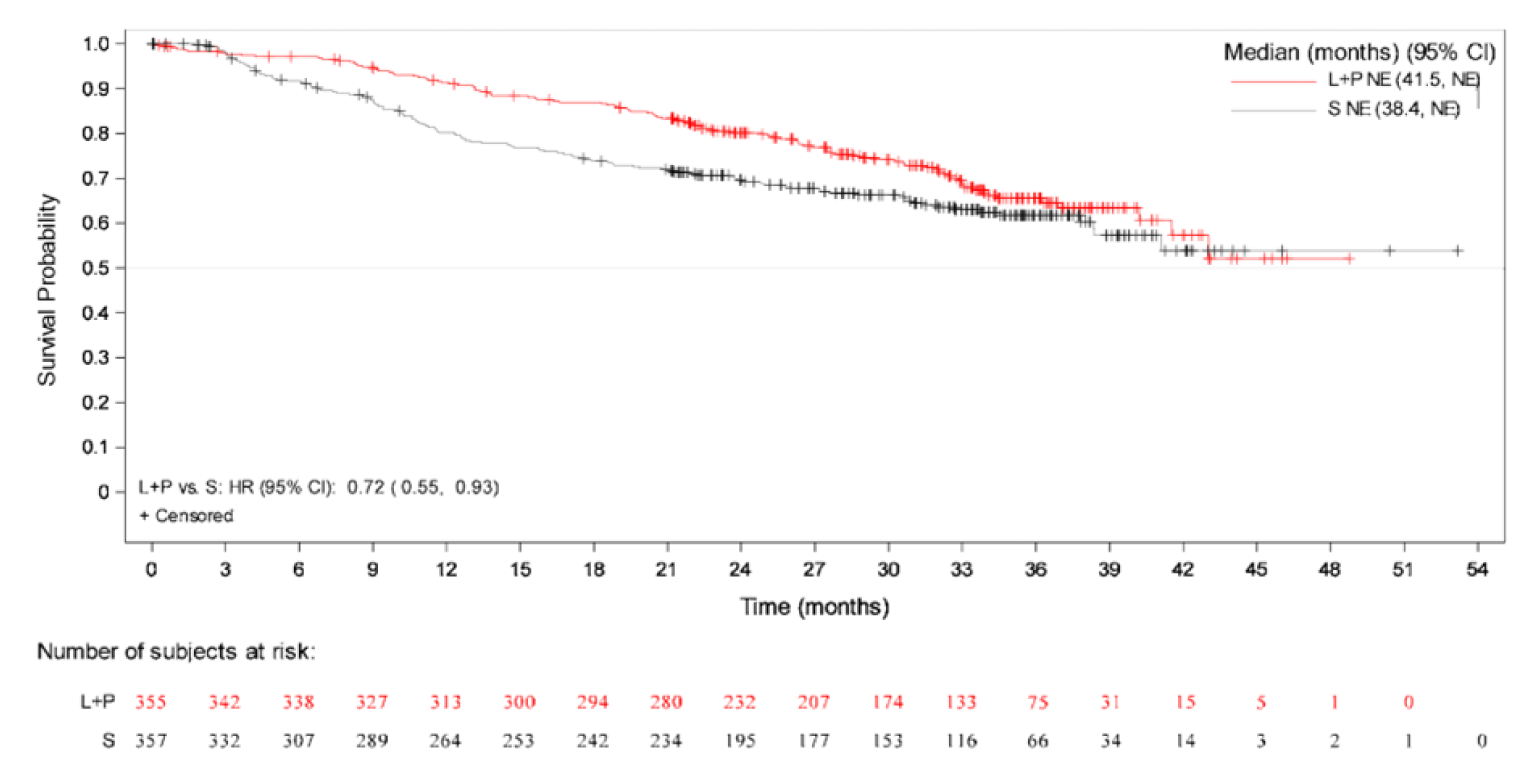
+ = censored observations; CI = confidence interval; HR = hazard ratio; IxRS = interactive voice and web response system; L+P = lenvatinib + pembrolizumab; NE = not evaluable; S = sunitinib.
Note: Median is estimated by Kaplan-Meier method, and the 95% CIs are estimated with a generalized Brookmeyer and Crowley method. Forest plots of the least squares mean difference estimates obtained with The Efron method is used for ties. Data cut-off date: March 31, 2021.
Source: Clinical Study Report.9
Appendix 4: Additional Data (Sponsor-Submitted NMA)
Table 39: Patient Characteristics in Studies Included in the Sponsor-Submitted NMA
Study | Treatment | Dose | Median age, in years | % Male | Ethnicity | Histology | Risk | PS | Stage | Number/ location of metastases | PD-L1 expression status |
|---|---|---|---|---|---|---|---|---|---|---|---|
AVOREN (Escudier, 2007) | Bevacizumab + IFN alfa-2a (n = 327, n = 312 for metastases) | Bevacizumab: 10 mg/kg IFN alfa-2a: 9 MIU | 61 (range: 30–82) | 68% | NR | Predominantly clear cellb | MSKCC category: Favourable: 27% Intermediate: 56% Poor: 9% Not available: 9% | Karnofsky: 100: 44% 90: 32% 80: 18% 70: 6% ≥ 70: 100%b | IV: 100%b | Median number of metastases: 2 (range: 1–5) Location of metastases: Lung: 62% Lymph node: 34% Liver: 18% Bone: 18% Brain/CNS: 0%b | NR |
IFN alfa-2a + placebo (n = 322, n = 301 for metastases) | Placebo: NR IFN alfa-2a: 9 MIU | 60 (range: 18–81) | 73% | NR | Predominantly clear cellb | MSKCC category: Favourable: 29% Intermediate: 56% Poor: 8% Not available: 7% | Karnofsky: 100: 39% 90: 39% 80: 16% 70: 7% ≥ 70: 100%b | IV: 100%b | Median number of metastases: 2 (range: 1–6) Location of metastases: Lung: 59% Lymph node: 36% Bone: 20% Liver: 19% Brain/CNS: 0%b | NR | |
CABOSUN (Choueiri, 2017) | Cabozantinib (n = 79) | 60 mg | 63 (range: 40–82) | 83.50% | White: 88.6% Black: 3.8% Asian: 1.3% Native Hawaiian or Pacific Islander: 1.3% American Indian or Alaska Native: 1.3% | Clear cell: 100%b | IMDC category: Intermediate: 81% Poor: 19% | ECOG: 0: 45.6% 1: 41.8% 2: 12.7% | NR | Bone: 36.7% | NR |
SUN (n = 78) | 50 mg | 64 (range: 31–87) | 73.10% | White: 96.2% Black: 2.6% Asian: 0% Native Hawaiian or Pacific Islander: 0% American Indian or Alaska Native: 0% | Clear cell: 100%b | IMDC category: Intermediate: 80.8% Poor: 19.2% | ECOG: 0: 46.2% 1: 41% 2: 12.8% | NR | Bone: 35.9% | NR | |
CheckMate 214 (Motzer, 2018b) | NIVO-IPI (n = 550, n = 499 for PD-L1 status) | Induction phase (first 4 doses): NIVO: 3 mg/kg (60-minute infusion) IPI: 1 mg/kg (30-minute infusion) Maintenance phase: NIVO monotherapy: 3 mg/kg | 62 (range: 26–85) | 75% | NR | Clear cell: 100%b | IMDC category: Favourable: 23% Intermediate: 61% Poor: 17% | Karnofsky: ≥ 70: 100%b | NR | Lung: 69% Lymph node: 45% Bone: 20% Liver: 18% CNS: 0%b | < 1%: 77% ≥ 1%: 23% |
SUN (n = 546, n = 503 for PD-L1 status) | 50 mg | 62 (range: 21–85) | 72% | NR | Clear cell: 100%b | IMDC category: Favourable: 23% Intermediate: 61% Poor: 16% | Karnofsky: ≥ 70: 100%b | NR | Lung: 68% Lymph node: 49% Bone: 22% Liver: 20% CNS: 0%b | < 1%: 75% ≥ 1%: 25% | |
CheckMate 9ER (Choueiri TK, 2020) | SUN (n = 328) | 50 mg | 61 (range: 28-86) | 71% | NR | NR | IMDC category: Favourable: 22% Intermediate: 57% Poor: 21% | NR | NR | Location of metastases: Lung: 76% Lymph node: 40% Bone: 22% Liver: 16% Number of metastases: 1: 21% ≥ 2: 78% | < 1%: 75% ≥ 1%: 25% |
NIVO + cabozantinib (n = 323) | NIVO: 240 mg Cabozantinib: 40 mg | 62 (range: 29-90) | 77% | NR | NR | IMDC Category: Favourable: 23% Intermediate: 58% Poor: 19% | NR | NR | Location of metastases: Lung: 74% Lymph node: 40% Bone: 24% Liver: 23% Number of metastases: 1: 20% ≥ 2: 80% | < 1%: 74% ≥ 1%: 26% | |
CLEAR (HOPE 307/KN-581) (Eisai, 2020) | LEN + everolimus | Actual median dose intensity, LEN: 12.67 mg/day; everolimus: 4.46 mg/day | 62 (range: 32-86) | 74.50% | White: 71.1% Asian: 21.6% Other: 2.8% | Clear cell: 100% Clear cell + papillary: 6.2% Clear cell + chromophobe: 0.8% Clear cell + sarcomatoid: 6.7% Clear cell + other: 7% Non–clear cell: 0% | IMDC category: Favourable: 31.9% Intermediate: 54.6% Poor: 11.8% MSKCC category: Favourable: 27.5% Intermediate: 63.6% Poor: 9% | Karnofsky: 100-90: 80.1% 80-70: 19.6% | At diagnosis: I: 8.4% II: 6.7% III: 19% IV: 54.6% Not assigned: 11.2% | Location of metastases: Adrenal: 17.4% Bone: 26.9% Brain: 0.8% Kidney: 24.1% Liver: 19.9% Lung: 68.6% Lymph node: 47.1% Number of metastases: 0: 0.6% 1: 27.7% 2: 40.9% ≥ 3: 30.5% | < 1%: 33.1% ≥ 1%: 32.5% |
LEN-PEM | Actual median dose intensity, LEN: 13.93 mg/day | 64 (range: 34-88) | 71.80% | White: 74.1% Asian: 22.8% Other: 1.7% | Clear cell: 99.7% Clear cell + papillary: 6.5% Clear cell + chromophobe: 0.6% Clear cell + sarcomatoid: 7.9% Clear cell + other: 4.8% Non–clear cell: 0.3% | IMDC category: Favourable: 31% Intermediate: 59.2% Poor: 9.3% MSKCC category: Favourable: 27% Intermediate: 63.9% Poor: 9% | Karnofsky: 100-90: 83.1% 80-70: 16.9% | At diagnosis: I: 14.1% II: 4.5% III: 16.9% IV: 50.1% Not assigned: 14.4% | Location of metastases: Adrenal: 14.9% Bone: 22.5% Brain: 1.7% Kidney: 25.6% Liver: 17.7% Lung: 71% Lymph node: 45.6% Number of metastases: 0: 1.4% 1: 33.5% 2: 36.3% ≥ 3: 38.7% | < 1%: 31.5% ≥ 1%: 30.1% | |
SUN | Actual median dose intensity: 41.59 mg/day | 61 (range: 29-82) | 77% | White: 75.6% Asian: 18.8% Other: 2.8% | Clear cell: 100% Clear cell + papillary: 5.9% Clear cell + chromophobe: 0.3% Clear cell + sarcomatoid: 5.9% Clear cell + other: 7.8% Non–clear cell: 0% | IMDC category: Favourable: 34.7% Intermediate: 53.8% Poor: 10.4% MSKCC category: Favourable: 27.2% Intermediate: 63.9% Poor: 9% | Karnofsky: 100-90: 82.4% 80-70: 17.4% | I: 9.8% II: 5.9% III: 18.8% IV: 54.6% Not assigned: 10.9% | Location of metastases: Adrenal: 18.5% Bone: 24.9% Brain: 2.8% Kidney: 24.6% Liver: 19.6% Lung: 63.9% Lymph node: 43.7% Number of metastases: 0: 1.7% 1: 31.9% 2: 35.6% ≥ 3: 30.5% | < 1%: 28.9% ≥ 1%: 33.3% | |
COMPARZ (Motzer, 2013a) | PAZO (n = 557) | 800 mg | 61 (range: 18–88) | 71% | NR | Clear cell: 100%b | MSKCC category: Favourable: 27% Intermediate: 58% Poor: 12% | Karnofsky: 90 or 100: 75% 70 or 80: 25% | NR | Number of metastases: 1: 21% 2: 37% ≥ 3: 42% Location of metastases: Lung: 76% Lymph node: 40% Bone: 20% Liver: 15% | NR |
SUN (n = 553) | 50 mg | 62 (range: 23–86) | 75% | NR | Clear cell: 100%b | MSKCC category: Favourable: 27% Intermediate: 59% Poor: 9% | Karnofsky: 90 or 100: 76% 70 or 80: 24% | NR | Number of metastases: 1: 20% 2: 37% ≥ 3: 44% Location of metastases: Lung: 77% Lymph node: 45% Liver: 20% Bone: 15% | NR | |
CROSS-J-RCC (Tomita, 2014) | SUN (n = 57) | 50 mg | 67 (range: 41-79) | NR | NR | Clear cell: 100%b | MSKCC Favourable: 21% | ECOG 0–1: 100%b | IV: 100%b | Presence of stable brain metastases: 8.8% | NR |
Sorafenib (n = 63) | 400 mg | 66 (range: 44-79) | NR | NR | Clear cell: 100%b | MSKCC Favourable: 22% | ECOG 0–1: 100%b | IV: 100%b | Presence of stable brain metastases: 1.6% | NR | |
Escudier, 2009 (Escudier, 2009) | IFN alfa-2a (n = 92, n = 90 for ethnicity) | 9 MIU | 62.5 (range: 18–80) | 56.50% | White: 83%a Asian: 1%a | NR | MSKCC category: Low: 51.1% Intermediate: 47.8% High: 0% Missing: 1.1% | ECOG: 0: 53.3% 1: 46.7% | III: 4.3% IV: 95.7% | Number of metastases: 1: 82%a 1: 18%a Location of metastases: Lung: 80.4% Lymph node: 46.7% Bone: 37% Pleura: 32.6% Liver: 20.7% Soft tissue: 9.8% Adrenal: 9.8% Spinal cord: 6.5% Kidney: 6.5% Pancreas: 3.3% Brain: 0%b | NR |
Sorafenib (n = 97) | 400 mg | 62 (range: 34–78) | 67% | White: 70%a Asian: NR | NR | MSKCC category: Low: 53.6% Intermediate: 45.4% High: 1% Missing: 0% | ECOG: 0: 57.7% 1: 42.3% | III: 2.1% IV: 97.9% | Number of metastases: 1: 9%a > 1: 91%a Location of metastases: Lung: 86.6% Lymph node: 55.7% Pleura: 34% Bone: 32% Liver: 24.7% Adrenal: 16.5% Kidney: 12.4% Pancreas: 9.3% Soft tissue: 7.2% Spinal cord: 4.1% Brain: 0%b | NR | |
Global ARCC (Dutcher, 2009; Hudes, 2007) | Temsiro-limus (n = 209, n = 206 for papillary histology) | 25 mg | 58 (range: 32–81) | 66% | NR | Clear cell: 81% Other histology: 19% Indeterminate: 12% Non–clear cell: 6% Non-papillary: 89%a Any papillary: 12%a | MSKCC category: Intermediate: 31% Poor: 69% | Karnofsky: > 70: 20% ≤ 70: 80% | NR | CNS: 0%b | NR |
IFN alfa-2a (n = 207, n = 206 for papillary histology) | 3 MIU during week 1, 9 MIU during Week 2, and 19 MIU thereafter | 60 (range: 23–86) | 71% | NR | Clear cell: 82% Other histology: 18% Indeterminate: 11% Non–clear cell: 6% Non-papillary: 86%a Any papillary: 15%a | MSKCC category: Intermediate: 24% Poor: 76% | Karnofsky: > 70: 16% ≤ 70: 83% | NR | CNS: 0%b | NR | |
IFN alfa-2a + temsirolimus (n = 210) | IFN alfa-2a: 3 MIU for week 1 and 6 MIU thereafter Temsirolimus: 15 mg | 59 (range: 32–82) | 69% | NR | Clear cell: 78% Other histology: 22% | MSKCC category: Intermediate: 24% Poor: 76% | Karnofsky: > 70: 16% ≤ 70: 84% | NR | CNS: 0%b | NR | |
Hutson, 2013 (Hutson, 2013) | AXI (n = 192) | 5 mg | 58 (range: 23–83) | 70% | White: 71% Asian: 25% Black: < 1% Other ethnicity: 4% | Clear cell: 100%b | MSKCC risk factors: 0: 49% 1–2: 44% ≥ 3: 4% Not available: 4% | ECOG: 0: 57% 1: 43% | IV: 100%b | Lung: 71% Lymph node: 52% Bone: 29% Liver: 27% Brain: 0%b | NR |
Sorafenib (n = 96) | 400 mg | 58 (range: 20–77) | 77% | White: 69% Asian: 25% Black: 0% Other ethnicity: 6% | Clear cell: 100%b | MSKCC risk factors: 0: 55% 1–2: 42% ≥ 3: 2% Not available: 1% | ECOG: 0: 57% 1: 43% | IV: 100%b | Lung: 75% Lymph node: 57% Liver: 26% Bone: 25% Brain: 0%b | NR | |
IMmotion 150 (McDermott, 2018) | Atezoli-zumab + bevaci-zumab (n = 101) | Atezolizumab: 1,200 mg Bevacizumab: 15 mg/kg | 62 (range: 32–88) | 73% | NR | Predominantly clear cell: 96% Sarcomatoid component: 15% | MSKCC category: Favourable: 30% Intermediate: 61% Poor: 9% | Karnofsky ≥ 80: 99% | IV: 100%b | CNS: 0%b | ≥ 1%: 50% |
Atezoli-zumab (n = 103) | 1,200 mg | 61 (range: 27–81) | 75% | NR | Predominantly clear cell: 92% Sarcomatoid component: 15% | MSKCC category: Favourable: 25% Intermediate: 67% Poor: 8% | Karnofsky ≥ 80: 99% | IV: 100%b | CNS: 0%b | ≥ 1%: 52% | |
SUN (n = 101) | 50 mg | 61 (range: 25–85) | 78% | NR | Predominantly clear cell: 96% Sarcomatoid component: 14% | MSKCC category: Favourable: 21% Intermediate: 69% Poor: 10% | Karnofsky ≥ 80: 93% | IV: 100%b | CNS: 0%b | ≥ 1%: 59% | |
Immotion 151 (Motzer, 2018a) | Atezoli-zumab + bevaci-zumab (n = 454) | Atezolizumab: 1,200 mg Bevacizumab: 15 mg/kg | 62 (range: 56-69) | 70% | NR | Predominantly sarcomatoid: 5% Predominantly clear cell: 93% Other: 2% Any component of sarcomatoid differentiation regardless of predominant histology: 15% | MSKCC category: Favourable: 20% Intermediate: 69% Poor: 12% | Karnofsky: < 80: 9% 80–90: 53% 90–100: 38% | NR | Liver: 17% Bone: 20% Lung: 75% Lymph node: 47% | < 1%: 61% ≥ 1%: 39%a |
SUN (n = 461) | 50 mg | 60 (range: 54-66) | 76% | NR | Predominantly sarcomatoid: 5% Predominantly clear cell: 92% Other: 3% Any component of sarcomatoid differentiation regardless of predominant histology: 16% | MSKCC category: Favourable: 20% Intermediate: 69% Poor: 12% | Karnofsky: < 80: 8% 80–90: 49% 90-100: 43% | NR | Liver: 18% Bone: 20% Lung: 71% Lymph node: 47% | < 1%: 60% ≥ 1%: 40%a | |
JAVELIN Renal 101 (Motzer, 2019; Uemura, 2020) | Avelumab + AXI (n = 442) | Avelumab: 10 mg/kg AXI: 5 mg (up to 7 mg or 10 mg) | 62 (range: 29–83) | 71.50% | NR | Clear cell: 100%b | MSKCC category: Favourable: 21.7% Intermediate: 64% Poor: 11.5% IMDC category: Favourable: 21.3% Intermediate: 61.3% Poor: 16.3% | ECOG 0–1: 100%b | I: 7.9% IA: 0.2% IB: 2.3% II: 8.8% IIA: 1.8% IIB: 0.9% III: 21% IIIA: 5.7% IIIB: 1.4% IV: 41.6% IVA: 0.9% IVB: 0.7% IVC: 0.2% IV M1A: 2.7% IV M1B: 0.5% IV M1C: 0.5% | Number of metastases: 0: 2.5% 1: 41% 2: 33.5% 3: 15.2% ≥ 4: 7.9% Location of metastases: CNS: 0%b | NR |
SUN (n = 444) | 50 mg | 61 (range: 27–88) | 77.50% | NR | Clear cell: 100%b | MSKCC category: Favourable: 22.5% Intermediate: 66% Poor: 10.1% IMDC category: Favourable: 21.6% Intermediate: 62.2% Poor: 16% | ECOG 0–1: 100%b | I: 8.1% IA: 0.2% IB: 2.3% II: 8.8% IIA: 1.1% IIB: 0.5% III: 16% IIIA: 4.5% IIIB: 1.4% IV: 45.5% IVA: 1.4% IVB: 0.2% IVC: 0.5% IV M1A: 2.5% IV M1B: 0.7% IV M1C: 1.1% | Number of metastases: 0: 3.6% 1: 39.2% 2: 34% 3: 17.8% ≥ 4: 5.4% Location of metastases: CNS: 0%b | NR | |
KEYNOTE-426 (Rini, 2019a) | PEM-AXI (n = 432, n = 410 for PD-L1 status) | PEM 200 mg AXI: 5 mg (up to 7 mg or 10 mg) | 62 (range: 30–89) | 71.30% | NR | Clear cell: 100%b Sarcomatoid features: 12% No sarcomatoid: 54% | IMDC category: Favourable: 31.9% Intermediate: 55.1% Poor: 13% | Karnofsky ≥ 70: 100%b | IV: 100%b | Number of metastases: 1: 26.4% ≥ 2: 72.9% Location of metastases: Lung: 72.2% Lymph node: 46.1% Bone: 23.8% Adrenal: 15.5% Liver: 15.3% CNS: 0%b | < 1%: 40.7% ≥ 1%: 59.3% |
SUN (n = 429, n = 412 for PD-L1 status) | 50 mg | 61 (range: 26–90) | 74.60% | NR | Clear cell: 100%b Sarcomatoid features: 13% No sarcomatoid: 56% | IMDC category: Favourable: 30.5% Intermediate: 57.3% Poor: 12.1% | Karnofsky ≥ 70: 100%b | IV: 100%b | Number of metastases: 1: 22.4% ≥ 2: 77.2% Location of metastases: Lung: 72% Lymph node: 45.9% Bone: 24% Adrenal: 17.7% Liver: 16.6% CNS: 0%b | < 1%: 38.3% ≥ 1%: 61.7% | |
Motzer, 2007 (Motzer, 2007) | SUN (n = 375) | 50 mg | 62 (range: 27–87) | 71% | NR | Clear cell: 100%b | MSKCC category: Favourable: 38% Intermediate: 56% Poor: 6% | ECOG: 0: 62% 1: 38% | IV: 100%b | Number of metastases: 1: 15% 2: 28% ≥ 3: 57% Location of metastases: Lung: 78% Lymph node: 58% Bone: 30% Liver: 26% Brain: 0%b | NR |
IFN alfa-2a (n = 375) | 3 MIU for first week, 6 MIU for the second week, and 9 MIU thereafter | 59 (range: 34–85) | 72% | NR | Clear cell: 100%b | MSKCC category: Favourable: 34% Intermediate: 59% Poor: 7% | ECOG: 0: 61% 1: 39% | IV: 100%b | Number of metastases: 1: 19% 2: 30% ≥ 3: 51% Location of metastases: Lung: 79% Lymph node: 53% Bone: 30% Liver: 24% Brain: 0%b | NR | |
Negrier, 1998 (Negrier, 1998) | IL-2 + IFN alfa-2a (n = 140) | IFN alfa-2a: 6 MIU IL-2: 9 MIU | 56 | 71% | NR | NR | NR | ECOG: 0: 83% 1: 15% 2: 1% | NR | Number of metastases: 1: 20% 2: 32% ≥ 3: 46% Location of metastases: Brain: 0%b | NR |
IFN alfa-2a (n = 147) | 9 MIU | 55 | 73% | NR | NR | NR | ECOG: 0: 77% 1: 20% 2: 2% | NR | Number of metastases: 1: 28% 2: 25% ≥ 3: 47% Location of metastases: Brain: 0%b | NR | |
IL-2 (n = 138) | 9 MIU | 56 | 69% | NR | NR | NR | ECOG: 0: 72% 1: 25% 2: 2% | NR | Number of metastases: 1: 22% 2: 36% ≥ 3: 41% Location of metastases: Brain: 0%b | NR | |
RECORD-2 (Ravaud, 2015) | Bevacizumab + everolimus (n = 182) | Bevacizumab: 10 mg/kg Everolimus: 10 mg | 60 (range: 20–84) | 75.80% | White: 79.1% Asian: 18.1% Black: 1.1% Other ethnicity: 1.6% | Any clear cell: 100%b Clear cell: 94.5% Sarcomatoid component: 3.3% Papillary: 2.2% Chromophobe: 0% Other: 0% | MSKCC category: Favourable: 35.7% Intermediate: 57.1% Poor: 7.1% | Karnofsky ≥ 70: 100%b | IV: 100%b | Lung: 83% Lymph node: 47.3% Bone: 26.4% Liver: 22.5% Mediastinum: 14.8% Pleura: 10.4% Retroperitoneal mass: 8.2% Pleural effusion: 2.7% Ascites: 1.6% Skin: 1.1% Central/ autonomic nervous system: 0.5% Other site: 29.1% | NR |
Bevacizumab + IFN alpha-2a (n = 183) | Bevacizumab: 10 mg/kg IFN alfa-2a: 9 MIU | 60 (range: 31–81) | 71.60% | White: 80.9% Asian: 13.1% Black: 3.8% Other ethnicity: 2.2% | Any clear cell: 100%b Clear cell: 97.3% Papillary: 1.1% Chromophobe: 0.5% Sarcomatoid component: 0.5% Other: 0.5% | MSKCC category: Favourable: 36.1% Intermediate: 56.8% Poor: 7.1% | Karnofsky ≥ 70: 100%b | IV: 100%b | Lung: 73.2% Lymph node: 53.6% Bone: 29.5% Liver: 20.2% Mediastinum: 19.7% Retroperitoneal mass: 12.6% Pleura: 7.7% Pleural effusion: 4.4% Ascites: 1.6% Skin: 0.5% Central/ autonomic nervous system: 0% Other site: 32.8% | NR | |
RECORD-3 (Motzer, 2014a) | Everolimus (n = 238) | 10 mg | 62 (range: 20–89) | 70% | White: 69% Asian: 19% Black: 3% Other ethnicity: 10% | Clear cell: 86% Any non–clear cell: 13% Papillary: 10% Chromophobe: 2% Missing: < 1% | MSKCC category: Favourable: 29% Intermediate: 56% Poor: 15% | Karnofsky: ≥ 90: 66% 80: 26% 70: 8% Missing: < 1% | NR | Number of metastases: 0: < 1% 1: 31% ≥ 2: 69% Location of metastases: Lung: 68% Bone: 24% Liver: 18% | NR |
SUN (n = 233) | 50 mg | 62 (range: 29–84) | 76% | White: 74% Asian: 16% Black: 3% Other ethnicity: 7% | Clear cell: 85% Any non–clear cell: 15% Papillary: 11% Chromophobe: 3% Missing: < 1% | MSKCC category: Favourable: 30% Intermediate: 56% Poor: 14% | Karnofsky: ≥ 90: 78% 80: 19% 70: 3% Missing: < 1% | NR | Number of metastases: 0: < 1% 1: 32% ≥ 2: 67% Location of metastases: Lung: 69% Bone: 21% Liver: 16% | NR | |
ROPETAR (Cirkel, 2017) | PAZO (n = 49) | 800 mg/day | 67 (range: 38–82) | 63% | NR | NR | MSKCC category: Favourable: 24% Intermediate: 55% Poor: 18% | ECOG: 0: 53% 1: 41% 2: 4% | NR | Lung: 69% Lymph node: 37% Bone: 39% Liver: 10% Brain: 0% | NR |
EVE + PAZ (rotating) (n = 52) | Everolimus: 10 mg/day PAZO: 800 mg/day | 65 (range: 44–87) | 73% | NR | NR | MSKCC category: Favourable: 27% Intermediate: 62% Poor: 12% | ECOG: 0: 60% 1: 36% 2: 4% | NR | Lung: 67% Lymph node: 40% Bone: 31% Liver: 12% Brain: 2% | NR | |
SWITCH (Eichelberg, 2015) | Sorafenib (n = 182, n = 177 for ECOG and metastases) | 400 mg | 64 (range: 39–84) | 76% | NR | Clear cell: 90% | MSKCC category: Favourable: 39% Intermediate: 59% High: 0.5% Unknown: 1.1% Missing: 0% | ECOG: 0: 66% 1: 31% 2: 0% Missing: 3.4% | NR | Number of metastases: 1: 21% 2: 38% 3: 29% ≥ 4: 11% Location of metastases: Lung: 79% Lymph node: 48% Liver: 20% Bone: 12% Brain: 3.4% | NR |
SUN (n = 183, n = 176 for ECOG and metastases) | 50 mg | 65 (range: 40–83) | 74% | NR | Clear cell: 84% | MSKCC category: Favourable: 45% Intermediate: 51% High: 0.5% Unknown: 2.2% Missing: 1.1% | ECOG: 0: 60% 1: 38% 2: 0.6% Missing: 1.7% | NR | Number of metastases: 1: 29% 2: 34% 3: 20% ≥ 4: 16% Location of metastases: Lung: 72% Lymph node: 40% Liver: 24% Bone: 17% Brain: 2.3% | NR | |
SWITCH II (Retz, 2019) | Sorafenib (n = 189) | 400 mg | 68 (range: 31–84) | 72% | NR | Clear cell: 89% | MSKCC category: Low: 50% Intermediate: 48% High: 2% | Karnofsky: 100: 51% 90: 17% 80: 27% 70: 5% | NR | Lung: 69% Bone: 20% Liver: 17% Brain: 0%b | NR |
PAZO (n = 188) | 800 mg | 68 (range: 26–86) | 73% | NR | Clear cell: 85% | MSKCC category: Low: 48% Intermediate: 47% High: 3% | Karnofsky: 100: 45% 90: 25% 80: 23% 70: 6% | NR | Lung: 74% Bone: 20% Liver: 20% Brain: 0%b | NR | |
TemPa (Tannir, 2020; Zurita, 2018) | PAZO (n = 34) | 800 mg | 61 (range: 37–74) | 82.30% | NR | Clear cell: 100%b | IMDC category: Intermediate: 44%a Poor: 59%a Intermediate: 23.5% Poor: 76.5% | ECOG: 0: 2.9% 1: 35.3% 2: 61.8% | NR | NR | NR |
Temsi-rolimus (n = 35) | 25 mg | 61 (range: 42–80) | 68.60% | NR | Clear cell: 100%b | IMDC category: Intermediate: 29%a Poor: 69%a Intermediate: 31.4% Poor: 68.6% | ECOG: 0: 2.9% 1: 40% 2: 57.1% | NR | NR | NR | |
TIVO-1 (Motzer, 2013b) | Tivozanib (n = 260) | 1.5 mg | 59 (range: 23–83) | 71% | White: 96% Asian: 4% Black: < 1% | Clear cell: 100%b | MSKCC category: Favourable: 27% Intermediate: 67% Poor: 7% | ECOG: 0: 45% 1: 55% | NR | Number of metastases: 1: 29% 2: 38% > 2: 33% Location of metastases: Lung: 82% Lymph node: 70% Adrenal: 30% Liver: 26% Bone: 23% | NR |
Sorafenib (n = 257) | 400 mg | 59 (range: 23–85) | 74% | White: 97% Asian: 3% Black: 0% | Clear cell: 100%b | MSKCC category: Favourable: 34% Intermediate: 62% Poor: 4% | ECOG: 0: 54% 1: 46 | NR | Number of metastases: 1: 34% 2: 41% > 2: 25% Location of metastases: Lung: 79% Lymph node: 65% Adrenal: 22% Bone: 20% Liver: 19% | NR | |
VEG105192 (Sternberg, 2010) | PAZO (n = 290) | 800 mg | 59 (range: 28–65) | 68% | White: 87% Asian: 12% Black: < 1% Other ethnicity: < 1% | Any clear cell: 100%b Clear cell: 91% Predominantly clear cell: 9% | MSKCC category: Favourable: 39% Intermediate: 55% Poor: 3% Unknown: 3% | ECOG: 0: 42% 1: 58% | NR | Number of metastases: 1: 18% 2: 27% ≥ 3: 55% Location of metastases: Lung: 74% Lymph node: 54% Bone: 28% Liver: 26% Kidney: 23% CNS: 0%b | NR |
Placebo (n = 145) | NA | 60 (range: 25–81) | 75% | White: 84% Asian: 16% Black: 0% Other ethnicity: 0% | Any clear cell: 100%b Clear cell: 89% Predominantly clear cell: 11% | MSKCC category: Favourable: 39% Intermediate: 53% Poor: 3% Unknown: 4% | ECOG: 0: 41% 1: 59% | NR | Number of metastases: 1: 14% 2: 34% ≥ 3: 52% Location of metastases: Lung: 73% Lymph node: 59% Bone: 26% Kidney: 25% Liver: 22% CNS: 0%b | NR |
AXI = axitinib; CNS = central nervous system; ECOG = Eastern Cooperative Oncology Group; IFN = interferon; IL-2 = interleukin-2; IMDC = International Metastatic Renal Cell Carcinoma Database Consortium; IPI = ipilimumab; LEN = lenvatinib; MSKCC = Memorial Sloan Kettering Cancer Center; NR = not reported; PAZO = pazopanib; PEM = pembrolizumab;PD-L1 = programmed cell death 1 ligand 1; PS = performance status; SUN = sunitinib.
aPercentages were calculated using the number of patients and the population size.
bThese parameters were restricted by study design.
Note this table has not been copy-edited.
Source: Sponsor-submitted NMA.31
Pharmacoeconomic Review
Abbreviations
AE
adverse event
AXI
axitinib
CKCF
Canadian Kidney Cancer Forum
DoT
duration of therapy
HR
hazard ratio
ICER
incremental cost-effectiveness ratio
IMDC
International Metastatic Renal Cell Carcinoma Database Consortium
IPI
ipilimumab
KM
Kaplan-Meier
LEN
lenvatinib
LY
life-year
NICE
National Institute for Health and Care Excellence
NIVO
nivolumab
NMA
network meta-analysis
OS
overall survival
PAZO
pazopanib
PEM
pembrolizumab
PFS
progression-free survival
PSM
partitioned survival model
QALY
quality-adjusted life-year
RCC
renal cell carcinoma
RDI
relative dose intensity
SUN
sunitinib
TTD
time to treatment discontinuation
Executive Summary
The executive summary comprises 2 tables (Table 1 and Table 2) and a conclusion.
Item | Description |
|---|---|
Drug product | Lenvatinib and pembrolizumab (Lenvima and Keytruda), capsules |
Submitted price |
|
Indication | Proposed: In combination with pembrolizumab, for the treatment of adult patients with advanced or metastatic RCC with no prior systemic therapy for metastatic RCC |
Health Canada approval status | NOC |
Health Canada review pathway | Standard |
NOC date | May 5, 2022 |
Reimbursement request | As per indication |
Sponsor | Eisai Limited |
Submission history | Previously reviewed: Yes Lenvatinib in combination with everolimus
Lenvatinib alone |
NOC = Notice of Compliance; RCC = renal cell carcinoma.
Table 2: Summary of Economic Evaluation
Component | Description |
|---|---|
Type of economic evaluation |
|
Target populations |
|
Treatments | Lenvatinib in combination with pembrolizumab (LEM-PEM) |
Comparators | Base case 1: Axitinib plus pembrolizumab (AXI-PEM), sunitinib (SUN), and pazopanib (PAZO) Base case 2: AXI-PEM, SUN, PAZO, and nivolumab plus ipilimumab (NIVO-IPI) |
Perspective | Canadian publicly funded health care payer |
Outcomes | QALYs, LYs |
Time horizon | Lifetime (30 years) |
Key data source | CLEAR (Study 307), a phase III, randomized, open-label trial (LEN-PEM vs. SUN) and a sponsor-conducted NMA (vs. AXI-PEM, PAZO, and NIVO-IPI) |
Submitted results |
|
Key limitations |
|
CADTH reanalysis results |
|
AE = adverse event; AXI = axitinib; DoT = duration of treatment; ICER = incremental cost-effectiveness ratio; IMDC = International Metastatic Renal Cell Carcinoma Database Consortium; IPI = ipilimumab; LEN = lenvatinib; LY = life-year; NIVO = nivolumab; OS = overall survival; PAZO = pazopanib; PEM = pembrolizumab; PFS = progression-free survival; PSM = partitioned survival model; QALY = quality-adjusted life-year; RCC = renal cell carcinoma; RDI = relative dose intensity; SUN = sunitinib; TTD = time to treatment discontinuation.
Conclusions
The CADTH Clinical Review found that the median progression-free survival (PFS) was 23.9 months in patients receiving lenvatinib (LEN) plus pembrolizumab (PEM) (LEN-PEM) compared with 9.2 months for patients receiving sunitinib (SUN). The objective response rate (ORR) estimated in the LEN-PEM arm was also considered statistically significant. Median overall survival (OS) was not reached. The Clinical Review noted that the open-label design was a key limitation of the CLEAR trial. The CADTH Clinical Review found that the sponsor’s network meta-analysis (NMA), which informed the efficacy of axitinib (AXI) plus PEM (AXI-PEM), pazopanib (PAZO), and nivolumab (NIVO) plus ipilimumab (IPI) (NIVO-IPI), has some sources of uncertainty but was generally well conducted and suggestive of a PFS benefit for LEN-PEM versus AXI-PEM. The NMA was not suggestive of an OS benefit for LEN-PEM compared with AXI-PEM.
CADTH undertook reanalyses to address limitations relating to the following:
uncertainty in the long term PFS for LEN-PEM
aligning the time to treatment discontinuation (TTD) for LEN with CLEAR trial observations and ensuring the duration of treatment (DoT) is close to but not greater than the duration of PFS
assuming DoT for subsequent therapies was equal for all comparators
assuming 50% of patients receive subsequent therapy upon progression
assuming an RDI of 100% for all treatments
adjusting adverse event (AE) treatment costs for anemia and hypertension to reflect the outpatient nature of their management.
Based on the CADTH base case, the incremental cost-effectiveness ratio (ICER) for LEN-PEM compared with AXI-PEM was $667,600 per quality-adjusted life-year (QALY). To achieve an ICER of $50,000 per QALY compared with AXI-PEM, a price reduction of at least 56% is required.
CADTH was unable to address limitations with the model regarding the sponsor’s partitioned survival model (PSM) modelling approach leading to unexpected pre-progression survival benefits for LEN-PEM and post-progression survival benefits for AXI-PEM. In a scenario analysis, CADTH assumed equal efficacy between these treatments in terms of PFS and OS, resulting in equal pre- and post-progression life-years (LYs) for LEN-PEM and AXI-PEM. In this scenario, AXI-PEM dominated (i.e., equally as effective and $34,337 more expensive) compared with LEN-PEM. CADTH conducted a scenario analysis only for the intermediate and poor risk subgroup; no conclusions can be drawn regarding the cost-effectiveness of LEN-PEM in this population.
Additionally, there is some uncertainty as to the drug cost for LEN. Given the different dose packages and pricing from the sponsor, the cost of a 20 mg dose is higher when using a 20 mg pack compared with two 10 mg packs. To address this, CADTH conducted a scenario analysis where LEN costs were based on two 10 mg packs, resulting in a reduction in incremental cost of more than $8,000 per patient, on average.
The comparative effectiveness estimate for LEN-PEM versus AXI-PEM is based on the results of an NMA that suggests a notable improvement in PFS for LEN-PEM, but no corresponding improvement in OS. This finding, while supported by the available statistical evidence, did not match the expectations or experience of the clinical experts consulted by CADTH, and produced results with questionable face validity. In the CADTH reanalysis, probabilistic estimates of incremental effectiveness estimated a 41% probability that LEN-PEM is inferior to AXI-PEM (i.e., LEN-PEM is associated with fewer QALYs). Consequently, while the higher costs of LEN-PEM are clear, the incremental effectiveness (and therefore cost-effectiveness) is uncertain.
Stakeholder Input Relevant to the Economic Review
This section is a summary of the feedback received from the patient groups, registered clinicians, and drug plans that participated in the CADTH review process (specifically, information that pertains to the economic submission).
Two patient groups, Kidney Cancer Canada and CanCertainty Coalition (CCC), provided patient input for this review. Patient input from the CanCertainty Coalition raised concerns related to the accessibility and affordability of funding for -orally administered oncology drugs, which are not funded across all jurisdictions. Patients from the CanCertainty Coalition expressed their desire for a change in policy or an increase in the funding available for treatment that would be beneficial to all renal cell carcinoma (RCC) patients, as these changes would not impose additional financial issues for the small number of RCC patients requiring drug coverage. Patients from the CCC expressed the need for better therapies that are less toxic and more tolerable, as patients can exhibit different responses to the same drug. Patients further highlighted the importance of having treatment alternatives within a given line of therapy. Patients reported that the commonly experienced side effects of existing treatments include diarrhea, nausea and vomiting, itching, fatigue and lack of energy, shortness of breath, and hand-foot syndrome, among other symptoms. Patients noted that important goals for treatment would include delaying disease progression, controlling drug resistance, and overcoming drug-resistance mechanisms. Patients expressed their desire toward achieving the best possible outcomes and quality of life through individualized treatment plans, and documentation of disease, treatment history, and contraindications. Only 1 patient reported having experience with LEN-PEM and indicated that the treatment was very tolerable, with manageable side effects and a decent quality of life; this patient felt this drug combination was highly effective in controlling their cancer.
One registered clinician and 1 clinician input group (the Kidney Cancer Research Network of Canada) affirmed that the combination of LEN-PEM in the first-line treatment setting would be available for all International Metastatic Renal Cell Carcinoma Database Consortium (IMDC) risk groups and that the relevant standard-of-care treatments would include AXI-PEM, SUN, and PAZO. The registered clinician input highlighted that the treatment goals for the indicated population include an improvement in OS and PFS with a reduction in the size (ORR) of metastatic lesions and an improved quality of life. Clinician input indicated that outpatient clinic settings are the most appropriate treatment settings for the administration of LEN-PEM. The clinician feedback also specified that patients who receive LEN-PEM will have treatment discontinuation criteria similar to PEM (i.e., a high-grade immune-related AE or a high-grade AE from LEN despite a dose reduction or schedule change). Regarding treatment sequencing, the registered clinicians indicated that subsequent line options after LEN-PEM may include cabozantinib and/or AXI (or other tyrosine kinase inhibitors that were not previously used in the first-line setting).
Feedback from the drug plans indicated that treatments currently available for first-line RCC are aligned with the sponsor’s submission. Drug plan feedback asked whether patients could continue to receive the other drug if 1 drug in the combination treatment was stopped for reasons other than disease progression.
Several of these concerns were addressed in the sponsor’s model:
The model considered OS and PFS.
Side effects were modelled, including diarrhea and fatigue, by incorporating costs and disutilities for AEs. Quality of life was captured through health state utility values.
Subsequent therapies were captured and included cabozantinib and AXI, along with SUN, PAZO, and NIVO.
Differential treatment discontinuation curves were permitted for LEN and PEM such that patients could continue on the other treatment if discontinuing 1 for reasons other than progression. Note, this was not possible for AXI-PEM or NIVO-IPI.
CADTH was unable to address the following concerns raised from stakeholder input:
ORR and drug resistance were not considered directly in the pharmacoeconomic model. However, PFS and OS were included, which are likely to be related to ORR and drug resistance.
Some AEs mentioned as important to patients were not captured in the model (nausea and vomiting, itching, shortness of breath, hand-foot syndrome).
Economic Review
The current review is for lenvatinib (Lenvima) in combination with pembrolizumab (Keytruda) for the treatment of adult patients with advanced or metastatic RCC with no prior systemic therapy for metastatic RCC.
Economic Evaluation
Summary of Sponsor’s Economic Evaluation
Overview
The sponsor submitted a cost-utility analysis of LEN-PEM compared with AXI-PEM, SUN, PAZO, and NIVO-IPI. The model population comprised adult patients with advanced or metastatic RCC with no prior systemic therapy for metastatic RCC. The sponsor conducted 2 analyses. One was in the overall population that considered all patients regardless of IMDC risk status and was aligned with the proposed Health Canada indication. The sponsor conducted a second analysis in adult patients who are intermediate or poor risk according to their IMDC risk score where LEN-PEM was compared with NIVO-IPI in addition to the comparators included in the overall population.
LEN is available as a 4 mg and 10 mg capsule. The recommended dose of LEN is 20 mg once daily, plus PEM 200 mg intravenously every 3 weeks. At the sponsor’s submitted price of $175.4127 per 20 mg dose, the cost per 21-day cycle of LEN is $3,684. At a price of $4,400 per 100 mg vial, the cost of PEM per 21-day cycle is $8,800. Together, the total 21-day cycle cost for LEN-PEM is $12,484 or $216,978 annually if people remain on treatment for a full year. The cost of AXI used in the model was $99.46 per 5 mg dose, leading to a 21-day cycle cost of $4,177 for AXI alone and $12,977 for AXI-PEM ($225,558 annually if people remain on treatment for a full year).
The clinical outcomes of interest were QALYs and LYs. The economic analysis was undertaken over a lifetime (30-year) time horizon from the perspective of a Canadian public health care payer. Discounting (1.5% per annum) was applied to both costs and outcomes.
Model Structure
The sponsor submitted a PSM with 3 health states: pre-progression, post-progression, and death (Figure 1). In both of the alive health states, patients could be on or off treatment. All patients entered the progression-free on-treatment state and remained there until disease progression or death. The proportion of people with progression-free and progressed disease for LEN-PEM and SUN was determined by fitting survival curves to PFS and OS data from the CLEAR trial. For all other comparators, the distribution of patients across health states was calculated by applying the hazard ratio (HR) from the sponsor-submitted NMA to the LEN-PEM PFS and OS curves.
The sponsor considered 2 separate populations: 1 overall population that considered all patients regardless of IMDC risk status, and 1 comprising patients categorized by IMDC criteria as intermediate or poor risk. These 2 analyses were run as separate base cases.
Model Inputs
The model’s baseline population characteristics and clinical efficacy parameters for LEN-PEM and SUN were characterized by the CLEAR study, an ongoing, randomized, open-label phase III study designed to evaluate the efficacy of LEN-PEM or LEN plus everolimus versus SUN as a first-line treatment in RCC. The sponsor assumed that the CLEAR population (baseline characteristics: mean age = 61.7 years, 75% male, mean body surface area = ||||||||| m2, mean weight = ||||||||| kg)4,5 reflected the Canadian population.
The PFS (Figure 2), OS (Figure 3), and TTD curves for LEN-PEM and SUN were generated by fitting survival distributions to patient-level data from the CLEAR trial. Curves were fit by first determining whether the proportional hazards assumption held between LEN-PEM and SUN, which determined whether the sponsor selected joint parametric fits or single stratified fits. If the proportional hazard assumption was deemed to hold, joint parametric fits were selected. Distributions were selected based on statistical fit, how well distributions matched the tail of the Kaplan–Meier (KM) curves and clinical plausibility, by comparing long-term PFS extrapolation predictions with the published literature for SUN.6,7 The sponsor chose an exponential function to extrapolate OS, and a log-normal function to extrapolate PFS. For comparators that were not included in the CLEAR trial (PAZO, AXI-PEM, NIVO-IPI), PFS and OS were generated by applying the HR derived from the sponsor’s submitted NMA to the LEN-PEM curve. To generate a TTD curve for non-CLEAR comparators, the sponsor fit an exponential curve to the median DoT of each comparator. Grade 3 or greater AEs were included if they occurred in at least 5% of patients for any comparator. AE rates for LEN-PEM and SUN were derived from the CLEAR trial; for all other comparators, AE rates were naively derived from their respective clinical study publications.4,6,8,9
Health state utility values were derived from the LEN-PEM arm of the CLEAR trial using the EuroQol 5-Dimensions 5-Levels questionnaire (EQ-5D-5L) results with a UK tariff applied, and applied to all patients independent of their treatment (0.79 for the pre-progression state, 0.70 for the post-progression state). Disutilities associated with AEs were applied by multiplying the disutility for the AE by the rate and duration of the AE. Disutility values were sourced from the NIVO-IPI submission to the National Institute for Health and Care Excellence (NICE).10 Median duration of the disutility was based primarily on the SUN arm of the CLEAR trial.4
Costs in the model included the costs of treatment acquisition, administration, subsequent therapies, health care resource use, AE management, and end-of-life costs. To calculate LEN costs, the sponsor took the distribution of days on each dose observed in the CLEAR trial (i.e., the percentage of patients receiving 8 mg, 10 mg, 14 mg, or 20 mg doses) and multiplied the distribution by the cost per milligram associated with each dose to derive a weighted-average cost per milligram for LEN. For other comparators, costs were based on the unit doses, derived from the Ontario Exceptional Access Program or previous CADTH reports.11,12 The sponsor applied an RDI for LEN-PEM and SUN based on the CLEAR trial and to PAZO based on a NICE technology review.13 For all other comparators, the RDI was 100%. First-line drug acquisition costs were applied based on the proportion of patients remaining on treatment in the pre-progression health state, determined by TTD curves. For PEM, patients only remained on treatment for a maximum of 2 years. Treatment administration costs were applied for oral and IV chemotherapies and were sourced from the Ontario Schedule of Physician Benefits.14
The proportion of patients who receive subsequent treatment upon progression (85%) was assumed to be the same regardless of initial treatment and was informed by the sponsor’s clinical experts. The distribution of patients across subsequent therapies based on their first-line treatment was informed by the CLEAR trial, the sponsor’s clinical experts, and a NICE technology review.4,15 The duration patients spend on treatment for LEN-PEM and SUN was determined by the CLEAR trial; for all other comparators, the duration of subsequent therapies was assumed to be equal to SUN.
Health care resource-use costs included medical oncology visits, blood tests, and CT scans, with visit frequencies depending on whether patients were pre-progression or post-progression. Unit costs for oncology visits and CT scans were based on the Ontario Schedule of Benefits for Physician Services, and blood test costs were based on the Ontario Schedule of Benefits for Laboratory Services.14,16 A 1-off mortality cost based on an Ontario end-of-life resource-use study was applied.17 The level of care associated with AE management was informed by the sponsor’s clinical experts. Management of outpatient AEs was assumed to be equal to the cost of a physician visit.14 Unit costs for inpatient events were sourced from the Canadian Institute for Health Information (CIHI) Patient Cost Estimator.18
Summary of Sponsor’s Economic Evaluation Results
All analyses were run probabilistically (1,000 iterations for the base-case and scenario analyses); the deterministic and probabilistic results were similar. The model initially submitted by the sponsor was seeded. Upon request, the sponsor submitted an unseeded model with probabilistic results that differed from the initially submitted seeded model. The probabilistic findings from the unseeded model are presented subsequently.
Base-Case Results
In the overall population (base case 1), LEN-PEM was associated with a QALY gain of 1.04 at an additional cost of $183,119, resulting in an ICER of $154,050 compared with PAZO. SUN and AXI-PEM were dominated by PAZO and LEN-PEM, respectively (i.e., more expensive and less effective). In the disaggregated results, the total QALYs for LEN-PEM were relatively evenly split between health states (52% for progression-free and 48% for progressed disease). However, for the remainder of the comparators, the majority of the total QALYs were accrued in the progressed-disease state (69% for SUN and PAZO and 71% for AXI-PEM). Drug acquisition costs accounted for the majority of the total costs for all comparators but were highest among LEN-PEM (81% of total) versus other comparators (73% for AXI-PEM, 50% for SUN, 46% for PAZO). One-off mortality costs were the second-largest source of total costs for all comparators apart from AXI-PEM, where subsequent therapy costs were the second-largest cost category. At the end of the 30-year time horizon, 2% of the patients who had received LEN-PEM remained alive. In the sponsor’s base case, 38% of predicted QALYs (1.95) were generated through extrapolation beyond the period of the available CLEAR trial data (38 months).
In the population categorized as intermediate or poor risk (base case 2), LEN-PEM was associated with a QALY gain of 0.33 at an additional cost of $116,398, resulting in an ICER of $355,397 compared with NIVO-IPI. NIVO-IPI was associated with a QALY gain of 1.19 at an additional cost of $74,394, resulting in an ICER of $62,494 compared with PAZO. SUN and AXI-PEM were dominated by PAZO and LEN-PEM, respectively (i.e., more expensive and less effective). The majority of the QALY gain for LEN-PEM was accrued in the progression-free health state (56%); however, for all other comparators, the majority of the total QALYs were accrued in the progressed state (63% for SUN and PAZO; 74% for NIVO-IPI; and 72% for AXI-PEM).
Drug acquisition costs accounted for the majority of the total costs for all comparators but were highest among LEN-PEM (80% of total) versus other comparators (73% for AXI-PEM, 44% for SUN, 41% for PAZO, 74% for NIVO-IPI). At the end of the 30-year time horizon, less than 1% of LEN-PEM patients remained alive.
Table 3: Summary of the Sponsor’s Economic Evaluation Results for the Overall Population (Base Case 1)
Drug | Total costs ($) | Total LYs | Total QALYs | Sequential ICER ($/QALY) |
|---|---|---|---|---|
Pazopanib | 146,340 | 5.37 | 3.91 | Reference |
Lenvatinib plus pembrolizumab | 328,663 | 6.80 | 5.09 | 154,050 |
Dominated or extended dominated treatments | ||||
Sunitinib | 147,249 | 5.37 | 3.90 | Dominated |
Axitinib plus pembrolizumab | 329,459 | 6.74 | 4.95 | Dominated |
ICER = incremental cost-effectiveness ratio; LY = life-year; QALY = quality-adjusted life-year.
Note: Only treatments that are on the efficiency frontier are reported in the main body. Full results can be found in Appendix 3.
Source: Sponsor’s pharmacoeconomic submission.19
Table 4: Summary of the Sponsor’s Economic Evaluation Results for the Intermediate and Poor Risk Population (Base Case 2)
Drug | Total costs ($) | Total LYs | Total QALYs | Sequential ICER ($/QALY) |
|---|---|---|---|---|
Pazopanib | 124,544 | 3.91 | 2.75 | Reference |
Nivolumab plus ipilimumab | 198,938 | 5.69 | 3.94 | 62,494 vs. pazopanib |
Lenvatinib plus pembrolizumab | 315,336 | 5.85 | 4.27 | 355,397 vs. nivolumab plus ipilimumab |
Dominated or extended dominated treatments | ||||
Sunitinib | 124,988 | 3.91 | 2.74 | Dominated |
Axitinib plus pembrolizumab | 330,994 | 5.71 | 4.02 | Dominated |
ICER = incremental cost-effectiveness ratio; LY = life-year; QALY = quality-adjusted life-year.
Note: Only treatments that are on the efficiency frontier are reported in the main body. Full results can be found in Appendix 3.
Source: Sponsor’s pharmacoeconomic submission.19
Sensitivity and Scenario Analysis Results
The sponsor assessed several model parameters in probabilistic scenario analyses. When a shorter (15-year) time horizon was selected, the ICER increased to $209,940 in the overall population (versus PAZO). Results were also sensitive to discounting, resulting in an ICER of $133,211 and $174,873 when a 0% and 3% discount rate was used, respectively (compared with PAZO). Finally, using a joint-fit Weibull distribution to extrapolate OS resulted in an increase in the ICER to $185,400 compared with PAZO.
CADTH Appraisal of the Sponsor’s Economic Evaluation
CADTH identified several key limitations to the sponsor’s analysis that have notable implications on the economic analysis:
The sponsor’s modelling approach led to pre-progression survival benefits that are not clinically expected. When comparing LEN-PEM with AXI-PEM (the most relevant comparator for RCC, according to the clinical experts consulted for this review), results from the NMA indicate that these treatment regimens have similar OS (HR = 0.99; 95% credible interval [CrI], 0.71 to 1.37), but PFS is nearly 2 times better with LEN-PEM compared with AXI-PEM (HR = 0.57; 95% CrI, 0.31 to 1.08).
In a PSM, post-progression survival is estimated as the difference between OS and PFS. Given that OS was found to be similar between LEN-PEM and AXI-PEM in the sponsor’s NMA, overall LYs between these comparators are similar (6.83 and 6.82 for LEN-PEM and AXI-PEM, respectively). However, since the PFS HR indicates a PFS benefit for LEN-PEM compared with AXI-PEM, this means that AXI-PEM patients spend longer in the progressed-disease health state but, overall, live for a similar amount of time. This is reflected in the significant post-progression survival benefit observed for AXI-PEM. Whereas patients who receive LEN-PEM accrue 3.50 LYs in the progressed-disease health state, patients who receive AXI-PEM accrue 1.5 times more LYs in the progressed-disease state. It is clinically unexpected that patients who receive AXI-PEM will live for longer upon progression, given that they receive the same subsequent therapies as patients who receive LEN-PEM. Additionally, when asked about the comparative clinical efficacy between LEN-PEM and AXI-PEM, the clinical experts consulted for this review noted they would not expect a difference in PFS or OS between these treatments. More specifically, they noted that they would not expect to see a significant PFS benefit for LEN-PEM, nor would they expect a significant post-progression survival benefit for AXI-PEM. The use of a PSM in this case produces an unexpected pattern of differential post-progression survival that does not match clinical expectations (and was not observed directly in the trial). However, the apparent differences in pre- and post-progression survival between LEN-PEM and AXI-PEM in the model are driven by the results of the NMA, which shows a benefit with LEN-PEM on PFS but similar effects on OS. Also, as utility scores are expected to be lower among patients with progressed disease compared with those whose disease is progression-free, this leads to there being 0.19 incremental QALYs for LEN-PEM compared with only 0.06 incremental LYs -for AXI-PEM.
The CADTH critical appraisal of the sponsor’s NMA found that LEN-PEM was suggested to have a PFS benefit over AXI-PEM, but the results were limited by a wide CrI that includes 1.0. Overall, the CADTH Clinical Review Report found that despite there being some sources of uncertainty with the NMA, it was generally well conducted.
Given the CADTH Clinical Review’s conclusions regarding the quality of the NMA, no change was made in the CADTH base case to adjust for the unexpected pre- and post-progression survival benefits. CADTH assumed equal efficacy between LEN-PEM and AXI-PEM in terms of PFS and OS as a scenario analysis.
Parameters informing efficacy for the intermediate and poor risk population are uncertain. To evaluate the cost-effectiveness of LEN-PEM compared with NIVO-IPI, the sponsor conducted a second base case in the combined intermediate and poor risk population, as this is the population the NIVO-IPI is indicated for.8 To model PFS and OS, the sponsor took an approach similar to the 1 it took for the overall population, that is, fitting parametric extrapolations for CLEAR trial PFS and OS KM curves for LEN-PEM and SUN, and using NMA-derived HRs to obtain PFS and OS estimates for non-CLEAR comparators (AXI-PEM, NIVO-IPI, and PAZO in the intermediate and poor risk population).
As KMs for PFS and OS in the intermediate and poor risk populations were not reported in the CLEAR trial clinical study report, CADTH was unable to validate the sponsor’s approach to modelling PFS and OS in this subgroup. The clinical study report presented forest plots of HRs by IMDC risk group (i.e., results for poor, results for intermediate) but did not present combined results for the intermediate and poor risk group as a whole, which was the subgroup of interest in the base case 2 population. According to the CADTH Clinical Review Report, subgroup analyses by IMDC risk were exploratory only and the magnitude of efficacy for subgroups was considered uncertain; therefore, cost-effectiveness estimates resulting from these subgroup analyses would also be considered uncertain.
Several limitations were also noted in terms of the derivation of efficacy estimates for the non-CLEAR comparators. The efficacy estimates for AXI-PEM informing the intermediate and poor risk subgroup HRs in the NMA were derived from a conference abstract that was not published in full. With regard to the NMA, the CADTH Clinical Review Report concluded that the subgroup analysis results are uncertain and limited by small sample sizes and that, overall, the interpretation of the results for the subgroup analyses of the NMA is limited. According to the clinical experts consulted by CADTH for this review, similar to the overall population, the experts did not expect there to be a substantial difference in PFS or OS within the intermediate and poor risk population for LEN-PEM compared with NIVO-IPI and AXI-PEM; however, this was not reflected by the HRs from the NMA. Finally, the HRs resulting from the sponsor’s NMA led to comparator PFS being underestimated in relation to the published literature for these comparators. Using the sponsor’s PFS extrapolations for LEN-PEM and the PFS HR derived from their NMA, median PFS for NIVO-IPI was 9.90 months; whereas, in the NIVO-IPI trial, median PFS in the intermediate and poor risk subgroup was 11.2 months.8 The 4-year PFS for NIVO-IPI was 33% in the literature compared with 5% in the sponsor’s model.8 This highlights that the outputs from the NMA are uncertain and may be leading to lower-than-expected PFS for NIVO-IPI.
As the parameters informing the efficacy for the intermediate and poor risk population are associated with clinical uncertainty, CADTH conducted a scenario analysis in the intermediate and poor risk population using the same stepped changes employed to derive the CADTH base case. CADTH also conducted a second scenario analysis that assumed NIVO-IPI and AXI-PEM were equal to LEN-PEM in terms of OS and PFS.
Long-term extrapolation of PFS is uncertain. While the CLEAR trial remains ongoing, PFS data are relatively mature, with approximately 66% of the patients in the overall population treated with LEN-PEM experiencing disease progression at the August 2020, data cut-off.4,19 KM data were available for LEN-PEM up to approximately 38 months. To extrapolate PFS for the remaining model time horizon, the sponsor fit parametric survival curves to the KM curves. The sponsor selected a log-normal joint parametric curve to model PFS for LEN-PEM and SUN on the basis of having the best statistical fit and the best visual fit to the tail of the KM curve for LEN-PEM. Statistical fit is a marker of how well the selected parametric model interpolates the data, which indicates a curve’s ability to fit the known data. Statistical fit has little weight in determining long-term outcomes. CADTH observed that all of the parametric survival curves fit the known data relatively well. For example, at around 100 weeks, where median PFS for LEN-PEM was met, all curves ranged from predicting from 48.15% to 50.92% PFS at that time, with the sponsor’s selected log-normal curve predicting the lowest survival probability.
As the survival curves are used to extrapolate known trial data for the remaining time horizon, CADTH evaluated the curve’s long-term PFS predictions. When using the sponsor’s log-normal function, at the end of the model’s 30-year time horizon, there were still some patients treated with LEN-PEM whose disease remained progression-free, which is not clinically expected or proven with existing evidence. According to the clinical experts consulted by CADTH for this review, predicting survival outcomes 20 to 30 years after initiating treatment is pure speculation, meaning that CADTH was unable to garner clinical input regarding what PFS might look like. The sponsor’s selected log-normal distribution predicted the most optimistic long-term survival, with 8%, 2%, and 1% of patients treated with LEN-PEM remaining progression-free at 10, 20, and 30 years.
According to both the sponsor and the clinical experts consulted for this review, there is no long-term evidence for PFS for LEN-PEM. In the absence of such evidence, in the CADTH base case, a more conservative PFS survival function was selected.
Sponsor’s selected parametric functions for TTD did not meet face validity. In the sponsor’s base case, treatment discontinuation curves were used to model the time spent on treatment for all comparators. For LEN-PEM and SUN, parametric single-fit survival curves were fit to CLEAR trial TTD data, using separate KMs for LEN, PEM, and SUN. The sponsor fit generalized gamma and Weibull curves to LEN and PEM KM data, respectively, and used a generalized gamma curve for SUN. A 2-year stopping rule was incorporated for treatments that used PEM on the basis of the CLEAR trial protocol that had patients continuing to receive study treatment until completion of 35 treatments (approximately 2 years) of PEM. The stopping rule was incorporated despite the sponsor’s TTD KM data for PEM demonstrating that |||||||||% of patients treated with LEN-PEM remained on PEM after 2 years, and that |||||||||% remained on PEM until up to ||||||||| weeks when the KM for PEM stops.
For example, at ||||||| weeks, |||||||% of patients were still taking LEN but only |||||||% of patients remained on PEM.4 Further, while PEM KM data are available only to ||||||| weeks (|||||||% remaining on treatment), LEN data are available for another ||||||| weeks until ||||||| weeks (|||||||% of patients remaining on LEN). This indicates that the sponsor’s survival extrapolations are not reflective of the available clinical data.
Finally, the clinical experts consulted by CADTH for this review indicated that TTD was not an important outcome, as it could be assumed that patients only discontinue treatment upon progression. Therefore, when taking a TTD approach to modelling treatment discontinuation, all curves should closely match PFS predictions without going over; it is not clinically expected that patients will discontinue LEN-PEM treatment and remain progression-free for an extended period of time.
To have survival extrapolations for LEN-PEM reflect the evidence from the CLEAR trial that patients discontinue PEM sooner than LEN, CADTH chose to model TTD based on the available KM data followed by parametric single fits. CADTH then selected parametric single fits for LEN such that TTD was close to the PFS extrapolation used in the CADTH base case without being greater (as it was assumed that no patients would continue receiving treatment upon progression).
The proportion of patients receiving subsequent therapies is not aligned with Canadian clinical practice. In the sponsor’s model, 85% of patients go on to receive subsequent therapy upon progression, regardless of their initial treatment. This estimate was informed by the sponsor’s clinical experts. According to the clinical experts consulted by CADTH for this review, in Canadian clinical practice, only approximately 50% of patients receive subsequent therapies upon progression. They note this because many patients have extensive RCC and, when they progress, some patients will get ill very quickly and may be too unwell to receive a subsequent therapy. Additionally, given the older age of the RCC population, the experts noted that some patients would not be interested in having subsequent therapy, as they may have other comorbid conditions influencing their overall health aside from their RCC. The experts also noted 2 retrospective cohort studies that indicated that a lower proportion of patients receive second-line therapies than estimated by the sponsor.5,20
In the CADTH base case, 50% of patients are assumed to receive subsequent therapy upon progression, to align with clinical expert feedback regarding Canadian clinical practice.
The DoT for subsequent therapies is uncertain. In the sponsor’s base case, the DoT with each subsequent therapy was dependent on the treatment patients received in the first line. The DoT for LEN-PEM and SUN was sourced from the CLEAR trial.21 For all non-CLEAR comparators (i.e., PAZO, AXI-PEM, and NIVO-IPI) the DoT was sourced from a NICE review of AXI-PEM.15 Compared with LEN-PEM, the second-line DoT was longer for all therapies among patients who received SUN as a first-line therapy, except cabozantinib, where second-line treatment duration was similar.4,19 For all non-CLEAR comparators, the DoT with second-line therapies was much longer than the DoT with LEN-PEM. For example, people who received PAZO in the second line took it for |||||||||||| weeks if they received LEN-PEM in the first line but, if they received a non-CLEAR comparator, they received PAZO for 46.49 weeks, meaning that the expected DoT with PAZO was 28 weeks longer for those who did not receive LEN-PEM in the first line.
According to the clinical experts consulted for this review, there is no clinical reason why one’s first line of therapy would influence the DoT required upon progression to second-line therapy. Having a subsequent treatment duration that is shorter for LEN-PEM compared with all other comparators favours LEN-PEM, as fewer costs are accrued upon progression.
In the absence of direct or indirect evidence evaluating the DoT with subsequent therapies by first-line therapy for RCC, CADTH assumed that all patients will have the same DoT with their subsequent therapies.
The sponsor’s approach to incorporating LEN drug costs could not be validated. To estimate the cost of LEN treatment in the model, the sponsor considered 4 LEN dose availabilities (4 mg, 10 mg, 14 mg, and 20 mg). The sponsor then calculated the distribution of days on each dose observed during the CLEAR study.4,19 The cost per milligram associated with each dose pack was weighted by the distribution to create a weighted-average cost per milligram, which was used to calculate LEN treatment costs in the model.
Despite the dose in the model for LEN being 20 mg, CADTH considered that the sponsor used the distribution of doses as a means of capturing dose interruptions and down-dosing in the model. However, CADTH could not validate the dose distribution used by the sponsor in the model; therefore, whether this approach is capturing different doses due to dose changes is unknown.
Second, the sponsor used nonlinear LEN pricing, i.e., the price per milligram differs depending on the dose pack taken. For example, a 20 mg dose pack costs $175.41; however, a 10 mg dose costs $75.28, meaning that two 10 mg doses will cost less than a 20 mg LEN dose. This is despite the fact that a 20 mg dose consists of two 10 mg capsules. Why the sponsor incorporated nonlinear dosing is unclear.
As CADTH could not validate the approach to the dose distribution method of estimating the cost of LEN, as a scenario analysis, CADTH assumed the cost of the 20 mg dose would be that of two 10 mg doses ($150.56).
The following limitations were identified but were not deemed key limitations:
Incorporation of an RDI is inappropriate. The sponsor incorporated an RDI of |||||% and |||||% for LEN and PEM, respectively, and an RDI of ||||||% for SUN, based on the CLEAR trial.4 An RDI of 86% was used for PAZO based on a NICE technology assessment. The RDI for AXI-PEM was assumed to be 100% for both treatments.
For other comparators, the clinical experts generally indicated agreement with the RDIs used, except for the assumption of an RDI of 100% for AXI and LEN. According to the clinical experts consulted by CADTH, there is no clinical reason why the RDI for PEM would differ whether it was administered alongside LEN or AXI. The sponsor’s assumption that RDI is lower for those receiving LEN-PEM decreases LEN-PEM costs in a way that is not reflected for those receiving AXI-PEM. Further, the experts felt that the RDI for AXI would be more aligned with other comparators, at approximately 80%. Finally, experts felt uncertain regarding the RDI of ||||||% used for LEN. While the clinical experts consulted by CADTH noted it is unlikely for any of the comparators to be administered at a full dose, this approach of multiplying the RDI by the drug costs is problematic, as RDI can be influenced by many different factors. For instance, the dose received by a patient may differ from the full planned dose of the drug due to dose delays, missed doses, dose reductions to manage toxicity, or subsequent dose re-escalation. Each of these reasons has a differing impact on drug costs. Without explicitly modelling dose delays and reductions for the patient population, this method of multiplying RDI by drug acquisition costs contributes to uncertainty in the true drug costs incurred by payers.
CADTH revised the RDI for all comparators to be 100%.
Cost of managing some AEs was overestimated. When costing AEs, the sponsor considered whether an AE was likely to be treated in the inpatient or outpatient setting. For an AE treated in the outpatient setting, the cost of managing the event was assumed to be equal to a single visit to a general practitioner.14 Events requiring inpatient treatment (hypertension and anemia) were estimated using the CIHI Patient Cost Estimator.18 To estimate anemia treatment costs, an aplastic anemia diagnosis with an average inpatient length of stay of 6.4 days was used.18 For hypertension, CIHI hypertensive disease costs were used with an average inpatient length of stay of 10 days.18 According to the clinical experts consulted for this review, these diagnostic codes overestimate the resources that may be required to treat these AEs. For anemia, experts noted that patients would rarely be admitted for this; rather, their anemia would be treated with an outpatient blood transfusion. For hypertension, experts noted that this AE would likely be treated on an outpatient basis.
In the CADTH reanalysis, the costs for treating anemia and hypertension were assumed to be equal to the cost of treating all other AEs in the model.
Estimates of health care resource use are uncertain. To estimate the health care resource use associated with managing RCC, the sponsor incorporated oncology follow-up visits, blood tests, and CT scans, with different visit frequencies for patients in the progression-free versus progressed-disease health state. According to the clinical experts consulted for this review, visit frequency will be similar among patients who are pre- or post-progression if they remain on treatment. Therefore, assumptions for CT scan frequency (once annually) for patients with progressed disease will be lower than expected if patients are receiving subsequent therapies.
As health care resource use was determined by health state, which was not stratified by whether patients were on or off treatment, CADTH was unable to incorporate health care resource use by treatment status. As monitoring costs may be underestimated in the progressed-disease state and because patients receiving LEN-PEM spend less time in the progressed-disease health state, increasing progressed-disease costs would likely favour LEN-PEM; therefore, the sponsor’s approach is conservative.
Additionally, the following key assumptions were made by the sponsor and have been appraised by CADTH (Table 5).
Table 5: Key Assumptions of the Submitted Economic Evaluation (Not Noted as Limitations to the Submission)
Sponsor’s key assumption | CADTH comment |
|---|---|
Rates of AEs for pazopanib, axitinib plus pembrolizumab, and nivolumab plus ipilimumab were derived from their respective clinical trials. | Inappropriate. Naively deriving AE rates from clinical trials does not account for differences in baseline characteristics between trial groups. Despite this, this assumption is unlikely to significantly influence cost-effectiveness results. |
The cost of treating an AE requiring outpatient treatment was assumed to be equal to the cost of a GP visit. | Inappropriate. The cost of treating an AE in the outpatient setting may involve additional care that would not be captured by a GP visit charge, such as additional bloodwork or prescription medications. However, as AE costs as a proportion of overall costs were low, this assumption is unlikely to significantly influence cost-effectiveness results. |
Costs of hospitalizations were not included in the model. | Inappropriate. According to the clinical experts consulted for this review, hospitalization costs can be significant in this patient population, as they may experience auto-immune side effects. Excluding hospitalization costs may have underestimated costs with treatment. However, as there is no direct or indirect evidence comparing hospitalization rates and durations between patients receiving different first-line treatments, the direction and magnitude of the effect of excluding hospitalization costs on the overall cost-effectiveness results is unknown. |
AE = adverse event; GP = general practitioner.
CADTH Reanalyses of the Economic Evaluation
Base-Case Results
The CADTH reanalyses addressed several limitations within the economic model, summarized in Table 6. The CADTH base case was derived by making changes in model parameter values and assumptions, in consultation with clinical experts. CADTH was unable to address limitations regarding the sponsor’s PSM modelling approach leading to unexpected pre-progression and post-progression survival benefits for LEN-PEM and AXI-PEM, respectively, and the limitations regarding the sponsor’s approach to estimating lenvatinib costs.
Table 6: CADTH Revisions to the Submitted Economic Evaluation
Stepped analysis | Sponsor’s value or assumption | CADTH value or assumption |
|---|---|---|
1. PFS extrapolation | Log-normal | Weibull |
2. Time to treatment discontinuation approach |
|
|
3. DoT for subsequent therapies | Different DoT for LEN-PEM and SUN | DoT for LEN-PEM and SUN equal to non-CLEAR comparators |
4. Percentage of patients who receive subsequent treatments | 85% | 50% |
5. RDI | Different | All 100% |
6. Cost of treating anemia and hypertension AE |
| Same as other AEs ($84) |
CADTH base case | — | 1 + 2 + 3 + 4 + 5 + 6 |
Changes to derive the CADTH base case | ||
None | — | — |
Corrections to sponsor’s base case | ||
None | — | — |
AE = adverse event; DoT = duration of treatment; LEN = lenvatinib; PEM = pembrolizumab; PFS = progression-free survival; RDI = relative dose intensity; SUN = sunitinib.
The results of CADTH’s stepped analysis are presented in Table 7. CADTH’s base-case reanalysis demonstrates that, compared with AXI-PEM, LEN-PEM is $78,851 more expensive and yields 0.12 greater QALYs, resulting in an ICER of $667,600 compared with AXI-PEM (Table 7). The OS for patients treated with LEN-PEM was similar to that for patients treated with AXI-PEM (0.05 LY or 18 days). Compared with the reference product, PAZO, LEN-PEM was $240,661 more expensive and yielded 1.48 more LYs and 1.15 more QALYs (Table 7).
Using a Weibull curve to extrapolate LEN-PEM led to 0.08 fewer QALYs for LEN-PEM; no other reanalysis step changed the estimated QALYs for LEN-PEM or comparators. The largest increase to total costs for LEN-PEM resulted from assuming an RDI of 100% for all treatments. Assuming a lower proportion of patients require subsequent therapies and changing AE management costs for anemia and hypertension decreased the total costs for all comparators, including LEN-PEM. All of the 0.12 incremental QALYs for LEN-PEM compared with AXI-PEM occurred in the progression-free health state. In the progression-free health state, 1.95 QALYs were accrued for LEN-PEM compared with 1.23 for AXI-PEM (Table 11). In the progressed-disease state, LEN-PEM accrued 3.07 QALYs compared with 3.68 for PEM-AXI (Table 11). First-line drug costs accounted for 83% of total costs for LEN-PEM (Table 11). At a $50,000 per QALY threshold, there is a 0% chance that LEN-PEM is cost-effective. In the CADTH base case, 39% of predicted QALYs (1.96) were generated through extrapolation beyond the period of the available CLEAR trial data (38 months).
CADTH found notable uncertainty in the probabilistic analysis comparing LEN-PEM with PEM-AXI (Figure 4). Within the CADTH reanalysis, 40.6% of probabilistic runs produced estimates of incremental QALYs that were less than 0 (i.e., PEM-LEN was inferior to PEM-AXI).
Table 7: Summary of the Stepped Analysis of the CADTH Reanalysis Results
Stepped analysis | Drug | Total costs ($) | Total LYs | Total QALYs | ICER ($/QALYs) |
|---|---|---|---|---|---|
Sponsor’s base case (deterministic) | PAZO | 145,686 | 5.35 | 3.90 | Reference |
SUN | 146,297 | 5.35 | 3.89 | Dominated | |
LEN-PEM | 327,505 | 6.76 | 5.08 | 154,108 | |
AXI-PEM | 332,821 | 6.82 | 4.89 | Dominated | |
CADTH reanalysis 1: PFS (Weibull) | PAZO | 148,108 | 5.35 | 3.86 | Reference |
SUN | 148,646 | 5.35 | 3.85 | Dominated | |
LEN-PEM | 331,401 | 6.76 | 5.00 | 160,683 | |
AXI-PEM | 334,274 | 6.82 | 4.87 | Dominated | |
CADTH reanalysis 2: TTD (KM followed by parametric single fit; extrapolated using exponential curve) | PAZO | 145,686 | 5.35 | 3.90 | Reference |
SUN | 146,297 | 5.35 | 3.89 | Dominated | |
LEN-PEM | 332,821 | 6.76 | 5.08 | 163,588 | |
AXI-PEM | 338,689 | 6.82 | 4.89 | Extendedly dominated | |
CADTH reanalysis 3: DoT for subsequent therapies | PAZO | 145,686 | 5.35 | 3.90 | Reference |
SUN | 146,081 | 5.35 | 3.89 | Dominated | |
AXI-PEM | 332,821 | 6.76 | 4.89 | Extendedly dominated | |
LEN-PEM | 342,321 | 6.82 | 5.08 | 166,666 | |
CADTH reanalysis 4: Percentage of patients who receive subsequent treatments | PAZO | 135,050 | 5.35 | 3.90 | Reference |
SUN | 135,932 | 5.35 | 3.89 | Dominated | |
AXI-PEM | 311,891 | 6.76 | 4.89 | Extendedly dominated | |
LEN-PEM | 319,227 | 6.82 | 5.08 | 156,108 | |
CADTH reanalysis 5: RDI | PAZO | 156,590 | 5.35 | 3.90 | Reference |
SUN | 165,539 | 5.35 | 3.89 | Dominated | |
AXI-PEM | 332,821 | 6.76 | 4.89 | 177,920 | |
LEN-PEM | 372,028 | 6.82 | 5.08 | 207,119 | |
CADTH reanalysis 6: AE costs | PAZO | 144,117 | 5.35 | 3.90 | Reference |
SUN | 144,472 | 5.35 | 3.89 | Dominated | |
LEN-PEM | 324,247 | 6.76 | 5.08 | 152,677 | |
AXI-PEM | 329,525 | 6.82 | 4.89 | Dominated | |
CADTH base case: 1 + 2 + 3 + 4 + 5 + 6 (deterministic) | PAZO | 145,663 | 5.35 | 3.86 | Reference |
SUN | 154,425 | 5.35 | 3.85 | Dominated | |
AXI-PEM | 309,816 | 6.76 | 4.87 | 161,793 | |
LEN-PEM | 387,079 | 6.82 | 5.00 | 612,614 | |
CADTH base case: 1 + 2 + 3 + 4 + 5 + 6 (probabilistic) | PAZO | 146,656 | 5.38 | 3.88 | Reference |
SUN | 155,701 | 5.38 | 3.87 | Dominated | |
AXI-PEM | 308,467 | 6.81 | 4.91 | 156,563 | |
LEN-PEM | 387,317 | 6.86 | 5.03 | 667,600 |
AE = adverse event; AXI = axitinib; DoT = duration of treatment; ICER = incremental cost-effectiveness ratio; KM = Kaplan–Meier; LEN = lenvatinib; LY = life-year; PAZO = pazopanib; PEM = pembrolizumab; PFS = progression-free survival; QALY = quality-adjusted life-year; RDI = relative dose intensity; SUN = sunitinib; TTD = time to treatment discontinuation.
Scenario Analysis Results
CADTH undertook price reduction analyses in the CADTH base case (Table 8). These analyses demonstrated that a price reduction of greater than 100% would be required for LEN-PEM to be considered cost-effective at a willingness-to-pay threshold of $50,000 per QALY compared with PAZO. This is because LEN-PEM is a combination treatment and total PEM costs alone are greater than total PAZO costs. Therefore, even if LEN had no cost, giving LEN in combination with PEM is not cost-effective compared with PAZO in either the sponsor’s base case or the CADTH base case. In the CADTH base case, in order for LEN-PEM to be cost-effective compared with AXI-PEM at a threshold of $50,000 per QALY, a price reduction of at least 56% is required. If a LEN price reduction of 100% were achieved, an additional 29% reduction in the price of PEM would be needed for PEM-LEN to reach that threshold compared with PAZO.
Table 8: CADTH Price Reduction Analyses
Analysis | ICERs for LEN-PEM vs. comparators ($/QALY) | |
|---|---|---|
Price reduction (LEN) | Sponsor base case | CADTH reanalysis |
No price reduction | 154,050 vs. PAZO | 208,975 vs. PAZO 667,600 vs. AXI-PEM |
10% | 146,470 vs. PAZO | 197,752 vs. PAZO 558,172 vs. AXI-PEM |
20% | 138,890 vs. PAZO | 186,529 vs. PAZO 448,744 vs. AXI-PEM |
30% | 131,310 vs. PAZO | 175,306 vs. PAZO 339,316vs. AXI-PEM |
40% | 123,731 vs. PAZO | 164,083 vs. PAZO 229,888 vs. AXI-PEM |
50% | 116,151 vs. PAZO | 152,860 vs. PAZO 120,459 vs. AXI-PEM |
56% | 113,266 vs. PAZO | 148,088 vs. PAZO 50,000 vs. AXI-PEM |
60% | 108,571 vs. PAZO | 141,637 vs. PAZO 11,034 vs. AXI-PEM |
70% | 100,992 vs. PAZO | 130,414 vs. PAZO AXI-PEM dominated by LEN-PEM |
80% | 93,412 vs. PAZO | 119,192 vs. PAZO |
90% | 85,832 vs. PAZO | 107,969 vs. PAZO |
100% | 78,252 vs. PAZO | 96,746 vs. PAZO |
AXI = axitinib; ICER = incremental cost-effectiveness ratio; LEN = lenvatinib; PAZO = pazopanib; PEM = pembrolizumab; QALY = quality-adjusted life-year.
To address the remaining uncertainty regarding the parameterization of the model, CADTH conducted several scenario analyses. Full results are presented in Table 12. When LEN-PEM was assumed to be as equally efficacious in terms of PFS as AXI-PEM (PFS HR = 1), LEN-PEM resulted in lower total costs than AXI-PEM, meaning AXI-PEM was dominated by LEN-PEM. When PFS and OS were assumed to be equal (HR for PFS and OS = 1), LEN-PEM and AXI-PEM were equally efficacious in terms of total QALYs but LEN-PEM was $34,337 less costly, leading to AXI-PEM being dominated by LEN-PEM (i.e., higher cost and equally as effective). When the cost of a 20 mg dose was lowered to be equal to the cost of two 10 mg doses, total costs for LEN-PEM were $8,525 lower, and the ICER for LEN-PEM compared with AXI-PEM was $550,106.
When the CADTH base-case changes were applied to the intermediate and poor risk population, NIVO-IPI was associated with an ICER of $47,792 compared with PAZO, and LEN-PEM had an ICER of $615,872 compared with NIVO-IPI (Table 18). A price reduction of more than 100% would be required for LEN-PEM to be cost-effective compared with NIVO-IPI in the intermediate and poor risk population. In a scenario where OS and PFS for NIVO-IPI and AXI-PEM are assumed to be equal to LEN-PEM, AXI-PEM had an ICER of $36,692,452 compared with NIVO-IPI, and LEN-PEM was dominated by AXI-PEM.
Issues for Consideration
LEN is currently listed on the Ontario Exceptional Access Program at the same cost as the sponsor’s submitted price for the 8 mg, 10 mg, 14 mg, and 20 mg doses.11 CADTH observed that only 2 capsule strengths are available in Canada for LEN: 4 mg and 10 mg.22 It is unclear why the sponsor has provided prices for dose packs rather than by capsule size. It is also unclear why pricing is nonlinear for the dose packs available. For example, the price of a 20 mg dose pack is $175.4127; however, the cost of a 10 mg dose ($75.2783) is less than half that of the 20 mg dose. This leads to different costs per milligram depending on the dose pack used, introducing some uncertainty in the overall costs of LEN to public drug plans.
LEN has been previously reviewed by CADTH for RCC (in combination with everolimus), differentiated thyroid cancer, and hepatocellular carcinoma. In the latter 2 submissions, it was considered alone and not in combination with another product. The submitted price for LEN was $8.14 per milligram in the previous RCC submission and hepatocellular carcinoma submission.1,3 In the differentiated thyroid cancer review, the submitted price for LEN was $164.64, $110.42, $71.64, and $77.56 per 20 mg, 14 mg, 10 mg, and 8 mg dose, respectively.23 Both of these previous submissions for LEN used different costs than in the current submission (see Table 9). For the previous RCC submission where LEN was used in combination with everolimus, LEN received a “do not reimburse” recommendation on the basis of a lack of a net clinical benefit compared with everolimus monotherapy.1 For the differentiated thyroid cancer and hepatocellular carcinoma reviews, LEN received a “reimburse with clinical criteria and/or conditions” recommendation. For differentiated thyroid cancer, the recommendation specified that LEN was not cost-effective compared with best supportive care.2 In the hepatocellular carcinoma review, the economic component of the submission specified that the public drug plan cost of LEN should not exceed the cost of comparator treatment (sorafenib).3
Overall Conclusions
The CADTH Clinical Review found that the median PFS was 23.9 months in patients receiving LEN-PEM compared with 9.2 months for patients receiving SUN. The ORR estimated in the LEN-PEM arm was also considered statistically significant. Median OS was not reached. The Clinical Review noted that the open-label design was a key limitation of the CLEAR trial. The CADTH Clinical Review found that the sponsor’s NMA, which informed the efficacy for AXI-PEM, PAZO, and NIVO-IPI, has some sources of uncertainty but was generally well conducted and suggestive of a PFS benefit for LEN-PEM versus AXI-PEM. The NMA was not suggestive of an OS benefit for LEN-PEM compared with AXI-PEM.
CADTH undertook reanalyses to address limitations relating to the following:
uncertainty in long-term PFS for LEN-PEM
aligning the TTD for LEN-PEM with CLEAR trial observations and ensuring DoT is close to but not greater than PFS
assuming DoT for subsequent therapies was equal for all comparators
assuming 50% of patients receive subsequent therapy upon progression
assuming an RDI of 100% for all treatments
adjusting AE treatment costs for anemia and hypertension to reflect the outpatient nature of their management.
Based on the CADTH base case, the ICER for LEN-PEM compared with AXI-PEM was $667,600 per QALY. The ICER for AXI-PEM compared with pazopanib was $156,563 per QALY. SUN was dominated (i.e., less effective and more expensive) by PAZO. A reduction of at least 56% in the price of LEN is required for LEN-PEM to achieve an ICER of $50,000 per QALY compared with AXI-PEM. To reach this willingness-to-pay threshold against PAZO, the cost of PEM would need to be further reduced by 29%.
CADTH was unable to address limitations relating to the model regarding the sponsor’s PSM modelling approach that led to unexpected pre-progression survival benefits for LEN-PEM and post-progression survival benefits for AXI-PEM. In a scenario analysis, CADTH assumed equal efficacy between these treatments in terms of PFS and OS, resulting in equal pre- and post-progression LYs and QALYs for LEN-PEM and AXI-PEM. In this scenario, AXI-PEM was dominated (i.e., equally as effective, but associated with $34,337 in incremental costs) by LEN-PEM. CADTH conducted a scenario analysis only for the intermediate and poor risk subgroup; no conclusions can be drawn regarding the cost-effectiveness of LEN-PEM in this population.
Additionally, there is some uncertainty as to the drug cost for LEN. Given the different dose packages and pricing from the sponsor, the cost of a 20 mg dose is higher when using a 20 mg pack compared with two 10 mg packs. To address this, CADTH conducted a scenario analysis adjusting the cost of the 20 mg dose to make it equal to the cost of two 10 mg doses, resulting in a reduction in incremental cost of more than $8,000 per patient, on average.
The comparative effectiveness estimate for LEN-PEM versus AXI-PEM is based on the results of an NMA that suggests a notable improvement in PFS for LEN-PEM but no corresponding improvement in OS. This finding, while supported by the available statistical evidence, did not match the expectations or experience of the clinical experts consulted by CADTH and produced results with questionable face validity. In the CADTH reanalysis, probabilistic estimates of incremental effectiveness estimated a 41% probability that LEN-PEM is inferior to AXI-PEM (i.e., LEN-PEM is associated with fewer QALYs). This finding is likely produced due to the similar OS estimates for LEN-PEM and AXI-PEM, with uncertainty around parameter estimates of the health state utility and survival. Consequently, while the incremental costs of LEN-PEM are clear, the incremental effectiveness (and therefore cost-effectiveness) is uncertain. The clinical expert feedback suggested that these 2 treatment approaches should be largely similar in terms of efficacy, which is supported by this probabilistic result. Interpretations of CADTH’s estimates of these ICERs should be interpreted with this decision uncertainty in mind.
References
1.pCODR Expert Review Committee (pERC) final recommendation: lenvatinib (Lenvima - Eisai Limited) for renal cell carcinoma Ottawa (ON): CADTH; 2018: https://www.cadth.ca/sites/default/files/pcodr/Reviews2019/10140LenvatinibRCC_FnRec_approvedbyChair_Post_04Jan2019_final.pdf. Accessed 2022 Feb 18.
2.pCODR Expert Review Committee (pERC) final recommendation: lenvatinib (Lenvima - Eisai Limited) for differentiated thyroid cancer Ottawa (ON): CADTH; 2019: https://www.cadth.ca/sites/default/files/pcodr/pcodr_lenvatinib_lenvima_dtc_fn_rec.pdf Accessed 2022 Feb 18.
3.pCODR Expert Review Committee (pERC) final recommendation: lenvatinib (Lenvima - Eisai Limited) for hepatocellular carcinoma. Ottawa (ON): CADTH; 2019: https://www.cadth.ca/sites/default/files/pcodr/Reviews2019/10175LenvatinibHCC_fnRec_2019-07-23_ApprovedByChair_Post_24Jul2019_final.pdf Accessed 2022 Feb 18.
4.Clinical Study Report: E7080-G000-307/KEYNOTE 581. A multicenter, open-label, randomized, phase 3 trial to compare the efficacy and safety of lenvatinib in combination with everolimus or pembrolizumab versus sunitinib alone in first-line treatment of subjects with advanced renal cell carcinoma (CLEAR). [internal sponsor's report]. Woodcliff Lake (NJ): Eisai Inc; 2021 Feb 18.
5.Iacovelli R, Cartenì G, Sternberg CN, et al. Clinical outcomes in patients receiving three lines of targeted therapy for metastatic renal cell carcinoma: results from a large patient cohort. Eur J Cancer. 2013;49(9):2134-2142. PubMed
6.Motzer RJ, Hutson TE, Cella D, et al. Pazopanib versus sunitinib in metastatic renal-cell carcinoma. N Engl J Med. 2013;369(8):722-731. PubMed
7.Rini BI, Powles T, Chen M, Puhlmann M, Atkins MB. Phase 3 KEYNOTE-426 trial: Pembrolizumab (pembro) plus axitinib versus sunitinib alone in treatment-naive advanced/metastatic renal cell carcinoma (mRCC). J Clin Oncol. 2017;35(Suppl 15):TPS4597.
8.Albiges L, Tannir NM, Burotto M, et al. Nivolumab plus ipilimumab versus sunitinib for first-line treatment of advanced renal cell carcinoma: extended 4-year follow-up of the phase III CheckMate 214 trial. ESMO open. 2020;5(6):e001079. PubMed
9.Powles T, Plimack ER, Soulières D, et al. Pembrolizumab plus axitinib versus sunitinib monotherapy as first-line treatment of advanced renal cell carcinoma (KEYNOTE-426): extended follow-up from a randomised, open-label, phase 3 trial. The Lancet Oncology. 2020;21(12):1563-1573. PubMed
10.Nivolumab with ipilimumab for untreated metastatic renal cell carcinoma [ID1182]: committee papers. (NICE Single Technology Appraisal). London: National Institute for Health and Care Excellence; 2019.
11.Exceptional Access Program (EAP). Toronto (ON): Ontario Ministry of Health; Ontario Ministry of Long-Term Care; 2021: https://www.health.gov.on.ca/en/pro/programs/drugs/odbf/odbf_except_access.aspx. Accessed 2022 Mar 1.
12.pan-Canadian Oncology Drug Review. Pembrolizumab (Keytruda) for renal cell carcinoma — details. Ottawa (ON): CADTH; 2020: https://www.cadth.ca/pembrolizumab-keytruda-renal-cell-carcinoma-details. Accessed 2022 Mar 1.
13.National Institute for Health and Care Excellence. Pazopanib for the first-line treatment of advanced renal cell carcinoma. (NICE Technology appraisal guidance TA215). 2011; https://www.nice.org.uk/guidance/ta215. Accessed 2022 Feb 8.
14.Schedule of benefits for physician services under the Health Insurance Act: effective April 1, 2020. Toronto (ON): Ontario Ministry of Health; 2020: https://www.health.gov.on.ca/en/pro/programs/ohip/sob/physserv/sob_master20200306.pdf. Accessed 2022 Mar 1.
15.Pembrolizumab with axitinib for untreated advanced renal cell carcinoma [ID1426]: committee papers (NICE Single Technology Appraisal). London: National Institute for Health and Care Excellence; 2020: https://www.nice.org.uk/guidance/ta650/evidence/appraisal-consultation-committee-papers-pdf-8843230045.
16.Schedule of benefits for laboratory services: effective July 1, 2020. Toronto (ON): Ontario Ministry of Health; 2020: https://www.health.gov.on.ca/en/pro/programs/ohip/sob/lab/lab_mn2020.pdf. Accessed 2022 Mar 1.
17.Walker H, Anderson M, Farahati F, et al. Resource use and costs of end-of-life/palliative care: Ontario adult cancer patients dying during 2002 and 2003. J Palliat Care. 2011;27(2):79-88. PubMed
18.Canadian Institute for Health Information (CIHI). Patient cost estimator. 2021; https://www.cihi.ca/en/patient-cost-estimator. Accessed 2022 Mar 1.
19.Pharmacoeconomic evaluation [internal sponsor's report]. In: Drug Reimbursement Review sponsor submission: Lenvima (lenvatinib) in combination with pembrolizumab (Keytruda), 4 mg and 10 mg lenvatinib mesylate capsules. Mississauga (ON): Eisai Limited; 2021 Nov.
20.Ko JJ, Choueiri TK, Rini BI, et al. First-, second-, third-line therapy for mRCC: benchmarks for trial design from the IMDC. Br J Cancer. 2014;110(8):1917-1922. PubMed
21.Porta CG, Motzer R, Ejzykowicz F, et al. Matching-adjusted indirect comparison (MAIC) of health-related quality of life (HRQoL) of nivolumab plus cabozantinib (N+C) vs pembrolizumab plus axitinib (P+A) in previously untreated advanced renal cell carcinoma (aRCC). Ann Oncol. 2021;32(Suppl 5):S692-S693.
22.Lenvima (lenvatinib capsules), 4 mg and 10 mg lenvatinib (as lenvatinib mesylate) [product monograph]. Mississauga (ON): Eisai Limited; 2021 May 3.
23.pan-Canadian Oncology Drug Review. Lenvatinib (Lenvima) differentiated thyroid cancer – final economic guidance report Ottawa (ON): CADTH; 2016: https://www.cadth.ca/sites/default/files/pcodr/pcodr_lenvatinib_lenvima_dtc_fn_egr.pdf. Accessed 2022 Feb 18.
24.DeltaPA. [Ottawa (ON)]: IQVIA; 2021: https://www.iqvia.com/. Accessed 2022 Mar 1.
25.Pembrolizumab (Keytruda) Can J Health Technol. 2022;2(2). https://www.cadth.ca/sites/default/files/DRR/2022/PC0250CL-Keytruda.pdf. Accessed 2022 Mar 1.
26.Cancer Care Ontario. AXI+PEMB regimen. 2021: https://www.cancercareontario.ca/system/files_force/AXITPEMB_GU_RCC_P.pdf. Accessed 2022 Mar 1.
27.Cancer Care Ontario. NIVL+IPIL Regimen (nivolumab-ipiliumumab). Cancer type: genitourinary, renal cell / kidney 2021: https://www.cancercareontario.ca/en/drugformulary/regimens/monograph/54006. Accessed 2022 Mar 1.
28.Cancer Care Ontario. Cabozantinib. 2022: https://www.cancercareontario.ca/en/drugformulary/drugs/monograph/60461. Accessed 2022 Mar 1.
29.Cancer Care Ontario. Sunitinib. 2020: https://www.cancercareontario.ca/system/files_force/sunitinib.pdf. Accessed 2022 Mar 1.
30.Cancer Care Ontario. Pazopanib. https://www.cancercareontario.ca/en/drugformulary/drugs/monograph/43756. Accessed 2022 Mar 1.
31.Budget Impact Analysis [internal sponsor's report]. In: Drug Reimbursement Review sponsor submission: Lenvima (lenvatinib) in combination with pembrolizumab (Keytruda), 4 mg and 10 mg lenvatinib mesylate capsules. Mississauga (ON): Eisai Limited; 2021 Nov.
Appendix 1: Cost Comparison Table
Note that this appendix has not been copy-edited.
The comparators presented in the following table have been deemed to be appropriate based on feedback from clinical expert(s) and drug plans. Comparators may be recommended (appropriate) practice or actual practice. Existing Product Listing Agreements are not reflected in the table and as such, the table may not represent the actual costs to public drug plans.
Table 9: CADTH Cost Comparison Table for Renal Cell Carcinoma
Treatment | Strength / concentration | Form | Price | Recommended dosage | Daily cost | Average 28-day cost a |
|---|---|---|---|---|---|---|
Immunotherapy plus monoclonal antibody | ||||||
LEN-PEM | ||||||
LEN | 8 mg 10 mg 14 mg 20 mg | Tablet | 68.6407a 75.2783a 116.9347a 175.4127a | 20 mg (two 10 mg capsules) orally once daily with PEM | 175.41 | 4,216 |
PEM | 100 mg/4mL | Vial for IV infusion (4 mL) | 4,400.0000b | 200 mg, every 3 weeks | 419.05 | 11,733 |
LEN-PEM | Until disease progression or toxicity | 569.60 | 15,949 | |||
Immunotherapy plus monoclonal antibody | ||||||
AXI-PEM | ||||||
AXI | 1 mg 5 mg | Oral | 19.8924 99.4621 | 5 mg twice daily | 198.92 | 5,570 |
PEM | 100 mg/4 mL | Vial for IV infusion (4 mL) | 4,400.0000a | 2 mg/kg on Day 1 up to a maximum of 200 mg per dose (weight-based or fixed dosing may be applicable) | 419.05 | 11,733 |
AXI-PEMc | Every 21 days (up to a maximum of 2 years) | 617.96 | 17,303 | |||
NIVO-IPI | ||||||
NIVO | 10 mg/mL | Vial for IV infusion 4 mL 10 mL | 782.2200 1,955.5600 | 3 mg/kg on Day 1 | 223.49 | 6,258 |
IPI | 5 mg/mL | Vial for IV infusion (10 mL) | 5,800.0000 | 1 mg/kg on Day 1 | 552.38 | 15,467 |
NIVO-IPId | Every 21 days for a total of 4 cycles | 776 | 21,724 | |||
Single-agent chemotherapy | ||||||
Cabozantinibe | 20 mg 40 mg 60 mg | Tablet | 299.2000 | 60 mg daily | 299.20 | 8,378 |
Multi-target tyrosine kinase inhibitor | ||||||
Sunitinibf | 12.5 mg 25 mg 50 mg | Tablet | 64.4157 128.8303 257.6611 | 50 mg daily (4 weeks on, 2 weeks off), every 6 weeks | 171.77 | 7,215 |
Pazopanibg | 200 mg | Tablet | 36.4300 | 800 mg daily | 145.72 | 4,080 |
AXI = axitinib; IPI = ipilimumab; LEN = Lenvatinib; NIVO = nivolumab; PEM = pembrolizumab.
Note: All prices are from the DeltaPA database24 (accessed January 11, 2022), unless otherwise indicated, and do not include dispensing fees.
aSponsor-submitted price.19
bCADTH Reimbursement Review for Pembrolizumab (Keytruda.)25
cCancer Care Ontario Product Monograph for Axitinib plus Pembrolizumab.26
dCancer Care Ontario Product Monograph for Nivolumab plus Ipiliumumab.27
eCancer Care Ontario Product Monograph for Cabozantinib.28
fCancer Care Ontario Product Monograph for Sunitinib.29
gCancer Care Ontario Product Monograph for Pazopanib.30
Appendix 2: Submission Quality
Note that this appendix has not been copy-edited.
Description | Yes/No | Comments |
|---|---|---|
Population is relevant, with no critical intervention missing, and no relevant outcome missing | Yes | No comment. |
Model has been adequately programmed and has sufficient face validity | No | The sponsor’s model required use of a macro to update deterministic model results. This made validating the programming of the sponsor’s model challenging. |
Model structure is adequate for decision problem | No | A partitioned survival model does not explicitly consider the relationship between PFS and OS (See Limitation). “The sponsor’s modelling approach led to pre-progression survival benefits that are not clinically expected.” |
Data incorporation into the model has been done adequately (e.g., parameters for probabilistic analysis) | Yes | No comment. |
Parameter and structural uncertainty were adequately assessed; analyses were adequate to inform the decision problem | Yes | No comment. |
The submission was well organized and complete; the information was easy to locate (clear and transparent reporting; technical documentation available in enough details) | Yes | No comment. |
Appendix 3: Additional Information on the Submitted Economic Evaluation
Note that this appendix has not been copy-edited.
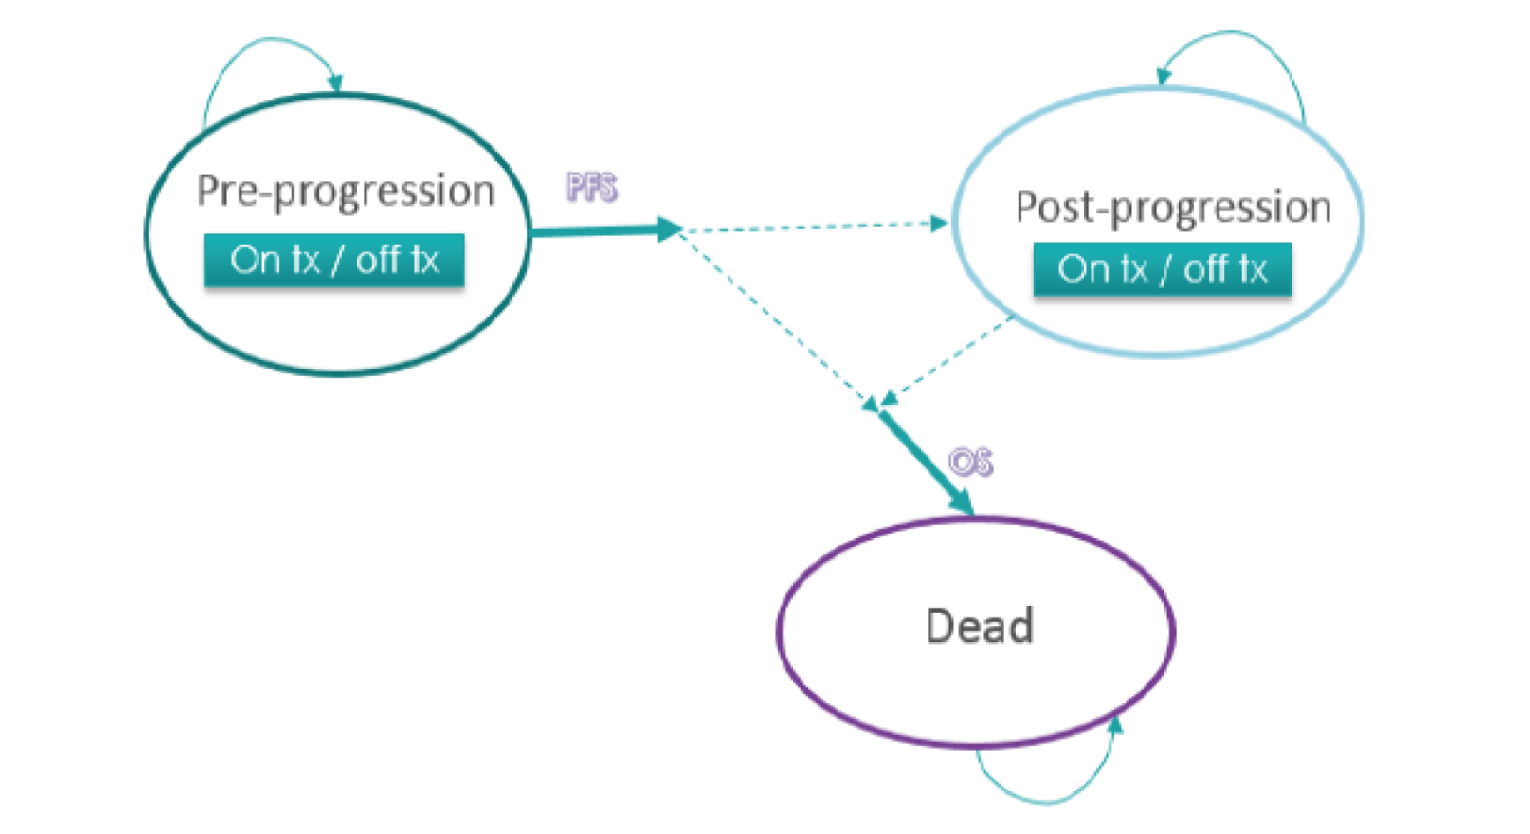
OS = overall survival; PFS = progression-free survival; tx = treatment.
Source: Sponsor’s pharmacoeconomic report.19
Detailed Results of the Sponsor’s Base Case
Figure 2: Parametric Joint-Fit PFS Extrapolations for LEN-PEM in the Overall Population
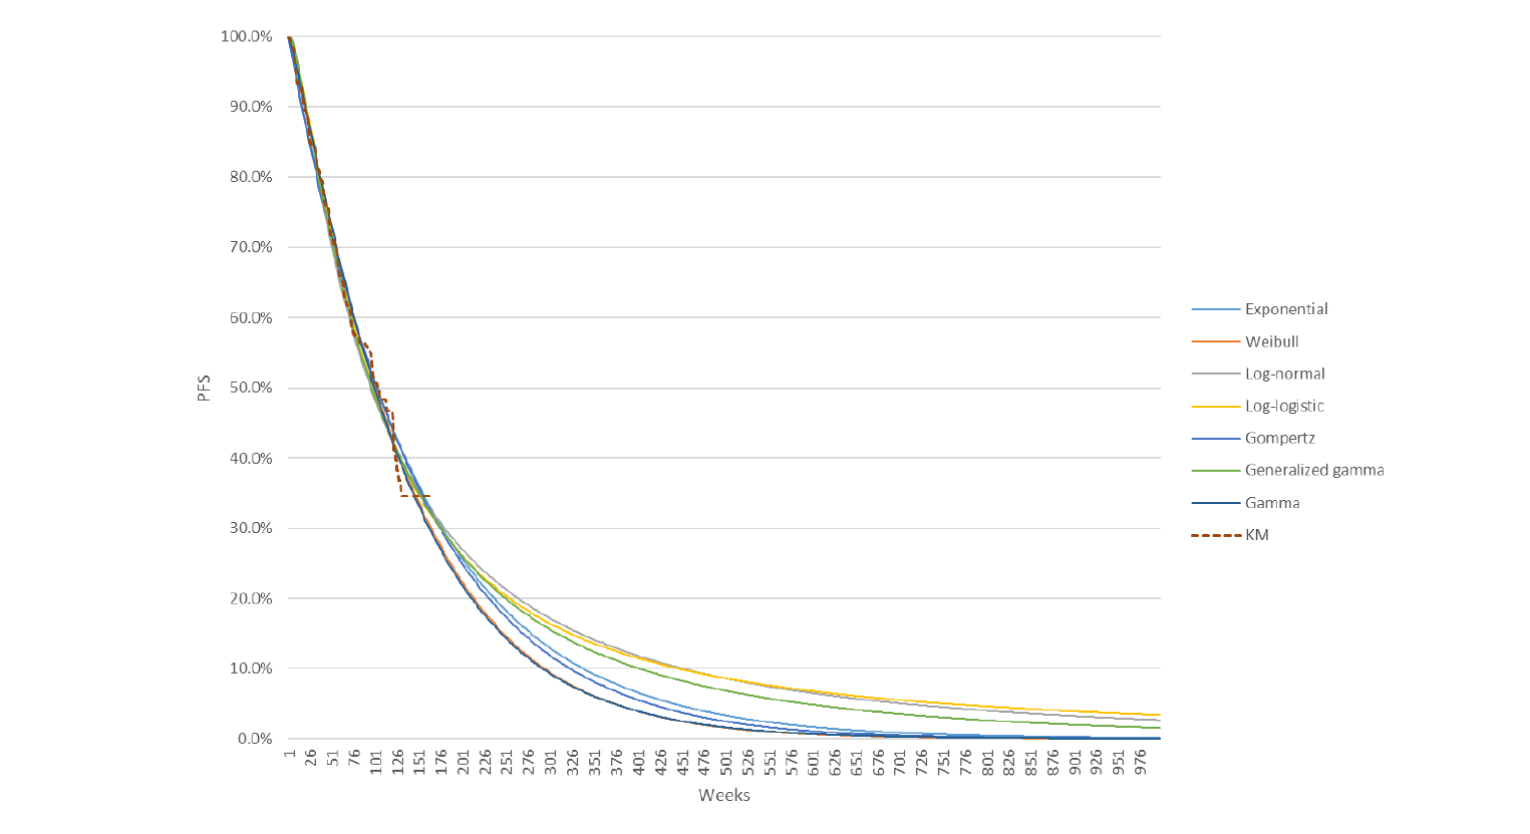
LEN = lenvatinib; KM = Kaplan-Meier; PEM = pembrolizumab; PFS = progression-free survival.
Source: Sponsor’s pharmacoeconomic report.19
Figure 3: Parametric Single-Fit Overall Survival Extrapolations for LEN-PEM in the Overall Population
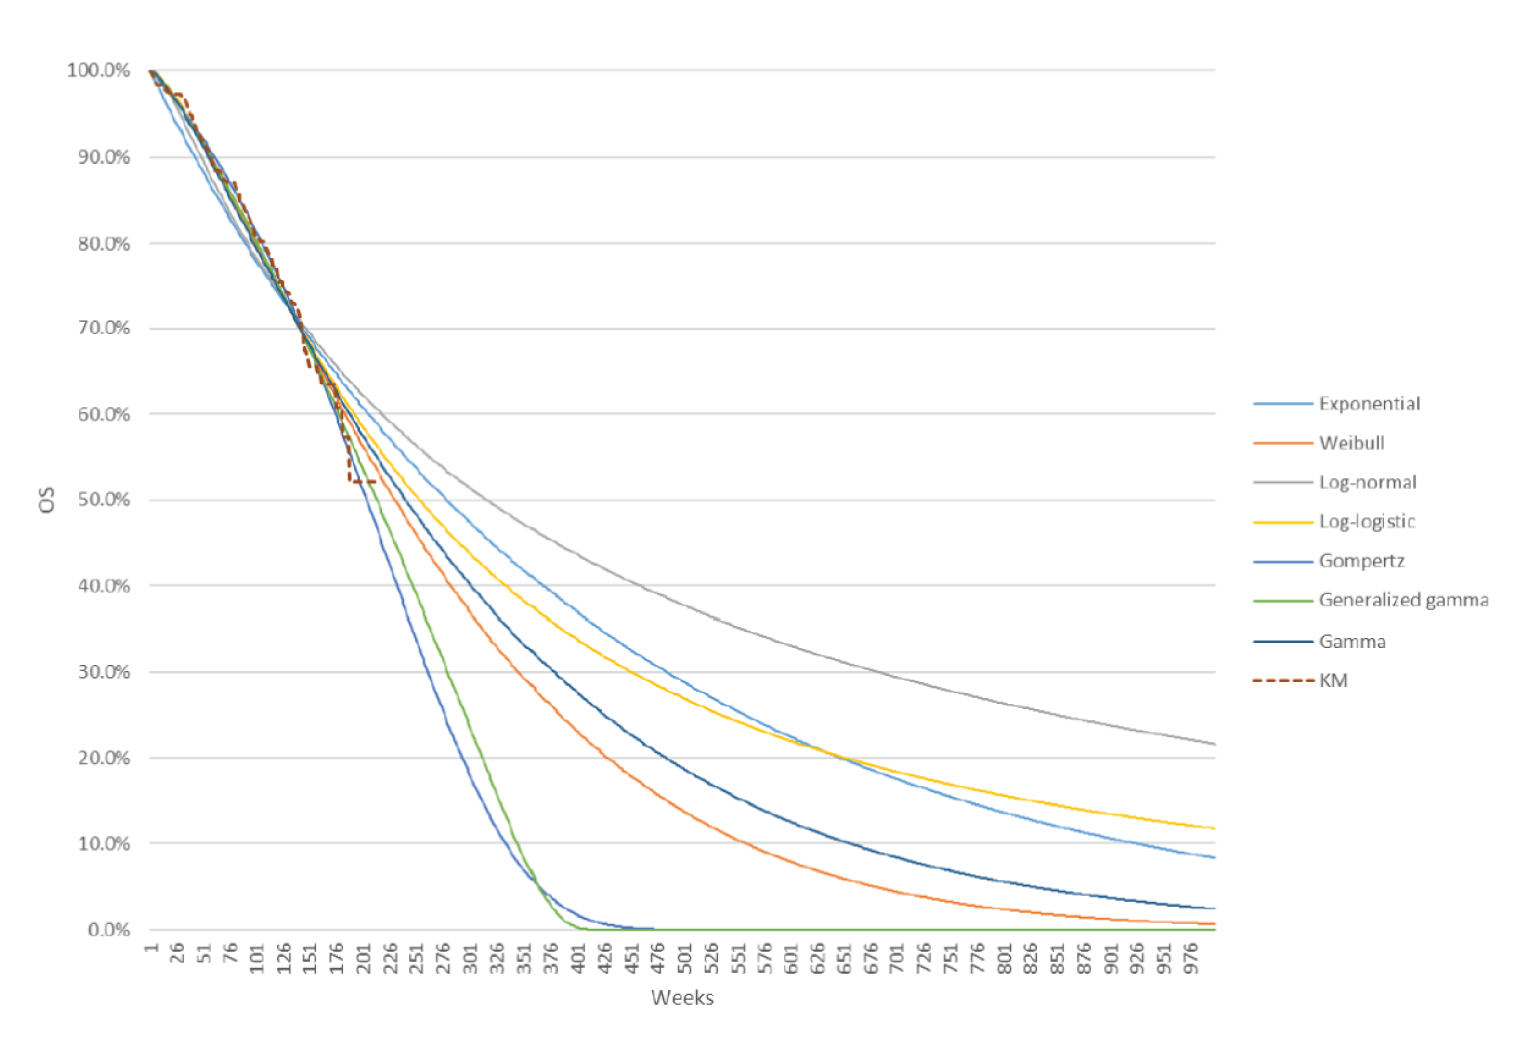
LEN-PEM = lenvatinib plus pembrolizumab; KM = Kaplan-Meier.
Source: Sponsor’s pharmacoeconomic report.19
Appendix 4: Additional Details on the CADTH Reanalyses and Sensitivity Analyses of the Economic Evaluation
Note that this appendix has not been copy-edited.
Table 11: Disaggregated Summary of CADTH’s Economic Evaluation Results
Treatment | Component | Value | Incremental (vs. reference) | Incremental (sequential) | |
|---|---|---|---|---|---|
Discounted LYs | |||||
PAZO | Pre-progression | 1.11 | — | — | |
Post-progression | 4.26 | — | — | ||
Total | 5.38 | — | — | ||
SUN | Pre-progression | 1.11 | 0.00 | — | |
Post-progression | 4.26 | 0.00 | — | ||
Total | 5.38 | –0.01 | — | ||
AXI-PEM | Pre-progression | 1.56 | 0.44 | 0.44 | |
Post-progression | 5.25 | 0.99 | 0.99 | ||
Total | 6.81 | 1.43 | 1.44 | ||
LEN-PEM | Pre-progression | 2.47 | 1.36 | 0.91 | |
Post-progression | 4.39 | 0.13 | −0.86 | ||
Total | 6.86 | 1.48 | 0.05 | ||
Discounted QALYs | |||||
PAZO | Pre-progression | 0.88 | — | — | |
Post-progression | 2.99 | — | — | ||
Total | 2.88 | — | — | ||
SUN | Pre-progression | 0.88 | 0.00 | — | |
Post-progression | 2.99 | 0.00 | — | ||
Total | 3.87 | –0.01 | — | ||
AXI-PEM | Pre-progression | 1.23 | 0.35 | 0.35 | |
Post-progression | 3.68 | 0.69 | 0.69 | ||
Total | 4.91 | 1.03 | 1.04 | ||
LEN-PEM | Pre-progression | 1.95 | 1.07 | 0.72 | |
Post-progression | 3.07 | 0.09 | −0.60 | ||
Total | 5.03 | 1.15 | 0.12 | ||
Discounted costs ($) | |||||
PAZO | First-line treatment costs | 78,819 | — | — | |
First-line Administration | 13,928 | — | — | ||
Disease management | 6,747 | — | — | ||
Mortality | 30,337 | — | — | ||
Subsequent treatment | 16,755 | — | — | ||
AE management | 69 | — | — | ||
Total | 146,656 | — | — | ||
SUN | First-line treatment costs | 92,912 | 14,092 | — | |
First-line Administration | 9,285 | −4,643 | — | ||
Disease management | 6,719 | −29 | — | ||
Mortality | 30,337 | 0 | — | ||
Subsequent treatment | 16,417 | −338 | — | ||
AE management | 31 | −38 | — | ||
Total | 155,701 | 9,045 | — | ||
AXI-PEM | First-line treatment costs | 239,640 | 160,820 | 146,728 | |
First-line Administration | 929 | −12,999 | −8,356 | ||
Disease management | 8,565 | 1,817 | 1,846 | ||
Mortality | 29,351 | −986 | −986 | ||
Subsequent treatment | 29,914 | 13,159 | 13,496 | ||
AE management | 68 | −1 | 37 | ||
Total | 308,467 | 161,810 | 152,765 | ||
LEN-PEM | First-line treatment costs | 321,931 | 243,112 | 82,291 | |
First-line Administration | 1,187 | −12,741 | 258 | ||
Disease management | 9,642 | 2,895 | 1,078 | ||
Mortality | 29,338 | −999 | −13 | ||
Subsequent treatment | 25,149 | 8,394 | −4,765 | ||
AE management | 71 | 1 | 2 | ||
Total | 387,317 | 240,661 | 78,851 | ||
ICER ($) | |||||
PAZO | Reference | Reference | |||
SUN | Dominated by PAZO | Dominated by PAZO | |||
AXI-PEM | $156,563 | $156,563 vs. PAZO | |||
LEN-PEM | $208,975 | $667,600 vs. AXI-PEM | |||
AE = adverse event; AXI = axitinib; ICER = incremental cost-effectiveness ratio; LEN = lenvatinib; LY = life-year; NA = not applicable; PAZO = pazopanib; PEM = pembrolizumab; QALY = quality-adjusted life-year.
Detailed Results of CADTH Base Case
Scenario Analyses
Table 12: CADTH Scenario Analyses
Stepped analysis | Drug | Total costs ($) | Total QALYs | ICER ($/QALYs) |
|---|---|---|---|---|
CADTH base case | PAZO | 146,656 | 3.88 | Reference |
SUN | 155,701 | 3.87 | Dominated | |
AXI-PEM | 308,467 | 4.91 | 156,563 | |
LEN-PEM | 387,317 | 5.03 | 667,600 | |
Equal PFS and TTD for LEN-PEM and AXI-PEM (HR = 1) | PAZO | 145,663 | 3.86 | Reference |
SUN | 154,425 | 3.85 | Dominated | |
LEN-PEM | 387,079 | 5.00 | 211,637 | |
AXI-PEM | 421,274 | 4.96 | Dominated | |
Equal OS for LEN-PEM and AXI-PEM (HR = 1) | PAZO | 145,663 | 3.86 | Reference |
SUN | 154,425 | 3.85 | Dominated | |
AXI-PEM | 309,910 | 4.91 | 155,696 | |
LEN-PEM | 387,079 | 5.00 | 899,506 | |
Equal PFS, TTD, and OS for LEN-PEM and AXI-PEM (HR = 1) | PAZO | 145,663 | 3.86 | Reference |
SUN | 154,425 | 3.85 | Dominated | |
LEN-PEM | 387,079 | 5.00 | 211,637 | |
AXI-PEM | 421,416 | 5.00 | Dominated | |
Price of 20 mg dose = $150.56 | PAZO | 145,663 | 3.86 | Reference |
SUN | 154,425 | 3.85 | Dominated | |
AXI-PEM | 309,816 | 4.87 | 161,793 | |
LEN-PEM | 379,196 | 5.00 | 550,106 | |
Intermediate/poor risk population: CADTH base case changes | PAZO | 121,864 | 2.68 | Reference |
SUN | 128,371 | 2.67 | Dominated | |
NIVO-IPI | 177,372 | 3.85 | 47,792 | |
AXI-PEM | 308,784 | 3.93 | Extended dominance | |
LEN-PEM | 367,963 | 4.16 | 615,872 | |
Intermediate/poor risk population: CADTH base case changes plus equal PFS for LEN-PEM and AXI-PEM plus NIVO-IPI (PFS HR = 1) | PAZO | 121,864 | 2.68 | Reference |
SUN | 128,371 | 2.67 | Dominated | |
NIVO-IPI | 170,838 | 3.98 | 37,799 | |
AXI-PEM | 303,046 | 4.05 | Extended dominance | |
LEN-PEM | 367,963 | 4.16 | 1,124,771 | |
Intermediate/poor risk population: CADTH base case changes plus equal PFS and OS for LEN-PEM and AXI-PEM plus NIVO-IPI (PFS and OS HR = 1) | PAZO | 121,864 | 2.68 | Reference |
SUN | 128,371 | 2.67 | Dominated | |
NIVO-IPI | 171,672 | 4.15 | 33,931 | |
AXI-PEM | 303,536 | 4.16 | 36,692,452 | |
LEN-PEM | 367,963 | 4.16 | Dominated |
AXI = axitinib; ICER = incremental cost-effectiveness ratio; IPI = ipilimumab; LEN = lenvatinib; NIVO = nivolumab; PAZO = pazopanib; PEM = pembrolizumab; PFS = progression-free survival; QALY = quality-adjusted life-year; Ref. = reference; SUN = sunitinib.
Note: Due to the wide credible intervals surrounding the PFS HR estimates, incremental QALYs between LEN-PEM and AXI-PEM differed significantly between some scenario analyses and the CADTH base case in ways that were not expected. Therefore, all scenario analyses were conducted deterministically.
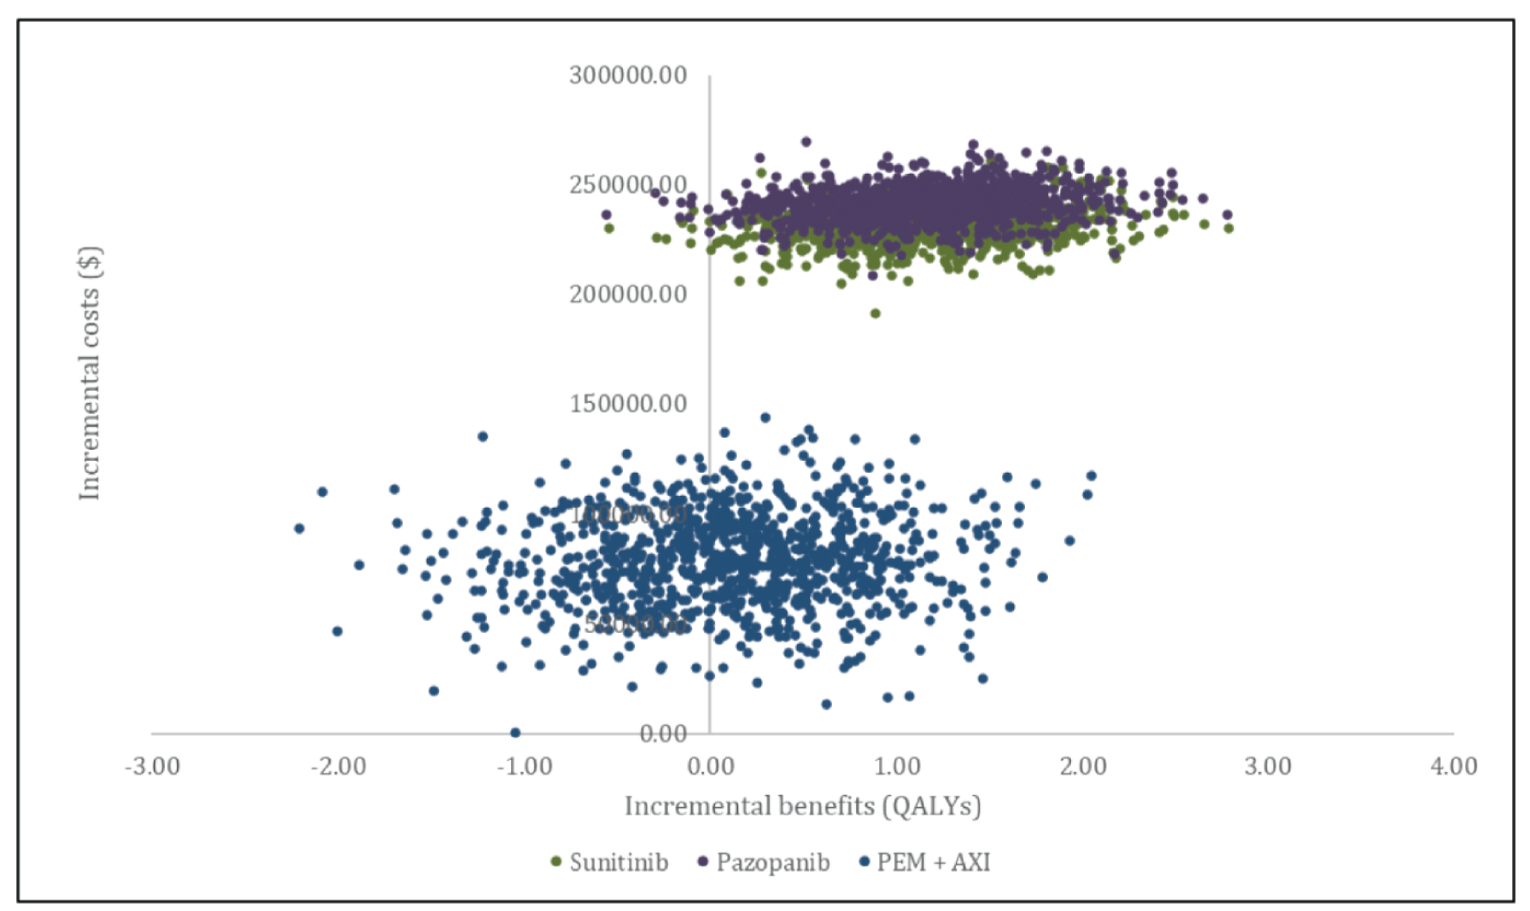
Appendix 5: Submitted Budget Impact Analysis (BIA) and CADTH Appraisal
Note that this appendix has not been copy-edited.
Table 13: Summary of Key Takeaways
Key takeaways of the BIA |
|---|
|
Summary of Sponsor’s BIA
The sponsor assessed the budget impact of the introduction of LEN-PEM compared with first-line treatments (i.e., AXI-PEM, NIVO-IPI, and SUN-PAZO), for adult patients with advanced or metastatic RCC with no prior systemic therapy for metastatic RCC, from the perspective of the public drug plan in the Canadian setting (excluding Quebec) over a 3-year time horizon.31 The sponsor’s submission considered only drug acquisition costs. Mark-up and dispensing fees were excluded. In the reference scenario, the sponsor assumed that patients would be eligible to receive the above-mentioned first-line treatments. In the new drug scenario, LEN-PEM was assumed to only displace AXI-PEM, as it was deemed to be the most relevant comparator.31
The sponsor estimated the eligible population size using an epidemiological approach which was derived via several assumptions and inputs to first estimate the total eligible population with advanced or metastatic RCC with no prior systemic therapy for metastatic RCC.31
Key inputs to the BIA are documented in Table 15.
The sponsor’s BIA also included the following key assumptions:
The sponsor estimated that in the new drug scenario, the market share for LEN-PEM would be |||||||%, |||||||%, and |||||||% in years 1, 2, and 3, respectively, based on the 3-year market share for AXI-PEM as a proxy from the ONCO-CAPPS data. A slower initial uptake was assumed in the first year of its introduction given that LEN-PEM would be the second IO-TKI introduced on the market. All capture for LEN-PEM was estimated to come from AXI-PEM.31
Total therapy costs were calculated by multiplying the number of units per cycle for a given treatment with the treatment cycle length. Drug wastage was assumed. Days of active therapy per cycle were used to determine the number of units per cycle.31
The submitted price per unit of LEN ($175.4127 per 20 mg daily dose; $116.9347 per 14 mg daily dose; $75.2783 per 10 mg daily dose; $68.6407 per 8 mg daily dose). Given that LEN is available in daily-dose packs of 20 mg (2 × 10mg), 14 mg (1 × 10 mg and 1 × 4 mg), 10 mg (1 × 10 mg), and 8 mg (2 × 4 mg), a weighted-average price per milligram of LEN was calculated across the daily-dose packs, based on the distribution of days on each dose observed within the CLEAR study.31
Table 14: Summary of Key Model Parameters
Parameter | Sponsor’s estimate (reported as year 1 / year 2 / year 3 if appropriate) |
|---|---|
Target population | |
Two-year prevalence rate of all kidney cancers | 0.0262% |
Proportion of RCC among kidney cancers and renal pelvis cancers (RPS) | 85% |
Proportion of renal cell carcinoma of clear-cell histology (cc-RCC) among those with RCC | 75% |
Proportion of patients with advanced renal cell carcinoma of clear-cell histology (cc-aRCC) among those with cc-RCC | 62.5% |
Proportion of patients with advanced or metastatic disease who received first-line treatment (i.e., treated population) | |||||||% |
Number of patients eligible for drug under review | 1,621 / 1,644 / 1,666 |
Market uptake (3 years) | |
Uptake (reference scenario) AXI-PEM NIVO-IPI SUN PAZO Clinical trial | |||||||% / |||||||% / |||||||% |||||||% / |||||||% / |||||||% |||||||% / |||||||% / |||||||% |||||||% / |||||||% / |||||||% |||||||% / |||||||% / |||||||% |
Uptake (new drug scenario) LEN-PEM AXI-PEM NIVO-IPI SUN PAZO Clinical trial | |||||||% / |||||||% / |||||||% |||||||% / |||||||% / |||||||% |||||||% / |||||||% / |||||||% |||||||% / |||||||% / |||||||% |||||||% / |||||||% / |||||||% |||||||% / |||||||% / |||||||% |
Cost of treatment (per patient) within the first year of treatment | |
Cost of treatment LEN-PEM AXI-PEM NIVO-IPI SUN PAZO | $195,453 $174,188 $94,932 $33,907 $27,289 |
AXI = axitinib; CKCF = Canadian Kidney Cancer Forum; CKCis = Canadian Kidney Cancer information system; IPI = ipilimumab; NIVO = nivolumab; PAZO = pazopanib; PEM = pembrolizumab; RCC = renal cell carcinoma; SUN = sunitinib.
Summary of the Sponsor’s BIA Results
Results of the sponsor’s base-case analysis under the drug plan perspective estimated that the introduction of LEN-PEM in patients with advanced or metastatic RCC with no prior systemic therapy would result in an incremental budget impact of $4,826,139 in year 1, $20,267,833 in year 2, and $30,646,344 in year 3, resulting in a total of $55,740,315 over the 3-year time horizon.31
CADTH Appraisal of the Sponsor’s BIA
CADTH identified several key limitations to the sponsor’s analysis that have notable implications on the results of the BIA:
The RDI for patients who received LEN-PEM did not align with clinical expectations: In the sponsor’s base-case analysis, drug cost calculations were derived by multiplying the RDI of each treatment by the drug costs. However, this approach of multiplying the RDI by the drug costs is problematic as RDI can be influenced by many different factors. For instance, the dose received by a patient may differ from the full planned dose of the drug due to dose delays, missed doses, dose reductions to manage toxicity, or subsequent dose re-escalation. Each of these reasons have differing impacts on drug costs. It is also unclear how these assumptions interact with considerations about vial size and wastage, which were incorporated into the sponsor’s calculations of the per cycle drug costs. Without explicitly modelling dose delays and reductions for the patient population, this method of multiplying RDI by drug acquisition costs contributes to uncertainty in the true drug costs incurred by payers.
Additionally, the clinical experts consulted by CADTH commented on the appropriateness of the RDI values in the submitted model, and noted some uncertainties: the RDI of 100% for both PEM combination therapies was reasonable; the RDI for AXI was expected to be 80% based on their clinical experience; and the RDI for LEN was uncertain. The expert further indicated that the RDI for NIVO would likely remain unadjusted and should be 100% and an RDI of 75% was more appropriate for IPI. Considering expert feedback and the limitations with the sponsor’s approach to calculating drug costs based on the RDI, CADTH revised the RDI for all treatments.
o CADTH addressed this limitation by revising the RDI for all treatments to 100%. In a scenario analysis, CADTH tested the impact of the sponsor’s assumed RDIs for all treatments.
The anticipated uptake of LEN-PEM in the new drug scenario is likely overestimated: The sponsor anticipated that LEN-PEM would capture |||||||%, |||||||% and |||||||% of the market share distribution in years 1, 2, and 3. The clinical expert consulted by CADTH described that the sponsor’s anticipated uptake is likely overestimated over the 3-year time horizon and that the market uptake would likely be lower in year 1, and increase in years 2 and 3. Further, the expert noted that AXI-PEM would have a higher uptake in year 1 than LEN-PEM, but equal market share in years 2 and 3. The expert indicated that NIVO-IPI would likely remain unchanged with the introduction of LEN-PEM given that most patients are in the intermediate and poor risk group while across all years, particularly in years 2 and 3. CADTH revised the market share uptake of LEN-PEM across years 1, 2, and 3 to 15%, 20%, and 20%, to align with experts’ feedback.
CADTH addressed this limitation by revising the market shares for LEN-PEM in the new drug scenario to 15%, 20%, and 20% in years 1, 2, and 3.
The market share distribution in the reference scenario does not align with clinical expectations: In the reference scenario, the sponsor assumed that AXI-PEM captured the majority of the market share, followed by NIVO-IPI, SUN, and pazopanib, and a proportion of patients would be enrolled in clinical trials. The clinical expert consulted by CADTH indicated that the market share distribution in the reference scenario did not align with Canadian clinical practice and noted that the market share distribution in the current treatment landscape is likely 50% NIVO-IPI, 30% AXI-PEM, and 20% pazopanib, and little to no sunitinib. Lastly, the sponsor included clinical trial treatments as part of the reference and new drug scenarios, however, the availability and applicability of clinical trial treatments remains uncertain for the target population.
CADTH addressed this limitation by revising the market share distribution in the reference scenario to reflect the trends described by the clinical expert, with no capture from clinical trials.
The total DoT for each treatment in the sponsor’s BIA was misaligned with the median DoT in the sponsor’s economic evaluation: In the sponsor’s BIA, the DoT for LEN-PEM, and sunitinib, respectively, did not align with the median DoT applied in the sponsor’s economic model, which were based on the time to discontinuation for each treatment from the CLEAR trial. Similarly, the DoT for nivolumab in combination with ipilimumab (NIVO-IPI), AXI-PEM, and pazopanib did not align with the median DoT values assumed in the sponsor’s economic model. Altogether, the sponsor’s assumed values for the DoT of each treatment in the BIA underestimated the total market costs. CADTH revised the DoT for all treatments to align with their respective DoT’s in the CADTH pharmacoeconomic analysis.
CADTH addressed this limitation by revising the DoT values for all treatments as follows: LEN: 19.6 months; PEM: 17.3 months; AXI: 10.4 months; PEM: 10.4 months; SUN: 8 months; and PAZO: 8 months.
The estimated eligible population for treatment with LEN-PEM may be underestimated: The sponsor undertook an epidemiological approach to estimate the size of the population eligible for LEN-PEM. This required assessing the published literature and applying several assumptions to derive estimates for the prevalent population in a multi-step approach. The clinical expert consulted by CADTH indicated that while the estimated target population derived from the sponsor’s assumptions and inputs appeared to be reasonable, there may be some underestimation of the model inputs may be associated with some uncertainty. First, the clinical expert consulted by CADTH indicated that there may be some uncertainty around the estimated prevalence of kidney and renal pelvis cancer. Second, the clinical expert consulted by CADTH noted that the proportion of patients with RCC of advanced clear-cell histology that were assumed to receive first-line treatment may be as high as 80%. Finally, the proportion of treated patients eligible to receive coverage across Canadian jurisdictions was estimated by the sponsor to be 75% however the clinical expert consulted by CADTH indicated that this should be as high as 95% if covered by provincial formularies. Based on the above estimates, there is some uncertainty with the estimate final population size which may result in an underestimated target population.
CADTH did not address this limitation. In a scenario analysis, CADTH arbitrarily explored the impact of (a) 80% of patients with RCC of advanced clear-cell histology assumed to receive first-line treatments; and (b) 100% of patients eligible to receive coverage across Canadian jurisdictions.
CADTH Reanalyses of the BIA
Table 15: CADTH Revisions to the Submitted BIA
Stepped analysis | Sponsor’s value or assumption | CADTH value or assumption |
|---|---|---|
Correctionsa to sponsor’s base case | ||
None | — | — |
Changes to derive the CADTH base case | ||
1. Relative dose intensities (RDIs) | LEN-PEM
AXI-PEM
NIVO-IPI
SUN = 83.2% PAZO = 83.2% | All RDIs assumed to be 100% |
2. Market share: new drug scenario | LEN-PEM: |||||||% / |||||||% / |||||||% AXI-PEM: |||||||% / |||||||% / |||||||% SUN: |||||||% / |||||||% / |||||||% NIVO-IPI: |||||||% / |||||||% / |||||||% PAZO: |||||||% / |||||||% / |||||||% | LEN-PEM: |||||||% / |||||||% / |||||||% AXI-PEM: |||||||% / |||||||% / |||||||% NIVO-IPI: |||||||% / |||||||% / |||||||% PAZO: |||||||% / |||||||% / |||||||% |
3. Market share: reference scenario | AXI-PEM: |||||||% / |||||||% / |||||||% NIVO-IPI: |||||||% / |||||||% / |||||||% SUN: |||||||% / |||||||% / |||||||% PAZO: |||||||% / |||||||% / |||||||% Clinical trial: |||||||% / |||||||% / |||||||% | AXI-PEM: |||||||% / |||||||% / |||||||% NIVO-IPI: |||||||% / |||||||% / |||||||% SUN: |||||||% / |||||||% / |||||||% PAZO: |||||||% / |||||||% / |||||||% Clinical trial: |||||||% / |||||||% / |||||||% |
4. Duration of therapy (months) | LEN-PEM
AXI-PEM
NIVO-IPI
SUN = 7.8 PAZO = 7.4 | LEN-PEM
AXI-PEM
NIVO-IPI
SUN = 8.0 PAZO = 8.0 |
CADTH base case | Reanalysis 1 + 2 + 3 + 4 | |
AXI = axitinib; IPI = ipilimumab; LEN = lenvatinib; NIVO = nivolumab; PAZO = pazopanib; PEM = pembrolizumab; RDI = relative dose intensity; SUN = sunitinib.
The results of the CADTH stepwise reanalysis are presented in summary format in Table 16 and a more detailed breakdown is presented in Table 17.
Table 16: Summary of the CADTH Reanalyses of the BIA
Stepped analysis | Three-year total |
|---|---|
Submitted base case | $55,740,315 |
CADTH reanalysis 1 | $78,542,513 |
CADTH reanalysis 2 | $13,668,617 |
CADTH reanalysis 3 | $55,740,315 |
CADTH reanalysis 4 | $58,486,642 |
CADTH base case | $41,899,528 |
BIA = budget impact analysis.
Table 17: Detailed Breakdown of the CADTH Reanalyses of the BIA
Stepped analysis | Scenario | Year 0 (current situation) | Year 1 | Year 2 | Year 3 | Three-year total |
|---|---|---|---|---|---|---|
Submitted base case | Reference | $167,105,689 | $175,155,565 | $181,567,882 | $187,162,579 | $543,886,027 |
New drug | $167,105,689 | $179,981,704 | $201,835,715 | $217,808,923 | $599,626,342 | |
Budget impact | $0 | $4,826,139 | $20,267,833 | $30,646,344 | $55,740,315 | |
CADTH base case | Reference | $191,040,661 | $195,824,010 | $224,845,069 | $227,970,104 | $648,639,183 |
New drug | $191,040,661 | $177,994,836 | $243,479,044 | $269,064,831 | $690,538,711 | |
Budget impact | $0 | –$17,829,174 | $18,633,975 | $41,094,727 | $41,899,528 |
BIA = budget impact analysis.
CADTH conducted the following additional scenario analyses from the drug plan perspective (Scenarios 1 to 4, Table 18):
Explored alternate assumptions affecting the estimated population size: (a) 80% of patients with RCC of advanced clear-cell histology assumed to receive first-line treatments; and (b) 100% of patients eligible to receive coverage across Canadian jurisdictions.
Explored the impact of the treatment-specific RDIs assumed in the sponsor’s base case.
Applied an alternate assumption for the DoT for all treatments based on those in the sponsor’s base case.
Applied a 56% reduction in the price of lenvatinib to align with the point at which the ICER is within the willingness-to-pay threshold of $50,000 per QALY in the CADTH economic base case.
LEN-PEM was associated with an increase in the 3-year total budget impact in the scenarios where the population size increased due to changes in the proportion of patients with RCC of advanced clear-cell histology assumed to receive first-line treatments, and where all patients were assumed to be eligible to receive coverage. LEN-PEM was only associated with budgetary savings in the scenario where there was a price reduction of 56% for LEN.
Table 18: CADTH Scenario Analyses
Stepped analysis | Budget impact | Year 0 (current situation) | Year 1 | Year 2 | Year 3 | Three-year total |
|---|---|---|---|---|---|---|
CADTH scenario analysis 1a | Reference | $244,532,046 | $250,654,732 | $287,801,688 | $291,801,734 | $830,258,154 |
New drug | $244,532,046 | $227,833,390 | $311,653,176 | $344,402,984 | $883,889,550 | |
Budget impact | $0 | –$22,821,342 | $23,851,488 | $52,601,251 | $53,631,396 | |
CADTH scenario analysis 1b | Reference | $255,420,915 | $261,819,083 | $300,624,140 | $304,806,276 | $867,249,500 |
New drug | $255,420,915 | $235,753,650 | $324,212,834 | $359,751,179 | $919,717,663 | |
Budget impact | $0 | –$26,065,434 | $23,588,694 | $54,944,903 | $52,468,163 | |
CADTH scenario analysis 2 | Reference | $179,863,985 | $181,230,063 | $210,820,664 | $213,750,780 | $605,801,507 |
New drug | $179,863,985 | $160,769,954 | $222,378,115 | $245,213,421 | $628,361,490 | |
Budget impact | $0 | –$20,460,109 | $11,557,450 | $31,462,642 | $22,559,983 | |
CADTH scenario analysis 3 | Reference | $178,084,764 | $184,853,131 | $210,849,476 | $213,779,992 | $609,482,599 |
New drug | $178,084,764 | $171,587,453 | $230,676,509 | $246,479,936 | $648,743,898 | |
Budget impact | $0 | –$13,265,678 | $19,827,033 | $32,699,944 | $39,261,299 | |
CADTH scenario analysis 4 | Reference | $191,040,661 | $195,824,010 | $224,845,069 | $227,970,104 | $648,639,183 |
New drug | $191,040,661 | $173,957,294 | $229,681,274 | $250,548,857 | $654,187,424 | |
Budget impact | $0 | –$21,866,716 | $4,836,204 | $22,578,753 | $5,548,241 |
Note: All scenario analyses are conducted based on the CADTH base case undertaken from the drug program plan perspective.
Stakeholder Input
Patient Input
CanCertainty
About CanCertainty
The CanCertainty Coalition is the united voice of more than 30 Canadian patient groups, cancer health charities, and caregiver organizations from across the country, joining together with oncologists and cancer care professionals to significantly improve the affordability and accessibility of cancer treatment.
For more information about the CanCertainty Coalition, please visit: https://www.cancertaintyforall.ca/
Information Gathering
Lenvatinib and pembrolizumab is indicated for patients with metastatic RCC with no prior systemic therapy. As an orally administered oncology drug, lenvatinib and pembrolizumab would not be automatically funded by certain provincial governments. In Ontario and the Atlantic provinces, only individuals over the age of 65 are automatically covered for oral oncology medication. For the small number of patients under 65 (with RCC) living in these provinces, their diagnosis could lead to severe economic hardships. However, if lenvatinib and pembrolizumab were to be fully funded for all age groups, patients would instead be able to focus on their treatment and spending time with their family and friends instead of dealing with the added burden of financial hardship and difficulties in accessing treatment.
In this submission we demonstrate that a small number of RCC patients would be affected by this inconsistent funding structure. We highlight that a small change to policy and an incremental increase in funding would ensure that all RCC patients have access to the best treatment without risking their financial security.
Our data collection efforts aimed to estimate the number of patients who are at risk of severe financial burden as a result of their diagnosis. To do this, we calculated the number of metastatic RCC cases in Canada each year among the under 65 population who do not have private or automatic public prescription drug coverage. Lenvatinib and pembrolizumab have each shown activity as monotherapies for the treatment of RCC. As a combination regimen, lenvatinib and pembrolizumab was shown to have promising antitumour activity in patients with RCC.
It is estimated that about 4,000 Canadians are diagnosed with RCC each year (Statistics Canada. Table 13-10-0111-01 Number and rates of new cases of primary cancer, by cancer type, age group and sex). We used data collected by Statistics Canada to calculate the number of Canadians that will become eligible for lenvatinib and pembrolizumab each year. Of the 4,000 diagnoses each year, we estimate that 1,376 patients will become eligible for lenvatinib and pembrolizumab. Six-hundred and twenty-three of these patients will be under the age of 65; depending on where these individuals live, their oral oncology medication may not be covered by their provincial government. For the 253 patients under 65 living in British Columbia, Alberta, Saskatchewan, and Manitoba, their oral oncology medication is automatically covered. Residents of Ontario and the Atlantic provinces under the age of 65 are not automatically covered for orally administered treatments under public plans. Their route to treatment access is not simple. By our estimations, about 47 of these Ontario cancer patients will not have private health insurance. Before they can receive their medication these patients will have to navigate a complicated process of funding applications, approval delays, locating a pharmacy, and waiting for their prescription. They will incur out-of-pocket costs and sizeable portion of their income may go towards their medication. This small number of patients would be unduly impacted by such restrictive treatment funding policies.
RCC is a disease that exemplifies the injustice of not providing oral oncology coverage for Canadians under 65. RCC is present in a higher proportion of under 65 cases than among the over 65 population. These younger patients (and their families) are at risk of financial toxicity if they live in Ontario or the Atlantic provinces.
Data Collection
We sourced “kidney and renal pelvis” cancer data from Statistics Canada (Statistics Canada. Table 13-10-0111-01 Number and rates of new cases of primary cancer, by cancer type, age group and sex). They provide the cases and each year, for each province, and for each 5 year age group across Canada. Renal pelvis cancer comprises about 6% of this category (SEER, National Cancer Institute, seer.cancer.gov). We extracted the kidney and renal pelvis cancer data and multiplied this data by 0.94 to arrive at the cases of kidney cancer. These modified case numbers were calculated for each 5-year age category (above the age of 18) in each province. RCC comprises approximately 85% of kidney cancer (Motzer, Robert J.; Bander, Neil H.; Nanus, David M. (1996). Renal-Cell Carcinoma. 335(12), 865–875). We multiplied the kidney cancer cases by 0.85 to arrive at the number of RCC cases. Metastatic RCC occurs in approximately 33% of RCC cases (Flanigan RC, Campbell SC, Clark JI, Picken MM. Metastatic renal cell carcinoma. Curr Treat Options Oncol. 2003 Oct;4(5):385-90. doi: 10.1007/s11864-003-0039-2. PMID: 12941198). In the next step, we multiplied the RCC cases by 0.33 to arrive at the number of metastatic RCC cases. Case data from Quebec was excluded from all calculations as they do not report cancer cases in the same manner as the rest of Canada.
We measured “potential financial toxicity” using data on lack of private drug coverage. The Canadian Life and Health Insurance Association (Sutherland, Greg, and Thy Dinh. Understanding the Gap: A Pan-Canadian Analysis of Prescription Drug Insurance Coverage. Published in Canada | All rights reserved | Agreement No. 40063028 | *Incorporated as AERIC Inc.) data on “extended health coverage.” For each province, we extracted the percentage of individuals under the age of 65 without private drug coverage AND without automatic public drug coverage. These province specific percentages were applied to the metastatic RCC case rates to arrive at the final estimation: the number of yearly metastatic RCC cases among the under 65 population without private or automatic public prescription drug coverage.
Assuming lenvatinib and pembrolizumab is ultimately funded by the provinces and territories, the following chart details the number of patients in each province/territory that would be face financial barriers in accessing this treatment:
Table 1: Estimation of The Yearly Number of Metastatic RCC Cancer Patients Without Private Drug Coverage
Provinces | Canadian populationi | Cases of metastatic RCCii | Patients without private drug coverageiii | |||
|---|---|---|---|---|---|---|
Over 65 | 18 to 65 | Over 65 | 18 to 65 | Over 65 | 18 to 65 | |
Totaliv | 4,766,291 | 20,719,798 | 754 | 623 | 0 | 54 |
BC | 912,748 | 3,626,769 | 145 | 113 | 0 | 0 |
AB | 550,944 | 3,197,822 | 90 | 90 | 0 | 0 |
SK | 178,828 | 828,171 | 28 | 23 | 0 | 0 |
MB | 207,999 | 971,496 | 32 | 27 | 0 | 0 |
ON | 2,423,015 | 10,404,301 | 381 | 313 | 0 | 47 |
NB | 159,716 | 538,069 | 25 | 18 | 0 | 4 |
NS | 195,114 | 674,503 | 31 | 22 | 0 | 2 |
PE | 29,833 | 107,963 | 5 | 3 | 0 | 1 |
NL | 108,094 | 370,704 | 17 | 13 | 0 | 0 |
(i) From Stats Canada for the year 2018 to align with incidence calculations.
(ii) Age-specific incidence rates were combined into two groups, over 65 years old and 18 to 65 years old.
(iii) Province specific private drug coverage rates provided by The Canadian Life and Health Insurance Association.
(iv) Excluding Quebec (who do not report cancer cases in the same manner) and the territories (for whom we do not have health insurance data).
Limitations
We calculated these estimates to highlight an issue, not to be absolutely precise.
Just because someone younger than 65 does not have private insurance does not mean that they are without financial support for their oral oncology medication. In each province, multiple programs exist to support individuals with high drug costs. Based on our experience as a patient advocacy group, we made the assumption that individuals with private health insurance incur less cost when prescribed oral oncology drugs.
Not all metastatic RCC patients will be eligible for lenvatinib and pembrolizumab because some patients may have already received prior systemic therapy. We cannot estimate the number of patients who have received prior therapy.
Disease Experience
The access problems are so difficult that in many hospitals and cancer centres across Canada, such as those in Ontario, a new type of social worker known as a drug access navigator has been established (and funded) to assist patients and clinicians navigate the byzantine treatment access structures. In Ontario, the organization that supports these navigators is known as the Oncology Drug Access Navigators of Ontario (ODANO). They describe the problem that their association works to resolve as follows: Drugs are an important part of cancer treatment, yet patients often have difficulty accessing coverage for the most effective medicines. The complexity of cancer drug coverage in Canada can overwhelm patients and families.
And
For example, although cancer drugs administered in hospitals and clinics are often offered free of charge to patients, half of all new cancer drugs are taken at home and, therefore, many are not covered by the public health system. Unfortunately, many of our patients do not have any private insurance. If a patient is fortunate enough to have private coverage, many drug plans require a 20% co-payment, which can quickly become a financial burden to patients on expensive medications.
British Columbia, Alberta, Saskatchewan, Manitoba, Quebec, NWT, Yukon, and Nunavut cover the reimbursement of oral cancer drugs for all in need. Ontario and the Atlantic provinces do not.
In Ontario and Atlantic provinces, with respect to access to approved cancer treatments, there is institutional discrimination against those who are young, uninsured and who have cancer requiring take-home cancer treatment. With 60% of all new cancer drugs being developed with oral formulations, this issue urgently needs to be resolved through policy change. Traditionally, cancer treatments were administered to patients by an IV in the hospital. Over the past 15 or so years, an increasing number of effective cancer treatments can be taken at home by pill or injection. Take-home cancer medications are now a fundamental part of today’s cancer treatments and should be recognized equally within our health care systems. Patients requiring an intravenous treatment can start that medication as soon as needed and don’t face any financial or administrative burdens provided the drug is included on the provincial formulary.
However, when take-home cancer medications are prescribed, patients in Ontario and the Atlantic provinces, who are under 65, and lack adequate private insurance, have to apply to a variety of funding assistance programs and ultimately pay a significant deductible or co-pay from their personal savings. In some cases, the cost to the patient might be as high as $23,400 annually, based upon Nova Scotia’s Family Pharmacare Program. To qualify for assistance programs, patients and their families have to submit significant amounts of personal and financial information and often face weeks of stressful delay in starting their cancer treatment until the paperwork and approvals are resolved.
Even for patients with private drug insurance, the reality is that many face significant co-pays, deductibles or annual/lifetime caps. For example, some private insurance plans have a cap of $2,000 for prescription drugs for the entire year. The majority of take-home cancer drugs cost more than $20,000 per year. Two-tiered pharmacare in Ontario and the Atlantic Provinces discriminates on the basis of age, income, geography, cancer type, and cancer treatment, and is financially ruining many lives.
A survey (Strategic Directions. Cancertainty & Strategic Directions IVR Report. 2017. Available at: https://d3n8a8pro7vhmx.cloudfront.net/cancertainty/pages/119/attachments/original/1490212245/CanCertaintySurvey_October2016.pdf) of over 1,600 Nova Scotians, commissioned by the CanCertainty Coalition, demonstrates that drug coverage for cancer patients is a serious and growing problem.
More than half (57 percent) of Nova Scotians expect the provincial health care system will pay for take-home cancer medications. In reality, patients will ultimately pay a significant deductible or co-pay from their personal funds.
Three out of five people in Nova Scotia (60 percent) said they would consider leaving the province if faced with having to pay for their cancer drugs. Only seven percent could afford monthly drug costs of over $200.
Experiences With Currently Available Treatments
Take-home cancer drugs (THCD) are medications used for the active treatment of cancer and are usually dispensed for administration in the home (e.g., oral chemotherapy). These drugs have become a standard treatment for many cancers and present opportunities for patients, providers, and the health system. However, flaws in our current drug coverage system result in some patients not being able to access these treatments.
The term “financial toxicity” describes the distress and hardship arising from the financial burden of cancer treatment. Even in counties with government funded universal healthcare, financial toxicity is an issue for cancer patients and their families. Financial toxicity comes in many forms: out of pocket costs, lost income, travel expenses etc. Patients may deal with their financial burden by delaying or foregoing care. They may take less medication than prescribed, utilize over-the-counter drugs in place of prescribed medications, decline procedures, and skip appointments in an attempt to defray costs. The combination of high drug prices, particularly of oral targeted anticancer drugs, and increased cost sharing has made patients more vulnerable to medication non- adherence. Patients who are younger, have lower income, and are uninsured appear to be at greater risk of medication non- adherence. Although government funded public healthcare exists in many very high development index countries, financial toxicity is still common among cancer patients and caregivers. The evidence suggests that those with a shorter time since diagnosis, not currently working, and with more severe cancers have higher rates of financial toxicity, including stress and strain (Longo, C.J., Fitch, M.I., Banfield, L. et al. Financial toxicity associated with a cancer diagnosis in publicly funded healthcare countries: a systematic review. Support Care Cancer 28, 4645–4665 (2020). https://doi.org/10.1007/s00520-020-05620-9).
An unfunded oral oncology drug is financially toxic compared to a funded IV oncology drug. The disease experience of cancer patients that require oral drugs is a dual track of disease and economic hardships. After receiving their diagnosis, deciding on a medication, and dealing with the side effects, patients in Ontario and the Atlantic provinces have to consider the financial side of their diagnosis. “Hearing that you have cancer is devastating. Finding out that you can’t pay for the medication that will make you well is catastrophic. It doesn’t have to be this way” (X, Ontario).
The financial side of cancer treatment is unnecessarily burdensome. “When you are going through any kind of sickness, whatever the severity of it, the last thing you should have to worry about is your medication cost” (X, Ontario). In addition to dealing with cancer, and not being well enough to work, patients in Ontario and the Atlantic provinces spend days on end, sometimes months, wading through paperwork in order to get approval for coverage of the oral chemotherapy that has kept them alive. Because some cancer treatments are not automatically funded, treatment is delayed for many patients. They wait weeks for government approval before dealing with insurance companies and pharmacies to receive their prescription. Patients often pay out of pocket for the first few weeks of their treatment, which they may not be reimbursed for. “My doctor prescribed a new drug that is not covered by the government therefore I had to find insurance to cover it which costs around $5000.00 a month, I came up with insurance to cover it but I had to pay the pharmacy first then the insurance would reimburse me some time later. My problem I do not have the $5000 to pay out let alone wait till they reimburse me” (X, Ontario).
“Cancer isn’t fair, but access to treatment should be!” (X, Ontario).
Experience With Drug Under Review
CanCertainty’s focus for this submission is on issues related the distress and hardship arising from the financial burdens associated with cancer treatment. If lenvatinib and pembrolizumab were to be reimbursed for patients with RCC, there would be some patients under 65 in Ontario and Atlantic Canada that would face significant financial and administrative barriers in accessing treatment.
Companion Diagnostic Test
N/A
Anything Else?
Equitable Access
We recommend that pCODR, when assessing and reporting on implementation issues with respect to lenvatinib and pembrolizumab, examine the issues of equitable access across all Canadian jurisdictions.
Safety
With respect to implementation, we believe pCODR should also examine the issue of safety with respect to take-home cancer drugs. From 2006 to 2001, it is estimated that Ontario’s computerized provider entry system, the Oncology Patient Information System (OPIS) prevented 8,500 adverse drug events, 5,000 physician office visits, 750 hospitalizations, 57 deaths, and saved millions in annual healthcare costs. But, this system is only used for only IV Drugs (eHealth Ontario. Cancer Care Ontario and eHealth Ontario Partner to Deliver Safer Chemotherapy Treatment. Toronto, ON: 2011. Available at: https://ehealthontario.on.ca/en/news/view/cancer-care-ontario-ehealth-ontario-partner-to-deliver-safer-chemotherapy). As a result, patients requiring take-home cancer drugs (THCD) in Ontario are (currently) subject to significant safety challenges, and health systems are subject to significant annual costs (physician office visits, hospitalizations etc).
In Ontario, dispensing and delivery models for THCD have been documented to be inconsistent and pose serious safety concerns for patients and their families. Some patients receive their medication from hospital pharmacies, some from specialty pharmacies, and some from community pharmacies that lack specialization and training in the handling of toxic cancer medications. This contrasts with the robust guidelines and clear processes that have been developed for intravenous cancer drugs (IVCD) where delivery is more comprehensive, organized, safer and patient-centred than THCD. There are numerous known safety and quality deficits related to the current method of community dispensing of THCD including incorrect dosing and handling, limited monitoring and non-adherence (which can lead to under or overdosing), serious toxicity, morbidity, and mortality. Patient lives and well-being are at stake. Ontario urgently needs to reform its systems for THCD dispensing that embed high-quality, safe practices that recognize the unique aspects of these drugs.
In April 2017, Cancer Care Ontario organized the Oncology Pharmacy Task Force with the mandate to advise Cancer Care Ontario (CCO) on how to enhance the current system for THCD delivery to optimize quality and safety; and subsequently, to deliver a report to the Ministry of Health and Long-Term Care (MOHLTC) based on the findings of the Task Force. The Task Force included representatives from patient advocacy groups, pharmacy and pharmacist associations, regulatory and standard setting organizations, and subject matter experts. On March 25th, 2019 the report was completed and published on the CCO website, but there has been no follow up or action taken to the many important recommendations. The report Enhancing the Delivery of Take-Home Cancer Drugs in Ontario (March 2019) can be found at: https://www.cancercareontario.ca/sites/ccocancercare/files/guidelines/full/1_CCO_THCD_Report_25Apr2019.pdf
CanCertainty suggests that pCODR examine the issues of safety and dispensing when examining and reporting on issues concerning pan-Canadian implementation of lenvatinib and pembrolizumab.
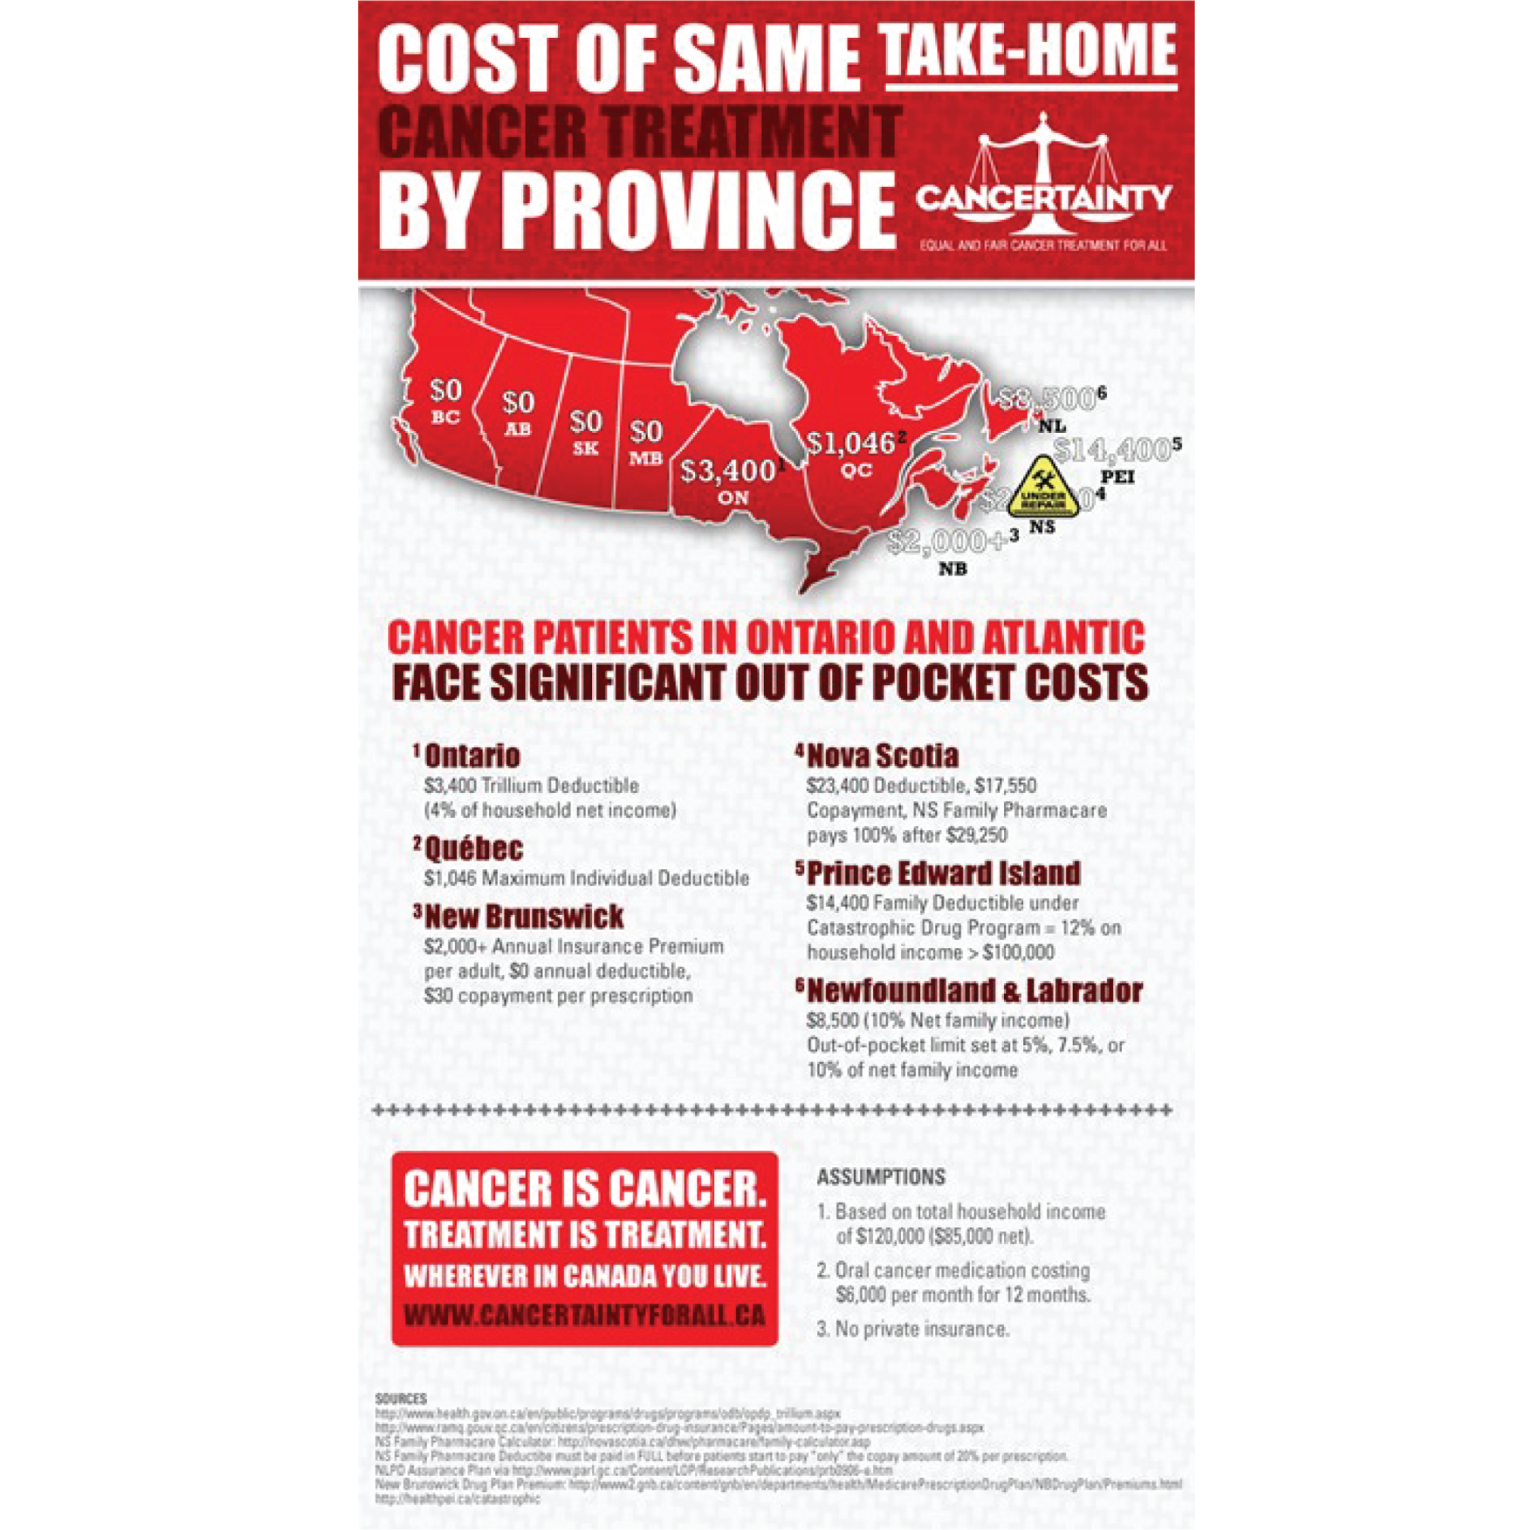
Patient Group Conflict of Interest Declaration — CanCertainty
To maintain the objectivity and credibility of the CADTH reimbursement review process, all participants in the drug review processes must disclose any real, potential, or perceived conflicts of interest. This Patient Group Conflict of Interest Declaration is required for participation. Declarations made do not negate or preclude the use of the patient group input. CADTH may contact your group with further questions, as needed.
Did you receive help from outside your patient group to complete this submission? If yes, please detail the help and who provided it.
This submission was completed exclusively using CanCertainty resources and personnel and contract personnel.
Did you receive help from outside your patient group to collect or analyze data used in this submission? If yes, please detail the help and who provided it.
Data was collected and analyzed using CanCertainty personnel/contract personnel.
List any companies or organizations that have provided your group with financial payment over the past two years AND who may have direct or indirect interest in the drug under review.
Table 2: Conflict of Interest Declaration for CanCertainty
Company | Check Appropriate Dollar Range | |||
|---|---|---|---|---|
$0 to 5,000 | $5,001 to 10,000 | $10,001 to 50,000 | In Excess of $50,000 | |
Merck | — | — | X | — |
I hereby certify that I have the authority to disclose all relevant information with respect to any matter involving this patient group with a company, organization, or entity that may place this patient group in a real, potential, or perceived conflict of interest situation.
Position: Co-Lead
Patient Group: CanCertainty
Date: Dec 9, 2021
Kidney Cancer Canada
About Kidney Cancer Canada
Kidney Cancer Canada (KCC) is a national community of patients, caregivers and health professionals who work to provide every Canadian touched by kidney cancer with support, education and advocacy for their care pathways and treatment options. www.kidneycancercanada.ca
Information Gathering
In 2020 Kidney Cancer Canada, helped design and promote an international online survey of patients and caregivers in affiliation with the International Kidney Cancer Coalition (IKCC). This survey included 2,012 respondents (patients and caregivers) from 41 countries sharing their experiences and insights. Canada had 241 respondents of which 205 (86%) were patients diagnosed with kidney cancer, and 24 (10%) were a caregiver to someone who has been diagnosed with kidney cancer, and 2 (0.8%) were undisclosed. The survey was designed to explore and benchmark worldwide patient experience in:
Patient knowledge, expectations of treatment and shared decision making
Clinical trials, research awareness and sources of information
Quality of life and overall health status of respondents
The 2020 survey also included special areas of inquiry including:
Biopsy practice: experience and willingness to repeat in the future
Physical activity: to what extent do patients undertake physical activity as part of their overall survivorship?
Patient Health Engagement Scale (PHE-S): to what extent do patients make sense of their health status and their perceived role in the healthcare journey?
The IKCC 2020 Patient Survey Global Report and the Canada report is available here.
Further, Kidney Cancer Canada attempted to contact patients who had experience with this new treatment (lenvatinib in combination with pembrolizumab for the first-line treatment of patients with advanced renal cell carcinoma). KCC contacted four Canadian physician investigators who had patients enrolled in the CLEAR trial1 and asked that they connect KCC with these patients. Only one patient provided permission to be contacted by KCC, and on November 26, 2021, KCC conducted a guided telephone interview with this patient to understand his experiences and challenges with kidney cancer and experiences with the treatment: lenvatinib + pembrolizumab for the 1st line treatment of renal cell carcinoma.
Also, in support of a previous patient submission for a treatment being reviewed by CADTH in 2018, Kidney Cancer Canada conducted an online survey of patients and caregivers in June 2018 to assess the challenges kidney cancer patients and caregivers face because of the disease. Some results from that survey are again presented herein.
This report reflects the results of IKCC survey, our 2018 survey of patients and caregivers, and our one-on-one interview with a patient with experience with the treatment under review. This submission is also informed by intelligence and insights Kidney Cancer Canada has garnered from more than 15 years of experience in patient support, research and advocacy in Canada related to kidney cancer.
Disease Experience
The Canadian Cancer Society (CCS) estimates that (in 2017) there were 6,600 new cases of kidney cancer diagnosed in Canada. It is the sixth most common cancer in men and the eleventh most common cancer in women. Of the 6,600 Canadians being diagnosed annually with kidney cancer, approximately 25% will be diagnosed as stage IV. Metastatic renal cell carcinoma (mRCC) is a fatal disease with no known cure. When Renal Cell Carcinoma is diagnosed, while the disease is confined to the kidney – surgery to remove the cancer may be the only treatment needed. However, for patients with stage IV disease, the survival rate is poor with less than 10% of these patients surviving for 5 years or longer. Nonetheless, kidney cancer survival has significantly improved over the last dozen years as a result of new innovative treatments and improved access to those treatments.
The enduring challenge for patients with mRCC, and the physicians who treat it, is that complete response to treatment with a single agent is rare with eventual resistance to existing available treatment being almost certain. New treatments and new treatment combinations are consistently improving the outcomes for patients with mRCC. Even with the improvements to survival for RCC patients, there remains great need for better therapy.
Experiences With Currently Available Treatments
From 2018 KCC Patient Survey: Side Effects/Toxicity
We asked patients and caregivers: What side effects have you experienced with your current or previous therapies used to treat kidney cancer? Please select all that apply.
78 patients responded to this question with the following reported side effects: Pneumonia n=5 (6.5%), Diarrhea n=52 (67%), Nausea/Vomiting n=29 (37%), Skin problems including itching (pruritus) and rash n=31 (40%), Pain n=24 (31%), Fever n=7 (9%), Fatigue/Lack of Energy n=62 (79%), Shortness of breath n=22 (28%), Bleeding n=12 (15%), Loss of appetite n=41(53%), Hand-foot syndrome n=35 (45%), Other (including mouth sores, coughing, insomnia,) n=24 (31%).
Table 3: Side Effects of Treatments
1 (Completely intolerable) | 2 | 3 | 4 | 5 (Very tolerable) | Weighted Average (WA) |
|---|---|---|---|---|---|
3pts | 18pts | 32pts | 17pts | 8pts | 3.08 |
Question asked: In general, how would you rate the side effects of these treatments. 1 is "completely intolerable" and 5 is "very tolerable". In general, how would you rate the side effects of these treatments? N=79
Table 4: Importance to Make a Choice of Drug(s) Based Upon Each Different Drug’s Known Side Effects
1 (Not important) | 2 | 3 | 4 | 5 (Very important) | Weighted Average (WA) |
|---|---|---|---|---|---|
2pts | 4pts | 12pts | 5pts | 49pts | 4.15 |
Question asked: Please rate on a scale of 1 – 5 how important it was for you and your physician to be able to make a choice of drug(s) based upon each different drug’s known side effects? 1 is "not important" and 5 is "very important". How important it was for you and your physician to be able to make a choice of drug(s) based upon each different drug’s known side effects? N=72
Conclusion
While tremendous advancements have been made in drug treatments for advanced RCC different patients can have different responses to the same drug. With 27 percent of patients indicating that they find current treatments difficult to tolerate (having selected 1 or 2 in the Q. how would you rate the side effects of these treatments?), it is clear that patients require drug options that are less toxic. When assessing the value of a new drug, the importance overall of treatment choice and patient preference must be recognized, and, for patients who find a specific prescribed drug intolerable, treatment alternatives within that line of therapy are extremely important.
From the 2020 IKCC 2020 Patient Survey Canada Report
Barriers to treatment
59% of respondents (n=138) reported experiencing no barriers to treatment, relative to 44% (n=839) globally. The most commonly experienced barriers reported from respondents in Canada were:
Wait time to treatment – 35% of respondents (n=33)
Other barrier – 24% (n=23)
No specialty doctor locally – 22% (n=21)
Lack of personal support – 17% (n=16)
No access to up-to-date treatment or equipment – 16% (n=15) >
Stage of kidney tumour(s) today
At the time of completing the survey, 47% (n=108) of respondents in Canada indicated that they had no evidence of disease / were ‘cured’. 6% (n=13) of respondents noted that their tumour was still only within the kidney (stage 1 or 2). Whereas 35% (n=80) of respondents indicated that their cancer was advanced/metastasized.
Biopsy practice
Overall, 48% (n=109) of respondents in Canada had a biopsy, 35% (n=79) of a kidney growth and 13% (n=30) of another part of their body. This is compared with 45% (n=829) of respondents globally, of which 30% (n=550) were biopsies of a kidney growth and 15% (n=279) were biopsies of another site.
On the contrary, 32% (n=73) of respondents in Canada indicated that their tissue was looked at after they had surgery to remove it. Globally, this was 36% (n=664) of respondents. A further 16% (n=35) reported that they were never offered a biopsy – 17% (n=314) globally while 4% (n=8) were offered a biopsy but refused the procedure (3%, n=47 globally).
Of the respondents in Canada who did not have a biopsy, 64% (n=72) would be willing to have one in the future.
Understanding of care and treatment
The survey also asked respondents to consider their level of understanding of their care and treatment today.
In Canada, over 60% of respondents agreed/strongly agreed that they understood the following:
surgical options (90%, n=197 of respondents, globally 90%, n=1637)
active surveillance (83%, n=169 of respondents, globally 75%, n=1272)
the role of nutrition/lifestyle on their wellbeing (79%, n=175 of respondents, globally 78%, n=1393)
local guidelines for kidney care follow-up (70%, n=148 of respondents, globally 64%, n=1081)
palliative care (64%, n=114 of respondents, globally 65%, n=985)
targeted therapy options (62%, n=117 of respondents, globally 71%, n=1140)
In Canada, more than one in five respondents disagreed/strongly disagreed that they understood the following:
ablative therapy options (25%, n=46 of respondents, globally 19%, n=293)
complementary therapies (e.g., meditation, etc.) (23%, n=46 of respondents, globally 16%, n=272)
Clinical trials, research awareness and sources of information
KCC and IKCC recognize clinical trials as the cornerstone for advancing treatment in kidney cancer.
Awareness of clinical trials: 48% of respondents in Canada (n=109) indicated that no one spoke to them about cancer clinical trials. Of those that did discuss cancer clinical trials, 22% (n=25) indicated that clinical trials had been discussed with a patient organization/support group, and 80% (n=93) said with a doctor/nurse.
Taking part in clinical trial: 34% (n=76) of respondents who were residents of Canada were invited to participate in a cancer clinical trial (compared with 31% (n=549) globally). 64% (n=69) of respondents
Improved Outcomes
From 2018 KCC Patient Survey
While new therapies in the last 15 years have led to improved patient outcomes overall, there is a general need for therapies that do more to improve the outlook for patients with advanced disease. Additionally, there is a need for effective predictive and prognostic biomarkers to guide treatment along with a need to better detect disease at earlier stages. There is also a need for more effective therapies with manageable side effects that escape resistance mechanisms to antiangiogenic therapy.
Importance for new therapy | 2 | 3 | 4 | 5 (Extremely important) | Total | Weighted Average | |
|---|---|---|---|---|---|---|---|
Improvement to your physical condition such as decreasing the size of (or stabilizing) the tumor(s), reducing pain, improving your breathing. | 4 | 0 | 2 | 20 | 89 | 115 | 4.65 |
Overall Improvement to your quality of life. | 3 | 1 | 5 | 11 | 93 | 113 | 4.68 |
Chance for long-term stability or reduction of disease. | 3 | 0 | 2 | 6 | 105 | 116 | 4.81 |
Questions asked to patients/caregivers: If you were to consider taking a new therapy for your kidney cancer, please rate the following on a scale of 1 - 5. 1 is "not important" and 5 is "extremely important". If you were to consider taking a new therapy for your kidney cancer, please rate the following on a scale of 1 - 5. 1 is "not important" and 5 is "extremely important".
Conclusion
Access to new effective treatment alternatives is critical to afford patients the opportunity to improve outcomes overall, halt disease progression, to control drug resistance, overcome drug resistance mechanisms. More choice and improved treatments enable patients and oncologists to individualize treatment plans according to specific disease/treatment history and contraindications, thereby enabling the best possible outcomes and quality of life for the patient.
Experience With Drug Under Review
Recognizing the small number of patients in Canada that were enrolled in the CLEAR trial, KCC was able to interview only one patient with experience with the treatment (lenvatinib + pembrolizumab for the 1st line treatment of renal cell carcinoma). KCC conducted a guided telephone interview with this patient to understand his experiences and challenges with kidney cancer and experiences with the treatment (lenvatinib + pembrolizumab for the 1st line treatment of renal cell carcinoma).
Excerpts from the patient interview with “GS”:
GS is a male, 80 years of age. Retired. Living in Southwestern Ontario.
GS was originally diagnosed with kidney cancer in his left kidney in 1994. After this diagnosis he underwent a nephrectomy, which appeared at the time to be curative.
He had routine follow-up for many years during which time he was diagnosed with prostate cancer, and underwent a prostatectomy, which appeared to be curative for prostate cancer.
He had routine follow-up for the next few years and was then diagnosed with bladder cancer. GS had 7 or 8 surgeries (cystectomies) which resulted in there being no remaining evidence of tumors on his bladder. Following 5 years of follow-up, his urologist told him that there was “no need for further follow up with respect to his bladder cancer.”
During this medical odyssey, GS had routine check-ups as part of his post nephrectomy follow-up.
In 2017 GS suddenly experienced rapid weight loss, losing 40lbs within a couple of months. This led him to see his urologist, who ordered scans, which revealed tumors on his pancreas, which was (mis) diagnosed as pancreatic cancer. He was referred to a surgeon who determined that the tumors were inoperable. At that time, they biopsied one of the tumors, and it was determined that it was not pancreatic cancer, but instead metastatic renal cell carcinoma (mRCC). GS was relieved, stating to the interviewer: “having pancreatic cancer would not have been very nice.”
GS was then referred to a medical oncologist for treatment for his kidney cancer. GS asked his oncologist if there were any clinical trials that he would qualify for as GS’s wife’s doctor had relayed to GS that if he had an opportunity to be in a clinical study, he should take advantage of it. So, his oncologist enrolled GS in the CLEAR study, where he was on the lenvatinib + pembrolizumab arm of the study.
GS commenced this combination treatment with pembrolizumab being administered once every three weeks, and lenvatinib being taken (orally) every day. With respect to lenvatinib, his starting dose was 14 mg, but that was reduced to 10 mg daily. About 4 or 5 cycles in with the pembrolizumab he developed a full body rash. It started as a light rash started then blossomed to total body rash for which he was prescribed prednisone. He is still on 5mg daily prednisone, but he is unsure why. He was then taken off pembrolizumab but has been taking lenvatinib daily for the last 3 years.
GS reports that he goes in for a scan every 8 or 12 weeks. GS reports that the scans have revealed both tumors have shrunk somewhat. But also, importantly, neither of the tumors have grown. “I was about 1.5 years into treatment when the radiologist noted a small shrinkage. I believe that the fact they aren’t growing is a win!”
We asked if the tumors remain inoperable. A: “One of these days I will ask about that, but they likely remain inoperable due to blood flow to the tumors. It is quite a mess. This is not going to be pleasant.”
He feels that his cancer is well managed, and he is enjoying reasonable quality of life at this time. His daily exercise is walking the dog.
We asked GS about side effects related to treatment:
Have you experienced any treatment related diarrhea? A: “No, but ever since being on lenvatinib I have very watery bowel movements. But that is not particularly troubling.”
Have you experienced hypertension related to treatment? A: “No. I take my own blood pressure at home daily and every 3 weeks at the clinic. I have no Issues”
Have you experienced stomatitis (swelling and redness of the lining of your mouth)? A: “No. I have never had swelling and redness of the lining of my mouth.”
What about hypothyroidism (underactive thyroid disease)? A: “I have blood work every three weeks and have had a little bit of an issue with my thyroid, but nothing that requires intervention. I am within manageable levels.”
Have you experienced treatment-related fatigue? A: “I do not have the energy that I had four years ago. Part of that problem is no doubt due to my weight loss. My dietician at the cancer clinic recommended severe changes to diet. I am still way underweight. I always weighed about 190 lbs, but am now 142 lbs.”
Have you ever experienced hand-foot syndrome? A: “No. Never”
What about treatment related decreased appetite? A: “I still get hungry, but I don’t eat nearly as much as I did before this cancer recurrence. My portions are small.”
What about nausea? A: “Sometimes if I try to eat too much, I get a slight feeling of nausea, but it has never led to vomiting.” What about treatment related dysgeusia (where a person's perception of taste is altered)? A: “No”
What about treatment-related weakness; lack of energy and strength (asthenia)? A: “Yes, by all means. This could be due to my weight loss, or it might be due to treatment or disease. Or all these things.”
What about treatment-related dysphonia (having an abnormal voice/ hoarseness)? A: “For awhile, about two years into treatment, my voice was hoarse. But it is back to normal.”
We asked: Do you find this to be a tolerable treatment? A: “Yes, very much so.”
We asked: Have you had discussions about other treatments? A: “My doctor said we will discuss other treatments when necessary. I think that the disease is currently stabilized”
Conclusion: The patient in this survey with experience with lenvatinib + pembrolizumab reported that the treatment was very tolerable, with manageable side-effects, and decent QoL. The patients also reported that this drug combination was highly effective in controlling his cancer.
Comment: Based on the results of CLEAR, lenvatinib + pembrolizumab affords a significant benefit over pembrolizumab + lenvatinib for 1st line mRCC in that
there is a much lower probability of liver toxicity with lenvatinib+pembrolizmab (compared to axitinib+pembrolizumab).
there is a much higher response rate and PFS with lenvatinib+pembrolizmab (compared to axitinib+pembrolizumab).
Companion Diagnostic Test
N/A
Anything Else?
The treatment paradigm for kidney cancer is undergoing significant and rapid change.
Kidney Cancer Canada recognizes that Health Technology Assessment (HTA) committees may encounter some uncertainty in the clinical data for some of these treatments, and that the (relatively) rapid onboarding of new treatments may also result in lack of clarity as to the optimal sequencing of these new agents. Of critical importance however is that these new treatments have the potential to dramatically improve outcomes for patients and give physicians reason to hope that they will soon be able to provide better treatments to their patients.
Kidney Cancer Canada urges the pCODR expert review committee to allow for the prospective collection of real world survival data, real world data on side effects and toxicities, real world data on cost-effectiveness, and real world data on utilization (based on patterns of care and toxicities) to resolve any issues of uncertainty it may encounter during their review of the clinical data for any current and forthcoming treatments for renal cell carcinoma.
The affiliated research arm of Kidney Cancer Canada, known as the Kidney Cancer Research Network of Canada (KCRNC), is uniquely positioned to provide the real-world evidence necessary to resolve/answer, over time, the uncertainties HTA committees may encounter during a drug review for treatments for renal cell carcinoma.
The KCRNC, in 2009 established a centralized Canadian kidney cancer database called the Canadian Kidney Cancer information system (CKCis) to collect data from medical centers across the country. CKCis is a web-based national registry supporting the development of clinical and basic research in kidney cancer across Canada. It contains pertinent retrospective, as well as prospective de-identified patient data collected from consented patients who have been diagnosed and treated for renal cell carcinoma.
CKCis is a flexible database platform that can integrate different data needs to accommodate creative innovations considered for research, including those to inform reimbursement decision-making. Data fields are updated as new information emerges concerning the treatment of renal cell carcinoma.
CKCis has now been in operation for over 10 years. Sixteen Canadian centers actively accrue kidney cancer patients into the CKCis registry, and as of March 2021, more than 15,300 patients are enrolled, and their data is being collected. CKCis is now central to the activities of the KCRNC. The data has matured enough to inform the publication of several key manuscripts with more in the pipeline. The network continues to bring together all interested clinicians and researchers in kidney cancer and supports the development of active kidney cancer research programs in Canada.
Patient Group Conflict of Interest Declaration — Kidney Cancer Canada
To maintain the objectivity and credibility of the CADTH reimbursement review process, all participants in the drug review processes must disclose any real, potential, or perceived conflicts of interest. This Patient Group Conflict of Interest Declaration is required for participation. Declarations made do not negate or preclude the use of the patient group input. CADTH may contact your group with further questions, as needed.
Did you receive help from outside your patient group to complete this submission? If yes, please detail the help and who provided it.
No. This patient submission was completed using Kidney Cancer Canada resources.
Did you receive help from outside your patient group to collect or analyze data used in this submission? If yes, please detail the help and who provided it.
No.
List any companies or organizations that have provided your group with financial payment over the past 2 years AND who may have direct or indirect interest in the drug under review.
Table 6: Conflict of Interest Declaration for Kidney Cancer Canada
Company | Check Appropriate Dollar Range | |||
|---|---|---|---|---|
$0 to 5,000 | $5,001 to 10,000 | $10,001 to 50,000 | In Excess of $50,000 | |
Eisai | — | — | X | — |
Merck | — | — | — | X |
BMS | — | — | — | X |
Pfizer | — | — | — | X |
Ipsen | — | — | X | — |
I hereby certify that I have the authority to disclose all relevant information with respect to any matter involving this patient group with a company, organization, or entity that may place this patient group in a real, potential, or perceived conflict of interest situation.
Position: Executive Director
Patient Group: Kidney Cancer Canada
Date: December 16, 2021
Clinician Input
Ontario Health (Cancer Care Ontario) Genitourinary Cancer Drug Advisory Committee
About Ontario Health (Cancer Care Ontario) Genitourinary Cancer Drug Advisory Committee
OH-CCO’s Drug Advisory Committees provide timely evidence-based clinical and health system guidance on drug-related issues in support of CCO’s mandate, including the Provincial Drug Reimbursement Programs (PDRP) and the Systemic Treatment Program.
Information Gathering
Discussed jointly via email.
Current Treatments
First-line systemic treatment for advanced kidney cancer (ie advanced renal cell carcinoma, aRCC) considers the IMDC risk categorization / groups. The following reflect available options in the Canadian context:
All IMDC risk groups: Pembrolizumab + Axitinib; alternatives Sunitinib, Pazopanib.
Intermediate/poor risk groups: Pembrolizumab + Axitinib; Nivolumab + Ipilimumab; alternatives Sunitinib, Pazopanib.
Subsequent line options include therapies not already used in the aRCC setting, such as: Sunitinib, Pazopanib, Cabozantinib, Axitinib, Nivolumab
Recommendations for aRCC therapy can be found at this reference: https://pubmed.ncbi.nlm.nih.gov/33830005/
All listed drugs do target symptom in patients such that patients that respond to therapy may feel better and have less pain from painful metastatic lesion. The TKIs are antiangiogenic and modify the biology of the RCC. The PD-(L)1 checkpoint inhibitors leverage the immune system allowing it to target the cancer cells more effectively.
Treatment Goals
Improvement in overall survival (OS) and progression free survival (PFS) with a reduction in the size (objective response rate/ORR) of metastatic lesions in patients with aRCC, with an improved quality of life.
Treatment Gaps (Unmet Needs)
Considering the treatment goals, please describe goals (needs) that are not being met by currently available treatments.
This combination significantly improves outcomes for many patients with aRCC and is an important new treatment; however, patients with aRCC are still not routinely cured by available therapies and do become resistant to treatment over time, and most patients still die from their disease. Further options for refractory disease are an unmet need.
Which patients have the greatest unmet need for an intervention such as the drug under review?
As stated previously, aRCC patients in general still require further options available given that resistance to therapy is not uncommon. Regarding this drug under review, Lenvatinib plus pembrolizumab has the highest ORR rate (71%) and CR rate (16%) seen with immunotherapy/TKI combinations and the longest PFS (23.9 months) with benefit seen across all IMDC risk groups. This combination provides a high probability of alleviating symptoms in symptomatic patients and has been shown to improve QOL.
Place in Therapy
How would the drug under review fit into the current treatment paradigm?
The combination of Lenvatinib plus pembrolizumab will provide an additional, efficacious first-line systemic therapy option for aRCC, along with axitinib/pembrolizumab, nivolumab/ipilimumab (IMDC intermediate/poor risk), sunitinib, and pazopanib. This combination would be available for all risk groups, whereas Nivo/Ipi restricted to intermediate/poor.
Please indicate whether or not it would be appropriate to recommend that patients try other treatments before initiating treatment with the drug under review. Please provide a rationale from your perspective.
There is not available high-level data to recommend other systemic treatments before initiating the drug combination under review. Treatment selection will be made after patient and treating oncologist discussion of the options. Some factors that may be considered are IMDC risk group, suitability for immunotherapy, tumour burden in terms of requiring rapid response, and patient preference. It would be very uncommon. Occasional patients may be switched to Lenvatinib-pembrolizumab if they experienced severe toxicity to ipilimumab in their first or second dose and these patients would need to be assessed on a case-by-case basis.
How would this drug affect the sequencing of therapies for the target condition?
The general principle would remain (as in the Current Treatments section) that next line options would involve TKIs not already used in the first line setting. For example, subsequent line options after Lenvatinib + Pembrolizumab could include cabozantinib and/or axitinib.
Which patients would be best suited for treatment with the drug under review?
Lenvatinib plus pembrolizumab was found in to have activity and improve OS, PFS, ORR in aRCC patients in the ITT population across IMDC risk groups. As per 6.2, there is not high-level data to choose amongst first line options. However, this combination would be especially useful for very symptomatic patients that need a good response in a short time.
How would patients best suited for treatment with the drug under review be identified?
Patients with aRCC across any IMDC risk group who are suitable for immunotherapy and TKI therapy would be potentially eligible for systemic treatment with lenvatinib plus pembrolizumab.
Which patients would be least suitable for treatment with the drug under review?
There is no available, high-level data regarding tumour characteristics of aRCC patients that would make treatment “least suitable”. Patients with pre-existing autoimmune conditions requiring corticosteroid use more than 10mg/day of prednisone or needing other systemic treatments for autoimmune condition(s) are at potentially higher risk for side effects (similar considerations with pembrolizumab/axitinib and nivolumab/ipilimumab).
Is it possible to identify those patients who are most likely to exhibit a response to treatment with the drug under review?
There are currently no clinical or pathological biomarkers that can predict the best therapy for an individual patient (or who are most likely to exhibit a response).
What outcomes are used to determine whether a patient is responding to treatment in clinical practice?
Standard of care to assess patient benefit to therapy include history, physical examination, and radiographic imaging (ie most commonly CT scans). This is identical to what is done with other currently funded first line options.
What would be considered a clinically meaningful response to treatment?
Standard of care for meaningful response/benefit to patient include improved or stable clinical status (ie feeling or functioning better) and stable disease or shrinkage of disease on radiographic imaging (ie CT scan).
How often should treatment response be assessed?
Clinical assessment per patient/oncologist discretion (ie in person or virtual) and imaging usually every 2-3 months.
What factors should be considered when deciding to discontinue treatment?
Disease progression or serious side effects from pembrolizumab (ie high-grade immune-related adverse event, irAE) or high-grade AE from lenvatinib despite dose reduction or schedule change.
What settings are appropriate for treatment with the drug under review?
Outpatient clinic setting
For non-oncology drugs, is a specialist required to diagnose, treat, and monitor patients who might receive the drug under review?
N/A
Additional Information
While there is another available option in the first-line setting for aRCC that employs checkpoint inhibition plus VEGF-TKI (pembrolizumab+axitinib), the combination under review does portend a very high response rate and a long progression-free survival – which are relevant clinical endpoints and meaningful to patients.
Conflict of Interest Declarations — Ontario Health (Cancer Care Ontario) Genitourinary Cancer Drug Advisory Committee
To maintain the objectivity and credibility of the CADTH drug review programs, all participants in the drug review processes must disclose any real, potential, or perceived conflicts of interest. This conflict of interest declaration is required for participation. Declarations made do not negate or preclude the use of the clinician group input. CADTH may contact your group with further questions, as needed. Please see the Procedures for CADTH Drug Reimbursement Reviews (see section 6.3) for further details.
Did you receive help from outside your clinician group to complete this submission? If yes, please detail the help and who provided it.
OH-CCO provided secretariat support to the DAC in completing this input.
Did you receive help from outside your clinician group to collect or analyze any information used in this submission? If yes, please detail the help and who provided it.
No
List any companies or organizations that have provided your group with financial payment over the past two years AND who may have direct or indirect interest in the drug under review. Please note that this is required for each clinician who contributed to the input — please add more tables as needed (copy and paste). It is preferred for all declarations to be included in a single document.
Declaration for Clinician 1
Name: Dr. Girish Kulkarni
Position: Genitourinary Drug Advisory Committee Lead
Date: 09/12/2021
Table 7: COI Declaration for Ontario Health (Cancer Care Ontario) Genitourinary Cancer Drug Advisory Committee — Clinician 1
Company | Check Appropriate Dollar Range | |||
|---|---|---|---|---|
$0 to 5,000 | $5,001 to 10,000 | $10,001 to 50,000 | In Excess of $50,000 | |
N/A | — | — | — | — |
Declaration for Clinician 2
Name: Dr. Aly-Khan Lalani
Position: Genitourinary Drug Advisory Committee Member
Date: 09/12/2021
Table 8: COI Declaration for Ontario Health (Cancer Care Ontario) Genitourinary Cancer Drug Advisory Committee — Clinician 2
Company | Check Appropriate Dollar Range | |||
|---|---|---|---|---|
$0 to 5,000 | $5,001 to 10,000 | $10,001 to 50,000 | In Excess of $50,000 | |
Merck | X | — | — | — |
Eisai | X | |||
Declaration for Clinician 3
Name: Dr. Sebastien Hotte
Position: Genitourinary Drug Advisory Committee Member
Date: 09/12/2021
Table 9: COI Declaration for Ontario Health (Cancer Care Ontario) Genitourinary Cancer Drug Advisory Committee — Clinician 3
Company | Check Appropriate Dollar Range | |||
|---|---|---|---|---|
$0 to 5,000 | $5,001 to 10,000 | $10,001 to 50,000 | In Excess of $50,000 | |
Merck | X | — | — | — |
Eisai | — | X | — | — |
Kidney Cancer Research Network of Canada
About Kidney Cancer Research Network of Canada
The Kidney Cancer Research Network of Canada (KCRNC) is a virtual and inclusive national network of researchers committed to the facilitation of kidney cancer research to enhance the knowledge of kidney cancer and its treatment.
Information Gathering
Please describe how you gathered the information included in the submission.
Information used to inform this submission was from clinical experience treating patients with metastatic renal cell carcinoma (mRCC), from reading the published data on relevant clinical trials, and from participating in research. The clinicians that participated in preparation of this submission were investigators for the CLEAR study: A Multicenter, Open-label, Randomized, Phase 3 Trial to Compare the Efficacy and Safety of Lenvatinib in Combination with Everolimus or Pembrolizumab Versus Sunitinib Alone in First-Line Treatment of Subjects with Advanced Renal Cell Carcinoma. (ClinicalTrials.gov Identifier: NCT02811861).
Describe the current treatment paradigm for the disease.
Below lists shows currently available and commonly used therapies in most Canadian provinces.
All listed drugs do target symptom in patients such that patients that respond to therapy may feel better and have less pain from painful metastatic lesion. The TKIs are antiangiogenic and as such modify the biology of the RCC. The immunotherapies target the immune system thus allowing it to target the cancer cells more effectively.
For all IMDC risk groups: 1st line Pembrolizumab/Axitinib. 2nd line cabozantinib
For all IMDC risk groups other options:1st line sunitinib or pazopanib. 2nd line Nivolumab or Cabozantinib or Axitinib. 3rd line cabozantinib or nivolumab or axitinib
For IMDC intermediate and poor risk groups: 1st line Nivolumab/Ipilimumab. 2nd line Sunitinib or Pazopanib. 3rd line cabozantinib or Axitinibgoals
What are the most important goals that an ideal treatment would address?
Prolong overall survival (OS) and progression free survival (PFS) with a reduction in the size (objective response rate/ORR) of metastatic lesions with an improved quality of life. Treatment gaps (unmet needs)
Considering the treatment goals, please describe goals (needs) that are not being met by currently available treatments.
Not all patients respond to currently available treatments, and those who do often become resistant to therapy after some time.
Which patients have the greatest unmet need for an intervention such as the drug under review?
RCC patient in all IMDC risk groups need better therapy. Lenvatinib plus pembrolizumab has the highest ORR rate (71%) and CR rate (16%) seen with immunotherapy/TKI combinations and the longest PFS (23.9 months) with benefit see across all IMDC risk groups. This combination therefor has the highest probability of alleviating symptoms in symptomatic patients. The median OS has not been reached. Place in therapy
How would the drug under review fit into the current treatment paradigm?
Lenvatinib plus pembrolizumab will provide an additional first-line therapy option, along with Axitinib/pembrolizumab, nivolumab/ipilimumab, sunitinib, and pazopanib, for the treatment of patients with advanced or metastatic RCC with no prior systemic therapy for RCC.
Please indicate whether or not it would be appropriate to recommend that patients try other treatments before initiating treatment with the drug under review. Please provide a rationale from your perspective.
The treating oncologist will decide among the listed 1st line options based on patient factors such as RCC histology, IMDC risk group and previous autoimmune disorders. The urgency to get a response and patient wishes will play a part as well.
How would this drug affect the sequencing of therapies for the target condition?
As is currently the case for Pembro/Axi, the 2nd line therapy would be cabozantinib. Axitinib would potentially also be approved 2nd line. So far there is no third line option approved in most provinces for patients that have received an Immunotherapy/TKI combination 1st line but any TKI not given previously would theoretically be an option 3rd line.
Which patients would be best suited for treatment with the drug under review?
Lenvatinib plus pembrolizumab was found to have very good activity for all IMDC risk groups and would be especially useful for very symptomatic patients that need a good response in a short time.
How would patients best suited for treatment with the drug under review be identified?
All IMDC risk groups are potentially eligible for Lenvatinib plus pembrolizumab.
Which patients would be least suitable for treatment with the drug under review?
There are no clear contraindications to Lenvatinib plus pembrolizumab except patients with pre-existing autoimmune disorder that would be of higher risk of side effects with any form of immunotherapy.
Is it possible to identify those patients who are most likely to exhibit a response to treatment with the drug under review?
There are currently no biomarkers that can predict the best therapy for each individual patient.
What outcomes are used to determine whether a patient is responding to treatment in clinical practice?
CT imaging, history and physical examination.
What would be considered a clinically meaningful response to treatment?
A reduction in the size of metastatic disease by CT. Reduction in pain from local metastases. Generally improved wellbeing.
How often should treatment response be assessed?
Every 2-3 months
What factors should be considered when deciding to discontinue treatment?
Disease progression or serious autoimmune side effects related to Pembrolizumab. Serious side effects from Lenvatinib are rare and can usually be managed with a dose reduction.
What settings are appropriate for treatment with the drug under review?
As pembrolizumab is administered intravenously this should be done in an approved oncology infusion clinic in an outpatient hospital setting. Lenvatinib is a capsule that can be taken at home.
For non-oncology drugs, is a specialist required to diagnose, treat, and monitor patients who might receive the drug under review?
These patients should generally be seen and treated by a medical oncologist. Also, there are a small number of oncological urologists in Canada that do systemic therapy and have the required experience and expertise to administer this therapy. Additional information
Is there any additional information you feel is pertinent to this review?
A significant benefit for this combination (Len/Pembro) vs. the Pembro/Axi combination is the much lower probability of liver toxicity with Lenvatinib. It can be challenging to differentiate liver toxicity from Axitinib vs. from immunotherapy and this often leads to prolonged breaks off all therapy. The incidence of liver toxicity with Axi/Pembro is 22-29%. https://www.sciencedirect.com/science/article/pii/S2588931121001139?via%3Dihub. The much higher response rate and PFS of Len/Pembro compared to Axi/Pembro is also very important.
Conflict of Interest Declarations — Kidney Cancer Research Network of Canada
To maintain the objectivity and credibility of the CADTH drug review programs, all participants in the drug review processes must disclose any real, potential, or perceived conflicts of interest. This conflict-of-interest declaration is required for participation.
Declarations made do not negate or preclude the use of the clinician group input. CADTH may contact your group with further questions, as needed.
Please see the Procedures for CADTH Drug Reimbursement Reviews (section 6.3) for further details.
Did you receive help from outside your clinician group to complete this submission? If yes, please detail the help and who provided it.
No
Did you receive help from outside your clinician group to collect or analyze any information used in this submission? If yes, please detail the help and who provided it.
No
List any companies or organizations that have provided your group with financial payment over the past two years AND who may have direct or indirect interest in the drug under review.
Please note that this is required for each clinician that contributed to the input — please add more tables as needed (copy and paste). It is preferred for all declarations to be included in a single document.
Declaration for Clinician 1
Name: Georg A Bjarnason
Position: Medical oncologist, Sunnybrook Odette Cancer Centre, Toronto.
Date: 07/12/2021
Table 10: COI Declaration for Kidney Cancer Research Network of Canada — Clinician 1
Company | Check Appropriate Dollar Range | |||
|---|---|---|---|---|
$0 to 5,000 | $5,001 to 10,000 | $10,001 to 50,000 | In Excess of $50,000 | |
Eisai | X | — | — | — |
Merck | X | — | — | — |
BMS | X | — | — | — |
Pfizer | X | — | — | — |
Ipsen | X | — | — | — |
Declaration for Clinician 2
Name: Naveen Basappa
Position: Medical Oncologist
Date: 10-12-202
Table 11: COI Declaration for Kidney Cancer Research Network of Canada — Clinician 2
Company | Check Appropriate Dollar Range | |||
|---|---|---|---|---|
$0 to 5,000 | $5,001 to 10,000 | $10,001 to 50,000 | In Excess of $50,000 | |
Eisai | X | — | — | — |
Merck | X | — | — | — |
BMS | X | — | — | — |
Pfizer | X | — | — | — |
Ipsen | X | — | — | — |
Declaration for Clinician 3
Name: Dr Catherine Sperlich
Position: Hematologist-oncologist, PEC, Hôpital Charles-Lemoyne-CISSS Montérégie-Centre, Québec
Date: 11/12/2021
Table 12: COI Declaration for Kidney Cancer Research Network of Canada — Clinician 3
Company | Check Appropriate Dollar Range | |||
|---|---|---|---|---|
$0 to 5,000 | $5,001 to 10,000 | $10,001 to 50,000 | In Excess of $50,000 | |
Eisai | X | — | — | — |
Merck | X | — | — | — |
BMS | X | — | — | — |
Ipsen | X | — | — | — |
Declaration for Clinician 4
Name: Eric Winquist
Position: Consultant, Medical oncology London Health Sciences Centre
Date: 09-12-2021
Table 13: COI Declaration for Kidney Cancer Research Network of Canada — Clinician 4
Company | Check Appropriate Dollar Range | |||
|---|---|---|---|---|
$0 to 5,000 | $5,001 to 10,000 | $10,001 to 50,000 | In Excess of $50,000 | |
Eisai | — | — | X | — |
Merck | X | — | — | — |
Roche | X | — | — | — |
Ipsen | X | — | — | — |
ISSN: 2563-6596
Disclaimer: The information in this document is intended to help Canadian health care decision-makers, health care professionals, health systems leaders, and policy-makers make well-informed decisions and thereby improve the quality of health care services. While patients and others may access this document, the document is made available for informational purposes only and no representations or warranties are made with respect to its fitness for any particular purpose. The information in this document should not be used as a substitute for professional medical advice or as a substitute for the application of clinical judgment in respect of the care of a particular patient or other professional judgment in any decision-making process. The Canadian Agency for Drugs and Technologies in Health (CADTH) does not endorse any information, drugs, therapies, treatments, products, processes, or services.
While care has been taken to ensure that the information prepared by CADTH in this document is accurate, complete, and up-to-date as at the applicable date the material was first published by CADTH, CADTH does not make any guarantees to that effect. CADTH does not guarantee and is not responsible for the quality, currency, propriety, accuracy, or reasonableness of any statements, information, or conclusions contained in any third-party materials used in preparing this document. The views and opinions of third parties published in this document do not necessarily state or reflect those of CADTH.
CADTH is not responsible for any errors, omissions, injury, loss, or damage arising from or relating to the use (or misuse) of any information, statements, or conclusions contained in or implied by the contents of this document or any of the source materials.
This document may contain links to third-party websites. CADTH does not have control over the content of such sites. Use of third-party sites is governed by the third-party website owners’ own terms and conditions set out for such sites. CADTH does not make any guarantee with respect to any information contained on such third-party sites and CADTH is not responsible for any injury, loss, or damage suffered as a result of using such third-party sites. CADTH has no responsibility for the collection, use, and disclosure of personal information by third-party sites.
Subject to the aforementioned limitations, the views expressed herein are those of CADTH and do not necessarily represent the views of Canada’s federal, provincial, or territorial governments or any third party supplier of information.
This document is prepared and intended for use in the context of the Canadian health care system. The use of this document outside of Canada is done so at the user’s own risk.
This disclaimer and any questions or matters of any nature arising from or relating to the content or use (or misuse) of this document will be governed by and interpreted in accordance with the laws of the Province of Ontario and the laws of Canada applicable therein, and all proceedings shall be subject to the exclusive jurisdiction of the courts of the Province of Ontario, Canada.
The copyright and other intellectual property rights in this document are owned by CADTH and its licensors. These rights are protected by the Canadian Copyright Act and other national and international laws and agreements. Users are permitted to make copies of this document for non-commercial purposes only, provided it is not modified when reproduced and appropriate credit is given to CADTH and its licensors.
Redactions: Confidential information in this document may be redacted at the request of the sponsor in accordance with the CADTH Drug Reimbursement Review Confidentiality Guidelines
Stakeholder Input: The views expressed in each submission are those of the submitting organization or individual; not necessarily the views of CADTH or of other organizations. As such, they are independent of CADTH and do not necessarily represent or reflect the view of CADTH. No endorsement by CADTH is intended or should be inferred. By filing with CADTH, the submitting organization or individual agrees to the full disclosure of the information. CADTH does not edit the content of the submissions.
CADTH does use reasonable care to prevent disclosure of personal information in posted material; however, it is ultimately the submitter’s responsibility to ensure no identifying personal information or personal health information is included in the submission. The name of the submitting organization or individual and all conflict of interest information are included in the submission; however, the name of the author, including the name of an individual patient or caregiver submitting the patient input, are not posted.
Accessibility: CADTH is committed to treating people with disabilities in a way that respects their dignity and independence, supports them in accessing material in a timely manner, and provides a robust feedback process to support continuous improvement. All materials prepared by CADTH are available in an accessible format. Where materials provided to CADTH by a submitting organization or individual are not available in an accessible format, CADTH will provide a summary document upon request. More details on CADTH’s accessibility policies can be found here.
About CADTH: CADTH is an independent, not-for-profit organization responsible for providing Canada’s health care decision-makers with objective evidence to help make informed decisions about the optimal use of drugs, medical devices, diagnostics, and procedures in our health care system.
Funding: CADTH receives funding from Canada’s federal, provincial, and territorial governments, with the exception of Quebec.