CADTH Reimbursement Review
Nivolumab (Opdivo)
Sponsor: Bristol Myers Squibb Canada
Therapeutic area: Gastric, gastroesophageal junction, or esophageal adenocarcinoma
This multi-part report includes:
Clinical Review
Pharmacoeconomic Review
Stakeholder Input
Clinical Review
Abbreviations
AE
adverse event
BICR
blinded independent central review
CGOEN
Canadian Gastrointestinal Oncology Evidence Network
CI
confidence interval
CPS
combined positive score
CR
complete response
CrI
credible interval
CT
computed tomography
DMC
data monitoring committee
DOR
duration of response
EAC
esophageal adenocarcinoma
EC
esophageal cancer
ECOG
Eastern Cooperative Oncology Group
EQ-5D-3L
EuroQol 5-Dimensions 3-Levels questionnaire
FACT-G7
functional assessment of cancer therapy – general 7 item version
FACT-Ga
functional assessment of cancer therapy – gastric
FOLFIRI
leucovorin and 5-fluorouracil plus irinotecan
FOLFOX
leucovorin and 5-fluorouracil plus oxaliplatin
GAC
gastric adenocarcinoma
GaCS
gastric cancer subscale
GC
gastric cancer
GEJ
gastroesophageal junction
GEJAC
gastroesophageal junction adenocarcinoma
GEJC
gastroesophageal junction cancer
GI
gastrointestinal
HER2
human epidermal growth factor receptor 2
HR
hazard ratio
HRQoL
health-related quality of life
HTA
Health Technology Assessment
ICTRP
International Clinical Trials Registry Platform
Ig
immunoglobulin
IMAE
immune-mediated adverse event
ITC
indirect treatment comparison
KM
Kaplan-Meier
MID
minimal important difference
MSI
microsatellite instability
MSI-H
microsatellite instability – high
MSS
microsatellite stable
NMA
network meta-analysis
OESI
other event of special interest
OL
open label
ORR
objective response rate
OS
overall survival
PAG
Provincial Advisory Group
PD-1
programmed cell death protein 1
PD-L1
programmed death ligand 1
PD-L2
programmed death ligand 2
PET
positron emission tomography
PFS
progression-free survival
PH
proportional hazard
PR
partial response
PS
performance status
RCT
randomized controlled trial
RECIST
response evaluation criteria in solid tumours
SAE
serious adverse event
SD
standard deviation
SOX
S-1 plus oxaliplatin
TTSD
time to symptom deterioration
VAS
visual analogue scale
WDAE
withdrawal-associated adverse event
XELOX
capecitabine plus oxaliplatin
Executive Summary
An overview of the submission details for nivolumab is provided in Table 1.
Item | Description |
|---|---|
Drug product | Nivolumab (Opdivo) for injection, IV infusion, 10 mg nivolumab/mL, 40 mg and 100 mg single-use vials |
Indication | Opdivo in combination with fluoropyrimidine- and platinum-containing chemotherapy, for the treatment of adult patients with HER2-negative advanced or metastatic gastric, gastroesophageal junction, or esophageal adenocarcinoma |
Reimbursement request | As per indication |
Health Canada approval status | NOC |
Health Canada review pathway | Project Orbis |
NOC date | October 28, 2021 |
Sponsor | Bristol Myers Squibb Canada |
HER2 = human epidermal growth factor receptor 2; NOC = Notice of Compliance.
Introduction
Esophagogastric cancers, including gastric cancer (GC), gastroesophageal junction cancer (GEJC), and esophageal cancer (EC), are a heterogeneous group of highly lethal malignancies of the upper gastrointestinal (GI) tract.1 Most esophagogastric cancers are adenocarcinomas (gastric adenocarcinoma [GAC], gastroesophageal junction adenocarcinoma [GEJAC], and esophageal adenocarcinoma [EAC]). These diseases occur more often in older men2 and are often diagnosed at an advanced stage in North America.3 Approximately 40% of patients have advanced or metastatic disease at diagnosis.4 In the small proportion (approximately 25%)5 of patients who are candidates for potentially curative resection, there is a high probability of recurrence within 1 year to 2 years.6 Symptoms — including dysphagia, pain, dyspepsia, reflux, weight loss, bleeding, and anemia7 — negatively impact health-related quality of life (HRQoL).8
Following diagnosis of de novo, recurrent advanced, or metastatic GAC, GEJAC, or EAC, a subset of patients will be eligible for systemic therapy with palliative intent (typically combination chemotherapy regimens, including a fluoropyrimidine and/or a platinum drug). According to the clinical experts consulted by CADTH for this review, the most important goals of treatment in these patients are prolonging survival, controlling symptoms, and maintaining HRQoL. The clinical experts indicated that leucovorin and 5-fluorouracil plus oxaliplatin (FOLFOX) is the most common regimen used in Canada for first-line therapy for advanced or metastatic GAC, GEJAC, or EAC, although capecitabine plus oxaliplatin (XELOX) and leucovorin and 5-fluorouracil plus irinotecan (FOLFIRI) may also be used in some patients. Existing therapies have limited efficacy, and responses are both infrequent and short-lived. In patients with advanced or metastatic disease, 5-year survival is approximately 4%,2,9 and median overall survival (OS) when first-line therapy is administered is approximately 7.7 months.10 In recent years, some patients have received immunotherapies (nivolumab and pembrolizumab) in combination with chemotherapy through registration in trials or special access programs. Programmed death ligand 1 (PD-L1) expression levels and combined positive scores (CPSs) vary in GACs, GEJACs, and EACs, and this may have prognostic significance in patients receiving immunotherapies.11
Nivolumab is a human immunoglobulin (Ig)G4 monoclonal antibody that binds programmed cell death protein 1 (PD-1) on T cells, blocking its interaction with its ligands PD-L1 and programmed death ligand 2 (PD-L2), which are upregulated on tumour cells and potentiate antitumour immune responses. Nivolumab (10 mg/mL) is supplied as 40 mg and 100 mg single-use vials and is administered through IV infusion at a dosage of 360 mg every 3 weeks or 240 mg every 2 weeks (depending on the backbone chemotherapy regimen). The Health Canada–approved indication is for nivolumab, in combination with fluoropyrimidine- and platinum-containing chemotherapy, for the treatment of adult patients with human epidermal growth factor receptor 2 (HER2)-negative advanced or metastatic GAC, GEJAC, or EAC. The indication also includes the following statement: “A positive association was observed between PD-L1 CPS score and the magnitude of treatment benefit.” The reimbursement request initially submitted by the sponsor for review by CADTH, |||||||||||||||||||||||||||||||||||||||||||||||||||||||||||||||||||||||||| |||||||||||||||||||||||||||, was for nivolumab, in combination with fluoropyrimidine- and platinum-containing chemotherapy, for the treatment of adult patients with advanced or metastatic GAC, GEJAC, or EAC. During the CADTH review, a Notice of Compliance (NOC) was issued by Health Canada. The approved indication differs from the initially submitted reimbursement request, in that HER2-negative status is specified and the approved indication is therefore narrower. After the NOC was issued, the sponsor confirmed with CADTH that the reimbursement request should be updated to match the approved indication. The sponsor estimated that the total population of patients with HER2-negative GAC, GEJAC, or EAC eligible for treatment with nivolumab plus chemotherapy under the Health Canada–approved indication was approximately 1,551 patients in Canada (excluding Quebec) in 2021.12 Nivolumab has been previously reviewed by CADTH for a variety of indications (melanoma, classical Hodgkin lymphoma, hepatocellular carcinoma, non–small cell lung cancer, malignant pleural mesothelioma, renal cell carcinoma, and squamous cell cancer of the head and neck) and is currently under CADTH review for adjuvant treatment of completely resected GEJC or EC.
The objective of this report was to perform a systematic review of the beneficial and harmful effects of nivolumab (IV injection over 30 minutes of 360 mg every 3 weeks or 240 mg every 2 weeks), in combination with fluoropyrimidine- and platinum-containing chemotherapy, for the treatment of adult patients with HER2-negative advanced or metastatic GAC, GEJAC, or EAC.
Stakeholder Perspectives
The information in this section is a summary of input provided by the patient groups that responded to CADTH’s call for patient input and from clinical experts consulted by CADTH for the purpose of this review.
Patient Input
Input was provided by 1 patient group for this review (My Gut Feeling – Stomach Cancer Foundation of Canada). My Gut Feeling distributed a survey via email, social media, and online forums to patients with GC, GEJC, or EC, as well as their caregivers, between August 20 and September 9, 2021. Among the 62 respondents (one-half patients and one-half caregivers), most (79%) were female, resided in Canada or the US (63% and 29%, respectively), and had received or were caring for someone who had received a diagnosis of GC (74.2%) and adenocarcinoma (82.3%). The number of respondents with advanced or metastatic disease was unclear. Most respondents (90.3%) reported a significant impact of their cancer on HRQoL, with adverse effects on physical health, mental health, ability to eat, ability to work, finances, social life, identity, and self-image. Some of these impacts extended to caregivers and families as well. Symptoms frequently included weight loss, change in appetite, pain, fatigue, reflux, nausea/vomiting, difficulty swallowing, shortness of breath, bleeding, anemia, ascites, and dumping syndrome. Patients highlighted the limited treatment options for GC, GEJC, and EC and their experiences with prior therapies (surgery, radiation, chemotherapy, and immunotherapy), including variable effectiveness in delaying progression and in controlling symptoms, as well as significant side effects affecting HRQoL (e.g., fatigue, nausea and/or vomiting, appetite changes exacerbating weight loss).
According to patients, an ideal therapy for GC, GEJC, and GC would prolong survival while maintaining or improving HRQoL compared with standard of care. Delaying recurrence or progression and having manageable side effects were also important factors for patients. Patients identified an unmet need for equitable access to therapies that may prolong life, improve symptoms, reduce risk of recurrence, and have improved tolerability. Such treatment options should be available barrier-free for all Canadian patients with GC, GEJC, or EC who could benefit.
Clinician Input
Input From Clinical Experts Consulted by CADTH
Two clinical specialists with expertise in the diagnosis and management of advanced or metastatic GAC, GEJAC, and EAC provided input for this review. According to the experts, current systemic therapies, including combination chemotherapy, are palliative in nature. Only a minority of patients have responses, and responses are often short-lived. Survival is typically less than 1 year; among responding patients, few live beyond 15 months to 18 months. There is an unmet need for more effective therapies with similar or lower toxicity than current chemotherapy options.
According to the experts, nivolumab would be administered in combination with fluoropyrimidine- and platinum-based chemotherapy for first-line treatment in most patients with HER2-negative advanced or metastatic GAC, GEJAC, or EAC who can tolerate chemotherapy. According to the experts, it would not be appropriate for patients to receive other therapies before nivolumab plus chemotherapy because the most effective treatment should be used in the first-line setting. The clinical experts stated that patients with good performance status (PS; Eastern Cooperative Oncology Group [ECOG] PS 0 or 1), patients with higher PD-L1 CPSs, and patients with high microsatellite instability (MSI-H) are most likely to respond to nivolumab plus chemotherapy. Patients with poor PS and PD-L1 CPS less than 1 are least likely to derive benefit from therapy, but, in the opinion of the clinical experts consulted by CADTH for this review, nivolumab plus chemotherapy could be considered for all patients with advanced or metastatic GAC, GEJAC, or EAC for whom local or curative treatment is not possible, regardless of tumour PD-L1 expression or PD-L1 CPS. Patients with active autoimmune diseases are least suitable for treatment with nivolumab due to safety concerns. Treatment would be initiated as soon as possible following diagnosis of advanced or metastatic GAC, GEJAC, or EAC, and response would be assessed by imaging approximately every 3 months. Objective tumour response on imaging, improvement in symptoms, HRQoL, weight, and PS are important parameters in response assessment. Treatment should be discontinued in patients with clear, objective tumour progression assessed by imaging. Treatment intolerance or significant toxicity may also require discontinuation of therapy.
Clinician Group Input
Two clinician groups provided input for this review: the Ontario Health (Cancer Care Ontario) Gastrointestinal Cancer Drug Advisory Committee (5 clinicians) and the Canadian Gastrointestinal Oncology Evidence Network (CGOEN) in collaboration with other physicians treating gastroesophageal cancers (7 clinicians). No major contrary views were presented. Both clinician groups echoed the limited efficacy of available systemic therapies for GAC, GEJAC, or EAC, and the short duration of response in many patients. By contrast with the clinical experts consulted by CADTH for this review, clinicians from the CGOEN felt that patients with PD-L1 CPS less than 5 (rather than < 1) would be least suitable for treatment with nivolumab plus chemotherapy, while those from the Ontario Health (Cancer Care Ontario) Gastrointestinal Cancer Drug Advisory Committee felt that, although patients with PD-L1 CPS of 5 or higher and 1 or higher are more likely to respond, all patients with GAC, GEJAC, or EAC can benefit from addition of nivolumab to chemotherapy.
Drug Program Input
The Provincial Advisory Group (PAG) identified several jurisdictional implementation issues. The PAG asked how FOLFOX and XELOX compared with other chemotherapy regimens for first-line therapy of GAC, GEJAC, or EAC and whether the available evidence could be generalized to combinations of nivolumab with non–platinum-based regimens. The clinical experts consulted by CADTH for this review responded that, with some jurisdictional variation, FOLFOX and XELOX, and to a lesser extent FOLFIRI, are generally preferred in Canada due to lower toxicity and more convenient administration, and that generalizability to other chemotherapy regimens was uncertain. The PAG inquired whether re-treatment with nivolumab (with or without chemotherapy) would be an option for patients who have received first-line nivolumab plus chemotherapy for 2 years and whose disease progresses while off therapy; the clinical experts confirmed that these patients would be offered re-treatment but that, in the absence of evidence, there would be variation in clinical practice in administration of nivolumab alone versus nivolumab plus chemotherapy for re-treatment. The PAG also inquired whether nivolumab plus chemotherapy would be offered to patients who had previously received nivolumab for adjuvant treatment of resected GAC, GEJAC, or EAC; the clinical experts confirmed that these patients would be eligible to receive nivolumab plus chemotherapy. The PAG asked whether patients treated with nivolumab plus chemotherapy could continue monotherapy if either component was discontinued; the clinical experts replied that yes, treatment with either nivolumab or chemotherapy alone would be continued, although it would be more common for patients to discontinue chemotherapy and continue nivolumab. The PAG raised the issue of how prescribers would choose which immunotherapy (e.g., pembrolizumab versus nivolumab) to administer in patients with GAC, GEJAC, or EAC; the clinical experts responded that this would depend on multiple factors, including funding of both immunotherapies, availability of PD-L1 testing, tumour site (GAC versus GEJAC versus EAC), PD-L1 CPS, and familiarity of the oncologist with each drug. The PAG asked whether patients with ECOG PS of 2 or higher would be eligible for nivolumab plus chemotherapy; the clinical experts confirmed that yes, some patients with ECOG PS of 2 or higher would be appropriate candidates for nivolumab plus chemotherapy. For patients currently receiving fluoropyrimidine- and platinum-based chemotherapy, PAG asked what time frame would be appropriate for addition of nivolumab to therapy; the clinical experts replied that 2 cycles to 3 cycles, or at least before the first scan at 3 months, would be appropriate cut-offs.
Clinical Evidence
Pivotal Studies and Protocol-Selected Studies
Description of Studies
CheckMate-649 was a phase III, open label (OL), multi-centre randomized controlled trial (RCT) (N = 1,581)13 with a primary objective to compare the efficacy of first-line therapy with nivolumab plus FOLFOX or XELOX versus FOLFOX or XELOX in prolonging OS and progression-free survival (PFS) per blinded independent central review (BICR) in patients with advanced or metastatic GAC, GEJAC, or EAC (all with PD-L1 CPS ≥ 5). Secondary objectives included comparing OS and PFS by BICR in patients with PD-L1 CPS of 1 or higher (OS: hierarchically tested), all randomized patients (OS: hierarchically tested), and patients with PD-L1 CPS of 10 or higher and comparing objective response rates (ORRs) in patients with PD-L1 CPS of 5 or higher, patients with PD-L1 CPS of 1 or higher, all randomized patients, and patients with PD-L1 CPS of 10 or higher. Changes in HRQoL (measured using the patient-reported EQ-5D-3L and functional assessment of cancer therapy – gastric [FACT-Ga] instruments, including the FACT-Ga gastric cancer subscale [GaCS]), were assessed in exploratory fashion. Patients had to be 18 years of age or older with inoperable advanced or metastatic, HER2-negative or HER2-unreported GAC, GEJAC, or EAC previously untreated in the advanced/metastatic setting and have ECOG PS 0 or 1. Patients were enrolled at 175 sites in 29 countries. Patients were randomized 1:1:1 to receive nivolumab 360 mg plus XELOX every 3 weeks or nivolumab 240 mg plus FOLFOX every 2 weeks; XELOX (every 3 weeks) or FOLFOX (every 2 weeks); or 4 cycles of nivolumab (1 mg/kg) plus ipilimumab (3 mg/kg) every 3 weeks followed by nivolumab monotherapy 240 mg every 2 weeks. The nivolumab plus ipilimumab and nivolumab monotherapy group was closed to recruitment on June 5, 2018, |||||||||||||||||||||||||||||||||||||||||||||||||||||||||||||||||||||||||||||||||||||||||||||||||||||||||||||||||||||||||||||||||||||; data for these patients were not relevant to the objective of this report and are not included. Patients were treated until disease progression, unacceptable toxicity, study withdrawal, or death, whichever came first. Treatment with nivolumab plus chemotherapy beyond initial, investigator-assessed progressive disease was allowed if the patient had investigator-assessed clinical benefit and was tolerating treatment. Further progression (increase in tumour burden ≥ 10%) resulted in discontinuation of nivolumab plus chemotherapy. For patients receiving nivolumab plus chemotherapy, the maximum treatment period was 24 months. Following treatment discontinuation, patients entered survival follow-up (every 3 months until study withdrawal, death, or data cut-off, whichever came first).
The mean ages of study participants were 60.3 years and 59.9 years in the nivolumab plus chemotherapy and chemotherapy arms, respectively. Approximately 70% of patients were male, approximately 70% were White, and approximately 60% were enrolled at sites outside of North America and Asia. Approximately 70% of patients had GAC and ||||||||||||||||||||||||||||||||||||||||||||||||||||||||||. Almost all patients (approximately 96%) had metastatic disease, while a minority (approximately 4%) had locally advanced or recurrent disease. Only a minority of patients (10% to 20%) had received prior surgery, ||||||||||||||||||||||||||||||||||||||||||||||||||||||||. Approximately 60% had HER2-negative tumours while HER2 status was not reported in approximately 40% of patients. Approximately 3% of patients were MSI-H. Approximately 83%, 61%, and 49% of patients had PD-L1 CPS of 1 or higher, 5 or higher, and 10 or higher, respectively. Baseline demographic and disease characteristics were generally well balanced between study arms.
Efficacy Results
Key efficacy results of the CheckMate-649 trial are summarized in Table 2. At the database lock of 10 July 2020 (minimum follow-up 12.1 months; mean follow-up ||||| months [standard deviation (SD) |||| months] in the nivolumab plus chemotherapy arm and ||||| months [SD |||| months] in chemotherapy arm), the co-primary efficacy analyses of OS and PFS in patients with PD-L1 CPS of 5 or higher showed that patients in the nivolumab plus chemotherapy arm had longer OS and PFS than those in the chemotherapy arm. Median OS was 14.39 months (95% confidence interval [CI], 13.11 to 16.23 months) in the nivolumab plus chemotherapy arm versus 11.10 months (95% CI, 10.02 to 12.09 months) in the chemotherapy arm (P < 0.0001). The hazard ratio (HR) for OS comparing nivolumab plus chemotherapy with chemotherapy was 0.71 (98.4% CI, 0.59 to 0.86). Median PFS was 7.69 months (95% CI, 7.03 to 9.17 months) in the nivolumab plus chemotherapy arm versus 6.05 months (95% CI, 5.55 to 6.90 months) in the chemotherapy arm (P < 0.0001). The HR for PFS comparing nivolumab plus chemotherapy with chemotherapy was 0.68 (98% CI, 0.56 to 0.81). The hierarchically tested secondary analyses of OS in patients with PD-L1 CPS of 1 or higher and all randomized patients also showed that patients in the nivolumab plus chemotherapy arm had longer OS than those in the chemotherapy arm. Among patients with PD-L1 CPS of 1 or higher, median OS was 13.96 months (95% CI, 12.55 to 14.98 months) in the nivolumab plus chemotherapy arm versus 11.33 months (95% CI, 10.64 to 12.25 months) in the chemotherapy arm (P < 0.0001). The HR comparing nivolumab plus chemotherapy with chemotherapy was 0.77 (99.3% CI, 0.64 to 0.92). Among all randomized patients, median OS was 13.83 months (95% CI, 12.55 to 14.55 months) in the nivolumab plus chemotherapy arm versus 11.56 months (95% CI, 10.87 to 12.48 months) in the chemotherapy arm (P = 0.0002). The HR comparing nivolumab plus chemotherapy with chemotherapy was 0.80 (99.3% CI, 0.68 to 0.94). The results of the co-primary and hierarchically tested secondary OS analyses were clinically relevant, according to the clinical experts consulted by CADTH for this review, based on their judgment that a 6-week improvement in survival represents a clinically meaningful improvement in this patient population.
Table 2: Summary of Key Efficacy Results From the CheckMate-649 Study
Outcome | Patients with PD-L1 CPS ≥ 10 | Patients with PD-L1 CPS ≥ 5 | Patients with PD-L1 CPS ≥ 1 | All randomized patients | ||||
|---|---|---|---|---|---|---|---|---|
Nivo + chemo (N = 375) | Chemo (N = 393) | Nivo + chemo (N = 473) | Chemo (N = 482) | Nivo + chemo (N = 641) | Chemo (N = 655) | Nivo + chemo (N = 789) | Chemo (N = 792) | |
OS (months) | ||||||||
Events, n (%) | ||||||||
2020a | 235 (62.7) | 295 (75.1) | 309 (65.3) | 362 (75.1) | 434 (67.7) | 492 (75.1) | 544 (68.9) | 591 (74.6) |
2021b | NR | NR | 344 (76.4) | 397 (82.4) | 478 (74.5) | 540 (82.4) | 603 (76.4) | 647 (81.7) |
OS, median (95% CI)c | ||||||||
2020a | 15.01 (13.77 to 16.79) | 10.87 (9.82 to 11.83) | 14.39 (13.11 to 16.23) | 11.10 (10.02 to 12.09) | 13.96 (12.55 to 14.98) | 11.33 (10.64 to 12.25) | 13.83 (12.55 to 14.55) | 11.56 (10.87 to 12.48) |
2021b | NR | NR | 14.42 (13.14 to 16.26) | 11.10 (10.02 to 12.09) | 14.00 (12.55 to 15.11) | 11.33 (10.58 to 12.12) | 13.93 (12.55 to 14.65) | 11.56 (10.87 to 12.48) |
HR (CI)d | ||||||||
2020a | 0.66 (95% CI, 0.55 to 0.78) | 0.71 (98.4% CI, 0.59 to 0.86) | 0.77 (99.3% CI, 0.64 to 0.92) | 0.80 (99.3% CI, 0.68 to 0.94) | ||||
2021b | NR | 0.69 (95% CI, 0.60 to 0.81) | 0.74 (95% CI, 0.66 to 0.84) | 0.79 (95% CI, 0.70 to 0.88) | ||||
P valuee | Not tested | < 0.0001 | < 0.0001 | 0.0002 | ||||
PFS (months) | ||||||||
Events, n (%) | ||||||||
2020a | 252 (67.2) | 289 (73.5) | 328 (69.3) | 350 (72.6) | 454 (70.8) | 472 (72.1) | 559 (70.8) | 557 (70.3) |
2021b | NR | NR | 342 (72.3) | 366 (75.9) | 475 (74.1) | 493 (75.2) | 581 (73.6) | 579 (73.1) |
PFS, median (95% CI)c | ||||||||
2020a | 8.31 (6.97 to 9.69) | 5.78 (5.45 to 6.87) | 7.69 (7.03 to 9.17) | 6.05 (5.55 to 6.90) | 7.49 (7.03 to 8.41) | 6.90 (6.08 to 7.03) | 7.66 (7.10 to 8.54) | 6.93 (6.60 to 7.13) |
2021b | NR | NR | 8.31 (7.03 to 9.26) | 6.05 (5.55 to 6.90) | 7.52 (7.03 to 8.51) | 6.90 (6.08 to 7.03) | 7.75 (7.13 to 8.57) | 6.93 (6.67 to 7.13) |
HR (CI)d | ||||||||
2020a | 0.63 (95% CI, 0.53 to 0.75) | 0.68 (98% CI, 0.56 to 0.81) | 0.74 (95% CI, 0.65 to 0.85) | 0.77 (95% CI, 0.68 to 0.87) | ||||
2021b | NR | 0.68 (95% CI, 0.59 to 0.79) | 0.74 (95% CI, 0.65 to 0.85) | 0.78 (95% CI, 0.69 to 0.88) | ||||
P valuee | Not tested | < 0.0001 | Not tested | Not tested | ||||
ORR (%) | ||||||||
ORR (95% CI) | ||| (||| to |||) | ||| (||| to |||) | ||| (||| to |||) | ||| (||| to |||) | ||| (||| to |||) | ||| (||| to |||) | ||| (||| to |||) | ||| (||| to |||) |
Difference of ORR (95% CI)f,g | ||| (||| to |||) | ||| (||| to |||) | ||| (||| to |||) | ||| (||| to |||) | ||||
DOR (months) | ||||||||
DOR, median (95% CI)c | ||| (|||,|||) | ||| (|||,|||) | 9.49 (7.98 to 11.37) | 6.97 (5.65 to 7.85) | ||| (|||,|||) | ||| (|||,|||) | 8.51 (7.23 to 9.92) | 6.93 (5.82 to 7.16) |
chemo = chemotherapy; CI = confidence interval; CPS = combined positive score; DOR = duration of response; HR = hazard ratio; Nivo = nivolumab; ORR = objective response rate; OS = overall survival; PD-L1 = programmed death ligand 1; PFS = progression-free survival.
Note: Efficacy analyses were conducted in all randomized patients, which consisted of the set of patients randomized concurrently to receive nivolumab plus chemotherapy or chemotherapy.
aAnalysis based on database lock of July 10, 2020.
bAnalysis based on database lock of February 16, 2021.
cBased on Kaplan-Meier estimates.
dStratified Cox proportional hazards model; HR for nivolumab + chemotherapy compared with chemotherapy. Stratification factors were region, ECOG PS, tumour cell PD-L1, and chemotherapy regimen. For analysis of OS in patients with PD-L1 CPS ≥ 1 at the February 16, 2021, database lock, an unstratified HR is reported.
eTwo-sided P value from stratified log-rank test. Value is from analysis based on database lock of July 10, 2020.
fStrata adjusted difference in response rate (nivolumab + chemotherapy versus chemotherapy) based on DerSimonian and Laird method of weighting.
gStratified by region, ECOG PS, tumour cell PD-L1, and chemotherapy regimen.
Source: CheckMate-649 Clinical Study Report14 and CADTH review submission for nivolumab.12
OS and PFS analyses were conducted as secondary end points across other PD-L1 CPS cut-offs. Median OS in patients with PD-L1 CPS of 10 or higher was ||||||| months (95% CI, ||||||| to ||||||| months) in the nivolumab plus chemotherapy arm and ||||||||| months (95% CI, ||||||||| to ||||||||| months) in the chemotherapy arm; the HR for OS comparing nivolumab plus chemotherapy with chemotherapy was ||||||| (95% CI, ||||||| to |||||||). Among patients with PD-L1 CPS of 10 or higher, median PFS was ||||||| months (95% CI, ||||||| to ||||||| months) in the nivolumab plus chemotherapy arm and ||||||| months (95% CI, ||||||| to ||||||| months) in the chemotherapy arm; the HR for PFS comparing nivolumab plus chemotherapy with chemotherapy was ||||||| (95% CI, ||||||| to |||||||). Among patients with PD-L1 CPS of 1 or higher, median PFS was 7.49 months (95% CI, 7.03 to 8.41 months) in the nivolumab plus chemotherapy arm and 6.90 months (95% CI, 6.08 to 7.03 months) in the chemotherapy arm; the HR for PFS comparing nivolumab plus chemotherapy with chemotherapy was 0.74 (95% CI, 0.65 to 0.85). Among all randomized patients, median PFS was 7.66 months (95% CI, 7.10 to 8.54 months) in the nivolumab plus chemotherapy arm and 6.93 months (95% CI, 6.60 to 7.13 months) in the chemotherapy arm; the HR for PFS comparing nivolumab plus chemotherapy with chemotherapy was 0.77 (95% CI, 0.68 to 0.87). Subgroup analyses of OS by PD-L1 status, showed decreasing treatment effects of nivolumab plus chemotherapy with lower PD-L1 CPS cut-offs as follows: PD-L1 CPS less than 10, HR = 0.94 (95% CI, 0.80 to 1.10); PD-L1 CPS of 10 or higher, HR = 0.65 (95% CI, 0.55 to 0.78); PD-L1 CPS less than 5, HR = 0.94 (95% CI, 0.78 to 1.13); PD-L1 CPS of 5 or higher, HR = 0.70 (95% CI, 0.60 to 0.81); PD-L1 CPS less than 1, HR = 0.92 (95% CI, 0.70 to 1.23); and PD-L1 CPS of 1 or higher, HR = 0.76 (95% CI, 0.67 to 0.87). Subgroup analyses of PFS followed a similar pattern.
EQ-5D-3L utility index scores, EQ visual analogue scale (VAS) scores, FACT-Ga total scores, and GaCS scores at baseline were similar among all randomized patients in the 2 treatment groups. Mean values for EQ-5D-3L utility index scores, EQ VAS scores, FACT-Ga total scores, and GaCS scores were numerically higher (improved) at post-baseline assessments during the treatment period compared with the baseline assessment among all randomized patients in both treatment groups. Interpretation of changes in patient-reported HRQoL outcomes was limited by high rates of missing data at later times post-baseline.
Comparisons of ORR and duration of responses (DOR) also favoured nivolumab plus chemotherapy over chemotherapy alone. According to the clinical experts consulted by CADTH for this review, differences in these outcomes, which were outside the statistical hierarchy, had uncertain clinical significance on their own but supported the clinically meaningful difference in OS in favour of nivolumab plus chemotherapy.
Harms Results
Key efficacy results of the CheckMate-649 trial are summarized in Table 3. Adverse events (AEs) occurred in almost all patients treated with nivolumab plus chemotherapy and chemotherapy alone (99.2% versus 98.0%). Serious AEs and withdrawals due to AEs occurred in larger proportions of patients receiving nivolumab plus chemotherapy compared with chemotherapy alone (54.1% versus 43.7% and 47.4% versus 32.7%, respectively). For death rates, 68.8% of patients treated with nivolumab plus chemotherapy and 74.6% of patients treated with chemotherapy alone died during the study period.
Select AEs, immune-mediated AEs (IMAEs), and other events of special interest (protocol-defined to capture the expected toxicity profile of nivolumab) occurred more frequently in the nivolumab plus chemotherapy arm than in the chemotherapy arm. Select AEs affecting the gastrointestinal system (40.3% in the nivolumab plus chemotherapy arm and 33.9% in the chemotherapy arm), the hepatic system (34.1% and 24.3%), the skin (33.5% and 17.9%), and the endocrine system (15.0% and 1.8%), as well as hypersensitivity and infusion reactions (15.1% and 5.9%), were the most common selected AEs in the nivolumab plus chemotherapy arm. Hypothyroidism and thyroiditis (9.5% in the nivolumab plus chemotherapy arm and 0.8% in the chemotherapy arm), rash (6.5% and 0.5%), pneumonitis (4.2% and 0%), diarrhea and colitis (3.3% and 0%), hyperthyroidism (2.9% and 0.3%), and hepatitis (2.4% and 0%) were the most common IMAEs in the nivolumab plus chemotherapy arm.
Table 3: Summary of Key Harms Results From the CheckMate-649 Study
Outcome | Nivo + chemo Treated patients (N = 782) | Chemo Treated patients (N = 767) |
|---|---|---|
Harms, n (%) | ||
AEs | 776 (99.2) | 752 (98.0) |
SAEs | 423 (54.1) | 335 (43.7) |
WDAEs | 371 (47.4) | 251 (32.7) |
Deaths | 538 (68.8) | 572 (74.6) |
Notable harms, n (%) | ||
Selected AEs | ||
Endocrine | 117 (15.0) | 14 (1.8) |
Gastrointestinal | 315 (40.3) | 260 (33.9) |
Hepatic | 267 (34.1) | 186 (24.3) |
Pulmonary | 41 (5.2) | 6 (0.8) |
Renal | 58 (7.4) | 24 (3.1) |
Skin | 262 (33.5) | 137 (17.9) |
Hypersensitivity/infusion reactions | 118 (15.1) | 45 (5.9) |
IMAEs | ||
Diarrhea/colitis | 26 (3.3) | 0 |
Hepatitis | 19 (2.4) | 0 |
Pneumonitis | 33 (4.2) | 0 |
Nephritis/renal dysfunction | 4 (0.5) | 0 |
Rash | 51 (6.5) | 4 (0.5) |
Hypersensitivity/infusion reactions | 6 (0.8) | 0 |
Endocrine IMAEs | ||
Adrenal insufficiency | 5 (0.6) | 2 (0.3) |
Hypophysitis | 6 (0.8) | 0 |
Hypothyroidism/thyroiditis | 74 (9.5) | 6 (0.8) |
Diabetes mellitus | 2 (0.3) | 0 |
Hyperthyroidism | 23 (2.9) | 2 (0.3) |
OESIs | ||
Pancreatitis | 3 (0.4) | 2 (0.3) |
Encephalitis | 1 (0.1) | 0 |
Myositis/rhabdomyolysis | 0 | 2 (0.3) |
Myasthenic syndrome | 0 | 0 |
Demyelination | 0 | 0 |
Guillain-Barré syndrome | 1 (0.1) | 0 |
Uveitis | 1 (0.1) | 0 |
Myocarditis | 2 (0.3) | 0 |
Graft vs. host disease | 0 | 0 |
||||||||||||||||||||||||||||||||||||||||||||||||||||| | ||| | ||| |
||||||||||||||||||||||||||||||||||||||||||||||| | ||
||||||||||||||||||||||||||||||||||| | |||||||||| | |||||||||| |
||||||||||||||||||||||||||||||||||||||||||||||| | |||||||||| | |||||||||| |
Abdominal pain, n (%) | 151 (19.3) | 120 (15.6) |
Abdominal pain upper, n (%) | 72 (9.2) | 69 (9.0) |
AE = adverse event; Chemo = chemotherapy; GI = gastrointestinal; IMAE = immune-mediated adverse event; Nivo = nivolumab; OESI = other event of special interest; SAE = serious adverse event; WDAE = withdrawal due to adverse event.
Source: CheckMate-649 Clinical Study Report.14
Critical Appraisal
A notable limitation of the CheckMate-649 study was its OL RCT design and potential bias associated with this design. Randomization was stratified by tumour PD-L1 expression (≥ 1% versus < 1%), while the co-primary OS and PFS analyses were conducted in patients with PD-L1 CPS of 5 or higher, eliminating the protection of stratified randomization. Although outcome assessment of tumour response and progression was performed by BICR using objective response evaluation criteria in solid tumours (RECIST) 1.1 criteria, patient-reported HRQoL data and assessment of harms outcomes may have been affected to some degree by knowledge of treatment allocation. The OL design may also have resulted in more frequent discontinuation before receiving any study therapy (nivolumab plus chemotherapy arm 0.9% versus chemotherapy arm 3.2%), discontinuation of therapy during the treatment phase (patient request: nivolumab plus chemotherapy arm 1.7% versus chemotherapy arm 4.6%; withdrawal of consent: nivolumab plus chemotherapy arm 2.6% versus chemotherapy arm 5.3%), and discontinuation from the study (withdrawal of consent: nivolumab plus chemotherapy arm 2.6% versus chemotherapy arm 4.7%) by patients randomized to the chemotherapy arm. The OL design could have altered treatment exposure in either or both study arms due to investigator biases, especially since treatment beyond progression was allowed for nivolumab plus chemotherapy but not chemotherapy alone. According to the clinical experts consulted by CADTH for this review, treatment with nivolumab plus chemotherapy beyond progression is clinically appropriate in some patients, although, in most patients, therapy would be discontinued at the first objective determination of progressive disease. According to the clinical experts consulted for this review, the frequency of treatment beyond progression in the CheckMate-649 trial (||||% of all randomized patients) was higher and the duration of treatment beyond progression was longer than expected based on current clinical practice in Canada. The impact of extended administration of nivolumab on OS was uncertain, although the clinical experts were of the opinion that post-progression treatment was unlikely to significantly influence OS or the interpretation of OS data. The absence of formal statistical comparison and high rates of missing HRQoL data (due to deaths and low questionnaire completion rates following treatment discontinuation) limited interpretation of these end points. In addition, the GaCS has not been validated as a stand-alone scale, and the degree to which it specifically measures changes in symptoms versus general HRQoL changes was unclear. The study had very high power for the co-primary efficacy analyses and would likely have been capable of detecting smaller treatment effects than originally anticipated with uncertain clinical relevance. The magnitude of OS differences between the nivolumab plus chemotherapy and chemotherapy arms in the primary analysis population (PD-L1 CPS ≥ 5) was statistically and clinically significant, according to the clinical experts consulted by CADTH for this review, but smaller differences in PFS were of uncertain clinical relevance.
The demographic and disease characteristics of the CheckMate-649 study population broadly reflected the Canadian population with GAC, GEJAC, or EAC. However, there were major unresolved questions of generalizability to some patient groups that would be covered by the Health Canada indication and the reimbursement request submitted for CADTH review. While the CheckMate-649 study enrolled patients with ECOG PS 0 or 1 and no prior systemic therapy in the advanced or metastatic setting, this review identified no evidence regarding administration of nivolumab plus chemotherapy in other types of patients (e.g., ECOG PS ≥ 2, non–first-line therapy). Critically, the study was not designed to conclusively identify the PD-L1 expression thresholds required for therapeutic benefit. Analyses of OS and PFS using different PD-L1 CPS cut-offs, as well as subgroup analyses by tumour cell PD-L1 expression, pointed toward potentially important differences in efficacy according to PD-L1 status.
Indirect Comparisons
Description of Studies
One sponsor-submitted indirect treatment comparison (ITC)15 contributed evidence to this review. The purpose of the ITC was to compare the efficacy of nivolumab plus chemotherapy to relevant comparators (chemotherapy regimens: fluoropyrimidine, fluoropyrimidine plus platinum, taxane plus platinum drug, fluoropyrimidine plus topoisomerase inhibitor, fluoropyrimidine plus taxane, platinum drug plus topoisomerase inhibitor, taxane plus topoisomerase inhibitor, fluoropyrimidine plus platinum drug and taxane, or fluoropyrimidine plus platinum drug and anthracycline) for first-line treatment of advanced or metastatic GC, GEJC, or EAC. Pembrolizumab plus chemotherapy and trastuzumab plus chemotherapy were not considered relevant comparators by the ITC authors.
Following literature searching, 31 studies presenting data on OS and PFS with relevant treatment comparisons were considered for inclusion in the network meta-analysis, of which 23 were used in the PFS network and 28 were used in the OS network. The ATTRACTION-4 study16 was excluded from the main ITC. Studies were connected in drug class–based networks for OS and PFS outcomes to indirectly compare nivolumab plus chemotherapy to other relevant therapies among the all-comers population (defined by the ITC authors as all patients studied in the selected trials, regardless of their PD-L1 status or other characteristics). A Bayesian framework was conducted with non-informative priors. As both fixed- and random-effects models were used, models were compared using the deviance information criterion. Scenario analyses were conducted based on the heterogeneity observed across trials included in the networks.
Efficacy Results
Pairwise comparisons for OS and PFS did not show differences between nivolumab plus fluoropyrimidine and platinum and the following treatments of interest: fluoropyrimidine plus platinum, fluoropyrimidine plus topoisomerase inhibitor, and fluoropyrimidine plus platinum and anthracycline. Scenario analyses were generally consistent with the primary analyses for PFS and OS for all relevant comparisons.
Harms Results
The sponsor-submitted ITC did not assess harms outcomes.
Critical Appraisal
Studies of pembrolizumab plus chemotherapy were not included in the ITC. While pembrolizumab is currently not funded outside special access programs across Canadian jurisdictions, it was still considered a clinically relevant comparator by the clinical experts consulted for this review. Substantial heterogeneity was observed across patient and trial characteristics. While multiple scenario analyses were conducted to explore the impact of certain effect modifiers, others could not be investigated. A risk of bias assessment conducted by the sponsor revealed that most studies included in the ITC were of low to medium quality, and scenario analyses that excluded low-quality studies produced more precise estimates. The sponsor’s ITC did not include outcomes other than OS and PFS, such as toxicities or HRQoL, both of which were important outcomes to patients. Overall, the ITC had limitations associated with clinical and statistical heterogeneity, which increased the uncertainty of estimates and may have prevented detection of differences among treatments.
Other Relevant Evidence
No other relevant evidence was identified for this review.
Conclusions
Evidence from the CheckMate-649 study suggested that, compared with FOLFOX or XELOX alone, first-line administration of nivolumab plus FOLFOX or XELOX contributed to statistically significant and clinically meaningful prolongation of OS among patients with HER2-negative GAC, GEJAC, or EAC. This finding was consistent across patients with PD-L1 CPS of 5 or higher, patients with PD-L1 CPS of 1 or higher, and all randomized patients. Administration of nivolumab plus FOLFOX or XELOX also resulted in statistically significant prolongation of PFS among patients with PD-L1 CPS of 5 or higher, although the clinical relevance of the difference in PFS was unclear. Other analyses of PFS, ORR, and DOR across different PD-L1 CPS cut-offs also numerically favoured nivolumab plus chemotherapy and supported the OS results. Results for patient-reported HRQoL and symptom scores (EQ-5D-3L, FACT-Ga) could not be interpreted due to absence of formal statistical testing, potential for bias in an OL trial, and high rates of missing data after baseline. There were signals from the trial that the comparative efficacy of nivolumab plus chemotherapy versus chemotherapy in patients with GAC, GEJAC, or EAC depended on PD-L1 status. Despite this, prolongation of OS by nivolumab plus chemotherapy, which was acknowledged as the most important outcome of therapy by both patients and clinicians, was statistically and clinically significant among all randomized patients. A sponsor-submitted ITC did not provide evidence of differences in efficacy between nivolumab plus fluoropyrimidine- and platinum-based chemotherapy and other chemotherapy regimens and did not include pembrolizumab plus chemotherapy as a comparator. Notable harms associated with nivolumab (including IMAEs) were appreciable but were expected and generally manageable with supportive care in most patients.
Introduction
Disease Background
Esophagogastric cancers, including GC, GEJC, and EC, are a heterogeneous group of highly lethal malignancies of the upper gastrointestinal tract.1 Tumours form in the squamous cells of the upper esophagus (squamous cell carcinoma) and, more frequently, in the glandular epithelial cells of the distal esophagus, gastroesophageal junction (GEJ), and stomach (adenocarcinoma; GAC, GEJAC, and EAC, respectively). Approximately 2-thirds to 3-quarters of cases occur in men, typically between the ages of 50 years to 70 years but sometimes in younger individuals.2 GAC, GEJAC, and EAC are often asymptomatic in the early stages of disease and thus go undetected.3 As the tumour grows, patients may experience dysphagia, pain, dyspepsia, reflux, weight loss, bleeding, and anemia.7 The disease severely negatively affects HRQoL because of physical symptoms, difficulty eating, financial difficulties arising from limited ability to work, and social impacts.8
In some regions with a high incidence of esophagogastric cancers, screening is routine.17 However, in North America, diagnosis is often made at a more advanced stage of disease. In approximately 40% of patients, disease extends beyond locoregional confines at diagnosis,4 and only about one-quarter of patients are eligible for potentially curative resection with adjuvant or neoadjuvant therapy.5 Curable esophagogastric cancers are infrequently detected outside of screening programs, although these programs are also rare in North America. Diagnosis is typically made by a gastroenterologist or surgeon based on endoscopic biopsy and imaging findings. Approximately 15% to 20% of patients with GAC, GEJAC, or EAC have HER2-positive tumours.5 PD-L1 expression levels vary in GAC, GEJAC, or EAC, which may have prognostic significance in patients receiving immunotherapies.11
Five-year survival among patients with stage IV GAC, GEJAC, or EAC is approximately 4%,2,9 and the median OS of patients receiving first-line treatment for metastatic or advanced GAC, GEJAC, or EAC is approximately 7.7 months.10 In Canada, the combined incidence of GC and GEJC was approximately 4,200 cases in 2020 and that of EC was approximately 2,400 cases.2,18 Approximately 90% of GCs and GEJCs19 and approximately 75% of ECs are adenocarcinomas.20 Approximately 40% of patients present with metastatic disease at diagnosis,4 and approximately 35% of incident cases of advanced or metastatic GC, GEJC, or EC represent recurrent disease following a prior diagnosis at an earlier stage.21 Approximately 75% of patients are eligible for systemic therapy,21 and approximately 77% have HER2-negative tumours.22 Based on these figures, the sponsor estimated a total population eligible for treatment with nivolumab plus chemotherapy of 1,551 patients in Canada (outside of Quebec) in 2021.12
Standards of Therapy
According to clinical experts consulted by CADTH for this review, a variety of non-drug approaches are used to manage symptoms associated with GAC, GEJAC, or EAC, such as bleeding and dysphagia, including surgery, radiation, and gastric or esophageal stents. Patients with resectable disease typically undergo radical esophagogastrostomy with adjuvant or neoadjuvant therapy in the hopes of cure. Unfortunately, unless resection is performed at an early stage, recurrence or relapse at locoregional or distant sites occurs in more than half of patients within 1 year to 2 years.6 Patients with de novo advanced, metastatic, or recurrent disease are transferred to the care of a medical oncologist for palliative systemic therapy.
According to the clinical experts, systemic therapy (typically combination chemotherapy) is used in patients with adequate PS and organ function. Because of the similar tumour locations of GAC, GEJAC, or EAC, similar combination chemotherapy regimens are used. These regimens typically include a fluoropyrimidine and/or a platinum drug. Folinic acid and 5-fluorouracil plus oxaliplatin (FOLFOX) is the most common first-line regimen used in Canada, although the regimen is not completely standardized. Capecitabine plus oxaliplatin (XELOX) may also be used, although this is not the regimen of choice for most clinicians because patients may have difficulty swallowing capecitabine pills. According to the clinical experts, folinic acid and 5-fluorouracil plus irinotecan (FOLFIRI) is used in patients who are unlikely to tolerate or have contraindications to platinum drugs. The clinical experts indicated that, in the approximately 15% of patients whose GAC or GEJAC is HER2-positive, trastuzumab plus chemotherapy can be administered. However, there are limited data on use of trastuzumab plus chemotherapy to treat EAC. Finally, some patients receive immunotherapies (nivolumab and pembrolizumab) in combination with chemotherapy through registration in trials or special access programs; both drugs are currently under review by CADTH. Responses to current combination chemotherapy regimens are both infrequent and short-lived. The clinical experts emphasized the importance of using the most active drugs for first-line treatment, because patients deteriorate rapidly, and few will receive second or subsequent lines of therapy (generally other chemotherapy regimens). Second-line regimens include paclitaxel, with or without ramucirumab (ramucirumab is not used for EAC), and trifluridine/tipiracil, while third-line regimens include irinotecan and trifluridine/tipiracil.
The clinical experts stated that the most important goals of treatment with palliative intent in patients with advanced or metastatic GAC, GEJAC, or EAC are controlling symptoms, maintaining HRQoL, and prolonging survival. These goals can conflict with one another, as the side effects of systemic therapy can worsen HRQoL. Thus, selecting appropriate interventions for each individual patient is critical.
Drug
Nivolumab is a human IgG4 monoclonal antibody directed against PD-1. Binding of nivolumab to PD-1 blocks its interaction with its ligands PD-L1 and PD-L2. Upregulation of PD-L1 and PD-L2 occurs in some tumours and inhibits antitumour T-cell responses. Thus, nivolumab can release PD-1 pathway-mediated inhibition of antitumour immunity, decreasing tumour growth.
The reimbursement request initially submitted by the sponsor for review by CADTH, |||||||||||||||||||||||||||||||||||||||||||||||||||||||||||||||||||||||||| |||||||||||||||||||||||||||, was for nivolumab, in combination with fluoropyrimidine- and platinum-containing chemotherapy, for the treatment of adult patients with advanced or metastatic GAC, GEJAC, or EAC. Nivolumab underwent an expedited Health Canada review for this indication through Project Orbis. During the CADTH review, an NOC was issued by Health Canada. The updated, Health Canada–approved indication is for nivolumab, in combination with fluoropyrimidine- and platinum-containing chemotherapy, for the treatment of adult patients with HER2-negative advanced or metastatic GAC, GEJAC, or EAC. The approved indication differs from the initially submitted indication in that HER2 status is specified and the approved indication is therefore narrower. The indication also includes the following statement: “A positive association was observed between PD-L1 CPS score and the magnitude of treatment benefit.” After the NOC was issued, the sponsor confirmed with CADTH that the reimbursement request should be updated to match the approved indication.
Key characteristics of nivolumab are shown in Table 4. Nivolumab is administered at a dose of 360 mg every 3 weeks or 240 mg every 2 weeks (depending on the chemotherapy backbone) through IV infusion. Nivolumab is also indicated for the treatment of melanoma, classical Hodgkin lymphoma, hepatocellular carcinoma, non–small cell lung cancer, malignant pleural mesothelioma, renal cell carcinoma, and squamous cell cancer of the head and neck. The drug has been previously reviewed by CADTH for all of these indications. Nivolumab is currently under CADTH review for adjuvant treatment of completely resected GEJC or EC.
Table 4: Key Characteristics of Nivolumab and Fluoropyrimidine- and Platinum-Based Chemotherapy for GAC, GEJAC, or EAC
Characteristic | Nivolumab | Fluoropyrimidine- and platinum-based chemotherapy (e.g., FOLFOX) |
|---|---|---|
Mechanism of action | Blockade of PD-1:PD-L1/PD-L2 interaction and release of antitumour T-cell responses | Enhancement of 5-FU activity by stabilizing the bond between 5-FdUMP and thymidylate synthetase (leucovorin); DNA and RNA synthesis inhibition (5-FU); alkylating drug (oxaliplatin) |
Indication(s)a | In combination with fluoropyrimidine- and platinum-containing chemotherapy, for the treatment of adult patients with HER2-negative advanced or metastatic gastric, gastroesophageal junction, or esophageal adenocarcinoma | Colorectal cancer (leucovorin); colorectal, breast, stomach, pancreas, prostate, ovary, bladder, and head and neck carcinoma (5-FU); colorectal cancer (oxaliplatin) |
Route(s) of administration | IV | IV or IM (leucovorin); IV (5-FU and oxaliplatin) |
Recommended dosage | 360 mg every 3 weeks (with XELOX) or 240 mg every 2 weeks (with FOLFOX) | Oxaliplatin 85 mg/m2, leucovorin 400 mg/m2, and 5-FU 400 mg/m2 on day 1; 5-FU 1,200 mg/m2 on days 1 and 2 of a 14-day treatment cycle |
Serious adverse effects or safety issues | Severe and/or fatal immune-mediated adverse reactions | Diarrhea, mucositis, stomatitis (leucovorin); myelosuppression, infection, cardiac events (5-FU); severe allergic reactions, liver problems, myelosuppression, infections, neuropathy, interstitial lung disease, irregular heartbeat, intestinal ulcers, bleeding, or perforation (oxaliplatin) |
EAC = esophageal adenocarcinoma; 5-FdUMP = 5-fluoro-2′-deoxyuridylate; FOLFOX = leucovorin and 5-fluorouracil plus oxaliplatin; 5-FU = 5-fluorouracil; GAC = gastric adenocarcinoma; GEJAC = gastroesophageal junction adenocarcinoma; HER2 = human epidermal growth factor receptor 2; IM = intramuscular; PD-1 = programmed cell death protein 1; PD-L1 = programmed death ligand 1; PD-L2 = programmed death ligand 2; XELOX = capecitabine plus oxaliplatin.
aNivolumab: Health Canada–proposed indication and indication submitted for CADTH reimbursement review; FOLFOX components: Health Canada–approved indications.
Source: CADTH review submission12 and product monograph23 for nivolumab and product monographs for leucovorin,24 5-fluorouracil,25 and oxaliplatin.26
Stakeholder Perspectives
Patient Group Input
This section was prepared by CADTH staff based on the input provided by a patient group. The original patient group submission can be found in the Stakeholder Input section.
Input was provided by 1 patient group for this review (My Gut Feeling – Stomach Cancer Foundation of Canada). My Gut Feeling is the first non-profit organization in Canada dedicated to providing support, awareness, education, information, and advocacy to patients with GC, GEJC, and EC as well as survivors and caregivers. My Gut Feeling distributed a survey via email, social media, and online forums to patients with GC, GEJC, and EC, as well as their caregivers, between 20 August and 9 September 2021. Among the 62 respondents (one-half patients and one-half caregivers), most (79%) were female, resided in Canada or the US (63% and 29%, respectively), and had received or were caring for someone who had received a diagnosis of GC (74.2%) and adenocarcinoma (82.3%). The number of respondents with advanced or metastatic disease was unclear.
Most respondents (90.3%) reported that cancer had a significant impact on HRQoL, with adverse effects on physical health, mental health, ability to eat, ability to work, finances, social life, identity, and self-image. Some of these impacts extended to caregivers and families as well. Common symptoms included weight loss, change in appetite, pain, fatigue, reflux, nausea/vomiting, difficulty swallowing, shortness of breath, bleeding, anemia, ascites, and dumping syndrome. Patients highlighted the limited treatment options for GC, GEJC, or EC and their experiences with prior therapies (surgery, radiation, chemotherapy, and immunotherapy), including variable effectiveness in delaying progression and controlling symptoms as well as significant side effects affecting HRQoL (e.g., fatigue, nausea/vomiting, appetite changes exacerbating weight loss). Twelve respondents had experience with nivolumab and felt that the drug controlled disease, improved HRQoL, and was more convenient and tolerable than surgery or chemotherapy.
According to patients, an ideal therapy for GC, GEJC, and GC would prolong survival while maintaining or improving HRQoL compared with standard of care. Delaying recurrence or progression and having manageable side effects were also important factors for patients. Patients identified an unmet need for equitable access to therapies that may prolong life, improve symptoms, reduce risk of recurrence, and have improved tolerability. Such treatment options should be available barrier-free for all Canadian patients with GC, GEJC, and EC who could benefit.
Clinician Input
Input From Clinical Experts Consulted by CADTH
All CADTH review teams include at least 1 clinical specialist with expertise regarding the diagnosis and management of the condition for which the drug is indicated. Clinical experts are a critical part of the review team and are involved in all phases of the review process (e.g., providing guidance on the development of the review protocol; assisting in the critical appraisal of clinical evidence; interpreting the clinical relevance of the results; and providing guidance on the potential place in therapy). The following input was provided by 2 clinical specialists with expertise in the diagnosis and management of advanced or metastatic GAC, GEJAC, or EAC.
Unmet Needs
According to the clinical experts consulted by CADTH for this review, all current treatment approaches for advanced or metastatic GAC, GEJAC, or EAC are palliative in nature, and survival is typically less than 1 year. Only a minority of patients respond to current combination chemotherapy regimens. These responses are usually short-lived, and very few patients live beyond 15 months to 18 months. There is clearly an unmet need for more effective therapies for advanced or metastatic GAC, GEJAC, or EAC that can be administered with similar or lower toxicity than current chemotherapy options.
Place in Therapy
According to the clinical experts, prior experience in other cancers has shown that, when immunotherapy alone is ineffective, combining it with chemotherapy may lead to better treatment outcomes with no or limited additional toxicity. According to the experts, as well as the sponsor, nivolumab would be administered in combination with fluoropyrimidine- and platinum-based chemotherapy for first-line treatment in most patients with HER2-negative advanced or metastatic GAC, GEJAC, or EAC who are able to tolerate chemotherapy. It would not be appropriate for patients to receive other treatments before nivolumab plus chemotherapy. According to the clinical experts, the most effective interventions should be used first-line. There is significant attrition, and many patients do not receive second or subsequent lines of therapy. Nivolumab would not be used in patients who are intolerant to or have failed chemotherapy. In patients with HER2-positive tumours, the clinical experts noted that trastuzumab would often be administered first-line and that, if the combination of pembrolizumab and trastuzumab with chemotherapy were available, this would be the preferred option for patients with HER2-positive tumours. The clinical experts stated that all patients with EAC would be eligible for nivolumab if funded, irrespective of the availability of HER2 testing. Nivolumab addresses the underlying disease process by potentiating antitumour immune responses, but there are many shortcomings to this approach. Reimbursement of nivolumab plus chemotherapy would not shift the treatment paradigm, as most patients would receive chemoimmunotherapy rather than fluoropyrimidine- and platinum-based chemotherapy alone in the first line, and second and subsequent lines of therapy would remain the same.
Patient Population
Unfortunately, the patients who are most in need of intervention have the most advanced disease, poor PS, and do not generally respond well to immunotherapy. As a result, they are excluded from clinical trials. According to the clinical experts consulted by CADTH for this review, the available data from trials provide evidence for use of nivolumab plus chemotherapy in patients with advanced or metastatic GAC, GEJAC, or EAC and ECOG PS 0 and 1, but administration in additional patients (ECOG PS 2 or potentially even 3) may be possible if judged appropriate by the treating clinician. In the opinion of the clinical experts, nivolumab plus chemotherapy should be available for all patients with advanced or metastatic GAC, GEJAC, or EAC for whom local or curative treatment is not possible and in whom chemotherapy is a treatment option. The site of metastasis or presence of symptoms would not affect patient selection. Diagnosis and staging (based on biopsy and CT or PET imaging) is standard, and misdiagnosis is unlikely.
According to the clinical experts, patients with good PS (ECOG PS 0 or 1) are most likely to respond to nivolumab plus chemotherapy. In addition, the clinical experts emphasized that PD-L1 expression is an established biomarker of response and patients with higher PD-L1 CPS are more likely to respond to nivolumab. PD-L1 CPS testing of biopsy specimens is now routinely performed for other cancer types and could easily be adapted for patients with GAC, GEJAC, or EAC, although this is not routinely done at present. According to the clinical experts, a small proportion of patients (3% to 5%) with MSI-H are also much more likely to respond to immunotherapy, including nivolumab. The clinical experts viewed patients with poor PS and PD-L1 CPS less than 1 as least likely to benefit from nivolumab, while patients with active autoimmune diseases are least suitable for treatment due to safety concerns.
Assessing Response to Treatment
Imaging (e.g., CT or PET scans) is used to evaluate response to therapy. In clinical practice, imaging assessments are performed approximately every 3 months (by contrast with the trial setting in which they are performed more frequently, i.e., every 6 weeks). Survival is the most important indicator of response, with improvement in symptoms and HRQoL also being important parameters in assessing response. Weight and PS may also give an indication of treatment response and are evaluated at each clinic visit.
Discontinuing Treatment
Treatment should be discontinued in patients with clear objective progressive disease assessed by imaging. Treatment intolerance or significant toxicity may also require discontinuation of therapy.
Prescribing Conditions
Diagnosis of GAC, GEJAC, or EAC and initial workup is typically performed by surgeons and gastroenterologists. Patients are then transferred to the care of a medical oncologist for systemic therapy. Palliative and supportive care specialists, as well as dietitians, would also follow these patients. Treatment would be administered in outpatient centres with experience in delivering systemic therapy (including chemotherapy and immunotherapy). Most centres already have significant experience with nivolumab and the accompanying chemotherapy regimens.
Additional Considerations
The clinical experts emphasized that most oncologists already have significant experience with administration of nivolumab, including combinations with chemotherapy, for other indications.
Clinician Group Input
This section was prepared by CADTH staff based on the input provided by clinician groups. The original clinician group input can be found in the Stakeholder Input section.
Two clinician groups provided input for this review: the Ontario Health (Cancer Care Ontario) Gastrointestinal Cancer Drug Advisory Committee (5 clinicians) and the CGOEN along with other physicians treating gastroesophageal cancers (7 clinicians). No major contrary views were presented. Both clinician groups echoed the limited efficacy of available systemic therapies for advanced or metastatic GAC, GEJAC, or EAC and short duration of response in many patients. By contrast with the clinical experts consulted by CADTH for this review, clinicians from the CGOEN felt that patients with PD-L1 CPS less than 5 (rather than < 1) would be least suitable for treatment with nivolumab plus chemotherapy, while those from the Ontario Health (Cancer Care Ontario) Gastrointestinal Cancer Drug Advisory Committee felt that, although patients with PD-L1 CPS of 5 or higher and 1 or higher are more likely to respond, all patients with GAC, GEJAC, or EAC can benefit from addition of nivolumab to chemotherapy.
Drug Program Input
The drug programs provide input on each drug being reviewed through CADTH’s reimbursement review processes by identifying issues that may affect their ability to implement a recommendation. The implementation questions and corresponding responses from the clinical experts consulted by CADTH are summarized in Table 5. Since CADTH solicited drug plan input before the sponsor notifying CADTH of the change in wording of the Health Canada indication, drug plans raised implementation issues concerning HER2-positive disease. Since the Health Canada–approved indication specifies that patients must have HER2-negative disease, those issues no longer required consideration.
Table 5: Summary of Drug Plan Input and Clinical Experts’ Response
Implementation issues | Clinical experts’ response |
|---|---|
Relevant comparators | |
How do FOLFOX and XELOX compare with other first-line chemotherapies with regard to efficacy and safety? | FOLFOX and XELOX (and, to a lesser extent, FOLFIRI) are the preferred chemotherapy backbones in Canada. FOLFOX is often preferred by clinicians due to difficulties in swallowing capecitabine pills. There is jurisdictional variation in chemotherapy regimens; in some jurisdictions, cisplatin plus 5-FU would be used instead, but clinician preference would be for FOLFOX or XELOX due to lower toxicity, more convenient administration, and potentially enhanced efficacy. |
Can the results of the CheckMate-649 trial be generalized to other first-line chemotherapy combinations than FOLFOX and XELOX in patients who are unable to tolerate platinum-based combinations? | This is uncertain, as the only data available are from the CheckMate-649 study that used FOLFOX or XELOX. A small percentage of patients may discontinue platinum drugs due to hypersensitivity but continue receiving the other components. Clinicians might consider administering nivolumab in combination with other chemotherapy regimens, but the efficacy of such combinations is unknown. |
Considerations for initiation of therapy | |
Patients with HER2-positive disease were excluded from the CheckMate-649 trial, but the reimbursement request does not mention HER2 status. Would patients with HER2-positive advanced or metastatic GAC, GEJAC, or EAC eligible for nivolumab in combination with fluoropyrimidine and platinum-containing chemotherapy? | Not applicablea |
How does trastuzumab plus chemotherapy compare with nivolumab plus chemotherapy for patients with HER2-positive advanced or metastatic GAC, GEJAC, or EAC? | Not applicablea |
Nivolumab (plus chemotherapy) was administered for a maximum of 2 years in the CheckMate-649 trial. Should re-treatment be offered to patients who complete up to 2 years whose disease progresses while off treatment? If so, what should the re-treatment duration be, and would re-treatment consist of nivolumab plus chemotherapy or nivolumab monotherapy? | Yes; based on past immunotherapy trials in other cancers, re-treatment should be offered to these patients after a gap of 6 months or longer. The re-treatment duration would be 1 to 2 years. In the absence of data, it is uncertain whether re-treatment would be with nivolumab alone or nivolumab plus chemotherapy, and there is likely to be variation in clinical practice. |
Nivolumab for adjuvant treatment of completely resected EC and GEJC is also under CADTH review. In other solid tumours, patients are eligible for downstream PD-1/PD-L1 inhibitors, provided that disease recurs more than 6 months after the last dose of adjuvant PD-1/PD-L1 inhibitor. Can the same principle be applied in this setting? | Yes; the same principle would apply in this setting unless proven otherwise. |
The PAG noted that pembrolizumab in combination with fluoropyrimidine- and platinum-based chemotherapy for first-line treatment of locally advanced unresectable or metastatic carcinoma of the esophagus or HER2-negative GEJAC is | For consideration by pERC |
under review by CADTH. The PAG noted the differences in the funding requests for these 2 reviews (e.g., squamous cell vs. adenocarcinoma histology, HER2 status, first-line therapy vs. treatment line-agnostic, and inclusion/exclusion of gastric cancer). | |
Considerations for discontinuation of therapy | |
In the CheckMate-649 trial, patients randomized to receive nivolumab plus chemotherapy could continue to receive nivolumab monotherapy (if chemotherapy was discontinued) or chemotherapy alone (if nivolumab was discontinued). Would these treatment discontinuation parameters be applied in clinical practice? | Yes, although it is more likely that patients would discontinue chemotherapy and continue with immunotherapy rather than vice versa. |
Considerations for prescribing of therapy | |
The PAG anticipated that, as with previous CADTH reviews of immune checkpoint inhibitors, jurisdictions will implement weight-based dosing for nivolumab, up to a maximum dose cap. Dosing frequency of nivolumab (e.g., Q2W, Q3W) will correspond to the chemotherapy regimen schedule used in combination. | For consideration by pERC |
The PAG noted the ongoing CADTH review of pembrolizumab plus chemotherapy in a similar patient population and noted that pembrolizumab and nivolumab have different dosing intervals; pembrolizumab may be administered every 21 or 42 days, while nivolumab may be administered every 14, 21, or 28 days. How would prescribers choose which immunotherapy (e.g., pembrolizumab vs. nivolumab) to use for advanced or metastatic GC, GEJ, or EC? | This would depend in part on funding of these immunotherapies (nivolumab and pembrolizumab) as well as availability of PD-L1 testing. Patients with EC (squamous cell carcinoma or adenocarcinoma) would likely receive pembrolizumab plus chemotherapy. Patients with GEJC and PD-L1 CPS ≥ 10 would likely receive pembrolizumab plus chemotherapy. Patients with GC would likely receive nivolumab plus chemotherapy. Patients with low or unknown PD-L1 CPS would likely receive nivolumab plus chemotherapy. For patients who are candidates for both nivolumab and pembrolizumab, the decision would come down to the familiarity of the oncologist and centre with each drug. Pembrolizumab would likely be used more often due to prior experience in other disease sites. |
How would HER2 status influence selection of first-line systemic therapy, including nivolumab, pembrolizumab, and trastuzumab? | Not applicablea |
Generalizability | |
Should patients with ECOG PS of 2 or greater be eligible for nivolumab plus chemotherapy? | In clinical practice, yes, some patients with ECOG PS of 2 (or potentially even 3) would receive nivolumab plus chemotherapy. Some younger patients may be good candidates despite ECOG PS of 2; treatment must be tailored to each patient, and such decisions would be made by the treating physician. Fragile patients with poor PS who are unlikely to respond and may suffer adverse effects without deriving clinical benefit would not be good candidates for nivolumab. |
For patients currently receiving fluoropyrimidine- and platinum-based chemotherapy with no evidence of progressive disease, there is a time-limited need for | This is uncertain. In the absence of data, arbitrary cut-offs of 2 or 3 cycles, or at least before the first scan at 3 months, would likely be used. Nivolumab should be added to chemotherapy before |
addition of nivolumab. What time frame from initiation of chemotherapy would be appropriate to add nivolumab for patients currently receiving chemotherapy or who recently completed chemotherapy? | any detected disease progression while the patient is receiving chemotherapy. Because there is no clear answer to this question at present, there is likely to be variation in clinical practice. |
Funding algorithm (oncology only) | |
The PAG noted that reimbursement of nivolumab for this indication may change place in therapy of drugs reimbursed in subsequent lines (e.g., ramucirumab plus paclitaxel, trifluridine/tipiracil). | For consideration by pERC |
Care provision issues | |
The PAG noted that adding nivolumab to chemotherapy would require additional time to administer treatment and adds admixtures for pharmacy preparation. However, because nivolumab is used in many other indications, it is anticipated that vial-sharing and dose-rounding would be possible, especially in larger centres. | For consideration by pERC |
System and economic issues | |
As noted above, the PAG noted the discrepancy between HER2 status in the CheckMate-649 trial (HER2-positive disease excluded) and the reimbursement request (no mention of HER2 status). The cost-effectiveness and budget impact of nivolumab plus chemotherapy in patients with HER2-positive disease are unclear. | Not applicablea |
CPS = combined positive score; EC = esophageal cancer; EAC = esophageal adenocarcinoma; ECOG = Eastern Cooperative Oncology Group; FOLFIRI = leucovorin and 5-fluorouracil plus irinotecan; FOLFOX = leucovorin and 5-fluorouracil plus oxaliplatin; GAC = gastric adenocarcinoma; GEJAC = gastroesophageal junction adenocarcinoma; FGC = gastric cancer; GEJ = gastroesophageal junction; GEJC = gastroesophageal junction cancer; HER2 = human epidermal growth receptor 2; PAG = Provincial Advisory Group; PD-1 = programmed cell death protein 1; PD-L1 = programmed death ligand 1; pERC = CADTH Pan-Canadian Oncology Drug Review Expert Committee; PS = performance status; Q2W = once every 2 weeks; Q3W = once every 3 weeks; vs. = versus; XELOX = capecitabine plus oxaliplatin.
aThe drug plan provided input before the sponsor notifying CADTH of the change in wording of the anticipated Health Canada indication. Since the Health Canada–approved indication specifies that patients must have HER2-negative disease, consideration of this item is no longer required.
Clinical Evidence
The clinical evidence included in the review of nivolumab is presented in 2 sections. The first section, the systematic review, includes pivotal studies provided in the sponsor’s submission to CADTH and Health Canada, as well as those studies that were selected according to an a priori protocol. The second section includes indirect evidence from the sponsor; no indirect evidence selected from the literature met the selection criteria specified in the review. No long-term extension studies or additional relevant studies were identified that addressed important gaps in the evidence included in the systematic review.
Systematic Review of Pivotal and Protocol-Selected Studies
Objectives
To perform a systematic review of the beneficial and harmful effects of nivolumab (IV injection over 30 minutes of 360 mg every 3 weeks or 240 mg very 2 weeks), in combination with fluoropyrimidine- and platinum-containing chemotherapy, for the treatment of adult patients with HER2-negative advanced or metastatic GAC, GEJAC, or EAC.
Methods
Studies selected for inclusion in the systematic review included pivotal studies provided in the sponsor’s submission to CADTH and Health Canada, as well as those meeting the selection criteria presented in Table 6. Outcomes included in the CADTH review protocol reflect outcomes considered to be important to patients, clinicians, and drug plans. The systematic review protocol was established before Health Canada granted an NOC .
Table 6: Inclusion Criteria for the Systematic Review
Criteria | Description |
|---|---|
Population | Adults (age ≥ 18 years) with advanced or metastatic gastric, GEJ, or esophageal adenocarcinoma. Subgroups:
|
Intervention | Nivolumab 360 mg administered intravenously over 30 minutes in combination with fluoropyrimidine- and platinum-containing chemotherapy every 3 weeks or 240 mg nivolumab administered intravenously over 30 minutes in combination with fluoropyrimidine- and platinum-containing chemotherapy every 2 weeks |
Comparator | Chemotherapy (e.g., FOLFOX, FOLFIRI, XELOX, 5-FU plus cisplatin, with or without epirubicin, capecitabine plus cisplatin, with or without epirubicin) Pembrolizumab plus platinum- and fluoropyrimidine-based chemotherapy Trastuzumab plus capecitabine and cisplatin or plus 5-FU and cisplatin |
Outcomes | Efficacy outcomes:
Harms outcomes:
|
Study design | Published and unpublished phase III and IV RCTs |
AE = adverse event; DOR = duration of response; FOLFIRI = leucovorin and 5-fluorouracil plus irinotecan; FOLFOX = leucovorin and 5-fluorouracil plus oxaliplatin; 5-FU, 5-fluorouracil; GEJ = gastroesophageal junction; GI = gastrointestinal; HER2 = human epidermal growth factor receptor 2; HRQoL = health-related quality of life; MSI = microsatellite instability; ORR = objective response rate; OS = overall survival; PD-L1 = programmed death ligand 1; PFS = progression-free survival; RCT = randomized controlled trial; SAE = serious adverse event; WDAE = withdrawal due to adverse event; XELOX = capecitabine plus oxaliplatin.
aThese outcomes were identified as being of particular importance to patients in the input received by CADTH from a patient group.
The literature search for clinical studies was performed by an information specialist using a peer-reviewed search strategy according to the PRESS Peer Review of Electronic Search Strategies resource.27
Published literature was identified by searching the following bibliographic databases: MEDLINE All (1946–) via Ovid and Embase (1974–) via Ovid. All Ovid searches were run simultaneously as a multi-file search. Duplicates were removed using Ovid deduplication for multi-file searches, followed by manual deduplication in Endnote. The search strategy comprised both controlled vocabulary, such as the National Library of Medicine’s MeSH (Medical Subject Headings), and keywords. The main search concepts were Opdivo (nivolumab) and gastric, gastroesophageal junction, or esophageal adenocarcinoma. Clinical trials registries were searched: the US National Institutes of Health’s clinicaltrials.gov, the WHO International Clinical Trials Registry Platform (ICTRP) search portal, Health Canada’s Clinical Trials Database, and the European Union Clinical Trials Register.
No filters were applied to limit the retrieval by study type. Retrieval was not limited by publication date or by language. Conference abstracts were excluded from the search results. See Appendix 3 for the detailed search strategies.
The initial search was completed on September 16, 2021. Regular alerts updated the search until the meeting of the CADTH pan-Canadian Oncology Drug Review Expert Committee (pERC) on January 12, 2022.
Grey literature (literature that is not commercially published) was identified by searching relevant websites from the Grey Matters: A Practical Tool For Searching Health-Related Grey Literature checklist.28 Included in this search were the websites of regulatory agencies (US FDA and European Medicines Agency). Google was used to search for additional internet-based materials. See Appendix 3 for more information on the grey literature search strategy. These searches were supplemented by reviewing bibliographies of key papers and through contacts with appropriate experts. In addition, the manufacturer of the drug was contacted for information regarding unpublished studies.
Two CADTH clinical reviewers independently selected studies for inclusion in the review based on titles and abstracts, according to the predetermined protocol. Full-text articles of all citations considered potentially relevant by at least 1 reviewer were acquired. Reviewers independently made the final selection of studies to be included in the review, and differences were resolved through discussion.
Findings From the Literature
One study was identified from the literature for inclusion in the systematic review (Figure 1). The included study is summarized in Table 7. A list of excluded studies is presented in Appendix 4.
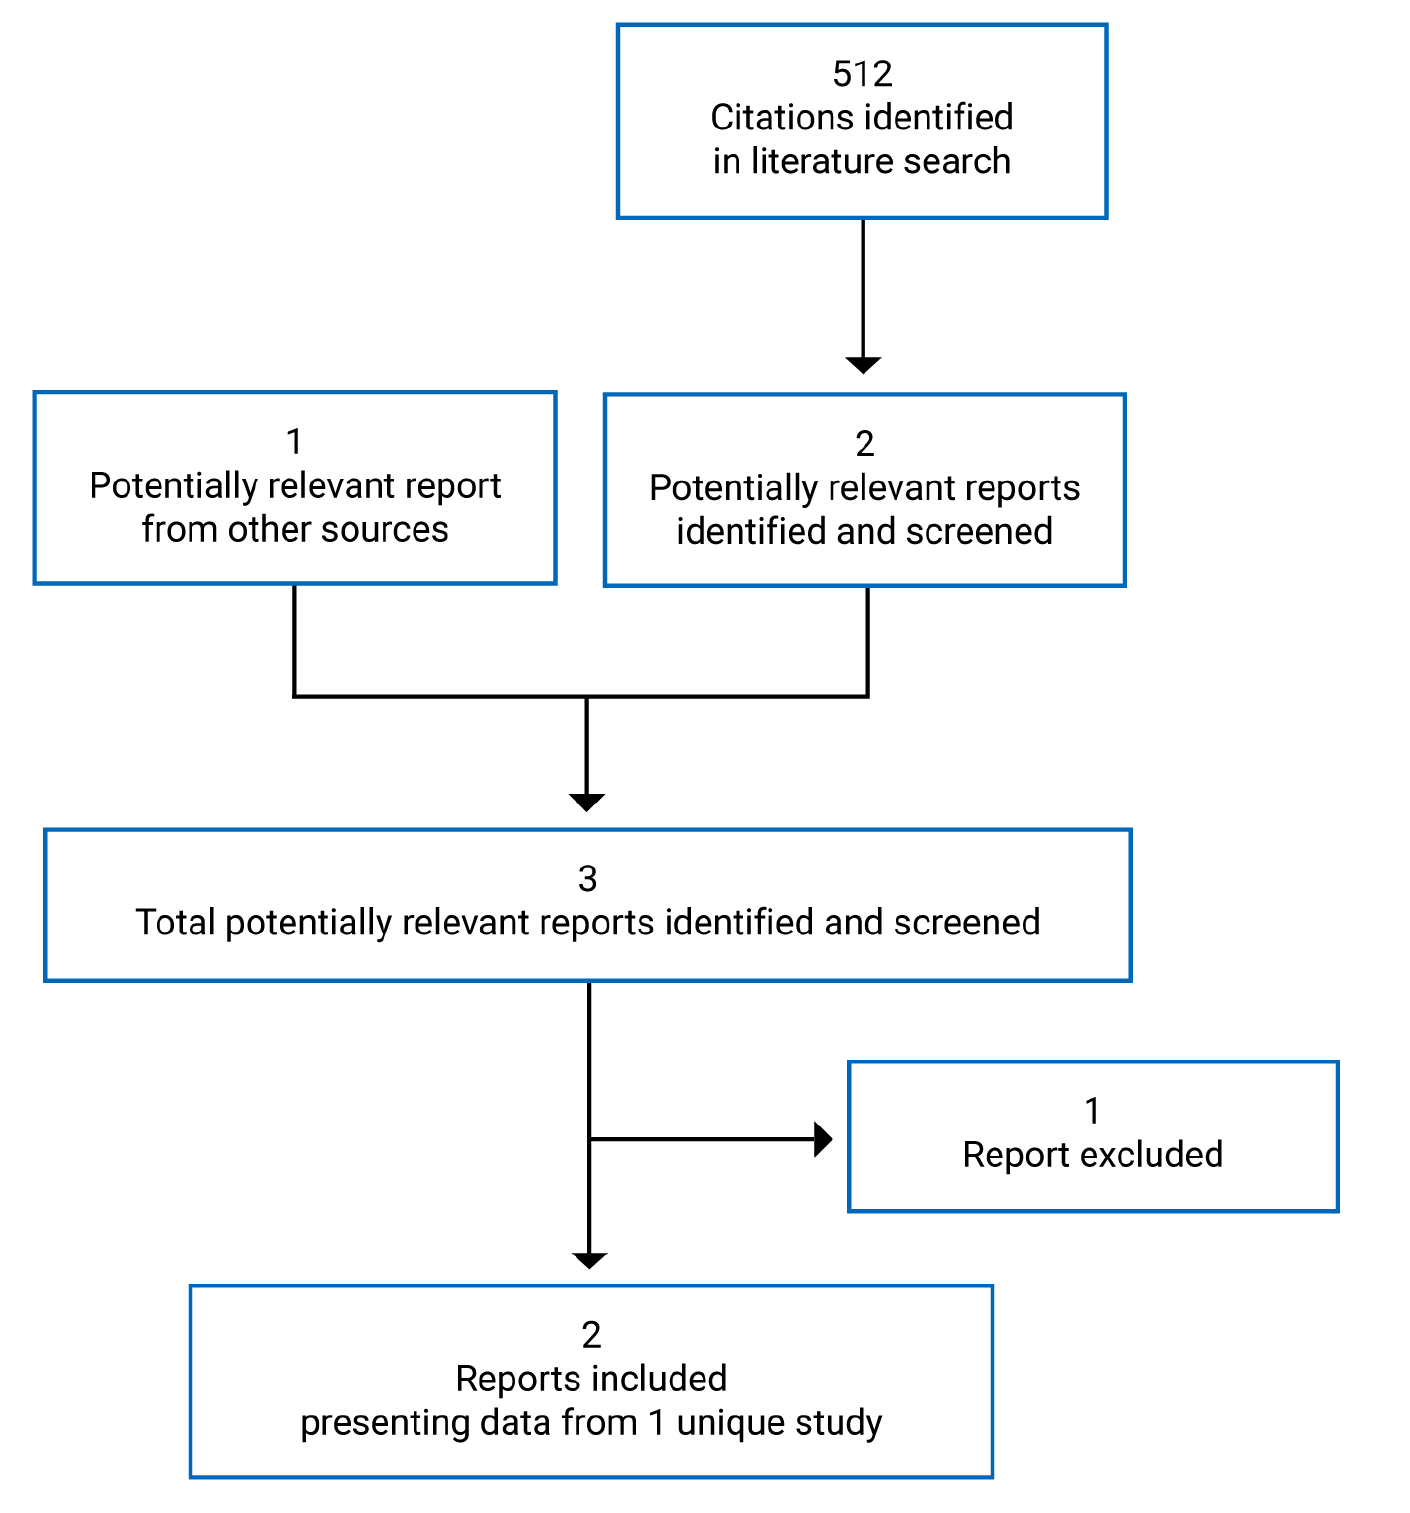
Table 7: Details of the CheckMate-649 Study
Characteristic | Description |
|---|---|
Design and population | |
Study design | Phase III OL multi-centre RCT |
Locations | 175 sites in 29 countries (Argentina, Australia, Brazil, Canada, Chile, China, Colombia, Czech Republic, France, Germany, Greece, Hong Kong, Hungary, Israel, Italy, Japan, Mexico, Peru, Poland, Portugal, Republic of Korea, Romania, Russian Federation, Singapore, Spain, Taiwan, Turkey, UK, and US) |
Patient enrolment dates | April 17, 2017, to May 27, 2019 |
Data cut-off | May 27, 2020 (last patient visit and clinical cut-off); July 10, 2020 (first database lock); |||||||||||| || (||||||||||||||||||||||||||) |
Randomized (N) | 1,581 (nivolumab plus chemotherapy and chemotherapy arms)a |
Inclusion criteria |
|
Exclusion criteria |
|
(continued) |
|
Drugs | |
Interventions |
|
Comparators |
|
Duration | |
Phase | |
Screening | 4 weeks |
OL treatment | Until progressive disease,b unacceptable toxicity, 24 months treatment (for nivolumab plus chemotherapy), or patient withdrawal of consent, whichever occurred first |
Survival follow-up | Until study withdrawal, death, or data cut-off, whichever came first |
Outcomes | |
Co-primary end points |
|
Secondary and exploratory end points | Hierarchically tested secondary:
Secondary:
|
(continued) | Exploratory:
|
Notes | |
Publicationsc | Janjigian et al. (2021)13 |
ALT = alanine aminotransferase; AST = aspartate aminotransferase; BICR = blinded independent central review; CD137 = cluster of differentiation 137; CNS = central nervous system; CPS = combined positive score; CTLA-4 = cytotoxic T-lymphocyte-associated protein 4; DOR = duration of response; DRR = durable response rate; EC = esophageal cancer; ECOG = Eastern Cooperative Oncology Group; EQ-5D-3L = EuroQol 5-Dimensions 3-Levels questionnaire; FACT-G7 = functional assessment of cancer therapy – general 7 item version; FACT-Ga = functional assessment of cancer therapy – gastric; FOLFOX = leucovorin and 5-fluorouracil plus oxaliplatin; 5-FU = 5-fluorouracil; GaCS = gastric cancer subscale; GC = gastric cancer; GEJC = gastroesophageal junction cancer; HBV = hepatitis B virus; HCV = hepatitis C virus; HER2 = human epidermal growth factor receptor 2; HRQoL = health-related quality of life; MSI = microsatellite instability; OL = open label; ORR = objective response rate; OS = overall survival; PD-1 = programmed cell death protein 1; PD-L1 = programmed death ligand 1; PD-L2 = programmed death ligand 2; PFS = progression-free survival; PFS2 = progression-free survival after next line of treatment; PS = performance status; RCT = randomized controlled trial; RECIST = Response Evaluation Criteria in Solid Tumours; TSST = time to second subsequent line therapy; TTSD = time to symptom deterioration; ULN = upper limit of normal; WBC = white blood cell; XELOX = capecitabine plus oxaliplatin.
aAn additional 450 patients were randomized to a third arm (nivolumab plus ipilimumab); these data are not presented in this report.
bNivolumab plus chemotherapy treatment beyond initial, investigator-assessed progression per RECIST 1.1 was permitted if the patient had investigator-assessed clinical benefit and was tolerating treatment; however, chemotherapy alone was not allowed to continue beyond progression.
cOne additional report was included (CheckMate-649 Clinical Study Report).
Source: CheckMate-649 Clinical Study Report.14
Description of Studies
CheckMate-649 was a phase III, randomized, OL, multi-centre RCT (N = 1,581) funded by the sponsor (Bristol Myers Squibb). The primary objective was to compare the efficacy of first-line therapy with nivolumab plus FOLFOX-XELOX versus FOLFOX-XELOX in prolonging OS and PFS per BICR in patients with advanced or metastatic GAC, GEJAC, or EAC (all with PD-L1 CPS ≥ 5). Secondary objectives included comparing OS and PFS by BICR in patients with PD-L1 CPS of 1 or higher (OS: hierarchically tested), all randomized patients (OS: hierarchically tested), and patients with PD-L1 CPS of 10 or higher; and to compare ORR in patients with PD-L1 CPS of 5 or higher, patients with PD-L1 CPS of 1 or higher, all randomized patients, and patients with PD-L1 CPS of 10 or higher. A summary of the design of the CheckMate-649 study is shown in Figure 2. Patients 18 years of age or older with inoperable advanced or metastatic, HER2-negative or HER2-unreported GAC, GEJAC, or EAC, and ECOG PS of 1 or lower were enrolled from April 17, 2017, to May 27, 2019, at 175 sites in 29 countries (8 sites in Canada; ||||||||||||||||||||||||||||||||||||||||||||||||||). Patients were screened for eligibility within 4 weeks of initiating protocol therapy.
Patients were randomized 1:1:1, using an interactive web response system, to receive nivolumab (360 mg) plus XELOX every 3 weeks or nivolumab (240 mg) plus FOLFOX every 2 weeks; XELOX every 3 weeks or FOLFOX every 2 weeks; or 4 cycles of nivolumab (1 mg/kg) plus ipilimumab (3 mg/kg) every 3 weeks followed by nivolumab monotherapy (240 mg) every 2 weeks. Chemotherapy regimens (FOLFOX versus XELOX) were selected at the discretion of investigators before randomization. The randomization procedure was not explicitly stated. The nivolumab plus ipilimumab-nivolumab monotherapy arm was closed to recruitment on June 5, 2018, due to concerns of the data monitoring committee (DMC) regarding increased early death rates and high toxicity rates; data for these patients are not yet available and were not relevant to the objective of this report. Randomization was stratified by region (Asia versus North America versus rest of world), ECOG PS (0 versus 1), chemotherapy regimen (FOLFOX versus XELOX), and PD-L1 expression (≥ 1% versus < 1% of tumour cells). Patients were treated until progressive disease (with some exceptions in the nivolumab plus chemotherapy arm), unacceptable toxicity, study withdrawal by patients or physicians, or death, whichever came first. Treatment delays of up to 6 weeks also led to discontinuation. Following treatment discontinuation, patients entered survival follow-up (every 3 months until study withdrawal, death, or data cut-off, whichever came first). The database was closed on May 27, 2020, and locked on July 10, 2020 (minimum follow-up 12.1 months). Data for a second database lock of February 16, 2021 (minimum follow-up 19.4 months) were made available during EMA review.
Figure 2: Design of the CheckMate-649 Trial
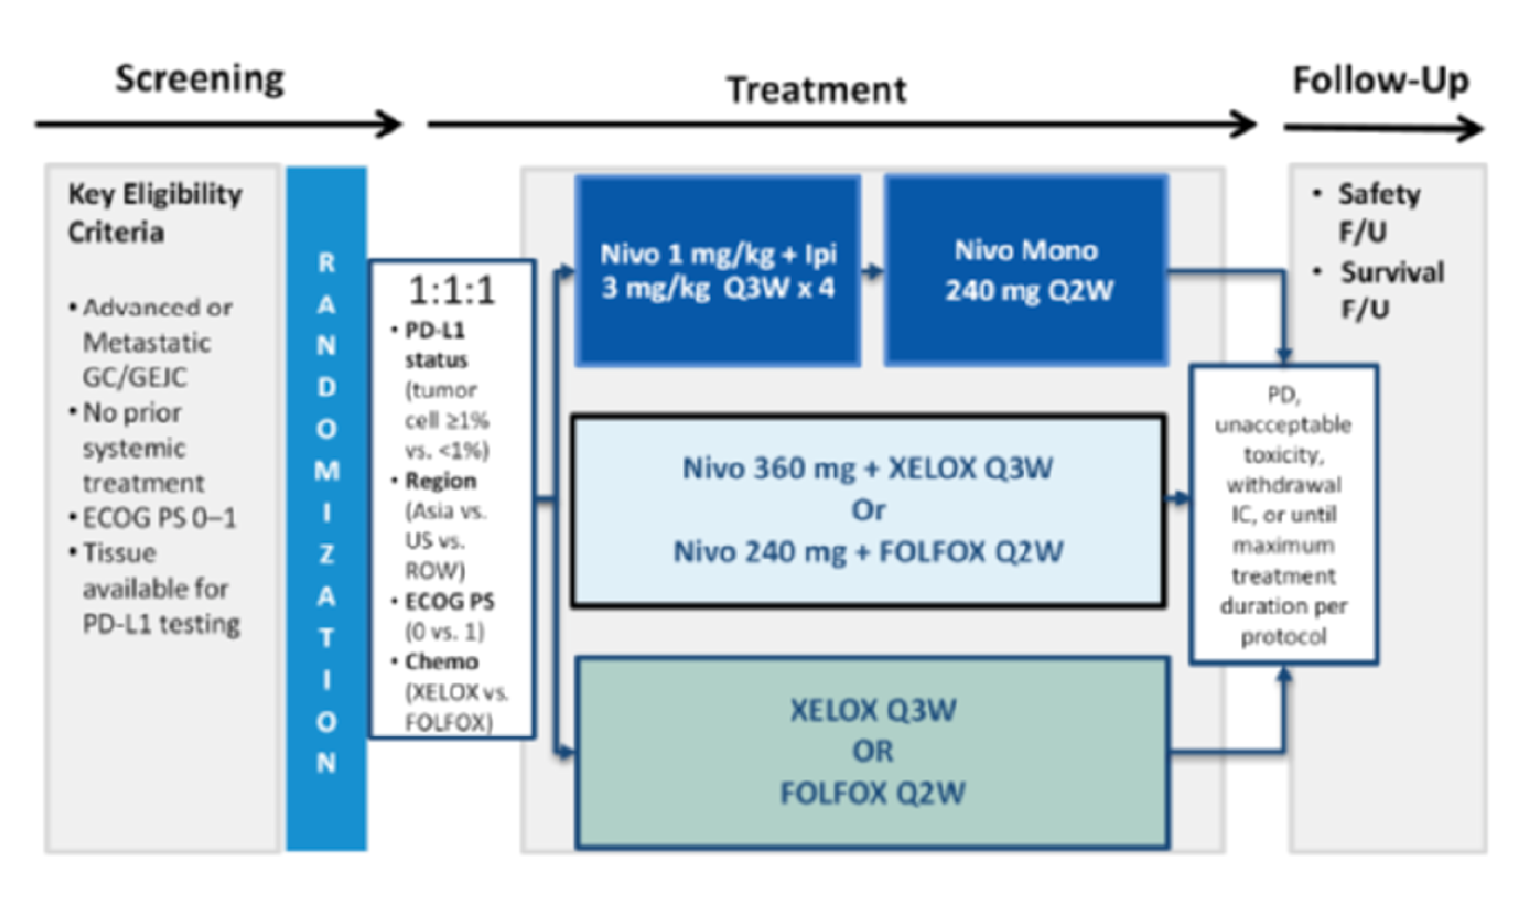
chemo = chemotherapy; ECOG PS = Eastern Cooperative Oncology Group performance status; FOLFOX = leucovorin and 5-fluorouracil plus oxaliplatin; F/U = follow-up; GC = gastric cancer; GEJC = gastroesophageal junction cancer; IC = informed consent; Ipi = ipilimumab; Mono = monotherapy; Nivo = nivolumab; PD = progressive disease; PD-L1 = programmed death ligand 1; Q2W = every 2 weeks; Q3W = every 3 weeks; ROW = rest of world; XELOX = capecitabine plus oxaliplatin.
Source: CheckMate-649 Clinical Study Report.14
Populations
Inclusion and Exclusion Criteria
Key inclusion and exclusion criteria for the CheckMate-649 study are shown in Table 7. Adult patients (18 years of age or older) with inoperable advanced, locally advanced, or metastatic GC, GEJC, or distal EC, and histologically confirmed predominant adenocarcinoma were eligible if they had ECOG PS 0 or 1, had at least 1 measurable lesion or evaluable disease by CT/PET, had adequate hematological and organ function, and had not previously received systemic therapy (including HER2 inhibitors) for advanced or metastatic disease. Prior adjuvant or neoadjuvant chemotherapy, radiotherapy, and/or chemoradiotherapy completed 6 months or more before randomization and palliative radiotherapy completed 2 weeks or more before randomization were permitted. Patients had to have recovered from all toxicities associated with prior therapies, and tumour tissue had to be available for PD-L1 analysis before randomization. Patients with HER2-positive tumours were excluded, although known HER2 status was not required for study eligibility. Patients with untreated central nervous system metastases, uncontrolled ascites, peripheral neuropathy of Grade 2 or higher, and active autoimmune diseases were excluded, as were patients receiving botanical preparations, systemic corticosteroids (> 10 mg daily prednisone or equivalent), or other immunosuppressive medications. Patients who had previously received immunotherapies, had allergy or hypersensitivity to study drug components, or had contraindications to XELOX or FOLFOX were excluded.
Baseline Characteristics
The baseline demographic and disease characteristics of randomized patients with PD-L1 CPS ≥ 5 and all randomized patients in the CheckMate-649 study are shown in Table 8. The mean ages of patients in the nivolumab plus chemotherapy and chemotherapy arms were 60.3 years and 59.9 years, respectively. Approximately 70% of patients were male, approximately 70% were White, and approximately 60% were enrolled at sites outside of North America and Asia. Approximately 70% of patients had GC and approximately ||||% had stage IV disease at diagnosis. Almost all patients (approximately 96%) had metastatic disease, while a minority (approximately 4%) had locally advanced or recurrent disease. Only a minority of patients (10% to 20%) had received prior surgery, ||||||||||||||||||||||||||||||||||||||||||||||||||||||||. Approximately 60% of patients had HER2-negative tumours, while HER2 status was not reported in approximately 40% of patients. Approximately 3% of patients were MSI-H. Approximately 83%, 61%, and 49% of patients had PD-L1 CPS ≥ 1, ≥ 5, and ≥ 10, respectively. Baseline demographic and disease characteristics were generally well balanced between study arms.
Table 8: Summary of Baseline Characteristics in the CheckMate-649 Trial
Characteristic | Patients with PD-L1 CPS ≥ 5 | All randomized patients | ||
|---|---|---|---|---|
Nivolumab + chemotherapy (N = 473) | Chemotherapy (N = 482) | Nivolumab + chemotherapy (N = 789) | Chemotherapy (N = 792) | |
Age, years | ||||
Mean | |||| | |||| | 60.3 | 59.9 |
Median (range) | 63.0 (18 to 88) | 62.0 (23 to 90) | 62.0 (18 to 88) | 61.0 (21 to 90) |
Age category, n (%) | ||||
< 65 years | |||| | |||| | 473 (59.9) | 488 (61.6) |
≥ 65 and < 75 years | |||| | |||| | 237 (30.0) | 229 (28.9) |
≥ 75 and < 85 years | |||| | |||| | 77 (9.8) | 69 (8.7) |
≥ 85 years | |||| | |||| | 2 (0.3) | 6 (0.8) |
≥ 75 years | |||| | |||| | 79 (10.0) | 75 (9.5) |
≥ 65 years | |||| | |||| | 316 (40.1) | 304 (38.4) |
Sex, n (%) | ||||
Female | 142 (30.0) | 133 (27.6) | 249 (31.6) | 232 (29.3) |
Male | 331 (70.0) | 349 (72.4) | 540 (68.4) | 560 (70.7) |
Race, n (%) | ||||
White | 328 (69.3) | 327 (67.8) | 556 (70.5) | 541 (68.3) |
Black or African American | 2 (0.4) | 7 (1.5) | 7 (0.9) | 11 (1.4) |
American Indian or Alaska Native | 10 (2.1) | 10 (2.1) | 12 (1.5) | 14 (1.8) |
Asian | 119 (25.2) | 117 (24.3) | 186 (23.6) | 189 (23.9) |
Other | 14 (3.0) | 21 (4.4) | 28 (3.5) | 36 (4.5) |
Not reported | 0 | 0 | 0 | 1 (0.1) |
Region, n (%) | ||||
Asia | 117 (24.7) | 111 (23.0) | 178 (22.6) | 178 (22.5) |
Asia excluding China | |||| | |||| | 79 (10.0) | 69 (8.7) |
North America | 67 (14.2) | 70 (14.5) | 131 (16.6) | 132 (16.7) |
Rest of world | 289 (61.1) | 301 (62.4) | 480 (60.8) | 482 (60.9) |
Primary tumour location at initial diagnosis, n (%) | ||||
GC | 333 (70.4) | 334 (69.3) | 554 (70.2) | 556 (70.2) |
GEJC | 84 (17.8) | 86 (17.8) | 132 (16.7) | 128 (16.2) |
EAC | 56 (11.8) | 62 (12.9) | 103 (13.1) | 108 (13.6) |
Disease stage at initial diagnosis, n (%) | ||||
Stage I | |||| | |||| | 7 (0.9) | 4 (0.5) |
Stage II | |||| | |||| | 25 (3.2) | 40 (5.1) |
Stage III | |||| | |||| | 108 (13.7) | 118 (14.9) |
Stage IV | |||| | |||| | 646 (81.9) | 628 (79.3) |
Not reported | |||| | |||| | 3 (0.4) | 2 (0.3) |
Disease status, n (%) | ||||
Locally recurrent | 3 (0.6) | 1 (0.2) | 5 (0.6) | 2 (0.3) |
Metastatic | 454 (96.0) | 461 (95.6) | 757 (95.9) | 756 (95.5) |
Locally advanced | 16 (3.4) | 20 (4.1) | 27 (3.4) | 34 (4.3) |
Lauren classification, n (%) | ||||
Intestinal type | 171 (36.2) | 176 (36.5) | 272 (34.5) | 267 (33.7) |
Diffuse type | 137 (29.0) | 141 (29.3) | 254 (32.2) | 273 (34.5) |
Mixed | 37 (7.8) | 30 (6.2) | 58 (7.4) | 48 (6.1) |
Unknown | 128 (27.1) | 135 (28.0) | 205 (26.0) | 204 (25.8) |
WHO histological classification (cell type), n (%) | ||||
Adenosquamous carcinoma | |||| | |||| | 107 (13.6) | 113 (14.3) |
Mucinous adenocarcinoma | |||| | |||| | 50 (6.3) | 49 (6.2) |
Papillary serous adenocarcinoma | |||| | |||| | 7 (0.9) | 5 (0.6) |
Signet ring cell | |||| | |||| | 145 (18.4) | 136 (17.2) |
Tubular adenocarcinoma | |||| | |||| | 128 (16.2) | 130 (16.4) |
Other | |||| | |||| | 352 (44.6) | 357 (45.1) |
Not reported | |||| | |||| | 0 | 2 (0.3) |
Smoking status, n (%) | ||||
Current/former | |||| | |||| | 376 (47.7) | 385 (48.6) |
Never smoked | |||| | |||| | 395 (50.1) | 378 (47.7) |
Unknown | |||| | |||| | 18 (2.3) | 29 (3.7) |
Metastases, n (%) | ||||
Liver | 191 (40.4) | 217 (45.0) | 301 (38.1) | 314 (39.6) |
Peritoneal | 101 (21.4) | 96 (19.9) | 188 (23.8) | 188 (23.7) |
HER2 status, n (%) | ||||
Positive | |||| | |||| | 3 (0.4) | 4 (0.5) |
Negative | |||| | |||| | 459 (58.2) | 472 (59.6) |
Unknown | |||| | |||| | 5 (0.6) | 4 (0.5) |
Not reported | |||| | |||| | 322 (40.8) | 312 (39.4) |
MSI, n (%) | ||||
MSI-H | 18 (3.8) | 16 (3.3) | 23 (2.9) | 21 (2.7) |
MSS | 423 (89.4) | 423 (87.8) | 695 (88.1) | 682 (86.1) |
Invalid/not reported | 32 (6.8) | 43 (8.9) | 71 (9.0) | 89 (11.2) |
ECOG performance status, n (%) | ||||
0 | 202 (42.7) | 207 (42.9) | 349 (44.2) | 349 (44.1) |
1 | 271 (57.3) | 275 (57.1) | 440 (55.8) | 443 (55.9) |
PD-L1 CPS quantifiable at baseline (yes), n (%) | 473 (100.0) | 482 (100.0) | 781 (99.0) | 780 (98.5) |
PD-L1 CPS,a mean (SD) | |||| | |||| | 18.2 (25.0) | 19.9 (26.6) |
Median (range) | |||| | |||| | 5.0 (0 to 100) | 10.0 (0 to 100) |
PD-L1 CPS category, n (%)a | ||||
≥ 1 | |||| | |||| | 641 (82.1) | 655 (84.0) |
< 1 | |||| | |||| | 140 (17.9) | 125 (16.0) |
≥ 5 | |||| | |||| | 473 (60.6) | 482 (61.8) |
< 5 | |||| | |||| | 308 (39.4) | 298 (38.2) |
≥ 10 | |||| | |||| | 375 (48.0) | 393 (50.4) |
< 10 | |||| | |||| | 406 (52.0) | 387 (49.6) |
Prior therapies, n (%) | ||||
Systemic anticancer therapyb | |||| | |||| | 105 (13.3) | 112 (14.1) |
Surgery | |||| | |||| | 160 (20.3) | 176 (22.2) |
Radiotherapy | |||| | |||| | 75 (9.5) | 77 (9.7) |
CPS = combined positive score; EAC = esophageal adenocarcinoma; ECOG = Eastern Cooperative Oncology Group; GC = gastric cancer; GEJC = gastroesophageal junction cancer; HER2 = human epidermal growth factor receptor 2; MSI = microsatellite instability; MSI-H = microsatellite instability-high; MSS = microsatellite stable; NR = not reported; PD-L1 = programmed death ligand 1.
aMeasured among patients with quantifiable PD-L1.
bAnticancer therapy (platinum-based or other chemotherapy) in the adjuvant, neo-adjuvant, or definitive chemoradiation setting.
Source: CheckMate-649 Clinical Study Report.14
Interventions
Patients were randomized 1:1:1 to receive nivolumab 360 mg plus XELOX every 3 weeks or nivolumab 240 mg plus FOLFOX every 2 weeks; XELOX every 3 weeks or FOLFOX every 2 weeks; or 4 cycles of nivolumab 1 mg/kg plus ipilimumab 3 mg/kg every 3 weeks, followed by nivolumab monotherapy 240 mg every 2 weeks. Only data for the first 2 arms are presented in this report. Investigators were free to choose either FOLFOX or XELOX, depending on local standards. Chemotherapy regimens (FOLFOX versus XELOX) were selected at the discretion of investigators before randomization. The study was OL, and protocol therapy included a mixture of IV and oral drugs. All therapy was administered by study personnel at site visits, except for capecitabine, which was self-administered.
Nivolumab was administered at a dose of 360 mg every 3 weeks or 240 mg every 2 weeks on day 1 of 3- or 2-week treatment cycles. The 240 mg every 2 weeks dosage is equivalent to 3 mg/kg every 2 weeks used across multiple indications, and the 360 mg every 3 weeks dosage was expected to result in similar exposure, based on pharmacokinetic modelling. In patients who discontinued chemotherapy, nivolumab 240 mg every 2 weeks, 360 mg every 3 weeks, or 480 mg every 4 weeks could be administered as monotherapy, depending on local standard of care. Nivolumab infusions were administered over 30 minutes.
FOLFOX and XELOX were administered as per local standard of care. For FOLFOX, oxaliplatin 85 mg/m2, leucovorin 400 mg/m2, and 5-fluorouracil 400 mg/m2 were administered IV on day 1 of each 2-week treatment cycle, and 5-fluorouracil 1,200 mg/m2 was administered by IV continuous infusion over 24 hours (or per local standard) daily on days 1 and 2 of each 2-week treatment cycle. For XELOX, oxaliplatin 130 mg/m2 was administered IV on day 1 of each treatment 3-week treatment cycle, and capecitabine 1,000 mg/m2 was administered orally twice daily on days 1 to 14 of each 3-week treatment cycle.
For patients receiving nivolumab plus chemotherapy, the maximum treatment period was 24 months. Treatment with nivolumab plus chemotherapy beyond initial, investigator-assessed progressive disease was allowed if the patient had investigator-assessed clinical benefit and was tolerating treatment. Further progression (increase in tumour burden ≥ 10%) resulted in discontinuation of nivolumab plus chemotherapy. Treatment beyond progressive disease was not allowed for patients receiving chemotherapy alone. In the nivolumab plus chemotherapy arm, either nivolumab or chemotherapy could be administered alone if the other component was discontinued due to toxicity or per local standard of care. The rules for nivolumab and chemotherapy dose reduction, dose interruption/delay, and discontinuation were as follows. Dose reductions of nivolumab were not permitted (although dose reductions of chemotherapy for toxicity were permitted according to local guidelines or package insert). Dose delays of nivolumab of up to 6 weeks were permitted for any AEs Grade 2 or higher or laboratory abnormalities until resolution of toxicities to Grade 1 or lower and discontinuation or tapering of corticosteroids (if administered) to 10 mg or less of prednisone daily or equivalent. Prior to Revised Protocol 07 (Amendment 23, September 14, 2018), all components of therapy were delayed together, while, after this amendment, dose delays of nivolumab and chemotherapy could be made independently. Infusion reactions (Grade 2) were treated with diphenhydramine, acetaminophen, corticosteroids, and decreased (50%) infusion rate for 30 minutes. Grade 3 or 4 infusion reactions that persisted following dose interruption resulted in permanent discontinuation of nivolumab. Nivolumab was also discontinued in patients who experienced a variety of AEs of Grade 3 or higher.
Immunosuppressive drugs, immunosuppressive doses of systemic corticosteroids (> 10 mg prednisone daily or equivalent), and concurrent antineoplastic therapies were prohibited. Topical and inhaled corticosteroids, adrenal replacement steroid dosages of more than 10 mg daily prednisone (or equivalent), and brief (< 3 weeks) courses of corticosteroids for prophylaxis or treatment of non-autoimmune conditions were permitted. In participants who experienced infusion reactions to nivolumab in any cycle, secondary prophylaxis with diphenhydramine, acetaminophen, and if necessary, corticosteroids (up to 25 mg hydrocortisone) were recommended as premedication in future cycles.
Outcomes
A list of efficacy end points identified in the CADTH review protocol that were assessed in the CheckMate-649 study is provided in Table 9. These end points are further summarized in this section. A detailed discussion and critical appraisal of the outcome measures is provided in Appendix 5. OS, PFS, and ORR are standard outcome measures in oncology trials; according to the clinical experts consulted by CADTH for this review, differences in survival outcomes of at least 6 weeks would be clinically meaningful in this patient population.
The EQ-5D-3L29 is a generic, preference-based HRQoL instrument that has been applied to a wide range of health conditions and treatments. It is a self-administered questionnaire consisting of a descriptive system with 5 dimensions (mobility, self-care, usual activities, pain/discomfort, and anxiety/depression), each with 3 response options, as well as a VAS. A scoring function can be used to assign a population-preference weighted utility index value based on responses to descriptive system items. Utility index scores vary depending on the utility function (e.g., –0.59 for the UK algorithm and –0.109 for the US algorithm); utility index scores less than 0 represent health states worse than death, while score of 0 and 1 represent “dead” and “perfect health,” respectively. For the EQ VAS, the end points of 0 and 100 represent “worst imaginable health state” and “best imaginable health state,” respectively. The instrument has been extensively validated and shown to be reliable and responsive to change in many cancers; the minimal important difference (MID) for the utility index score has been estimated at approximately 0.09 to 0.12 (UK) and 0.06 to 0.09 (US), and the MID for the EQ VAS has been estimated at approximately 7 to 12 points. This instrument has not been validated specifically in patients with GAC, GEJAC, or EAC, and a disease-specific MID has not been determined.
The FACT-Ga30 combines the functional assessment of cancer therapy – general (FACT-G; a self-administered, cancer-specific, preference-based HRQoL instrument consisting of 27 items evaluated on a 5-point Likert scale in 4 domains: physical, social/family, emotional, and functional well-being) and a 19-item GaCS. The FACT-G7 is an abbreviated form of the FACT-G, consisting of only 7 items in 4 domains (physical, emotional, and functional well-being) that was designed to quickly capture the most relevant issues to patients with cancer. In the CheckMate-649 study, the FACT-Ga instrument was used during the treatment period, and the FACT-G7 was used during survival follow-up. The GaCS of the FACT-Ga is a disease-specific subscale that assesses symptoms and impacts relating to pain, reflux, dysphagia, eating difficulties, tiredness, weakness, interference, and difficulty planning. FACT-Ga total scores range from 0 to 184, with higher values representing better HRQoL. FACT-Ga GaCS scores range from 0 to 76, with higher values representing better HRQoL. The FACT-Ga has been extensively validated and found to be reliable and responsive to change in patients with GC; however, the GaCS has not been validated as a stand-alone scale, and the degree to which it specifically measures changes in symptoms versus general HRQoL is unclear. The MID for the total FACT-Ga score was estimated at 15.1 to 22.6 points, and the MID for the GaCS subscale was estimated at 8.2 to 12.3 points.
Refer to Appendix 6 for a detailed appraisal of HRQoL outcomes.
Table 9: Summary of Outcomes of Interest Identified in the CADTH Review Protocol
Outcome measure | CheckMate-649 |
|---|---|
OSa in patients with PD-L1 CPS ≥ 5 | Co-primary |
OSa in patients with PD-L1 CPS ≥ 1 | Hierarchically tested secondary |
OSa in all randomized patients | Hierarchically tested secondary |
OSa in patients with PD-L1 CPS ≥ 10 | Secondary |
HRQoL (EQ-5D-3L utility index score and VAS; FACT-Ga total and subscale scores; FACT-G7 total score) | Exploratory |
PFSb per BICR in patients with PD-L1 CPS ≥ 5 | Co-primary |
PFSb per BICR in patients with PD-L1 CPS ≥ 10, patients with PD-L1 CPS ≥ 1, and all randomized patients | Secondary |
ORRc per BICR in patients with PD-L1 CPS ≥ 10, patients with PD-L1 CPS ≥ 5, patients with PD-L1 CPS ≥ 1, and all randomized patients | Secondary |
DORd per BICR in patients with PD-L1 CPS ≥ 10, patients with PD-L1 CPS ≥ 5, patients with PD-L1 CPS ≥ 1, and all randomized patients | Exploratory |
TTSD (FACT-Ga GaCS score)e | Exploratory |
BICR = blinded independent central review; CPS = combined positive score; DOR = duration of response; FACT-Ga = functional assessment of cancer therapy – gastric; FACT-G7 = 7-item version of the FACT – general; GaCS = gastric cancer subscale; HRQoL = health-related quality of life; ORR = objective response rate; OS = overall survival; PD-L1 = programmed death ligand 1; PFS = progression-free survival; TTSD = time to symptom deterioration; VAS = visual analogue scale.
aDefined as time from randomization until death from any cause. For patients without documented death, OS was censored at the date last known alive. OS was not censored for patient who initiated subsequent anticancer therapies.
bDefined as time from randomization to date of first progressive disease or death from any cause, whichever came first. Patients without progressive disease or death were censored at the last evaluable tumour assessment before initiation of subsequent anticancer therapy.
cDefined as number of patients with a best overall response of complete or partial response by RECIST 1.1 based on BICR assessments divided by the number of randomized patients. Best overall response was measured between randomization and date of progressive disease or initiation of subsequent anticancer therapy, whichever came first.
dDefined as time between first confirmed response and first documented progression by RECIST 1.1 or death from any cause, whichever occurred first.
eDefined as time from randomization to a clinically meaningful decline (8.2 points) from baseline in GaCS score. Only events before treatment discontinuation were taken into account. Patients who did not deteriorate before treatment discontinuation were censored at the date of last GaCS assessment.
Source: CheckMate-649 Clinical Study Report.14
During the treatment period (until progressive disease, unacceptable toxicity, or 24 months for the nivolumab plus chemotherapy arm), tumour response was assessed by CT/PET at baseline (within 4 weeks before randomization), every 6 (± 1) weeks for the first 48 weeks, and then every 12 (± 1) weeks. For each patient, the same imaging modality was used to assess tumour response throughout the study. Patients who discontinued treatment due to toxicity continued with tumour response assessments at the protocol-required schedule until progressive disease or withdrawal of consent. Designation of response was based on the response of target and non-target lesions and the appearance of any new lesions using RECIST, version 1.1. Progressive disease was defined as a predefined increase (20%), taking as reference the smallest sum on study, in the sum of target lesions or the appearance of new non-target lesions; the sum must also demonstrate an absolute increase of at least 5 mm. Partial response (PR) was defined as at least a 30% decrease in the sum of diameters of target lesions, taking as reference the baseline sum diameters. Complete response (CR) was defined as disappearance of all target lesions, with reduction of the short axis of any pathological lymph nodes to less than 10 mm. Stable disease was defined as neither sufficient shrinkage (compared to baseline) to qualify for PR nor sufficient increase (taking as reference the smallest sum diameters while on study) to qualify for progressive disease.
||||||||||||||||||||||||||||||||||||||||||||||||||||||||||||||||||||||||||||||||||||||||||||||||||||||||||||||||||||||||||||||||||||||||||||||||||||||||||||||||||||||||||||||||||||||||||||||||||||||||||||||||||||||||||||||||||||||||||||||||||||||||||||||||||||||||||||||||||||||||||||||||||||||||||||||||||||||||||||||||||||||||||||||||||||||||||||||||||||||||||||||||||||||||||||||||||||||||||||||||||||||||||||||||||||||||||||||||||||||||||||||||||||||||||||||||||||||||||||||||||||||||||||||||||||||||||||||||||||||||||||||||||||||||||||||||||||||||||||||||||||||||||||||||||||||||||||||||||||||||||||||||||||||||||||||||||||||||||||||||||||||||||||||||||||||||||||||||||||||||||||||||||||||||||||||||||||||||||||||||||||||||||||||||||||||||||||||||||||||||||||||||||||||||||||||||||||||||||||||||||||||||||||||||||||||||||||||||||||||||||||||||||||||||||||||||||||||||||||||||||||||| ||||||||||||||||||||||||||||||||||||||||||||||||||||||||||||||||||||||||||||||||||||||||||||||||||||||||||||||||||||||||||.
The co-primary outcomes were OS (defined as time from randomization to death from any cause) and PFS per BICR (defined as time from randomization to date of first objective progressive disease or death from any cause, whichever came first) among patients with PD-L1 CPS of 5 or higher. PD-L1 CPS was calculated as the number of PD-L1 positive cells (tumour cells, lymphocytes, and macrophages) divided by the total number of viable tumour cells within the evaluated tumour area, multiplied by 100. For patients without documentation of death, OS was censored at the last date known alive but was not censored when patients initiated other anticancer therapy. For patients without objective progressive disease or death, PFS was censored at the last tumour assessment (or randomization date if no assessments) before or on the date of initiation of other anticancer therapy. OS among patients with PD-L1 CPS of 1 or higher and all randomized patients were hierarchically tested secondary outcomes. OS among patients with PD-L1 CPS of 10 or higher, PFS among patients with PD-L1 CPS of 10 or higher, PFS among patients with PD-L1 CPS of 1 or higher, and PFS among all randomized patients were secondary outcomes. ORR (proportion of patients with PR or CR by RECIST 1.1) per BICR was evaluated in patients with PD-L1 CPS of 10 or higher, PD-L1 CPS of 5 or higher, PD-L1 CPS of 1 or higher, and all randomized patients; all were secondary outcomes.
DOR, defined as time from first objective response per BICR until first objective progressive disease per BICR or death from any cause, whichever occurred first, was evaluated as an exploratory outcome. During the treatment period, patients completed the EQ-5D-3L and FACT-Ga every 6 weeks. During survival follow-up, patients completed the EQ-5D-3L, the GaCS, and FACT-G7 every 3 months. Time to symptom deterioration (TTSD) was defined as time from randomization until a decline from baseline in GaCS score of 8.2 points. TTSD was only evaluated before treatment discontinuation. EQ-5D-3L index scores were determined using a scoring algorithm based on the UK Time-Trade-Off value set.
Following treatment discontinuation, survival follow-up occurred 30 days and 84 days after the last dose of protocol therapy and then every 3 months (in person or by phone).
Harms outcomes included treatment-emergent AEs; serious AEs (SAEs); AEs requiring dose interruption, dose delay, or dose reduction; withdrawals due to AE (WDAEs); select AEs; IMAEs; and other events of significant interest (OESIs). Definitions of select AEs, IMAEs, and OESIs are listed in Table 10. AEs that began or worsened on or after the start of protocol therapy until 30 days after the last dose of study drug were captured, except for deaths (no time limit) and IMAEs/OESIs (100 days after last dose). AEs were defined as any untoward medical occurrence and were coded according to Medical Dictionary for Regulatory Activities version 23.0 and graded according to the National Cancer Institute Common Terminology Criteria for Adverse Events version 4.0.
Table 10: Definitions of Select AEs, IMAEs, and OESIs in the CheckMate-649 Trial
Outcome measure | Preferred terms |
|---|---|
Select AEs | |
|||||||||||||||||||| | |
|||||||||||||||||| | |||||||||||||||||||||||||||||||||||||||||||||||||||||||||||||||||||||||||||||||||||||||||||||||||||||||||||| |||||||||||||||||||||||||||||||||||||||||||||||||||||||||||||||||||||||||||||||||||||||||||||||||||||||||||| |||||||||||||||||||||||||||||||||||||||||||||||||||||||||||||||||||||||||||||||||||||||||||||||||||||||||||||| |
|||||||||||||||||||| | |||||||||||||||||||||||||||||||||||||||||||||||||||||||||||||||||||||||||||||||||||||||||||||||||||||||| |||||||||||||||||||||||||||||||||||||||||||||||||||||||||||||||||||||||||||||||||||||||||||||||||||||||||||| |||||||||||||||||||||||||||||||||||||||||||||||||||||||||||||||||||||||||||||||||||||||||||||||||||| |||||||||||||||||||||||||||||||||||||||||||||||||||||||||||||||||||||||||||||||||||||||||||||||||||||||||| |
IMAEs | |
|||||||||||||||||||| | |||||||||||||||||||||||||||||||||||||||||||||||||||||||||||||||||||||||||||||||||||||||||||||||||||||||||| |||||||||||||||||||||||||||||||||||||||||||||||||||||||||||||||||||||||||||||||||||||||||| |
|||||||||||||||||||| | |||||||||||||||||||||||||||||||||||||||||||||||||||||||||||||||||||||||||||||||||||||||||||||||||||||||||| |||||||||||||||||||||||||||||||||||||||||||||||||||||||||||||||||||||||||||||||||||||||||| |
OESIs | |
|||||||||||||||||||| | |||||||||||||||||||||||||||||||||||||||||||||||||||||||||||||||||||||||||||||||||||||||||||||||||||||||||||||||||||||||||||||||||||||||||||||||||| |
|||||||||||||||||||| | |||||||||||||||||||||||||||||||||||||||||||||||||||||||||||||||||||||||||||||||||||||||||||||||||||| |||||||||||||||||||||||||||||||||||||||||||||||||||||||||||||||||||||||||||||||||||||||||||||||||||| |||||||||||||||||||||||||||||||||||||||||||||||||||||||||||||||||||||||||||||||||||||||||||||| |||||||||||||||||||||||||||||||||||||||||||||||||||||||||||||||||||||||||||||||||||||||||||||||||||||||||||||| |||||||||||||||||||||||||||||||||||||||||||||||||||||||||||||||||||||||||||||||||||||||||||||||||||||| |||||||||||||||||||||||||||||||||||||||||||||||||||||||||||||||||||||||||||||||||||||||||||||||||||||||| |||||||||||||||||||||||||||||||||||||||||||||||||||||||||||||||||||||||||||||||||||||||||||||||||||| |||||||||||||||||||||||||||||||||||||||||||||||||||||||||||||||||||||||||||||||||||||||||||||||||||||||||||||||||||||||||||||||| |
AE = adverse event; IMAE = immune-mediated adverse event; OESI = other event of significant interest.
Note: Redacted rows have been deleted.
Source: CheckMate-649 Clinical Study Report.14
Statistical Analysis
Statistical analysis of efficacy outcomes in the CheckMate-649 study is summarized in Table 11. As of the most recent protocol amendment, the final PFS and interim OS analyses were planned to be conducted at a minimum follow-up time of 12 months, and final OS analysis was planned to be conducted at a minimum follow-up of 24 months. At the time of the interim OS analysis, if DMC review had determined that the pre-specified significance levels for all of the objectives in the statistical testing hierarchy were not met, the study would have been terminated.
Table 11: Statistical Analysis of Efficacy End Points in the CheckMate-649 Trial
Type | End point | Position in statistical hierarchy | Statistical model | Adjustment factors | Sensitivity analyses |
|---|---|---|---|---|---|
Co-primary | OS in patients with PD-L1 CPS ≥ 5 | 1 (alpha = 0.03) | Two-sided long-rank test stratified by randomization factors; KM analysis with median survival and 95% CIs calculated via the log-log transformation method; survival rates at fixed time points from KM analysis with CIs based on the Greenwood formula for variance derivation and on log-log transformation applied on the survivor function; HRs and CIs calculated using stratified Cox proportional hazards models with treatment as the sole covariate | Stratification factors:
|
|
Co-primary | PFS per BICR in patients with PD-L1 CPS ≥ 5 | 1 (alpha = 0.02) | As per OS analysis | As per OS analysis | As per OS analysis |
Hierarchically tested secondary | OS in patients with PD-L1 CPS ≥ 1 | 2 (alpha = 0.015) | As per primary analysis | As per primary analysis | As per primary analysis |
Hierarchically tested secondary | OS in all randomized patients | 3 (alpha = 0.015) | As per primary analysis | As per primary analysis | As per primary analysis |
Secondary | OS in patients with PD-L1 CPS ≥ 10 | NA | As per primary analysis | As per primary analysis | NA |
Secondary | PFS per BICR in patients with:
| NA | As per primary analysis | As per primary analysis | NA |
Secondary | ORR per BICR in patients with:
| NA | Differences between groups in ORs assessed using the Cochran-Mantel-Haenszel method stratified by randomization factors; 2-sided 95% CIs for ORR calculated using the Clopper-Pearson method | As per primary analysis | NA |
Exploratory | DOR per BICR in patients with:
| NA | As per primary analysis (without log-rank test) | As per primary analysis | NA |
Exploratory | HRQoL (EQ-5D-3L utility index score and VAS, FACT-Ga total and subscale scores, FACT-G7 total score) | NA | Descriptive and summary statistics | NA | NA |
Exploratory | TTSD (GaCS/FACT-Ga GaCS) | NA | As per primary analysis (without log-rank test) | As per primary analysis | Accounting for events of deterioration or death during treatment; accounting for events that occurred on or after treatment discontinuation |
BICR = blinded independent review committee; CI = confidence interval; CPS = combined positive score; DOR = duration of response; ECOG PS = Eastern Cooperative Oncology Group performance status; FACT-Ga = functional assessment of cancer therapy – gastric; FACT-G7 = 7-item version of the FACT – general; FOLFOX = oxaliplatin + leucovorin + 5-fluorouracil; GaCS = gastric cancer subscale; HR = hazard ratio; HRQoL = health-related quality of life; KM = Kaplan-Meier; NA = not applicable; OR = odds ratio; ORR = objective response rate; OS = overall survival; PD-L1 = programmed death ligand 1; PFS = progression-free survival; ROW = rest of world; TTSD = time to symptom deterioration; VAS = visual analogue scale; vs. = versus; XELOX = oxaliplatin + capecitabine.
aFor OS: stratified analysis based on first 420 randomized patients with PD-L1 CPS ≥ 5, and based on first 354 OS events among all randomized patients with PD-L1 CPS ≥ 5. For PFS: stratified analysis based on first 228 PFS events among the first 298 randomized patients with PD-L1 CPS ≥ 5.
Source: CheckMate-649 Clinical Study Report.14
Type I error was controlled using a hierarchical testing strategy. For the co-primary end points of PFS and OS among patients with PD-L1 CPS of 5 or higher, a 2-sided family-wise error rate of 5% was split between the co-primary outcomes: 2% was allocated to PFS and 3% was allocated to OS. If the OS comparison (nivolumab plus chemotherapy versus chemotherapy) in patients with PD-L1 CPS of 5 or higher was significant, then OS in patients with PD-L1 CPS of 1 or higher and OS in all randomized patients would be sequentially tested at a 2-sided significance level of 1.5% (0.7% each). For analysis of OS in patients with PD-L1 CPS of 5 or higher, patients with PD-L1 CPS of 1 or higher, and all randomized patients, the significance levels at the interim and final analyses were obtained using the Lan-DeMets alpha spending function with O’Brien-Fleming type boundary. At the time of the interim analysis, the significance level was based on actual OS events observed and the estimated final number of events; the alpha boundary was 0.016 based on the spending function. At the final analysis, the significance level will be calculated using the number of events, with consideration of the alpha already spent at the interim analysis. For the interim analysis of OS in randomized patients with PD-L1 CPS of 1 or higher and all randomized patients, the significance levels were obtained using the same information fraction as for patients with PD-L1 CPS of 5 or higher.
In the original study design (1:1:1 randomization to nivolumab plus chemotherapy, chemotherapy, or nivolumab plus ipilimumab followed by nivolumab monotherapy), comparisons between the nivolumab plus ipilimumab followed by nivolumab monotherapy and chemotherapy arms were accounted for in the statistical hierarchy and were nested to be tested following the co-primary OS and PFS analyses in patients with PD-L1 CPS of 5 or higher.
Power for Interim and Final Analyses
The final sample size was based on an event-driven analysis (total 2,005 patients). The final PFS analysis and the interim OS analysis was planned at a minimum follow-up of 12 months. The final OS analysis was planned at a minimum follow-up of 24 months. At the database lock of July 10, 2020, the minimum follow-up was 12.1 months (e.g., final PFS and interim OS analysis). Given changes in the study protocol, and assuming that the prevalence of PD-L1 CPS of 5 or higher was 35%, it was estimated that for the July 10, 2020 cut-off (final PFS analysis and interim OS analysis), the primary analysis population would consist of 554 patients with PD-L1 CPS of 5 or higher concurrently randomized to the nivolumab plus chemotherapy and chemotherapy arms. The HR for PFS was modelled as a 2-piece HR with a delayed effect (HR = 1) for the first 3 or 6 months, followed by a constant HR of 0.56 thereafter. With a type I error of 2% at 12 months minimum follow-up, the expected number of PFS events was estimated to be 497 for a 3-month delayed separation of Kaplan-Meier (KM) curves and approximately 99% power, or 506 PFS events for a 6-month delay and approximately 60% power. For OS, the HR was modelled as a 2-piece HR (a delayed effect with a HR of 1 versus chemotherapy for the first 6 months, followed by a constant HR of 0.65 thereafter). At 24 months minimum follow-up (the final analysis), it was expected that 466 events would be observed, providing a power of approximately 85% with a type I error of 3% (2-sided). The actual observed prevalence of PD-L1 CPS of 5 or higher was 60% in the locked database of July 10, 2020 among all randomized patients in the 3 treatment arms. Therefore, the power for PFS and OS analyses was based on 949 patients concurrently randomized to nivolumab plus chemotherapy versus chemotherapy. Using the same PFS model as in the design, with 3 months or 6 months delayed treatment effect, the expected number of PFS events would be 841 and 857, with corresponding power of 99.9% and 84%, respectively. For OS, the expected number of events, using the same model as in the design, was 800 events, providing a power of 97.9%.
|||||||||||||||||||||||||||||||||||||||||||||||||||||||||||||||||||||||||||||, data for a February 16, 2021, database lock were provided, reflecting a minimum follow-up of 19.4 months. The planned final analysis of OS (minimum follow-up 24 months) is expected in late 2021 and will include the analysis of the nivolumab plus ipilimumab arm. Power calculations for the February 16, 2021, database lock were not provided.
Protocol Changes
Power considerations for the CheckMate-649 study were affected by amendments to the original study protocol (May 4, 2016) over time, which are summarized in this section. In the original study design, the primary objective was to compare OS in patients with tumour cell PD-L1 ≥ 1% treated with nivolumab plus ipilimumab versus chemotherapy. The planned sample size was 750 patients, based on a piecewise mixture cure rate (with cure defined as long-term survival beyond the study follow-up period) assuming 3 months of delayed separation of curves between nivolumab plus ipilimumab and chemotherapy, a 15% cure rate in the nivolumab plus ipilimumab arm, an HR of 0.7 in non-cured patients, and median OS of 8 months in Europe or North America and 9.6 months in Japan. A total of 240 events in the approximately 300 patients with tumour cell PD-L1 of 1% or more among 750 randomized patients would provide approximately 90% power to detect an average HR of 0.64 with a type I error of 5% (2-sided).
The major changes to the study protocol are as follows:
In Revised Protocol 02 (Amendment 08; December 7, 2016) the nivolumab plus chemotherapy arm was added, based on positive results of the CA20901231 and KEYNOTE-05932 studies. Subsequent randomization was 1:1:1, and the total sample size was increased to 1,349 patients. At the time of this protocol change, 83 patients had been randomized under the original protocol, with 1:1 randomization. The family-wise error rate (5%) was split equally between the 2 comparisons (nivolumab plus ipilimumab versus chemotherapy and nivolumab plus chemotherapy versus chemotherapy).
In Revised Protocol 04 (Amendment 17, January 5, 2018), PFS and ORR were added as primary end points for the nivolumab plus chemotherapy versus chemotherapy comparison, and the primary analysis population for this comparison was changed to all randomized patients, based on positive results of the ATTRACTION-4 study.16 The overall significance level of 2.5% allocated to the nivolumab plus chemotherapy versus chemotherapy comparison was split 0.9% for PFS, 1.5% for OS, and 0.1% for ORR.
In Revised Protocol 05 (Amendment 19, May 29, 2018), the sample size was increased to 1,649 patients to enable more robust analysis across different PD-L1 cut-offs, based on data from the ATTRACTION-416 and KEYNOTE-06133 studies.
In Revised Protocol 06 (Amendment 20, June 11, 2018), the DMC conducted a pre-planned safety review. Enrolment in the nivolumab plus ipilimumab arm was closed, following DMC review of all 1,003 randomized patients in the 3 treatment arms, due to concerns of the DMC regarding increased early death rates and high toxicity rates.
In Revised Protocol 07 (Amendment 23, September 14, 2018), the primary analysis population for the nivolumab plus chemotherapy versus chemotherapy comparison was changed again, from all randomized patients to patients with PD-L1 CPS ≥ 5, based on data from the CA209032,34 KEYNOTE-059,32 and KEYNOTE-06133 studies. OS and PFS were maintained as primary end points, and ORR was moved to a secondary end point. The family-wise error rate of 5% was split 2% for PFS and 3% for OS. The PFS analysis was planned when 228 events occurred in the first 298 patients with PD-L1 CPS ≥ 5, to ensure a minimum follow-up of approximately 8 months. Two interim analyses of OS were planned when 248 and 301 events had occurred in patients with PD-L1 CPS of 5 or higher (the number of patients with PD-L1 CPS ≥ 5 was assumed to be 420).
In Revised Protocol 08 (Amendment 26, November 15, 2018), the sample size was increased to 2,005 patients, based on pooled blinded monitoring of PD-L1 CPS of 5 or higher prevalence in the CheckMate-649 study. This was necessary to achieve the planned 420 patients with PD-L1 CPS of 5 or higher in the primary PFS and OS analyses.
In Revised Protocol 09 (Amendment 29, September 16, 2019), the trigger for PFS/OS analyses was changed from event-driven to time-driven, when it was detected that PD-L1 CPS had been significantly underscored for a proportion of study participants, and thus samples had to be rescored. Since enrolment was completed before this amendment, the final sample size (2,005 patients in total) remained based on the original event-driven analysis. The primary analysis population for PFS was updated to patients with PD-L1 CPS of 5 or higher, and the 2 interim OS analyses were reduced to a single interim analysis. Based on data from the KEYNOTE-062 study35 showing delayed separation of the PFS and OS KM curves, the timing of the PFS and OS analyses was changed to a minimum follow-up of 12 months (for the final PFS analysis and the interim OS analysis) and 24 months (for the final OS analysis); these analyses would be based on all events observed at the time of database lock.
Analytical Techniques
For the co-primary end points of OS and PFS per BICR in patients with PD-L1 CPS ≥ 5, the nivolumab plus chemotherapy and chemotherapy arms were compared using a 2-sided stratified log-rank test. The HR comparing treatment arms was calculated from stratified Cox proportional hazards model, with treatment as the sole covariate. Ties were handled using the exact method. Stratification factors for these analyses were region (Asia versus North America versus rest of world), ECOG PS (0 versus 1), chemotherapy regimen (XELOX versus FOLFOX), and tumour cell PD-L1 (≥ 1% versus < 1%, including indeterminate). CIs were adjusted for the corresponding significance level of the HR. The PFS and OS functions were estimated using the KM product limit method; 2-sided 95% CIs for median survival were obtained by log-log transformation. PFS and OS rates at fixed time points and their 95% CIs were derived from KM analysis, using the Greenwood formula variance derivation and on log-log transformation of the survivor function. Analysis of OS and PFS as secondary outcomes in patients with different PD-L1 CPS and analysis of DOR was performed in the same manner as the primary analysis.
ORR and its exact 95% CI was calculated in each treatment group using the Clopper-Pearson method. The difference in ORRs between treatment groups, and the corresponding 95% CI, was calculated using the Cochran-Mantel-Haenszel test, adjusted by stratification factors used for randomization. Stratified ORs, and their 95% CIs, were calculated using the Mantel-Haenszel estimator. Patients who discontinued the study and tumour assessments before objective CR or PR were counted as non-responders. Patient-reported HRQoL data (EQ-5D-3L utility index score and VAS, FACT-Ga total and subscale scores, and FACT-G7 total score) were presented as descriptive and summary statistics. Analysis of HRQoL data was restricted to randomized patients who had an assessment at baseline and at least 1 post-baseline assessment. TTSD was analyzed in the same manner as the primary analyses. A sensitivity analysis was conducted for TTSD, accounting for events (deterioration of symptoms) on or after treatment discontinuation. For HRQoL outcomes (EQ-5D-3L utility index scores and VAS, FACT-Ga total and GaCS score, FACT-G7 scores), missing data were not accounted for, and observed data were presented without imputation. The strategy used for calculation of EQ-5D-3L utility index scores, FACT-G7 scores, and FACT-Ga total and GaCS scores for partially completed questionnaires was not stated.
Sensitivity analyses for the co-primary and hierarchically tested secondary OS and PFS analyses included unstratified analysis, unstratified analysis with stratification factors as covariates, and the originally planned event-driven analysis of Revised Protocol 07. Subgroup analyses of pre-specified subgroups (by region, ECOG PS, chemotherapy regimen, age, sex, race, tumour location at diagnosis, disease stage at diagnosis, locally recurrent/advanced versus metastatic disease, prior cancer surgery, prior radiotherapy, Lauren classification, WHO histologic classification, TNM (tumour, lymph node, metastasis) classification, presence of target lesions, number of organs with baseline lesions, time from diagnosis to randomization, peritoneal metastasis, and liver metastasis) were conducted as per the primary analysis in exploratory fashion. The study was not specifically powered to evaluate outcomes in individual strata.
Analysis Populations
The screened population consisted of all patients concurrently randomized to receive nivolumab plus chemotherapy or chemotherapy, as well as patients enrolled as of the start of the 1:1:1 randomization and not randomized to any of the treatment arms. All randomized patients consisted of the set of patients randomized concurrently to receive nivolumab plus chemotherapy or chemotherapy starting on April 17, 2017. Patients randomized to chemotherapy before the addition of the nivolumab plus chemotherapy arm were not included in the set of randomized patients. All efficacy analyses were conducted in the set of randomized patients. Treated patients (the safety set) consisted of patients concurrently randomized to receive nivolumab plus chemotherapy or chemotherapy who received at least 1 dose of study drug.
Results
Unless noted otherwise, data presented are from the July 10, 2020, database lock.
Patient Disposition
The total number of patients screened in the CheckMate-649 study across all phases was ||||| patients (including the original 1:1 randomization to nivolumab plus ipilimumab versus chemotherapy, 1:1:1 randomization after the nivolumab plus chemotherapy arm was introduced, and the continuing 1:1 randomization to nivolumab plus chemotherapy versus chemotherapy after the nivolumab plus ipilimumab arm was closed). Screening information was provided for the entire study (||||| patients screened). Overall, 2,031 patients were randomized to all 3 arms of the study, and 1,155 (36.3%) were screen failures. The most common reason for screen failure was “patient no longer meets study criteria” (900 patients, 28.2%) because of HER2 positivity (130 patients, 14.4%), no tumour sample available for PD-L1 analysis (130 patients, 14.4%), and ECOG PS of 2 or higher (108 patients, 12.0%).
Patient disposition in the CheckMate-649 trial is summarized in Table 12. In the nivolumab plus chemotherapy and chemotherapy arms, a collective total of 2,687 patients were enrolled. This total represents all concurrently randomized patients to nivolumab plus chemotherapy and to chemotherapy, as well as patients enrolled as of the start of the 1:1:1 randomization and not randomized to any of the treatment arms. Among these 2,687 patients, 1,581 (58.8%) were concurrently randomized to receive either nivolumab plus chemotherapy or chemotherapy (also known as the all-comers population). Among randomized patients, slightly higher proportions received at least 1 dose of protocol therapy in the nivolumab plus chemotherapy arm (|||% of patients with PD-L1 CPS of 5 or higher and 99.1% of all randomized patients) compared with the chemotherapy arm (|||% of patients with PD-L1 CPS ≥ 5 and 96.8% of all randomized patients), primarily due to higher rates of consent withdrawal in the chemotherapy arm. Most patients in the study discontinued treatment (89.3% and 94.9% of all randomized patients in the nivolumab plus chemotherapy and chemotherapy arms, respectively). The most common reasons for discontinuing treatment were disease progression (65.9% and 68.8% of all randomized patients in the nivolumab plus chemotherapy and chemotherapy arms, respectively). Higher proportions of patients in the chemotherapy arm discontinued therapy due to withdrawal of consent or patient request (5.3% and 4.6% of all randomized patients, respectively) compared with the nivolumab plus chemotherapy arm (2.6% and 1.7% of all randomized patients, respectively). Slightly higher proportions of all randomized patients in the nivolumab plus chemotherapy arm (7.7%) discontinued protocol therapy due to toxicity compared with the chemotherapy arm (5.2%). The most common reason for discontinuing the study, other than death, was withdrawal of consent (2.6% in the nivolumab plus chemotherapy arm and 4.7% in the chemotherapy arm)
Table 12: Patient Disposition in the CheckMate-649 Trial
Category | Patients with PD-L1 CPS ≥ 5 | All-comers | ||||
|---|---|---|---|---|---|---|
Nivo + chemo (N = 473) | Chemo (N = 482) | Total (N = 955) | Nivo + chemo (N = 789) | Chemo (N = 792) | Total (N = 1,581) | |
Screened, Na | ||| | 2,687 (||||) | ||||
Randomized, N (%) | ||| | ||| | ||| | 789 (100.0) | 792 (100.0) | 1,581 (100.0) |
Treated, n (%)b | ||| | ||| | ||| | 782 (99.1) | 767 (96.8) | 1,549 (98.0) |
Not treated, n (%)b | ||| | ||| | ||| | 7 (0.9) | 25 (3.2) | 32 (2.0) |
Reason for not being treated, n (%)b | ||||||
Disease progression | ||| | ||| | ||| | 0 | 1 (0.1) | 1 (< 0.1) |
AE unrelated to study drug | ||| | ||| | ||| | 0 | 2 (0.3) | 2 (0.1) |
Patient request to discontinue study treatment | ||| | ||| | ||| | 0 | 2 (0.3) | 2 (0.1) |
Patient withdrew consent | ||| | ||| | ||| | 2 (0.3) | 19 (2.4) | 21 (1.3) |
Patient no longer meets study criteria | ||| | ||| | ||| | 4 (0.5) | 1 (0.1) | 5 (0.3) |
Other | ||| | ||| | ||| | 1 (0.1) | 0 | 1 (< 0.1) |
Discontinued study treatment, n (%)c | ||| | ||| | ||| | 698 (89.3) | 728 (94.9) | 1,426 (92.1) |
Reason for treatment discontinuation, n (%)c | ||||||
Disease progression | ||| | ||| | ||| | 515 (65.9) | 528 (68.8) | 1,043 (67.3) |
Study drug toxicity | ||| | ||| | ||| | 60 (7.7) | 40 (5.2) | 100 (6.5) |
Death | ||| | ||| | ||| | 0 | 1 (0.1) | 1 (< 0.1) |
AE unrelated to study drug | ||| | ||| | ||| | 46 (5.9) | 35 (4.6) | 81 (5.2) |
Patient request to discontinue study treatment | ||| | ||| | ||| | 13 (1.7) | 35 (4.6) | 48 (3.1) |
Patient withdrew consent | ||| | ||| | ||| | 20 (2.6) | 41 (5.3) | 61 (3.9) |
Lost to follow-up | ||| | ||| | ||| | 2 (0.3) | 2 (0.3) | 4 (0.3) |
Maximum clinical benefit | ||| | ||| | ||| | 10 (1.3) | 25 (3.3) | 35 (2.3) |
Poor/non-compliance | ||| | ||| | ||| | 1 (0.1) | 4 (0.5) | 5 (0.3) |
Patient no longer meets study criteria | ||| | ||| | ||| | 1 (0.1) | 3 (0.4) | 4 (0.3) |
Completed treatment as per protocol | ||| | ||| | ||| | 20 (2.6) | 0 | 20 (1.3) |
Other | ||| | ||| | ||| | 10 (1.3) | 14 (1.8) | 24 (1.5) |
Not continuing in the study, n (%)c,d | ||| | ||| | ||| | 158 (20.2) | 142 (18.5) | 300 (19.4) |
Reason for not continuing in the study, n (%)c,d | ||||||
Death | ||| | ||| | ||| | 121 (15.5) | 88 (11.5) | 209 (13.5) |
Patient withdrew consent | ||| | ||| | ||| | 20 (2.6) | 36 (4.7) | 56 (3.6) |
Lost to follow-up | ||| | ||| | ||| | 5 (0.6) | 6 (0.8) | 11 (0.7) |
Other | ||| | ||| | ||| | 12 (1.5) | 12 (1.6) | 24 (1.5) |
Follow-up length, months | ||| | ||| | ||| | |||
Mean (SD) | ||| | ||| | ||| | 13.51 (8.24) | 11.77 (7.53) | NR |
Median (range) | ||| | ||| | ||| | 13.08 (0.1 to 37.5) | 11.06 (0.0 to 36.6) | NR |
AE = adverse event; chemo = chemotherapy; CPS = combined positive score; nivo = nivolumab; NR = not reported; PD-L1 = programmed death ligand 1; SD = standard deviation.
Note: Results are from the July 10, 2020, database lock.
aThe enrolled population (N = 2,687) represents all concurrently randomized patients to nivolumab + chemotherapy and chemotherapy as well as patients enrolled as of the start of the 1:1:1 randomization and not randomized to any of the treatment arms. Thus, the frequency of patients enrolled but not randomized does not reflect the actual screen failure rate. The total study enrolment was 3,186 patients.
bPercentage of patients randomized. Treated patients were randomized patients who received at least one dose of study drug.
cPercentage of treated patients.
dPatient status at end of treatment.
eIncludes patients still on treatment and patients off treatment continuing in the follow-up period.
Source: CheckMate-649 Clinical Study Report.14
Protocol deviations in the CheckMate-649 trial are summarized in Table 13. Relevant protocol deviations were predefined in the statistical analysis plan, as deviations related to inclusion or exclusion criteria, study conduct, study management, or subject assessment that were programmable and could affect the interpretability of study results. In all randomized patients at baseline, 1.3% and 1.4% of the nivolumab plus chemotherapy and chemotherapy arms, respectively, had a relevant protocol deviation. During the treatment period, 1.0% and 0.5% of the nivolumab plus chemotherapy and chemotherapy arms, respectively, had a relevant protocol deviation.
Table 13: Relevant Protocol Deviations in the CheckMate-649 Trial
Item | Patients with PD-L1 CPS ≥ 5 | All randomized patients | ||||
|---|---|---|---|---|---|---|
Nivo + chemo (N = 473) | Chemo (N = 482) | Total (N = 955) | Nivo + chemo (N = 789) | Chemo N = 792) | Total (N = 1,581) | |
Patients with ≥ 1 relevant protocol deviation, n (%) | |||| | |||| | |||| | 10 (1.3) | 11 (1.4) | 21 (1.3) |
Patients with ≥ 1 relevant protocol deviation at study entry, n (%) | ||||||
Wrong cancer diagnosisa | |||| | |||| | |||| | 0 | 2 (0.3) | 2 (0.1) |
Prohibited prior anticancer therapyb | |||| | |||| | |||| | 1 (0.1) | 0 | 1 (< 0.1) |
Baseline ECOG PS > 1 | |||| | |||| | |||| | 1 (0.1) | 4 (0.5) | 5 (0.3) |
No disease at baselinec | |||| | |||| | |||| | 0 | 1 (0.1) | 1 (< 0.1) |
Patients with ≥ 1 on-treatment relevant protocol deviation, n (%) | ||||||
Prohibited anticancer therapyd | |||| | |||| | |||| | 8 (1.0) | 4 (0.5) | 12 (0.8) |
Chemo = chemotherapy; CPS = combined positive score; ECOG PS = Eastern Cooperative Oncology Group performance status; Nivo = nivolumab; PD-L1 = programmed death ligand 1.
Note: Results are from the July 10, 2020, database lock.
aPatients without inoperable, advanced, or metastatic GC or GEJ or distal esophageal carcinoma or without histologically confirmed predominant adenocarcinoma. Of 2 patients with wrong diagnosis, one was diagnosed after randomization and immediately discontinued from the study and one patient’s correct diagnosis (multiple myeloma) was found after the patient discontinued study therapy.
bPrior adjuvant or neoadjuvant chemotherapy was permitted.
cNo disease at baseline assessed based on investigator tumour assessments.
dPalliative radiotherapy was allowed and not counted as a deviation. One patient with prohibited therapy listed in the table received human granulocyte colony stimulating factor which was allowed.
Source: CheckMate-649 Clinical Study Report.14
Exposure to Study Treatments
Treatment exposure in the CheckMate-649 trial is summarized in Table 14. The mean (SD) duration of nivolumab therapy was similar in patients receiving nivolumab plus FOLFOX and nivolumab plus XELOX (|||| [||||] months and |||| [||||] months, respectively). The mean durations of administration of most chemotherapy components were shorter than that of nivolumab (nivolumab plus FOLFOX: oxaliplatin |||| months, leucovorin |||| months, 5-fluorouracil |||| months, 5-fluorouracil continuous |||| months; nivolumab plus XELOX: oxaliplatin |||| months, capecitabine |||| months). Chemotherapy components were administered for slightly shorter mean durations in the chemotherapy arm compared with the nivolumab plus chemotherapy arm (FOLFOX: oxaliplatin |||| months, leucovorin |||| months, 5-fluorouracil |||| months, 5-fluorouracil continuous |||| months; XELOX: oxaliplatin |||| months, capecitabine |||| months).
Table 14: Treatment Exposure in the CheckMate-649 Trial
Item | Nivolumab + chemotherapy (N = 782) | Chemotherapy (N = 767) | ||||||||||||
|---|---|---|---|---|---|---|---|---|---|---|---|---|---|---|
Nivolumab + FOLFOX (N = 422) | Nivolumab + XELOX (N = 360) | FOLFOX (N = 406) | XELOX (N = 361) | |||||||||||
Nivo (N = 422) | OX (N = 422) | LEU (N = 422) | 5-FU (N = 420) | 5-FU-cont (N = 422) | Nivo (N = 360) | OX (N = 360) | CAPE (N = 360) | OX (N = 406) | LEU (N = 406) | 5-FU (N = 402) | 5-FU-cont (N = 406) | OX (N = 361) | CAPE (N = 361) | |
Number of doses received | ||||||||||||||
Mean (SD) | 17.17 (12.7) | 9.37 (4.8) | 14.67 (11.4) | 13.92 (11.1) | 15.25 (11.4) | 11.36 (9.2) | 6.48 (4.1) | 10.88 (9.4) | 9.37 (6.1) | 12.15 (9.7) | 11.67 (9.3) | 12.32 (9.7) | 6.70 (5.3) | 9.27 (8.2) |
Median (range) | 13.50 (1.0 to 53.0) | 10.00 (1.0 to 36.0) | 12.00 (1.0 to 59.0) | 11.00 (1.0 to 59.0) | 12.00 (1.0 to 59.0) | 8.00 (1.0 to 35.0) | 6.00 (1.0 to 34.0) | 7.00 (1.0 to 47.0) | 9.00 (1.0 to 51.0) | 10.00 (1.0 to 64.0) | 9.00 (1.0 to 64.0) | 10.00 (1.0 to 64.0) | 6.00 (1.0 to 47.0) | 7.00 (1.0 to 48.0) |
Duration of therapy, months | ||||||||||||||
Mean (SD) | 8.47 (6.50) | 4.58 (2.84) | 7.16 (5.74) | 6.84 (5.64) | 7.56 (5.76) | 7.90 (6.78) | 4.32 (3.15) | 8.01 (6.94) | 4.34 (3.14) | 5.76 (4.97) | 5.55 (4.74) | 5.91 (4.96) | 4.39 (4.08) | 6.64 (6.06) |
Median (range) | 6.74 (0.0 to 24.0) | 4.60 (0.0 to 20.7) | 5.52 (0.0 to 29.9) | 5.29 (0.0 to 29.9) | 5.85 (0.0 to 30.0) | 5.45 (0.0 to 24.0) | 3.99 (0.0 to 23.2) | 5.63 (0.1 to 33.5) | 4.24 (0.0 to 26.6) | 4.63 (0.0 to 33.1) | 4.40 (0.0 to 33.1) | 4.80 (0.1 to 33.2) | 3.68 (0.0 to 34.4) | 4.70 (0.0 to 34.9) |
Relative dose intensity, n (%)a | ||||||||||||||
≥ 110% | 0 | 15 (3.6) | 0 | 27 (6.4) | 45 (10.7) | 0 | 2 (0.6) | 13 (3.6) | 7 (1.7) | 0 | 24 (6.0) | 39 (9.6) | 3 (0.8) | 11 (3.0) |
90% to < 110% | 238 (56.4) | 145 (34.4) | 155 (36.7) | 155 (36.9) | 136 (32.2) | 252 (70.0) | 157 (43.6) | 109 (30.3) | 176 (43.3) | 182 (44.8) | 174 (43.3) | 168 (41.4) | 174 (48.2) | 121 (33.5) |
70% to < 90% | 168 (39.8) | 171 (40.5) | 155 (36.7) | 138 (32.9) | 167 (39.6) | 102 (28.3) | 132 (36.7) | 109 (30.3) | 157 (38.7) | 136 (33.5) | 130 (32.3) | 143 (35.2) | 137 (38.0) | 118 (32.7) |
50% to < 70% | 12 (2.8) | 78 (18.5) | 81 (19.2) | 81 (19.3) | 60 (14.2) | 6 (1.7) | 64 (17.8) | 88 (24.4) | 62 (15.3) | 70 (17.2) | 65 (16.2) | 48 (11.8) | 43 (11.9) | 77 (21.3) |
< 50% | 4 (0.9) | 13 (3.1) | 31 (7.3) | 19 (4.5) | 14 (3.3) | 0 | 5 (1.4) | 41 (11.4) | 1 (0.2) | 15 (3.7) | 6 (1.5) | 5 (1.2) | 4 (1.1) | 34 (9.4) |
NR | 0 | 0 | 0 | 0 | 0 | 0 | 0 | 0 | 3 (0.7) | 3 (0.7) | 3 (0.7) | 3 (0.7) | 0 | 0 |
CAPE = capecitabine; FOLFOX = oxaliplatin + leucovorin + 5-fluorouracil; 5-FU = 5-fluorouracil; 5-FU-cont = 5-fluorouracil continuous; LEU = leucovorin; Nivo = nivolumab; NR = not reported; OX = oxaliplatin; SD = standard deviation; XELOX = oxaliplatin + capecitabine.
Note: Results are from the July 10, 2020 database lock.
aFor definitions of relative dose intensities, see preceding text.
Source: CheckMate-649 Clinical Study Report.14
Relative dose intensities were calculated using the following formulas. For patients receiving nivolumab plus XELOX, the relative dose intensity of nivolumab was calculated as: 100 × cumulative dose (mg) / ([last dose date of nivolumab 360 mg – start date of nivolumab + 21] × 360/21) + ([last dose date of nivolumab 480 mg – start date of nivolumab 480 mg + 28] × 480/28). For patients receiving XELOX, the relative dose intensity of oxaliplatin was calculated as: 100 × (cumulative dose [mg/m2] / [last oxaliplatin dose date – oxaliplatin start dose date + 21] × 130/21). For patients receiving XELOX, the relative dose intensity of capecitabine was calculated as: 100 × (cumulative dose [mg/m2] / first dose of capecitabine in the last cycle – capecitabine start dose date + 21) × 28,000/21. For patients receiving nivolumab plus FOLFOX, the relative dose intensity of nivolumab was calculated as: 100 × cumulative dose (mg) / ([last dose date of nivolumab 240 mg – start date in the nivolumab monotherapy phase + 14] × 240/14) + ([last dose date of nivolumab 480 mg – start date of nivolumab 480 mg + 28] × 480/28). For patients receiving FOLFOX, the relative dose intensity of oxaliplatin was calculated as: 100 × (cumulative dose [mg/m2] / [last oxaliplatin dose date – oxaliplatin start dose date + 14] × 85/14). For patients receiving FOLFOX, the relative dose intensity of leucovorin was calculated as: 100 × (cumulative dose [mg/m2] / [last leucovorin dose date – leucovorin start dose date + 14] × 400/14). For patients receiving FOLFOX, the relative dose intensity of bolus 5-fluorouracil was calculated as: 100 × (cumulative dose [mg/m2] / [First dose of 5-fluorouracil in the last cycle – 5-fluorouracil start dose date + 14] × 400/14), and that of continuous 5-fluorouracil was calculated as: 100 × (cumulative dose [mg/m2] / [first dose of continuous 5-fluorouracil in the last cycle – continuous 5-fluorouracil start dose date + 14] × 2,400/14).
The relative dose intensity of nivolumab was higher than that of chemotherapy, but the relative dose intensities of chemotherapy components were similar in both treatment groups.
For the 2 database cut-offs included in this report (July 10, 2020, and February 16, 2021), the minimum follow-up time was 12.1 months and 19.4 months, respectively. For the database cut-off of July 10, 2020, the mean (SD) follow-up was |||| (||||) months in the nivolumab plus chemotherapy arm and |||| (||||) months in the chemotherapy arm.
For frequencies and duration of treatment beyond progression in the nivolumab plus chemotherapy arm, see Appendix 5.
Figure 3 shows a KM analysis of time to treatment discontinuation in the CheckMate-649 trial, based on the July 10, 2020, database lock. Median time to treatment discontinuation was 6.75 months (95% CI, 6.11 months to 7.36 months) in the nivolumab plus chemotherapy arm and 4.86 months (95% CI, 4.47 months to 5.29 months) in the chemotherapy arm.
Figure 3: Time to Treatment Discontinuation in the CheckMate-649 Trial
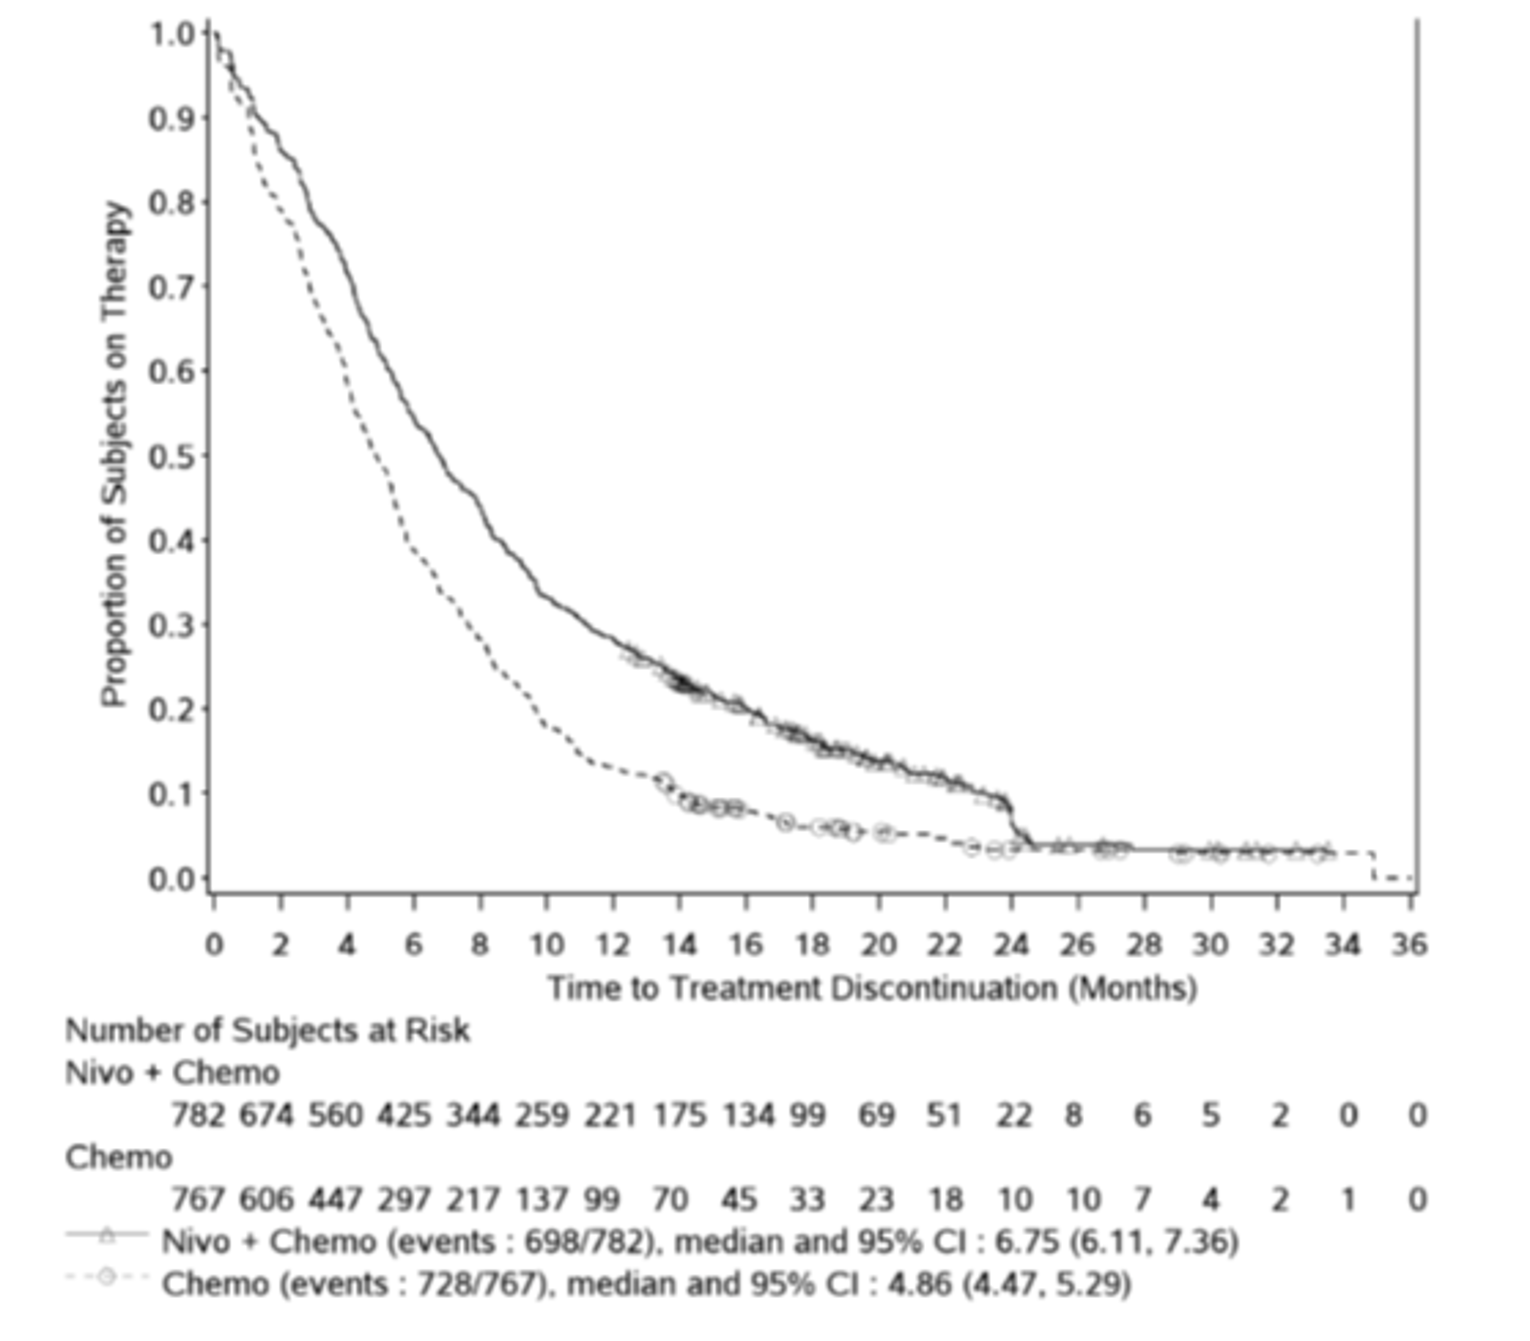
Note: Symbols represent censored observations.
Source: CheckMate-649 Clinical Study Report.14
Concomitant non–study drug therapies administered in the CheckMate-649 trial are summarized in Table 15. ||||||||||||||||||||||||||||||||||||||||||||||||||||||||||||||||||||||||||||||||||||||||||||||||||||||||||||||||||||||||||||||||||||.||||||||||||||||||||||||||||||||||||||||||||||||||||||||||||||||||||||||||||||||||||||||||||||||||||||||||||||||||||||||||||||||||||||||||||||||||||||||||||||||||||||||||||||||||||||||||||||||||||||||||||||||||||||||||||||||||||||||||||||||||||||||||||||||||||||||||||||||||||||||||||||||||||||||||||||||||||||||||||||||||||||||||||||||||||||||||||||||||||||||||||||||||||||||||||||||||||||||||||||||||||||||||||||||||||||||||||||||||||||||||||||||||||||||||||||||||||||||||||||||||||||||||||||||||||||||||||||||||||||||||||||||||||||||||||||||||||||||||||||||||||||||||||||||||||||||||||||||||||||||||||||||||||||||||||||||||||||||||||||||||||||||||||||||||||||||||||||||||||||||||||||||||||||||||||||||||||||||||||||||||||||||||||||||||||||||||||||||||||||||||||||||||||||||||||||||||||||||||||||||||||||||||||||||||||||||||||||||||||||||||||||||||||||||||||||||||||||||||||||||||||||||||||||||||||||||||||||||||||||||||||||
Table 15: Concomitant Non–Study Therapies in the CheckMate-649 Trial
Therapy | Patients with PD-L1 CPS ≥ 5 | All randomized patients | ||||
|---|---|---|---|---|---|---|
Nivo + chemo (N = 473) | Chemo (N = 482) | Total (N = 955) | Nivo + chemo (N = 789) | Chemo (N = 792) | Total (N = 1,581) | |
Treated, n | ||||| | ||||| | ||||| | ||||| | ||||| | ||||| |
≥ 1 Concomitant non–study therapy, n (%)a | ||||| | ||||| | ||||| | ||||| | ||||| | ||||| |
||||||||||||||||||||||||||||||||||||||||||||||||||||||||||||||||||||||||||||||||||||||||||b | ||||| | ||||| | ||||| | ||||| | ||||| | ||||| |
|||||||||||||||||||||||||||||||||||||||||||| | ||||| | ||||| | ||||| | ||||| | ||||| | ||||| |
||||||||||||||||||||||||||||||||||||||||||||| | ||||| | ||||| | ||||| | ||||| | ||||| | ||||| |
||||||||||||||||||||||||||||||||||||||||||||||||||||||||||||||||||||||||||||||||||||||||||b | ||||| | ||||| | ||||| | ||||| | ||||| | ||||| |
|||||||||||||||||||||||||||||||||||||||||||| | ||||| | ||||| | ||||| | ||||| | ||||| | ||||| |
|||||||||||||||||||||||||||||||||||||||||||| | ||||| | ||||| | ||||| | ||||| | ||||| | ||||| |
|||||||||||||||||||||||||||||||||||||||||||||||||||||||||||||||||||||||||||||||||||||||||||||||||||||||||||||||||||||||||||||||||||||||||||||||||||||||||||||||||||||||||||||||||||||||||||||||||||||||||||||||||||||||||||||||||||||||||||||||||||||||||||||||||||||||||||||||||||||||
a|||||||||||||||||||||||||||||||||||||||||||||||||||||||||||||||||||||||||||||||||||||||||||||||||||||||||||||||||||||||||||||||||||||||||||||||||||||||||||||||||||||||||||||||.
b|||||||||||||||||||||||||||||||||||||||||||||||||||||||||||||||||||||||||||||||||||||||||||||||||||||||||||||||||||||||||||||||||||||||||||||||||||||||||||.
Note: Results are from the July 10, 2020 database lock.
Source: CheckMate-649 Clinical Study Report.14
Anticancer therapies received subsequent to study treatment discontinuation in the CheckMate-649 study are shown in Table 16. Overall, 37.6% of patients in the nivolumab plus chemotherapy arm and 41.2% of patients in the chemotherapy arm received at least 1 subsequent anticancer therapy, which were primarily systemic chemotherapy regimens. A higher proportion of patients in the chemotherapy arm (8.1% of all randomized patients) received subsequent immunotherapy, including anti-PD-1 inhibitors, compared with the nivolumab plus chemotherapy arm (1.5% of all randomized patients).
Table 16: Subsequent Anticancer Therapies in the CheckMate-649 Trial
Therapy | Nivolumab + chemotherapy (N = 789) | Chemotherapy (N = 792) |
|---|---|---|
≥ 1 subsequent therapy, n (%) | 297 (37.6) | 326 (41.2) |
Subsequent radiotherapy, n (%)a | 37 (4.7) | 44 (5.6) |
Subsequent surgery, n (%) | 17 (2.2) | 23 (2.9) |
Subsequent systemic therapy, n (%)b | 268 (34.0) | 311 (39.3) |
Common subsequent systemic therapies, n (%)c | ||
Immunotherapy | 12 (1.5) | 64 (8.1) |
Anti-PD-1 | ||||| | ||||| |
Nivolumab | 6 (0.8) | 28 (3.5) |
Pembrolizumab | 2 (0.3) | 27 (3.4) |
Toripalimab | 1 (0.1) | 3 (0.4) |
Anti-PD-L1 | ||||| | ||||| |
Atezolizumab | 0 | 4 (0.5) |
Anti-CTLA-4 | ||||| | ||||| |
Ipilimumab | 1 (0.1) | 2 (0.3) |
Other immunotherapy | 3 (0.4) | 2 (0.3) |
Investigational immunomodulating drug | ||||| | ||||| |
Investigational immunotherapy | ||||| | ||||| |
Tumour necrosis factor | ||||| | ||||| |
Targeted therapy | ||||| | ||||| |
Apatinib | ||||| | ||||| |
Ramucirumab | 91 (11.5) | 85 (10.7) |
Trastuzumab | ||||| | ||||| |
Investigational antineoplastic drugs | ||||| | ||||| |
Chemotherapy | 258 (32.7) | 290 (36.6) |
Capecitabine | 21 (2.7) | 22 (2.8) |
Carboplatin | 7 (0.9) | 9 (1.1) |
Cisplatin | 14 (1.8) | 15 (1.9) |
Docetaxel | 18 (2.3) | 22 (2.8) |
Fluorouracil | 68 (8.6) | 106 (13.4) |
TS1 | ||||| | ||||| |
Irinotecan | ||||| | ||||| |
Oxaliplatin | 27 (3.4) | 43 (5.4) |
Paclitaxel | 154 (19.5) | 170 (21.5) |
Raltitrexed | ||||| | ||||| |
CTLA-4 = cytotoxic T-lymphocyte-associated protein 4; PD-1 = programmed death 1; PD-L1 = programmed death ligand 1; TS1 = tegafur + gimeracil + oteracil.
Note: Results are from the July 10, 2020, database lock.
aIncludes palliative radiotherapy.
bPatients may have received more than 1 subsequent therapy.
c||||||||||||||||||||||||||||||||||||||||||||||||||||||||||||||||||||||||||||||||||||||||||||||||||||||||||||||||||||||||||||||||||||||||||||||||||||||||||||||||||||||||||||||||||||||||||||||||||||||||||||||||||||||||||||||||||||||||||||||||||||||||||||||||||||.
Source: CheckMate-649 Clinical Study Report.14
Efficacy
Only those efficacy outcomes and analyses of subgroups identified in the review protocol are reported in this section. Refer to Appendix 5 for detailed efficacy data. Unless noted otherwise, data presented are from the July 10, 2020, database lock.
Overall Survival
Results for OS in patients with PD-L1 CPS ≥ 5, patients with PD-L1 CPS of 1 or higher, patients with CPS of 10 or higher, and all randomized patients are shown in Table 17, Figure 4, Figure 5, and Figure 6.
At the July 10, 2020, database lock and in the primary analysis population of patients with PD-L1 CPS of 5 or higher, OS events had occurred in 309/473 (65.3%) of patients in the nivolumab plus chemotherapy arm and in 362/482 (75.1%) of patients in the chemotherapy arm. Among patients with PD-L1 CPS ≥ 5, median OS was longer in the nivolumab plus chemotherapy arm (14.39 months; 95% CI, 13.11 to 16.23 months) compared with the chemotherapy arm (11.10 months; 95% CI, 10.02 to 12.09 months) (P < 0.0001). The HR for OS comparing nivolumab plus chemotherapy versus chemotherapy was 0.71 (98.4% CI, 0.59 to 0.86) in favour of nivolumab plus chemotherapy. The 12-month OS rate among patients with PD-L1 CPS ≥ 5 was 57.3% (95% CI, 52.6% to 61.6%) in the nivolumab plus chemotherapy arm and 46.4% (95% CI, 41.8% to 50.8%) in the chemotherapy arm.
At the July 10, 2020, database lock and in the hierarchically tested secondary analysis population of patients with PD-L1 CPS of 1 or higher, OS events had occurred in 434/641 (67.7%) of patients in the nivolumab plus chemotherapy arm and in 492/655 (75.1%) of patients in the chemotherapy arm. Among patients with PD-L1 CPS of 1 or higher, median OS was longer in the nivolumab plus chemotherapy arm (13.96 months; 95% CI, 12.55 to 14.98 months) compared with the chemotherapy arm (11.33 months; 95% CI, 10.64 to 12.25 months; P < 0.0001). The HR for OS comparing nivolumab plus chemotherapy versus chemotherapy was 0.77 (99.3% CI, 0.64 to 0.92) in favour of nivolumab plus chemotherapy. The 12-month OS rate among patients with PD-L1 CPS of 1 or higher was 57.3% (95% CI, ||||% to ||||%) in the nivolumab plus chemotherapy arm and 47.0% (95% CI, |||||||% to |||||||%) in the chemotherapy arm.
At the July 10, 2020, database lock and in the hierarchically tested secondary analysis population of all randomized patients, OS events had occurred in 544 of 789 (68.9%) patients in the nivolumab plus chemotherapy arm and in 591 of 792 (74.6%) patients in the chemotherapy arm. Among all randomized patients, median OS was longer in the nivolumab plus chemotherapy arm (13.83 months; 95% CI, 12.55 to 14.55 months) compared with the chemotherapy arm (11.56 months; 95% CI, 10.87 to 12.48 months; P = 0.0002). The HR for OS comparing nivolumab plus chemotherapy versus chemotherapy was 0.80 (99.3% CI, 0.68 to 0.94) in favour of nivolumab plus chemotherapy. The 12-month OS rate among all randomized patients was 55.0% (95% CI, 51.4% to 58.4%) in the nivolumab plus chemotherapy arm and 47.9% (95% CI, 44.4% to 51.4%) in the chemotherapy arm.
At the July 10, 2020, database lock and in the secondary analysis population of patients with PD-L1 CPS of 10 or higher, OS events had occurred in ||||/|||| (||||%) of patients in the nivolumab plus chemotherapy arm and in ||||/|||| (||||%) of patients in the chemotherapy arm. Among patients with PD-L1 CPS of 10 or higher, median OS was |||| months (95% CI, |||| to |||| months) in the nivolumab plus chemotherapy arm and |||| months (95% CI, |||| to |||| months) in the chemotherapy arm. The HR for OS comparing nivolumab plus chemotherapy versus chemotherapy was |||| (95% CI, |||| to ||||). The 12-month OS rate among patients with PD-L1 CPS of 10 or higher was ||||% (95% CI, ||||% to ||||%) in the nivolumab plus chemotherapy arm and ||||% (95% CI, ||||% to ||||%) in the chemotherapy arm.
Sensitivity analyses of OS as of July 10, 2020, database lock in the primary and hierarchically tested secondary analysis populations showed similar results that were consistent with the main analyses (see Appendix 5). Results were also similar for the more recent database lock of February 16, 2021. KM plots of OS based on data from the February 16, 2021, database lock are shown in Appendix 5.
Table 17: OS Among Patients With PD-L1 CPS ≥ 10, PD-L1 CPS ≥ 5, PD-L1 CPS ≥ 1, and All Randomized Patients in the CheckMate-649 Trial
Item | PD-L1 CPS ≥ 10 | PD-L1 CPS ≥ 5 | PD-L1 CPS ≥ 1 | All randomized patients | ||||
|---|---|---|---|---|---|---|---|---|
Nivo + chemo (N = 375) | Chemo (N = 393) | Nivo + chemo (N = 473) | Chemo (N = 482) | Nivo + chemo (N = 641) | Chemo (N = 655) | Nivo + chemo (N = 789) | Chemo (N = 792) | |
Events, n (%) | 235 (62.7)a | 295 (75.1)a | 309 (65.3)a | 362 (75.1)a | 434 (67.7)a | 492 (75.1)a | 544 (68.9)a | 591 (74.6)a |
344 (76.4)b | 397 (82.4)b | 478 (74.5)b | 540 (82.4)b | 603 (76.4)b | 647 (81.7)b | |||
Median OS (95% CI), monthsc | 15.01 (13.77 to 16.79)a | 10.87 (9.82 to 11.83)a | 14.39 (13.11 to 16.23)a | 11.10 (10.02 to 12.09)a | 13.96 (12.55 to 14.98)a | 11.33 (10.64 to 12.25)a | 13.83 (12.55 to 14.55)a | 11.56 (10.87 to 12.48)a |
14.42 (13.14 to 16.26)b | 11.10 (10.02 to 12.09)b | 14.00 (12.55 to 15.11)b | 11.33 (10.58 to 12.12)b | 13.93 (12.55 to 14.65)b | 11.56 (10.87 to 12.48)b | |||
HR (CI)d | 0.66 (95% CI, 0.55 to 0.78)a | 0.71 (98.4% CI, 0.59 to 0.86)a | 0.77 (99.3% CI, 0.64 to 0.92)a | 0.80 (99.3% CI, 0.68 to 0.94)a | ||||
0.69 (95% CI, 0.60 to 0.81)b | 0.74 (95% CI, 0.66 to 0.84)b | 0.79 (95% CI, 0.70 to 0.88)b | ||||||
P valuee | Not tested | < 0.0001 | < 0.0001 | 0.0002 | ||||
12-month OS rate (95% CI), %a,c | |||| (|||| to ||||) | |||| (|||| to ||||) | |||| (|||| to ||||) | |||| (|||| to ||||) | |||| (|||| to ||||) | |||| (|||| to ||||) | |||| (|||| to ||||) | |||| (|||| to ||||) |
chemo = chemotherapy; CI = confidence interval; CPS = combined positive score; HR = hazard ratio; nivo = nivolumab; OS = overall survival; PD-L1 = programmed death ligand 1.
aAnalysis based on database lock of July 10, 2020.
bAnalysis based on database lock of February 16, 2021.
cBased on Kaplan-Meier estimates.
dStratified Cox proportional hazards model; HR for nivolumab + chemotherapy compared with chemotherapy. Stratification factors were region, ECOG PS, tumour cell PD-L1, and chemotherapy regimen. For analysis of OS in patients with PD-L1 CPS ≥ 1 at the February 16, 2021, database lock, an unstratified HR is reported.
eTwo-sided P value from stratified log-rank test.
Source: CheckMate-649 Clinical Study Report.14
Figure 4: OS Among Patients With PD-L1 CPS ≥ 5 in the CheckMate-649 Trial
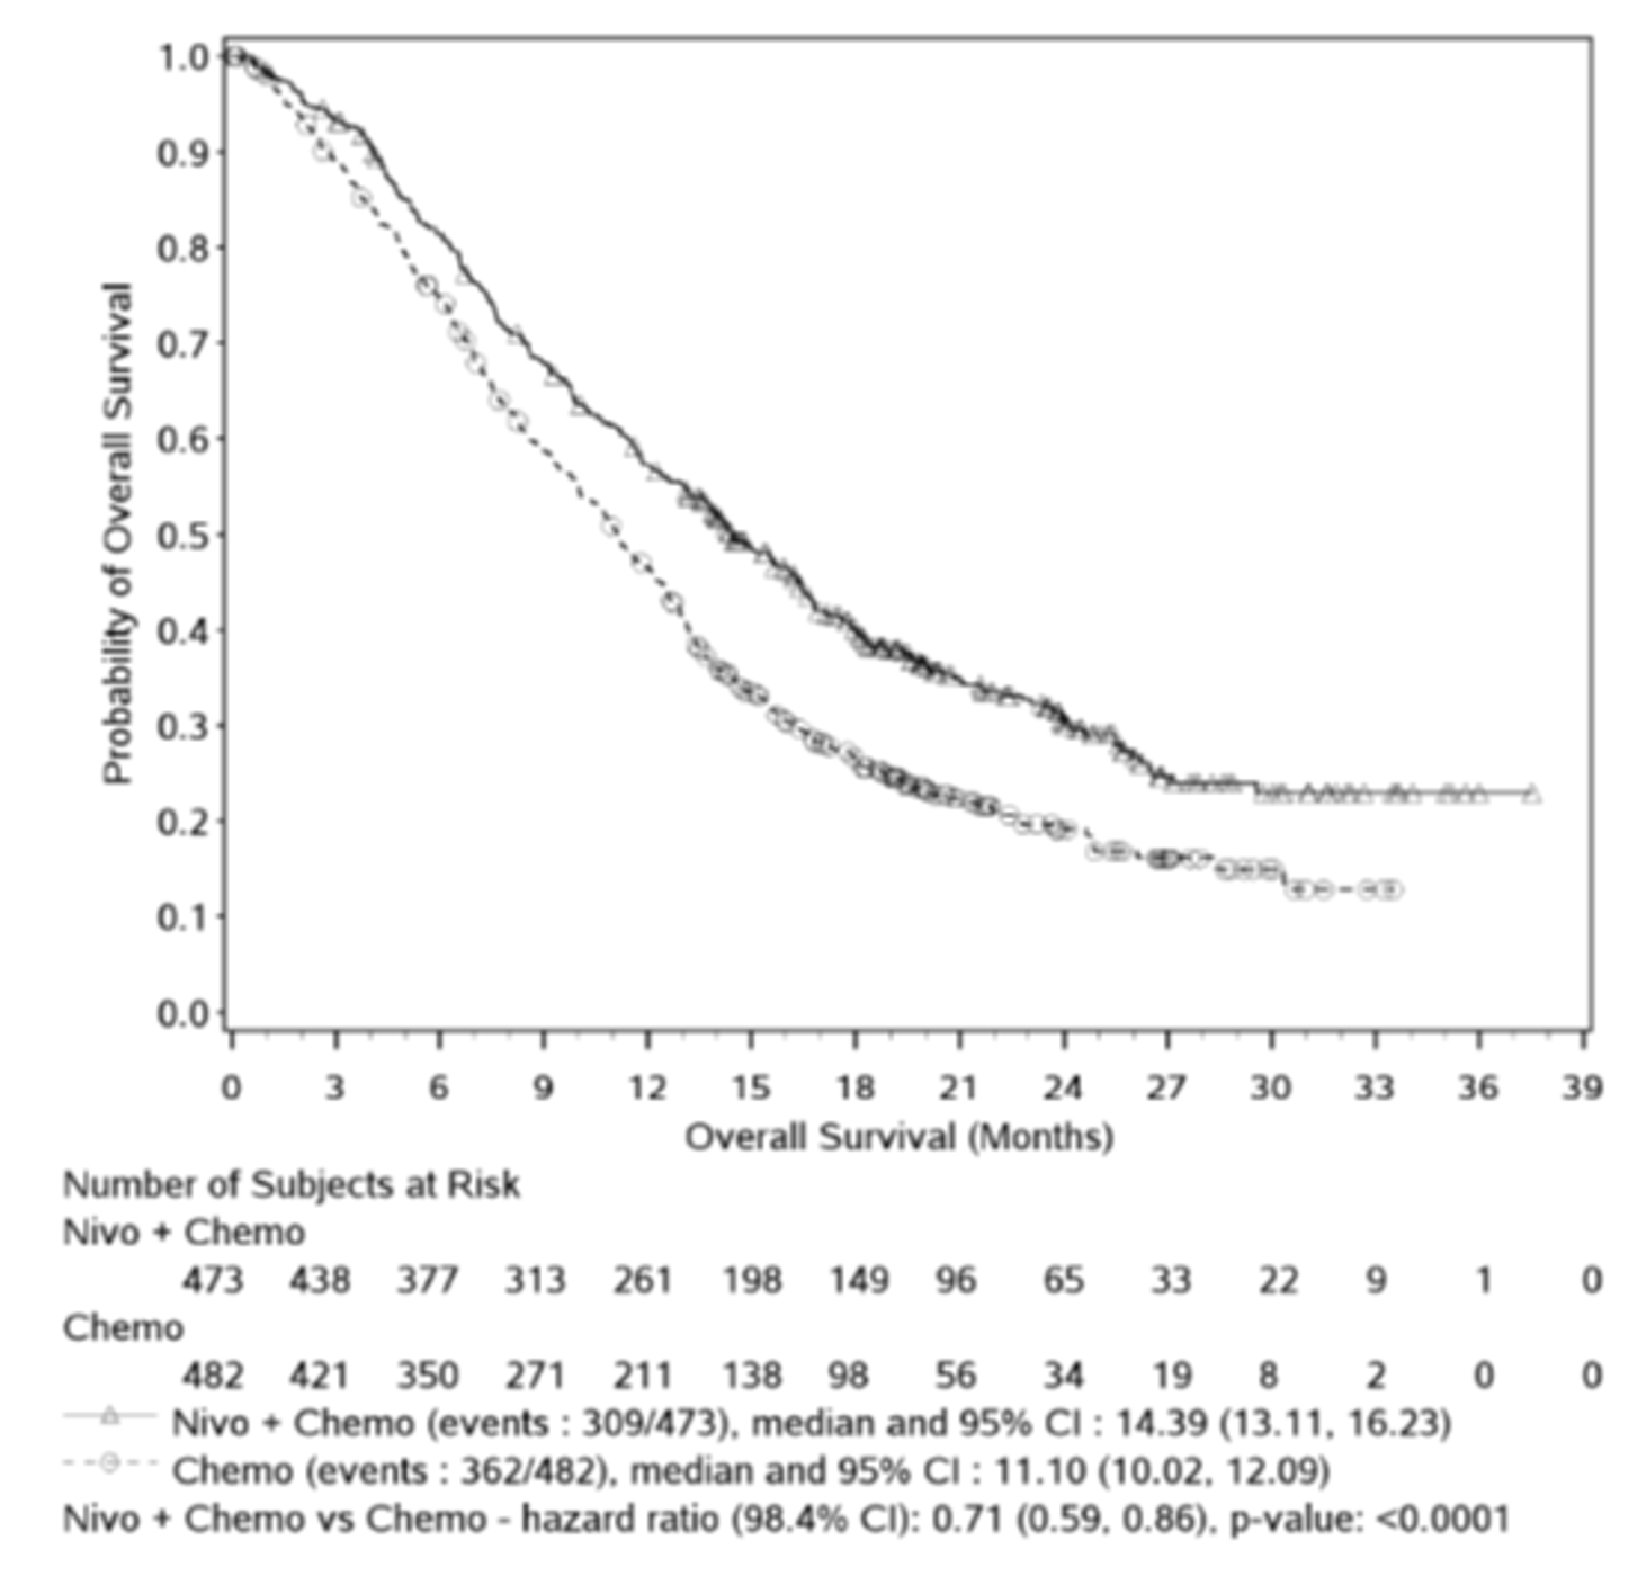
Note: Symbols represent censored observations. HR is from stratified Cox proportional hazards model and P value is from stratified log-rank test.
Source: CheckMate-649 Clinical Study Report.14
Figure 5: OS Among Patients With PD-L1 CPS ≥ 1 in the CheckMate-649 Trial
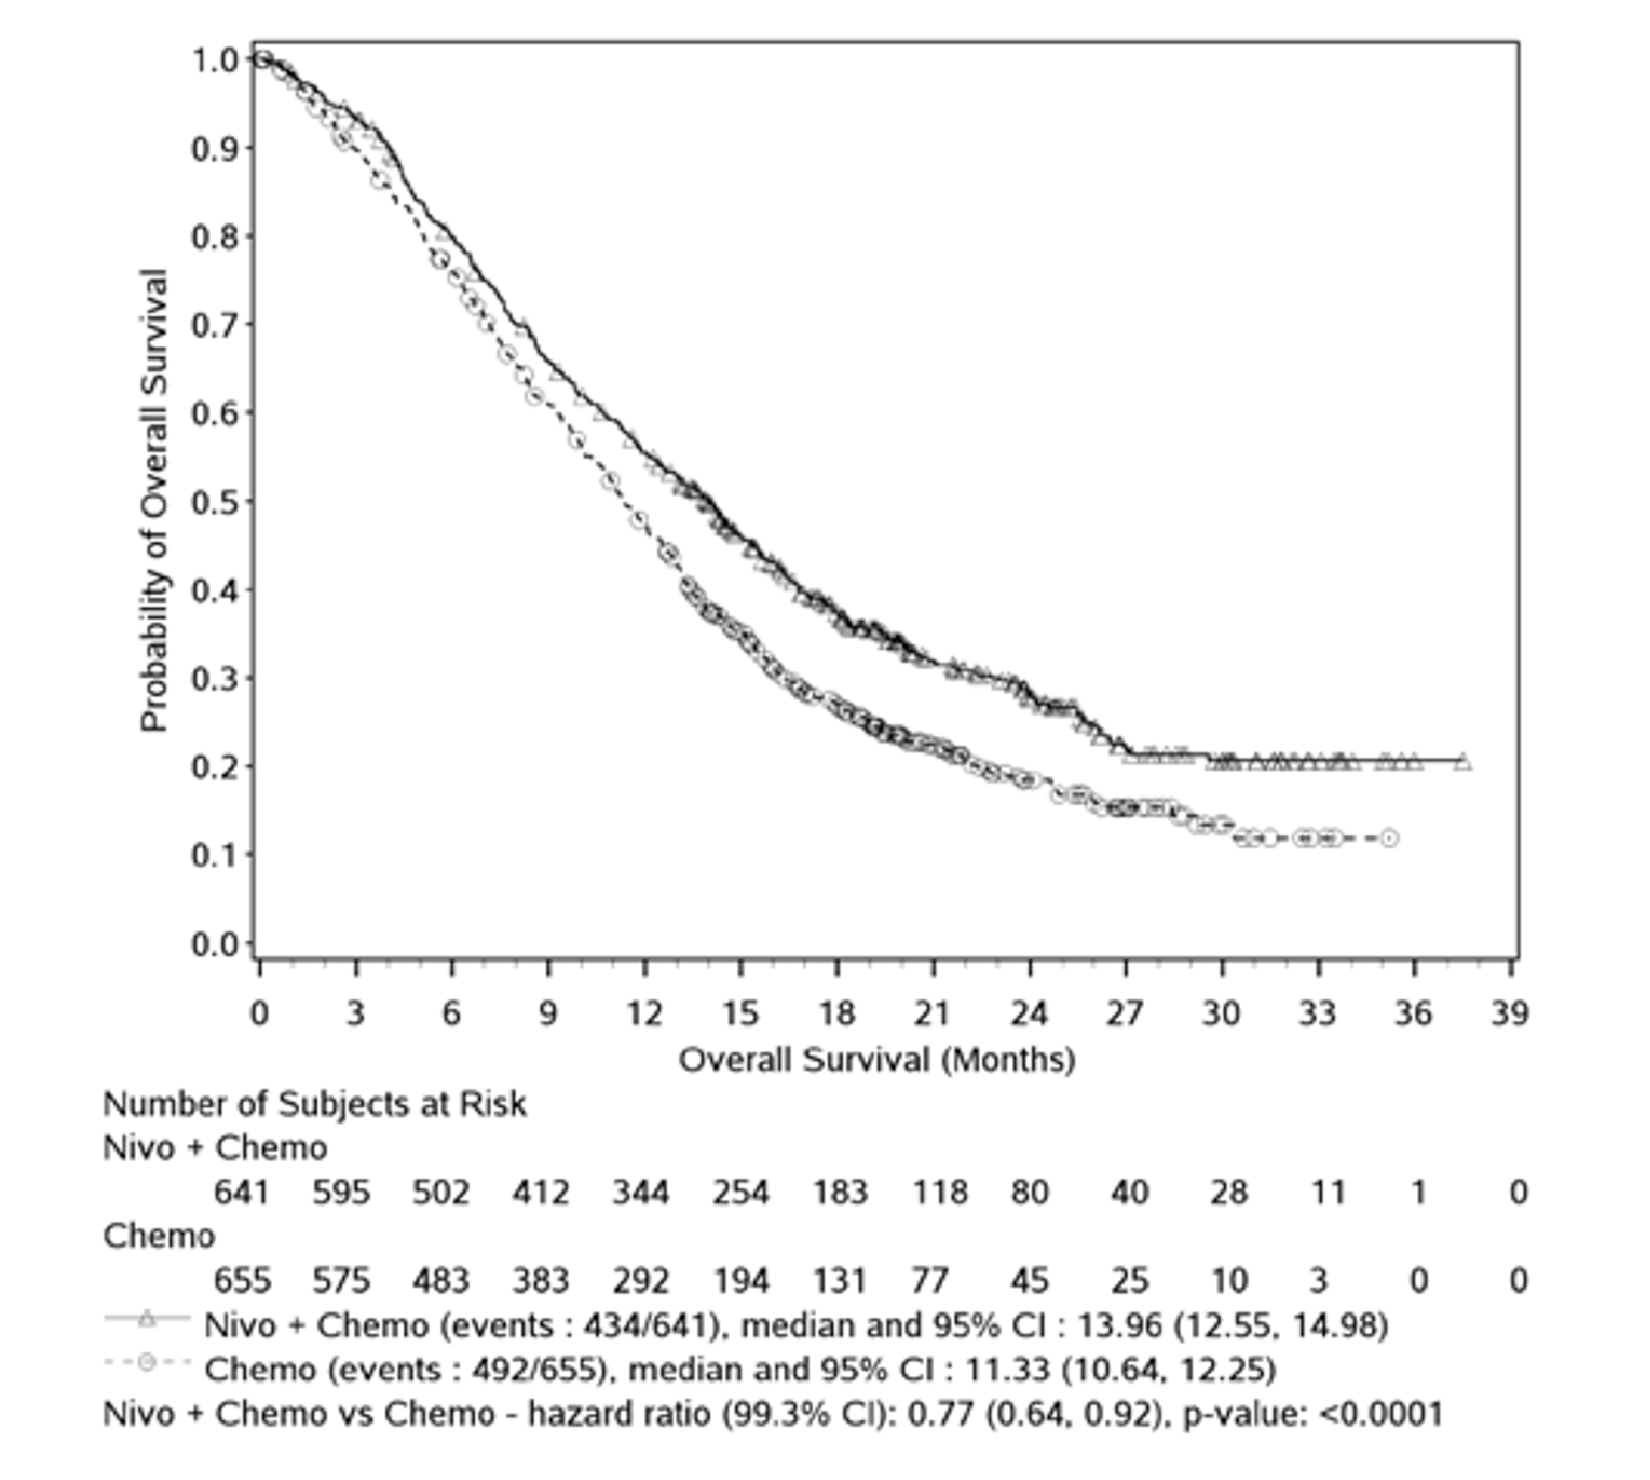
Note: Symbols represent censored observations. HR is from stratified Cox proportional hazards model and P value is from stratified log-rank test.
Source: CheckMate-649 Clinical Study Report.14
Figure 6: OS Among All Randomized Patients in the CheckMate-649 Trial
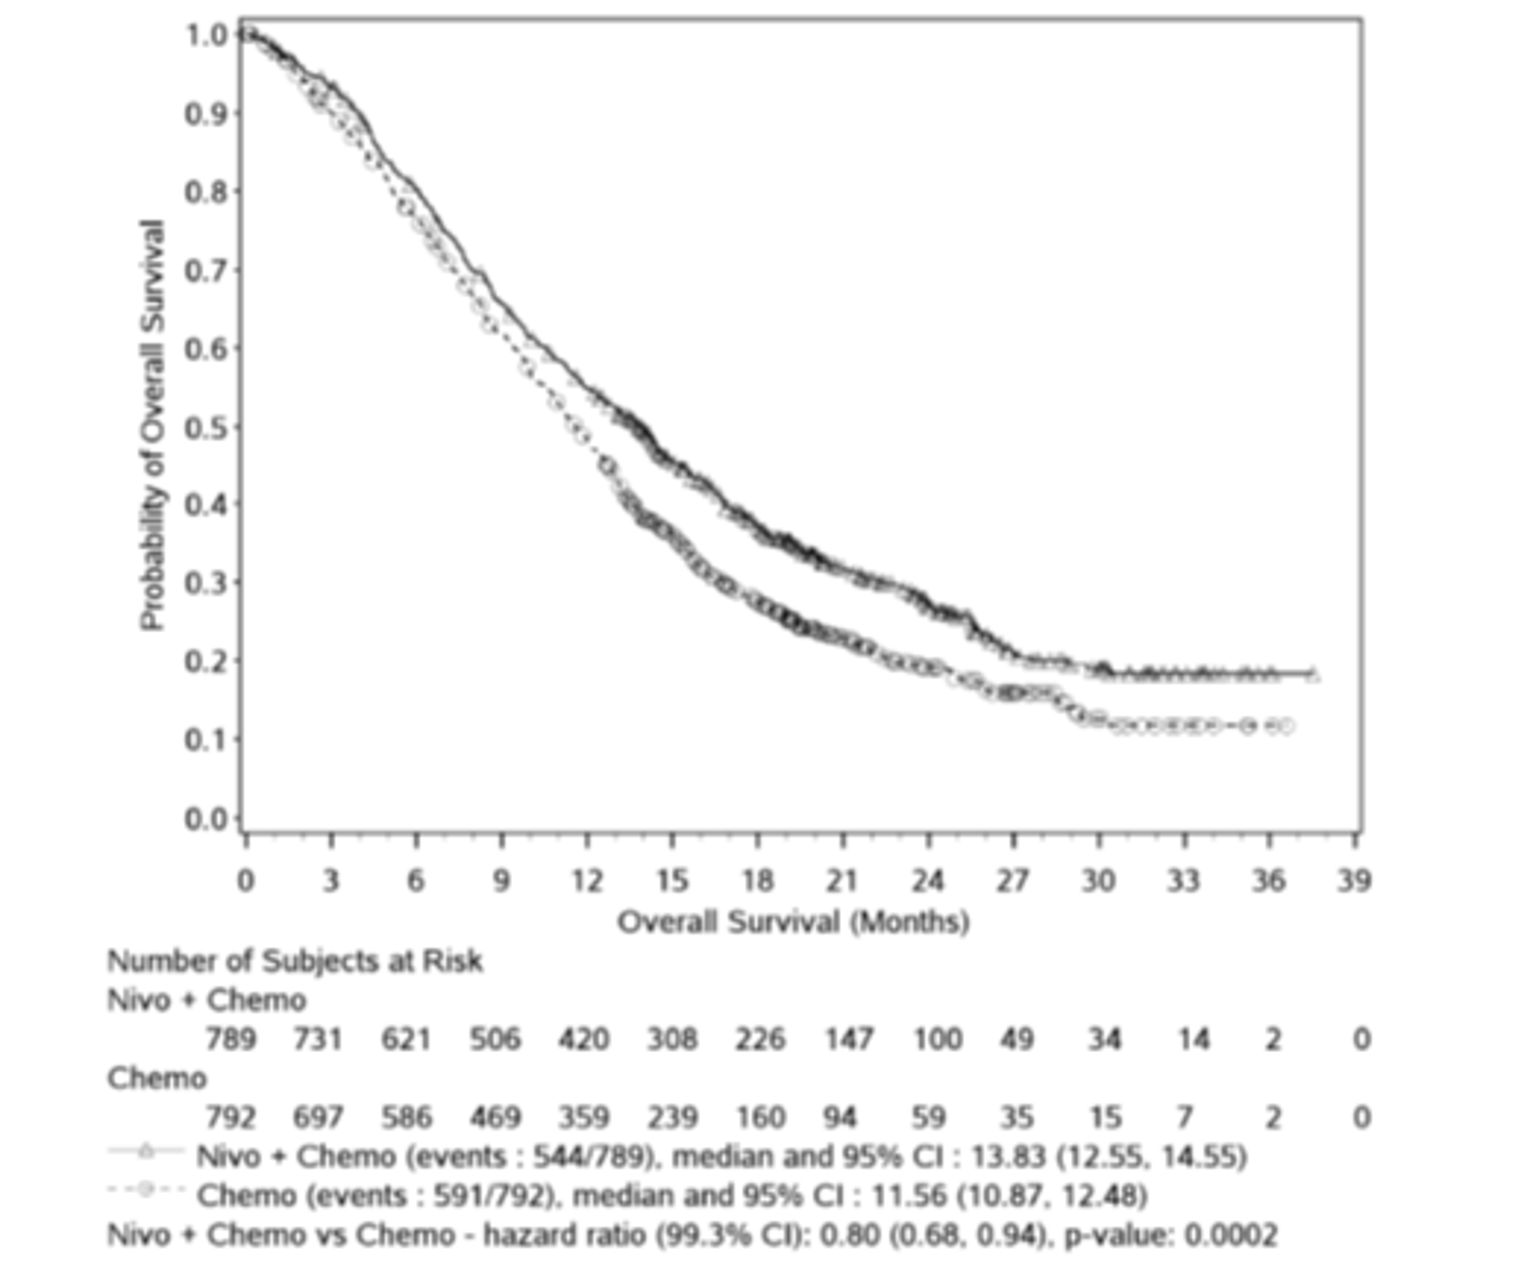
Note: Symbols represent censored observations. HR is from stratified Cox proportional hazards model and P value is from stratified log-rank test.
Source: CheckMate-649 Clinical Study Report.14
Subgroup analyses of OS by PD-L1 status, HER2 status, and MSI status were of interest to this review and are shown in Table 18 and Appendix 5. In the primary and hierarchically tested secondary analysis populations (patients with PD-L1 CPS ≥ 5, patients with PD-L1 CPS ≥ 1, and all randomized patients), the HRs from unstratified Cox proportional hazards models comparing nivolumab plus chemotherapy versus chemotherapy were 0.87 (95% CI, 0.71 to 1.06), 0.84 (95% CI, 0.71 to 0.99), and 0.85 (95% CI, 0.73 to 0.99), respectively, in patients with HER2-negative status and 0.53 (95% CI, 0.42 to 0.67), 0.67 (95% CI, 0.55 to 0.82), and 0.71 (95% CI, 0.59 to 0.85), respectively, in patients with unreported HER2 status. In the primary and hierarchically tested secondary analysis populations (patients with PD-L1 CPS ≥ 5, patients with PD-L1 CPS ≥ 1, and all randomized patients), the HRs comparing nivolumab plus chemotherapy versus chemotherapy were 0.33 (95% CI, 0.12 to 0.87), |||| (||||, ||||), and 0.37 (95% CI, 0.16 to 0.87), respectively, in MSI-H patients, and 0.73 (95% CI, 0.62 to 0.85), |||| (||||, ||||), and 0.80 (95% CI, 0.71 to 0.91), respectively, in microsatellite stable (MSS) patients. Among all randomized patients, the HRs comparing nivolumab plus chemotherapy versus chemotherapy favoured nivolumab plus chemotherapy to a greater degree as the PD-L1 CPS cut-off increased. Among randomized patients with PD-L1 CPS less than 10, less than 5, and less than 1, the HRs comparing nivolumab plus chemotherapy versus chemotherapy were 0.94 (95% CI, 0.80 to 1.10), 0.94 (95% CI, 0.78 to 1.13), and 0.92 (95% CI, 0.70 to 1.23), respectively.
Table 18: OS by PD-L1 CPS Among All Randomized Patients in the CheckMate-649 Trial
Subgroup | Nivolumab + chemotherapy | Chemotherapy |
|---|---|---|
CPS < 1 | N = 140 | N = 125 |
Events, n (%) | 103 (73.6) | 91 (72.8) |
Median OS, months (95% CI) | 13.08 (9.82 to 16.66) | 12.48 (10.12 to 13.83) |
HR (95% CI) | 0.92 (0.70 to 1.23) | Reference |
CPS ≥ 1 | N = 641 | N = 655 |
Events, n (%) | 434 (67.7) | 492 (75.1) |
Median OS, months (95% CI) | 13.96 (12.55 to 14.98) | 11.33 (10.64 to 12.25) |
HR (95% CI) | 0.76 (0.67 to 0.87) | Reference |
CPS < 5 | N = 308 | N = 298 |
Events, n (%) | 228 (74.0) | 221 (74.2) |
Median OS, months (95% CI) | 12.42 (10.61 to 14.26) | 12.25 (10.97 to 13.24) |
HR (95% CI) | 0.94 (0.78 to 1.13) | Reference |
CPS ≥ 5 | N = 473 | N = 482 |
Events, n (%) | 309 (65.3) | 362 (75.1) |
Median OS, months (95% CI) | 14.39 (13.11 to 16.23) | 11.10 (10.02 to 12.09) |
HR (95% CI) | 0.70 (0.60 to 0.81) | Reference |
CPS < 10 | N = 406 | N = 387 |
Events, n (%) | 302 (74.4) | 288 (74.4) |
Median OS, months (95% CI) | 12.55 (11.07 to 14.19) | 12.52 (11.24 to 13.27) |
HR (95% CI) | 0.94 (0.80 to 1.10) | Reference |
CPS ≥ 10 | N = 375 | N = 393 |
Events, n (%) | 235 (62.7) | 295 (75.1) |
Median OS, months (95% CI) | 15.01 (13.77 to 16.79) | 10.87 (9.82 to 11.83) |
HR (95% CI) | 0.65 (0.55 to 0.78) | Reference |
CI = confidence interval; CPS = combined positive score; HR = hazard ratio; OS = overall survival.
Note: HRs are from unstratified Cox proportional hazards models using data from the July 10, 2020, database lock.
Source: CheckMate-649 Clinical Study Report.14
Health-Related Quality of Life
EQ-5D-3L utility index scores and EQ VAS scores among all randomized patients in the CheckMate-649 study are shown in Figure 7 and Figure 8. The EQ-5D-3L questionnaire completion rate during the treatment period for all randomized patients was 90% or more at baseline and 80% or more at most subsequent assessments for which at least 10 patients were eligible to respond. Among patients who had discontinued study treatment but remained in the study, completion rates ranged from ||||% to ||||% in the nivolumab plus chemotherapy arm and from ||||% to ||||% in the chemotherapy arm at follow-up visits || and || after treatment discontinuation. Among patients who had discontinued study treatment but remained in the study, completion rates ranged from ||||% to ||||% in the nivolumab plus chemotherapy arm and from ||||% to ||||% in the chemotherapy arm during survival follow-up at assessments for which |||||||||||||||||||||||||||||||||||||||||||||||||||||||||||||||||||||||||||||||||||||||||||||||||||||||||||||||||||||||||||||||||||||||||||||||||||||||||||||||||||||||||||||||||||||||||||||||||||||||||||||||||||||||||||||||||||||||||||||||||||||||||||||||||||||||||||||||||||||||||||||||||||||||||||||||||||||||||||||||||||||||||||||||||||||||||||||||||||||||||||||||||||||||||||||||||||||||||||||||||||||||||||||||||||||||||||||||||||||||||||||||||||||||||||||||||||||||||||||||||||||||||||||||||||||||||||||||||||||||||||||||||||||||||||||||||||||||||||||||||||||||||||||||||||||||||||||||||||||||||||||||||||||||||||||||||||||||||||||||||||||||||||||||||||||||||||||||||||||||||||||||||||||||||||||||||||||||||||||||||||||||||||||||||||||||||||||||||||||||||||||||||||||||||||||||||||||||||||||||||||||||||||||||||||||||||||||||||||||||||||||||||||||||||||||||||||||||||||||||||||||||||||||||||||||||||||||||||||||||||||||||||||||||||||||||||||||||||||||||||||||||||||||||||||||||||||||||||||||||||
Figure 7: Mean Changes in EQ-5D-3L Utility Index Score From Baseline Among All Randomized Patients in the CheckMate-649 Trial
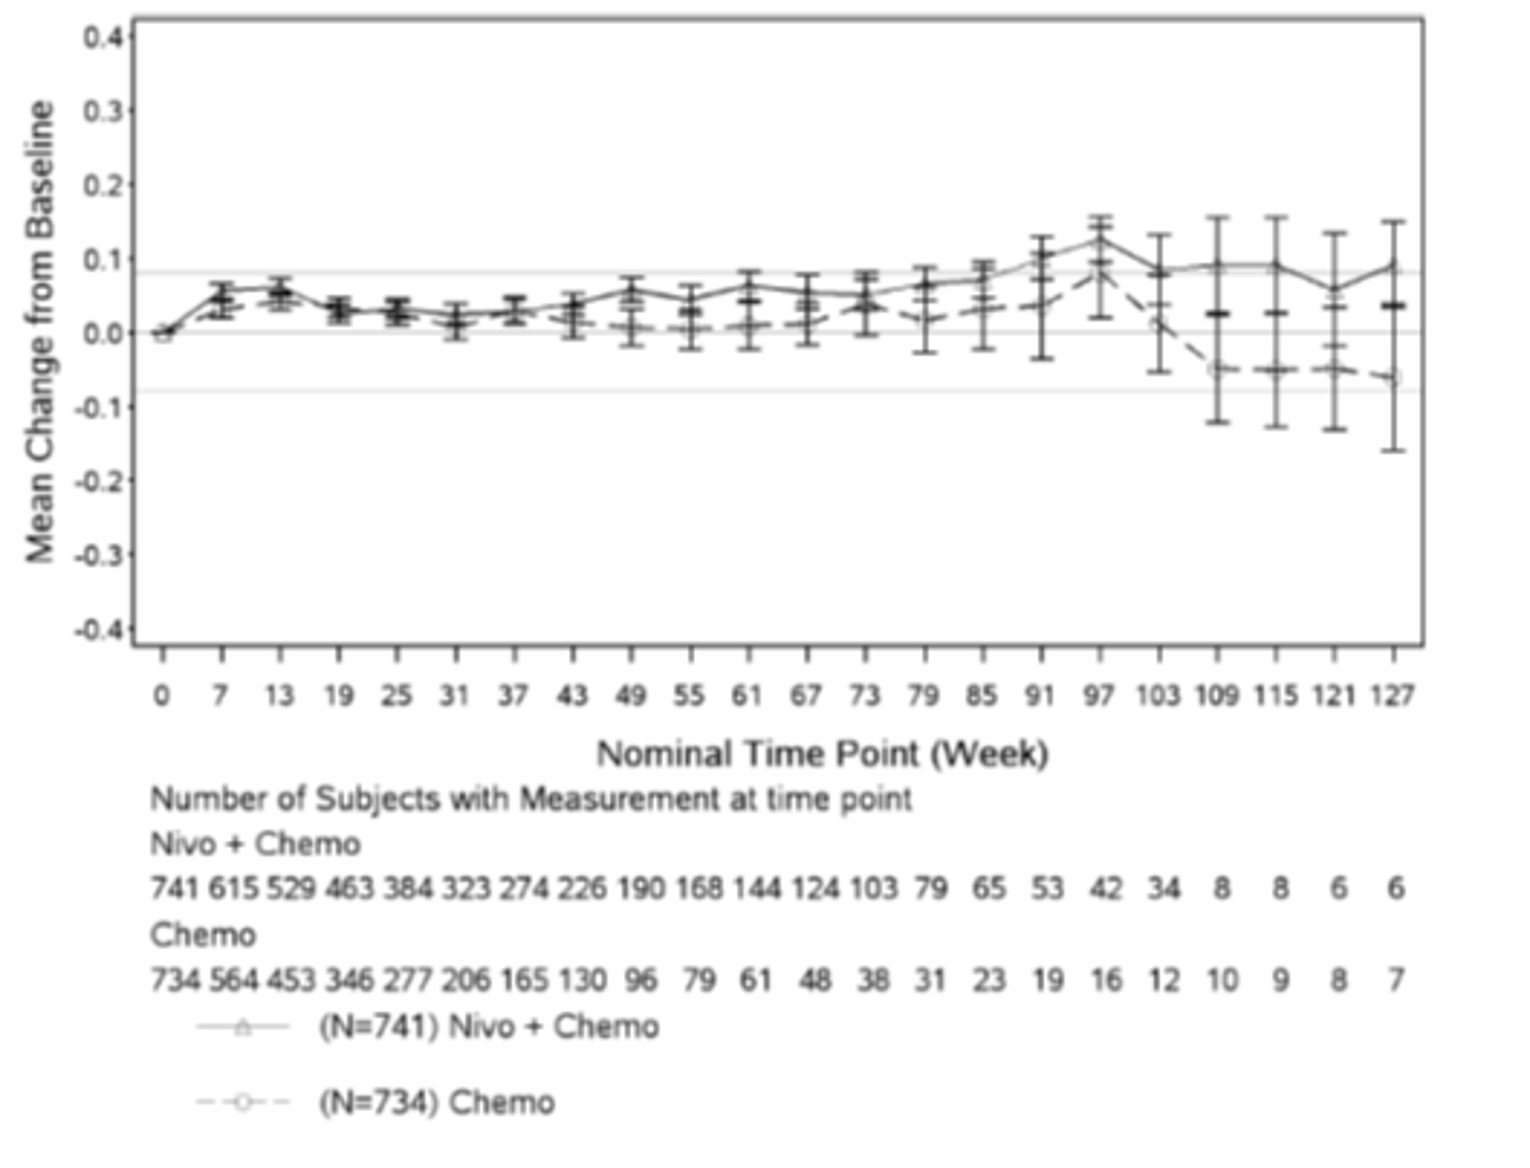
Note: Utility index scores range from 0 (no utility) to 1 (perfect utility). Error bars represent standard error of the mean. Horizontal lines indicate the sponsor-defined MID of 0.08 points. Only time points with a minimum of 5 patient responses are plotted.
Source: CheckMate-649 Clinical Study Report.14
Figure 8: Mean Changes in EQ-5D-3L Self-Rated Health Status EQ VAS From Baseline Among All Randomized Patients in the CheckMate-649 Trial

This figure has been redacted at the sponsor’s request.
Note: EQ VAS scores range from 0 (worst imaginable health) to 100 (best imaginable health). Error bars represent standard error of the mean. Horizontal lines indicate the sponsor-defined MID of 7 points. Only time points with a minimum of 5 patient responses are plotted.
Source: CheckMate-649 Clinical Study Report.14
FACT-Ga total scores and GaCS scores among all randomized patients in the CheckMate-649 study are shown in Figure 9. The FACT-Ga questionnaire completion rate during the treatment period for all randomized patients was 90% or more at baseline and 80% or more at most subsequent assessments for which at least 10 patients were eligible to respond. Among patients who had discontinued study treatment but remained in the study, completion rates for the GaCS and FACT-G7 ranged from 45.6% to 78.6% in the nivolumab plus chemotherapy arm and from 31.3% to 55.6% in the chemotherapy arm at assessments for which at least 10 patients were eligible to respond. Patients in both arms had similar FACT-Ga total scores at baseline (mean = 126.6, SD = 28.3, in the nivolumab plus chemotherapy arm and mean = 126.8, SD = 26.8, in the chemotherapy arm). Patients in both arms had similar GaCS scores at baseline (mean = 49.6, SD = 15, in the nivolumab plus chemotherapy arm and mean = 50.0, SD = 15.0, in the chemotherapy arm). FACT-Ga total scores and GaCS scores were numerically higher (improved) at post-baseline assessments compared with the baseline assessment until 121 weeks and 127 weeks post-baseline, respectively, in both treatment groups.
Figure 9: Mean Changes in FACT-Ga Total and GaCS Scores From Baseline Among All Randomized Patients in the CheckMate-649 Trial

This figure has been redacted at the sponsor’s request.
Note: FACT-Ga total scores range from 0 to 184, with higher values indicating better HRQoL. GaCS scores range from 0 to 76, with higher values indicating better HRQoL. Error bars represent standard error of the mean. Horizontal lines indicate the sponsor-defined MID of 8.2 points for the FACT-Ga GaCS score). Only time points with a minimum of 5 patient responses are plotted.
Source: CheckMate-649 Clinical Study Report.14
Progression-Free Survival
Results for PFS per BICR in patients with PD-L1 CPS of 5 or higher, patients with PD-L1 CPS of 1 or higher, patients with CPS of 10 or higher, and all randomized patients are shown in Table 19.
At the July 10, 2020, database lock and in the primary analysis population of patients with PD-L1 CPS of 5 or higher, PFS events had occurred in 328 of 473 (69.3%) patients in the nivolumab plus chemotherapy arm and in 350 of 482 (72.6%) patients in the chemotherapy arm (refer to Figure 10 for KM curves). Among patients with PD-L1 CPS of 5 or higher, median PFS was longer in the nivolumab plus chemotherapy arm (7.69 months; 95% CI, 7.03 to 9.17 months) compared with the chemotherapy arm (6.05 months; 95% CI, 5.55 to 6.90 months; P < 0.0001). The HR for PFS comparing nivolumab plus chemotherapy versus chemotherapy was 0.68 (98% CI, 0.56 to 0.81) in favour of nivolumab plus chemotherapy. The 12-month PFS rate among patients with PD-L1 CPS of 5 or higher was |||% (95% CI, |||% to |||%) in the nivolumab plus chemotherapy arm and |||% (95% CI, |||% to |||%) in the chemotherapy arm.
At the July 10, 2020, database lock and in the secondary analysis population of patients with PD-L1 CPS of 1 or higher, PFS events had occurred in 454 of 641 (70.8%) patients in the nivolumab plus chemotherapy arm and in 472 of 655 (72.1%) patients in the chemotherapy arm. Among patients with PD-L1 CPS of 1 or higher, median PFS was 7.49 months (95% CI, 7.03 to 8.41 months) in the nivolumab plus chemotherapy arm and 6.90 months (95% CI, 6.08 to 7.03 months) in the chemotherapy arm. The HR for PFS comparing nivolumab plus chemotherapy versus chemotherapy was 0.74 (95% CI, 0.65 to 0.85). The 12-month PFS rate among patients with PD-L1 CPS of 1 or higher was |||% (95% CI, |||% to |||%) in the nivolumab plus chemotherapy arm and |||% (95% CI, |||% to |||%) in the chemotherapy arm.
At the July 10, 2020, database lock and in the secondary analysis population of all randomized patients, PFS events had occurred in 559 of 789 (70.8%) of patients in the nivolumab plus chemotherapy arm and in 557 of 792 (70.3%) of patients in the chemotherapy arm. Among all randomized patients, median PFS was 7.66 months (95% CI, 7.10 to 8.54) months in the nivolumab plus chemotherapy arm and 6.93 months (95% CI, 6.60 to 7.13 months) in the chemotherapy arm. The HR for PFS comparing nivolumab plus chemotherapy versus chemotherapy was 0.77 (95% CI, 0.68 to 0.87). The 12-month PFS rate among all randomized patients was |||% (95% CI, |||% to |||%) in the nivolumab plus chemotherapy arm and |||% (95% CI, |||% to |||%) in the chemotherapy arm.
At the July 10, 2020, database lock and in the secondary analysis population of patients with PD-L1 CPS of 10 or higher, PFS events had occurred in 252 of 375 (67.2%) patients in the nivolumab plus chemotherapy arm and in 289 of 393 (73.5%) patients in the chemotherapy arm. Among patients with PD-L1 CPS of 10 or higher, median PFS was 8.31 months (95% CI, 6.97 to 9.69 months) in the nivolumab plus chemotherapy arm and 5.78 months (95% CI, 5.45 to 6.87 months) in the chemotherapy arm. The HR for PFS comparing nivolumab plus chemotherapy versus chemotherapy was 0.63 (95% CI, 0.53 to 0.75). The 12-month PFS rate among patients with PD-L1 CPS of 10 or higher was |||% (95% CI, |||% to |||%) in the nivolumab plus chemotherapy arm and |||% (95% CI, |||% to |||%) in the chemotherapy arm.
Sensitivity analyses of PFS as of July 10, 2020, database lock in the primary analysis populations showed similar results (Appendix 5). Results were also similar for PFS analysis using the more recent database lock of February 16, 2021. KM plots of PFS based on data from the February 16, 2021, database lock are shown in Appendix 5.
Subgroup analyses of PFS by PD-L1 status, HER2 status, and MSI status were of interest to this review and are shown in Appendix 5. In the primary analysis population (patients with PD-L1 CPS ≥ 5), the HR for PFS comparing nivolumab plus chemotherapy versus chemotherapy was 0.78 (95% CI, 0.64 to 0.96) in patients with HER2-negative status and 0.57 (95% CI, 0.45 to 0.72) in patients with unreported HER2 status. In the primary analysis population (patients with PD-L1 CPS ≥ 5), the HR for PFS comparing nivolumab plus chemotherapy versus chemotherapy was 0.32 (95% CI, 0.12 to 0.85) in MSI-H patients and 0.70 (95% CI, 0.59 to 0.82) in MSS patients. Among all randomized patients, the unstratified HRs for PFS comparing nivolumab plus chemotherapy versus chemotherapy favoured nivolumab plus chemotherapy to a greater degree as the PD-L1 CPS cut-off increased. Among randomized patients with PD-L1 CPS less than 10, less than 5, and less than 1, the HRs for PFS comparing nivolumab plus chemotherapy versus chemotherapy were ||| (95% CI, ||| to |||), ||| (95% CI, ||| to |||), and ||| (95% CI, ||| to |||), respectively.
Table 19: PFS by BICR Among Patients With PD-L1 CPS ≥ 10, PD-L1 CPS ≥ 5, PD-L1 CPS ≥ 1, and All Randomized Patients in the CheckMate-649 Trial
Item | PD-L1 CPS ≥ 10 | PD-L1 CPS ≥ 5 | PD-L1 CPS ≥ 1 | All randomized patients | ||||
|---|---|---|---|---|---|---|---|---|
Nivo + chemo (N = 375) | Chemo (N = 393) | Nivo + chemo (N = 473) | Chemo (N = 482) | Nivo + chemo (N = 641) | Chemo (N = 655) | Nivo + chemo (N = 789) | Chemo (N = 792) | |
Events, n (%) | ||| (||)a | ||| (||)a | | ||| (||)a ||| (||)b | ||| (||)a ||| (||)b | ||| (||)a ||| (||)b | ||| (||)a ||| (||)b | ||| (||)a ||| (||)b | ||| (||)a ||| (||)b |
Median PFS (95% CI), monthsc | ||| (||,||)a | ||| (||,||)a | 7.69 (7.03, 9.17)a ||| (||,||)b | 6.05 (5.55, 6.90)a ||| (||,||)b | 7.49 (7.03, 8.41) a ||| (||,||)b | 6.90 (6.08, 7.03)a ||| (||,||)b | 7.66 (7.10, 8.54)a ||| (||,||)b | 6.93 (6.60, 7.13)a ||| (||,||)b |
HR (CI)d | 2020a: || (95% CI, || to ||) | 2020a: 0.68 (98% CI, 0.56 to 0.81) 2021b: || (95% CI, || to ||) | 2020a: 0.74 (95% CI, 0.65 to 0.85) 2021b: || (95% CI, || to ||)b | 2020a: 0.77 (95% CI, 0.68 to 0.87) 2021b: || (95% CI, || to ||) | ||||
P valuee | |||||||||| | |||||||||| | |||||||||| | |||||||||| | ||||
12-month PFS rate (95% CI), %a,c | ||| (|| to ||) | ||| (|| to ||) | ||| (|| to ||) | ||| (|| to ||) | ||| (|| to ||) | ||| (|| to ||) | ||| (|| to ||) | ||| (|| to ||) |
Chemo = chemotherapy; CI = confidence interval; CPS = combined positive score; HR = hazard ratio; Nivo = nivolumab; PD-L1 = programmed death ligand 1; PFS = progression-free survival.
aAnalysis based on database lock of July 10, 2020.
bAnalysis based on database lock of February 16, 2021.
cBased on Kaplan-Meier estimates.
dStratified Cox proportional hazards model; HR for nivolumab + chemotherapy compared with chemotherapy. Stratification factors were region, ECOG PS, tumour cell PD-L1, and chemotherapy regimen.
eTwo-sided P value from stratified log-rank test.
Source: CheckMate-649 Clinical Study Report.14
Figure 10: PFS Among Patients With PD-L1 CPS ≥ 5 in the CheckMate-649 Trial
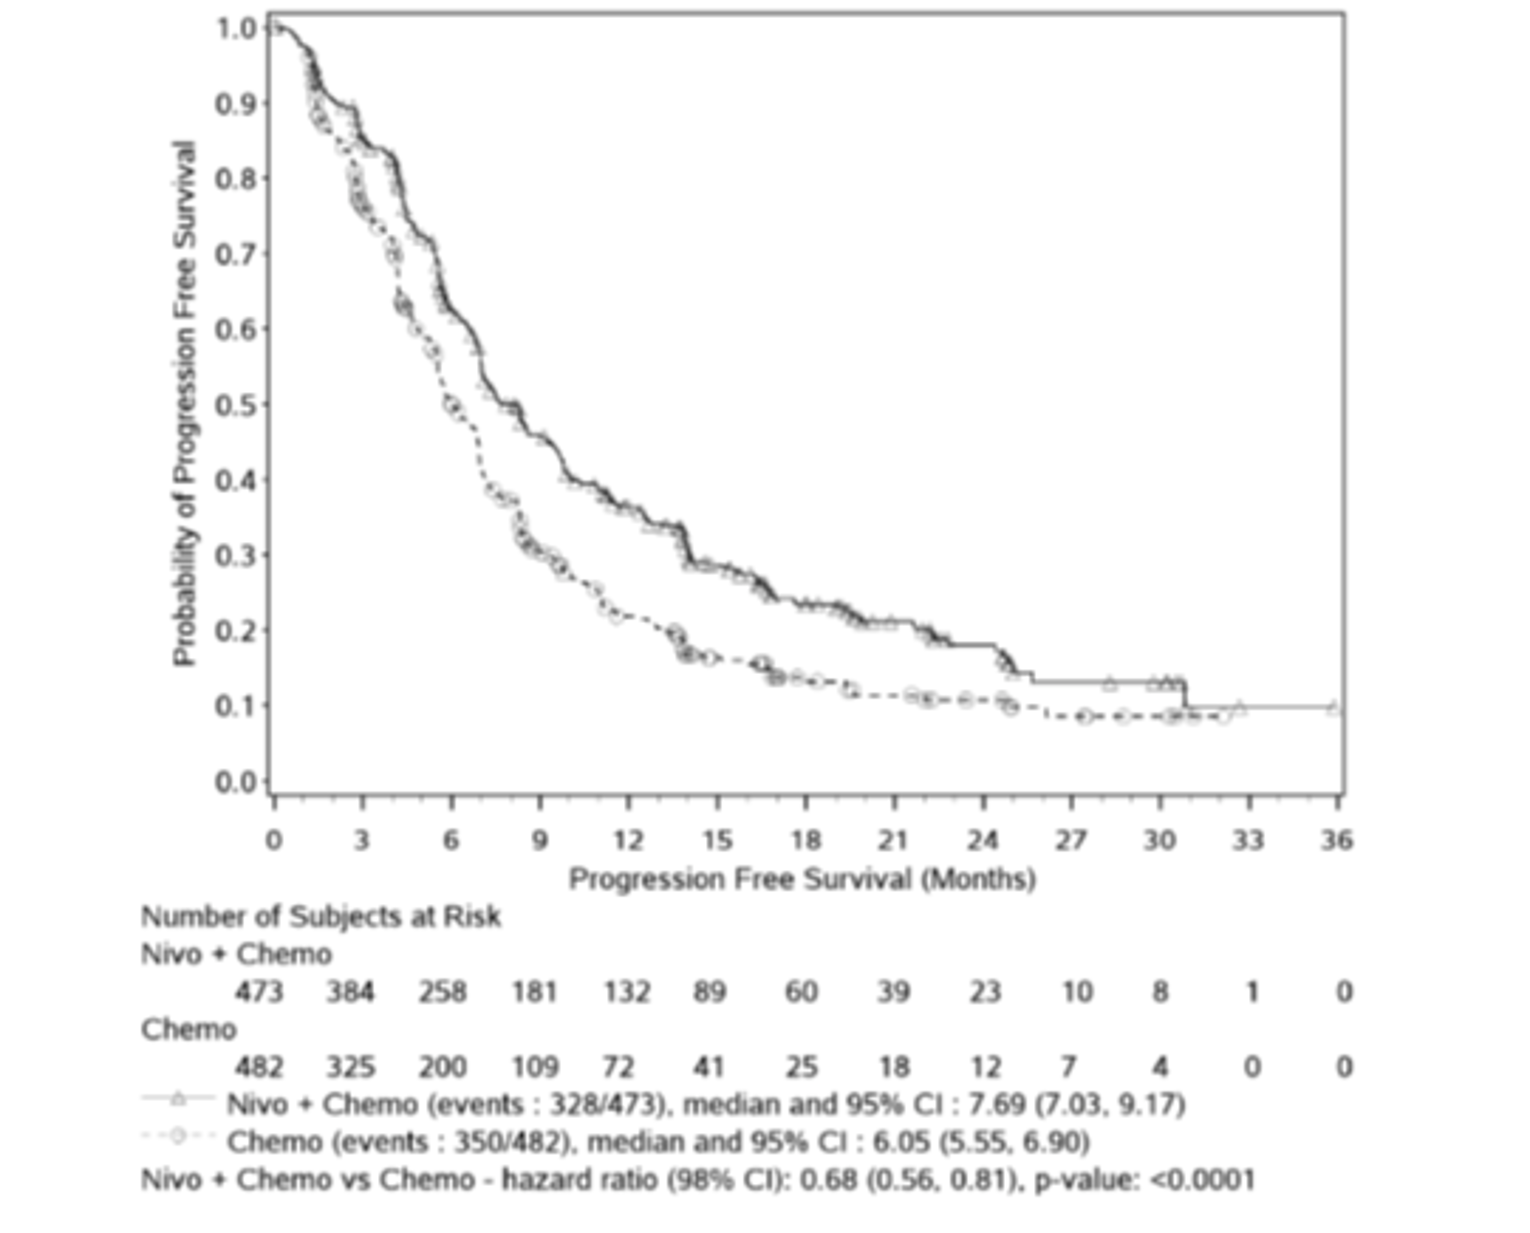
Note: Symbols represent censored observations. HR is from stratified Cox proportional hazards model and P value is from stratified log-rank test.
Source: CheckMate-649 Clinical Study Report.14
Objective Response Rate
ORR (best overall response of PR or CR) per BICR in patients with PD-L1 CPS of 10 or higher, patients with PD-L1 CPS of 5 or higher, patients with PD-L1 CPS of 1 or higher, and all randomized patients is shown in Table 20. Among patients with PD-L1 CPS of 10 or higher, the difference in ORR comparing nivolumab plus chemotherapy versus chemotherapy was |||% (95% CI, |||% to |||%) and the OR for response was ||| (95% CI, ||| to |||). Among patients with PD-L1 CPS of 5 or higher, the difference in ORR comparing nivolumab plus chemotherapy versus chemotherapy was |||% (95% CI, |||% to |||%) and the OR for response was ||| (95% CI, ||| to |||). Among patients with PD-L1 CPS of 1 or higher, the difference in ORR comparing nivolumab plus chemotherapy versus chemotherapy was |||% (95% CI, |||% to |||%) and the OR for response was ||| (95% CI, ||| to |||). Among all randomized patients, the difference in ORR comparing nivolumab plus chemotherapy versus chemotherapy was |||% (95% CI, |||% to |||%) and the OR for response was ||| (95% CI, ||| to |||).
Table 20: ORR per BICR Among Patients With PD-L1 CPS ≥ 10, PD-L1 CPS ≥ 5, PD-L1 CPS ≥ 1, and All Randomized Patients in the CheckMate-649 Trial
Item | PD-L1 CPS ≥ 10 | PD-L1 CPS ≥ 5 | PD-L1 CPS ≥ 1 | All randomized patients | ||||
|---|---|---|---|---|---|---|---|---|
Nivo + chemo (N = 375) | Chemo (N = 393) | Nivo + chemo (N = 473) | Chemo (N = 482) | Nivo + chemo (N = 641) | Chemo (N = 655) | Nivo + chemo (N = 789) | Chemo (N = 792) | |
Responders, n (%)a | ||| (|||) | ||| (|||) | ||| (|||) | ||| (|||) | ||| (|||) | ||| (|||) | ||| (|||) | ||| (|||) |
95% CI, % | ||| to ||| | ||| to ||| | ||| to ||| | ||| to ||| | ||| to ||| | ||| to ||| | ||| to ||| | ||| to ||| |
Difference of ORR, % (95% CI)b,c | ||| (||| to |||) | ||| (||| to |||) | ||| (||| to |||) | ||| (||| to |||) | ||||
OR (95% CI)d | ||| (||| to |||) | ||| (||| to |||) | ||| (||| to |||) | ||| (||| to |||) | ||||
P valuee | ||| | ||| | ||| | ||| | ||||
Best overall response, n (%) | NA | NA | NA | NA | NA | NA | NA | NA |
CR | ||| (|||) | ||| (|||) | ||| (|||) | ||| (|||) | ||| (|||) | ||| (|||) | ||| (|||) | ||| (|||) |
PR | ||| (|||) | ||| (|||) | ||| (|||) | ||| (|||) | ||| (|||) | ||| (|||) | ||| (|||) | ||| (|||) |
SD | ||| (|||) | ||| (|||) | ||| (|||) | ||| (|||) | ||| (|||) | ||| (|||) | ||| (|||) | ||| (|||) |
Progressive disease | ||| (|||) | ||| (|||) | ||| (|||) | ||| (|||) | ||| (|||) | ||| (|||) | ||| (|||) | ||| (|||) |
UTD | ||| (|||) | ||| (|||) | ||| (|||) | ||| (|||) | ||| (|||) | ||| (|||) | ||| (|||) | ||| (|||) |
NR | ||| (|||) | ||| (|||) | ||| (|||) | ||| (|||) | ||| (|||) | ||| (|||) | ||| (|||) | ||| (|||) |
BICR = blinded independent central review; CI = confidence interval; CPS = combined positive score; CR = complete response; NA = not applicable; NR = not reported; OR = odds ratio; ORR = objective response rate; PD-L1 = programmed death ligand 1; PR = partial response; SD = stable disease; UTD = unable to determine.
aConfirmed CR or PR by RECIST 1.1.
bStratified adjusted difference in response rate (nivolumab + chemotherapy vs. chemotherapy) based on DerSimonian and Laird method of weighting.
cStratified by region, ECOG PS, tumour cell PD-L1, and chemotherapy regimen.
dStratified adjusted odds ratio (nivolumab + chemotherapy vs. chemotherapy) using Mantel-Haenszel method.
eTwo-sided P value from stratified Cochran-Mantel-Haenszel test. Note that this P value is not adjusted for multiplicity.
Source: CheckMate-649 Clinical Study Report.14
Duration of Response
DOR per BICR in patients with PD-L1 CPS of 10 or higher, patients with PD-L1 CPS of 5 or higher, patients with PD-L1 CPS of 1 or higher, and all randomized patients is shown in Table 21. Among patients with PD-L1 CPS of 10 or higher, the median DOR was ||| months (95% CI, ||| to ||| months) in the nivolumab plus chemotherapy arm and ||| months (95% CI, ||| to ||| months) in the chemotherapy arm. Among patients with PD-L1 CPS of 5 or higher, the median DOR was 9.49 months (95% CI, 7.98 to 11.37 months) in the nivolumab plus chemotherapy arm and 6.97 months (95% CI, 5.65 to 7.85 months) in the chemotherapy arm. Among patients with PD-L1 CPS of 1 or higher, the median DOR was ||| months (95% CI, ||| to ||| months) in the nivolumab plus chemotherapy arm and ||| months (95% CI, ||| to ||| months) in the chemotherapy arm. Among all randomized patients, the median DOR was 8.51 months (95% CI, 7.23 to 9.92 months) in the nivolumab plus chemotherapy arm and 6.93 months (95% CI, 5.82 to 7.16 months) in the chemotherapy arm.
Table 21: DOR per BICR Among Patients With Measurable Disease and PD-L1 CPS ≥ 10, PD-L1 CPS ≥ 5, PD-L1 CPS ≥ 1, and All Randomized Patients in the CheckMate-649 Trial
Item | PD-L1 CPS ≥ 10 | PD-L1 CPS ≥ 5 | PD-L1 CPS ≥ 1 | All randomized patients | ||||
|---|---|---|---|---|---|---|---|---|
Nivo + chemo (N = 375) | Chemo (N = 393) | Nivo + chemo (N = 473) | Chemo (N = 482) | Nivo + chemo (N = 641) | Chemo (N = 655) | Nivo + chemo (N = 789) | Chemo (N = 792) | |
Patients with responses, n | ||| | ||| | ||| | ||| | ||| | ||| | ||| | ||| |
Events among responders, n (%) | ||| (|||) | ||| (|||) | ||| (|||) | ||| (|||) | ||| (|||) | ||| (|||) | ||| (|||) | ||| (|||) |
Median DOR (95% CI), monthsa | ||| (||| to|||) | ||| (||| to|||) | 9.49 (7.98 to 11.37) | 6.97 (5.65 to 7.85) | ||| (||| to |||) | ||| (||| to |||) | 8.51 (7.23 to 9.92) | 6.93 (5.82 to 7.16) |
DOR range, months | || to|| | || to|| | || to|| | || to|| | || to|| | || to|| | || to|| | ||to|| |
DOR ≥ 12 months, % (95% CI)a | ||| (||| to|||) | ||| (||| to|||) | ||| (||| to |||) | ||| (||| to |||) | ||| (||| to |||) | ||| (||| to |||) | ||| (||| to |||) | ||| (||| to |||) |
BICR = blinded independent central review; chemo = chemotherapy; CI = confidence interval; CPS = combined positive score; DOR = duration of response; nivo = nivolumab; PD-L1 = programmed death ligand 1.
Note: + indicates a censored value. Results are from the July 10, 2020, database lock.
aBased on Kaplan-Meier estimates.
Source: CheckMate-649 Clinical Study Report.14
Symptom Severity
TTSD, defined as time from randomization to a decline of 8.2 points from baseline in GaCS score, is shown for all randomized patients in Table 22 and Figure 11. Median TTSD was not reached in the nivolumab plus chemotherapy arm. The median TTSD in the chemotherapy arm was 21.03 months (95% CI lower bound 12.45 months). The HR for comparison of the nivolumab plus chemotherapy arm versus the chemotherapy arm was 0.77 (95% CI, 0.63 to 0.95).
Table 22: TTSD Among All Randomized Patients in the CheckMate-649 Trial
Item | All randomized patients | |
|---|---|---|
Nivolumab + chemotherapy (N = 789) | Chemotherapy (N = 792) | |
Events, n (%) | ||| (|||) | ||| (|||) |
Median TTSD (95% CI), monthsa | NR (22.64 to NA) | 21.03 (12.45 to NA) |
HR (95% CI)b | 0.77 (0.63 to 0.95) | |
CI = confidence interval; HR = hazard ratio; NA = not applicable; NR = not reached; TTSD = time to symptom deterioration.
Note: Results are from the July 10, 2020, database lock.
aBased on Kaplan-Meier estimates.
bStratified Cox proportional hazards model; HR for nivolumab + chemotherapy compared with chemotherapy. Stratification factors were region, ECOG PS, tumour cell PD-L1, and chemotherapy regimen.
Source: CheckMate-649 Clinical Study Report.14
Figure 11: TTSD Among All Randomized Patients in the CheckMate-649 Trial
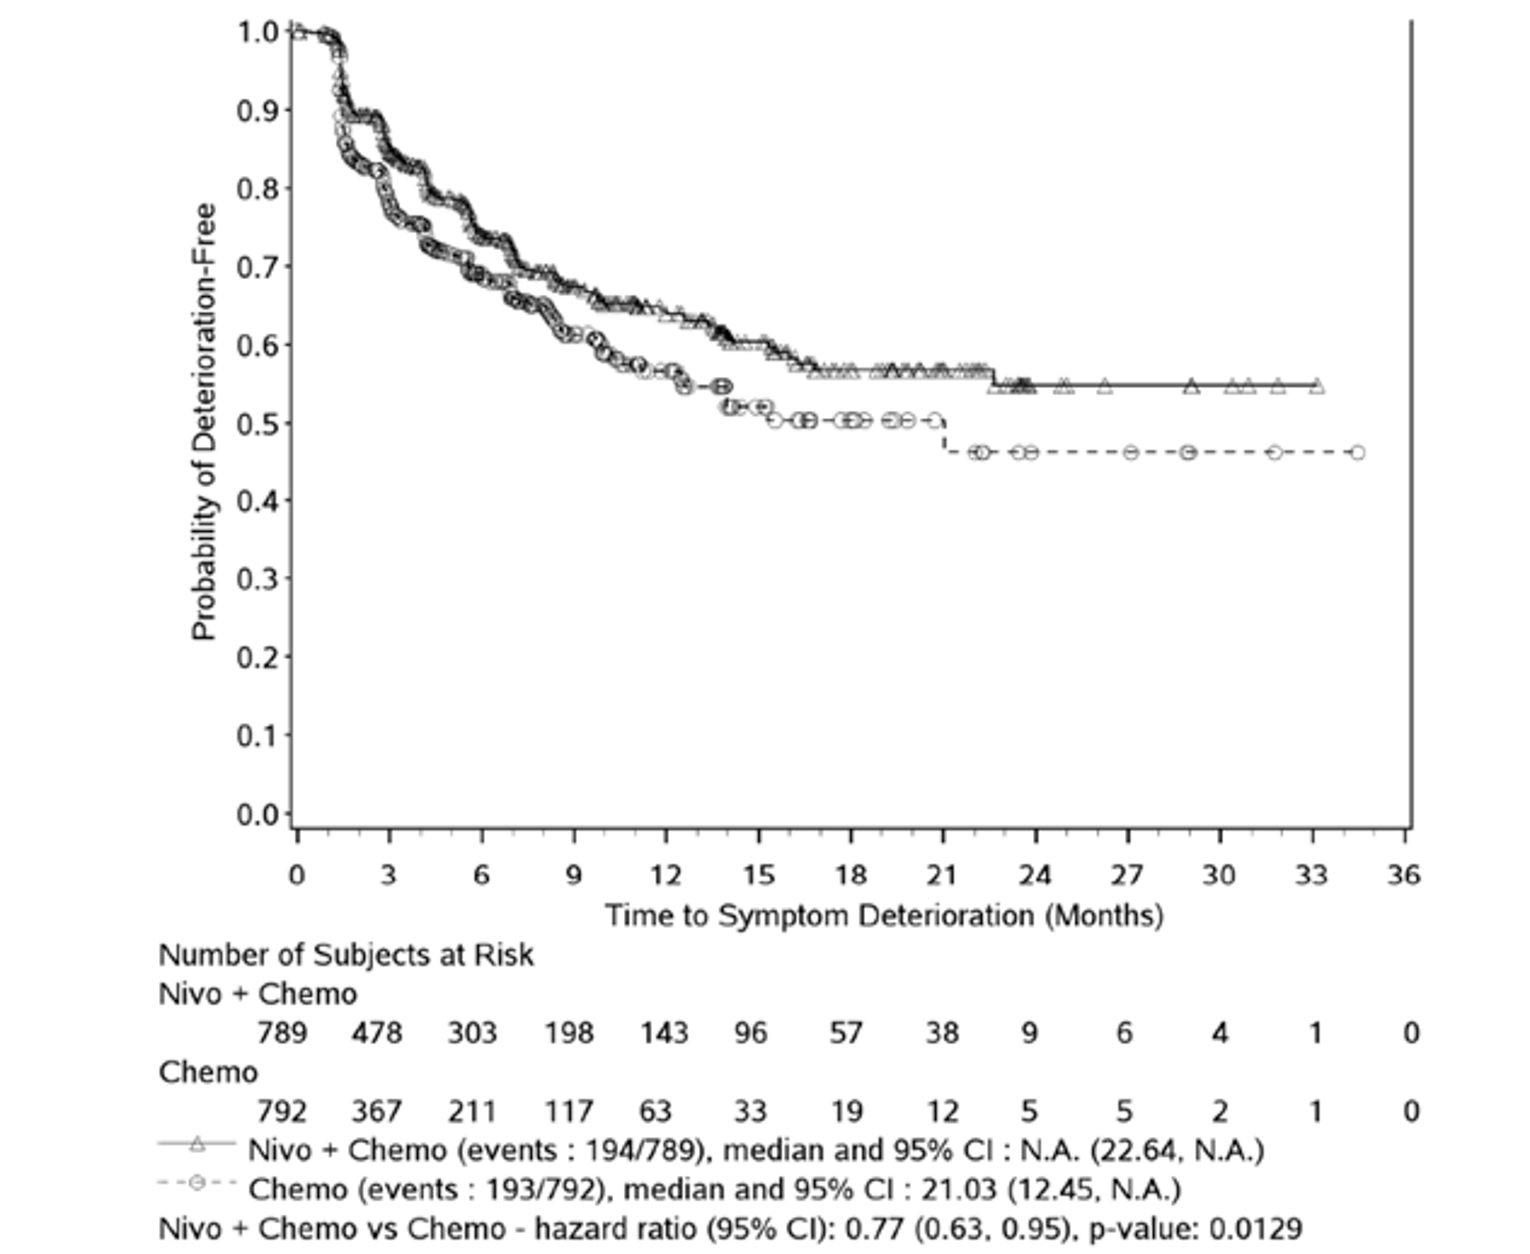
TTSD = time to symptom deterioration.
Note: Symbols represent censored observations. HR is from stratified Cox proportional hazards model.
Source: CheckMate-649 Clinical Study Report.14
Harms
Only those harms identified in the review protocol are reported below. Refer to Table 23 for detailed harms data.
Adverse Events
Almost all patients in the nivolumab plus chemotherapy arm (99.2%) and the chemotherapy arm (98.0%) experienced at least 1 AE. In the nivolumab plus chemotherapy arm, 69.1% of patients experienced at least 1 AE of Grade 3 or higher, while in the chemotherapy arm, 59.5% of patients experienced at least 1 AE of Grade 3 or higher. Common AEs in both arms were nausea, vomiting, diarrhea, peripheral neuropathy, neutropenia, and anemia.
Serious Adverse Events
SAEs occurred in 54.1% (Grade ≥ 3, 35.9%) of patients receiving nivolumab plus chemotherapy and 43.7% (Grade ≥ 3, 29.9%) of patients receiving chemotherapy. SAEs occurring in at least 2% of either treatment group were vomiting, diarrhea, dysphagia, malignant neoplasm progression, pneumonia, anemia, febrile neutropenia, pneumonitis, and pyrexia. Aside from malignant neoplasm progression, each of these SAEs occurred in less than 4% of either treatment group.
Withdrawals Due to Adverse Events
WDAEs occurred when AEs led to discontinuation of at least 1 study drug, regardless of whether the patient continued with study treatment. Overall, 47.4% of patients in the nivolumab plus chemotherapy arm and 32.7% of patients in the chemotherapy arm experienced WDAEs. Common WDAEs included progressive disease, peripheral neuropathy, and diarrhea. Note that only 7.7% of patients in the nivolumab plus chemotherapy arm and 5.2% of patients in the chemotherapy arm discontinued study treatment due to unacceptable toxicity (Table 12).
Mortality
During the study period, 68.8% of patients receiving nivolumab plus chemotherapy and 74.6% of patients receiving chemotherapy died. Deaths attributed to study drug toxicity by investigators occurred in 1.5% of patients in the nivolumab plus chemotherapy arm and 0.5% of patients in the chemotherapy arm.
Notable Harms
Refer to Table 10 for definitions of select AEs, IMAEs, and OESIs, which were protocol-defined to capture the expected toxicity profile of nivolumab. Select AEs in all categories, and most IMAEs and OESIs, occurred more frequently in the nivolumab plus chemotherapy arm than in the chemotherapy arm. Select AEs affecting the gastrointestinal system (40.3% in the nivolumab plus chemotherapy arm and 33.9% in the chemotherapy arm), select AEs affecting the hepatic system (34.1% and 24.3%), select AEs affecting the skin (33.5% and 17.9%), select AEs affecting the endocrine system (15.0% and 1.8%), and hypersensitivity/infusion reactions (15.1% and 5.9%) were the most common select AEs in the nivolumab plus chemotherapy arm. Hypothyroidism/thyroiditis (9.5% in the nivolumab plus chemotherapy arm and 0.8% in the chemotherapy arm), rash (6.5% and 0.5%), pneumonitis (4.2% and 0%), diarrhea/colitis (3.3% and 0%), hyperthyroidism (2.9% and 0.3%), and hepatitis (2.4% and 0%) were the most common IMAEs in the nivolumab plus chemotherapy arm.
Table 23: Summary of Harms in the CheckMate-649 Trial
Harms | Nivolumab + chemotherapy (N = 782) | Chemotherapy (N = 767) |
|---|---|---|
Patients with ≥ 1 AE, n (%) | ||
Total | 776 (99.2) | 752 (98.0) |
Grade 3/4 | 540 (69.1) | 456 (59.5) |
Common AEsa | ||
Nausea | 372 (47.6) | 334 (43.5) |
Diarrhea | 308 (39.4) | 258 (33.6) |
Vomiting | 245 (31.3) | 221 (28.8) |
Peripheral neuropathy | 232 (29.7) | 201 (26.2) |
Fatigue | 257 (32.9) | 219 (28.6) |
Neutropenia | 214 (27.4) | 192 (25.0) |
Anemia | 299 (38.2) | 254 (33.1) |
Decreased appetite | 224 (28.6) | 203 (26.5) |
Patients with ≥ 1 SAE, n (%) | ||
Total | 423 (54.1) | 335 (43.7) |
Grade 3/4 | 281 (35.9) | 229 (29.9) |
Common SAEsb | ||
Vomiting | 25 (3.2) | 24 (3.1) |
Diarrhea | 19 (2.4) | 12 (1.6) |
Dysphagia | 10 (1.3) | 16 (2.1) |
Malignant neoplasm progression | 109 (13.9) | 90 (11.7) |
Pneumonia | 22 (2.8) | 10 (1.3) |
Anemia | 24 (3.1) | 9 (1.2) |
Febrile neutropenia | 18 (2.3) | 7 (0.9) |
Pneumonitis | 17 (2.2) | 1 (0.1) |
Pyrexia | 20 (2.6) | 10 (1.3) |
Patients with ≥ 1 WDAE, n (%) | ||
Total | 371 (47.4) | 251 (32.7) |
Grade 3/4 | 194 (24.8) | 113 (14.7) |
Common WDAEs, n (%)b | ||
Peripheral neuropathy | 61 (7.8) | 41 (5.3) |
Peripheral sensory neuropathy | 35 (4.5) | 36 (4.7) |
Diarrhea | 16 (2.0) | 7 (0.9) |
Malignant neoplasm progression | 37 (4.7) | 28 (3.7) |
Deaths, n (%) | ||
Total | 538 (68.8) | 572 (74.6) |
Primary reason for death | ||
Disease | 465 (59.5) | 506 (66.0) |
Study drug toxicity | 12 (1.5) | 4 (0.5) |
Unknown | 12 (1.5) | 18 (2.3) |
Other | 49 (6.3) | 44 (5.7) |
Notable harms, n (%) | ||
Selected AEs | ||
Endocrine | 117 (15.0) | 14 (1.8) |
Gastrointestinal | 315 (40.3) | 260 (33.9) |
Hepatic | 267 (34.1) | 186 (24.3) |
Pulmonary | 41 (5.2) | 6 (0.8) |
Renal | 58 (7.4) | 24 (3.1) |
Skin | 262 (33.5) | 137 (17.9) |
Hypersensitivity/infusion reactions | 118 (15.1) | 45 (5.9) |
IMAEsc | ||
Diarrhea/colitis | 26 (3.3) | 0 |
Hepatitis | 19 (2.4) | 0 |
Pneumonitis | 33 (4.2) | 0 |
Nephritis/renal dysfunction | 4 (0.5) | 0 |
Rash | 51 (6.5) | 4 (0.5) |
Hypersensitivity/infusion reactions | 6 (0.8) | 0 |
Endocrine IMAEsc | ||
Adrenal insufficiency | 5 (0.6) | 2 (0.3) |
Hypophysitis | 6 (0.8) | 0 |
Hypothyroidism/thyroiditis | 74 (9.5) | 6 (0.8) |
Diabetes mellitus | 2 (0.3) | 0 |
Hyperthyroidism | 23 (2.9) | 2 (0.3) |
OESIsc | ||
Pancreatitis | 3 (0.4) | 2 (0.3) |
Encephalitis | 1 (0.1) | 0 |
Myositis/rhabdomyolysis | 0 | 0 |
Myasthenic syndrome | 0 | 0 |
Demyelination | 0 | 0 |
Guillain-Barré syndrome | 1 (0.1) | 0 |
Uveitis | 1 (0.1) | 0 |
Myocarditis | 2 (0.3) | 0 |
Graft vs. host disease | 0 | 0 |
||||||||||||||||||||||||||||||||||||||||||||||||||||| | ||| | ||| |
||||||||||||||||||||||||||||||||||||||||||||||| | ||
|||||||||||||||||||||||||| | ||||||||||||| | ||||||||||||| |
||||||||||||||||||||||||||||||||||||| | ||||||||||||| | ||||||||||||| |
Abdominal pain | 151 (19.3) | 120 (15.6) |
Abdominal pain upper | 72 (9.2) | 69 (9.0) |
AE = adverse event; GI = gastrointestinal; IMAE = immune-mediated adverse event; OESI = other event of special interest; SAE = serious adverse event; WDAE = withdrawal due to adverse event.
Note: AEs were defined and graded using Medical Dictionary for Regulatory Activities version 23.0 and Common Terminology Criteria for Adverse Events version 4.0. All events are within 30 days of the last dose of study drug unless otherwise indicated (any time for deaths, 100 days for IMAEs and OESIs). Results are from the July 10, 2020, database lock.
aAEs ≥ 25% in either study arm are shown.
bSAEs with frequency ≥ 2% in either study arm are shown.
cWDAEs with frequency ≥ 2% in either study arm are shown.
dWithin 100 days of last dose, with or without immune-modulating medication.
Source: CheckMate-649 Clinical Study Report.14
Critical Appraisal
Internal Validity
CheckMate-649 was a large, phase III, randomized, OL, multi-centre study of patients with locally advanced or metastatic GAC, GEJAC, or EAC (N = 1,581).12 Randomization appeared adequate in balancing baseline demographic and disease characteristics between the nivolumab plus chemotherapy and chemotherapy arms. Randomization was conducted using an interactive web response system which appropriately concealed allocation, although the specific randomization algorithm used was not stated. Notably, randomization was stratified by tumour cell PD-L1 (≥ 1% versus < 1%), while the co-primary efficacy analyses of OS and PFS were conducted in patients with PD-L1 CPS of 5 or higher, hierarchically tested secondary OS analyses in patients with PD-L1 CPS of 1 or higher, and all randomized patients. Thus, the protection from imbalance in PD-L1 expression originally planned via stratification was lost through this change in the study protocol. There were no baseline imbalances in demographic or disease characteristics of prognostic importance, according to the clinical experts consulted by CADTH for this review.
Many of the outcomes used in the CheckMate-649 study (PFS, OS, ORR, DOR) are standard in oncology trials. Tumour responses were objectively evaluated using RECIST 1.1 by BICR. OS was not censored for patients who initiated other anticancer therapies following CheckMate-649 protocol therapy discontinuation, and approximately 8% of patients in the chemotherapy arm received subsequent immunotherapy, including PD-1 inhibitors. According to clinical experts consulted by CADTH for this review, this minor degree of crossover would probably only have had minor impact on the OS analysis, as this was a small proportion of patients and immunotherapy has been demonstrated to be less effective in the second or further line of therapy.
The OL design of the CheckMate-649 study had the potential to introduce bias in several forms, although the impacts of these biases are difficult to evaluate. Early dropouts (before the first dose of therapy: nivolumab plus chemotherapy arm 0.9% versus chemotherapy arm 3.2%), discontinuation of therapy during the treatment phase (patient request: nivolumab plus chemotherapy arm 1.7% versus chemotherapy arm 4.6%; withdrawal of consent: nivolumab plus chemotherapy arm 2.6% versus chemotherapy arm 5.3%), and discontinuation from the study (withdrawal of consent: nivolumab plus chemotherapy arm 2.6% versus chemotherapy arm 4.7%) occurred more often in the chemotherapy arm compared with the nivolumab plus chemotherapy arm. According to the clinical experts consulted for this review, 1 potential explanation is that some patients declined to participate in the study following randomization to the chemotherapy-only arm of the study. Selective discontinuation of therapy in the chemotherapy-only arm would decrease relative exposure to chemotherapy and potentially treatment efficacy, although some patients who discontinued protocol therapy likely received other chemotherapy. According to the clinical experts consulted for this review, the patients who discontinued treatment before progressive disease in the chemotherapy-only arm would not be expected to differ systematically from those who remained on protocol therapy. Similarly, since the decision to continue or discontinue therapy was made by the investigator based on local scans (not BICR) and treatment beyond progression was allowed for nivolumab plus chemotherapy, investigator bias for or against the nivolumab plus chemotherapy regimen could have altered treatment exposure in both study arms and potentially efficacy. The number of patients who were censored from PFS analyses due to initiation of new anticancer therapy before objective progressive disease (and due to incorrect assignment of progressive disease by local investigators) was similar in both trial arms, suggesting no major systematic bias. According to the clinical experts consulted for this review, the frequency of treatment beyond progression in the CheckMate-649 trial (27.1% of all randomized patients) was higher and the duration of treatment beyond progression (mean number of doses of ||| [SD = |||] and mean duration of ||| months [SD = ||| months]) was longer than expected, based on current clinical practice in Canada. The impact of extended administration of nivolumab on OS was uncertain, although the clinical experts were of the opinion that post-progression treatment was unlikely to meaningfully influence OS or interpretation of OS data. According to the clinical experts consulted for this review, treatment beyond progression can be administered in select patients with pseudoprogression and/or oligoprogression, and the vast majority of patients would be discontinued from therapy at the time of progressive disease or shortly thereafter.
Several statistical issues should be considered when interpreting the results of the CheckMate-649 trial. Many components of the study protocol, including treatment arms, analysis populations, and statistical analysis plans, were altered several times over the course of the study based on data from other immunotherapy trials. Data from the CheckMate-649 study itself likely did not impact the design of the study, as unblinding did not occur until DMC review of the final PFS and interim OS analysis. Because of the change from an event-driven analysis to a time-driven one, and unexpectedly high prevalence of PD-L1 CPS of 5 or higher in the trial population, the primary analyses of PFS and OS had more than the anticipated statistical power (e.g., 99.9% for PFS) and thus would be likely to detect very small differences in outcomes that may or may not meet the threshold for clinical relevance. However, results of the OS and PFS analyses at the July 10, 2020, database lock (final PFS and interim OS analysis; minimum follow-up 12.1 months) and the more recent February 16, 2021, database lock (near-final OS analysis; minimum follow-up 19.4 months) were very similar. Statistical tests were overall appropriate, and a strict hierarchical strategy was applied for multiplicity control of co-primary and hierarchically tested PFS and OS analyses. Although statistical testing of the proportional hazard assumption in Cox models did not uncover evidence of departure from this assumption, sample size calculations (using 2-piece HRs), experience from other immunotherapy trials, and the data from the CheckMate-649 study all pointed toward delayed separation of KM curves and differences in early and late treatment effects. The co-primary OS and PFS analyses were robust to an array of sensitivity analyses. However, several outcomes of interest to this review (OS in patients with PD-L1 CPS of 10 or higher; PFS in patients with PD-L1 CPS of 10 or higher, PD-L1 CPS of 1 or higher, and all randomized patients) were not controlled for multiplicity. Subgroup analyses of interest to this review were specified a priori and only 1 (tumour PD-L1 expression) was based on a stratification variable (PD-L1 CPS, HER2 status, and MSI were not stratification variables). The study was not specifically powered to evaluate strata among subgroups, there were no tests for differences among subgroups, and subgroup analyses were not controlled for multiplicity.
The absence of formal statistical comparison and missing HRQoL data at later time points post-baseline (due to withdrawal of consent and low completion rates following treatment discontinuation as well as expected attrition of the study population) limited interpretation of potentially important changes in these outcomes, which are considered highly important by patients. Furthermore, measurement of patient-reported HRQoL and harms outcomes may have been influenced to some degree by knowledge of treatment allocation. Moreover, although FACT-Ga has been validated in patients with GC, the GaCS has not been validated as a stand-alone scale, and the degree to which it specifically measures changes in symptoms versus general HRQoL is unclear. The sponsor-defined MIDs for EQ-5D-3L utility index scores (0.08 points), EQ VAS (7 points), and the FACT-Ga GaCS score (8.2 points) were in the range of those used and validated in the literature.
External Validity
According to the clinical experts consulted by CADTH for this review, the demographic and disease characteristics of the CheckMate-649 study13 population reflected the Canadian population with GAC, GEJAC, and EAC. Applying the inclusion and exclusion criteria to this patient population resulted in a relatively high proportion of screen failures (36.3% at the global study level). According to the clinical experts, this was expected in this patient population and would not be a major source of bias. However, as in most oncology trials, the clinical experts emphasized that the enrolment criteria likely selected for a healthier cross-section of the overall patient population with GAC, GEJAC, or EAC, who were more likely to tolerate and respond to therapy. The experts stated that, as with any trial situation, the patients under study (e.g., ECOG PS 0 or 1) were in better health and more likely to respond favourably to treatment than a general population. The experts expected that, in clinical practice, some patients with ECOG PS 2 or even 3 may receive nivolumab plus chemotherapy and were uncertain whether the study results could be generalized to these patients. The study population was drawn from a wide variety of different sites around the globe. While most participants were White, male, and had stage IV metastatic GAC, this would not limit generalizability to other patients with GAC, GEJAC, or EAC, including the smaller numbers of patients with EAC and locally recurrent or locally advanced disease. The experts commented that the screen failure rate in the trial was expected based on the eligibility criteria as well as generally rapid disease progression in the patients under study. The experts noted that the high proportion (approximately 40%) of patients with unknown HER2 status likely resulted from limited availability of HER2 testing in some regions participating in the study. The experts agreed that the results of the CheckMate-649 study cannot be easily generalized to lines of therapy other than the first-line or to treatment of sicker patients with more advanced disease (ECOG PS ≥ 2).
In the CheckMate-649 trial, approximately 83%, 61%, and 49% of patients had PD-L1 CPS of 1 or higher, 5 or higher, and 10 or higher, respectively. Thus, the data from the study cannot be easily generalized to patients with PD-L1 CPS < 1 since few of these patients were included in the trial. According to the experts, the data from the trial (for all randomized patients) would be generalizable to patients with unknown PD-L1 expression, as there were no restrictions on PD-L1 expression level in the trial. Thus, patients with unmeasured PD-L1 would be expected to mirror the distribution of PD-L1 expression in the trial population.
Doses of nivolumab and chemotherapy administered in the trial were aligned with Health Canada–approved dosing and with clinical practice. The clinical experts consulted for this review felt that the 24-month cap on nivolumab treatment was appropriate and that treatment beyond progressive disease with nivolumab plus chemotherapy but not chemotherapy alone was a reasonable approach due to the possibility of pseudoprogression and/or oligoprogression. However, treatment beyond progressive disease was acknowledged by the clinical experts to be appropriate only in a small minority of patients (approximately 5%).36 The frequency and duration of treatment beyond progression in the CheckMate-649 study were higher and longer than what would be expected based on Canadian clinical practice. The experts also stated that the trial approach of allowing dose reductions for chemotherapy but not for nivolumab was clinically appropriate. Despite use of immunostimulants (granulocyte colony stimulating factor) to counteract myelosuppressive AEs in patients receiving nivolumab plus chemotherapy in the study, the experts did not feel that this would impede generalizability to Canadian practice, as access to this growth factor is increasing even in palliative settings. However, generalizability of the CheckMate-649 study results to other treatment strategies or durations (e.g., shorter treatment periods, treatment until progressive disease only, dose-reduced treatment) was uncertain. Since nivolumab plus chemotherapy would be administered in a hospital or specialty clinic setting, background care (e.g., oncologist visits, imaging frequency, blood testing) would be expected to be similar to the CheckMate-649 trial situation for Canadian patients in real-world clinical settings.
Several of the outcomes examined in the CheckMate-649, including OS, HRQoL, and PFS, were identified as clinically important by both patients and clinical experts. Both patients and clinicians stated that survival is the most important outcome of treatment, but maintaining or improving HRQoL is also a critical consideration. According to the experts consulted by CADTH for this review, the HRQoL instruments used in the CheckMate-649 trial (EQ-5D-3L, FACT-Ga), although important research tools, are not used in clinical practice. The duration of follow-up was adequate for assessment of the primary and secondary outcomes (PFS, OS, ORR), especially at the most recent database lock of February 16, 2021.
Indirect Evidence
Objectives and Methods for the Summary of Indirect Evidence
The CheckMate-649 trial compared nivolumab in combination with investigator’s choice of chemotherapy (FOLFOX or XELOX) to chemotherapy alone for first-line treatment of patients with previously untreated advanced or metastatic GAC, GEJAC, or EAC. The objective of this section is to summarize and critically appraise available indirect evidence comparing nivolumab plus chemotherapy to other relevant comparators for treatment of GAC, GEJAC, or EAC. One ITC, prepared by Pharmerit for the sponsor, is summarized and critically appraised below.
A supplemental search of the medical literature for publicly available ITCs was conducted by the CADTH review team. A focused literature search for network meta-analyses (NMAs) dealing with GC, GEJC, or EAC was run in MEDLINE All (1946–) on September 16, 2021. No limits were applied to the search. There were no relevant ITCs identified through the CADTH literature search, although 1 article by da Silva et al. (2021)37 was considered for inclusion. This published ITC combined information from the ATTRACTION-416 and CheckMate-64913 trials, both of which evaluated nivolumab in combination with chemotherapy. Ultimately, the publication by da Silva et al. (2021)37 was excluded, as it had pooled data from 2 trials that combined nivolumab with 2 different chemotherapy regimens. One of the chemotherapy regimens used in the ATTRACTION-4 trial was S-1 plus oxaliplatin (SOX) which is not available in Canada; as data using this regimen was combined with efficacy data from CheckMate-649, which assessed nivolumab in combination with FOLFOX or XELOX, the ITC was excluded.
Methods of the Sponsor-Submitted ITC
Objectives
The purpose of the sponsor-submitted ITC was to compare the efficacy of nivolumab plus chemotherapy to alternative treatments among patients being treated in the first line for advanced or metastatic GC, GEJC, or EAC. A secondary objective of the sponsor-submitted ITC was to compare the efficacy of nivolumab plus chemotherapy to chemotherapy alone in the first line for patients with advanced or metastatic advanced or metastatic GC, GEJC, or EAC based on PD-L1 expression (≥ 1, ≥ 5, and ≥ 10) subgroups in the CheckMate-649 trial.13
Study Selection Methods
The sponsor-submitted ITC was informed by a systematic literature review to identify relevant studies for the ITC. A literature search was conducted based on the details reported in Table 24. The systematic literature review was aimed at identifying all available RCTs that assessed patients with GC, GEJC, and EAC in the first line. Studies were retrieved from MEDLINE, Embase, and Cochrane Library. In addition to electronic databases, the ITC authors conducted searches to identify trials through clinicaltrials.gov and conference proceedings. The search was conducted on April 24, 2018, and then updated on August 12, 2019. The list of comparators considered relevant were based on European Society for Medical Oncology guidelines, National Comprehensive Cancer Network guidelines, and the pan-Asian adapted European Society for Medical Oncology guidelines.
Identified citations were compiled into an Excel file and screened by 2 reviewers based on titles and abstracts. The full text of relevant citations identified after the title and abstract stage were then screened by 2 reviewers. Data were extracted from relevant full-text articles by 1 reviewer and checked for accuracy by a second reviewer.
Table 24: Study Selection Criteria and Methods for the Sponsor-Submitted ITC
Criteria | Description |
|---|---|
Population |
|
Interventions | In addition to nivolumab, any systemic anticancer therapy categorized as follows:
|
(continued) |
|
Comparators | Any of the interventions listed above |
Outcomes |
|
Study designs | RCTs (phase II and III), systematic reviews,b non-randomized studies (observational studies, single-group studiesc) |
Publication characteristics | No data limits for publication date or language of publication were imposed |
Exclusion criteria | Population
Interventions
|
(continued) |
Outcomes
Study designs
|
Databases searched |
|
Selection process | Two independent reviewers screened articles |
Data-extraction process |
|
Quality assessment | Studies were assessed using the checklist for RCTs from the CRD Guidance for Undertaking Reviews in Health Care (2009) |
AE = adverse event; BOR = best overall response; CR = complete response; CRD = Centre for Reviews and Dissemination; DCR = disease control rate; DOR = duration of response; EAC = esophageal adenocarcinoma; GC = gastric cancer; GEJC = gastroesophageal junction cancer; HRQoL = health-related quality of life; ITC = indirect treatment comparison; ORR = objective response rate; OS = overall survival; PFS = progression-free survival; PR = partial response; RCT = randomized control trial; SD = stable disease.
aThese specifications were made during the full-text selection phase and were applied to all studies included in the full-text screening.
bData from systematic reviews and ITCs were not extracted into the data-extraction form. The references from these publications were checked to ensure no important article was missed by the search strategy.
cNon-randomized studies were not considered for the purpose of the NMA, as many RCTs were identified which investigated all therapies on interest.
Source: Sponsor-submitted ITC.15
Pembrolizumab monotherapy and pembrolizumab plus chemotherapy were not considered relevant comparators, based on the KEYNOTE-062 trial35 and the KEYNOTE-590 trial.38 The KEYNOTE-062 trial failed to demonstrate superiority of pembrolizumab plus chemotherapy versus chemotherapy alone but was able to demonstrate that pembrolizumab monotherapy was noninferior to chemotherapy; the ITC authors stated that pembrolizumab had not been granted regulatory approval for the first-line treatment of GC. The KEYNOTE-590 trial demonstrated improvement among patients treated with pembrolizumab plus chemotherapy compared to chemotherapy alone among first-line patients with EC (esophageal squamous cell carcinoma, EAC, and a subset of GEJC), and was approved by the US FDA in March 2021. The rationale for not including the KEYNOTE-590 trial in the NMA was that its population differed from that of the CheckMate-649 trial (mostly patients with esophageal squamous cell carcinoma) and that it was published after the systematic literature review.
Construction of Networks
Studies identified through the systematic literature search were connected in networks for outcomes of OS and PFS to indirectly compare nivolumab plus chemotherapy to other relevant therapies. Treatments that were not recommended by clinical guidelines but that provided an indirect link (bridging studies) were included in the network diagram.
Assessment of Heterogeneity
The ITC authors created a virtual advisory board consisting of clinical and Health Technology Assessment (HTA) experts who were consulted to validate the initial networks of evidence. Before conducting the heterogeneity assessment, the recommendations of the experts were taken into consideration. Convergence of models was checked through exploratory NMAs.15
Heterogeneity across 51 studies considered for inclusion in the ITC was assessed based on variables that could modify relative treatment effects. The criteria included as part of the assessment of heterogeneity are reported in Table 25; these criteria were determined a priori.
Table 25: Characteristics in the Assessment of Heterogeneity for Studies Included in the Sponsor-Submitted ITC
Population characteristics | Interventions | Comparators | Outcomes | Study design |
|---|---|---|---|---|
Age ECOG PS HER2 status Histology type Metastatic site location Number of metastatic sites Prior chemotherapy Prior surgery Recurrent disease Sex Tumour location | Number of studies per comparison | Number of studies per comparison | Median follow-up | Enrolment/study period Region Study quality Sample size |
ECOG PS = Eastern Cooperative Oncology Group performance status; HER2 = human epidermal growth factor receptor 2; ITC = indirect treatment comparison.
Source: Sponsor-submitted ITC.15
The clinical and HTA experts enrolled on the virtual advisory board were consulted for their opinions on potential treatment-effect modifiers. The experts were asked to rate potential effect modifiers on the likelihood that they had a strong, medium, or weak treatment effect. The experts were also asked to investigate potential treatment-effect modifiers based on subgroup analysis results of the CheckMate-649 trial. The experts identified the following variables as strong potential treatment-effect modifiers: ECOG PS, enrolment/study period, and location of metastases.
Heterogeneity across the trials was assessed by the ITC authors visually using histograms. Histograms that showed large variations (no further definition provided) were considered to show major heterogeneity, while histograms that showed a few outlying studies were taken to indicate moderate heterogeneity. Where there was large heterogeneity among studies in the network, the ITC authors conducted scenario analyses to removing studies that contributed to that heterogeneity, or they conducted meta-regression to adjust for imbalances between the potential effect modifiers.
Construction of Drug Class–Based Networks
The networks proposed for the ITC using each treatment as separate nodes were stated to be complex, including more than 75 studies and more than 50 different treatment comparisons. The network diagrams consisted of many loops, and the exploratory NMA was stated to show difficulty converging. Consultation with experts from the virtual advisory board suggested that a drug class–based network would better suit the NMA than using separate nodes for each separate treatment; due to the high heterogeneity across the studies, there were convergence issues when using specific treatments as nodes. The use of a drug class–based network assumes that treatments in the class are equivalent; consultation with the experts from the virtual advisory board confirmed that treatments in the same drug class could be considered comparable, except for cisplatin and oxaliplatin; a meta-analysis published by Wagner et al. in 201739 was used to substantiate this. The meta-analysis assessed the efficacy of chemotherapy compared to best supportive care among patients with advanced GC and revealed that oxaliplatin-containing regimens may result in improved OS compared to the same regimen containing cisplatin. The drug class–based network was considered less complex than the treatment-specific network diagram and included drug classes recommended by clinical guidelines. Therefore, drugs were categorized according to class as follows:
Fluoropyrimidine: 5-fluorouracil, capecitabine, S-1
Platinum: cisplatin, oxaliplatin
Taxane: docetaxel, paclitaxel
Anthracycline: doxorubicin, epirubicin
Topoisomerase inhibitor: etoposide, irinotecan
Immunotherapy: nivolumab
The drug class–based network was split, as some drug classes were split by leucovorin. For example, the fluoropyrimidine class included 5-fluorouracil, while the fluoropyrimidine plus leucovorin class included 5-fluorouracil plus leucovorin. However, the ITC authors stated that this approach would require separate HRs per backbone treatment in the CheckMate-649 trial. Patients in the CheckMate 649 trial received either FOLFOX or XELOX backbones, and FOLFOX includes leucovorin, whereas XELOX does not. The CheckMate 649 trial was not powered for comparisons between chemotherapy backbones. In addition, the experts on the virtual advisory board confirmed that FOLFOX and XELOX were generally considered equivalent. Therefore, chemotherapy regimens with or without leucovorin were pooled into the same drug class for the final network; for example, 5-fluorouracil and 5-fluorouracil plus leucovorin belonging to the class fluoropyrimidine.
The ITC authors noted that the inclusion of bridging studies in the network diagram used for the heterogeneity assessment resulted in nodes that consisted of treatments that were both recommended and non-recommended by clinical guidelines. It was assumed that recommended and non-recommended treatments had similar efficacy, on the basis that they were in the same drug class.
ITC Analysis Methods
Details of the methods used for the sponsor-submitted ITC are provided in Table 26.
The ITC assessed the efficacy of treatments among the all-comers population, which was defined by the ITC authors as all patients studied in the selected trials, regardless of their PD-L1 status or other characteristics.
The ITC authors noted the ATTRACTION-4 trial, which compared nivolumab plus SOX to nivolumab plus XELOX (phase II) and nivolumab plus investigator’s choice of SOX or XELOX versus SOX or XELOX (phase III); under the node classification of the ITC, these treatments fall under the classifications for immune-oncology therapy plus fluoropyrimidine and platinum therapy and fluoropyrimidine plus platinum therapy. These treatments were noted to be the same drug classes as those used in the CheckMate-649 trial, which compared nivolumab plus fluoropyrimidine and oxaliplatin to fluoropyrimidine plus oxaliplatin. However, the ITC authors stated that the results of the ATTRACTION-4 study were confounded by the presence of a large proportion of patients who received immune-oncology therapies in later lines of treatment; this was due to nivolumab monotherapy being approved for use in the third line for GCs in Japan, such patients accounted for more than half of patients in this trial. The ATTRACTION-4 study was excluded from both the base case OS and PFS analyses of the ITC.
Table 26: ITC Analysis Methods
Analysis | Description |
|---|---|
ITC methods | A Bayesian framework was conducted, run with 3 chains with initial values defined as 0, –1, or 1 for all treatments. A total number of 100,000 iterations were conducted with a burn-in of 50,000 iterations, and thinning set at 1. Treatment effects were assessed using log HRs; a normal distribution with a mean 0 and precision of 0.0001 was used. Both fixed- and random-effects models were used. Three simulation chains with 100,000 iterations, a burn-in of 50,000, and no thinning were used in the Monte Carlo simulations. |
Priors | A non-informative prior was used, in line with recommendations by Dias et al. (2014).40 For meta-regressions, a prior distribution of the treatment effects is a normal distribution with mean zero and variance of 0.0001. |
Assessment of model fit | As both fixed- and random-effects were used, models were compared using the DIC as the model selection criterion. Additional criteria, including the DBar and pD, were also reported for assessment of goodness of fit and overfitting, respectively. As DIC is a sum of both the DBar and pD, the model with the lowest DIC was considered to have been an optimal measure of goodness of fit and overfitting. |
Assessment of consistency | Consistency between the indirect and direct evidence was assessed by comparing residuals from the unrelated mean (relative) effects’ model with the standard NMA. If there was evidence of consistency found in the main analysis of the NMA, the consistency assumption was investigated in some of the scenario analyses. The heterogeneity between studies and its influence on the consistency within the network was also examined. |
Assessment of convergence | In the Monte Carlo simulations, convergence was assessed using Gelman-Rubin statistics, the size of the Monte Carlo error, auto-correlation function, trace plots, and Kernel density plots. When there was non-convergence, attempts were made to increase the number of iterations to calculate the random-effects model. |
Outcomes | OS PFS |
Sensitivity analyses | Scenario analyses were conducted based on the heterogeneity observed across trials included in the networks. Analyses which were conducted using meta-regressions were fitted with a single common interaction term to adjust for effect modifiers. Continuous variables were centred to improve the mixing of the MCMC chains. Both fixed and random-effects models were conducted for the meta-regressions. Models were run with 3 chains. A total number of 100,000 iterations with a burn-in of 50,000, and thinning set at 1 were conducted. |
Subgroup analysis | PD-L1 CPS (≥ 1, ≥ 5, ≥ 10) |
Methods for pairwise meta-analysis | Pairwise comparisons for random-effects models were represented using HRs with associated 95% CrIs. |
CPS = combined positive score; CrI = credible interval; DBar = posterior mean of the deviance; DIC = deviance information criterion; HR = hazard ratio; ITC = indirect treatment comparison; MCMC = Markov chain Monte Carlo; NMA = network meta-analysis; OS = overall survival; pD = effective number of parameters; PD-L1 = programmed death ligand 1; PFS = progression-free survival.
Source: Sponsor-submitted ITC.15
End Points
End points assessed in the sponsor-submitted ITC included OS and PFS. According to the ITC authors, in all studies, OS was defined as the time from randomization until death from any cause, and PFS was defined as the time from randomization until disease progression or death. According to the ITC authors, censoring for these end points occurred when patients were lost to follow-up or at the end of the observation period.
HRs and CIs from published trials were used to inform the comparisons in the ITC. For studies that did not report HRs and CIs, individual patient-level data were simulated from KM curves using methods proposed by Guyot et al. (2012)41 and Cox models were applied to estimate HRs and corresponding 95% CIs.
For studies that compared treatments belonging to 2 different drug classes, HRs were pooled to create a relative efficacy outcome comparing 2 drug classes. For example, if drug A and B were of the same class and drug C was of another class, then comparisons of A versus C and B versus C were pooled.
Subgroup Analyses
Subgroup analyses were conducted by PD-L1 status. The networks for subgroup analyses remained the same as for the main analyses. The majority of publications did not report the PD-L1 status of patients, and the only HRs for subgroups according to PD-L1 status used were those reported in the CheckMate-649 trial. The HRs from the CheckMate-649 trial based on PD-L1 status are reported in Table 27.
Table 27: Adjusted HRs for OS and PFS in the CheckMate-649 Trial Used in Subgroup Analyses in the Sponsor-Submitted ITC
Population | PFS HR (95% CI) | OS HR (95% CI) |
|---|---|---|
All-comers | 0.77 (0.68 to 0.87) | 0.80 (0.71 to 0.90) |
PD-L1 CPS ≥ 1 | 0.74 (0.65 to 0.85) | 0.77 (0.68 to 0.88) |
PD-L1 CPS ≥ 5 | 0.68 (0.58 to 0.79) | 0.71 (0.61 to 0.83) |
PD-L1 CPS ≥ 10 | 0.63 (0.53 to 0.75) | 0.66 (0.55 to 0.78) |
CI = confidence interval; CPS = combined positive score; HR = hazard ratio; ITC = indirect treatment comparison; OS = overall survival; PD-L1 = programmed death ligand 1; PFS = progression-free survival.
Source: Sponsor-submitted ITC.15
Scenario Analyses
Based on the heterogeneity assessment, the following scenario analyses were conducted:
Studies that displayed KM curves that presumably used a smoothing function were excluded, as it was uncertain whether the survival curves were based on the KM method.
Studies with low quality (scores < 3), as assessed by the ITC authors, were excluded.
A meta-regression based on inclusion of patients with ECOG PS 2 as a binary covariate was conducted.
A meta-regression using enrolment period as a continuous variable was conducted.
A meta-regression using age as a continuous variable was conducted.
An analysis was conducted that differentiated between platinum chemotherapies (cisplatin- and oxaliplatin-based regimens).
Publications that included therapies that are not recommended but bridge relevant drug classes were included. The ITC authors noted that this did not result in adding extra recommended treatment regimens.
The ATTRACTION-4 study16 was included in the all-comers analysis.
The ITC authors noted that some of the scenario analyses, in particular for scenarios 6 and 7, resulted in structural changes to the network diagrams. Scenario 6 resulted in a change to the definition of nodes and, thus, structural changes to the network of evidence. Scenario 7 resulted in inclusion of additional studies that gave indirect evidence to the network. Except for scenario 7, all scenarios were conducted using the same set of studies.
It was not clear how missing covariate information was handled in the meta-regressions.
Assessment of the Proportional Hazards Assumption
The proportional hazards (PH) assumption was not assessed in the sponsor-submitted ITC. The ITC authors stated that this decision was due to the large amounts of heterogeneity and inconsistency observed and that the PH assumption was also likely to be violated due to statistical chance because of the large number of studies included.
Results of the Sponsor-Submitted ITC
Results of Systematic Search
The initial literature search identified a total of 5,800 studies after deduplication. After title and abstract screening, 4,833 studies were excluded, leaving a total of 967 publications to assess for eligibility. Of those assessed, 543 were excluded due to incorrect population (n = 209), intervention (n = 56), comparator (n = 3), outcomes (n = 42), and study design (n = 233), leaving a total of 424 publications. An additional 4 citations were identified, leaving 484 publications for extraction; of these, 177 records were RCTs and 251 were non-randomized trials. The literature search was updated as of August 2019 and yielded a total of 3,433 records after deduplication. Of these, 3,308 studies were excluded after title and abstract screening, leaving 127 articles to be assessed for eligibility. Of the 127 articles assessed for eligibility, 62 were excluded due to wrong population (n = 24), intervention (n = 3), outcomes (n = 4), study design (n = 8), duplicate study (n = 22), and unretrievable study (n = 1). In total, 65 publications were included from the updated literature search, of which 32 were RCTs and 33 were non-randomized trials.12 Therefore, 209 articles were considered for inclusion in the ITC based on the literature search, with an additional 2 studies identified through a qualitative search (n = 211 articles). A flow chart illustrating the inclusion of trials from the literature search based on the 211 articles assessed for eligibility into the ITC is shown in Figure 12.
Figure 12: Flow Chart of Trials Included in the ITC
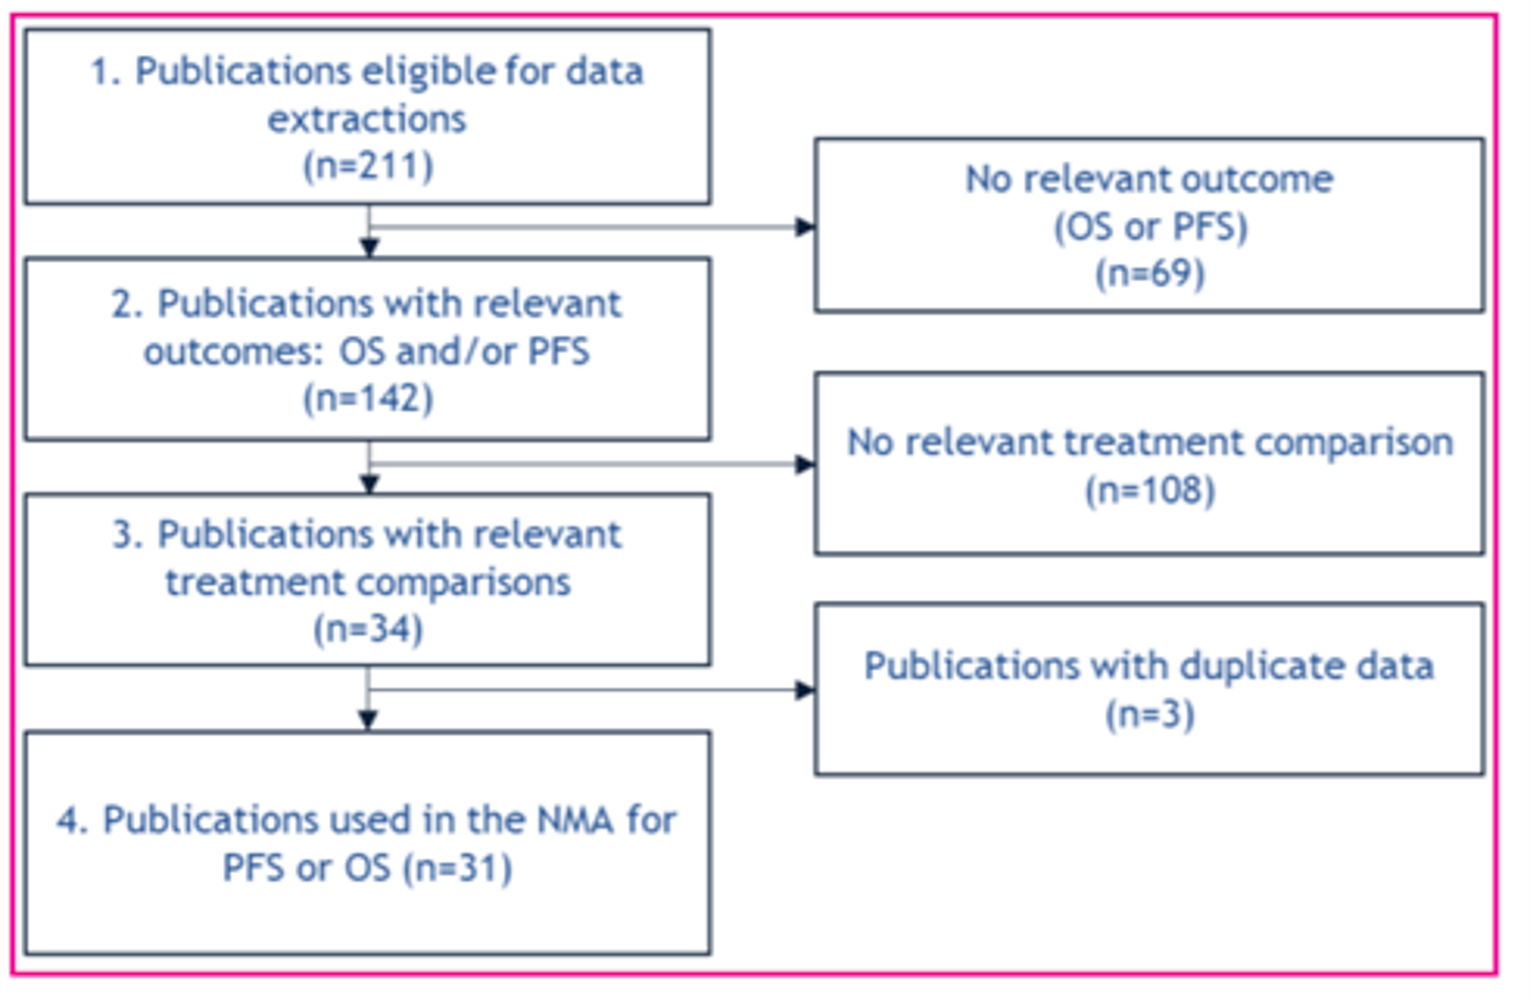
ITC = indirect treatment comparison; NMA = network meta-analysis; OS = overall survival; PFS = progression-free survival.
Source: Sponsor-submitted ITC.15
In total, 31 studies were considered for inclusion for the analyses of OS and PFS in the sponsor’s NMA; of these studies, 23 were used in the network for PFS and 28 were used in the network for OS. The ATTRACTION-4 study16 was not included in either the network for PFS or OS; this study was included only in scenario analyses.
Heterogeneity Assessment and Construction of Networks
Across the trials included in the sponsor-submitted ITC, the following variables were stated to show major heterogeneity: histology type, number of metastatic sites, prior surgery, previous chemotherapy, region, enrolment period, total study sample size, and study quality. Moderate heterogeneity was stated to have been observed for age, sex, ECOG PS, tumour location, metastatic site location, and median follow-up. The ITC authors stated that there was insufficient information available for recurrent disease status and HER2-positive status.
Due to the large amount of heterogeneity across trials, multiple scenario analyses were conducted to investigate the effect of heterogeneity for study-level characteristics.
Age, which was considered to be a medium treatment-effect modifier, was found to have moderate heterogeneity. A meta-regression using age as a covariate was conducted to adjust for this variable.
ECOG PS was considered a strong treatment-effect modifier and showed major heterogeneity between studies. A meta-regression was conducted to adjust for ECOG PS. The meta-regression was conducted considering ECOG PS as a binary variable to investigate the effect of studies that included patients with an ECOG PS of 2 versus studies that did not.
Enrolment period was considered a strong treatment-effect modifier and showed major heterogeneity. Since this was a continuous variable, and since a threshold to identify outlying studies would have been chosen arbitrarily, a meta-regression using start year of enrolment period as a continuous variable was used to adjust for enrolment period.
The ITC authors determined that study quality showed major heterogeneity across all studies. To adjust for study quality, the authors dropped studies with a study quality score less than 3 in a scenario analysis.
Other variables, including histology type, number of metastatic sites, recurrent disease, prior surgery, previous chemotherapy, HER2-positive status, region, and median follow-up, were reported by a low number of publications. Due to the lack of data, the ITC authors stated that it was difficult to adjust for the heterogeneity observed for these variables. In addition, metastatic site location was considered to be a potential treatment-effect modifier, with considerable variability reported within the reported locations. The ITC authors noted that patients can have metastases in multiple locations. Due to the difficulty of adequately capturing this variable, no investigations were performed based on metastatic site location.
The network diagrams for OS and PFS are provided in Figure 13 and Figure 14.
Figure 13: Network Diagram for OS
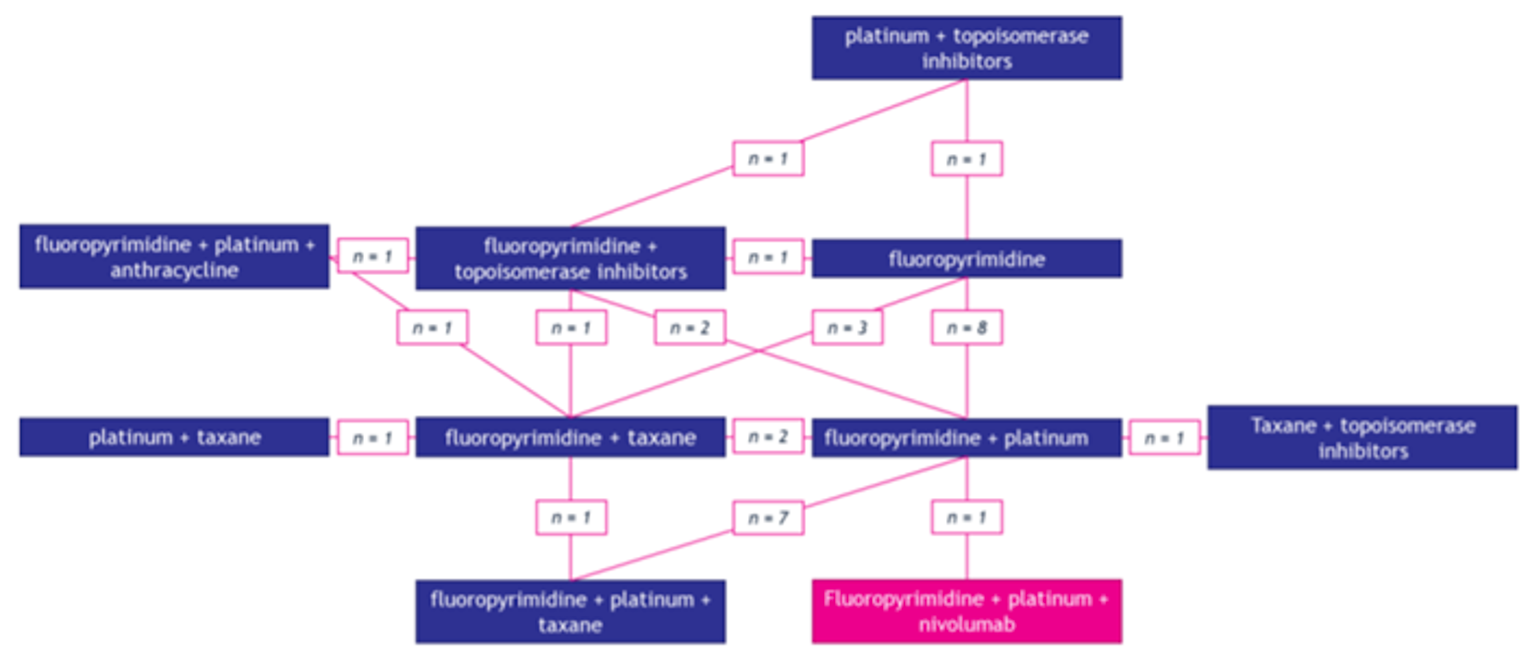
OS = overall survival.
Note: The number of trials per treatment comparison is indicated by n; it does not sum to 28 since the network includes a 3-group study.
Source: Sponsor-submitted ITC.15
Figure 14: Network Diagram for PFS
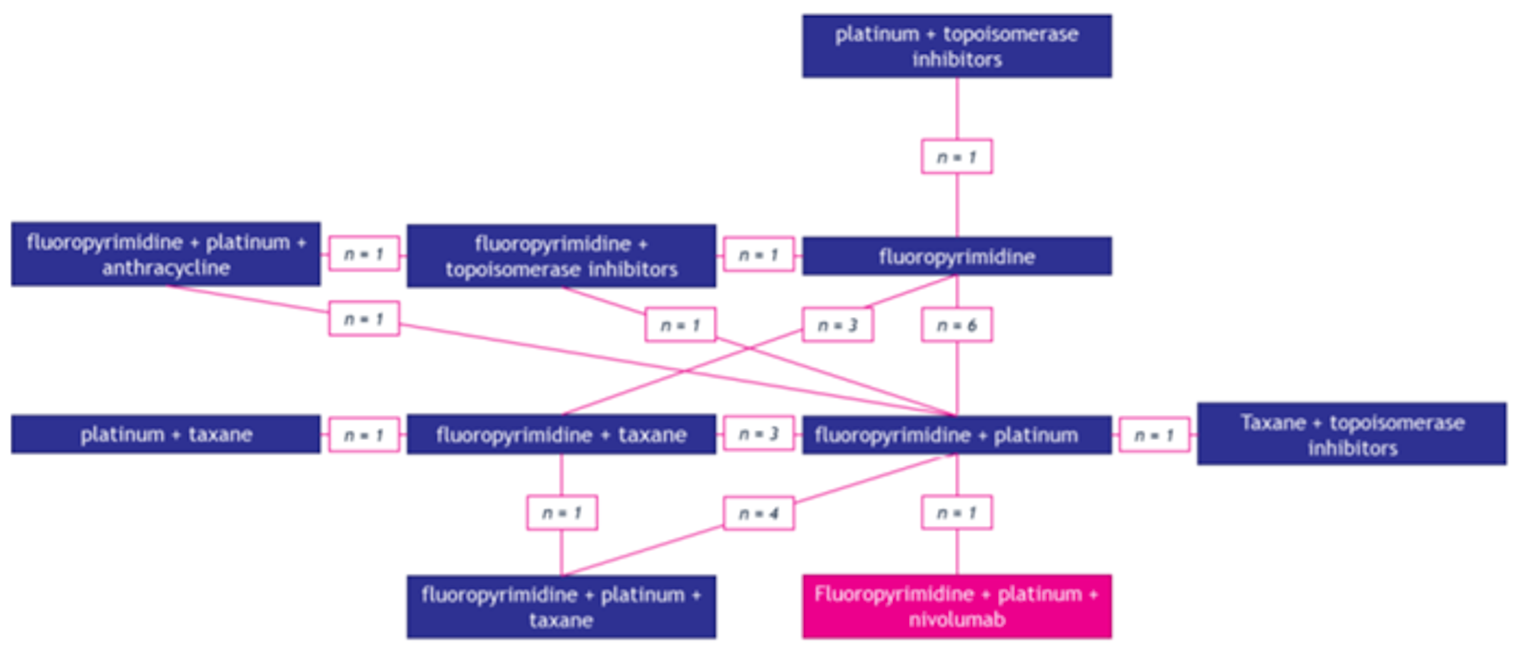
PFS = progression-free survival.
Note: The number of trials per treatment comparison is indicated by n; it does not sum to 23 since the network includes a 3-group study.
Source: Sponsor-submitted ITC.15
Risk of Bias
A quality assessment of trials included in the ITC was undertaken using the checklist for clinical trials and observational studies from Guidance for Undertaking Reviews in Health Care (2009) from the Centre for Reviews and Dissemination. A series of 7 questions was used to determine study quality, in which 1 point was awarded for each positive answer to each of the questions. A maximum score of 7 could be given to each study. A score of zero was given to conference abstracts due to the limited information they could provide; conversely, most full-text publications were given a score of 3. The CheckMate 649 trial was given a score of 5. Study quality for studies ranged between scores of 0 and 5.
Results
The sponsor-submitted ITC compared nivolumab plus fluoropyrimidine and platinum to the following treatments: fluoropyrimidine plus platinum, fluoropyrimidine, fluoropyrimidine plus topoisomerase, taxane plus topoisomerase, platinum plus taxane, fluoropyrimidine plus taxane, platinum plus topoisomerase, fluoropyrimidine plus platinum and anthracycline, and fluoropyrimidine plus platinum and taxane. However, only the following treatments were considered relevant comparators for the purposes of this review (in accordance with the CADTH systematic review protocol): fluoropyrimidine plus platinum, fluoropyrimidine plus topoisomerase, and fluoropyrimidine plus platinum and anthracycline. Results reported for OS and PFS will focus only on these relevant comparators.
Overall Survival
Based on a lower deviance information criterion (DIC) value, the random-effects model was considered to provide a better fit for the analysis of OS than the fixed-effects model. The ITC authors noted that tau, representing the variance of the random effect in the model, did not converge properly, which resulted in greater uncertainty. However, the random-effects model had a better fit compared to the fixed-effects model and a lower DIC. Therefore, the random-effects model was used. An assessment of consistency revealed that most studies demonstrated acceptable consistency, except for Tebbut et al. (2010),42 which was a non-comparative phase II trial in which patients received fluoropyrimidine plus platinum plus taxane or fluoropyrimidine plus taxane (docetaxel plus cisplatin and 5-fluorouracil or docetaxel plus capecitabine). This study favoured treatment with fluoropyrimidine plus platinum and was used to inform indirect comparisons between fluoropyrimidine plus platinum plus taxane and fluoropyrimidine plus platinum (fluoropyrimidine plus platinum being the reference treatment in the sponsor-submitted NMA). The direct and indirect results of this comparison were not in alignment; however, as this comparison was not of interest, these results are not discussed here and do not affect the comparisons of interest reported in this section. The study by Tebbut et al. (2010) was included, as the treatment comparisons helped to form loops with other regimens included in the network.
Based on the NMA for the all-comers population, treatment with nivolumab plus fluoropyrimidine and platinum showed no difference in OS compared to fluoropyrimidine plus platinum (HR 0.81; 95% credible interval [CrI], 0.54 to 1.18).
Pairwise comparisons showed that treatment with nivolumab plus fluoropyrimidine and platinum showed no differences in OS compared to fluoropyrimidine plus platinum (HR 0.78; 95% CrI, 0.54 to 1.18), fluoropyrimidine plus topoisomerase inhibitor (HR 0.90; 95% CrI, 0.55 to 1.42), or fluoropyrimidine plus platinum and anthracycline (HR 0.94; 95% CrI, 0.52 to 1.59).
Progression-Free Survival
Based on a lower DIC value, the random-effects model was considered to provide a better fit for the analysis of PFS than the fixed-effects model. The ITC authors noted that the tau value, an indicator of variance of the random effect in the random-effects model, did not converge properly, which introduced uncertainty in the estimates of the model. An assessment of consistency revealed that most studies demonstrated acceptable consistency, except for a study by Matsuyama et al. (2018),43 which compared fluoropyrimidine plus taxane versus fluoropyrimidine plus platinum (or cisplatin plus S-1 versus docetaxel plus S-1). The ITC authors noted that the study by Matsuyama et al. (2018) had a study quality rated as 0 because data were available only from a conference abstract and the sample size was small (N = 61). In addition, the comparison of fluoropyrimidine plus taxane versus fluoropyrimidine plus platinum was informed by 3 studies, including Matsuyama et al. (2018),43 Lu et al. (2018),44 and Mochiki et al. (2012)45; differences in PFS for these comparisons in all studies were not statistically significant, but it was acknowledged that the point estimate reported in Matsuyama et al. (2018) was lower than the estimates reported in the other 2 trials.
Based on the NMA for the all-comers population, treatment with nivolumab plus fluoropyrimidine and platinum (HR 0.78; 95% CrI, 0.56 to 1.05) showed no differences in PFS compared to fluoropyrimidine plus platinum.
Based on pairwise comparisons, treatment with nivolumab plus fluoropyrimidine and platinum showed no differences in PFS compared to fluoropyrimidine plus platinum (HR 0.76; 0.55 to 1.05), fluoropyrimidine plus topoisomerase inhibitor (HR 0.89; 95% CrI, 0.53 to 1.40), or fluoropyrimidine plus platinum and anthracycline (HR 0.88; 95% CrI, 1.19 to 2.72).
Subgroup Analysis
Subgroup analyses were conducted for OS and PFS among the following PD-L1 subgroups: CPS of 1 or higher, CPS 5 or higher, and CPS 10 or higher. Subgroup analyses were conducted using random-effects models.
Regarding PFS, nivolumab plus chemotherapy was favoured over chemotherapy in PD-L1 subgroups with CPS scores of 5 or higher (HR 0.68; 95% CrI, 0.49 to 0.94) and 10 or higher (HR 0.64; 95% CrI, 0.45 to 0.88). There were no differences in PFS between nivolumab plus chemotherapy and chemotherapy among the subgroup of PD-L1 CPS score of 1 or higher (HR 0.75; 95% CrI, 0.54 to 1.03).
Regarding OS, nivolumab plus chemotherapy was favoured over chemotherapy in the PD-L1 subgroup with CPS score of 10 or higher (HR 0.67; 95% CrI, 0.43 to 0.99). There were no differences in OS between nivolumab plus chemotherapy and chemotherapy among the subgroups of PD-L1 CPS score of 1 or higher (HR 0.79; 95% CrI, 0.52 to 1.15) or 5 or higher (HR 0.73; 95% CrI, 0.48 to 1.07).
Scenario Analyses
A summary of all scenario analyses for PFS is reported in Table 28; all scenario analyses comparing nivolumab plus fluoropyrimidine and platinum with fluoropyrimidine plus platinum were conducted using random-effects models, except for scenarios 2 and 5, which were conducted using fixed-effects models. Only scenario 7 included additional studies that were not included in the primary analyses of the NMA. In all scenario analyses, the point estimates were not greatly affected compared to the base case. In addition, there were no treatment differences detected between nivolumab plus fluoropyrimidine and platinum and fluoropyrimidine plus platinum, except for scenarios 2, 5, and 8, in which nivolumab plus fluoropyrimidine and platinum was favoured, with the 95% CrI excluding 1. Scenario 8 included additional information from the ATTRACTION-4 trial. The phase II part of this trial compared nivolumab plus SOX to nivolumab plus XELOX, and the phase III part compared nivolumab plus investigator’s choice of SOX or XELOX versus SOX or XELOX.
Comparisons of nivolumab plus fluoropyrimidine and platinum versus fluoropyrimidine plus topoisomerase inhibitor and versus fluoropyrimidine plus platinum and anthracycline for each scenario for PFS were consistent with those of the primary analysis.
Table 28: Overview of Scenario Analysis Results for PFS
Scenario analysis | Description | Model type | Treatments included | Studies included | PFS for nivo + fluoro + plat vs. fluoro + plat, HR (95% CrI) | Betaa (95% CrI) |
|---|---|---|---|---|---|---|
0 | Base case | RE | 10 | 23 | 0.78 (0.56 to 1.05) | NA |
1 | Excluding studies with KM smoothing | RE | 10 | 22 | 0.78 (0.54 to 1.09) | NA |
2 | Excluding low-quality studies | FE | 7 | 14 | 0.77 (0.68 to 0.87) | NA |
3 | Meta-regression adjusting for inclusion of ECOG PS 2 | RE | 10 | 22 | 0.82 (0.54 to 1.22) | 0.06 (–0.24 to 0.40) |
4 | Meta-regression adjusting for enrolment period | RE | 9 | 19 | 0.79 (0.39 to 1.46) | –0.01 (–0.05 to 0.03) |
5 | Meta-regression adjusting for age | FE | 9 | 20 | 0.80 (0.71 to 0.91) | 0.03 (0.01 to 0.06) |
6 | Split cisplatin and oxaliplatin-based regimens | RE | 12 | 23 | 0.78 (0.53 to 1.12) | NA |
7 | Inclusion of bridging studies | RE | 11 | 27 | 0.78 (0.59 to 1.00) | NA |
8 | Inclusion of ATTRACTION-4 | RE | 10 | 24 | 0.74 (0.59 to 0.91) | NA |
CrI = credible interval; ECOG = Eastern Cooperative Oncology Group; FE = fixed-effects; fluoro = fluoropyrimidine; HR = hazard ratio; KM = Kaplan-Meier; NA = not applicable; nivo = nivolumab; PFS = progression-free survival; plat = platinum; PS = performance status; RE = random-effects.
aThe estimated beta of the covariate effect in the meta-regression.
Source: Sponsor-submitted ITC.15
A summary of all scenario analyses for OS is reported in Table 29; all scenarios comparing nivolumab plus fluoropyrimidine and platinum with fluoropyrimidine plus platinum analyses were conducted using random-effects models. In all scenarios, the point estimate for comparisons of OS were not greatly changed, and none of the 95% CrIs excluded the value 1.
Comparisons of nivolumab plus fluoropyrimidine and platinum versus fluoropyrimidine plus topoisomerase inhibitor and versus fluoropyrimidine plus platinum and anthracycline for each scenario for OS were consistent with those of the primary analysis.
Table 29: Overview of Scenario Analysis Results for OS
Scenario analysis | Description | Model type | Treatments included | Studies included | OS for nivo + fluoro + plat vs. fluoro + plat, HR (95% CrI) | Betaa (95% CrI) |
|---|---|---|---|---|---|---|
0 | Base case | RE | 10 | 28 | 0.81 (0.54 to 1.18) | NA |
1 | Excluding studies with KM smoothing | RE | 10 | 26 | 0.81 (0.51 to 1.23) | NA |
2 | Excluding low-quality studies | RE | 8 | 17 | 0.82 (0.50 to 1.27) | NA |
3 | Meta-regression adjusting for inclusion of ECOG PS 2 | RE | 10 | 26 | 0.74 (0.48 to 1.12) | –0.15 (–0.43 to 0.14) |
4 | Meta-regression adjusting for enrolment period | RE | 9 | 22 | 0.83 (0.4 to −1.34) | 0.00 (–0.03 to 0.02) |
5 | Meta-regression adjusting for age | RE | 9 | 25 | 0.82 (0.52 to 1.23) | 0.00 (–0.03 to 0.03) |
6 | Split cisplatin and oxaliplatin-based regimens | RE | 12 | 28 | 0.77 (0.49 to 1.15) | NA |
7 | Inclusion of bridging studies | RE | 16 | 51 | 0.81 (0.56 to 1.14) | NA |
8 | Inclusion of ATTRACTION-4 | RE | 10 | 29 | 0.85 (0.65 to 1.10) | NA |
CrI = credible interval; ECOG = Eastern Cooperative Oncology Group; FE = fixed-effects; fluoro = fluoropyrimidine; HR = hazard ratio; NA = not applicable; nivo = nivolumab; OS = overall survival; plat = platinum; PS = performance status; RE = random-effects.
aThe estimated beta of the covariate effect in the meta-regression.
Source: Sponsor-submitted ITC.15
Critical Appraisal of the Sponsor-Submitted ITC
The sponsor-submitted NMA included trials retrieved from a systematic literature review. The systematic literature was initially conducted in spring of 2018 and updated as of August 2019. It was noted that the CheckMate-649 trial was not published at the time of the systematic literature review. As the literature search was not updated to the current date of this CADTH review, it is possible that important literature may have been missed. However, the ITC authors noted that additional studies were added for inclusion in the ITC through a qualitative search, which may have captured additional trials informing the overall networks. The KEYNOTE-590 trial of pembrolizumab plus chemotherapy was excluded from the NMA, partly because it was published after the date of the literature search, as well as because most patients in that trial did not fit the relevant population for the ITC. However, it was not clear whether there were relevant subgroup analyses from that trial that could have been included in the NMA.
The ATTRACTION-4 trial (phase II: nivolumab plus SOX versus nivolumab plus XELOX; phase III, nivolumab plus investigator’s choice of SOX or XELOX versus SOX or XELOX) was excluded from the sponsor-submitted ITC, because of the expected confounding from patients receiving immune-oncology therapies in later lines of treatment. Exclusion of this trial was considered acceptable, as 1 of the chemotherapy regimens used in the ATTRACTION-4 trial (SOX) is not available to patients in Canada. In a scenario analysis that included this trial, the estimate for OS was unchanged, while the estimate for PFS favoured nivolumab plus fluoropyrimidine and platinum over fluoropyrimidine plus platinum, versus the primary analysis, which did not indicate any difference. The sponsor-submitted NMA compared numerous treatments from 31 studies. Major sources of clinical heterogeneity were identified across multiple demographic characteristics, including histology type, number of metastatic sites, and prior surgery. The heterogeneity observed across patients is likely to have introduced bias and affected the overall comparability across trials and treatments. Due to the heterogeneity, multiple scenario analyses were conducted to explore the effects of identified sources. In general, estimates for comparisons between nivolumab plus fluoropyrimidine and platinum and fluoropyrimidine plus platinum in the networks for PFS and OS were mostly unchanged in the scenario analyses. The point estimates remained similar to the primary analysis, and credible intervals for the HRs continued to exclude 1. There were a few instances in which scenario analyses affected the point estimates, including scenarios that adjusted for inclusion of patients with ECOG PS of 2. It is likely that the heterogeneity observed across patients introduced bias, which may or may not have been accounted for through the scenario analyses conducted by the ITC authors. Scenario analyses to explore heterogeneity across several other important patient characteristics, such as histology type, HER2-positive status, and metastatic site location, were not conducted due to limited data reported across trials.
Heterogeneity was also observed across trial characteristics, including enrolment period, sample size, quality of studies, and study design. The ITC authors conducted scenario analyses to adjust for some of these trial characteristics, including exclusion of studies with KM smoothing, exclusion of low-quality studies, adjustment for enrolment period, and inclusion of bridging studies. However, exclusion of low-quality studies did result in a narrower credible interval for PFS. It was also noted that the sample sizes of the studies included in the sponsor-submitted ITC varied greatly, ranging from less than 100 to more than 1,000. Trials with smaller sample sizes may introduce greater uncertainty in the overall NMA estimates, as they may affect the overall precision of pooled estimates.
A risk of bias assessment using the checklist for clinical trials and observational studies from Guidance for Undertaking Reviews in Health Care (2009) from the Centre for Reviews and Dissemination was undertaken for studies included in the ITC. In general, studies were reported to have low- to mid-levels of bias. It is unclear which aspects of study design were rated as poor or excellent across trials, as the ITC authors did not report this information. It is possible that study quality introduced bias into the sponsor-submitted NMA. The extent of this impact is not certain; however, scenario analyses conducted by the ITC authors that excluded studies of low quality confirmed that study quality did affect the precision of treatment-effect estimates.
With more than 75 studies and approximately 50 individual treatments, the initial networks were determined to be too complex for NMA, with poor convergence in exploratory analyses. To reduce the complexity, the ITC authors created a network of comparisons among drug classes. Treatments were compared based on the following classes: fluoropyrimidines, platinum drugs, taxanes, anthracyclines, topoisomerase inhibitors, and immunotherapies. The ITC authors validated the use of these drug classes using a virtual advisory board consisting of clinical and HTA experts. The use of comparisons between drug classes was based on the assumption that treatments within a class were equivalent in terms of efficacy; the virtual advisory board consulting with the ITC authors confirmed that the treatments within a drug class could be considered comparable, except for cisplatin and oxaliplatin. The clinical experts consulting with CADTH for this review also confirmed that the classification of these drug classes was appropriate. The clinical experts also agreed that platinum chemotherapies cisplatin and oxaliplatin may not be considered equivalent; oxaliplatin was stated to be the preferred regimen, as it is better tolerated than cisplatin, which leads to improved target dose administration and, ultimately, a better response. The ITC authors conducted a scenario analysis for both OS and PFS that split cisplatin and oxaliplatin from the same treatment node. For analysis of either OS and PFS, the comparisons between nivolumab plus chemotherapy and chemotherapy in the NMA were not greatly changed. It was noted that, in the CheckMate-649 trial, patients could have received either FOLFOX or XELOX. In the drug class–based network used in the ITC, both FOLFOX and XELOX were considered to be the same drug class. The clinical experts consulted by CADTH for this review confirmed that both FOLFOX and XELOX are considered equivalent in terms of efficacy. However, in some cases, FOLFOX may be preferred because there are no swallowing issues. While there may be nuances between treatments in terms of efficacy and safety, which are not captured in the NMA due to this classification of treatments, the reduced complexity of this network was considered appropriate by the CADTH review team.
The CADTH health economic reviewers noted that the sponsor’s submitted pharmacoeconomic model considered irinotecan plus 5-fluorouracil and leucovorin (FOLFIRI, which was included in the drug class of fluoropyrimidine plus topoisomerase inhibitor) to have greater efficacy than the other chemotherapy regimens of interest to this review, including fluoropyrimidine plus platinum and fluoropyrimidine plus platinum and anthracycline. However, there was no evidence in the ITC for any differences in OS or PFS between fluoropyrimidine plus platinum, fluoropyrimidine plus topoisomerase inhibitor, and fluoropyrimidine plus platinum and anthracycline, as the relevant 95% CrIs did not exclude 1.
Of the comparators included in the ITC, many were considered to be outdated by the clinical experts consulted by CADTH for this review. The clinical experts confirmed that cisplatin-containing regimens are generally not used in clinical practice. Typically, patients may receive FOLFOX or XELOX, depending on patient and clinician preference. The comparators considered to be most important in the ITC included fluoropyrimidine plus platinum, fluoropyrimidine plus topoisomerase inhibitors, and fluoropyrimidine plus platinum and anthracycline. It was noted that pembrolizumab was not included in the ITC. While pembrolizumab is not currently funded for this indication, it is a clinically relevant comparator, as the clinical experts confirmed that current access programs offer pembrolizumab plus chemotherapy to patients. It is not possible to know the comparative efficacy between nivolumab plus chemotherapy and pembrolizumab plus chemotherapy, as the ITC did not include this, and no direct evidence exists to inform this comparison.
The ITC authors used random-effects models in their ITC. Both random- and fixed-effects models were conducted and, based on lower DIC values and improved model fit, random-effects models with non-informative prior distributions were used. Random-effects models are usually preferred when numerous studies are included in an NMA, as they may better accommodate the heterogeneity across trials. Therefore, the choice of random-effects models was considered appropriate by the CADTH team. Results for pairwise comparisons were presented separately from the NMA results, and it was unclear what method was used for the pairwise comparisons, although results were similar between the 2 methods for comparisons with fluoropyrimidine plus platinum. Sensitivity analyses of the effect of prior distributions were not reported. The ITC authors also made an a priori decision not to test for violation of the PH assumption and to conduct the ITC with the assumption that the PH assumption was acceptable. The ITC authors stated that, due to the high number of trials included, it would be likely that the PH assumption would be violated due to chance in the statistical tests. Potential violation of the PH assumption should be considered a limitation of the estimates retrieved from the sponsor-submitted NMA.
Subgroup analyses were conducted for PD-L1 expression. These analyses revealed that nivolumab plus chemotherapy was favoured over chemotherapy in PD-L1 subgroups with CPS scores of 5 or higher and 10 or higher for PFS, and CPS score of 10 or higher for OS. These results are somewhat conflicting from results from the CheckMate-649 trial, which indicated that nivolumab plus chemotherapy was favoured over chemotherapy in all PD-L1 subgroups for both OS and PFS. In addition, randomization in the CheckMate-649 trial was stratified based on tumour PD-L1 expression of 1% or more and less than 1%; therefore, the randomization of PD-L1 was not preserved for subgroups of PD-L1 analyzed in the NMA (CPS ≥ 5 and ≥ 10). Due to methodological challenges associated with the sponsor-submitted NMA (i.e., combining treatments into grouped nodes and variations across patient and trial characteristics), bias may have been introduced into the comparisons, which affects the interpretability of the subgroup analyses. Overall, subgroup analyses should be interpreted with caution.
The ITC included analyses only for OS and PFS, and there were no comparisons between treatments for safety or HRQoL outcomes. Considerations of toxicities and their impacts on patient’s quality of life are important for both patients and clinicians.
Other Relevant Evidence
No other relevant evidence was identified for this review.
Discussion
Summary of Available Evidence
One phase III, randomized, OL multi-centre study (CheckMate-649, N = 1,581),13 as well as 1 sponsor-submitted ITC,15 contributed evidence to this report. The study enrolled patients with previously untreated, advanced or metastatic GAC, GEJAC, or EAC. Patients were randomized 1:1 to receive either nivolumab plus FOLFOX or XELOX or FOLFOX or XELOX alone until progressive disease or unacceptable toxicity. The co-primary outcomes were OS and PFS in patients with PD-L1 CPS of 5 or higher, while hierarchically tested secondary outcomes comprised OS in patients with PD-L1 CPS of 1 or higher and all randomized patients. Other secondary and exploratory outcomes of interest included OS in patients with PD-L1 CPS of 10 or higher, HRQoL, PFS in patients with PD-L1 CPS of 10 or higher, PFS in patients with PD-L1 CPS of 1 or higher, PFS in all randomized patients, ORR, DOR, and TTSD.
According to the clinical experts consulted by CADTH for this review, the baseline characteristics of the CheckMate-649 study population were broadly representative of Canadian patients with GAC, GEJAC, or EAC who would be candidates for nivolumab plus chemotherapy. Most patients were White, most were male, most had stage IV metastatic GAC, and most had PD-L1 CPS of 5 or higher. Patients with HER2-positive disease were excluded from the study. The major limitations of the included study were potential biases inherent to its OL design; uncertain generalizability to some patients who would be included in the Health Canada indication (e.g., those with ECOG PS of 2 or higher, those previously treated in the metastatic setting); overpowering for efficacy, leading to higher chances of detecting smaller magnitudes of treatment effects of questionable clinical meaningfulness; and inability to draw firm conclusions regarding efficacy in patients below any of the tumour PD-L1 expression or PD-L1 CPS cut-offs. In addition, changes in HRQoL could not be interpreted, as these outcomes were assessed in exploratory fashion (outside the statistical hierarchy with no formal testing), were patient-reported in an OL trial and hence subject to bias and were affected by high rates of missing data.
No evidence was available comparing the combination of nivolumab plus fluoropyrimidine- and platinum-based chemotherapy versus pembrolizumab plus fluoropyridine- and platinum-based chemotherapy for first-line treatment of patients with advanced or metastatic GAC, GEJAC, or EAC.
Interpretation of Results
Efficacy
Administration of nivolumab plus chemotherapy in the CheckMate-649 study13 resulted in statistically significant prolongation of OS compared with chemotherapy alone in patients with PD-L1 CPS of 5 or higher (median OS of 14.39 months versus 11.10 months), PD-L1 CPS of 1 or higher (median OS of 13.96 months versus 11.33 months), and all randomized patients (median OS of 13.83 months versus 11.56 months). Although it was not part of the statistical hierarchy, median OS in patients with PD-L1 CPS of 10 or higher was 15.01 months in the nivolumab plus chemotherapy arm versus 10.87 months in the chemotherapy arm. The co-primary and hierarchically tested secondary OS analyses were both statistically significant and clinically relevant, according to the clinical experts consulted by CADTH for this review. In their judgment, based on the totality of evidence, a 6-week improvement in survival represents a clinically meaningful improvement in this patient population. Administration of nivolumab plus chemotherapy also resulted in statistically significant prolongation of PFS compared with chemotherapy alone in patients with PD-L1 CPS of 5 or higher (median PFS of 7.69 months versus 6.05 months). According to the clinical experts, the magnitude of this change in PFS was of unclear clinical relevance. Differences in PFS in patients with PD-L1 CPS of 1 or higher and all randomized patients, outcomes outside of the statistical hierarchy, were smaller than in patients with PD-L1 CPS of 5 or higher. Input from experts and patients alike indicated that OS is more important to patients than PFS and tumour responses. Differences in ORR numerically favouring nivolumab plus chemotherapy (approximately 11% to 13% and similar across PD-L1 CPS cut-offs) and DOR (approximately 1.5 to 3 months) supported the OS results but were viewed by the experts as not meaningful on their own.
HRQoL analyses were descriptive only, limited by high rates of missing data, and limited by being patient-administered in a study with OL design. Thus, changes in HRQoL in the CheckMate-649 trial could not be interpreted. HRQoL and symptom relief were identified in the patient input as very important to patients with GAC, GEJAC, or EAC.
Analysis of OS and PFS in patients with different PD-L1 CPS cut-offs (≥ 10, ≥ 5, ≥ 1, and all randomized patients), as well as pre-planned subgroup analyses, pointed toward an important role of PD-L1 status in the likelihood of response to nivolumab plus chemotherapy. At the time this report was prepared, the FDA had approved nivolumab plus chemotherapy in all patients, regardless of PD-L1 status,46 while a positive European Medicines Agency Committee for Medicinal Products for Human Use opinion had been issued for treatment of patients with PD-L1 CPS of 5 or higher.47 The HC indication also includes the following statement: “A positive association was observed between PD-L1 CPS score and the magnitude of treatment benefit.” There was some degree of variation between input received from the clinical experts consulted for this review, who noted that patients with PD-L1 CPS less than 1 would be unlikely to respond to therapy, and clinician groups. According to clinicians from the CGOEN, patients with PD-L1 CPS less than 5 would be unlikely to benefit from addition of nivolumab to chemotherapy, while those from the Ontario Health (Cancer Care Ontario) Gastrointestinal Cancer Drug Advisory Committee felt that, although patients with PD-L1 CPS of 5 or higher and 1 or higher are more likely to respond, all patients with GAC, GEJAC, or EAC can benefit from addition of nivolumab to chemotherapy. In the CheckMate-649 trial, approximately 83%, 61%, and 49% of all randomized patients had PD-L1 CPS of 1 or higher, 5 or higher, and 10 or higher, respectively. The trial was not designed to assess comparative efficacy in patients with PD-L1 CPS below any given cut-off, including those with PD-L1 CPS less than 1 whom clinicians considered to be unlikely to benefit. According to the clinical experts consulted by CADTH for this review, it is currently impossible to identify patients who would definitively not derive benefit from nivolumab plus chemotherapy, although low PD-L1 expression probably decreases the chance of response and the degree of benefit. The experts stated that, in this patient population, there is no PD-L1 threshold below which the risks of nivolumab treatment would be too great to justify its administration in the hopes of obtaining clinical benefit, especially given the poor prognosis of GAC, GEJAC, or EAC and the lack of more effective treatment options for these patients at present. Both expert groups were clear that, if the drug were available, they would administer it in a patient with PD-L1 CPS less than 1 who had no contraindications to nivolumab. The clinical experts emphasized that, from a clinical standpoint, there is very little reason to exclude patients with low PD-L1 expression from receiving nivolumab, as there is no strong evidence that they cannot benefit from treatment at all.
One ITC submitted by the sponsor compared nivolumab plus chemotherapy to other treatments. Treatments were compared by drug class rather than specific treatments; nivolumab plus chemotherapy was classified as nivolumab plus fluoropyrimidine and platinum. Pairwise comparisons for OS and PFS did not show a difference between nivolumab plus fluoropyrimidine and platinum and the following treatments of interest: fluoropyrimidine plus platinum, fluoropyrimidine plus topoisomerase inhibitor, and fluoropyrimidine plus platinum and anthracycline.
Pembrolizumab plus chemotherapy was not included as a comparator. While this regimen is currently not funded outside special access programs across Canadian jurisdictions, it is still considered clinically relevant by the clinical experts consulted for this review. Substantial heterogeneity was observed across patient and trial characteristics. While multiple scenario analyses were conducted to explore the impact of certain effect modifiers, others could not be investigated. A risk of bias assessment conducted by the ITC authors revealed that most studies included in the ITC were of low to medium quality, and scenario analyses that excluded low-quality studies produced more precise estimates. The ITC also did not include outcomes other than OS and PFS, such as toxicities or HRQoL, both of which are important to patients. Overall, the ITC had limitations associated with clinical and statistical heterogeneity, which increased the uncertainty of estimates and may have prevented detection of differences between treatments.
Harms
The safety profile of nivolumab plus chemotherapy in the CheckMate-649 trial13 was as expected by the clinical experts consulted for this review, based on prior experience with the drug. AEs following nivolumab plus chemotherapy were not clinically insignificant but were considered by the clinical experts to be manageable with appropriate supportive care. The proportion of all randomized patients discontinuing study treatment due to toxicity was slightly higher in the nivolumab plus chemotherapy arm (7.7%) than in the chemotherapy arm (5.2%). SAEs were more frequent in patients treated with nivolumab plus chemotherapy than in those treated with chemotherapy alone (54.1% versus 43.7%). Although the notable harms of nivolumab are varied and clinically significant, the clinical experts consulted by CADTH for this review emphasized that most oncologists now have extensive experience with immunotherapies, and these events can be managed effectively.
Conclusions
Evidence from the CheckMate-649 study suggested that, compared with FOLFOX or XELOX alone, first-line administration of nivolumab plus FOLFOX or XELOX contributed to statistically significant and clinically meaningful prolongation of OS among patients with HER2-negative GAC, GEJAC, or EAC. This finding was consistent across patients with PD-L1 CPS of 5 or higher, patients with PD-L1 CPS of 1 or higher, and all randomized patients. Administration of nivolumab plus FOLFOX or XELOX also resulted in statistically significant prolongation of PFS among patients with PD-L1 CPS of 5 or higher, although the clinical relevance of the difference in PFS was unclear. Other analyses of PFS, ORR, and DOR across different PD-L1 CPS cut-offs also numerically favoured nivolumab plus chemotherapy and supported the OS results. Results for patient-reported HRQoL and symptom scores (EQ-5D-3L, FACT-Ga) could not be interpreted due to the absence of formal statistical testing, potential for bias in an OL trial, and high rates of missing data at later time points post-baseline. There were signals from the trial that the comparative efficacy of nivolumab plus chemotherapy versus chemotherapy in patients with GAC, GEJAC, or EAC depended on PD-L1 status. Despite this, prolongation of OS by nivolumab plus chemotherapy, which was acknowledged as the most important outcome of therapy by both patients and clinicians, was statistically and clinically significant among all randomized patients. A sponsor-submitted ITC did not provide evidence of differences in efficacy between nivolumab plus fluoropyrimidine- and platinum-based chemotherapy and other chemotherapy regimens and did not include pembrolizumab plus chemotherapy as a comparator. Notable harms associated with nivolumab (including immune-mediated AEs) were appreciable but were expected and generally manageable in most patients with supportive care.
References
1.Hu B, El Hajj N, Sittler S, Lammert N, Barnes R, Meloni-Ehrig A. Gastric cancer: Classification, histology and application of molecular pathology. J Gastrointest Oncol. 2012;3(3):251-261. PubMed
2.Canadian Cancer Society. Cancer-specific statistics 2020. 2020; https://www.cancer.ca/~/media/cancer.ca/CW/cancer%20information/cancer%20101/Canadian%20cancer%20statistics%20supplementary%20information/2020/2020_cancer-specific-stats.pdf?la=en. Accessed 25 October 2021.
3.Layke JC, Lopez PP. Gastric cancer: diagnosis and treatment options. Am Fam Physician. 2004;69(5):1133-1140. PubMed
4.Canadian Cancer Society. Canadian cancer statistics: A 2018 special report on cancer incidence by stage. 2018; https://cdn.cancer.ca/-/media/files/research/cancer-statistics/2018-statistics/canadian-cancer-statistics-2018-en.pdf. Accessed 25 October 2021.
5.Dicken BJ, Bigam DL, Cass C, Mackey JR, Joy AA, Hamilton SM. Gastric adenocarcinoma: review and considerations for future directions. Ann Surg. 2005;241(1):27-39. PubMed
6.Spolverato G, Ejaz A, Kim Y, et al. Rates and patterns of recurrence after curative intent resection for gastric cancer: a United States multi-institutional analysis. J Am Coll Surg. 2014;219(4):664-675. PubMed
7.Maconi G, Manes G, Porro GB. Role of symptoms in diagnosis and outcome of gastric cancer. World J Gastroenterol. 2008;14(8):1149-1155. PubMed
8.Kaptein AA, Morita S, Sakamoto J. Quality of life in gastric cancer. World J Gastroenterol. 2005;11(21):3189-3196. PubMed
9.Canadian Cancer Society. Survival statistics for stomach cancer. 2020; https://www.cancer.ca/en/cancer-information/cancer-type/stomach/prognosis-and-survival/survival-statistics?region=on. Accessed 25 October 2021.
10.Tsang ES, Lim HJ, Renouf DJ, Davies JM, Loree JM, Gill S. Real-world treatment attrition rates in advanced esophagogastric cancer. World J Gastroenterol. 2020;26(39):6027-6036. PubMed
11.Zhang M, Dong Y, Liu H, et al. The clinicopathological and prognostic significance of PD-L1 expression in gastric cancer: a meta-analysis of 10 studies with 1,901 patients. Sci Rep. 2016;6:37933. PubMed
12.Drug Reimbursement Review sponsor submission: Opdivo (nivolumab) [internal sponsor's package]. Montreal: Bristol Myers Squibb Canada; 2021 Aug 18.
13.Janjigian YY, Shitara K, Moehler M, et al. First-line nivolumab plus chemotherapy versus chemotherapy alone for advanced gastric, gastro-oesophageal junction, and oesophageal adenocarcinoma (CheckMate 649): a randomised, open-label, phase 3 trial. Lancet. 2021;398(10294):27-40. PubMed
14.Clinical Study Report: CA209649. A Randomized, Multicenter, Open-Label, Phase 3 Study of Nivolumab Plus Ipilimumab or Nivolumab in Combination with Oxaliplatin Plus Fluoropyrimidine versus Oxaliplatin Plus Fluoropyrimidine in Subjects with Previously Untreated Advanced or Metastatic Gastric or Gastroesophageal Junction Cancer [internal sponsor's report]. Lawrenceville (NJ) Bristol-Myers Squibb; 2020 Oct 13.
15.Sponsor's NMA report title [internal sponsor's report]. In: Drug Reimbursement Review sponsor submission: Opdivo (nivolumab). Montreal: Bristol Myers Squibb Canada; 2021 Aug 18.
16.Boku N, Ryu MH, Kato K, et al. Safety and efficacy of nivolumab in combination with S-1/capecitabine plus oxaliplatin in patients with previously untreated, unresectable, advanced, or recurrent gastric/gastroesophageal junction cancer: interim results of a randomized, phase II trial (ATTRACTION-4). Annals of Oncology. 2019;30(2):250-258. PubMed
17.Rawla P, Barsouk A. Epidemiology of gastric cancer: global trends, risk factors and prevention. Prz Gastroenterol. 2019;14(1):26-38. PubMed
18.WHO International Agency for Research on Canada. Canada cancer fact sheet 2020: Incidence, mortality, and prevalence by cancer site. 2020; https://gco.iarc.fr/today/data/factsheets/populations/124-canada-fact-sheets.pdf. Accessed 25 October 2021.
19.Ajani JA, Lee J, Sano T, Janjigian YY, Fan D, Song S. Gastric adenocarcinoma. Nat Rev Dis Primers. 2017;3:17036. PubMed
20.Otterstatter MC, Brierley JD, De P, et al. Esophageal cancer in Canada: trends according to morphology and anatomical location. Can J Gastroenterol. 2012;26(10):723-727. PubMed
21.Shankaran V, Xiao H, Bertwistle D, et al. A Comparison of Real-World Treatment Patterns and Clinical Outcomes in Patients Receiving First-Line Therapy for Unresectable Advanced Gastric or Gastroesophageal Junction Cancer Versus Esophageal Adenocarcinomas. Adv Ther. 2021;38(1):707-720. PubMed
22.Merchant SJ, Kong W, Gyawali B, et al. First-Line Palliative Chemotherapy for Esophageal and Gastric Cancer: Practice Patterns and Outcomes in the General Population. JCO Oncol Pract. 2021;17(10):e1537-e1550. PubMed
23.Opdivo® nivolumab for injection. Intravenous infusion, 10 mg nivolumab /mL40 mg and 100 mg single-use vials [product monograph]. Montreal Bristol-Myers Squibb Canada; 2020 Dec 11.
24.Leucovorin calcium injection USP, 10 mg/mL, sterile solution [product monograph]. Kirkland, QC Pfizer Canada Inc.; 2018 June 21.
25.Fluorouracil injection USP, 5-fluorouracil Ph.Eur., 50 mg/mL injection USP, antineoplastic agent[product monograph]. Boucherville, QC Sandoz Canada Inc.; 2012 April 16.
26.Oxaliplatin injection, solution for injection, 5 mg/mL, concentrate:must be diluted before use, manufacturer's std. antineoplastic agent [product monograph]. Boucherville, QC Sandoz Canada Inc.; 2018 April 16.
27.McGowan J, Sampson M, Salzwedel DM, Cogo E, Foerster V, Lefebvre C. PRESS Peer Review of Electronic Search Strategies: 2015 guideline statement. Journal of clinical epidemiology. 2016;75:40-46. PubMed
28.Grey matters: a practical tool for searching health-related grey literature. Ottawa (ON): CADTH; 2019: https://www.cadth.ca/grey-matters. Accessed 2021 Dec 13.
29.EuroQol Group. EuroQol--a new facility for the measurement of health-related quality of life. Health Policy. 1990;16(3):199-208. PubMed
30.Garland SN, Pelletier G, Lawe A, et al. Prospective evaluation of the reliability, validity, and minimally important difference of the functional assessment of cancer therapy-gastric (FACT-Ga) quality-of-life instrument. Cancer. 2011;117(6):1302-1312. PubMed
31.Hellmann MD, Rizvi NA, Goldman JW, et al. Nivolumab plus ipilimumab as first-line treatment for advanced non-small-cell lung cancer (CheckMate 012): results of an open-label, phase 1, multicohort study. Lancet Oncol. 2017;18(1):31-41. PubMed
32.Fuchs CS, Doi T, Jang RW, et al. Safety and Efficacy of Pembrolizumab Monotherapy in Patients With Previously Treated Advanced Gastric and Gastroesophageal Junction Cancer: Phase 2 Clinical KEYNOTE-059 Trial. JAMA Oncol. 2018;4(5):e180013. PubMed
33.Shitara K, Ozguroglu M, Bang YJ, et al. Pembrolizumab versus paclitaxel for previously treated, advanced gastric or gastro-oesophageal junction cancer (KEYNOTE-061): a randomised, open-label, controlled, phase 3 trial. Lancet. 2018;392(10142):123-133. PubMed
34.Sharma P, Siefker-Radtke A, de Braud F, et al. Nivolumab Alone and With Ipilimumab in Previously Treated Metastatic Urothelial Carcinoma: CheckMate 032 Nivolumab 1 mg/kg Plus Ipilimumab 3 mg/kg Expansion Cohort Results. J Clin Oncol. 2019;37(19):1608-1616. PubMed
35.Shitara K, Van Cutsem E, Bang YJ, et al. Efficacy and Safety of Pembrolizumab or Pembrolizumab Plus Chemotherapy vs Chemotherapy Alone for Patients With First-line, Advanced Gastric Cancer: The KEYNOTE-062 Phase 3 Randomized Clinical Trial. JAMA Oncol. 2020;6(10):1571-1580. PubMed
36.Spagnolo F, Boutros A, Cecchi F, Croce E, Tanda ET, Queirolo P. Treatment beyond progression with anti-PD-1/PD-L1 based regimens in advanced solid tumors: a systematic review. BMC Cancer. 2021;21(1):425. PubMed
37.da Silva LL, Aguiar PN, Jr., Park R, Edelman Saul E, Haaland B, de Lima Lopes G. Comparative Efficacy and Safety of Programmed Death-1 Pathway Inhibitors in Advanced Gastroesophageal Cancers: A Systematic Review and Network Meta-Analysis of Phase III Clinical Trials. Cancers. 2021;13(11):26. PubMed
38.Sun JM, Shen L, Shah MA, et al. Pembrolizumab plus chemotherapy versus chemotherapy alone for first-line treatment of advanced oesophageal cancer (KEYNOTE-590): a randomised, placebo-controlled, phase 3 study. Lancet. 2021;398(10302):759-771. PubMed
39.Wagner AD, Unverzagt S, Grothe W, et al. Chemotherapy for advanced gastric cancer. Cochrane Database Syst Rev. 2010(3):CD004064. PubMed
40.Dias SWN, Sutton AJ, al. e. NICE DSU technical support document 2: A generalised linear modelling framework for pairwise and network meta-analysis of randomised controlled trial. London (GB): NICE; 2014.
41.Guyot P, Ades AE, Ouwens MJ, Welton NJ. Enhanced secondary analysis of survival data: reconstructing the data from published Kaplan-Meier survival curves. BMC Med Res Methodol. 2012;12:9. PubMed
42.Tebbutt NC, Cummins MM, Sourjina T, et al. Randomised, non-comparative phase II study of weekly docetaxel with cisplatin and 5-fluorouracil or with capecitabine in oesophagogastric cancer: the AGITG ATTAX trial. Br J Cancer. 2010;102(3):475-481. PubMed
43.Matsuyama J, Kurokawa Y, Nishikawa K, et al. Randomized phase II study to compare docetaxel plus S-1 with cisplatin plus S-1 in advanced gastric cancer without measurable lesions (HERBIS-3). J Clin Oncol. 2018;4 Suppl:119.
44.Lu Z, Zhang X, Liu W, et al. A multicenter, randomized trial comparing efficacy and safety of paclitaxel/capecitabine and cisplatin/capecitabine in advanced gastric cancer. Gastric Cancer. 2018;21(5):782-791. PubMed
45.Mochiki E, Ogata K, Ohno T, et al. Phase II multi-institutional prospective randomised trial comparing S-1+paclitaxel with S-1+cisplatin in patients with unresectable and/or recurrent advanced gastric cancer. Br J Cancer. 2012;107(1):31-36. PubMed
46.US Food and Drug Administration. OPDIVO (nivolumab) injection, for intravenous use [FDA label]. 2021; https://www.accessdata.fda.gov/drugsatfda_docs/label/2021_125554s097lbl.pdf. Accessed 25 October 2021.
47.EMA Committe for Medicinal Products for Human Use (CHMP). Opdivo: Pending decision. 2021; https://www.ema.europa.eu/en/medicines/human/EPAR/opdivo. Accessed 25 October 2021.
48.Bristol Myers Squibb response to Dec 6, 2021 DRR request for additional information regarding Opdivo DRR review [internal additional sponsor's information]. Saint-Laurent (Québec): Bristol Myers Squibb; 2021 Dec 15.
49.Brooks R. EuroQol: the current state of play. Health Policy. 1996;37(1):53-72. PubMed
50.Doherty MK, Leung Y, Su J, et al. Health utility scores from EQ-5D and health-related quality of life in patients with esophageal cancer: a real-world cross-sectional study. Dis Esophagus. 2018;31(12). PubMed
51.Pickard AS, Neary MP, Cella D. Estimation of minimally important differences in EQ-5D utility and VAS scores in cancer. Health Qual Life Outcomes. 2007;5:70. PubMed
52.Debb SM, Arnold B, Perez B, Cella D. Validation of the FACT-Gastric cancer quality of life questionnaire for use in Spanish-speaking countries. Psychooncology. 2011;20(1):19-27. PubMed
53.Maeda H, Sato M, Kobayashi M, et al. Validity of the Japanese version of functional assessment of cancer therapy-gastric (FACT-Ga) and its sensitivity to ascites volume change: a retrospective analysis of Japanese clinical trial participants. Support Care Cancer. 2016;24(11):4515-4521. PubMed
54.Zhou HJ, So JB, Yong WP, et al. Validation of the functional assessment of cancer therapy-gastric module for the Chinese population. Health Qual Life Outcomes. 2012;10:145. PubMed
55.Eremenco SL, Cashy J, Webster K, et al. FACT-Gastric: A new international measure of QOL in gastric cancer. Journal of Clinical Oncology. 2004;22(14_suppl):8123-8123.
Appendix 1: Literature Search Strategy
Note this appendix has not been copy-edited.
Clinical Literature Search
Overview
Interface: Ovid
Databases:
MEDLINE All (1946-present)
Embase (1974-present)
Note: Subject headings and search fields have been customized for each database. Duplicates between databases were removed in Ovid.
Date of search: September 16, 2021
Alerts: Bi-weekly search updates until project completion
Search filters applied: None
Limits:
Conference abstracts: excluded
Syntax | Description |
|---|---|
/ | At the end of a phrase, searches the phrase as a subject heading |
MeSH | Medical Subject Heading |
.fs | Floating subheading |
exp | Explode a subject heading |
* | Before a word, indicates that the marked subject heading is a primary topic; or, after a word, a truncation symbol (wildcard) to retrieve plurals or varying endings |
# | Truncation symbol for one character |
? | Truncation symbol for one or no characters only |
adj# | Requires terms to be adjacent to each other within # number of words (in any order) |
.ti | Title |
.ot | Original title |
.ab | Abstract |
.hw | Heading word; usually includes subject headings and controlled vocabulary |
.kf | Author keyword heading word (MEDLINE) |
.kw | Author keyword (Embase) |
.dq | Candidate term word (Embase) |
.pt | Publication type |
.mp | Mapped term |
.rn | Registry number |
.nm | Name of substance word (MEDLINE) |
.yr | Publication year |
.jw | Journal title word (MEDLINE) |
.jx | Journal title word (Embase) |
freq=# | Requires terms to occur # number of times in the specified fields |
medall | Ovid database code: MEDLINE All, 1946 to present, updated daily |
oemezd | Ovid database code; Embase, 1974 to present, updated daily |
Multi-Database Strategy
# Searches
Nivolumab/
(opdivo* or nivolumab* or nivo or bms 936558 or bms936558 or cmab 819 or cmab819 or mdx 1106 or mdx1106 or ono 4538 or ono4538 or HSDB 8256 or HSDB8256 or GTPL 7335 or GTPL7335 or 31YO63LBSN).ti,ab,kf,ot,rn,nm.
1 or 2
exp Esophageal Neoplasms/
Stomach Neoplasms/
((esophag* or gastroesophag* or oesophag* or cardioesophageal or cardiooesophageal or EG junction* or gastrooesophageal or GE junction*) adj3 (cancer* or neoplas* or tumo?r* or carcinoma* or adenocarcinoma* or squamous or malignan* or metast*)).ti,ab,kf.
((gastric* or GEJ or EGJ or stomach) adj3 (cancer* or neoplas* or tumo?r* or carcinoma* or adenocarcinoma* or squamous or malignan* or metast*)).ti,ab,kf.
or/4-7
3 and 8
9 use medall
*nivolumab/
(opdivo* or nivolumab* or nivo or bms 936558 or bms936558 or cmab 819 or cmab819 or mdx 1106 or mdx1106 or ono 4538 or ono4538 or HSDB 8256 or HSDB8256 or GTPL 7335 or GTPL7335).ti,ab,kw,dq.
11 or 12
exp Esophagus tumour/
exp Stomach Cancer/
exp Stomach tumour/
((esophag* or gastroesophag* or oesophag* or cardioesophageal or cardiooesophageal or EG junction* or gastrooesophageal or GE junction*) adj3 (cancer* or neoplas* or tumo?r* or carcinoma* or adenocarcinoma* or squamous or malignan* or metast*)).ti,ab,kw.
((gastric* or GEJ or EGJ or stomach) adj3 (cancer* or neoplas* or tumo?r* or carcinoma* or adenocarcinoma* or squamous or malignan* or metast*)).ti,ab,kw.
or/14-18
13 and 19
20 use oemezd
21 not (conference abstract or conference review).pt.
10 or 22
remove duplicates from 23
Clinical Trials Registries
ClinicalTrials.gov
Produced by the US National Library of Medicine. Targeted search used to capture registered clinical trials.
[Search -- Opdivo OR nivolumab OR MDX 1106 OR MDX1106 OR BMS936558 OR BMS 936558 OR ONO4538 OR ONO 4538 OR HSDB 8256 OR HSDB8256 | esophageal OR esophagus OR gastroesophageal OR "gastro esophageal" OR gastric OR oesophagus OR oesophageal OR esophagogastric OR stomach]
WHO ICTRP
International Clinical Trials Registry Platform, produced by the World Health Organization. Targeted search used to capture registered clinical trials.
[Search terms -- Opdivo OR nivolumab OR MDX 1106 OR MDX1106 OR BMS936558 OR BMS 936558 OR ONO4538 OR ONO 4538 OR HSDB 8256 OR HSDB8256 | esophageal OR esophagus OR gastroesophageal OR "gastro esophageal" OR gastric OR oesophagus OR oesophageal OR esophagogastric OR stomach]
Health Canada’s Clinical Trials Database
Produced by Health Canada. Targeted search used to capture registered clinical trials.
[Search terms -- Opdivo OR nivolumab OR MDX 1106 OR MDX1106 OR BMS936558 OR BMS 936558 OR ONO4538 OR ONO 4538 OR HSDB 8256 OR HSDB8256 | esophageal OR esophagus OR gastroesophageal OR "gastro esophageal" OR gastric OR oesophagus OR oesophageal OR esophagogastric OR stomach]
EU Clinical Trials Register
European Union Clinical Trials Register, produced by the European Union. Targeted search used to capture registered clinical trials.
[Search terms -- Opdivo OR nivolumab OR MDX 1106 OR MDX1106 OR BMS936558 OR BMS 936558 OR ONO4538 OR ONO 4538 OR HSDB 8256 OR HSDB8256 | esophageal OR esophagus OR gastroesophageal OR "gastro esophageal" OR gastric OR oesophagus OR oesophageal OR esophagogastric OR stomach]
Grey Literature
Search dates: September 7, 2021 to September 10, 2020
Keywords: Opdivo OR nivolumab OR MDX 1106 OR MDX1106 OR BMS936558 OR BMS 936558 OR ONO4538 OR ONO 4538 OR HSDB 8256 OR HSDB8256 | esophageal OR esophagus OR gastroesophageal OR "gastro esophageal" OR gastric OR oesophagus OR oesophageal OR esophagogastric OR stomach
Limits: None
Updated: Search updated prior to the completion of stakeholder feedback period
Relevant websites from the following sections of the CADTH grey literature tool Grey Matters: A Practical Tool for Searching Health-Related Grey Literature were searched:
Health Technology Assessment Agencies
Health Economics
Clinical Practice Guidelines
Drug and Device Regulatory Approvals
Advisories and Warnings
Drug Class Reviews
Clinical Trials Registries
Databases (free)
Health Statistics
Internet Search
Open Access Journals
Appendix 2: Excluded Studies
Note this appendix has not been copy-edited.
Reference | Reason for exclusion |
|---|---|
Boku et al. (2019)16 | Comparator (SOX including TS-1 not available in Canada); no full text available |
SOX = TS-1 plus oxaliplatin; TS-1 = tegafur-gimeracil-oteracil.
Appendix 3: Detailed Outcome Data
Note this appendix has not been copy-edited.
Table 32: Sensitivity Analyses in the CheckMate-649 Trial
Outcome | HR (98.4% CI) | P value |
|---|---|---|
OS in patients with PD-L1 CPS ≥ 5 | ||
Unstratified analysis | 0.70 (0.58 to 0.84) | < 0.0001 |
Unstratified analysis with stratified factors as covariates | 0.68 (0.57 to 0.83) | < 0.0001 |
Stratified analysis based on the first 420 randomized patients with PD-L1 CPS ≥ 5 | 0.70 (0.53 to 0.92) | 0.0018 |
Stratified analysis based on the population with first 354 events among all randomized patients with PD-L1 CPS ≥ 5 | 0.64 (0.49 to 0.83) | < 0.0001 |
OS in patients with PD-L1 CPS ≥ 1 | ||
Unstratified analysis | |||||| (|||||| to ||||||) | |||||| |
Unstratified analysis with stratified factors as covariates | |||||| (|||||| to ||||||) | |||||| |
OS in all randomized patients | ||
Unstratified analysis | 0.79 (0.67 to 0.93) | < 0.0001 |
Unstratified analysis with stratified factors as covariates | 0.78 (0.67 to 0.92) | < 0.0001 |
PFS in patients with PD-L1 CPS ≥ 5 | ||
Unstratified analysis | 0.69 (0.58 to 0.83) | < 0.0001 |
Unstratified analysis with stratified factors as covariates | 0.68 (0.57 to 0.81) | < 0.0001 |
Stratified analysis based on patients with the first 228 events among the first 298 randomized patients with PD-L1 CPS ≥ 5 | 0.69 (0.49 to 0.97) | 0.0100 |
CI = confidence interval; CPS = combined positive score; HR = hazard ratio; OS = overall survival; PD-L1 = programmed death ligand 1; PFS = progression-free survival.
Source: CheckMate-649 Clinical Study Report.14
Table 33: Subgroup Analyses in the CheckMate-649 Trial
Outcome | N | Nivo + chemo, median (95% CI) | Chemo, median (95% CI) | HR (95% CI) |
|---|---|---|---|---|
OS in patients with PD-L1 CPS ≥ 5 | ||||
HER2 status | ||||
HER2-positive | 7 | NA | 13.34 (7.00 to 18.10) | Not calculable |
HER2-negative | 543 | 14.46 (13.14 to 16.46) | 13.14 (11.56 to 14.42) | 0.87 (0.71 to 1.06) |
HER2-unknown | 5 | NA (2.04 to NA) | 3.58 (3.19 to NA) | Not calculable |
HER2-not reported | 400 | 13.93 (11.14 to 16.85) | 8.48 (7.52 to 9.95) | 0.53 (0.42 to 0.67) |
MSI | ||||
MSI-H | 34 | NA (5.3 to NA) | 8.80 (3.71 to 16.46) | 0.33 (0.12 to 0.87) |
MSS | 846 | 14.39 (13.04 to 16.23) | 11.14 (10.05 to 12.48) | 0.73 (0.62 to 0.85) |
Invalid | 14 | 11.37 (3.38 to 18.83) | 14.14 (6.34 to 19.32) | Not calculable |
Not reported | 61 | 11.79 (8.28 to 14.39) | 10.25 (6.67 to 12.71) | 0.62 (0.34 to 1.13) |
Tumour cell PD-L1 | ||||
< 1% | 724 | 14.19 (12.55 to 16.10) | 11.56 (10.64 to 12.65) | 0.75 (0.63 to 0.90) |
≥ 1% | 230 | 16.23 (11.76 to 23.72) | 8.77 (6.34 to 11.24) | 0.56 (0.40 to 0.77) |
Indeterminate/unevaluable/not reported | 1 | NA | 12.25 (NA to NA) | Not calculable |
OS in patients with PD-L1 CPS ≥ 1 | ||||
HER2 status | ||||
HER2-positive | |||||| | |||||| | |||||| (|||||| to||||||) | |||||| |
HER2-negative | |||||| | |||||| (|||||| to||||||) | |||||| (|||||| to||||||) | |||||| (|||||| to||||||) |
HER2-unknown | |||||| | |||||| (|||||| to||||||) | |||||| (|||||| to||||||) | |||||| |
HER2-not reported | |||||| | |||||| (|||||| to||||||) | |||||| (|||||| to||||||) | |||||| (|||||| to||||||) |
MSI | ||||
MSI-H | 41 | NA (|||||| to||||||) | 9.30 (|||||| to||||||) | 0.33 (0.13 to 0.80) |
MSS | 1,139 | |||||| (|||||| to||||||) | 11.24 (|||||| to||||||) | 0.78 (0.68 to 0.89) |
Invalid | |||||| | |||||| (|||||| to||||||) | |||||| (|||||| to||||||) | |||||| (|||||| to||||||) |
Not reported | |||||| | |||||| (|||||| to||||||) | |||||| (|||||| to||||||) | |||||| (|||||| to||||||) |
Tumour cell PD-L1 status | ||||
< 1% | |||||| | |||||| (|||||| to||||||) | |||||| (|||||| to||||||) | |||||| (|||||| to||||||) |
≥ 1% | |||||| | |||||| (|||||| to||||||) | |||||| (|||||| to||||||) | |||||| (|||||| to||||||) |
Indeterminate/unevaluable/not reported | |||||| | |||||| | |||||| (|||||| to||||||) | |||||| (|||||| to||||||) |
OS in all randomized patients | ||||
HER2 status | ||||
HER2-positive | 7 | NA | 13.34 (7.00 to 18.10) | Not calculable |
HER2-negative | 931 | 14.42 (13.57 to 16.23) | 12.65 (11.89 to 13.54) | 0.85 (0.73 to 0.99) |
HER2-unknown | 9 | 10.28 (2.04 to 24.15) | 6.74 (3.19 to NA) | Not calculable |
HER2-not reported | 634 | 11.33 (9.79 to 14.00) | 9.76 (8.38 to 11.04) | 0.71 (0.59 to 0.85) |
MSI | ||||
MSI-H | 44 | NA (8.38 to NA) | 12.25 (4.11 to 21.55) | 0.37 (0.16 to 0.87) |
MSS | 1,377 | 13.83 (12.42 to 14.62) | 11.37 (10.74 to 12.48) | 0.80 (0.71 to 0.91) |
Invalid | 28 | 9.26 (4.44 to 26.97) | 13.70 (7.75 to 19.32) | 1.08 (0.44 to 2.68) |
Not reported | 132 | 11.79 (8.87 to 16.66) | 11.56 (9.95 to 13.54) | 0.79 (0.53 to 1.18) |
Tumour cell PD-L1 | ||||
< 10% | 1,425 | 13.60 (12.29 to 14.39) | 11.76 (10.97 to 12.58) | 0.83 (0.73 to 0.93) |
≥ 10% | 151 | 16.23 (10.15 to 23.92) | 9.82 (6.21 to 13.21) | 0.57 (0.38 to 0.84) |
< 5% | 1,393 | 13.7 (12.39 to 14.42) | 11.96 (11.10 to 12.71) | 0.83 (0.73 to 0.94) |
≥ 5% | 183 | 16.13 (10.15 to 23.06) | 9.23 (6.28 to 11.63) | 0.59 (0.41 to 0.84) |
< 1% | 1,323 | 13.60 (12.09 to 14.39) | 11.99 (11.14 to 12.78) | 0.85 (0.75 to 0.96) |
≥ 1% | 253 | 15.64 (11.76 to 23.06) | 9.66 (7.20 to 11.24) | 0.57 (0.42 to 0.77) |
Indeterminate/unevaluable/not reported | 5 | NA | 9.56 (3.68 to 12.52) | Not calculable |
PD-L1 CPS | ||||
< 10 | 793 | 12.55 (11.07 to 14.19) | 12.52 (11.24 to 13.27) | 0.94 (0.80 to 1.10) |
≥ 10 | 768 | 15.01 (13.77 to 16.79) | 10.87 (9.82 to 11.83) | 0.65 (0.55 to 0.78) |
< 5 | 606 | 12.42 (10.61 to 14.26) | 12.25 (10.97 to 13.24) | 0.94 (0.78 to 1.13) |
≥ 5 | 955 | 14.39 (13.11 to 16.23) | 11.10 (10.02 to 12.09) | 0.70 (0.60 to 0.81) |
< 1 | 265 | 13.08 (9.82 to 16.66) | 12.48 (10.12 to 13.83) | 0.92 (0.70 to 1.23) |
≥ 1 | 1,296 | 13.96 (12.55 to 14.98) | 11.33 (10.64 to 12.25) | 0.76 (0.67 to 0.87) |
Indeterminate/unevaluable/not reported | 20 | 13.19 (1.22 to 19.25) | 12.14 (6.97 to NA) | Not calculable |
PFS in patients with PD-L1 CPS ≥ 5 | ||||
HER2 status | ||||
HER2-positive | 7 | NA (2.83 to NA) | 6.93 (NA to NA) | Not calculable |
HER2-negative | 543 | 8.28 (6.80 to 9.56) | 6.93 (5.68 to 7.33) | 0.78 (0.64 to 0.96) |
HER2-unknown | 5 | 1.69 (0.49 to 2.89) | 9.71 (2.66 to 16.76) | Not calculable |
HER2-not reported | 400 | 7.69 (6.97 to 9.79) | 5.55 (4.50 to 6.24) | 0.57 (0.45 to 0.72) |
MSI | ||||
MSI-H | 34 | 12.48 (2.89 to NA) | 4.27 (1.97 to 7.13) | 0.32 (0.12 to 0.85) |
MSS | 846 | 8.31 (7.06 to 9.46) | 6.21 (5.59 to 6.93) | 0.70 (0.59 to 0.82) |
Invalid | 14 | 4.24 (0.30 to 9.99) | 5.55 (1.41 to 13.83) | Not calculable |
Not reported | 61 | 6.54 (4.24 to 8.28) | 5.78 (3.55 to 8 to97) | 0.87 (0.49 to 1.54) |
Tumour cell PD-L1 status | ||||
< 1% | 724 | 7.52 (6.97 to 8.57) | 6.67 (5.78 to 6.97) | 0.76 (0.64 to 0.91) |
≥ 1% | 230 | 9.89 (6.97 to 13.83) | 4.76 (4.04 to 5.68) | 0.51 (0.37 to 0.71) |
Indeterminate/unevaluable/not reported | 1 | NA | 7.13 (NA to NA) | Not calculable |
PFS in all randomized patients | ||||
Tumour cell PD-L1 | ||||
< 10% | 1,425 | 7.66 (7.06 to 8.57) | 6.97 (6.83 to 7.29) | 0.80 (0.70 to 0.90) |
≥ 10% | 151 | 7.29 (4.73 to 11.43) | 5.29 (3.55 to 6.77) | 0.60 (0.41 to 0.89) |
< 5% | 1,393 | 7.62 (7.06 to 8.54) | 7.03 (6.87 to 7.59) | 0.81 (0.72 to 0.92) |
≥ 5% | 183 | 8.31 (5.45 to 11.37) | 5.29 (3.55 to 6.21) | 0.56 (0.40 to 0.80) |
< 1% | 1,323 | 7.52 (7.03 to 8.44) | 7.03 (6.90 to 7.72) | 0.84 (0.74 to 0.96) |
≥ 1% | 253 | 9.66 (6.97 to 12.35) | 5.26 (4.17 to 6.05) | 0.52 (0.39 to 0.71) |
Indeterminate/unevaluable/not reported | 5 | NR | NR | Not calculable |
PD-L1 CPS | ||||
< 10 | 793 | 7.49 (7.03 to 8.44) | 7.72 (6.97 to 8.31) | 0.91 (0.77 to 1.08) |
≥ 10 | 768 | 8.31 (6.97 to 9.69) | 5.78 (5.45 to 6.87) | 0.65 (0.55 to 0.77) |
< 5 | 606 | 7.49 (6.97 to 8.67) | 8.15 (7.06 to 8.67) | 0.93 (0.76 to 1.12) |
≥ 5 | 955 | 7.69 (7.03 to 9.17) | 6.05 (5.55 to 6.90) | 0.69 (0.59 to 0.80) |
< 1 | 265 | 8.67 (6.93 to 9.69) | 8.11 (6.87 to 9.82) | 0.93 (0.69 to 1.26) |
≥ 1 | 1,296 | 7.49 (7.03 to 8.41) | 6.90 (6.08 to 7.03) | 0.75 (0.65 to 0.85) |
Indeterminate/unevaluable/not reported | 20 | NR | NR | Not calculable |
CI = confidence interval; CPS = combined positive score; HER2 = human epidermal growth factor receptor; HR = hazard ratio; MSI = microsatellite instability; MSI-H = microsatellite instability-high; MSS = microsatellite stable; NA = not applicable; NR = not reported; OS = overall survival; PD-L1 = programmed death ligand 1; PFS = progression-free survival.
Note: All results are from the July 10, 2020, database lock. Median OS and PFS and their 95% CIs are from Kaplan-Meier analyses and HRs (95% CIs) are from unstratified Cox proportional hazards models.
Source: CheckMate-649 Clinical Study Report.14
Table 34: Reasons for Censoring of PFS per BICR Among Patients With PD-L1 CPS ≥ 5 in the CheckMate-649 Trial
Item | Nivolumab + chemotherapy (N = 473) | Chemotherapy (N = 482) |
|---|---|---|
Events, n (%) | |||||| (||||||) | |||||| (||||||) |
Type of event, n (%) | ||
Progressive diseasea | |||||| (||||||) | |||||| (||||||) |
Death | |||||| (||||||) | |||||| (||||||) |
Patients censored, n (%) | |||||| (||||||) | |||||| (||||||) |
Censored on date of randomization | |||||| (||||||) | |||||| (||||||) |
No baseline tumour assessmentb | |||||| (||||||) | |||||| (||||||) |
Never treated | |||||| (||||||) | |||||| (||||||) |
Other | |||||| (||||||) | |||||| (||||||) |
No on-study tumour assessment and no death | |||||| (||||||) | |||||| (||||||) |
Never treated | |||||| (||||||) | |||||| (||||||) |
Other | |||||| (||||||) | |||||| (||||||) |
Censored on date of last tumour assessment on study | |||||| (||||||) | |||||| (||||||) |
Received subsequent anticancer therapyc | |||||| (||||||) | |||||| (||||||) |
Still on treatment | |||||| (||||||) | |||||| (||||||) |
In follow-up | |||||| (||||||) | |||||| (||||||) |
Off study | |||||| (||||||) | |||||| (||||||) |
Lost to follow-up | |||||| (||||||) | |||||| (||||||) |
Patient withdrew consent | |||||| (||||||) | |||||| (||||||) |
Other | |||||| (||||||) | |||||| (||||||) |
BICR = blinded independent review committee; CPS = combined positive score; PFS = progression-free survival; PD-L1 = programmed death ligand 1.
aPer RECIST 1.1 criteria.
bTumour assessments and death if any, occurring after start of subsequent anticancer therapy was not considered.
cIncludes patients, regardless of treatment status, who received subsequent anticancer therapy without a prior reported PFS event. Those patients were censored at the last evaluable tumour assessment prior to/on start date of subsequent anticancer therapy.
Source: CheckMate-649 Clinical Study Report.14
Updated KM Plots as of the February 16, 2021, Database Lock
Figure 15: OS Among All Randomized Patients in the CheckMate-649 Trial as of the July 10, 2020, and February 16, 2021, Database Locks
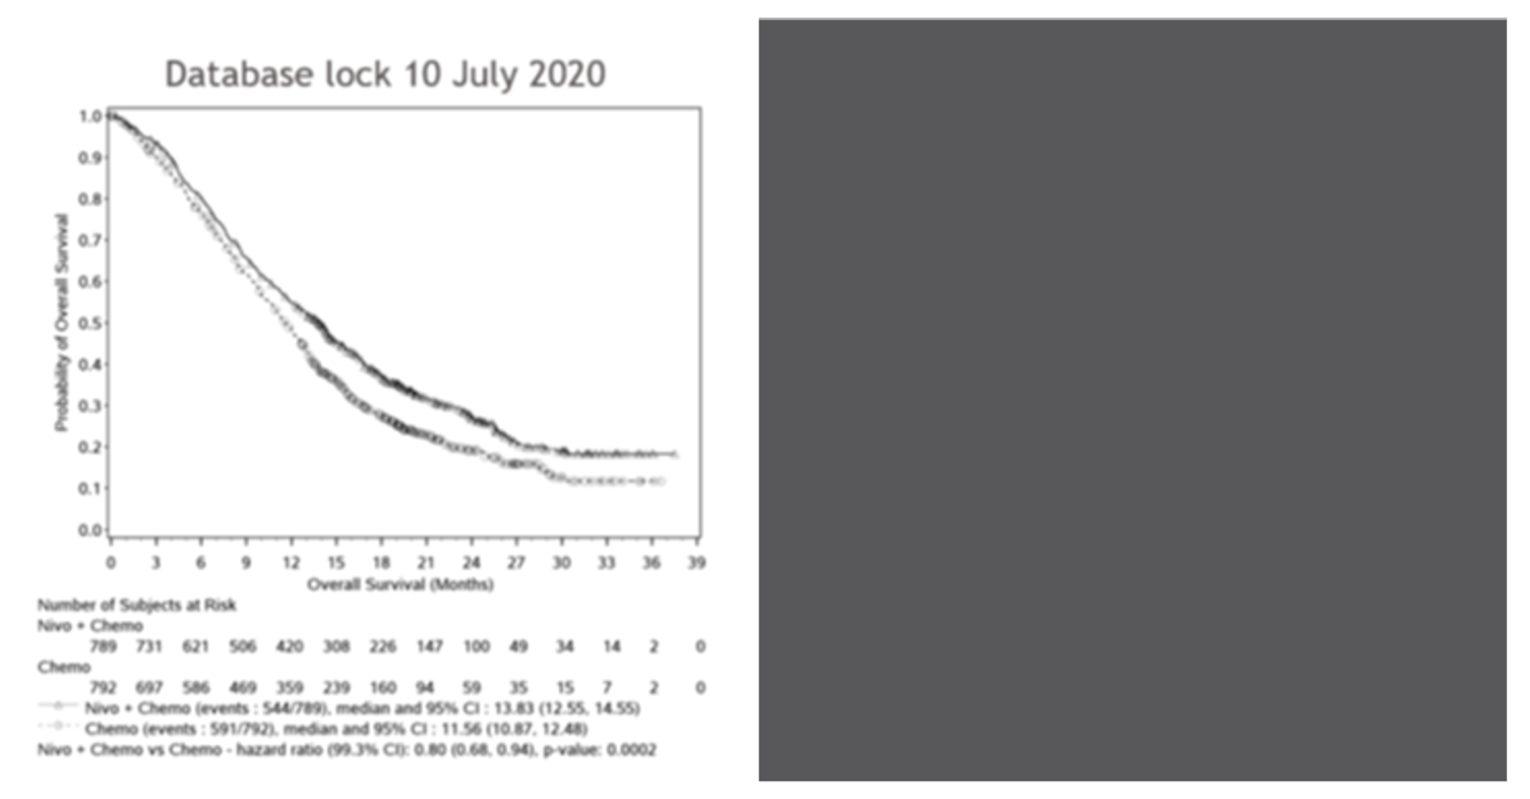
The Kaplan-Meier plot based on the February 16, 2021, database lock has been redacted at the request of the sponsor.
Note: Symbols represent censored observations.
Source: Sponsor’s submission.12
Figure 16: PFS Among All Randomized Patients in the CheckMate-649 Trial as of the July 10, 2020, and February 16, 2021, Database Locks
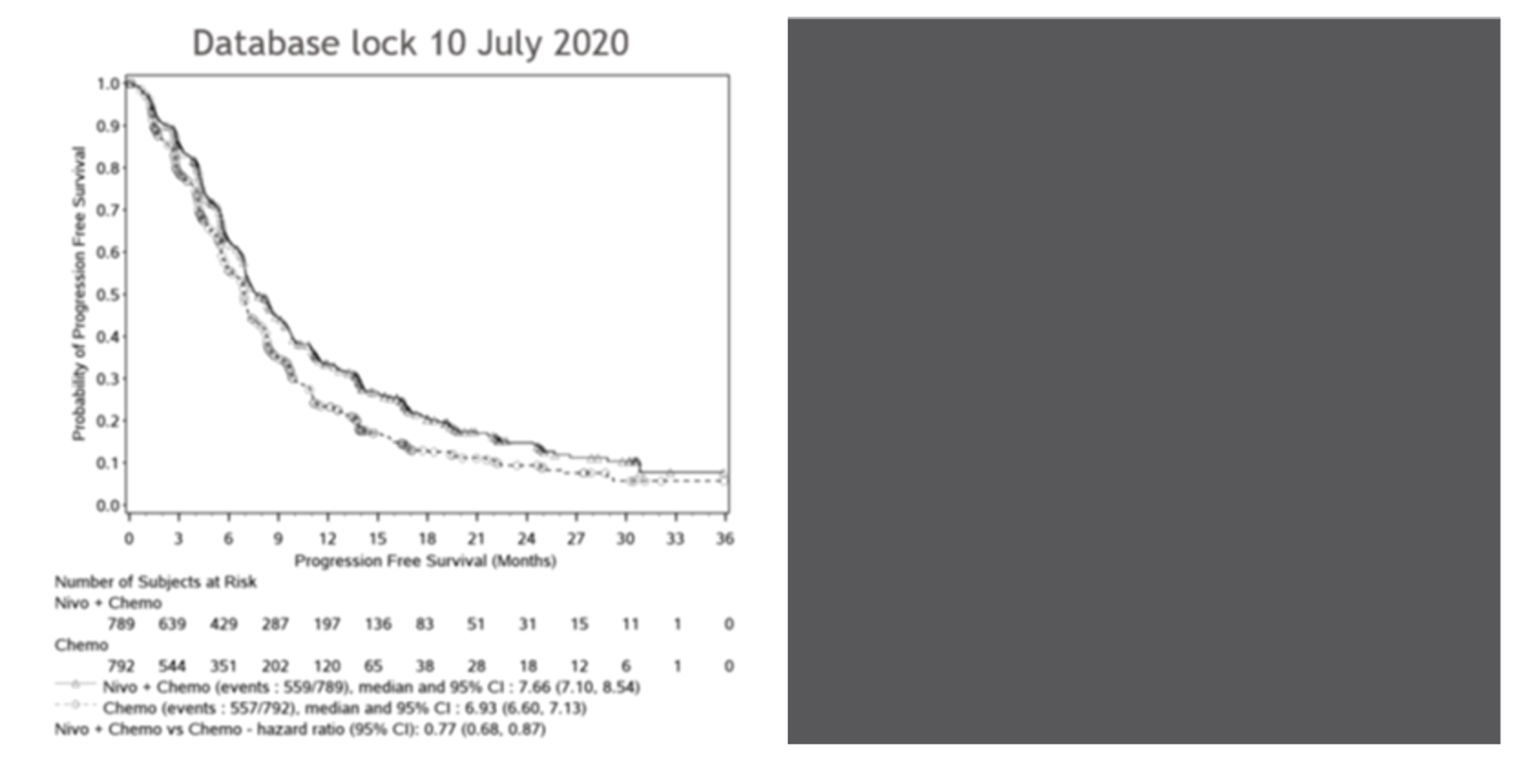
The Kaplan-Meier plot based on the February 16, 2021, database lock has been redacted at the request of the sponsor.
Note: Symbols represent censored observations.
Source: Sponsor’s submission.12
Figure 17: OS Among Patients With PD-L1 CPS ≥ 5 in the CheckMate-649 Trial as of the July 10, 2020, and February 16, 2021, Database Locks
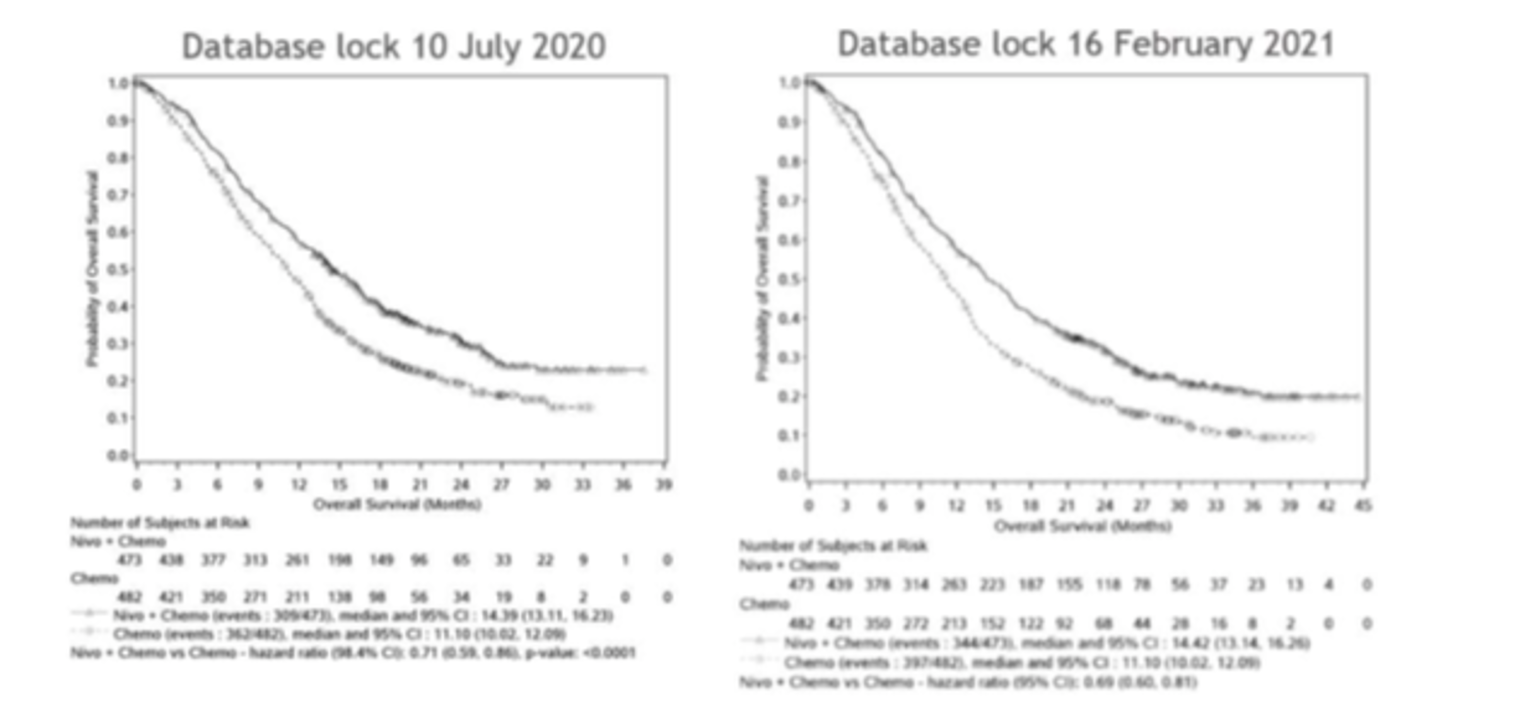
Note: Symbols represent censored observations.
Source: Sponsor’s submission.12
Figure 18: PFS Among Patients With PD-L1 CPS ≥ 5 in the CheckMate-649 Trial as of the July 10, 2020, and February 16, 2021, Database Locks
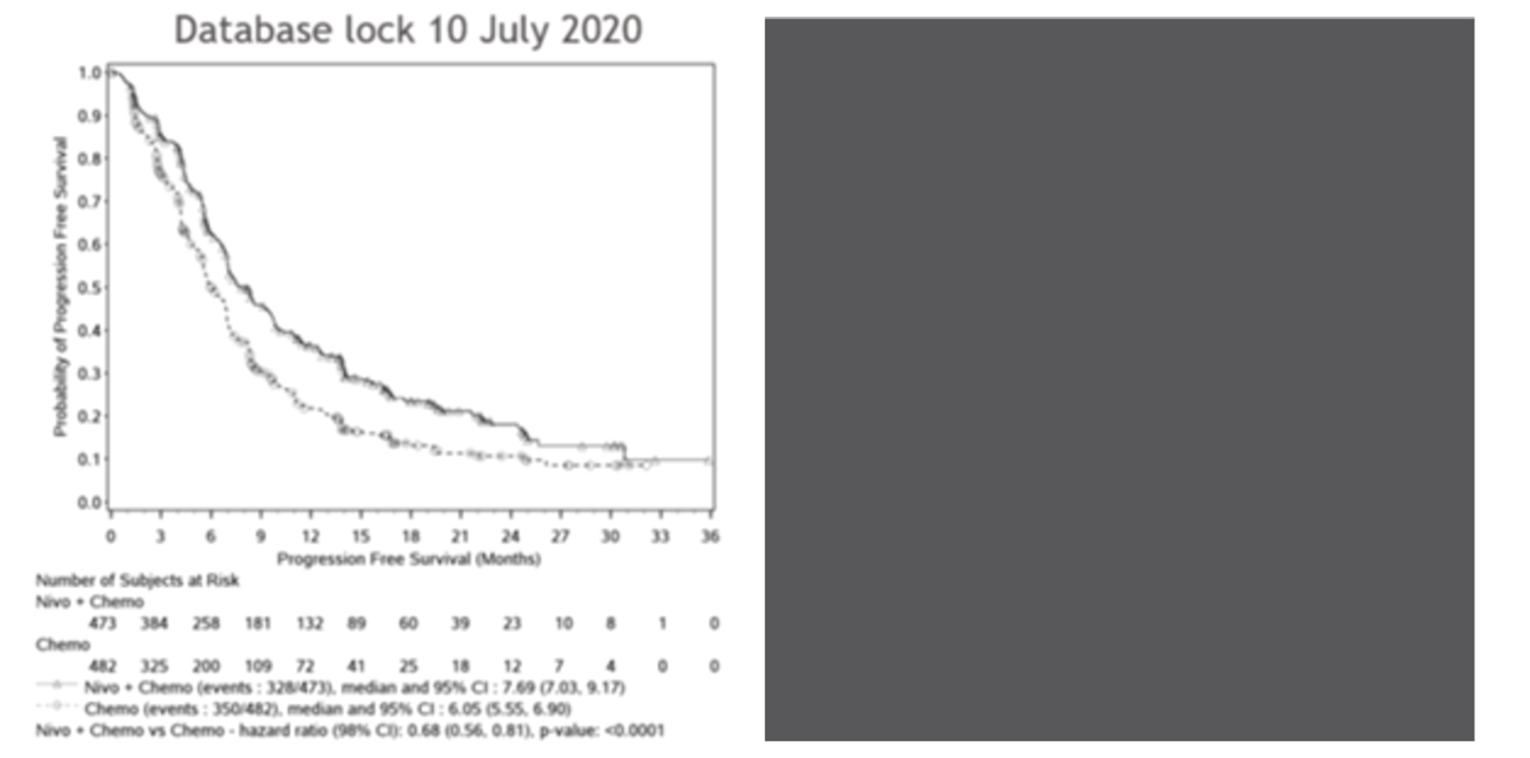
The Kaplan-Meier plot based on the February 16, 2021, database lock has been redacted at the request of the sponsor.
Note: Symbols represent censored observations.
Source: Sponsor’s submission.12
Figure 19: OS Among Patients With PD-L1 CPS ≥ 1 in the CheckMate-649 Trial as of the July 10, 2020, and February 16, 2021, Database Locks
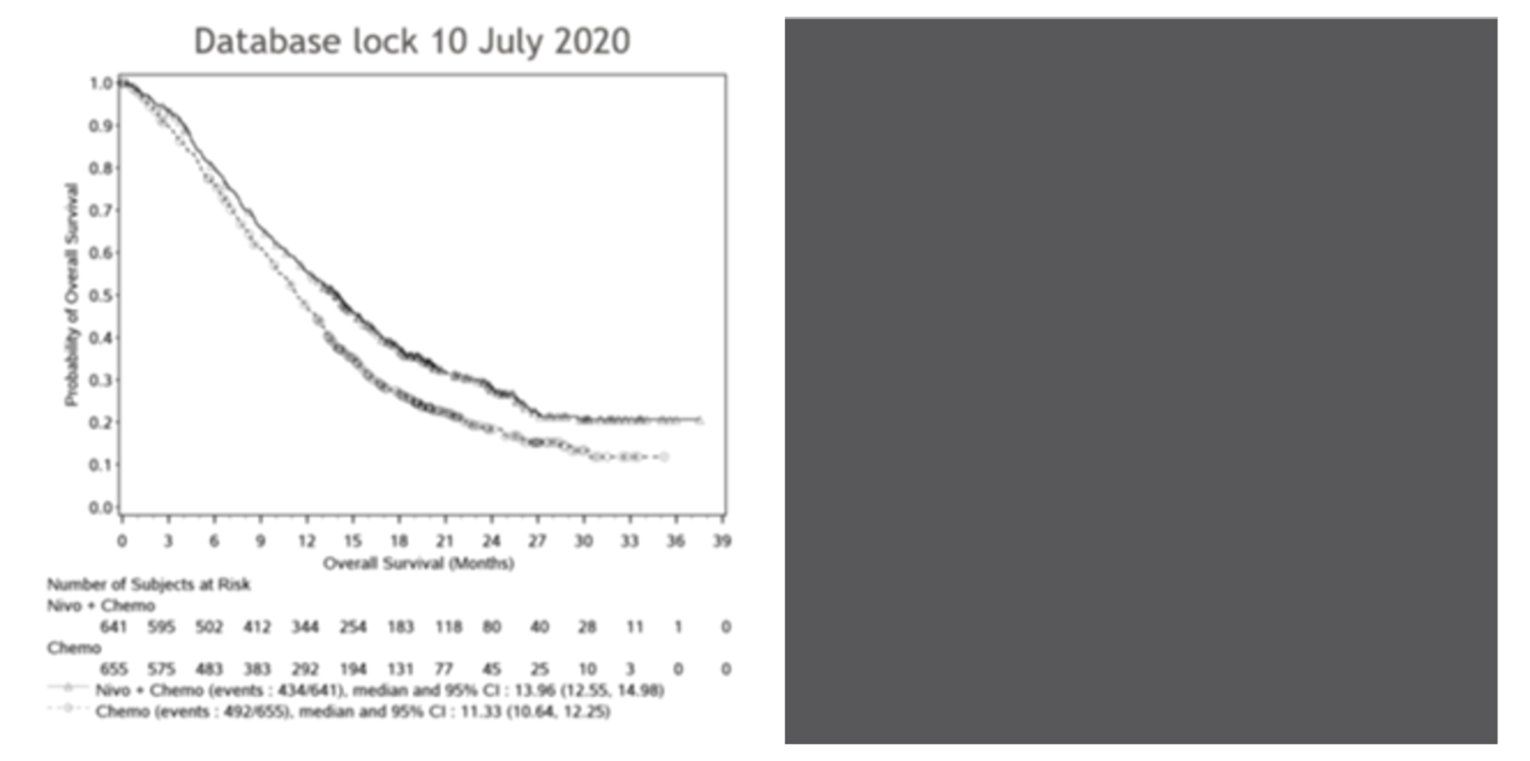
The Kaplan-Meier plot based on the February 16, 2021, database lock has been redacted at the request of the sponsor.
Note: Symbols represent censored observations.
Source: Sponsor’s submission.12
Figure 20: PFS Among Patients With PD-L1 CPS ≥ 1 in the CheckMate-649 Trial as of the July 10, 2020, and February 16, 2021, Database Locks
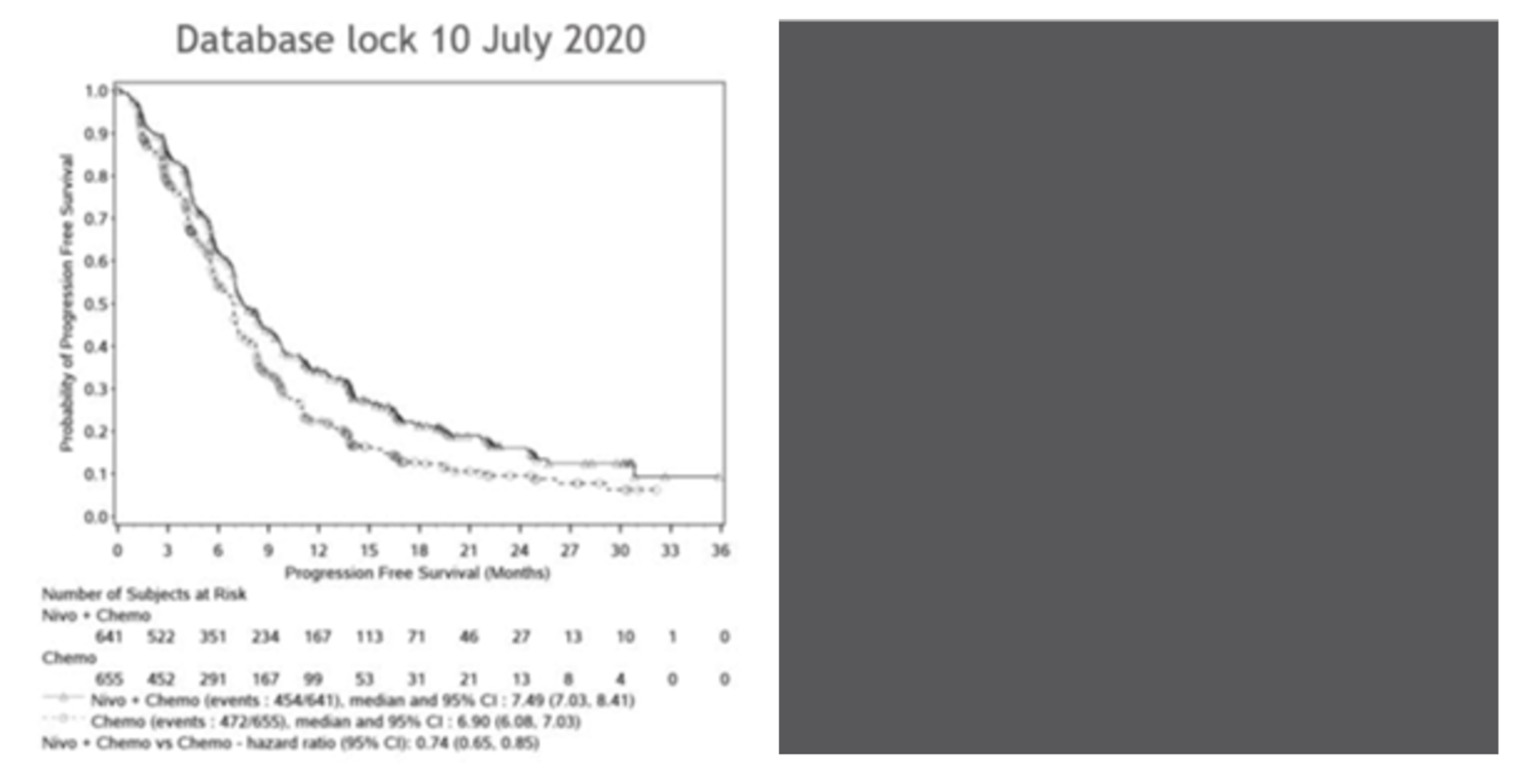
The Kaplan-Meier plot based on the February 16, 2021, database lock has been redacted at the request of the sponsor.
Note: Symbols represent censored observations.
Source: Sponsor’s submission.12
Table 35: Treatment Beyond Progression per BICR With Nivolumab Plus Chemotherapy Among Patients With PD-L1 CPS ≥ 10, PD-L1 CPS ≥ 5, PD-L1 CPS ≥ 1, and All Randomized Patients in the CheckMate-649 Trial
Item | PD-L1 CPS ≥ 10 (N = 375) | PD-L1 CPS ≥ 5 (N = 473) | PD-L1 CPS ≥ 1 (N = 641) | All randomized patients (N = 789) |
|---|---|---|---|---|
Treated beyond progression per BICR, n (%) | |||||| (||||||) | |||||| (||||||) | |||||| (||||||) | |||||| (||||||) |
Number of doses received beyond progression per BICR | ||||
Mean (SD) | |||||| (||||||) | |||||| (||||||) | |||||| (||||||) | |||||| (||||||) |
Median (range) | |||||| (||||||) | |||||| (||||||) | |||||| (||||||) | |||||| (||||||) |
Duration of treatment beyond progression per BICR (months) | ||||
Mean (SD) | |||||| (||||||) | |||| (||||,||||) | |||| (||||,||||) | |||| (||||,||||) |
Median (range) | |||| (||||,||||) | |||| (||||,||||) | |||| (||||,||||) | |||| (||||,||||) |
BICR = blinded independent central review; CPS = combined positive score; PD-L1 = programmed death ligand 1; SD = standard deviation.
Source: Sponsor’s additional information.48
Appendix 4: Description and Appraisal of Outcome Measures
Note this appendix has not been copy-edited.
Aim
To describe the following outcome measures and review their measurement properties (validity, reliability, responsiveness to change, and MID):
EQ-5D-3L
Functional Assessment of Cancer Therapy-Gastric (FACT-Ga)
Findings
Table 36: Summary of Outcome Measures and Their Measurement Properties
Outcome measure | Type | Conclusions about measurement properties | MID |
|---|---|---|---|
EQ-5D-3L | A generic preference-based HRQoL instrument that has been applied to a wide range of health conditions and treatments. The EQ-5D-3L consists of 2 components: the descriptive system (from which the index score is generated) and the VAS. | The validation of EQ-5D-3L is available across countries around the world and in various conditions.29,49 Validity Strong correlation was observed between EQ-5D-3L and FACT-E total score (R = 0.73), as well as FACT-E subclass domains to varying degrees. Also, moderately strong correlation with ECOG scale (Spearman r = -0.65) and EQ-5D-3L HUS.50 Responsiveness EQ-5D-3L index score displayed a similar pattern as mean FACT-E and its subscale scores (P < 0.05 for time points studied). However, a ceiling effect was observed in the EQ-5D-3L index score.50 | Unknown for patients with GAC, GEJAC, or EAC. Assessed among patients with the following cancers: stage III or IV cancers of the bladder, brain, breast, colon/rectum, head/neck, liver/pancreas, kidney, lung, lymphoma, ovary, and prostate (not including esophageal cancer)51: MID (UK): 0.10 to 0.12 based on PS range and 0.09 to 0.10 based on FACT-G score MID (US): 0.07 to 0.09 grouped by PS and 0.06 to 0.07 grouped by FACT-G score MIDs for VAS: 8 to 12 using PS and 7 to 10 using FACT-G quintiles |
FACT-Ga | A cancer-specific, preference-based HRQoL instrument with 5-point Likert-type scale that can be applied to a variety of tumour types. Higher scores correspond to better quality of life.31 The FACT-Ga combines the FACT-G and a 19-item gastric cancer subscale capturing specific HRQoL aspects related to gastric cancers. The FACT-G consists of 27 items in 4 subscale domains - physical, social/family, emotional, and functional well-being. Total FACT-G score and individual subclass domain score is possible. In addition, the core measure can be supplemented with Additional Concerns subscales, which contain disease-, treatment-, or condition-specific items. | The FACT-Ga is a well-studied HRQoL scoring measure that has been validated and is available in various languages.30,52-55 Validity Construct validity was determined by assessing the correlation between the FACT-Ga and other validated surveys, including the SF-36, and psychometric instruments, including the BDI-II, the M-CSDS, the Paulhus Deception Scale, and the STAI. There was reasonable correlation between the FACT-Ga total and subscale scores score and the other constructs, except for the social well-being subscale. The subscales of the FACT-Ga and measures of anxiety and depression were negatively correlated. There were no clear correlations between the FACT-Ga and measures of social desirability.30 Reliability Internal consistency of total FACT-Ga and subscales was acceptable with Cronbach α scores > 0.70. test-retest reliability was also acceptable with ICC scores > 0.70 for the total FACT-Ga and subscales.30 Responsiveness FACT-Ga was able to detect changes in patient’s HRQoL; in particular, responsiveness was statistically significant in the total FACT-Ga and the physical well-being and gastric cancer subscales. In addition, the FACT-Ga was most responsive among patients whose conditions showed deterioration compared to patients who did not change or improved.30 | Among patients with gastric cancer30: MID for total FACT-Ga score: change in 15.1 to 22.6 points MIDs for the gastric cancer subscale: change in 8.2 to 12.3 points |
BDI-II, Beck Depression Inventory-II; ECOG = the Eastern Cooperative Oncology Group; FACT-E = Functional Assessment of Cancer Therapy – Esophageal; FACT-G = Functional Assessment of Cancer Therapy – General; FACT-Ga = Functional Assessment of Cancer Therapy – Gastric; FACT-G7 = Functional Assessment of Cancer Therapy – General 7;; HRQoL = health-related quality of life; HUS = health utility scores; ICC = intraclass correlation coefficient; M-CSDS = Marlowe-Crown Social Desirability Scale; MID = minimal important difference; PS = performance status; PSR = performance status rating; SF-6D = (EQ-5D) Short-Form 6-Dimension questionnaire; STAI = State-Trait Anxiety Inventory; VAS = visual analogue scale.
EQ-5D-3L
The EQ-5D-3L is a generic preference-based HRQoL instrument that has been applied to a wide range of health conditions and treatments.29,49 The first of 2 parts of the EQ-5D-3L is a descriptive system that classifies respondents (aged ≥ 12 years) into one of 243 distinct health states. The descriptive system consists of the following 5 dimensions: mobility, self-care, usual activities, pain/discomfort, and anxiety/depression. Each dimension has 3 possible levels (1, 2, or 3) representing ‘no problems,’ ‘some problems,’ and ‘extreme problems,’ respectively. Respondents are asked to choose one level that reflects their own health state for each of the 5 dimensions. A scoring function can be used to assign a value (EQ- 5D-3L index score) to self-reported health states from a set of population-based preference weights.29,49 The second part is a vertical, calibrated 20 cm VAS (EQ VAS) that has end points labelled 0 and 100, with respective anchors of ‘worst imaginable health state’ and ‘best imaginable health state,’ respectively. Respondents are asked to rate their own health by drawing a line from an anchor box to the point on the EQ VAS which best represents their own health on that day. Hence, the EQ-5D-3L produces 3 types of data for each respondent:
A profile indicating the extent of problems on each of the 5 dimensions represented by a 5-digit descriptor, such as 11121, 33211
A population-preference-weighted health index score based on the descriptive system
A self-reported current health status based on the EQ VAS that is used to assess the overall health of the respondent rather than selected dimensions of individuals’ health
The EQ-5D-3L index score is generated by applying a multi-attribute utility function to the descriptive system. Different utility functions are available that reflect the preferences of specific populations (e.g., US or UK). The lowest possible overall score (corresponding to severe problems on all 5 attributes) varies depending on the utility function that is applied to the descriptive system (e.g., −0.59 for the UK algorithm and −0.109 for the US algorithm). Scores less than 0 represent health states that are valued by society as being worse than dead, while scores of 0 and 1.00 are assigned to the health states ‘dead’ and ‘perfect health,’ respectively.
Validity
Doherty et al.50 analyzed 119 patients with histologically confirmed EC and gastroesophageal junction cancer (Siewert I/II) of all disease stages at ambulatory clinics in a cross-sectional survey study and a real-world setting. Bivariate Spearman correlation and multivariable linear regression analyses characterized associations between the various EC subscales (FACT-E), scales, and the FACT-E derived symptom complexes with EQ-5D-3L derived index scores. A strong correlation was observed between EQ-5D-3L and FACT-E (R = 0.73): the strongest correlation observed with the physical well-being (PWB) subscale, followed in descending order by functional well-being (FWB), esophageal-specific symptoms, emotional well-being (EWB), and social well-being (SWB) subscales. In addition, the association between FACT-E and EQ-5D-3L was maintained in a multivariable model (β of 0.0044, P < 0.001). Lastly, moderately strong correlation was also seen between a self-reported performance status based on the ECOG scale (Spearman r = -0.65) and EQ-5D-3L index score.
Reliability
There is insufficient data to assess reliability of EQ-5D-3L in the setting of GAC, GEJAC, or EAC.
Responsiveness to Change
Doherty et al.50 analyzed the same sample in longitudinal follow-up surveys at baseline and predetermined subsequent visits, i.e., pre-treatment, during chemoradiotherapy, and post-treatment (within the first 6 months following definitive chemoradiotherapy or surgery), surveillance (more than 6 months from definitive treatment without relapse or progression), progression, and palliative chemotherapy. EQ-5D-3L index score displayed a similar pattern as mean FACT-E and subscale scores, which dropped from baseline through treatment and recovered during post-treatment surveillance (P < 0.001), but with smaller differences (P = 0.07). In addition, the ceiling effect was observed in the EQ-5D-3L index score. Briefly, among patients with stage II/III EC, mean EQ-5D-3L index score varied across disease states (P < 0.001), along with FACT-E and subscales (P < 0.001). Among patients with advanced disease, there was no significant difference between baseline and on-treatment total scores of EQ-5D-3L, but improved EC subscale scores were noted (P = 0.003). Overall, the observed differences in mean EQ-5D-3L index score across cancer stages and disease states suggests some sensitivity to change in clinical circumstances.
Clinical Relevance
There is insufficient information regarding the estimated MIDs for GAC, GEJAC, or EAC.
Pickard et al.51 conducted a retrospective analysis on cross-sectional data collected from 534 cancer patients with 11 types of cancer, including stage III or IV cancers of the bladder, brain, breast, colon/rectum, head/neck, liver/pancreas, kidney, lung, lymphoma, ovary, and prostate. A range of MIDs in EQ-5D index-based utility (UK and US) scores and VAS scores were estimated using both anchor-based (ECOG PS and FACT-G total score-based quintiles) and distribution-based (0.5 SD and standard error of the measure) approaches. Important differences in EQ-5D utility and VAS scores were similar for all cancers (not including EC). For UK-utility scores, MID estimates based on PS ranged from 0.10 to 0.12 and from 0.09 to 0.10 using FACT-G quintiles for all cancers (not including EC). For US-utility scores, MIDs ranged from 0.07 to 0.09 grouped by PS and when based on FACT-G quintiles, MIDs were 0.06 to 0.07 in all cancers (not including ECs). MIDs for VAS scores ranged from 8 to 12 (PS) and 7 to 10 (FACT-G quintiles).
Other Considerations and Limitations
One limitation of the EQ-5D-3L was a significant ceiling effect, and left skew of the data; for example, EQ-5D-3L may be more useful in a population with worse overall health status. Further, though the EQ-5D-3L may be an adequate tool to summarize HRQoL, responsiveness to change may still be better captured using a more disease-specific tool such as FACT-E.50 In addition, there is a lack of data for VAS to assess its validity in the setting of esophageal cancer.
Functional Assessment of Cancer Therapy – Gastric (FACT-Ga)
The FACT-G is a self-administered, disease-specific, HRQoL measure for patients with any tumour type who are 18 years and older. The FACT-G is a 27-item instrument containing 4 subscales: PWB (7 items), FWB (7 items), SWB (7 items), and EWB (6 items) on a 5-point Likert-type scale ranging from 0 (not at all) to 4 (very much) with a recall period of the past 7 days. Negatively-worded items are reverse scored so that higher scores always represent better quality of life or less severe symptoms. Responses are summed to create a total FACT-G score and individual subscale scores. The highest possible score is 28 for the PWB, SWB, and FWB subscales, 24 for the EWB subscale, and 108 for the FACT-G total score. The core measure can be supplemented with Additional Concerns subscales, which contain disease-, treatment -, or condition-specific items. The most recent version of FACT-G is v.4.31
The FACT-Ga is a disease-specific tool to measure the HRQoL of patients with gastric malignancies. The gastric specific version of the tool combines the items from the FACT-G with a 19-item GaCS; the GaCS was developed to capture specific HRQoL concerns pertaining to GCs. Therefore, the FACT-Ga consists of a total of 46 items.
Validity
The validity of the FACT-Ga was assessed by Garland et al.30 in an English-speaking population using a longitudinal study design where patients who were referred by their treating surgeon or oncologist were assessed at baseline, and 2-week and 3-month time points. Patients were adults (≥ 18 years) with gastric adenocarcinoma, clinically stable and a minimum of 1 month post-diagnosis or 2 months post-surgery. A total of 82 patients were enrolled who had local disease (25%), regional spread (45%), and distant spread (18%), were diagnosed with stage I (21%), II (15%), III (24%) and IV (39%) disease, and had a Karnofsky PS (KPS) of 100 (11%), 80 to 90 (55%), or 60 to 70 (27%). Approximately half (48%) of the patients had received chemotherapy, and 28% of patients received radiation therapy. Most patients had received a total gastrectomy (48%) or subtotal gastrectomy (35%), while the remaining patients were inoperable for surgery (12%) or bypass surgery (4%). Validation of the FACT-Ga was based on completion of the Medical Outcomes Study 36-item Short-Form Health Survey (SF-36) and psychometric instruments including the Beck Depression Inventory-II and the Marlow-Crown Social Desirability Scale, and the Paulhus Deception Scale, and the State-Trait Anxiety Inventory. The construct validity of the FACT-Ga was determined by how the questionnaire related to other questionnaires mentioned here and to measures of related states including depression and anxiety. All subscales, except for the SWB subscale, demonstrated reasonable correlation with other constructs (Pearson correlation coefficients of 0.381 to 0.737). GaCS and the total FACT-Ga also demonstrated reasonable correlation with other constructs. The total FACT-Ga and all subscales were all negatively correlated with measures of anxiety and depression which was expected. All subscales as well as the total FACT-Ga were unrelated to measures of social desirability.
Reliability
The FACT-Ga was initially designed as part of a pilot project aimed at refining the contents and constructing the scales incorporated in the tool; it was tested among a group of Canadian (n = 10) and Japanese (n = 20) patients with GC. The final 19 items incorporated into the FACT-Ga were reported to have a Cronbach α of 0.93 in the English-speaking group and 0.84 in the Japanese speaking group.30,55 A study by Garland et al., 201130 assessed the internal consistency and test-retest reliability of the FACT-Ga. All subscales of the questionnaire, other than the EWB subscale, demonstrated acceptable internal consistency as the Cronbach alpha scores were > 0.70. The GaCS of the FACT-G and the total FACT-Ga demonstrated good internal consistency with Cronbach α scores of 0.864 and 0.811, respectively. The test-retest reliability was also demonstrated to be good as intraclass correlation (ICC) scores were all > 0.70 for subscales (PWB subscale: ICC = 0.777; SWB subscale: ICC = 0.580; EWB subscale: ICC = 0.638; FWB subscale: ICC = 0.842), the GaCS (ICC = 0.877) and the total FACT-Ga (ICC = 0.885).
Responsiveness to Change
The sensitivity to change of the FACT-Ga score was assessed by Garland et al., 201130 using a 5-point scale for patient-centred global ratings of changes in HRQoL with the following benchmarks: −2, much worse; −1, somewhat worse; 0, no change, +1, somewhat better; +2, much better. A score of ±1 was considered a small change while a score of ±2 was considered a large change. The KPS scores were assessed along side their scores on the FACT-Ga which assumed that changes in KPS would translate to changes in HRQoL scores measured using the FACT-Ga; should no change in the FACT-Ga be observed despite changes in KPS, the authors would conclude that the questionnaire was not sensitive enough. Sensitivity to change was also assessed by comparing changes in the FACT-Ga scores to self-reported scores of HRQoL. Univariate analysis by Garland et al., 2011 revealed that patient rated changes in global QoL and changes in the FACT-Ga subscale were statistically significant for the PWB subscale (P = 0.030), the GaCS (P = 0.041), and the total FACT-Ga (P =.022); therefore, the perceptions of HRQoL as rated by patient were correlated with scores in the FACT-Ga. Changes in KPS as determined by patients’ physicians which indicated patient deterioration were also correlated with greater change in the PWB, FWB, and gastric subscale scores as well as the FACT-Ga total scores compared to patients whose KPS did not change or improved. Univariate analysis revealed statistically significant correlations between KPS and changes in HRQoL for the PWB (P < 0.001), FWB (P < 0.001), and GaCSs (P < 0.001), as well as the total FACT-Ga (P < 0.001).
Clinical Relevance
Regression analysis was conducted by Garland et al., 201130 to determine MID scores which indicated the smallest difference in scores which would be perceived as important for patients on the FACT-G, GaCS, and the FACT-Ga; using this analysis r2 values were used to assess the strength of the correlation between scores on the questionnaire and changes in HRQoL for patients with GCs. The r2s values were 0.37 for the FACT-G, 0.44 for the GaCS, and 0.41 for the total FACT-Ga. Therefore, it was determined that the FACT-G, the GC subscale, and the FACT-Ga were all good predictors of change in HRQoL of patients with GC. For the FACT-G, no change was indicated by a mean change in score of 3.9 (95% CI, 2.6 to 5.2), a small change was indicated by a mean change in score of 7.8 (95% CI, 5.2 to 10.5) while a large change was indicated by a mean change in score of 11.8 (95% CI, 7.8 to 15.7). For the GaCS, no change was indicated by a mean chance in score of 4.1 (95% CI, 2.9 to 5.3), a small change was indicated by a mean change in score of 8.2 (95% CI, 5.9 to 10.6) while a large change was indicated by a mean change in score of 12.3 (95% CI, 8.8 to 15.9). For the total FACT-Ga, no change was indicated by a mean chance in score of 7.5 (95% CI, 5.2 to 9.9), a small change was indicated by a mean change in score of 15.1 (95% CI, 10.4 to 19.5) while a large change was indicated by a mean change in score of 22.6 (95% CI, 15.6 to 29.6).
Other Considerations and Limitations
It was noted in the study by Garland et al., 201130 that the FACT-Ga was most sensitive to change on the physical, functional, disease-specific, and total scores; based on these findings, the authors concluded that the FACT-Ga may be more likely to capture overt changes in HRQoL versus social and emotional constructs. In addition, the FACT-Ga was most sensitive among patients who experienced deterioration in their condition compared to patients who showed no change or improvement. It should be noted that the GaCS has not been validated as a stand-alone subscale; therefore, results that are reported only for the subscale should be interpreted with caution.
In addition to the above study by Garland et al., 2011,30 the FACT-Ga was also validated in 75 patients from 5 Spanish-speaking countries,52 67 Chinese-speaking patients from Singapore,54 and 156 Japanese patients.53 The FACT-Ga should be validated separately if used in other populations.
Pharmacoeconomic Review
Abbreviations
AE
adverse event
BIA
budget impact analysis
CPS
combined positive score
EAC
esophageal adenocarcinoma
FEP
5-fluorouracil plus epirubicin plus cisplatin
FOLFIRI
5-fluorouracil plus irinotecan and leucovorin
FOLFOX
5-fluorouracil plus oxaliplatin and leucovorin
GAC
gastric adenocarcinoma
GEJAC
gastroesophageal junction adenocarcinoma
HER2
human epidermal growth factor receptor
ICER
incremental cost-effectiveness ratio
KM
Kaplan-Meier
LY
life-year
OS
overall survival
PD-L1
programmed death-ligand 1
PFS
progression-free survival
PSM
partitioned survival model
QALY
quality-adjusted life-year
TTD
time to treatment discontinuation
WTP
willingness-to-pay
XELOX
capecitabine in combination with oxaliplatin
Executive Summary
Item | Description |
|---|---|
Drug product | Nivolumab (Opdivo; single-use vial for injection), to be used with fluoropyrimidine- and platinum-containing chemotherapy |
Submitted price | Nivolumab, 10 mg per mL, solution: $19.55 per mg ($782.22 per 40 mg vial) Nivolumab, 10 mg per mL, solution: $19.55 per mg ($1,955.56 per 100 mg vial) |
Indication | Proposed: Opdivo, in combination with fluoropyrimidine- and platinum-containing chemotherapy, is indicated for the treatment of adult patients with HER2-negative advanced or metastatic gastric, gastroesophageal junction, or esophageal adenocarcinoma. A positive association was observed between PD-L1 CPS and the magnitude of the treatment benefit. |
Health Canada approval status | Under review (pre-NOC) |
Health Canada review pathway | Other expedited pathway – Project Orbis |
NOC date | October 28, 2021 |
Reimbursement request | As per indication |
Sponsor | Bristol Myers Squibb Canada |
Submission history | Previously reviewed: Yes Nivolumab (Opdivo) has been reviewed and is currently under review for multiple indications at CADTH. The following indications were reviewed in 2020 or are ongoing in 2021:
|
CPS = combined positive score; HER2 = human epidermal growth factor receptor; NOC = Notice of Compliance; PD-L1 = programmed death-ligand 1.
Table 2: Summary of Economic Evaluation
Component | Description |
|---|---|
Type of economic evaluation | Cost-utility analysis Partitioned survival model |
Target population(s) | Adult patients (aged 18 years and older) with HER2-negative advanced or metastatic gastric, gastroesophageal junction, or esophageal adenocarcinoma; aligns with reimbursement request |
Treatments | Nivolumab in combination with XELOX or FOLFOX |
Comparators |
|
Perspective | Canadian publicly funded health care payer |
Outcomes | QALYs, LYs |
Time horizon | Lifetime (25 years) |
Key data source | CheckMate 649 trial was used to inform parameter values for progression-free survival, overall survival, time to discontinuation, and health state utility |
Submitted results |
|
Key limitations |
|
CADTH reanalysis results |
|
5-FU = 5-fluorouracil; FEP = 5-FU plus epirubicin plus cisplatin; FOLFIRI = 5-FU plus irinotecan and leucovorin; FOLFOX = 5-FU plus oxaliplatin and leucovorin; HER2 = human epidermal growth factor receptor; ICER = incremental cost-effectiveness ratio; KM = Kaplan-Meier; LY = life-year; QALY = quality-adjusted life-year; WTP = willingness-to-pay; XELOX = capecitabine + oxaliplatin.
Conclusions
The CADTH Clinical Review found that evidence from the CheckMate 649 trial indicated that, compared to 5-fluorouracil plus oxaliplatin and leucovorin (FOLFOX) or capecitabine plus oxaliplatin (XELOX) alone, first-line treatment with nivolumab plus FOLFOX or XELOX showed a clinically meaningful and statistically significant overall survival (OS) and progression-free survival (PFS) benefit in adult patients with HER2-negative advanced or metastatic gastric adenocarcinoma (GAC), gastroesophageal junction adenocarcinoma (GEJAC), and esophageal adenocarcinoma (EAC), based on the data currently analyzed.1 As the study is ongoing, additional long-term efficacy and safety information are anticipated.
CADTH identified several limitations in the sponsor’s economic analysis, specifically, the uncertainty associated with the long-term efficacy of nivolumab, the choice of extrapolation of survival curves beyond the follow-up period of the clinical trial, inclusion of comparators that are not relevant in a Canadian context, and exclusion of pembrolizumab as a comparator. CADTH undertook a reanalysis by removing irrelevant comparators; using public listed prices for prices oxaliplatin, leucovorin, irinotecan, ramucirumab, and paclitaxel; setting dose intensity levels to 100%; using Kaplan-Meier (KM) data for the on-trial period of the economic evaluation; and using alternative parametric survival extrapolation to match clinical expectation and to account for a potential treatment-waning effect over the long term.
Although CADTH’s base case resulted in a higher incremental cost-effectiveness ratio (ICER) than the sponsor’s base case, when nivolumab plus FOLFOX or XELOX was compared to FOLFOX or XELOX ($398,312 per QALY), both analyses suggested that nivolumab in combination with chemotherapy was associated with higher costs and improved quality-adjusted life-years (QALYs) but was not cost-effective at a $50,000 per QALY willingness-to-pay (WTP) threshold compared to FOLFOX or XELOX. Based on publicly available list prices for all comparators, a price reduction of at least 95% would be required to make nivolumab an optimal treatment option at this WTP threshold. The cost-effectiveness of nivolumab plus FOLFOX or XELOX was highly sensitive to patient programmed death-ligand 1 (PD-L1) status, and to statistical approaches used to fit the OS data. However, under all modelled scenarios, nivolumab plus FOLFOX or XELOX was not cost-effective at a $50,000 per QALY threshold.
Stakeholder Input Relevant to the Economic Review
This section is a summary of the feedback received from the patient groups, registered clinicians, and drug plans that participated in the CADTH review process — specifically, information that pertains to the economic submission.
Patient input from caregivers (n = 31) and patients (n = 31) with gastric cancer (74.2%) or esophageal and/or gastroesophageal cancer (25.8%) was received from My Gut Feeling – Stomach Cancer Foundation of Canada, collected via an online international survey. Most respondents were women (79.0%), ranging in age from 20 to 81 years and older, and residing in Canada (n = 39, 62.9%) and the US (n = 18, 29.0%). The participants had adenocarcinoma (82.3%) and squamous cell carcinoma (14.2%), of whom 9.7% were diagnosed with stage I cancer, 9.7% with stage II, 25.8% with stage III, and 25.8% with stage IV; the remainder were unaware of the diagnosed stage. Most reported disease symptoms were change in appetite, weight loss, pain, reflux, nausea/vomiting, and trouble swallowing. Cancer diagnosis had a significant impact on quality of life, affecting physical and mental health, eating, working, finances, social life, identity, and personal image. Treatments included chemotherapy (83.9%), surgery (69.4%), radiation therapy (27.4%), chemo-radiation (8.1%), immunotherapy (25.8%), and alternative therapies (5.1%). Most respondents reported improvement in symptoms under standard care, with side effects such as fatigue (88.0%), weight loss (71.0%), appetite changes (67.7%), taste changes (69.4%), nausea/vomiting (64.5%), diarrhea (62.9%), alopecia (59.7%), brain fog (58.1%), constipation (48.4%), neuropathy (45.2%), and abdominal pain (41.9%) significantly affecting quality of life. While 38.7% of patients were able to tolerate treatment as prescribed, 14.5% had to stop treatment because of being hospitalized for an adverse event, 12.9% had a dose reduction, and 8.1% had to delay or skip a treatment cycle. Patients expressed a desire for new treatments that improved quality of life, were more convenient (requiring less frequent visits to the hospital), and accessible. Patients accessed treatments through publicly funded health care, private insurance, drug access programs, Access to Hope, personal savings, or donations, with 22.6% of respondents paying for some or all their treatment. Respondents noted immunotherapy was not covered by universal health care or insurance and was commonly paid for out-of-pocket, costing $6,000 to $10,000 per month. Twelve patients had direct experience with nivolumab; all agreed that nivolumab was more tolerable than previous treatments and improved quality of life. Some patients reported being satisfied with nivolumab because of its treatment convenience, disease control, and minimal side effects. Of the 12 patients, 5 experienced fatigue after receiving nivolumab; 3 reported muscle, bone, and joint pain; and 2 reported shortness of breath, constipation, and loss of appetite.
Clinician input was received from Ontario Health (Cancer Care Ontario), the Gastrointestinal Cancer Drug Advisory Committee, the Canadian Gastrointestinal Oncology Evidence Network, and other gastroesophageal cancer-treating physicians. The current pathway of care for patients includes first-line treatment with fluoropyrimidine- and platinum-containing chemotherapy (FOLFOX and 5-fluorouracil plus irinotecan and leucovorin [FOLFIRI]), or capecitabine and oxaliplatin (XELOX). Second-line treatment includes a taxane (docetaxel, paclitaxel) with or without ramucirumab. Third-line treatment includes irinotecan or trifluridine and tipiracil for patients with metastatic gastric or gastroesophageal junction cancer. The treatment algorithm is similar for patients with esophageal adenocarcinoma, but ramucirumab is not used in second-line treatment. Clinicians noted some treatment gaps, specifically, that not all patients respond to available systemic treatments, especially those with HER2-negative cancer (85% of patients). Median survival has not surpassed 1 year with therapy; patients have short duration of response and become refractory to current treatment options; and survival is limited even in patients who demonstrate a response. Clinicians also noted that nivolumab will be an addition to currently available treatment in the first-line setting, especially for patients with HER2-negative disease, and that tumours with a PD-L1 combined positive score (CPS) score of 5 or higher seem to derive a greater benefit.
The drug plans noted that jurisdictions will implement weight-based dosing, up to a maximum dosage of 240 mg every 2 weeks or 360 mg every 3 weeks. The drug plans also noted some relevant comparators; some patients may be receiving pembrolizumab through enrolment in special access programs, and a subset of the population may be receiving FOLFIRI treatment.
The following concerns were addressed in the sponsor's economic model:
A subgroup analysis for patients with PD-L1 status CPS of 5 or higher and CPS 1 or higher was conducted by the sponsor.
In addition, CADTH addressed the following concerns:
Clinicians noted that very few patients would receive capecitabine-containing therapies.
CADTH was unable to address the following concern raised from stakeholder input:
Drug plans noted pembrolizumab is available to some patients through access programs and should be included as a comparator.
Economic Review
The current review is for nivolumab (Opdivo) plus chemotherapy for first-line treatment of HER2-negative advanced or metastatic GAC, GEJAC, or EAC.
Economic Evaluation
Summary of Sponsor’s Economic Evaluation
Overview
The sponsor submitted a cost-utility analysis comparing costs and outcomes for nivolumab in combination with either FOLFOX (5-fluorouracil, oxaliplatin, and leucovorin) or XELOX (capecitabine and oxaliplatin) for the first-line treatment of adult patients with HER2-negative advanced or metastatic GAC, GEJAC, or EAC. Comparators included FOLFOX, XELOX, FOLFIRI (a combination of irinotecan, leucovorin, and 5-fluorouracil), capecitabine plus cisplatin, cisplatin plus 5-fluorouracil, and 5-fluorouracil plus epirubicin plus cisplatin (FEP). The modelled population was in line with the reimbursement request and requested Health Canada indication.
Nivolumab is available as a solution for infusion (40 mg/4 mL vial and 100 mg/10 mL vial). The recommended dosage depends on the chemotherapy prescribed. For patients assigned to nivolumab plus FOLFOX, the recommended dosage is nivolumab 3 mg/kg (up to 240 mg) every 2 weeks in combination with oxaliplatin 85 mg/m2, leucovorin 400 mg/m2, and 5-fluorouracil 400 mg/m2 administered on day 1 of each treatment cycle of 2 weeks and 5-fluorouracil 1,200 mg/m2 over 24 hours daily on days 1 and 2 of each treatment cycle. Patients assigned to nivolumab plus XELOX received nivolumab 4.5 mg/kg (up to 360 mg) every 3 weeks in combination with oxaliplatin 130 mg/m2 and capecitabine 1,000 mg/m2 administered orally twice daily on days 1 to 14 of each treatment cycle.
At the submitted price of $782.22 per 4 mL vial, the average 28-day cost of nivolumab was estimated to be $9,387, assuming 100% dose intensity. When used in combination with FOLFOX or XELOX, the average 28-day regimen cost was $10,618 and $9,833, respectively. The average 28-day cost was $1,231 for FOLFOX, $447 for XELOX, $745 for cisplatin plus capecitabine, $1,006 for FOLFIRI, $199 for FEP, and $232 for cisplatin plus 5-fluorouracil.2
Clinical outcomes were QALYs and life-years (LYs). The economic analysis was undertaken over a time horizon of 25 years, from the perspective of a Canadian publicly funded health care system. Costs and QALYs were discounted at a rate of 1.5% per annum.2
Model Structure
The sponsor submitted a partitioned survival model (PSM) with 3 health states: progression-free, progressive disease, and death (Appendix 3; Figure 1). The proportion of progression-free patients who experienced progressive disease or who were dead at any time over the model horizon was derived from non–mutually exclusive survival curves. All patients entered in the progression-free state and were assumed to receive treatments until disease progression and/or the development of treatment-limiting or treatment-related adverse events (AEs). Patients could discontinue treatment but remain in the progression-free health state based on the time-on-treatment curve, and, upon discontinuation, the cost of treatment would no longer be incurred. At the end of each weekly cycle, the proportion of patients with progressive disease or death was derived based on the area under the survival curves. Specifically, OS was partitioned to estimate the proportion of patients in the death state, while PFS was used to estimate the proportion of patients in the progression-free health state. The difference between the OS curve and PFS curve was partitioned at each time point to estimate the proportion of patients in the progressive disease health state.
Model Inputs
The modelled population reflected the baseline characteristics of the population enrolled in CheckMate 649 trial, a global randomized, open-label, multi-centre phase III study of nivolumab plus chemotherapy and nivolumab plus ipilimumab versus chemotherapy alone, in first-line treatment of patients with HER2-negative advanced or metastatic GAC, GEJAC, or EAC. Based on the CheckMate 649 enrolment, the submitted model assumed that 30.4% of the population were women, mean age of ||||||| years, mean body surface area of ||||||||, and mean weight of ||||||| kg.2
PFS, OS, and time to treatment discontinuation (TTD) curves for nivolumab plus FOLFOX or XELOX were generated using patient-level data from the CheckMate 649 trial (data cut-off date: February 2021). The sponsor used parametric models to extrapolate PFS and OS beyond trial follow-up. For PFS, KM data from the CheckMate 649 trial were used to fit an independent log-logistic parametric survival model. Similarly, OS KM data were used to fit a log-logistic model to patient-level data to inform long-term extrapolation. For TTD, KM data were used to fit an independent gamma, which was used for extrapolation. This distribution was selected based on visual inspection, clinical plausibility, and model fit statistics.2
Health utility values were based on descriptive analysis of the EuroQol 5-Dimensions 3-Levels questionnaire data from CheckMate 649. The analysis assumed the same utility values for each health state, irrespective of the treatment arm. Health utilities were adjusted for age. AE decrements were calculated by multiplying disutility value by the duration of AEs. Disutility values for each AE were based on the literature.
Costs included drug (acquisition, administration, monitoring), disease management (progression-free and progressive disease health states), AEs, subsequent treatments, and terminal care. Cost inputs from previous years were inflated to 2021 values using the health care component of the consumer price index. Drug acquisition costs were based on previous submissions to CADTH. Administration costs were based on the Ontario Health Insurance Plan’s Schedule of Benefits. Treatment regimens for different first-line treatments were sourced from Cancer Care Ontario. Relative dose intensity, defined as the ratio between the administered doses and the prescribed doses within a year, was applied to account for situations in which patients do not receive the correct dose or AEs prevent the correct dose from being administered. Assumed dose intensities ranged from 85% to 100%. For the base-case analysis, nivolumab was administered with vial sharing and an assumed 5% wastage. Scenario analyses conducted by the sponsor included no vial sharing and full vial sharing. The maximum duration of treatment with nivolumab was assumed to be 24 months.2
The model also considered the costs of subsequent therapies among patients who discontinued first-line treatment. The proportion of patients receiving different subsequent treatments after discontinuation of either nivolumab plus FOLFOX or XELOX, or FOLFOX or XELOX alone, were based on subsequent treatments observed in CheckMate 649. For other comparator chemotherapy regimens, the proportion was assumed to be the same as the FOLFOX or XELOX arm in CheckMate 649. The model also considered disease management costs, including CT scans, full blood counts, renal function tests, hepatic function tests, and medical consultations. Unit costs for resource use elements were obtained from the Ontario Health Insurance Plan’s Schedule of Benefits. Costs for each AE were obtained from the published literature. Terminal care costs were applied to patients who transitioned to the death health state; the cost estimate was obtained from an economic evaluation study by Oliveira et al. (2016),3 which reported the end-of-life costs due to gastric cancer in the last 12 months before death.2
Summary of Sponsor’s Economic Evaluation Results
All analyses were run probabilistically, with 1,000 iterations. The deterministic and probabilistic results were different due to slightly higher reported QALYs for comparators, which leads to a large difference in ICERs. To err on the side of caution, we have included the sponsor’s probabilistic analysis, as it is more conservative.
Base-Case Results
Nivolumab plus FOLFOX or XELOX was associated with an ICER of $619,128 per QALY compared to FEP over a 25-year time horizon (Table 3).
The FOLFOX or XELOX comparator, which is the current standard clinical practice, and 5-fluorouracil plus cisplatin, were dominated by capecitabine plus cisplatin, FOLFIRI, and FEP, as they were more costly and generated the same QALYs.2 The pairwise ICER for nivolumab plus FOLFOX or XELOX, versus FOLFOX or XELOX alone, was $184.174 per QALY. At a WTP of $50,000 per QALY, the probability of nivolumab plus FOLFOX or XELOX being cost-effective was 0% when compared to the most cost-effective comparator (i.e., FEP).
The main cost driver was drug acquisition cost, followed by drug administration cost and subsequent treatment cost. Nivolumab plus FOLFOX or XELOX was associated with 0.36 additional LYs compared with FEP. At the end of the model time horizon, the model estimated that around 0.58% of the patients were alive in the nivolumab plus FOLFOX or XELOX group, compared to 0.15% in the FOLFOX or XELOX alone group.
Table 3: Summary of the Sponsor’s Economic Evaluation Results
Drug | Total costs ($) | Total QALYs | Sequential ICER ($/QALY) |
|---|---|---|---|
Capecitabine + cisplatin | 73,457 | 1.15 | Reference |
FOLFIRI | 74,738 | 1.32 | 7,350 |
FEP | 76,992 | 1.40 | 28,483 |
Nivolumab + FOLFOX or XELOX | 179,545 | 1.57 | 619,128 |
5-FU = 5-fluorouracil; FEP = 5-FU plus epirubicin plus cisplatin; FOLFIRI = 5-FU plus irinotecan and leucovorin; FOLFOX = 5-FU plus oxaliplatin and leucovorin; ICER = incremental cost-effectiveness ratio; QALY = quality-adjusted life-year; XELOX = capecitabine plus oxaliplatin.
Note: Only treatments that are on the efficiency frontier are reported in the main body. 5-fluorouracil plus cisplatin and XELOX or FOLFOX were dominated by capecitabine plus cisplatin, FOLFIRI, and FEP. Note that sponsor’s base-case ICER for nivolumab plus FOLFOX or XELOX, versus FOLFOX or XELOX alone, was $184.174 per QALY.
Source: Sponsor’s pharmacoeconomic submission.2
Sensitivity and Scenario Analysis Results
The sponsor performed scenario analyses by considering alternative parametric survival models, flat-dosing regimen for nivolumab instead of weight-based dosing, using linear mixed-model utility values, using mean body weight and surface area for the Canadian population instead of the population in CheckMate 649, and using alternative time horizon or discount rates. Cost-effectiveness results for nivolumab in plus FOLFOX or XELOX, versus FOLFOX or XELOX alone, were robust to changes in most parameters and assumptions. Sensitivity and scenario analysis results were not provided for other comparators, namely, capecitabine plus cisplatin, FOLFIRI, and FEP. The scenarios with the greatest impact on the ICER were alternative parametric functions for modelling PFS, TTD, and OS, which increased the ICER for nivolumab plus FOLFOX or XELOX, versus FOLFOX or XELOX alone, to $356,494 per QALY.2
A deterministic subgroup analysis of patients with PD-L1 status CPS of 5 or higher and CPS of 1 or higher showed improved ICER compared with the sponsor’s base case. ICER for nivolumab plus FOLFOX or XELOX, versus FOLFOX or XELOX alone, was $153,604 per QALY for PD-L1 status CPS of 5 or higher and $174,618 per QALY for PD-L1 status CPS of 1 or higher.2
CADTH Appraisal of the Sponsor’s Economic Evaluation
CADTH identified several key limitations to the sponsor’s analysis that have notable implications for the economic analysis:
Inclusion of comparators that do not reflect current practice in Canada: The clinical expert consulted by CADTH confirmed that most Canadian patients receive FOLFOX as the first-line therapy for this indication, with a smaller proportion receiving XELOX. Other comparator treatments included in the sponsor’s analysis — capecitabine plus cisplatin, FEP, and cisplatin plus 5-fluorouracil — were not considered to be part of standard management for this disease. CADTH excluded capecitabine plus cisplatin, cisplatin plus 5-fluorouracil, and FEP as comparators in the analysis. CADTH excluded FOLFIRI from the base case and considered it in scenario analysis.
Uncertainty in the long-term survival benefits of nivolumab: Although clinical experts consulted by CADTH agreed that nivolumab plus chemotherapy resulted in a clinically meaningful benefit for patients with HER2-negative advanced or metastatic GAC, GEJAC, or EAC, the long-term extrapolation of both nivolumab plus chemotherapy and the chemotherapy arms were highly uncertain. Meaningful uncertainty was contributed by the fact that the sponsor’s economic model was based on the results of interim analyses, and that the timeline of the economic analysis (25 years) by far exceeds the duration of the trial. Further, the CADTH Clinical Review found no evidence to support long-term survival benefits associated with nivolumab compared to chemotherapy. Clinical experts consulted by CADTH noted that predicted 3-year OS rates in the sponsor’s base case were likely overestimated, suggesting that the sponsor’s base-case extrapolation assumption (log-logistic) was overly optimistic and introduced bias in favour of nivolumab. Additionally, the sponsor’s model did not account for any treatment-waning effect over time, which suggests further bias in favour of nivolumab.
CADTH attempted to adjust for this in a reanalysis by using KM survival curves for a period of 33 months (based on visual inspection of the curve) and imposing an accelerated failure Weibull model for extrapolation of survival in the nivolumab plus chemotherapy group, and a 1-knot hazard spline for the chemotherapy group.
CADTH notes that the sponsor’s model lacked the flexibility to evaluate patients who had a PD-L1 CPS of 10 or higher. CADTH was not able to address this in reanalysis.
Structural uncertainty due to model choice: CADTH also noted additional uncertainty associated with the estimated survival benefits of nivolumab plus FOLFOX or XELOX due to the sponsor’s use of a PSM. Results from the sponsor's model suggested that nivolumab was associated with longer survival after progression (0.55 QALY versus 0.37 QALY with FOLFOX or XELOX; Table 11). While the pivotal trial showed a statistically significant impact of nivolumab on PFS and OS, CADTH was unable to identify a clear mechanism in the sponsor’s submitted evidence by which nivolumab would continue to provide clinical benefit after relapse. This approach introduces structural assumptions about the relationship between PFS and OS (i.e., non–mutually exclusive curves) that may produce implausible results.4 This uncertainty could not be adjusted for in CADTH’s reanalysis because of the submitted model structure. These assumptions are likely to introduce a post-progression survival bias that favours nivolumab plus FOLFOX or XELOX. CADTH was not able to estimate the full extent to which the post-PFS survival benefit estimated in the model was due to the efficacy of nivolumab plus FOLFOX or XELOX, versus FOLFOX or XELOX alone, owing to the structural bias within the model.
CADTH was not able address this limitation in reanalysis.
Relevant comparators excluded from the analysis: Pembrolizumab has been approved by Health Canada for the treatment of HER2-negative advanced or metastatic esophagogastric junction cancer and is available to some patients under special access programs, according to feedback from participating drug programs. The sponsor did not include pembrolizumab plus chemotherapy in the cost-utility analysis as a comparator.
CADTH was not able to address this in a reanalysis due to a lack of data. Consequently, the cost-effectiveness of nivolumab compared to pembrolizumab is unknown.
Additional limitations were identified but were not considered to be key limitations. These limitations are as follows:
The source for dose intensities percentages was unclear. All intensities were set at 100% in the reanalysis by CADTH.
Price values for some comparator drugs were not aligned with current public list prices.
Additionally, the following key assumptions were made by the sponsor and have been appraised by CADTH (Table 4).
Table 4: Key Assumptions of the Submitted Economic Evaluation (Not Noted as Limitations to the Submission)
Sponsor’s key assumption | CADTH comment |
|---|---|
Patient characteristics (i.e., age, sex, weight, body surface area) based on patients participating in the CheckMate 649 trial | The clinical experts consulted by CADTH found this assumption acceptable |
Maximum duration of treatment with nivolumab was assumed to be 24 months | The clinical experts consulted by CADTH found this assumption acceptable |
Proportion of patients who receive second-line treatment was based on CheckMate 649 observations for nivolumab + FOLFOX or XELOX and FOLFOX or XELOX alone | The clinical experts consulted by CADTH found this assumption acceptable |
Comparator chemotherapy regimens were assumed to have the same proportion of patients going to second-line treatments as FOLFOX or XELOX in CheckMate 649 | The clinical experts consulted by CADTH found this assumption acceptable |
Same utility values were assumed for each health state, irrespective of the treatment arm | Acceptable |
FOLFOX = 5-fluorouracil plus oxaliplatin and leucovorin; XELOX = capecitabine + oxaliplatin.
CADTH Reanalyses of the Economic Evaluation
Base-Case Results
CADTH was unable to address uncertainty resulting from exclusion of pembrolizumab as a comparator. CADTH corrected the sponsor’s model by updating drug prices based on publicly available prices of the comparator and subsequent treatments and removing comparators that do not represent current standard practice in Canada. CADTH’s base case was derived by making changes in model parameter values and assumptions, in consultation with clinical experts. CADTH’s base case assumed 100% dose intensity for all medications, used KM curves for the on-trial period, and was based on alternative survival models to extrapolate long-term OS for nivolumab plus chemotherapy and chemotherapy.
Table 5: CADTH Revisions to the Submitted Economic Evaluation
Stepped analysis | Sponsor’s value or assumption | CADTH value or assumption |
|---|---|---|
Corrections to sponsor’s base case | ||
1. Listed price (cost per mg) for comparators and subsequent treatments | Oxaliplatin: $10.200 per mg Leucovorin: $0.050 per mg 5-FU: $0.030 per mg Irinotecan: $0.500 per mg Ramucirumab: $9.094 per mg Paclitaxel: $9.710 per mg | Oxaliplatin: $0.725 per mg Leucovorin: $0.149 per mg 5-FU: $0.032 per mg Irinotecan: $0.081 per mg Ramucirumab: $6.201 per mg Paclitaxel: $10.000 per mg |
2. Removal of excluded comparators | FOLFIRI, capecitabine + cisplatin, cisplatin + 5-FU, FOLFOX or XELOX and FEP as comparators | FOLFOX or XELOX as comparator |
Changes to derive the CADTH base case | ||
1. Use KM curves for on-trial period | Parametric survival used for entire follow-up period | KM curves were used for the first 33 months for which trial data were available |
2. Alternative parametric extrapolation of survival curves | Sponsor used a log-logistic survival model for nivolumab + chemo, and 1 knot odds spline for chemotherapy arm | A Weibull frailty model was used for nivolumab + chemotherapy, and a 1-knot hazard spline survival was used for the chemotherapy arm |
3. Set dose intensities at 100% | Assumed dose intensities ranged between 85% to 100% | All dose intensities set at 100% |
CADTH base case | — | 1 + 2 + 3 |
5-FU = 5-fluorouracil; FEP = 5-fluorouracil plus epirubicin plus cisplatin; FOLFIRI = 5-fluorouracil plus irinotecan and leucovorin; FOLFOX = 5-fluorouracil plus oxaliplatin and leucovorin; ICER = incremental cost-effectiveness ratio; QALY = quality-adjusted life-year; XELOX = capecitabine + oxaliplatin.
Table 6: Summary of the Stepped Analysis of the CADTH Reanalysis Results
Stepped analysis | Drug | Total costs ($) | Total QALYs | ICER ($/QALYs) |
|---|---|---|---|---|
Sponsor’s base case | Capecitabine + cisplatina | 73,457 | 1.148 | Reference |
FOLFIRI | 74,738 | 1.322 | 7,350 | |
FEP | 76,992 | 1.401 | 13,946 | |
Nivolumab + FOLFOX or XELOX | 179,545 | 1.567 | 253,108 | |
Sponsor’s corrected base case | FOLFOX or XELOXa | 75,395 | 1.142 | Reference |
Nivolumab + FOLFOX or XELOX | 152,992 | 1.563 | 184.174 | |
CADTH reanalysis 1 | FOLFOX or XELOXa | 74,666 | 1.155 | Reference |
Nivolumab + FOLFOX or XELOX | 154,445 | 1.580 | 187,588 | |
CADTH reanalysis 2 | FOLFOX or XELOXa | 74,918 | 1.034 | Reference |
Nivolumab + FOLFOX or XELOX | 153,472 | 1.241 | 378,443 | |
CADTH reanalysis 3 | FOLFOX or XELOXa | 76,002 | 1.148 | Reference |
Nivolumab + FOLFOX or XELOX | 161,907 | 1.565 | 206,158 | |
CADTH base case (1 + 2 + 3) | FOLFOX or XELOXa | 74,937 | 1.035 | Reference |
Nivolumab + FOLFOX or XELOX | 163,705 | 1.258 | 398,312 |
FOLFOX = 5-fluorouracil plus oxaliplatin and leucovorin; ICER = incremental cost-effectiveness ratio; QALY = quality-adjusted life-year; XELOX = capecitabine + oxaliplatin.
aReference product is least costly alternative.
Results from CADTH's base case suggest that nivolumab plus FOLFOX or XELOX was associated with higher costs ($88,768) and improved QALYs (0.22 QALYs), with an ICER of $398,312 per QALY compared to FOLFOX or XELOX. The estimated ICER was higher than the sponsor's base case, which is primarily due to alternative parametric extrapolation of survival curves. The probability that nivolumab is cost-effective was 0% at the WTP threshold of $50,000 per QALY.
Of the 1.26 QALYs estimated for nivolumab plus FOLFOX or XELOX in the CADTH base case, 1.09 (86%) were estimated during the period of the pivotal trial (33 months). Of the $163,705 total cost, $88,492 (54%) was treatment acquisition costs for nivolumab plus FOLFOX or XELOX.
Scenario Analysis Results
Based on CADTH's base case, a series of scenario analyses were conducted. These analyses explored the impact of the following model parameters and assumptions: limiting analysis to the subgroup of patients with PD-L1 CPS of 5 or higher, using alternative parametric survival models for extrapolation beyond trial follow-up (including the 1 suggested by the sponsor), including FOLFIRI as a comparator, and applying a 2-year stopping rule for FOLFOX or XELOX.
Results from scenario analysis (Appendix 4, Table 12) demonstrated that the PD-L1 CPS subgroup of patients and the choice of the parametric survival model for extrapolation of OS beyond the trial timeline were the key drivers of cost-effectiveness findings.
Repeating the analysis in the subpopulation with PD-L1 CPS of 5 or higher reduced the ICER to $245,188 per QALY. ICERs were also affected by the choice of parametric survival functions. When the sponsor’s preferred survival models were used (log-logistic for nivolumab plus FOLFOX or XELOX and 1-knot odds spline for FOLFOX or XELOX), ICER decreased to $205,115 per QALY. However, of the 1.57 QALYs estimated for nivolumab plus FOLFOX or XELOX, 1.08 (69%) were estimated during a 33-month period of the pivotal trial, in contrast to 86% in CADTH’s base case. This demonstrates that most of the QALYs in CADTH’s base case are drawn from the initial follow-up years for which clinical data are available and that CADTH’s base case relies less on the uncertain long-term extrapolation of survival curves. When FOLFIRI was included in the analysis, it dominated XELOX or FOLFOX, as it generated more QALYs for a slightly lower price. The ICER for nivolumab plus FOLFOX or XELOX was $771,905 compared to FOLFIRI. In addition, adding a 2-year stopping rule for FOLFOX or XELOX increased the ICER to $404,684 per QALY. The CADTH Clinical Review of the indirect treatment comparison did not find a statistically significant difference in treatment effectiveness for FOLFOX and FOLFIRI, suggesting that these 2 treatments would likely produce similar QALYs, these results notwithstanding.
Price reduction analysis was conducted based on sponsor’s base case and CADTH’s reanalysis (Table 7). The results indicate that a price reduction of at least 84% (based on sponsor’s base case) or 95% (based on CADTH’s base case) is required for nivolumab plus FOLFOX or FOLFIRI to be considered cost-effective at a WTP threshold of $50,000 per QALY.
Table 7: CADTH Price Reduction Analyses
Price reduction | ICERs for nivolumab + FOLFOX or XELOX vs. FOLFOX or XELOX | ||
|---|---|---|---|
Sponsor base case | CADTH reanalysis | ||
No price reduction | 192,700 | 398,312 | |
10% | 178,375 | 361,044 | |
20% | 160,982 | 326,838 | |
30% | 143,589 | 288,707 | |
40% | 126,196 | 251,092 | |
50% | 108,803 | 215,346 | |
60% | 91,410 | 179,777 | |
70% | 74,017 | 140,941 | |
80% | 56,624 | 104,893 | |
84% | 49,667 | 90,239 | |
90% | 39,231 | 68,259 | |
95% | 30,534 | 49,942 | |
FOLFOX = 5-fluorouracil plus oxaliplatin and leucovorin; ICER = incremental cost-effectiveness ratio; XELOX = capecitabine + oxaliplatin.
Issues for Consideration
The indication is for patients with HER2-negative advanced or metastatic GAC, GEJAC, or EAC. Access to HER2 testing may vary between jurisdictions and by histological site. In jurisdictions without regular HER2 testing within this population, additional testing costs would be incurred by the health care system.
According to an interim analysis of the CheckMate 649 trial, nivolumab in combination with FOLFOX or XELOX might provide the greater clinical benefits and more cost-effective for patients with PD-L1 CPS score of 5 or higher. Access to PD-L1 testing may vary among jurisdictions.
Clinical experts consulted by CADTH indicated that re-challenging with nivolumab post-progression might be an option for patients who survive up to a certain point. The CADTH Pharmacoeconomic Review does not reflect the cost-effectiveness of this potential use of nivolumab.
Feedback from participating drug plans suggested that pembrolizumab, in combination with chemotherapy, is also now available and accessible as first-line treatment to some patients with an indication of interest through special access programs. The sponsor has excluded pembrolizumab as a comparator from the cost-utility analysis and budget impact analysis (BIA). Should pembrolizumab receive a positive recommendation and successful negotiations, the cost-effectiveness and budget impact of nivolumab with pembrolizumab as a comparator in the market mix is unknown.
According to the clinical experts consulted for this review, patients with the indication of interest decline quickly, and if there are barriers to treatment, patients may decline to a point where systemic therapy is not possible. Patients with poor performance status would be ineligible for chemotherapy and nivolumab treatment. Ascertainment of performance status was not assessed in the BIA. If regional variations in treatment patterns and clinical practices present barriers to treatment, the number of patients eligible for treatment and estimated budget impact would decrease.
Overall Conclusions
Evidence from the CheckMate 649 trial indicated that, compared to chemotherapy, nivolumab plus chemotherapy showed a clinically meaningful and statistically significant OS and PFS benefit in adult patients with HER2-negative advanced or metastatic GAC, GEJAC, or EAC compared to chemotherapy alone.1 As the study is ongoing, additional long-term efficacy and safety information are anticipated. Survival models used to extrapolate OS data and patient’s PD-L1 status CPS drove the modelled cost-effectiveness of nivolumab in combination with chemotherapy compared to chemotherapy alone.
CADTH identified several limitations of the sponsor’s economic analysis, specifically, the uncertainty associated with the long-term efficacy of nivolumab, overly optimistic extrapolation of survival curves beyond the follow-up period of the clinical trial, inclusion of comparators that are not relevant in a Canadian context, and exclusion of pembrolizumab as a comparator.
CADTH was unable to address all the limitations identified but made several corrections and revisions to the sponsor's base case to derive the CADTH's base case. CADTH removed irrelevant comparators; corrected public listed prices for oxaliplatin, leucovorin, irinotecan, ramucirumab, and paclitaxel; set relative dose intensity levels to 100%; and used KM data for the on-trial period of the economic evaluation and alternative parametric survival extrapolation to match clinical expectation and to account for a potential treatment-waning effect over the long term.
Although CADTH’s base case resulted in a higher ICER than the sponsor’s base case when nivolumab plus FOLFOX or XELOX was compared to FOLFOX or XELOX alone ($398,312 per QALY versus $192,700 per QALY), both analyses provided consistent results, suggesting that nivolumab in combination with chemotherapy was associated with higher costs and improved QALYs but was not cost-effective at a $50,000 per QALY WTP threshold compared to FOLFOX or XELOX at the submitted price. A price reduction of at least 95% would be required to make nivolumab an optimal treatment option at a WTP threshold of $50,000 per QALY. Given the apparent structural bias introduced by the PSM, this price reduction is likely an underestimate.
The cost-effectiveness of nivolumab plus FOLFOX or XELOX was highly sensitive to PD-L1 CPS, with the ICERs ranging from $245,188 (scenario 1: subgroup of patients with PD-L1 CPS ≥ 5) to $398,312 (CADTH base case: all HER2-negative patients, irrespective of PD-L1 CPS) and to statistical approaches used to fit the OS data, with the ICERs ranging from $205,115 per QALY to $405,122 per QALY (scenario 4: gamma survival extrapolation for nivolumab plus FOLFOX or XELOX and exponential survival extrapolation for FOLFOX or XELOX). Adding a 24-month stopping rule for chemotherapy increased the ICER to $404,684 per QALY (scenario 6).
The sponsor’s model was not sufficiently flexible to estimate the cost-effectiveness of nivolumab in patients with PD-L1 CPS of 10 or higher, which is therefore unknown. The cost-effectiveness compared to pembrolizumab is also unknown.
References
1.Janjigian YY, Shitara K, Moehler M, et al. First-line nivolumab plus chemotherapy versus chemotherapy alone for advanced gastric, gastro-oesophageal junction, and oesophageal adenocarcinoma (CheckMate 649): a randomised, open-label, phase 3 trial. Lancet. 2021;398(10294):27-40. PubMed
2.Pharmacoeconomic evaluation [internal sponsor's report]. In: Drug Reimbursement Review sponsor submission: Opdivo (nivolumab). Montreal: Bristol Myers Squibb Canada; 2021 Aug 18.
3.de Oliveira C, Pataky R, Bremner KE, et al. Phase-specific and lifetime costs of cancer care in Ontario, Canada. BMC Cancer. 2016;16(1):809. PubMed
4.Woods B SE, Palmer S, Latimer N, Soares M. NICE. Partitioned Survival Analysis For Decision Modelling In Health Care: A Critical Review. . 2017.
5.DeltaPA. [Ottawa (ON)]: IQVIA; 2021: https://www.iqvia.com/. Accessed 2021 Dec 7.
6.Budget Impact Analysis [internal sponsor's report]. In: Drug Reimbursement Review sponsor submission: Opdivo (nivolumab). Montreal: Bristol Myers Squibb Canada; 2021 Aug 18.
7.Opdivo® nivolumab for injection Intravenous Infusion, 10 mg nivolumab /mL 40 mg and 100 mg single-use vials [product monograph]. Montréal: Bristol-Myers Squibb Canada Co; 2021 Dec 1: https://www.bms.com/assets/bms/ca/documents/productmonograph/OPDIVO_EN_PM.pdf. Accessed 2021 Dec 7.
8.CADTH. Pharmacoeconomic review: pembrolizumab https://cadth.ca/pembrolizumab-0. Accessed 2021 Sep 23.
9.Nova Scotia Formulary. 2021 Nov; https://novascotia.ca/dhw/pharmacare/documents/formulary.pdf. Accessed 2021 Dec 7.
10.B. C. Government. BC PharmaCare formulary search. 2021; https://pharmacareformularysearch.gov.bc.ca. Accessed 2021 Dec 7.
11.Epirubicin for injection 2 mg/mL (2 mg Epirubicin Hydrochloride/ mL) [product monograph]. Toronto (ON): Teva Canada Limited; 2014: https://www.tevacanada.com/globalassets/canada-scs/product-monographs/epirubicin-for-inj-2mg-per-ml-pm-aug20_2014-wis-eng.pdf. Accessed 2021 Dec 7.
12.Epirubicin Hydrochloride Injection 2 mg/mL [product monograph]. Kirkland (QC): Pfizer Canada Inc.; 2018 Jan 23: https://www.pfizer.ca/sites/default/files/201802/2018.01.23_Epirubicin_PM_E_Level_3.pdf. Accessed 2021 Dec 7.
13.Statistics Canada. Life Tables, Canada, Provinces and Territories, 1980/1982 to 2017/2019. Statistics Canada. 2020 Nov 26; https://www150.statcan.gc.ca/n1/en/catalogue/84-537-X2020001. Accessed 2021 Dec 7.
14.Brenner DR, Weir HK, Demers AA, et al. Projected estimates of cancer in Canada in 2020. CMAJ. 2020;192(9):E199-E205. PubMed
15.Otterstatter MC, Brierley JD, De P, et al. Esophageal cancer in Canada: trends according to morphology and anatomical location. Can J Gastroenterol. 2012;26(10):723-727. PubMed
16.Shankaran V, Xiao H, Bertwistle D, et al. A Comparison of Real-World Treatment Patterns and Clinical Outcomes in Patients Receiving First-Line Therapy for Unresectable Advanced Gastric or Gastroesophageal Junction Cancer Versus Esophageal Adenocarcinomas. Adv Ther. 2021;38(1):707-720. PubMed
17.Muro K, Van Cutsem E, Narita Y, et al. Pan-Asian adapted ESMO Clinical Practice Guidelines for the management of patients with metastatic gastric cancer: a JSMO-ESMO initiative endorsed by CSCO, KSMO, MOS, SSO and TOS. Ann Oncol. 2019;30(1):19-33. PubMed
18.Canadian Cancer Statistics Advisory Committee. Canadian Cancer Statistics. A 2018 special report on cancer incidence by stage. Toronto (ON): Canadian Cancer Society; 2018: https://cdn.cancer.ca/-/media/files/research/cancer-statistics/2018-statistics/canadian-cancer-statistics-2018-en.pdf. Accessed 2021 Dec 7.
19.Initial Economic Guidance Report: Ramucirumab (Cyramza) for Gastric Cancer. Toronto: pan-Canadian Oncology Drug Review; 2015 Sep 3: https://www.cadth.ca/sites/default/files/pcodr/pcodr_ramucirumab_cyramza_gc_in_egr.pdf. Accessed 2021 Dec 7.
20.pERC final recommendation: Vectibix for left sided metastatic colorectal cancer Ottawa: CADTH; 2018 Mar 29: https://www.cadth.ca/sites/default/files/pcodr/pcodr_panitumumab_vectibix_ls_mcrc_fn_rec.pdf. Accessed 2021 Dec 7.
21.Initial economic guidance report: pertuzumab-trastuzumab for early breast cancer. pan-Canadian Oncology Drug Review. Ottawa: CADTH; 2018 Oct 4: https://www.cadth.ca/sites/default/files/pcodr/pcodr_pertuzumab-trastuzumab_perjeta-herceptin-combo_ebc_in_egr.pdf. Accessed 2021 Dec 7.
22.Final economic guidance report: cemiplimab (Libtayo) for cutaneous squamous cell carcinoma. pan-Canadian Oncology Drug Review. Ottawa: CADTH; 2020 Jan 22: https://www.cadth.ca/sites/default/files/pcodr/Reviews2020/10187CemiplimabCSCC_fnEGR_REDACT-ABBREV_EarlyConv_22Jan2020_final.pdf. Accessed 2021 Dec 7.
23.Cancer Care Ontario: funded evidence-informed regimens. 2021; https://www.cancercareontario.ca/en/drugformulary/regimens. Accessed 2021 Dec 7.
24.Sakamoto J, Matsui T, Kodera Y. Paclitaxel chemotherapy for the treatment of gastric cancer. Gastric Cancer. 2009;12(2):69-78. PubMed
25.Cyramza® ramucirumab intravenous injection, 10 mg ramucirumab / mL 10 mL and 50 mL vials [product monograph]. Toronto (ON): Eli Lilly Canada Inc.; 2020: http://pi.lilly.com/ca/cyramza-ca-pm.pdf. Accessed 2021 Dec 7.
26.Fluorouracil injection USP 50 mg/mL (5 g/100 mL) [product monograph]. Kirkland (QC): Pfizer Canada ULC; 2019 Aug 7: https://www.pfizer.ca/sites/default/files/201908/FLUOROURACIL_PM_E_227813_07Aug2019.pdf. Accessed 2021 Dec 7.
27.Irinotecan hydrochloride injection USP (Irinotecan hydrochloride trihydrate) Sterile Solution 20 mg / mL (40 mg / 2 mL, 100 mg / 5 mL, 500 mg / 25 mL) [product monograph]. Kirkland (QC): Pfizer Canada ULC; 2019 Mar 8: https://www.pfizer.ca/sites/default/files/201903/Irinotecan_HCL_USP_PM_E_224931_08Mar2019.pdf. Accessed 2021 Dec 7.
28.Oxaliplatin Injection, Pfizer Standard 5 mg/mL oxaliplatin 50 mg / 10 mL, 100 mg / 20 mL, 200 mg / 40 mL [product monograph]. Kirkland (QC): Pfizer Canada ULC; 2020: https://www.pfizer.ca/sites/default/files/202007/Oxaliplatin_PM_E_236783_2020.07.03.pdf. Accessed 2021 Dec 7.
29.Taxol (paclitaxel) Injection, 6 mg/mL [product monograph]. Montréal: Bristol-Myers Squibb Canada; 2010 Feb 22: https://pdf.hres.ca/dpd_pm/00009873.PDF. Accessed 2021 Dec 7.
30.Schedule of benefits for physician services under the Health Insurance Act: effective (July 2, 2021 (Effective October 1, 2021)) Toronto (ON): Ontario Ministry of Health; 2021: https://www.health.gov.on.ca/en/pro/programs/ohip/sob/physserv/sob_master.pdf. Accessed 2021 Dec 7.
31.Wehler E, Zhao Z, Pinar Bilir S, Munakata J, Barber B. Economic burden of toxicities associated with treating metastatic melanoma in eight countries. Eur J Health Econ. 2017;18(1):49-58. PubMed
32.Budget Impact Analysis Guidelines: Guidelines for Conducting Pharmaceutical Budget Impact Analyses for Submission to Public Drug Plans in Canada Ottawa (ON): Patented Medicine Prices Review Board; 2020 Jun: https://www.canada.ca/content/dam/pmprb-cepmb/documents/reports-and-studies/budget-impact-analysis-guidelines/PMPRB-BIA-Guidlines-en.pdf. Accessed 2021 Dec 7.
33.Cisplatin injection BP Sterile solution 1 mg / mL (50 mg and 100 mg cisplatin per vial) [product monograph]. Kirkland (QC): Pfizer Canada ULC; 2020 Apr 3: https://www.pfizer.ca/sites/default/files/202004/Cisplatin_PM_E_235278_2020-04-03.pdf. Accessed 2021 Dec 7.
34.Leucovorin calcium injection USP 10 mg/mL Sterile Solution [product monograph]. Kirkland (QC): Pfizer Canada Inc.; 2018: https://www.pfizer.ca/sites/default/files/201807/2018.06.21_Leucovorin_PM_E_215416.pdf. Accessed 2021 Dec 7.
Appendix 1: Cost Comparison Table
Note this appendix has not been copy-edited.
The comparators presented in the following table have been deemed to be appropriate based on feedback from clinical experts and CADTH-participating drug plans. Comparators may be recommended (appropriate) practice or actual practice. Existing Product Listing Agreements are not reflected in the table and as such, the table may not represent the actual costs to public drug plans.
Table 8: CADTH Cost Comparison Table for the Treatment of Adult Patients With HER2-Negative Advanced or Metastatic Gastric, Gastroesophageal Junction, or Esophageal Adenocarcinoma
Treatment | Strength/ concentration | Form | Price per vial ($) | Recommended dosage | Average daily cost ($) | Average 28-day cost ($) |
|---|---|---|---|---|---|---|
Nivolumab (Opdivo) | 10 mg/mL | 4 mL 10 mL Injection for IV infusion | $782.2200a $1,955.5600a | 240 mg Q2W 360 mg Q3W | 335.24 | 9,387 |
Nivolumab plus CISPFU Q3W | 10,236 | |||||
Nivolumab plus CISPFU Q4W | 10,023 | |||||
Nivolumab plus CAPECISP | 10,132 | |||||
Nivolumab plus XELOX | 9,833 | |||||
Nivolumab plus FOLFOX | 10,618 | |||||
Nivolumab plus FOLFIRI | 10,393 | |||||
Nivolumab plus ECF | 14,968 | |||||
Nivolumab plus ECX | 9,387 | |||||
Nivolumab plus EOX | 12,582 | |||||
Pembrolizumab + chemotherapy | ||||||
Pembrolizumab (Keytruda) | 100 mg/4mL | 4 mL Vial IV infusion | 4,400.0000b | 200 mg Q3W or 400 mg Q6W | 419.05 | 11,733 |
Pembrolizumab plus CISPFU Q3W | 12,582 | |||||
Pembrolizumab plus CISPFU Q4W | 12,370 | |||||
Pembrolizumab plus CAPECISP | 12,478 | |||||
Pembrolizumab plus XELOX | 12,180 | |||||
Pembrolizumab plus FOLFOX | 12,965 | |||||
Pembrolizumab plus FOLFIRI | 12,739 | |||||
Pembrolizumab plus ECF | 17,314 | |||||
Pembrolizumab plus ECX | 13,006 | |||||
Pembrolizumab plus EOX | 12,707 | |||||
Cisplatin-5-fluorouracil (CISPFU) | ||||||
Cisplatin | 1 mg/mL | 50 mg 100 mg Vial for IV infusion | 135.0000 270.0000 | 80 mg/m2 Q3W or Q4W | 19.29 14.46 | 540 405 |
5-Fluorouracil | 50 mg/mL | 100 mL Vial for IV infusion | 160.9000c | 800 mg/m2/day on days 1 to 5 or 1,000 mg/m2 on days 1 to 4 | — | — |
Q3W Or Q4W | 11.03 8.27 | 309 232 | ||||
CISPFU Q3W Or Q4W | 30.32 22.74 | 849 637 | ||||
Cisplatin-capecitabine (CAPECISP) | ||||||
Cisplatin | 1 mg/mL | 50 mL 100 mL Vial for IV infusion | 135.0000 270.0000 | 60 or 80 mg/m2 Q3W | 19.29 | 540 |
Capecitabine (Xeloda) | 150 mg 500 mg | Tablet | 0.4575 1.5250 | 1,000 mg/m2 twice daily on days 1 to 14 Q3W | 7.32 | 205 |
CAPECISP | 26.61 | 745 | ||||
Capecitabine-oxaliplatin (XELOX) | ||||||
Oxaliplatin | 5 mg/mL | 10 mL 20 mL 40 mL Vial for IV infusion | 36.2700 72.5400 145.0800 | 130 mg/m2 Q3W | 8.64 | 242 |
Capecitabine (Xeloda) | 150 mg 500 mg | Tablet | 0.4575 1.525 | 1,000 mg/m2 twice daily on days 1 to 14 Q3W | 7.32 | 205 |
XELOX | 15.96 | 447 | ||||
Folinic acid (leucovorin)-fluorouracil-oxaliplatin (FOLFOX) | ||||||
Oxaliplatin | 5 mg/mL | 10 mL 20 mL 40 mL Vial for IV infusion | 36.2700 72.5400 145.0800 | 85 mg/m2 Q2W | 10.36 | 290 |
Leucovorin | 10 mg/mL | 5 mL 50 mL Vial for IV infusion | 68.9400 74.4100d | 400 mg/m2 Q2W | 10.63 | 298 |
5-Fluorouracil | 50 mg/mL | 10 mL 100 mL Vial for IV infusion | 16.0900c 160.9000c | 400 mg/m2 IV bolus Q2W | 11.49 | 322 |
5-Fluorouracil | 50 mg/mL | 10 mL 100 mL Vial for IV infusion | 16.0900c 160.9000c | 2,400 mg/m2 IV continuous infusion Q2W | 11.49 | 322 |
FOLFOX | 43.98 | 1,231 | ||||
Folinic acid (leucovorin)-fluorouracil-irinotecan (FOLFIRI) | ||||||
Irinotecan | 20 mg/mL | 2 mL 5 mL 25 mL Vial for IV infusion | 208.3400 8.1000 2,604.3750 | 180 mg/m2 Q2W | 2.31 | 65 |
Leucovorin | 10 mg/mL | 5 mL 50 mL Vial for IV infusion | 68.9400 74.4100 | 400 mg/m2 Q2W | 10.63 | 298 |
5-Fluorouracil | 50 mg/mL | 100 mL Vial for IV infusion | 160.9000c | 400 mg/m2 IV bolus Q2W | 11.49 | 322 |
5-Fluorouracil | 50 mg/mL | 100 mL Vial for IV infusion | 160.9000c | 2,400 mg/m2 IV continuous infusion Q2W | 11.49 | 322 |
FOLFIRI | 35.93 | 1,006 | ||||
Fluorouracil-cisplatin-epirubicin (ECF) | ||||||
Epirubicin | 2 mg/mL | 25 mL 100 mL Vial for IV infusione | 200.9100 779.5400 | 50 mg/m2 Q3W | 536 | 19.13 |
Cisplatin | 1 mg/mL | 50 mL 100 mL Vial for IV infusion | 135.0000 270.0000 | 60 mg/m2 Q3W | 540 | 19.29 |
5-Fluorouracil | 50 mg/mL | 100 mL Vial for IV infusion | 160.9000c | 200 mg/m2/day for 21 days Q3W | 4,505 | 160.90 |
ECF | 5,581 | 199.32 | ||||
Epirubicin-cisplatin-capecitabine (ECX) | ||||||
Epirubicin | 2 mg/mL | 25 mL 100 mL Vial for IV infusione | 200.9100 779.5400 | 50 mg/m2 Q3W | 19.13 | 536 |
Cisplatin | 1 mg/mL | 50 mL 100 mL Vial for IV infusion | 135.0000 270.0000 | 60 mg/m2 Q3W | 19.29 | 540 |
Capecitabine | 150 mg 500 mg | Tablet | 0.4575 1.5250 | 625 mg/m2 twice daily | 7.02 | 196 |
ECX | 45.44 | 1,272 | ||||
Epirubicin-oxaliplatin-capecitabine (EOX) | ||||||
Epirubicin | 2 mg/mL | 25 mL 100 mL Vial for IV infusione | 200.9100 779.5400 | 50 mg/m2 Q3W | 19.13 | 536 |
Oxaliplatin | 5 mg/mL | 10 mL 20 mL 40 mL Vial for IV infusion | 36.2700 72.5400 145.0800 | 130 mg/m2 Q3W | 8.64 | 242 |
Capecitabine | 150 mg 500 mg | Tablet | 0.4575 1.525 | 625 mg/m2 twice daily | 7.02 | 196 |
EOX | 34.79 | 974 | ||||
Q2W = every 2 weeks; Q3W = every 3 weeks.
Note: All prices are IQVIA Delta PA wholesale list prices5 (accessed July 2021), unless otherwise indicated, and do not include dispensing fees or markups. Wastage of excess medication in vials is included in costs. Recommended dosage is based on Cancer Care Ontario monographs, unless otherwise indicated. For dosing that depends on weight or body surface area, CADTH assumed mean body weight of 71 kg and mean body surface area was 1.8 m2. Total cost estimates per regimen are based on the cheapest combination of the component drugs.
aSponsor’s submitted price for each dosage.6 Maximum treatment duration is 2 years.7
bCADTH Pharmacoeconomic review of pembrolizumab.8
cNova Scotia Formulary,9 as reported by IQVIA Delta PA (August 2021).
dBritish Columbia Formulary list price,10 as reported by IQVIA Delta PA (August 2021).
eOther sizes are available as per product monographs11,12 but price was not available for 5 mL, 10 mL, 50 mL, and 75 mL vials.
Appendix 2: Submission Quality
Note this appendix has not been copy-edited.
Description | Yes/No | Comments |
|---|---|---|
Population is relevant, with no critical intervention missing, and no relevant outcome missing | No | See CADTH appraisal section. |
Model has been adequately programmed and has sufficient face validity | No | CADTH identified inconsistencies in total costs and total QALYs across probabilistic and deterministic result tables in the submission, likely resulting from identified errors in sponsor model’s script for generating probabilistic results. |
Model structure is adequate for decision problem | Yes | The choice of a partitioned survival model introduced an apparent post-progression bias in favour of nivolumab. |
Data incorporation into the model has been done adequately (e.g., parameters for probabilistic analysis) | Yes | No comment. |
Parameter and structural uncertainty were adequately assessed; analyses were adequate to inform the decision problem | Yes | No comment. |
The submission was well organized and complete; the information was easy to locate (clear and transparent reporting; technical documentation available in enough details) | No | There were discrepancies in the sponsor’s economic report and model regarding inclusion of HER2 positive patients, deterministic versus probabilistic results, and treatment stopping rule. |
Appendix 3: Additional Information on the Submitted Economic Evaluation
Note this appendix has not been copy-edited.
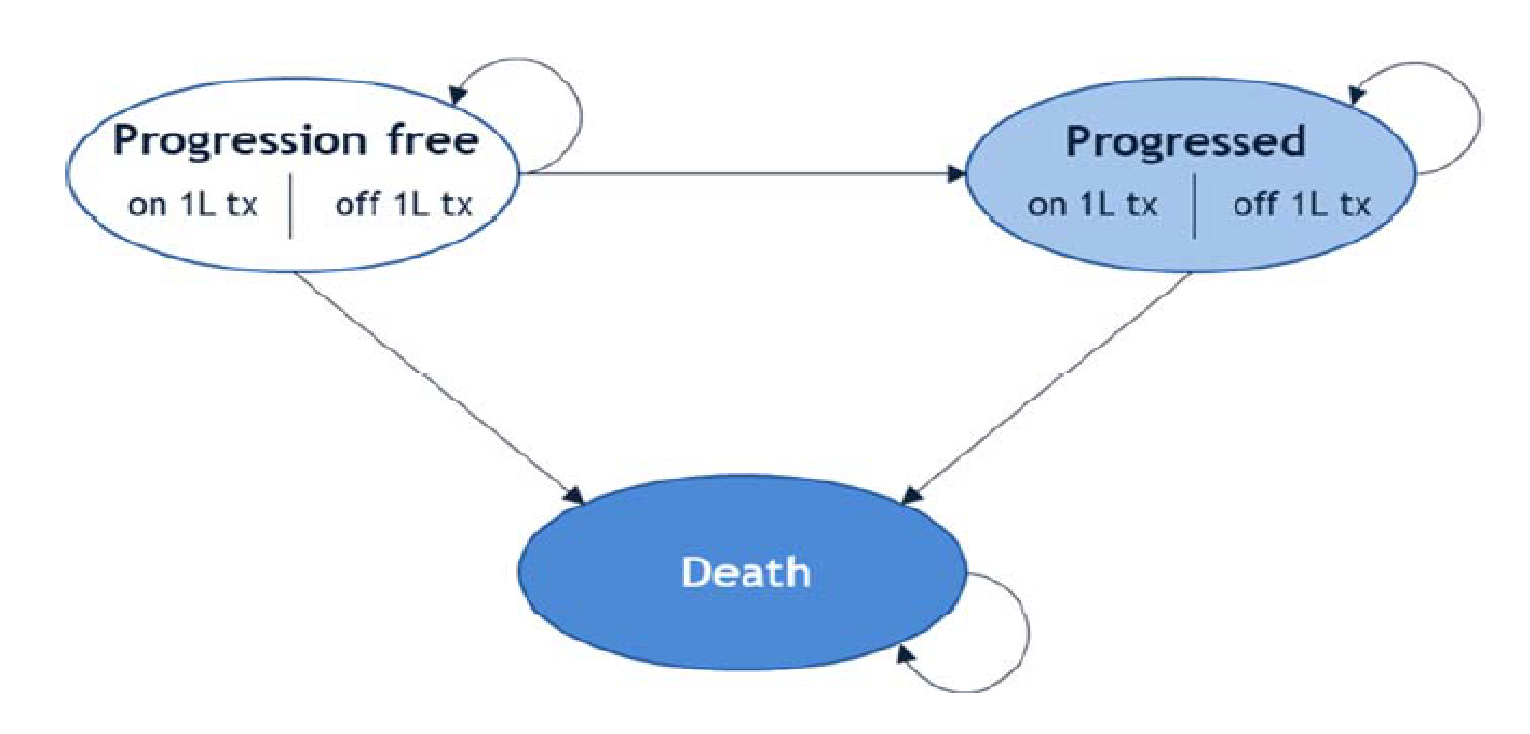
Detailed Results of the Sponsor’s Base Case
Table 10: Summary of the Sponsor’s Economic Evaluation Results
Drug | Total costs ($) | Total life-years | Total QALYs | Sequential ICER ($/QALY) |
|---|---|---|---|---|
Capecitabine + cisplatin | 72,481 | 1.45 | 1.142 | Ref. |
FOLFIRI | 74,019 | 1.62 | 1.271 | 7,350 |
FEP | 76,042 | 1.66 | 1.296 | 28,483 |
Cisplatin + 5FU | 83,356 | 1.45 | 1.142 | Strictly dominated by FOLFIRI, capecitabine + cisplatin, FEP |
FOFLOX/XELOX | 98,034 | 1.45 | 1.142 | Strictly dominated by FOLFIRI, capecitabine + cisplatin, FEP |
Nivolumab + FOLFOX or XELOX | 179,814 | 2.02 | 1.560 | $619,128a |
5-FU = 5-fluorouracil; FEP: 5-fluorouracil plus epirubicin plus cisplatin; FOLFIRI: 5-fluorouracil plus irinotecan and leucovorin; FOLFOX: 5-fluorouracil plus oxaliplatin and leucovorin; ICER = incremental cost-effectiveness ratio; QALY = quality-adjusted life-year; Ref. = reference; XELOX = capecitabine + oxaliplatin.
aNote that sponsor’s base-case ICER for nivolumab + FOLFOX or XELOX versus FOLFOX or XELOX was $184.174 per QALY, which does not appear in the table due to FOLFOX or XELOX being dominated by FEP.
Source: Sponsor’s pharmacoeconomic submission.2
Appendix 4: Additional Details on the CADTH Reanalyses and Sensitivity Analyses of the Economic Evaluation
Note this appendix has not been copy-edited.
Detailed Results of CADTH Base Case
Table 11: Disaggregated Summary of CADTH’s Economic Evaluation Results
Parameter | Nivolumab + FOLFOX or XELOX | FOLFOX or XELOX | Incremental |
|---|---|---|---|
Discounted QALYs | |||
Total | 1.258 | 1.035 | 0.223 |
By health state or data source | |||
Progression-free | 0.94 | 0.72 | 0.22 |
Progressed | 0.32 | 0.32 | 0 |
Adverse events | –0.0048 | –0.0035 | –0.0013 |
Discounted costs ($) | |||
Total | 163,708 | 74,940 | 88,768 |
Acquisition | 88,492 | 4,485 | 84,007 |
Administration | 10,841 | 6,902 | 3,939 |
Monitoring | 1,577 | 1,215 | 362 |
Subsequent treatment | 2,790 | 2,625 | 165 |
Terminal care | 55,815 | 56,037 | –222 |
Adverse events | 4,193 | 3,675 | 518 |
ICER ($/QALY) | 398,312 | ||
FOLFOX: 5-fluorouracil plus oxaliplatin and leucovorin; ICER = incremental cost-effectiveness ratio; XELOX = capecitabine + oxaliplatin; QALY = quality-adjusted life-year.
Scenario Analyses
Table 12: Summary of CADTH Scenario Analyses
Drug | Total costs ($) | Total QALYs | ICER ($/QALY) |
|---|---|---|---|
Sponsor's corrected base case | |||
FOLFOX or XELOX | 75,395 | 1.14 | Reference |
Nivolumab + FOLFOX or XELOX | 152,992 | 1.56 | 184.174 |
CADTH’s base case | |||
FOLFOX or XELOX | $74,937 | 1.04 | Reference |
Nivolumab + FOLFOX or XELOX | $163,705 | 1.26 | 398,312 |
CADTH’s scenario analysis 1: Subgroup of patients with PDL CPS ≥ 5 | |||
FOLFOX or XELOX | 73,504 | 1.02 | Reference |
Nivolumab + FOLFOX or XELOX | 162,705 | 1.38 | 245,188 |
CADTH’s scenario analysis 2: Using sponsor’s suggested survival model to extrapolate OS beyond trial follow-up | |||
FOLFOX or XELOX | 75,308 | 1.16 | Reference |
Nivolumab + FOLFOX or XELOX | 163,192 | 1.59 | 205,115 |
CADTH’s scenario analysis 3: Using alternative survival model to extrapolate OS beyond trial follow-up | |||
FOLFOX or XELOX | 75,013 | 1.05 | Reference |
Nivolumab + FOLFOX or XELOX | 163,579 | 1.33 | 318,979 |
CADTH’s scenario analysis 4: Using alternative survival model to extrapolate OS beyond trial follow-up | |||
FOLFOX or XELOX | 74,821 | 1.05 | Reference |
Nivolumab + FOLFOX or XELOX | 163,457 | 1.27 | 405,122 |
CADTH’s scenario analysis 5: Including FOLFIRI as a comparator | |||
FOLFIRI | 73,226 | 1.14 | Reference |
FOLFOX or XELOX | 74,734 | 1.04 | Dominated by FOLFIRI |
Nivolumab + FOLFOX or XELOX | 163,437 | 1.26 | 771,905 |
CADTH’s scenario analysis 6: Two-years stopping rule for chemotherapy | |||
FOLFOX or XELOX | 73,405 | 1.03 | Reference |
Nivolumab + FOLFOX or XELOX | 162,940 | 1.25 | 404,684 |
Appendix 5: Submitted Budget Impact Analysis and CADTH Appraisal
Note this appendix has not been copy-edited.
Table 13: Summary of Key Take-Aways
Key take-aways of the budget impact analysis |
|---|
|
Summary of Sponsor’s Budget Impact Analysis
The sponsor submitted a BIA,6 assessing the expected budgetary impact of the introduction of nivolumab, in combination with platinum- and fluoropyrimidine-based chemotherapy, for the first-line treatment of adults with HER2-negative advanced or metastatic gastric, gastroesophageal junction, or esophageal adenocarcinoma (GAC, GEJAC, or EAC). The analysis was done from the perspective of a Canadian health care payer over a 3-year time horizon; the base year was assumed to be 2021 and the 3-year time horizon ran from 2022 to 2024. Key inputs to the BIA are documented in Table 15.
The sponsor estimated population size using an epidemiology-based approach, with data obtained from published literature13-17 and Canadian Cancer Society statistics18 to estimate the number of new (incident) patients eligible for treatment with nivolumab. Current standard of care includes chemotherapy alone such as XELOX, FOLFOX, FOLFIRI, capecitabine plus cisplatin, FEP, and cisplatin plus 5-fluorouracil. The sponsor assumed the proportion of patients on nivolumab in combination with FOLFOX is 90.9%, and nivolumab in combination with XELOX is 9.1%.6 Some patients progress on disease and receive subsequent chemotherapy; 37.6% of patients on nivolumab plus chemotherapy and 41.2% of patients on chemotherapy alone accrued the costs of subsequent chemotherapy. Subsequent systemic treatment includes ramucirumab, fluorouracil, irinotecan, oxaliplatin, and paclitaxel. Patients accrued drug acquisition costs in their incident year only, which were obtained from published literature.19-22 Total costs were calculated by multiplying drug cost per administration with the mean number of doses. The sponsor assumed weight-based dosing of nivolumab, and vial sharing with 5% wastage. Dosing regimens of chemotherapies were obtained from Cancer Care Ontario Formulary,23 published literature1,24 and product monographs.25-29
The sponsor also included monitoring costs, drug administration costs, and costs of Grade 3-4 AE; nausea, diarrhea, vomiting, neuropathy peripheral, decreased neutrophil count, decreased platelet count, increased lipase, anemia, neutropenia, and fatigue. Monitoring costs and drug administration costs were obtained from OHIP Schedule of Benefits30 and adverse event costs were obtained from published literature.31
Figure 2: Sponsor’s Estimation of the Size of the Eligible Population
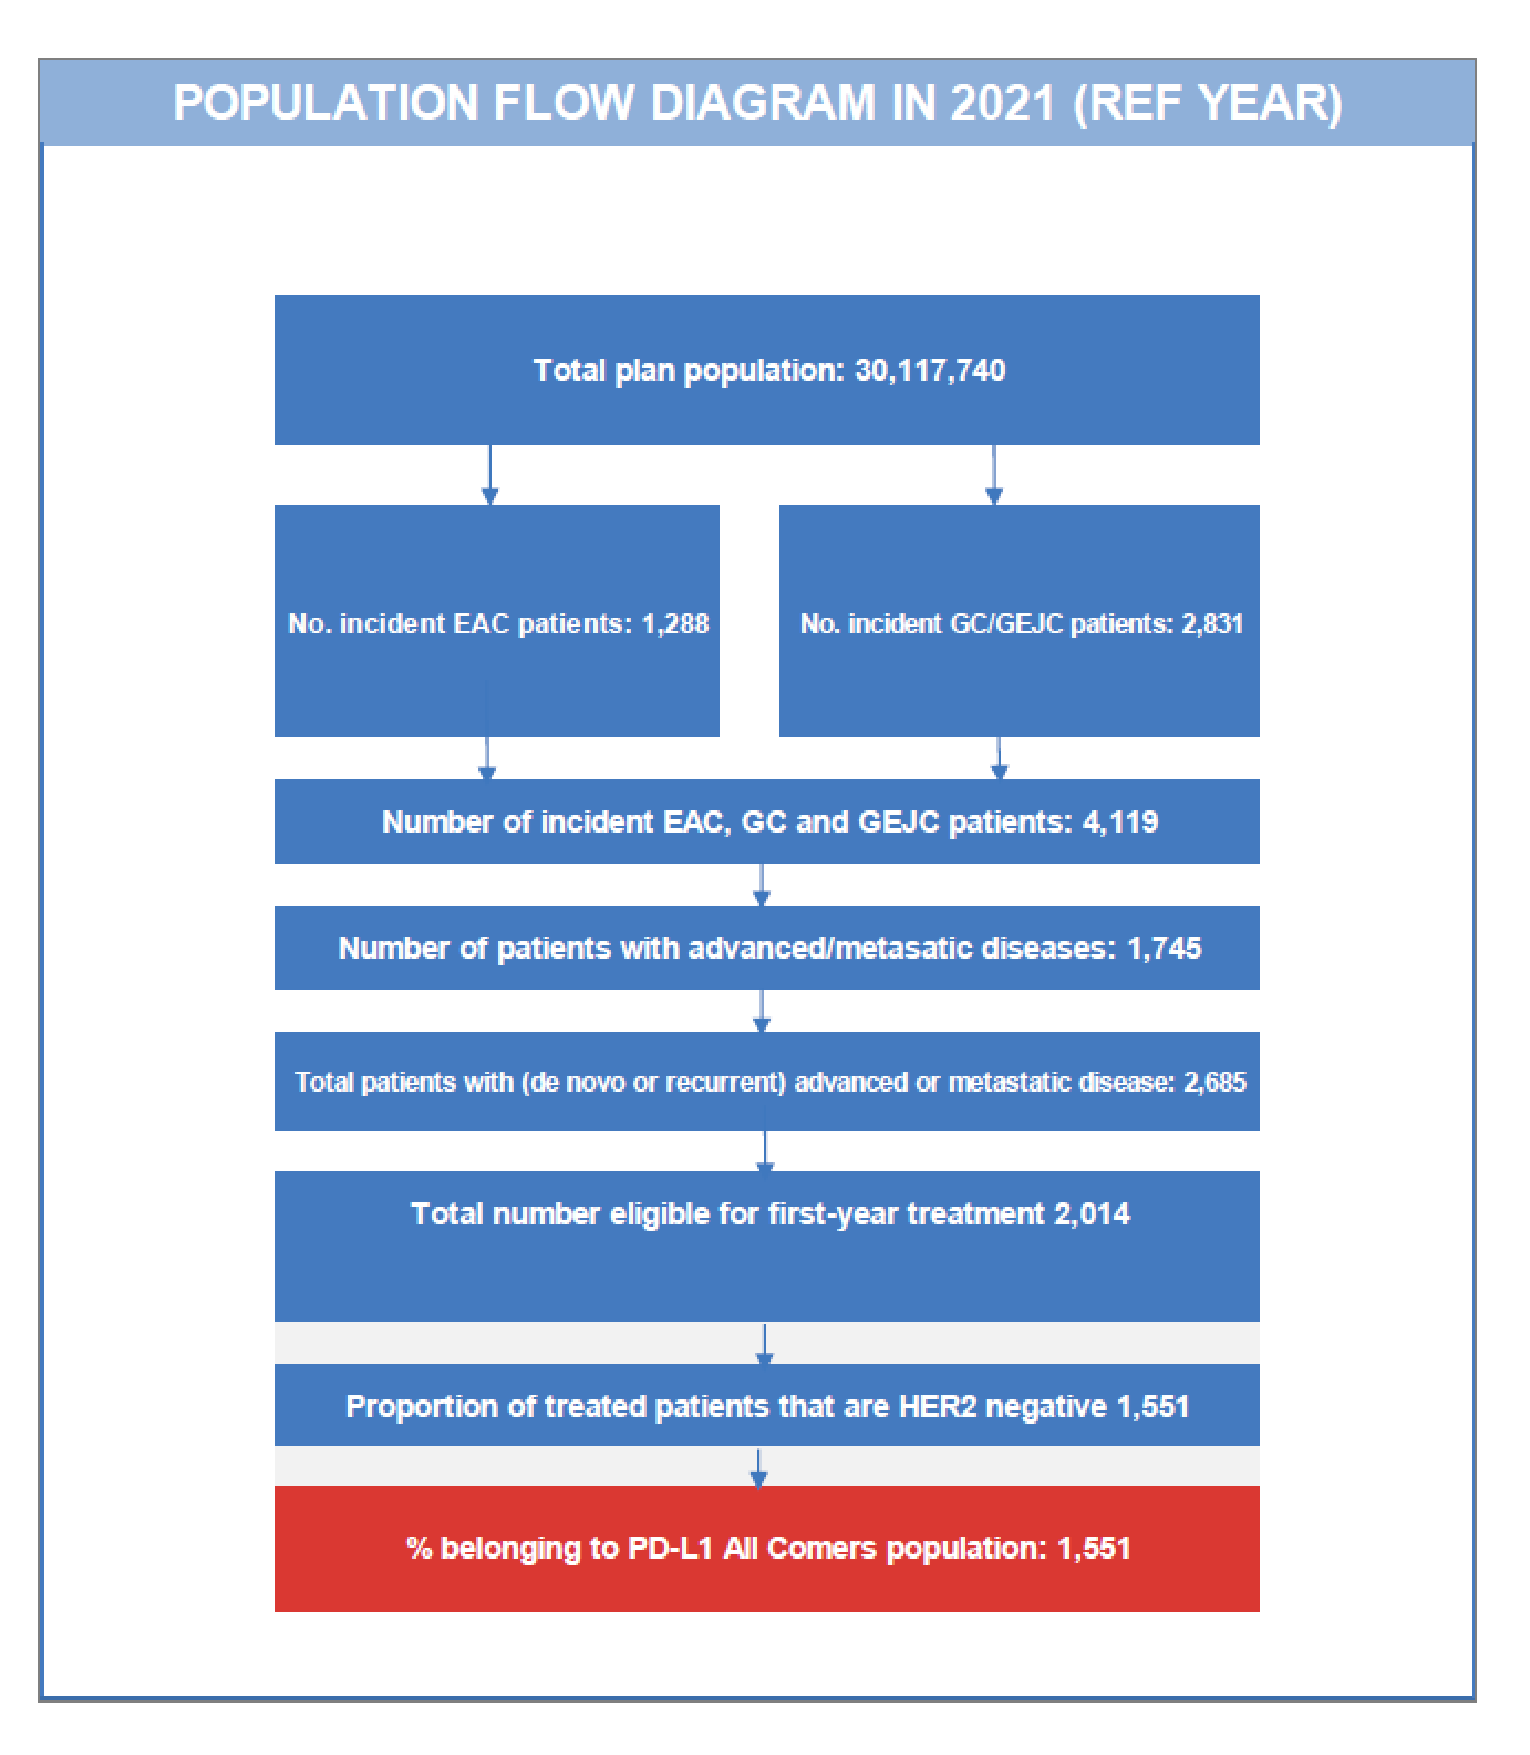
Source: Sponsor’s pharmacoeconomic submission.2
Table 14: Summary of Key Model Parameters
Parameter | Sponsor’s estimate (reported as year 1 / year 2 / year 3 if appropriate) |
|---|---|
Target population | |
Annual population growth in Canada (excluding Quebec) | 1.16%13 |
Annual incidence of esophageal cancer | 0.0057%14 |
Proportion of esophageal cancer patients with esophageal adenocarcinoma | 75.00%15 |
Proportion of EAC incident population with de novo advanced/metastatic disease | 39.90%18 |
Annual incidence of gastric cancer and gastroesophageal junction cancer | 0.0094%14 |
Proportion of gastric cancer and gastroesophageal junction cancer incident population with de novo advanced/metastatic disease | 43.50%18 |
Proportion of incident advanced/metastatic patients with recurrent disease (after prior diagnosis at early stage) | 35.00%6 |
Proportion of eligible people starting treatment | 75.00%16 |
Proportion of treated patients that are HER2-negative | 77.00%17 |
Proportion of population with PD-L1 status of All Comers | 100%16 |
Number of patients eligible for drug under review | 1,568 / 1,587 / 1,605 |
Incidence of adverse events (Grade 3-4)1 | |
Nivolumab + FOLFOX or XELOX Nausea Diarrhea Vomiting Neuropathy peripheral Neutrophil count decreased Platelet count decreased Increased lipase Anemia Neutropenia Fatigue | 3.20% 5.10% 4.20% 4.30% 11.50% 2.80% 7.00% 11.00% 16.90% 5.20% |
XELOX, FOLFOX, FOLFIRI, capecitabine plus cisplatin, FEP, cisplatin + 5-FU Nausea Diarrhea Vomiting Neuropathy peripheral Neutrophil count decreased Platelet count decreased Increased lipase Anemia Neutropenia Fatigue | 3.70% 3.70% 4.20% 3.00% 9.10% 2.60% 3.70% 7.30% 13.00% 3.30% |
Market uptake (3 years)6 | |
Uptake (reference scenario) XELOX FOLFOX FOLFIRI Capecitabine plus cisplatin FEP Cisplatin plus 5-FU | 5% / 5% / 5% 50% / 50% / 50% 20% / 20% / 20% 5% / 5% / 5% 5% / 5% / 5% 15% / 15% / 15% |
Uptake (new drug scenario) Nivolumab + chemotherapy (FOLFOX, XELOX) XELOX FOLFOX FOLFIRI Capecitabine plus cisplatin FEP Cisplatin plus 5-FU | |||||||||||||||||||||||||||| |||||||||||||| ||||||||||||||||||||| |||||||||||||| |||||||||||||| |||||||||||||| ||||||||||||||||||||| |
Cost of treatment (per patient)a6 | |
Cost of treatment over cycle Nivolumab + FOLFOX Nivolumab + XELOX XELOX FOLFOX FOLFIRI Capecitabine plus cisplatin FEP Cisplatin plus 5-FU | $5,651 $8,345 $2,368 $1,676 $283 $288 $1,204 $377 |
Cost of monitoring (per patient)30 | |
Nivolumab + chemotherapy (FOLFOX, XELOX) XELOX FOLFOX FOLFIRI Capecitabine plus cisplatin FEP Cisplatin plus 5-FU | $1,491 $1,128 $1,128 $517 $697 $515 $801 |
Cost of administration30b | |
Drug administration IV Oral Subcutaneous | $105 $26 $4 |
Cost per adverse events31 | |
Nausea Diarrhea Vomiting Neuropathy peripheral Neutrophil count decreased Platelet count decreased Increased lipase Anemia Neutropenia Fatigue | $4,234 $5,018 $4,234 $10,839 $8,780 $8,780 $0 $6,214 $8,780 $6,214 |
FOLFIRI = Folinic Acid (Leucovorin)-Fluorouracil-Irinotecan, FOLFOX = Folinic Acid (Leucovorin)-Fluorouracil-Oxaliplatin, FEP = Fluorouracil-Cisplatin-Epirubicin, IV = intravenous infusion, PD-L1 = programmed death-ligand 1, XELOX = Capecitabine-Oxaliplatin, 5-FU = 5-fluorouracil.
Note: Mean number of doses in calculating drug costs for nivolumab + XELOX were ||||||| nivolumab doses, ||||||| oxaliplatin doses and ||||||| capecitabine doses, for nivolumab + FOLFOX were ||||||| nivolumab doses, ||||||| oxaliplatin doses, ||||||| leucovorin doses and ||||||| 5-fluorouracil doses, for XELOX were 6.7 oxaliplatin doses and 9.27 capecitabine doses, for FOLFOX were ||||||| oxaliplatin doses, ||||||| leucovorin doses, ||||||| 5- fluorouracil bolus doses and ||||||| 5-fluorouracil infusion doses, for FOLFIRI were ||||||| irinotecan doses, ||||||| leucovorin doses, ||||||| 5- fluorouracil bolus doses and ||||||| 5-fluorouracil infusion doses, for capecitabine plus cisplatin were ||||||| capecitabine doses and ||||||| cisplatin doses, for FEP were ||||||| 5- fluorouracil doses, ||||||| cisplatin doses and ||||||| epirubicin doses, and for cisplatin plus 5-fluorouracil were ||||||| cisplatin doses and ||||||| 5- fluorouracil doses.
aAssuming weight-based dosing, 100% dose intensity and 5% drug wastage (i.e., vial sharing).
bCode G359 for IV, G388 for oral and G372 for subcutaneous mode of administration from the Ontario Schedule of Benefits for Physician Services.30
Summary of the Sponsor’s BIA Results
From the Canadian health care payer perspective, the sponsor estimated the net 3-year budget impact of introducing nivolumab for the first-line treatment of adults with HER2-negative advanced or metastatic gastric, gastroesophageal junction, or esophageal adenocarcinoma in adults to be $174,128,355 (Year 1: $50,002,318; Year 2: $57,983,413; Year 3: $66,142,624). The sponsor estimated the net 3-year budget impact to the public drug plans to be $166,514,065 (Year 1: $47,815,815; Year 2: $55,447,913; Year 3: $63,250,338).
CADTH Appraisal of the Sponsor’s BIA
CADTH identified several key limitations to the sponsor’s analysis that have notable implications on the results of the BIA:
There is significant uncertainty in estimated population size: The revised anticipated Health Canada indication received from the sponsor during CADTH’s review included adult patients with HER2-negative advanced or metastatic gastric, gastroesophageal junction, and esophageal adenocarcinoma. The sponsor submitted BIA restricted eligible market size for nivolumab to patients with HER2-negative status, with 77% of treated patients having HER2-negative status. CADTH was unable to confirm the sponsor’s adopted value with the provided reference.17 According to the clinical experts consulted for this review by CADTH, the proportion of patients with HER2-negative status may be in the range of 85%. As such, the proportion of HER2-negative patients and budget impact may be underestimated in the sponsor’s submission.
Further, the sponsor assumed 35% of incident advanced/metastatic patients have recurrent disease. According to the clinical experts consulted for this review by CADTH, the assumed recurrent rate is reasonable but associated with uncertainty. Should the proportion of patients with recurrent disease be higher than assumed, the budget impact would be higher than estimated.
There is also significant heterogeneity in testing of HER2 status across jurisdictions. The sponsor assumed HER2 status would be known for all patients in all jurisdictions; however, according to the clinical experts consulted for this review, the availability of testing for EAC varies across jurisdictions. Under the revised anticipated Health Canada indication, patients with unknown HER2 status would not be eligible for treatment with nivolumab, and the sponsor may have overestimated the population size and the budget impact.
In the CADTH reanalysis, the proportion of patients with HER2-negative was assumed to be 85% based on feedback from clinical experts. CADTH explored the impact of assuming 90% of patients having HER2-negative status in a scenario analysis.
CADTH explored the impact of assuming an arbitrarily higher recurrence rate of 45% in a scenario analysis.
CADTH was unable to address the limitation on heterogeneity in testing of HER2 status.
The BIA should adopt the drug plan perspective and relevant drug costs should include drug wastage: In their base case, the sponsor adopted the perspective of public health care payer and included drug acquisition costs, monitoring costs, drug administration costs, and adverse event costs. According to the CADTH guidelines on BIA,32 the BIA should assume the drug plan perspective and include only drug-related costs that have a direct impact on the plan budget. The impact of other related costs associated with a broader health care system perspective (such as costs of physician visits, diagnostic procedures, and hospitalizations) should be presented in a scenario analysis.32 The sponsor also assumed vial sharing with 5% drug wastage in the calculation of treatment acquisition cost of nivolumab and comparators. However, drug wastage should be included, and treatment cost should reflect the cost of the number of units dispensed rather than consumed.32 Further, nivolumab and most of the components of comparator treatments (such as cisplatin, oxaliplatin, leucovorin and irinotecan) are available as a single-use product, as noted in the respective monographs,28,33,34 and assuming vial sharing would be inappropriate. Assuming 5% drug wastage (i.e., vial sharing) underestimates treatment acquisition cost and the BIA.
CADTH corrected the base case so that it reflected the drug plan perspective, including only drug acquisition costs and accounting for drug wastage (i.e., no vial sharing is assumed).
Update unit costs of 5-fluorouracil, oxaliplatin, leucovorin, and irinotecan, and align dosing regimen of CISPFU and capecitabine plus cisplatin with Cancer Care Ontario formulary: The sponsor leveraged published literature19-22 to obtain unit prices of 5-fluorouracil, oxaliplatin, leucovorin, and irinotecan. CADTH obtained the unit prices of these components using IQVIA Delta PA database5 and updated outdated costs to reflect changes in prices. In estimating treatment cost of CISPFU, the sponsor assumed a dosing regimen of 1,000 mg/m2 5-fluorouracil twice daily for 14 consecutive days every 3 weeks and a dosing regimen of 1,000 mg/m2 capecitabine once daily every 3 weeks for capecitabine plus cisplatin. These dosing regimens do not align with dosing regimens in Cancer Care Ontario Formulary.23 According to Cancer Care Ontario formulary,23 the dosing regimen for CISPFU includes 1,000 mg/m2 of 5-fluorouracil on days 1 to 4 every 3 to 4 weeks and the dosing regimen for capecitabine plus cisplatin includes 1,000 mg/m2 of capecitabine twice daily on days 1 to 14 every 3 weeks.
CADTH corrected the unit prices of 5-fluorouracil, oxaliplatin, leucovorin, and irinotecan to the most recent prices and aligned dosing regimens of CISPFU and capecitabine plus cisplatin with Cancer Care Ontario Formulary.23
Treatment cost of nivolumab was underestimated: The sponsor adopted weight-based dosing in estimating treatment cost of nivolumab plus chemotherapy, however, the product monograph7 recommends a flat-dosing strategy of nivolumab. According to the clinical experts, a mix of weight-based and flat-dosing strategy may be implemented in clinical practice, with nivolumab dose capped at 360 mg every 3 weeks or 240 mg every 2 weeks. However, the clinical experts also estimated 30% of patients may be administered nivolumab doses over the threshold. The sponsor has underestimated treatment cost of nivolumab and the budget impact by assuming weight-based dosing of nivolumab.
In CADTH reanalysis, nivolumab treatment cost was based on a flat-dosing strategy.
There is uncertainty in treatment duration of nivolumab in combination with chemotherapy: The sponsor based treatment duration of nivolumab, XELOX, and FOLFOX on trial1 data and some assumptions. The sponsor calculated annual treatment cost of nivolumab in combination with XELOX, assuming |||||||||||||| doses of nivolumab, |||||||| doses of oxaliplatin and |||||||||||||| doses of capecitabine administered on average. The annual treatment cost of nivolumab plus FOLFOX was based on ||||||| doses of nivolumab, ||||||| doses of oxaliplatin, |||||||||||||| doses of leucovorin and |||||||||||||| doses of 5-fluorouracil administered on average. The sponsor based treatment costs and duration on mean number of doses, however, the trial1 also provides the median treatment duration. Based on the median treatment duration, treatment with nivolumab plus XELOX includes 7.33 doses of nivolumab, 5.33 doses of oxaliplatin and 209.07 doses of capecitabine. Based on median treatment duration, treatment with nivolumab plus FOLFOX includes 8.93 doses of nivolumab, 6.13 doses of oxaliplatin and 11.8 doses of 5-flurouracil. Should the median treatment duration and number of doses be assumed, the treatment cost of nivolumab, XELOX, and FOLFOX, and budget impact may be overestimated in this review. As such, there is uncertainty in treatment duration of nivolumab.
CADTH explored the impact of uncertainty in treatment duration on budget impact in a scenario analysis, assuming median treatment duration and number of doses for nivolumab and chemotherapy (XELOX/FOLFOX).
Market share of nivolumab and comparators may not reflect likely use: The sponsor assumed nivolumab has a market share of |||||||% by year 3. According to the clinical experts consulted for this review by CADTH, the market share of nivolumab may be higher than estimated in a scenario where there is no other immunotherapy available for the indication of interest in the market mix. Should nivolumab be the only drug available in the market for the indication of interest, the market share of nivolumab, and therefore budget, impact would be higher than estimated in this review.
The sponsor assumed that FOLFIRI has a market share of 20% and CISPFU has a market share of 15% at baseline. FOLFIRI is typically used in the treatment of patients who are not candidates for platinum therapy, and other comparator treatments (CISPFU, capecitabine plus cisplatin, and FEP) are rarely used in clinical practice to treat patients with the indication of interest according to the clinical experts consulted for this review. However, these chemotherapy regimens are available in the formulary and so, may be used by some physicians in clinical practice. According to the clinical experts, most patients with the indication of interest have difficulty with swallowing, and infusion treatments are preferred. FOLFOX is more commonly used chemotherapy in clinical practice, followed by XELOX. As such, there is high uncertainty associated in the market share of nivolumab and comparators.
In the CADTH reanalysis, FOLFIRI is excluded from the market mix, with its market share divided equally over commonly used chemotherapies, FOLFOX and XELOX.
CADTH explored the impact of assuming 1.5% growth rate in market share of nivolumab in a scenario analysis.
CADTH explored the impact of assuming lower market share of CISPFU at baseline in a scenario analysis. The market share is decreased from 15% to 5%, with its market share divided equally over FOLFOX and XELOX.
CADTH explored the impact of excluding FOLFIRI, CISPFU, capecitabine plus cisplatin, and FEP from the market mix in a scenario analysis, with its market share divided equally over FOLFOX and XELOX.
CADTH Reanalyses of the Budget Impact Analysis
CADTH corrected the sponsor’s base case by updating unit prices of 5-fluorouracil, oxaliplatin, leucovorin, and irinotecan, aligning dosing regimen of CISPFU and capecitabine plus cisplatin with Cancer Care Ontario formulary and adopting the public drug plan perspective. CADTH revised the sponsor’s base case by assuming 85% of patients have HER2-negative status, including drug wastage, assuming flat-dosing of nivolumab, and excluding FOLFIRI from the market mix.
Table 15: CADTH Revisions to the Submitted Budget Impact Analysis
Stepped analysis | Sponsor’s value or assumption | CADTH value or assumption |
|---|---|---|
Correctionsa to sponsor’s base case | ||
1. Update unit prices | 5-FU = $0.0300/mg Oxaliplatin = $10.2000/mg Leucovorin = $0.0500/mg Irinotecan = $0.5000/mg Cisplatin = $2.0000/mg Ramucirumab: $9.094/mg Paclitaxel: $9.710/mg | 5-FU = $0.0322/mg Oxaliplatin = $0.7254/mg Leucovorin = $0.1488/mg Irinotecan = $0.0810/mg Cisplatin = $2.7000/mg Ramucirumab: $6.201/mg Paclitaxel: $10.000/mg |
2. Dosing regimen | CISPFU: 1,000 mg/m2 5-FU twice daily for 14 consecutive days Q3W Capecitabine plus cisplatin: 1,000 mg/m2 capecitabine once daily Q3W | CISPFU: 1,000 mg/m2 5-FU once daily on days 1 to 4 Q3W Capecitabine plus cisplatin: 1,000 mg/m2 capecitabine twice daily on Days 1 to 14 Q3W |
3. Public payer perspective | Include: • Drug acquisition costs • Monitoring costs • Drug administration costs • Adverse event costs | Include: • Drug acquisition costs |
Changes to derive the CADTH base case | ||
1. HER2-negative rate | 77% | 85% |
2. Drug wastage | Vial sharing: 5% wastage | Vial sharing: No |
3. Nivolumab treatment | Weight-based dosing | Flat-dosing |
4. Market share of FOLFIRI | 20% | 0% |
CADTH base case | Reanalysis 1 + 2 + 3 + 4 | |
CISPFU = Cisplatin-5-fluorouracil, FOLFIRI = Folinic Acid (Leucovorin)-Fluorouracil-Irinotecan, Q3W = every 3 weeks, 5-FU = 5-Flourouracil
In the CADTH reanalysis, the 3-year budget impact of reimbursing nivolumab from the public drug plan perspective for the first-line treatment of adults with HER2-negative advanced or metastatic gastric, gastroesophageal junction, or esophageal adenocarcinoma increased to $198,898,038 (Year 1: $57,115,126; Year 2: $66,231,528; Year 3: $75,551,384).
The results of the CADTH step-wise reanalysis are presented in summary format in Table 16 and a more detailed breakdown is presented in Table 17.
Table 16: Summary of the CADTH Reanalyses of the BIA
Stepped analysis | Three-year total ($) |
|---|---|
Submitted base case | 174,128,355 |
CADTH correction 1 | 161,133,823 |
CADTH correction 2 | 173,464,238 |
CADTH correction 3 | 166,514,065 |
Sponsor’s base case, corrected | 152,807,104 |
Stepped analysis | |
CADTH reanalysis 1 | 168,683,167 |
CADTH reanalysis 2 | 158,889,097 |
CADTH reanalysis 3 | 179,945,147 |
CADTH reanalysis 4 | 153,021,752 |
CADTH base case | 198,898,038 |
BIA = budget impact analysis
CADTH also conducted additional scenario analyses to address remaining uncertainty, using the CADTH base case. Results are provided in Table 17. The scenario analysis involved:
Assume HER2-negative rate of 90%.
Assuming recurrence rate of 45%.
Assuming median treatment duration for nivolumab and chemotherapy, XELOX and FOLFOX.
Assuming 1.5% growth rate in market share of nivolumab (year 1 = 42%, year 2 = 48% and year 3 = 55%).
Assuming market share of CISPFU is 5% at baseline.
Excluding FOLFIRI, CISPFU, capecitabine plus cisplatin, and FEP from the market mix.
Price reduction of nivolumab by 95%.
Table 17: Detailed Breakdown of the CADTH Reanalyses of the BIA
Stepped analysis | Scenario | Year 0 (current situation) | Year 1 | Year 2 | Year 3 | Three-year total |
|---|---|---|---|---|---|---|
Submitted base case, public drug plan perspective | Reference | 21,552,009 | 21,801,552 | 22,053,983 | 22,309,338 | 66,164,873 |
New drug | 21,552,009 | 69,617,367 | 77,501,896 | 85,559,676 | 232,678,938 | |
Budget impact | 0 | 47,815,815 | 55,447,913 | 63,250,338 | 166,514,065 | |
Submitted base case, corrected | Reference | 10,617,145 | 10,740,077 | 10,864,432 | 10,990,227 | 32,594,736 |
New drug | 10,617,145 | 54,619,831 | 61,748,031 | 69,033,978 | 185,401,840 | |
Budget impact | 0 | 43,879,754 | 50,883,599 | 58,043,751 | 152,807,104 | |
CADTH base case, public drug plan perspective | Reference | 13,372,014 | 13,526,843 | 13,683,465 | 13,841,901 | 41,052,210 |
New drug | 13,372,014 | 70,641,969 | 79,914,994 | 89,393,285 | 239,950,248 | |
Budget impact | 0 | 57,115,126 | 66,231,528 | 75,551,384 | 198,898,038 | |
CADTH scenario analysis: 90% HER2-negative status | Reference | 14,158,603 | 14,322,540 | 14,488,375 | 14,656,130 | 43,467,046 |
New drug | 14,158,603 | 74,797,379 | 84,615,876 | 94,651,714 | 254,064,969 | |
Budget impact | 0 | 60,474,839 | 70,127,501 | 79,995,583 | 210,597,923 | |
CADTH scenario analysis: 45% recurrence rate | Reference | 15,803,289 | 15,986,270 | 16,171,368 | 16,358,610 | 48,516,248 |
New drug | 15,803,289 | 83,485,964 | 94,444,993 | 105,646,610 | 283,577,566 | |
Budget impact | 0 | 67,499,694 | 78,273,624 | 89,287,999 | 235,061,318 | |
CADTH scenario analysis: median treatment duration | Reference | 12,889,390 | 13,038,631 | 13,189,600 | 13,342,317 | 39,570,548 |
New drug | 12,889,390 | 43,149,941 | 48,107,112 | 53,173,292 | 144,430,345 | |
Budget impact | 0 | 30,111,310 | 34,917,512 | 39,830,975 | 104,859,797 | |
CADTH scenario analysis: 1.5% growth rate in market share of nivolumab | Reference | 13,372,014 | 13,526,843 | 13,683,465 | 13,841,901 | 41,052,210 |
New drug | 13,372,014 | 71,498,696 | 81,916,842 | 92,844,350 | 246,259,887 | |
Budget impact | 0 | 57,971,853 | 68,233,376 | 79,002,449 | 205,207,678 | |
CADTH scenario analysis: 5% market share of CISPFU | Reference | 12,881,042 | 13,030,187 | 13,181,058 | 13,333,676 | 39,544,921 |
New drug | 12,881,042 | 70,348,942 | 79,648,718 | 89,154,419 | 239,152,079 | |
Budget impact | 0 | 57,318,755 | 66,467,660 | 75,820,743 | 199,607,158 | |
CADTH scenario analysis: Excluding FOLFIRI, CISPFU, capecitabine plus cisplatin, and FEP | Reference | 12,473,440 | 12,617,865 | 12,763,962 | 12,911,751 | 38,293,578 |
New drug | 12,473,440 | 70,105,672 | 79,427,657 | 88,956,115 | 238,489,443 | |
Budget impact | 0 | 57,487,807 | 66,663,695 | 76,044,364 | 200,195,866 | |
CADTH scenario analysis: price reduction of 95% | Reference | 13,372,014 | 13,526,843 | 13,683,465 | 13,841,901 | 41,052,210 |
New drug | 13,372,014 | 16,331,685 | 16,936,001 | 17,552,121 | 50,819,808 | |
Budget impact | 0 | 2,804,842 | 3,252,535 | 3,710,220 | 9,767,598 |
BIA = budget impact analysis; CISPFU = Cisplatin-5-fluorouracil, FOLFIRI = Folinic Acid (Leucovorin)-Fluorouracil-Irinotecan, FEP = Fluorouracil-Cisplatin-Epirubicin, 5-FU = 5-fluorouracil.
Stakeholder Input
Patient Group Input
My Gut Feeling
About My Gut Feeling
My Gut Feeling – Stomach Cancer Foundation of Canada is the first non-profit organization in Canada, dedicated to providing support, awareness, education, information and advocacy to stomach cancer patients, survivors and caregivers. My Gut Feeling was founded by two stomach cancer survivors; although the organization was initially developed to help people affected by stomach cancer, people with gastroesophageal (GEJ) and esophageal cancer are included in our services and receive ongoing support. Our goals are to dispel misconceptions, to provide information on the day to day journey of being diagnosed, living with and surviving cancer, and to improve the quality of life, give a voice to patients and caregivers, and provide peer mentorship based on lived experience with cancer. Website: https://mygutfeeling.ca
Information Gathering
In order to represent the patient and caregiver voice, My Gut Feeling - Stomach Cancer Foundation of Canada conducted an international survey to understand the perspective of patients and caregivers affected by gastric, esophageal and/or gastroesophageal (GEJ) cancer including experiences with current treatment and the novel immunotherapy under review. My Gut Feeling launched an online patient and caregiver survey between August 20th, 2021 to September 9th, 2021. The survey link was posted on My Gut Feelings’s social media platforms (including Facebook, Instagram and Twitter) as well as the email distribution list for all members. The survey was also shared in private online groups for patients with Esophageal Cancer, Lynch Syndrome and Stomach Cancer.
In total, sixty-two people completed the survey, of those, half identified as patients and half as caregivers. Specifically, 79.0% or respondents identified as female and 21.0% identified as male. Respondents were diagnosed across all ages ranging from 20 to 80 years old: 20-30 years (14.5%), 31-40 years (9.7%), 41-50 years (14.5%), 61 to 70 years (32.3%), and 71-80 years (4.80%), 81 and over (3.2%). Data was gathered internationally with 62.9% of respondents residing in Canada, 29% in the United States and 8.1% residing outside of North America. To ensure unbiased data collection, respondents were asked to refrain from using personal identifiers to preserve anonymity.
Respondents included in this survey had a diagnosis of gastric, esophageal and/or gastroesophageal (GEJ) cancer. The majority of respondents (74.2%) had gastric cancer and the remainder had either esophageal and/or GEJ cancer. Of the respondents, 9.7% were diagnosed with stage one, 9.7% with stage two, 25.8% with stage three, 25.8% with stage four and the remainder of respondents were not given or were not aware of their cancer stage. When the cancer metastasized, in 27.0% it had spread to lymph nodes, 27.9% to peritoneum, 23.3% to liver and the remainder to other locations including the lungs, bowel and pelvic structures. Most patients (82.3%) had adenocarcinoma, the remainder (14.5%) had squamous cell carcinoma. When asked about other cancer factors, 50% of respondents were told they had microsatellite stable disease, 17.7% had HER-2 negative and 9.7% had HER-2 positive. We had attempted to inquire about other tumor pathology as well as CPS testing, however most patients were not aware of their status.
Disease Experience
Most respondents (90.3%), felt that the cancer diagnosis had a significant impact on their quality of life, only (6.5%) felt it had a minimal impact and (1.6%) felt it had no impact on quality of life. Areas affected were physical health, mental health, ability to eat, work, finances, social life, identity, and personal image. We received an overwhelming amount of direct quotes from patients and caregivers describing their disease experience; we attempted to pick direct quotes that best exemplified these challenges. For example one patient wrote “The whole family’s life and dynamic changed as a result of [the] diagnosis. There was very minimal support from the medical team and we felt thrown into this whole new and very scary journey… we had to figure out everything on our own...the family had to take full control to help and support through treatment… every part of our lives changed.” It was not just the patient affected but the entire family, for example a patient wrote that “[cancer] certainly stopped my life and my family’s lives while I did treatment and surgery. I gave up my job after being diagnosed while my husband had to work twice as hard, it was extremely hard on my 19-year-old daughter”.
Respondents commented on the physical implications of cancer and its treatment. Weight loss and fatigue were mentioned most by respondents, for example, one patient wrote “[there were] many complications with surgeries which caused me to lose 40+ pounds. I was unable to stand to shower as my legs were not physically strong enough to hold me up anymore. I am now malnourished and struggling to gain weight”. Another patient wrote “I was unable to eat solid foods without regurgitating it all, I lost weight, I could feel a pressure on the middle of my spine. My surgery left me with a stoma and a feeding tube for all nutrition and hydration.”
In addition to physical implications, mental health was significantly affected. Both patient and caregiver respondents (especially those with metastatic disease) felt hopeless regarding their prognosis. For example, one person wrote: “esophageal cancer with metastasis is basically a death sentence, so mentally every day we both felt that time was limited. It's an awful feeling that your partner will eventually die of this. This was very depressing for both of us”. Another caregiver stated that “everything was impacted [by cancer]...The fact that we live with the fear that the cancer progresses every day, the fact that the treatments available are just palliative and do not give too much hope. My husband is now on disability from work, no social life because nobody understands the impact of this disease, hard to go out or travel as eating can be a challenge, no sexual life as the depression set in. it is a life waiting for bad news unfortunately”. A mother with stomach cancer wrote “I have a great deal of anxiety around my health and my immediate family. I worry constantly about what it's doing to my kids. Both of my kids have begun doing counseling and I have guilt around that. I want them to just have a normal childhood and not have to deal with this”. Pre-existing mental health issues became amplified, for example “I have always struggled with depression and anxiety. Getting cancer and going through treatment (losing my hair especially, and weight) caused me to have extreme depression. I truly did not want to be alive anymore.”
Many respondents had concerns over finances due to inability to maintain work due to the diagnosis and/or treatment for cancer. The cancer treatment, the physical and mental symptoms, the time commitment to treatment and the additional costs to treatment created financial strain for patients and caregivers. For example, one patient wrote “I am so weak I can no longer have a job, haven’t for a year. I am struggling to pay bills. My family is very close but this has caused a lot of strain on our relationships.” Other respondents commented on the impact of cancer on their relationships with others. For example, one patient wrote “ Now my husband has to do everything that I used to do around the house. I feel like a burden on him. It is difficult to go out with friends when I feel sick and tired so much.” Another patient wrote “I do not have a social life at all. I struggle extremely bad with my body image which definitely affects my relationship with my SO when it comes to intimacy. I can no longer do things I used to love to do because my body is just not strong enough.”
Objectively when asked to rank symptom burden, respondents commented that both the cancer itself and the treatments to control the cancer played a major impact on their daily living. Patients and caregivers were asked if any esophageal/GEJ cancer-induced symptoms were experienced prior to diagnosis. All (100%) of respondents had experienced at least one symptom prior to being diagnosed. Changes in appetite (69.4%), weight loss (64.5%), pain (56.5%), reflux (33.9%), nausea/vomiting (30.6%) and anemia/blood work abnormalities (30.6%) were the most reported symptoms. Other significant symptoms included difficulty swallowing (27.4%), shortness of breath (24.2%), bleeding (22.6%) and ascites (21.0%). Less reported symptoms included dumping syndrome, feeling a mass, jaundice, blood clot, bowel obstruction, food regurgitation, chest pain, back pain and exercise intolerance (Figure 1). Respondents commented that these symptoms impacted their day to day life.
Figure 1: Patient and Caregiver Reported Symptoms Prior to Diagnosis With Gastric, Esophageal or Gastroesophageal Cancer
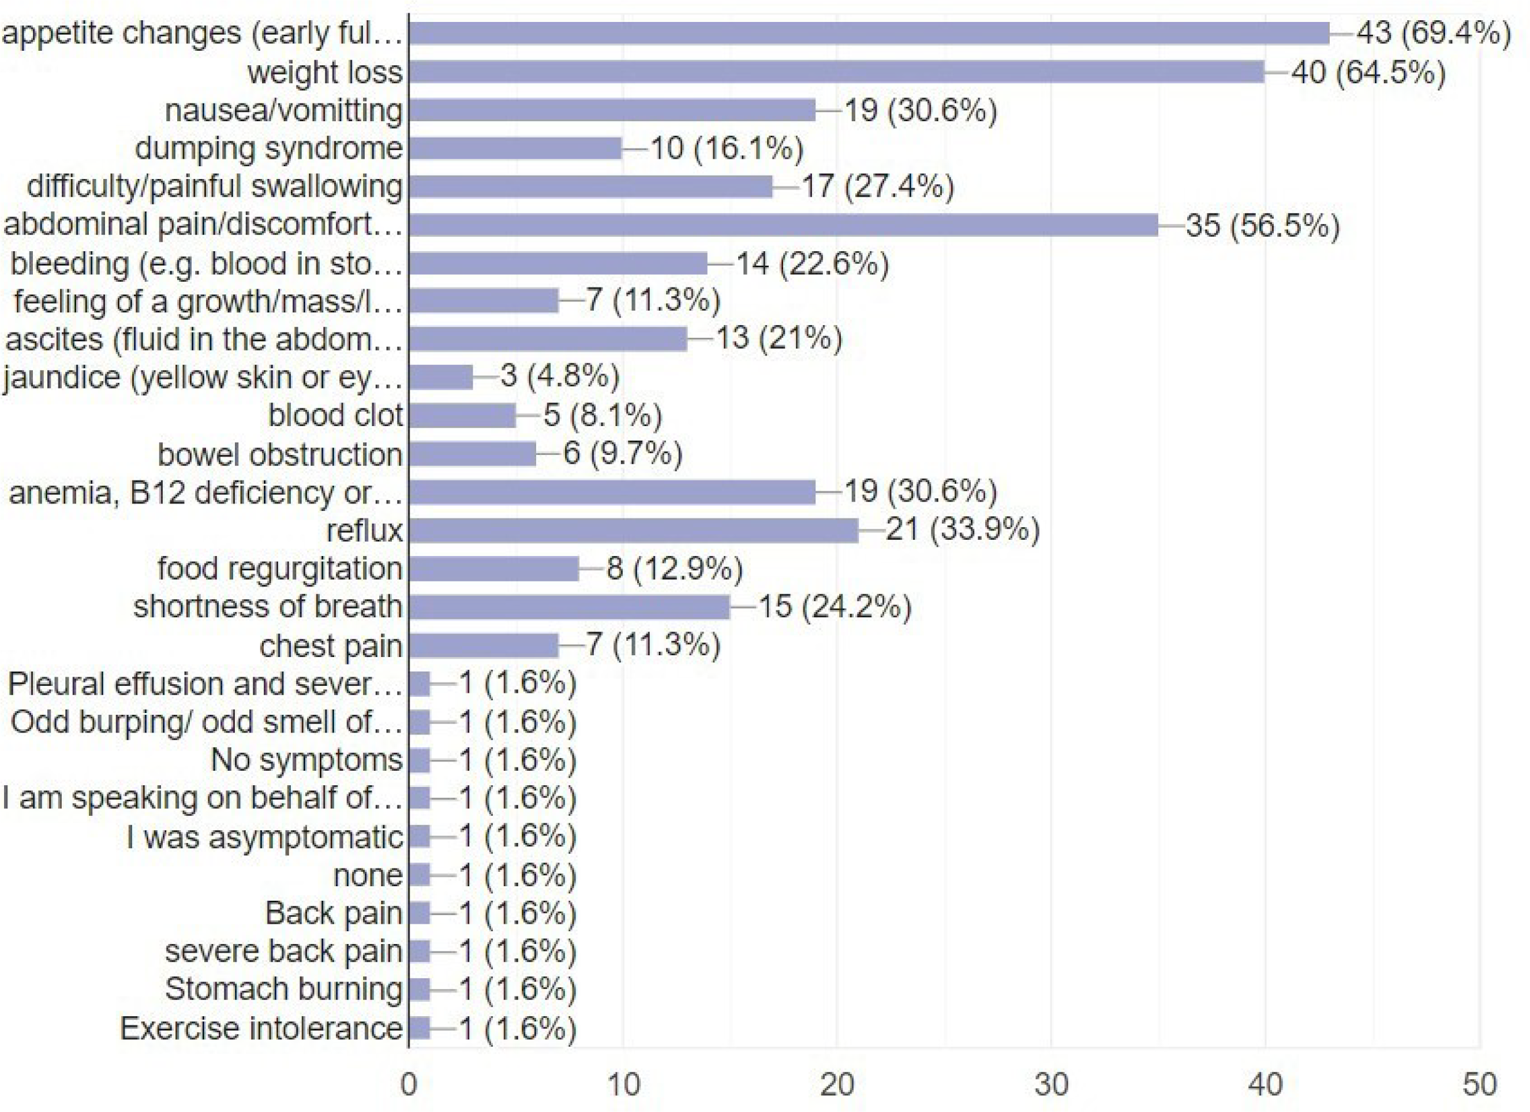
Experiences With Currently Available Treatments
Respondents reported that they had experience with a variety of treatment modalities. Of those that pursued treatment: 83.9% had chemotherapy, 69.4% had surgery, 27.4% had radiation alone, 8.1% had chemo-radiation, 25.8% had immunotherapy and 5.2% had alternative therapy. Respondents had experience with a variety of systemic treatments including CROSS (Carboplatin/paclitaxel), FOLFOX, Capecitabine, XELOX, FLOT, Transtuzumab, Pembrolizumab, Ramicirumab, Paclitaxel, Nivolumab and Lonsurf. Participants were asked to evaluate the effectiveness of their treatment on a scale of 1 to 10 (1 = “not effective”, 10 = “very effective”). Figure 2 demonstrates that responses were split. Respondents were able to comment on why they gave the specific ranking. Those that ranked their care as five and below cited recurrence, tumor progression, side effects and lack of alternatives as the reason for finding the treatment less effective. For example one patient stated they provided this ranking “simply because it is not a cure. First line chemo held cancer at bay for almost a year, and I now started on second line. I wish immunotherapy was available to me”. Some respondents felt that despite disease stability, the quality of life implications lead to dissatisfaction with current therapies, for example, one patient wrote that “even if the CT scans are good, the difficulty eating has persisted and it impacts the quality of life- eating in public, choking on food, nausea, vomiting during meals”. The respondents that replied with a rating of greater than 5 cited that they were satisfied with their treatment because it caused the cancer to shrink, caused a reduction of symptom burden or resulted in remission. Additionally we asked participants to rank the following statement on a 1 to 5 scale (1 = “disagree” and 5 = “agree”) “my current therapy(ies) are able to manage my cancer symptoms." The majority of respondents (46.8%) rated the statement as a 4 or 5. Where 27.4% were in the middle, ranking the statement as a 3. The remainder (25.8%) ranked the statement as a 1 or 2.
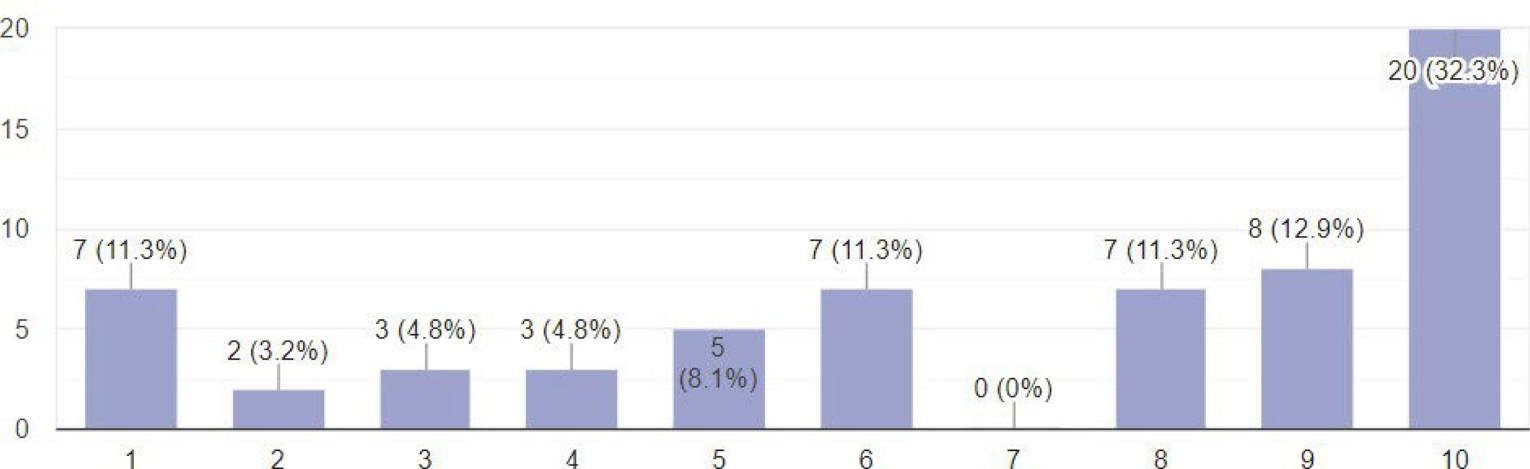
While current therapies lead to a mixed satisfaction from respondents in terms of perceived efficacy and cancer control, current treatments have a variety of side effects impacting quality of life. All respondents identified at least one treatment related side effect with 88.0% reporting fatigue. Other common symptoms included weight loss (71.0%), appetite changes (67.7%), taste changes (69.4%), nausea/vomiting (64.5%), diarrhea (62.9%), alopecia (59.7%), brain fog (58.1%), constipation (48.4%), neuropathy (45.2%) and abdominal pain (41.9%). Less common symptoms included reflux, anemia, blood clots, infection, body aches, skin rash, hand-foot syndrome, insomnia, mucositis, dumping syndrome and blood-work abnormalities (Figure 3). Respondents were able to leave additional comments regarding their treatment experiences. We asked respondents to identify the top 3 “worst” symptoms from treatment. While fatigue and appetite changes leading to weight loss were reported as some of the worst side effects of treatment, there was no overall consensus regarding the functionally impairing side-effects of treatment, thus demonstrating how participants vary in evaluating perceived side-effects. While most (38.7%) were able to tolerate treatment as prescribed, 14.5% had to stop treatment because of being hospitalized for an adverse event, 12.9% received a dose reduction in treatment and 8.1% had to delay or skip a treatment cycle of systemic therapy. It is apparent from this survey that for the majority of respondents the currently available treatments had significant implications on quality of life.
Figure 3: Patient and Caregiver Reported Side Effects While on Treatment for Gastric, Esophageal or Gastroesophageal Cancer
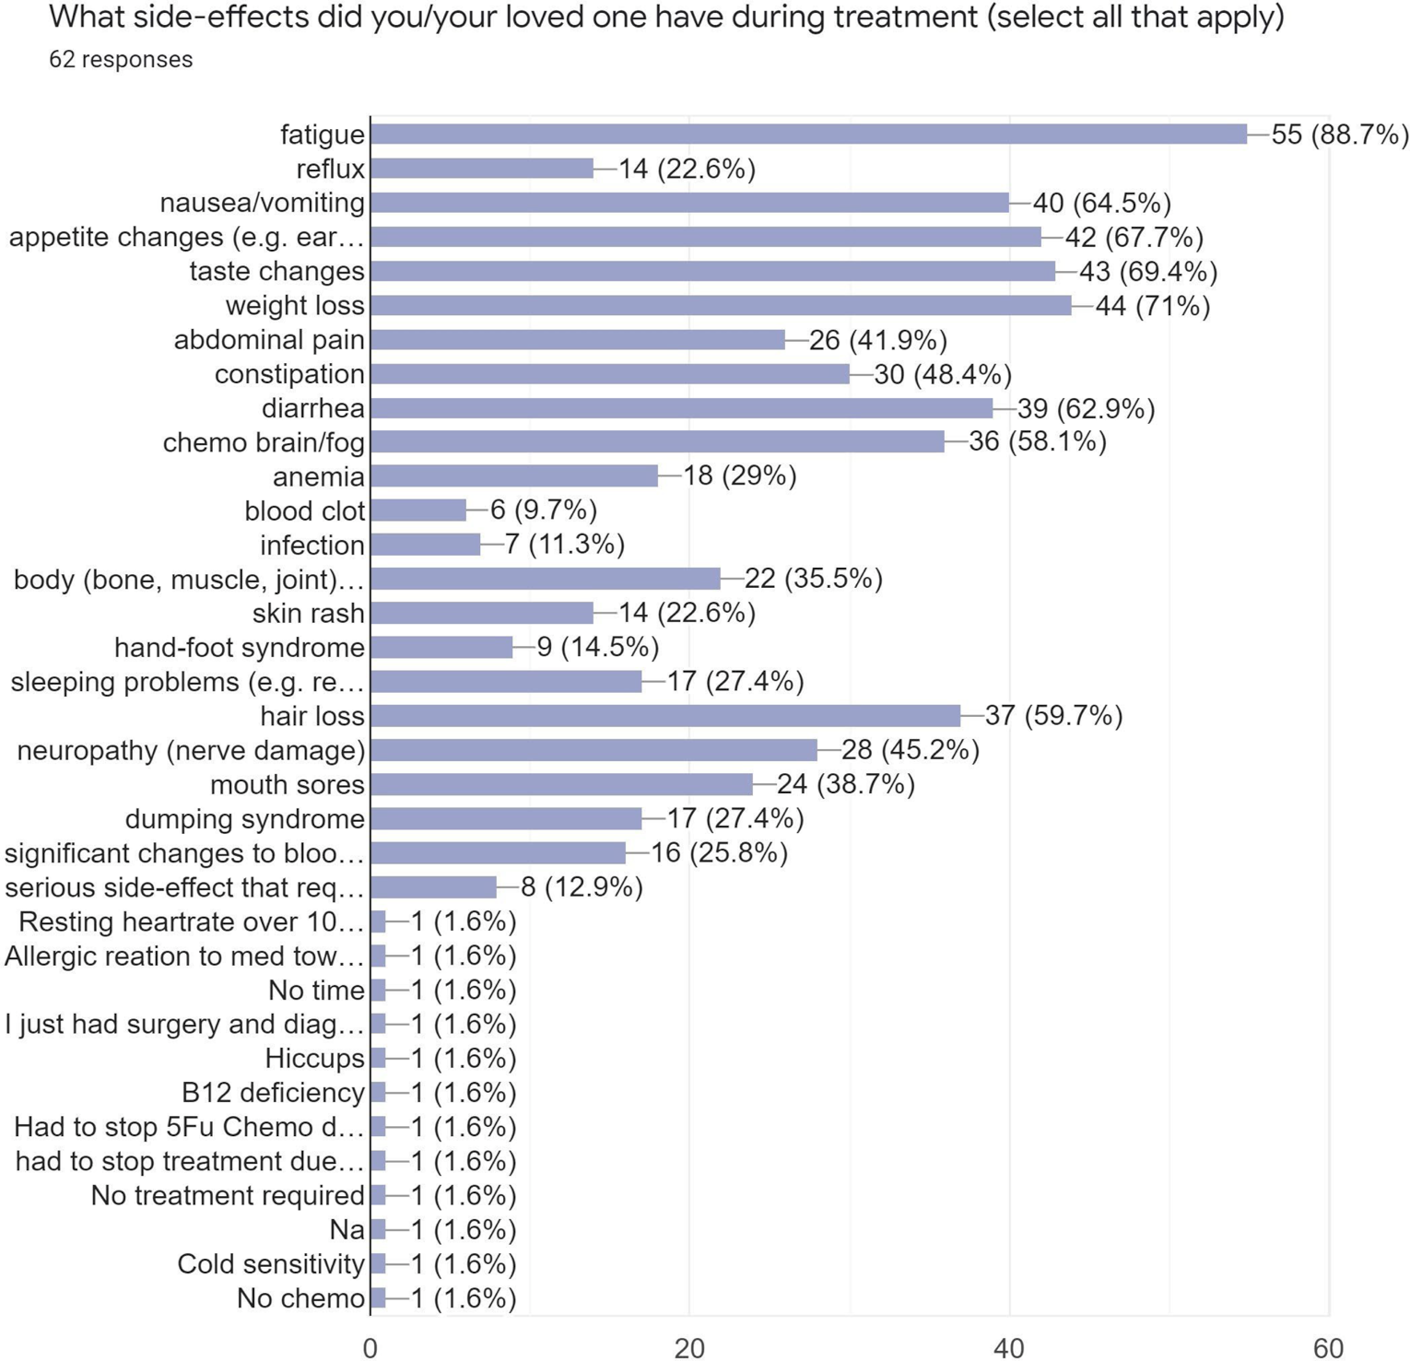
Improved Outcomes
When evaluating their treatment options, patients and caregivers considered multiple factors such as quality of life, treatment side effects, cost of treatment, convenience of treatment, duration of treatment and the survival benefits. Respondents recognized that treatments had trade-offs and each respondent placed a different value on these considerations based on their preferences. For example, when asked “how important is it for you that new therapies bring about improvement in quality of life”. Almost all respondents (83.9%) replied with a 10 or “extremely important”. While cancer control was an important consideration, treatment came at a cost to quality of life which may not be tolerable to all patients. For example, one patient wrote “I only completed 3 out of 7 chemo treatments... too many side effects to continue and I wanted to enjoy my life, however long”. In contrast another patient wrote that she had “4.5 years of chemo, various surgeries, many hospital stays but it give 4.5 years…no idea what might have happened under other choices...The side-effects were bad but I am still here”. Convenience of treatment was another consideration for patients and caregivers. For example patients preferred an oral chemotherapy taken at home to an IV chemotherapy administered in a hospital, favouring less frequent visits to the hospital. Patient satisfaction also depended on the medical team. Patients wished to have frequent discussions with their oncologist to discuss options and preferred to be a part of the decision making process. A patient wrote that “the list of potential risks and complications in my treatment and surgery was long, but I listened to my oncologists and thoracic surgeon and trusted their advice. They knew my age and relative health and that I wanted to be around to watch my children grow up”.
We asked respondents if they would pay out of pocket for additional therapies. The majority of respondents were interested in discussing treatment options even if they were not covered by their current healthcare plan or universal healthcare. Most, 41.0%, replied with a “yes”. The remainder of respondents stated they would “maybe” pay for these treatments if the treatment improved survival (27.4%), maybe - depending on cost (21.0%) and maybe - depending on side effects (10.6%). This once again demonstrates that while survival is important, respondents place different values on quality versus quantity of life. While our survey found that most people (77.4%) did not have to pay directly out of pocket for specific treatments, the remainder of respondents (22.6%) directly paid for some or all of their treatment. Immunotherapy that was not covered by universal healthcare or insurance appeared to be one of the therapies most commonly paid for out of pocket. Respondents quoted the cost of immunotherapy ranging from $6,000 to $10,000 per month. Some respondents were able to use private insurance but stated that despite this, they still had to pay several thousands of dollars for immunotherapy, for example one patient cited “$40,000 with co-pay so far”. Another avenue to improve patient outcomes may be achieved through providing equal access to treatment access. Respondents received access to treatment through publicly funded healthcare, private insurance, drug access programs, Access to Hope, personal savings or donations. However at this time there is no universal coverage for immunotherapy, making it a challenge for patients to decide on whether to pursue this treatment at the high expense.
Treatment access varied by geographic location, for example a respondent from India said “All we have is surgery here if you’re lucky, no chemo and no immunotherapy”. Standard of care treatments such as surgery or chemotherapy were more accessible than novel therapies such as immunotherapy. Barriers to access identified included institutional and health care system barriers, limited availability of treatment and how quickly treatment could be accessed. Respondents had many great suggestions in terms of how to better access treatment. For example, one patient wrote “more interactive website of the Canadian Cancer Society advising on options available to cancer patients in Canada with regards to second opinions, alternative treatments, new research reports.”. Unanimously, 96.8% of respondents felt it was “extremely important” to have access to more treatment and 91.9% felt that these cancers needed to have more advocacy to have funded treatment options. One patient wrote simply that we need “increased approval of treatment options, pharmacare and universal coverage for treatments and more overall funding”. While current treatments options may improve patient survival, there are clear limitations in available treatment options, access to new therapies and patient centred discussion regarding options. Patients and caregivers want more options to choose from so that they can make informed decisions based on their values and preferences.
Experience With Drug Under Review
In our survey, twelve respondents had experience with Nivolumab (Opdivo), the drug under review. The majority (26.7%) of respondents used it in combination with chemotherapy, 13.4.% used it after chemotherapy, 13.3% after surgery, and 6.7% before chemotherapy. In these respondents, 30.8% accessed the drug through self-pay, 15.4% through clinical trial, 7.7% through a special access program at the hospital, 7.7% through a special access program through a pharmaceutical company and 7.7% through private insurance. At the time of the survey, 23.1% were actively on this drug and had been on it for at least more than one month. The duration of use showed that 23.1% were on the drug for 1-3 months, 15.4% were on the drug for 3-6 months, 7.7% were on the drug for 6-9 months, 7.7% for over 12 months. Participants commented that they were satisfied with this drug primarily because it had less side-effects and was more convenient than their standard of care treatment such as chemotherapy or surgery. Fatigue continued to be the most reported symptom, however overall the side effect profile appeared to be much less relative to standard of care treatment. (Figure 4).
Figure 4: Reported Side-Effects From Nivolumab Combined Between Patients and Caregivers With Gastric, Esophageal and GEJ Cancer
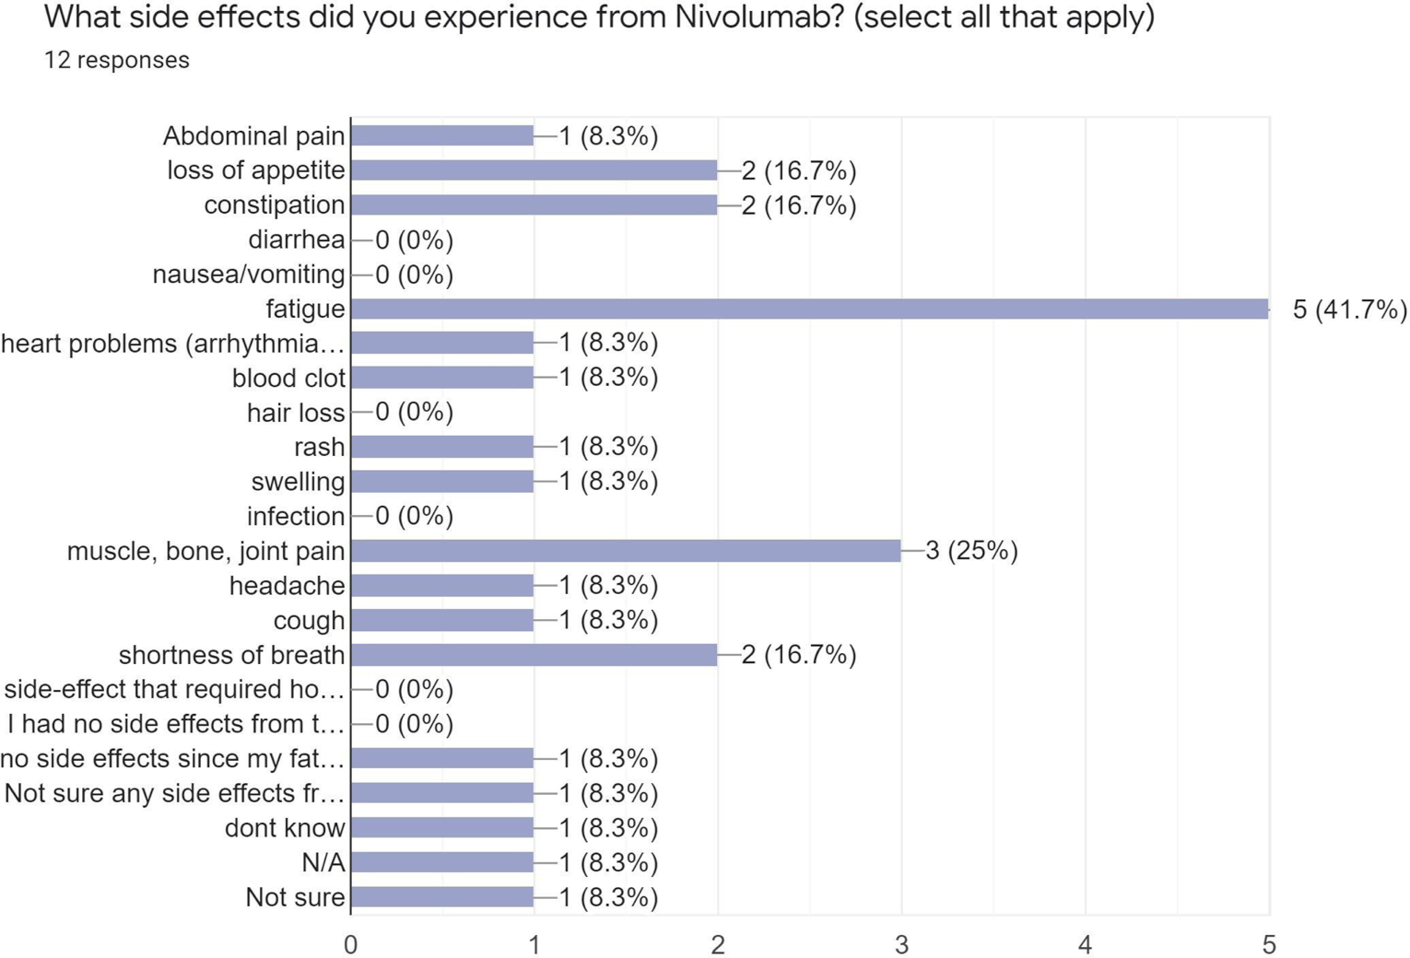
When asked to rate the statement “compared to other previous treatments Nivolumab was easier to tolerate overall” (1= “strongly disagree”, 5= “strongly agree”), 71.4% respondents selected 5 as “strongly agree” and the remainder (28.6%) ranked it as 4 or “agree”. When asked to rate the statement “Nivolumab has improved my quality of life” on a 1 to 10 scale (1=“strongly disagree”, 10 = “strongly agree”), 71.4% selected 10 or “strongly agree”, 14.3% selected 9 and 14.3% selected 8 as a rating. Respondents who were satisfied with the drug mentioned disease control, for example one patient stated “cancer seems to be under control for the first time; mild fatigue is the only side effect; infusion is quick”. One patient mentioned that their cancer symptoms improved “for a short period while the cancer had shrunk enough to be able to eat "normal" food”. Other patients were satisfied because of the minimal side effect profile, for example “It has very little side effects, it doesn’t leave me bed ridden and it is working to control the cancer” another mentioned “No pain, gain weight, hair growth, living normal”. Another patient reported “It has very little side effects, it doesn’t leave me bed ridden and it is working to control the cancer”. When asked if respondents had additional comments regarding Nivolumab, one patient cited that she believed that: “from past clinical trials conducted in the US, opdivo has shown improved survival in advanced gastric cancer patients. It needs to be accessible by all gastric cancer patients.” Another patient said they felt that “It should be covered under health plans and part of government funding”. Lastly, another patient simply stated that the drug gave them “hope to live long enough to see my kids grow up”. Although most patients were not treated directly with Nivolumab, our survey generated additional comments with respondents asking for more information about Nivolumab. This again demonstrates a need for patients and caregivers to have options and information on novel therapies that could improve the length and/or quality of life.
Companion Diagnostic Test
We did not ask questions related to companion diagnostic testing.
Anything Else?
Being diagnosed with any cancer is challenging. Gastric, esophageal and gastroesophageal cancers are rare in Canada with few treatment options. For those patients and caregivers impacted by this diagnosis, having options is important since it brings about a sense of control and hope at a time when cancer strips the patient and family of their identity. This survey administered by My Gut Feeling shows that there is an unmet patient and caregiver need to receive equitable access to therapies that may prolong life, improve symptoms, reduce risk of recurrence and improve treatment tolerability. My Gut Feeling strongly supports the use of Nivolumab in combination with fluoropyrimidine-and platinum-containing chemotherapy, for the treatment of adult patients with advanced or metastatic gastric, gastroesophageal junction or esophageal adenocarcinoma.
Targeted therapy is the future of oncology and there are subsets of gastric, esophageal and gastroesophageal cancer patients that can benefit from drugs such as Nivolumab. While surgery and chemo-radiation continues to be the gold standard of care for this population these come at a great cost to physical and mental health with implications on all life domains. While most respondents surveyed were on active treatment. Even respondents that had completed treatment continued to struggle years after treatment suggesting that the cost of standard treatment such as surgery and chemotherapy has lifelong implications on quality of life. For example, one patient commented: “I had completed my treatments but still continued to lose weight and was unable to eat comfortably. I had a total meltdown. I felt like I was not meeting any of the markers for recovery my team was suggesting I should be at. I thought perhaps I had beaten cancer but I was going to die anyway because I couldn't stop losing weight. It was really the lowest point for me mentally - because there had always been the hope if I could only get through the treatments things would start getting better for me. And then they didn't for so many years - it was all so devastating.”
Based on the objective research completed over a short time frame, the conclusion of My Gut Feeling - Stomach Cancer Foundation of Canada is to strongly support the use of Nivolumab in combination with fluoropyrimidine- and platinum-containing chemotherapy, for the treatment of adult patients with advanced or metastatic gastric, gastroesophageal junction or esophageal adenocarcinoma. From our survey we drew the following conclusions:
Patients need to be informed of their treatment options without barriers; including standard of care options and novel therapies: As expressed by a caregiver:
"More time with physician’s to really discuss options and explain the process. We really felt thrown into everything and with no knowledge of the cancer process, we had no clue what we were in for or what were our options. Only later did we become aware of other treatments and trials that we just advocated for ourselves, but at that point we were just too late…"
New therapies need to have an impact on both survival and quality of life. Patients and caregivers should have a choice in treatment options based on their own personal preferences. As stated by a patient: "A treatment with less side effects would be good in the future with a more realistic picture from the medical professionals about what life is going to be like afterwards and the time frames involved to prepare people better and manage expectations."
Treatment options should be available barrier free for all Canadians, covered under the universal healthcare system to benefit the subset of cancer patients that would benefit from this therapy. As stated by a patient: "[treatment] needs to be equitable wherever you live and it should be paid for. No exceptions."
Patient Group Conflict of Interest Declaration
To maintain the objectivity and credibility of the CADTH CDR and pCODR programs, all participants in the drug review processes must disclose any real, potential, or perceived conflicts of interest. This Patient Group Conflict of Interest Declaration is required for participation. Declarations made do not negate or preclude the use of the patient group input. CADTH may contact your group with further questions, as needed.
Did you receive help from outside your patient group to complete this submission? If yes, please detail the help and who provided it.
No, My Gut Feeling independently completed this submission
Did you receive help from outside your patient group to collect or analyze data used in this submission? If yes, please detail the help and who provided it.
No, My Gut Feeling independently collected and analyzed data used for this submission
List any companies or organizations that have provided your group with financial payment over the past two years AND who may have direct or indirect interest in the drug under review.
Table 1: Conflict of Interest Declaration for My Gut Feeling
Company | Check Appropriate Dollar Range | |||
|---|---|---|---|---|
$0 to 5,000 | $5,001 to 10,000 | $10,001 to 50,000 | In Excess of $50,000 | |
Ely Lilly Canada Inc. | — | — | — | X |
Taiho Pharma Canada Inc. | — | — | X | — |
Bristol Myers Squibb | — | — | X | — |
I hereby certify that I have the authority to disclose all relevant information with respect to any matter involving this patient group with a company, organization, or entity that may place this patient group in a real, potential, or perceived conflict of interest situation.
Patient Group: My Gut Feeling - Stomach Cancer Foundation of Canada
Date: September 13, 2021
Clinician Group Input
Ontario Health (Cancer Care Ontario) Gastrointestinal Cancer Drug Advisory Committee
About Ontario Health (Cancer Care Ontario) Gastrointestinal Cancer Drug Advisory Committee
Please describe the purpose of your organization. Include a link to your website (if applicable).
OH-CCO’s Drug Advisory Committees provide timely evidence-based clinical and health system guidance on drug-related issues in support of CCO’s mandate, including the Provincial Drug Reimbursement Programs (PDRP) and the Systemic Treatment Program.
Information Gathering
Please describe how you gathered the information included in the submission.
This input was jointly discussed at a DAC meeting and via email.
Current treatments
Describe the current treatment paradigm for the disease.
Focus on the Canadian context. Please include drug and non-drug treatments. Drugs without Health Canada approval for use in the management of the indication of interest may be relevant if they are routinely used in Canadian clinical practice. Are such treatments supported by clinical practice guidelines? Treatments available through special access programs are relevant. Do current treatments modify the underlying disease mechanism? Target symptoms?
Response: First-line options: FOLFOX, FOLFIRI, second-line: paclitaxel +/- ramucirumab for GEJ adenocarcinoma, TAS-102 for GEJ adenocarcinoma. Clinical trial in any line where the patient may be eligible and appropriate
Treatment goals
What are the most important goals that an ideal treatment would address?
Examples: Prolong life, delay disease progression, improve lung function, prevent the need for organ transplant, prevent infection or transmission of disease, reduce loss of cognition, reduce the severity of symptoms, minimize adverse effects, improve health-related quality of life, increase the ability to maintain employment, maintain independence, reduce burden on caregivers.
Response: Prolong life, delay disease progression, maintain QoL and weight and maintain nutrition
Treatment gaps (unmet needs)
Considering the treatment goals in Section 4, please describe goals (needs) that are not being met by currently available treatments.
Examples: Not all patients respond to available treatments. Patients become refractory to current treatment options. No treatments are available to reverse the course of disease. No treatments are available to address key outcomes. Treatments are needed that are better tolerated. Treatment are needed to improve compliance. Formulations are needed to improve convenience.
Response: Not all patients respond to available systemic treatments. Patients have short duration of response and become refractory to current treatment options. Limited survival even in patients who demonstrated a response
Which patients have the greatest unmet need for an intervention such as the drug under review?
Would these patients be considered a subpopulation or niche population? Describe characteristics of this patient population. Would the drug under review address the unmet need in this patient population?
Response: Esophageal cancers and GEJ adenocarcinoma patients have poor prognosis. CheckMate 649 showed that patients with PD-L1 CPS score ≥ 5 and ≥1 have enriched response but all patients benefitted regardless of CPS score.
Place in therapy
How would the drug under review fit into the current treatment paradigm?
Is there a mechanism of action that would complement other available treatments, and would it be added to other treatments? Is the drug under review the first treatment approved that will address the underlying disease process rather than being a symptomatic management therapy? Would the drug under review be used as a first-line treatment, in combination with other treatments, or as a later (or last) line of treatment? Is the drug under review expected to cause a shift in the current treatment paradigm?
Response: Nivolumab under review will be adding to currently available treatment in the first line setting, for patients with HER2-negative disease.
Please indicate whether or not it would be appropriate to recommend that patients try other treatments before initiating treatment with the drug under review. Please provide a rationale from your perspective.
If so, please describe which treatments should be tried, in what order, and include a brief rationale.
Response: No. Nivolumab will be adding to current 1L chemo to improve outcome.
How would this drug affect the sequencing of therapies for the target condition?
If appropriate for this condition, please indicate which treatments would be given after the therapy has failed and specify whether this is a significant departure from the sequence employed in current practice. Would there be opportunity to treat patients with this same drug in a subsequent line of therapy? If so, according to what parameters?
Response: If patient is treated with 1L immunotherapy, will not use in subsequent line of treatment.
Which patients would be best suited for treatment with the drug under review?
Which patients are most likely to respond to treatment with the drug under review? Which patients are most in need of an intervention? Would this differ based on any disease characteristics (e.g., presence or absence of certain symptoms, stage of disease)?
Response: All patients with HER2-negative gastric, esophageal, and GEJ adenocarcinoma will be suited for nivo + chemo
How would patients best suited for treatment with the drug under review be identified?
Examples: Clinician examination or judgement, laboratory tests (specify), diagnostic tools (specify). Is the condition challenging to diagnose in routine clinical practice? Are there any issues related to diagnosis? (e.g., tests may not be widely available, tests may be available at a cost, uncertainty in testing, unclear whether a scale is accurate or the scale may be subjective, variability in expert opinion.) Is it likely that misdiagnosis occurs in clinical practice (e.g., underdiagnosis)? Should patients who are pre-symptomatic be treated considering the mechanism of action of the drug under review?
Response: Histology and staging confirmed diagnosis.
Which patients would be least suitable for treatment with the drug under review?
Response: Patients who are not suitable candidates for immunotherapy due to potential contraindications.
Is it possible to identify those patients who are most likely to exhibit a response to treatment with the drug under review?
If so, how would these patients be identified?
Response: All patients regardless of PD-L1 CPS score appear to benefit from the addition of nivo to chemo
What outcomes are used to determine whether a patient is responding to treatment in clinical practice?
Are the outcomes used in clinical practice aligned with the outcomes typically used in clinical trials?
Response: Improved symptoms and objective response on imaging
What would be considered a clinically meaningful response to treatment?
Examples: Reduction in the frequency or severity of symptoms (provide specifics regarding changes in frequency, severity, and so forth). Attainment of major motor milestones. Ability to perform activities of daily living. Improvement in symptoms. Stabilization (no deterioration) of symptoms. Consider the magnitude of the response to treatment. Is this likely to vary across physicians?
Response: Reduction in the frequency or severity of symptoms (provide specifics regarding changes in frequency, severity, and so forth). Ability to perform activities of daily living. Improvement in symptoms, in particular maintaining weight and nutrition. Stabilization (no deterioration) of symptoms.
How often should treatment response be assessed?
Response: every 2 to 3 months imaging
What factors should be considered when deciding to discontinue treatment?
Examples: Disease progression (specify; e.g., loss of lower limb mobility). Certain adverse events occur (specify type, frequency, and severity). Additional treatment becomes necessary (specify).
Response: disease progression, adverse events, toxicities.
What settings are appropriate for treatment with the drug under review?
Examples: Community setting, hospital (outpatient clinic), specialty clinic
Response: Outpatient administration
For non-oncology drugs, is a specialist required to diagnose, treat, and monitor patients who might receive the drug under review?
If so, which specialties would be relevant?
Response: NA
Additional information
Is there any additional information you feel is pertinent to this review?
Response: None
Conflict of Interest Declarations Ontario Health (Cancer Care Ontario) Gastrointestinal Cancer Drug Advisory Committee
To maintain the objectivity and credibility of the CADTH drug review programs, all participants in the drug review processes must disclose any real, potential, or perceived conflicts of interest. This conflict of interest declaration is required for participation. Declarations made do not negate or preclude the use of the clinician group input. CADTH may contact your group with further questions, as needed. Please see the Procedures for CADTH Drug Reimbursement Reviews (section 6.3) for further details.
Did you receive help from outside your clinician group to complete this submission? If yes, please detail the help and who provided it.
OH-CCO provided secretariat support to the DAC in completing this input.
Did you receive help from outside your clinician group to collect or analyze any information used in this submission? If yes, please detail the help and who provided it.
No.
List any companies or organizations that have provided your group with financial payment over the past two years AND who may have direct or indirect interest in the drug under review. Please note that this is required for each clinician that contributed to the input — please add more tables as needed (copy and paste). It is preferred for all declarations to be included in a single document.
Declaration for Clinician 1
Name: Dr. Erin Kennedy
Position: Ontario Cancer Lead; surgeon
Date: 10-Sep-2021
Table 2: Declaration for OH-CCO Gastrointestinal Cancer Drug Advisory Committee Clinician 1
Company | Check Appropriate Dollar Range | |||
|---|---|---|---|---|
$0 to 5,000 | $5,001 to 10,000 | $10,001 to 50,000 | In Excess of $50,000 | |
No COI | — | — | — | — |
Declaration for Clinician 2
Name: Dr. Christine Brezden-Masley
Position: Medical Oncologist, Mount Sinai Hospital; Medical Director, Cancer Program for Sinai Health; Director, Marvelle Koffler Breast Centre, Mount Sinai Hospital; Senior Clinical Scientist, Lunenfeld-Tanenbaum Research Institute at Mount Sinai Hospital Associate Professor of Medicine, University of Toronto
Date: 10-Sep-2021
Table 3: Declaration for OH-CCO Gastrointestinal Cancer Drug Advisory Committee Clinician 2
Company | Check Appropriate Dollar Range | |||
|---|---|---|---|---|
$0 to 5,000 | $5,001 to 10,000 | $10,001 to 50,000 | In Excess of $50,000 | |
BMS | X | — | — | — |
Declaration for Clinician 3
Name: Dr. Tim Asmis
Position: Medical oncologist
Date: 10-Sep-2021
Table 4: Declaration for OH-CCO Gastrointestinal Cancer Drug Advisory Committee Clinician 3
Company | Check Appropriate Dollar Range | |||
|---|---|---|---|---|
$0 to 5,000 | $5,001 to 10,000 | $10,001 to 50,000 | In Excess of $50,000 | |
No COI | — | — | — | — |
Declaration for Clinician 4
Name: Dr. Jim Biagi
Position: Medical oncologist
Date: 13-Sep-2021
Table 5: Declaration for OH-CCO Gastrointestinal Cancer Drug Advisory Committee Clinician 4
Company | Check Appropriate Dollar Range | |||
|---|---|---|---|---|
$0 to 5,000 | $5,001 to 10,000 | $10,001 to 50,000 | In Excess of $50,000 | |
No COI | — | — | — | — |
The Canadian Gastrointestinal Oncology Evidence Network (CGOEN) and Other Gastroesophageal Cancer-Treating Physicians
About The Canadian Gastrointestinal Oncology Evidence Network (CGOEN) and other Gastroesophageal Cancer-Treating Physicians
Please describe the purpose of your organization. Include a link to your website (if applicable). The Canadian GI Oncology Evidence Network (CGOEN) is a virtual and inclusive network of Canadian GI Oncology clinicians who contribute to the knowledge of GI cancer and its treatments, including participating in clinical trials, conducting observational research, and involvement in local/provincial and national clinical guideline development and health technology assessment.
Information Gathering
Please describe how you gathered the information included in the submission. Information gathered for this submission was based on relevant data from the Checkmate 649 trial and expert evidence-based review by Canadian gastrointestinal cancer specialists. Some of the clinicians in this group were investigators in the Checkmate 649 trial.
Current treatments
Describe the current treatment paradigm for the disease.
Response: Canadian clinicians treating advanced /metastatic disease typically follow the evidence-based clinical practice guidelines such as those recommended by the European Society of Medical Oncology (ESMO).
Briefly: This is in the Her 2 negative subset of patients, which represents 80-85% with esophago-gastric adenocarcinomas.
Metastatic gastric/gastroesophageal junction
First-line: doublet combination of platinum/ fluorouracil (5FU) Second-line: a taxane (docetaxel, paclitaxel) +/- ramucirumab Third-line: irinotecan or trifluridine and tipiracil.
Esophageal adenocarcinoma
Treatment for esophageal adenocarcinoma has a similar treatment algorithm, however, in the second line ramucirumab is not used. In BC, third line irinotecan or trifluridine and tipiracil is used for esophageal adenocarcinoma.
Treatment goals
What are the most important goals that an ideal treatment would address?
Response: The ideal treatment would improve overall survival, improve quality of life, tolerable side effect profile, and decrease the burden of disease.
Treatment gaps (unmet needs)
Considering the treatment goals in Section 4, please describe goals (needs) that are not being met by currently available treatments.
Response: In the first-line setting for patients with (HER2-negative) gastric, gastro-esophageal junction, or esophageal adenocarcinoma, there are limited treatment options, and no significant treatment advances have been made in the last decade. There is a clear need for treatments that improve overall survival (OS), with improved durable objective response, and that have an acceptable safety profile.
For these patients, nivolumab (in combination with chemotherapy) is the first PD-1 inhibitor to show superior overall survival (OS), along with clinically meaningful progression free survival (PFS) benefit, improved and durable objective responses, maintained Health-Related Quality of Live (HRQOL), and an acceptable safety profile.
Which patients have the greatest unmet need for an intervention such as the drug under review?
Response: There has been limited success with systemic therapy in metastatic gastro-esophageal cancers – especially in the HER2- negative subset – which represents 85% of the patients. Median survival has not surpassed one year with therapy. Nivolumab in combination with 1L chemotherapy represents a significant and meaningful improvement in survival for this population of patients.
Place in therapy
How would the drug under review fit into the current treatment paradigm?
Response: Nivolumab would be in combination with the first line standard of fluoropyrimdine/platinum based treatment. This combination would not shift the treatment paradigm as it is an addition to first line treatment. The therapy address the treatment goals outlined section 4. The addition of Nivolumab improves overall survival, maintains quality of life with manageable side effects.
Please indicate whether or not it would be appropriate to recommend that patients try other treatments before initiating treatment with the drug under review. Please provide a rationale from your perspective.
Response: This therapy is in combination with first line therapy. So there would not be other treatments that should be tried.
How would this drug affect the sequencing of therapies for the target condition?
Response: It should not affect the sequencing of treatment as this is a new therapy. Immunotherapy is not funded in subsequent lines of therapies.
Which patients would be best suited for treatment with the drug under review?
Response: Patients with HER 2 negative metastatic gastroesophageal cancer or disease not amenable for curative resection. Tumour PDL1 or CPS scoring may help select populations that may respond better to Nivolumab.
How would patients best suited for treatment with the drug under review be identified?
Response: Patients who have unresectable or metastatic gastro-esophageal adenocarcinoma would be eligible. These patients are already identified via endoscopy and staging investigations. PDL1 scoring can be done by pathologists. This scoring is already being done by many cancer centres as immunotherapy is already used in other tumor sites.
Which patients would be least suitable for treatment with the drug under review?
Response: Patients with an ECOG of 3 or 4 and tumors with a PDL-1 CPS score < 5.
Is it possible to identify those patients who are most likely to exhibit a response to treatment with the drug under review?
If so, how would these patients be identified?
Response: Tumors with a PDL-1 CPS score of > 5 seem to derive a greater benefit. This can be performed on the tumor sample.
What outcomes are used to determine whether a patient is responding to treatment in clinical practice?
Are the outcomes used in clinical practice aligned with the outcomes typically used in clinical trials?
Response: Routine imaging in the form of CT scans are done every 2-3 months to assess response to treatment. This is similar to clinical trials. The outcomes are aligned with the outcomes used in clinical trials. Symptom assessment would also be performed to determine if the patient is clinically improving as well.
What would be considered a clinically meaningful response to treatment?
Response: Response on imaging – decrease or stability of disease seen on imaging. Improvement or maintenance of quality of life. Improvement or maintenance of symptoms – dysphagia can be a major issue in these patients. A higher response rate helps palliative this symptom – allowing the patient to eat resulting in a significant improvement in the quality of life.
How often should treatment response be assessed?
Response: Patients would have routine clinic visits around the time of treatment which could be every 2-6 weeks for symptom and toxicity assessment. Routine imaging would occur every 2-3 months.
What factors should be considered when deciding to discontinue treatment?
Response: Disease progression – either clinically or on imaging. Toxicity from treatment – grade 3 o4 toxicity resulting in hospitalization. Patient preference.
What settings are appropriate for treatment with the drug under review?
Examples: Community setting, hospital (outpatient clinic), specialty clinic
Response: Any setting where standard chemotherapy is delivered.
For non-oncology drugs, is a specialist required to diagnose, treat, and monitor patients who might receive the drug under review?
If so, which specialties would be relevant?
Response: N/A
Additional information
Is there any additional information you feel is pertinent to this review?
Response: This represents a significant improvement in survival for gastro-esophageal patients. In addition it is well tolerated and manageable. Immunotherapy has been available in other countries and the data supports the use in the first line in combination with chemotherapy. This is a therapy that Canadians patients should have access to.
Conflict of Interest Declarations
To maintain the objectivity and credibility of the CADTH drug review programs, all participants in the drug review processes must disclose any real, potential, or perceived conflicts of interest. This conflict of interest declaration is required for participation. Declarations made do not negate or preclude the use of the clinician group input. CADTH may contact your group with further questions, as needed. Please see the Procedures for CADTH Drug Reimbursement Reviews for further details.
Did you receive help from outside your clinician group to complete this submission? If yes, please detail the help and who provided it.
No.
Did you receive help from outside your clinician group to collect or analyze any information used in this submission? If yes, please detail the help and who provided it.
No.
List any companies or organizations that have provided your group with financial payment over the past two years AND who may have direct or indirect interest in the drug under review. Please note that this is required for each clinician that contributed to the input — please add more tables as needed (copy and paste). It is preferred for all declarations to be included in a single document.
Declaration for Clinician 1
Name: Howard Lim
Position: Medical Oncologist
Date: 20-Sept-2021
Table 6: Declaration for CGOEN and Other Gastroesophageal Cancer-Treating Physicians — Clinician 1
Company | Check Appropriate Dollar Range | |||
|---|---|---|---|---|
$0 to 5,000 | $5,001 to 10,000 | $10,001 to 50,000 | In Excess of $50,000 | |
Roche | — | — | X | — |
Bayer | X | — | — | — |
Amgen | X | — | — | — |
Lilly | X | — | — | — |
Taiho | X | — | — | — |
Eisai | — | X | — | — |
Ipsen | X | — | — | — |
Declaration for Clinician 2
Name: Dr. Sharlene Gill
Position: Medical Oncologist, BC Cancer, Vancouver
Date: 15-09-2021
Table 7: Declaration for CGOEN and Other Gastroesophageal Cancer-Treating Physicians — Clinician 2
Company | Check Appropriate Dollar Range | |||
|---|---|---|---|---|
$0 to 5,000 | $5,001 to 10,000 | $10,001 to 50,000 | In Excess of $50,000 | |
No relevant disclosures | — | — | — | — |
Declaration for Clinician 3
Name: Mustapha Tehfe
Position: Medical Oncologist
Date: 14-09-2021
Table 8: Declaration for CGOEN and Other Gastroesophageal Cancer-Treating Physicians — Clinician 3
Company | Check Appropriate Dollar Range | |||
|---|---|---|---|---|
$0 to 5,000 | $5,001 to 10,000 | $10,001 to 50,000 | In Excess of $50,000 | |
BMC | X | — | — | — |
Pfizer | X | — | — | — |
Merck | X | — | — | — |
Taiho | X | — | — | — |
Declaration for Clinician 4
Name: Frédéric Lemay
Position: Associate Professor
Date: 14-09-2021
Table 9: Declaration for CGOEN and Other Gastroesophageal Cancer-Treating Physicians — Clinician 4
Company | Check Appropriate Dollar Range | |||
|---|---|---|---|---|
$0 to 5,000 | $5,001 to 10,000 | $10,001 to 50,000 | In Excess of $50,000 | |
Merck Canada | X | — | — | — |
BMS Canada | X | — | — | — |
Esperas Pharma Inc. | X | — | — | — |
Declaration for Clinician 5
Name: Eric Chen
Position: Medical Oncologist
Date: 14-09-2021
Table 10: Declaration for CGOEN and other Gastroesophageal Cancer-Treating Physicians — Clinician 5
Company | Check Appropriate Dollar Range | |||
|---|---|---|---|---|
$0 to 5,000 | $5,001 to 10,000 | $10,001 to 50,000 | In Excess of $50,000 | |
None declared | — | — | — | — |
Declaration for Clinician 6
Name: Jennifer Spratlin
Position: Medical Oncologist, Associate Professor
Date: 16-09-2021
Table 11: Declaration for CGOEN and Other Gastroesophageal Cancer-Treating Physicians — Clinician 6
Company | Check Appropriate Dollar Range | |||
|---|---|---|---|---|
$0 to 5,000 | $5,001 to 10,000 | $10,001 to 50,000 | In Excess of $50,000 | |
None declared | — | — | — | — |
Declaration for Clinician 7
Name: Xiaofu Zhu
Position: Medical oncologist, Cross Cancer Institute
Date: 18-09-2021
Table 12: Declaration for CGOEN and Other Gastroesophageal Cancer-Treating Physicians — Clinician 7
Company | Check Appropriate Dollar Range | |||
|---|---|---|---|---|
$0 to 5,000 | $5,001 to 10,000 | $10,001 to 50,000 | In Excess of $50,000 | |
Pfizer | X | — | — | — |
Novartis | X | — | — | — |
AstraZeneca | X | — | — | — |
Lilly | X | — | — | — |
Merck | X | — | — | — |
Taiho | X | — | — | — |
Apobiologix | X | — | — | — |
ISSN: 2563-6596
Disclaimer: The information in this document is intended to help Canadian health care decision-makers, health care professionals, health systems leaders, and policy-makers make well-informed decisions and thereby improve the quality of health care services. While patients and others may access this document, the document is made available for informational purposes only and no representations or warranties are made with respect to its fitness for any particular purpose. The information in this document should not be used as a substitute for professional medical advice or as a substitute for the application of clinical judgment in respect of the care of a particular patient or other professional judgment in any decision-making process. The Canadian Agency for Drugs and Technologies in Health (CADTH) does not endorse any information, drugs, therapies, treatments, products, processes, or services.
While care has been taken to ensure that the information prepared by CADTH in this document is accurate, complete, and up-to-date as at the applicable date the material was first published by CADTH, CADTH does not make any guarantees to that effect. CADTH does not guarantee and is not responsible for the quality, currency, propriety, accuracy, or reasonableness of any statements, information, or conclusions contained in any third-party materials used in preparing this document. The views and opinions of third parties published in this document do not necessarily state or reflect those of CADTH.
CADTH is not responsible for any errors, omissions, injury, loss, or damage arising from or relating to the use (or misuse) of any information, statements, or conclusions contained in or implied by the contents of this document or any of the source materials.
This document may contain links to third-party websites. CADTH does not have control over the content of such sites. Use of third-party sites is governed by the third-party website owners’ own terms and conditions set out for such sites. CADTH does not make any guarantee with respect to any information contained on such third-party sites and CADTH is not responsible for any injury, loss, or damage suffered as a result of using such third-party sites. CADTH has no responsibility for the collection, use, and disclosure of personal information by third-party sites.
Subject to the aforementioned limitations, the views expressed herein are those of CADTH and do not necessarily represent the views of Canada’s federal, provincial, or territorial governments or any third party supplier of information.
This document is prepared and intended for use in the context of the Canadian health care system. The use of this document outside of Canada is done so at the user’s own risk.
This disclaimer and any questions or matters of any nature arising from or relating to the content or use (or misuse) of this document will be governed by and interpreted in accordance with the laws of the Province of Ontario and the laws of Canada applicable therein, and all proceedings shall be subject to the exclusive jurisdiction of the courts of the Province of Ontario, Canada.
The copyright and other intellectual property rights in this document are owned by CADTH and its licensors. These rights are protected by the Canadian Copyright Act and other national and international laws and agreements. Users are permitted to make copies of this document for non-commercial purposes only, provided it is not modified when reproduced and appropriate credit is given to CADTH and its licensors.
Redactions: Confidential information in this document may be redacted at the request of the sponsor in accordance with the CADTH Drug Reimbursement Review Confidentiality Guidelines
Stakeholder Input: The views expressed in each submission are those of the submitting organization or individual; not necessarily the views of CADTH or of other organizations. As such, they are independent of CADTH and do not necessarily represent or reflect the view of CADTH. No endorsement by CADTH is intended or should be inferred. By filing with CADTH, the submitting organization or individual agrees to the full disclosure of the information. CADTH does not edit the content of the submissions.
CADTH does use reasonable care to prevent disclosure of personal information in posted material; however, it is ultimately the submitter’s responsibility to ensure no identifying personal information or personal health information is included in the submission. The name of the submitting organization or individual and all conflict of interest information are included in the submission; however, the name of the author, including the name of an individual patient or caregiver submitting the patient input, are not posted.
Accessibility: CADTH is committed to treating people with disabilities in a way that respects their dignity and independence, supports them in accessing material in a timely manner, and provides a robust feedback process to support continuous improvement. All materials prepared by CADTH are available in an accessible format. Where materials provided to CADTH by a submitting organization or individual are not available in an accessible format, CADTH will provide a summary document upon request. More details on CADTH’s accessibility policies can be found here.
About CADTH: CADTH is an independent, not-for-profit organization responsible for providing Canada’s health care decision-makers with objective evidence to help make informed decisions about the optimal use of drugs, medical devices, diagnostics, and procedures in our health care system.
Funding: CADTH receives funding from Canada’s federal, provincial, and territorial governments, with the exception of Quebec.