CADTH Health Technology Review
Measuring and Valuing Health for Children: A Review of the Evidence
Technology Review
Key Messages
What Was the Question?
There are many generic preference-based instruments intended for use in children and adolescents (those aged < 18 years, hereafter referred to as children); however, the optimal methods for measuring and valuing health-related quality of life (HRQoL) in children are unclear, at least in part because of conceptual and methodological challenges related to determining what dimensions of HRQoL should be considered for children across developmental stages; who should be asked to complete the instruments (e.g., self-report versus proxy report by parents, caregivers, or clinicians); how health states should be valued and by whom (e.g., adults, children); and whether or how the impact of interventions on the HRQoL of caregivers and family members of pediatric patients (i.e., spillover effects) should be incorporated. There is a need for clearer guidance about how to address these methods in economic evaluations, as well as research into the impact of methodological and normative choices on estimates of the cost-effectiveness of interventions.
What Did We Do?
We conducted 3 literature reviews to provide an overview of the current state of evidence worldwide related to the measurement and valuation of generic preference-based instruments and value sets for children; comparison of health-state preferences between adults and children; and the impact of including spillover effects (i.e., the impact on HRQoL of family members and caregivers) in economic evaluations.
What Did We Find?
We identified 15 generic preference-based instruments intended for use in children, with 29 country-specific utility value sets available for 16 countries. Canada-specific value sets were identified only for the Health Utility Index Mark 2 (HUI2) and Health Utility Index Mark 3 (HUI3), with preferences obtained from the adult general population. Children may have lower preferences compared to adults for the same health states, yet the implication of this on estimates of cost-effectiveness analyses that span a lifetime horizon are unknown. Few health technology assessment (HTA) agencies provide guidance on measuring and valuing child health or whether and how to incorporate spillover effects. There is no consensus in the literature on how spillover effects should be measured and quantified, or the impact that the choice of methods used to measure spillover effects has on economic analyses.
What Does This Mean?
There has been significant progress in recent years in the development of instruments and methods for measuring and valuing child health. These advances are vital steps toward supporting the assessment of health technologies targeting pediatric conditions and resource allocation decisions about these technologies. However, there is a need for additional research comparing the impact of using child versus adult health-state preferences in cost-utility analyses; whether the same preference-based instruments should be used for children and adults; and the impact that different approaches to handling age transitions have when modelling over a lifetime horizon. The small number of identified studies precludes a robust discussion of the impact of spillover effects on economic evaluations, and there is currently no consensus in the literature as to best practices. Additional research is needed into the number and type of caregivers that could be included in the assessment of spillover effects and the ethical implications of including spillover in economic evaluations.
Introduction
Economic evaluations involve the comparative assessment of costs and benefits of competing interventions, programs, or policies. Cost-utility analysis (CUA) is the recommended type of economic evaluation by many health technology assessment (HTA) agencies, including CADTH. Cost-utility analyses value the effect of interventions using quality-adjusted life-years (QALYs), which combine length and health-related quality of life (HRQoL) into a single metric, and can then be used to compare an intervention’s effects across populations and clinical settings. QALYs are calculated by multiplying the amount of time that an individual spends in a health state by a preference weight (i.e., health-state utility value) assigned to that state.1
Utility values can be estimated by use of either direct or indirect methods. Direct methods involve individuals providing their preferences for a health state directly through the use of elicitation techniques such as the rating scale (RS), standard gamble (SG), or time trade-off (TTO). Indirect methods involve the use of a generic preference-based instrument that requires a conversion scale to derive utility values. These instruments consist of a descriptive system that describes health states through a set of selected dimensions of HRQoL and a value set that converts the health states to a utility value.2 The value set is usually developed through a valuation study designed to obtain societal preferences from the general population, but may sometimes reflect patient preferences from specific populations.3
HTA agencies such as CADTH and the National Institute for Health and Care Excellence (NICE) in the UK recommend the use of indirect methods based on a generic preference-based instrument with the value set obtained from the general population.4,5 However, while methods for the measurement and valuation of HRQoL among adults are well established,3,4 the optimal methods for measuring and valuing HRQoL in children are less clear. This can be attributed, at least in part, to a number of conceptual and methodological challenges related to the measurement and valuation of child health. Broadly, these challenges include determining what dimensions of HRQoL should be considered for children across developmental stages (e.g., from newborn to late teens); who should be asked to complete the instruments (e.g., self-report versus proxy report by parents, caregivers, or clinicians); how health states should be valued and by whom (e.g., adults, children); whether there are meaningful differences in health-state preferences between adults and children, and whether these differences would impact the results of economic evaluations; and whether or how the impact of interventions on the HRQoL of caregivers and other family members of pediatric patients (i.e., spillover effects) should be incorporated.
The existing CADTH guidelines provide no explicit guidance on the conduct of economic evaluations in children, which is an issue that has been raised by several groups.6,7 In 2020, NICE also identified measuring and valuing HRQoL in children as key areas requiring further research, as part of its public consultation on proposals for changes to the methods in HTA.8 Due to this rapidly growing and heterogeneous body of evidence, there is a need to identify and summarize existing evidence related to measuring and valuing health for children.
Methods
Three independent reviews were undertaken, each addressing a research question related to the conduct of economic evaluations in children (Table 1).
Table 1: Research Questions Addressed in Each Review
Review | Research questions |
|---|---|
Review 1 |
|
Review 2 |
|
Review 3 |
|
vs. = versus.
Note: A prespecified protocol outlining the review methods was developed and is described in subsequent sections.
Data Sources and Study Selection
Three independent literature searches were undertaken to identify the available evidence to address the research questions (Table 2). For each review, eligible studies included primary studies and literature reviews published in English that intended to address the aim of each review.
We additionally searched selected grey literature sources (Appendix 5); namely, the websites of HTA agencies in countries with publicly funded health care systems similar to those in Canada, as well as 3 organizations (i.e., the FDA, WHO, and the International Society for Pharmacoeconomics and Outcomes Research [ISPOR]) that have issued guidelines related to patient-reported outcomes (search date: December 6, 2022).
Table 2: Aim and Search Parameters for Each Review
Review | Aim | Search datesa | Search strategy |
|---|---|---|---|
Review 1 | To identify generic preference-based instruments and value sets for children | PubMed (October 1, 2020, to December 6, 2022)b,c | |
Review 2 | To identify evidence comparing preferences for health states between adults and children | PubMed (inception to January 21, 2023) | |
Review 3 | To identify evidence focused on the spillover effects on family HRQoL | PubMed (inception to January 21, 2023) |
HRQoL = health-related quality of life.
aWe additionally manually searched the bibliographies of any identified reviews that met the inclusion criteria for each research question.
bGiven that relevant studies published from 1992 to 2020 were identified as part of previous systematic reviews,9,10 the intent of the current search was to identify studies published after 2020.
cWhen the published information pertaining to the generic preference-based instruments was either out of date or incomplete, we consulted the websites of the relevant instrument, if available (Appendix 4).
Study Selection and Data Extraction
For each review, 2 reviewers screened the titles, abstracts, and full texts independently and in duplicate. Data were extracted from eligible studies by 2 independent reviewers. Discrepancies were resolved through consensus at both the study selection and data extraction stage.
Data extracted from all studies included author and year of publication. For review 1 (generic preference-based instruments and value sets for children), the characteristics of each instrument were extracted, including the instrument name and/or abbreviation, development year and jurisdiction, target age range, mode of administration (proxy versus self), recall period, dimensions covered, number of response levels, and measurement properties. Additional data extracted from valuation studies included the country of conduct, source of preferences, sample size, preference elicitation technique, and range of utility values. For review 2 (comparison of health state preferences between adults and children), extracted data included the study population, sample size, perspective, preference elicitation technique, and results related to differences in preferences. For review 3 (spillover effects), extracted data included study population, sample size, methods of assessing spillover effects, and main findings.
Data Synthesis
A narrative synthesis was conducted to highlight important characteristics as well as any similarities or differences between instruments and studies. A similar analysis was conducted for the information extracted on the value sets and spillover studies.
Summary of Findings
Review 1: Generic Preference-Based Instruments and Value Sets for Children
Study Selection
The initial search identified 10,531 records (Figure 1). An additional 26 records were identified from previous systematic reviews. Of these, 183 records were retained for full-text screening, and 97 were included in the review.
Figure 1: PRISMA Flow Chart of Study Selection for Review 1
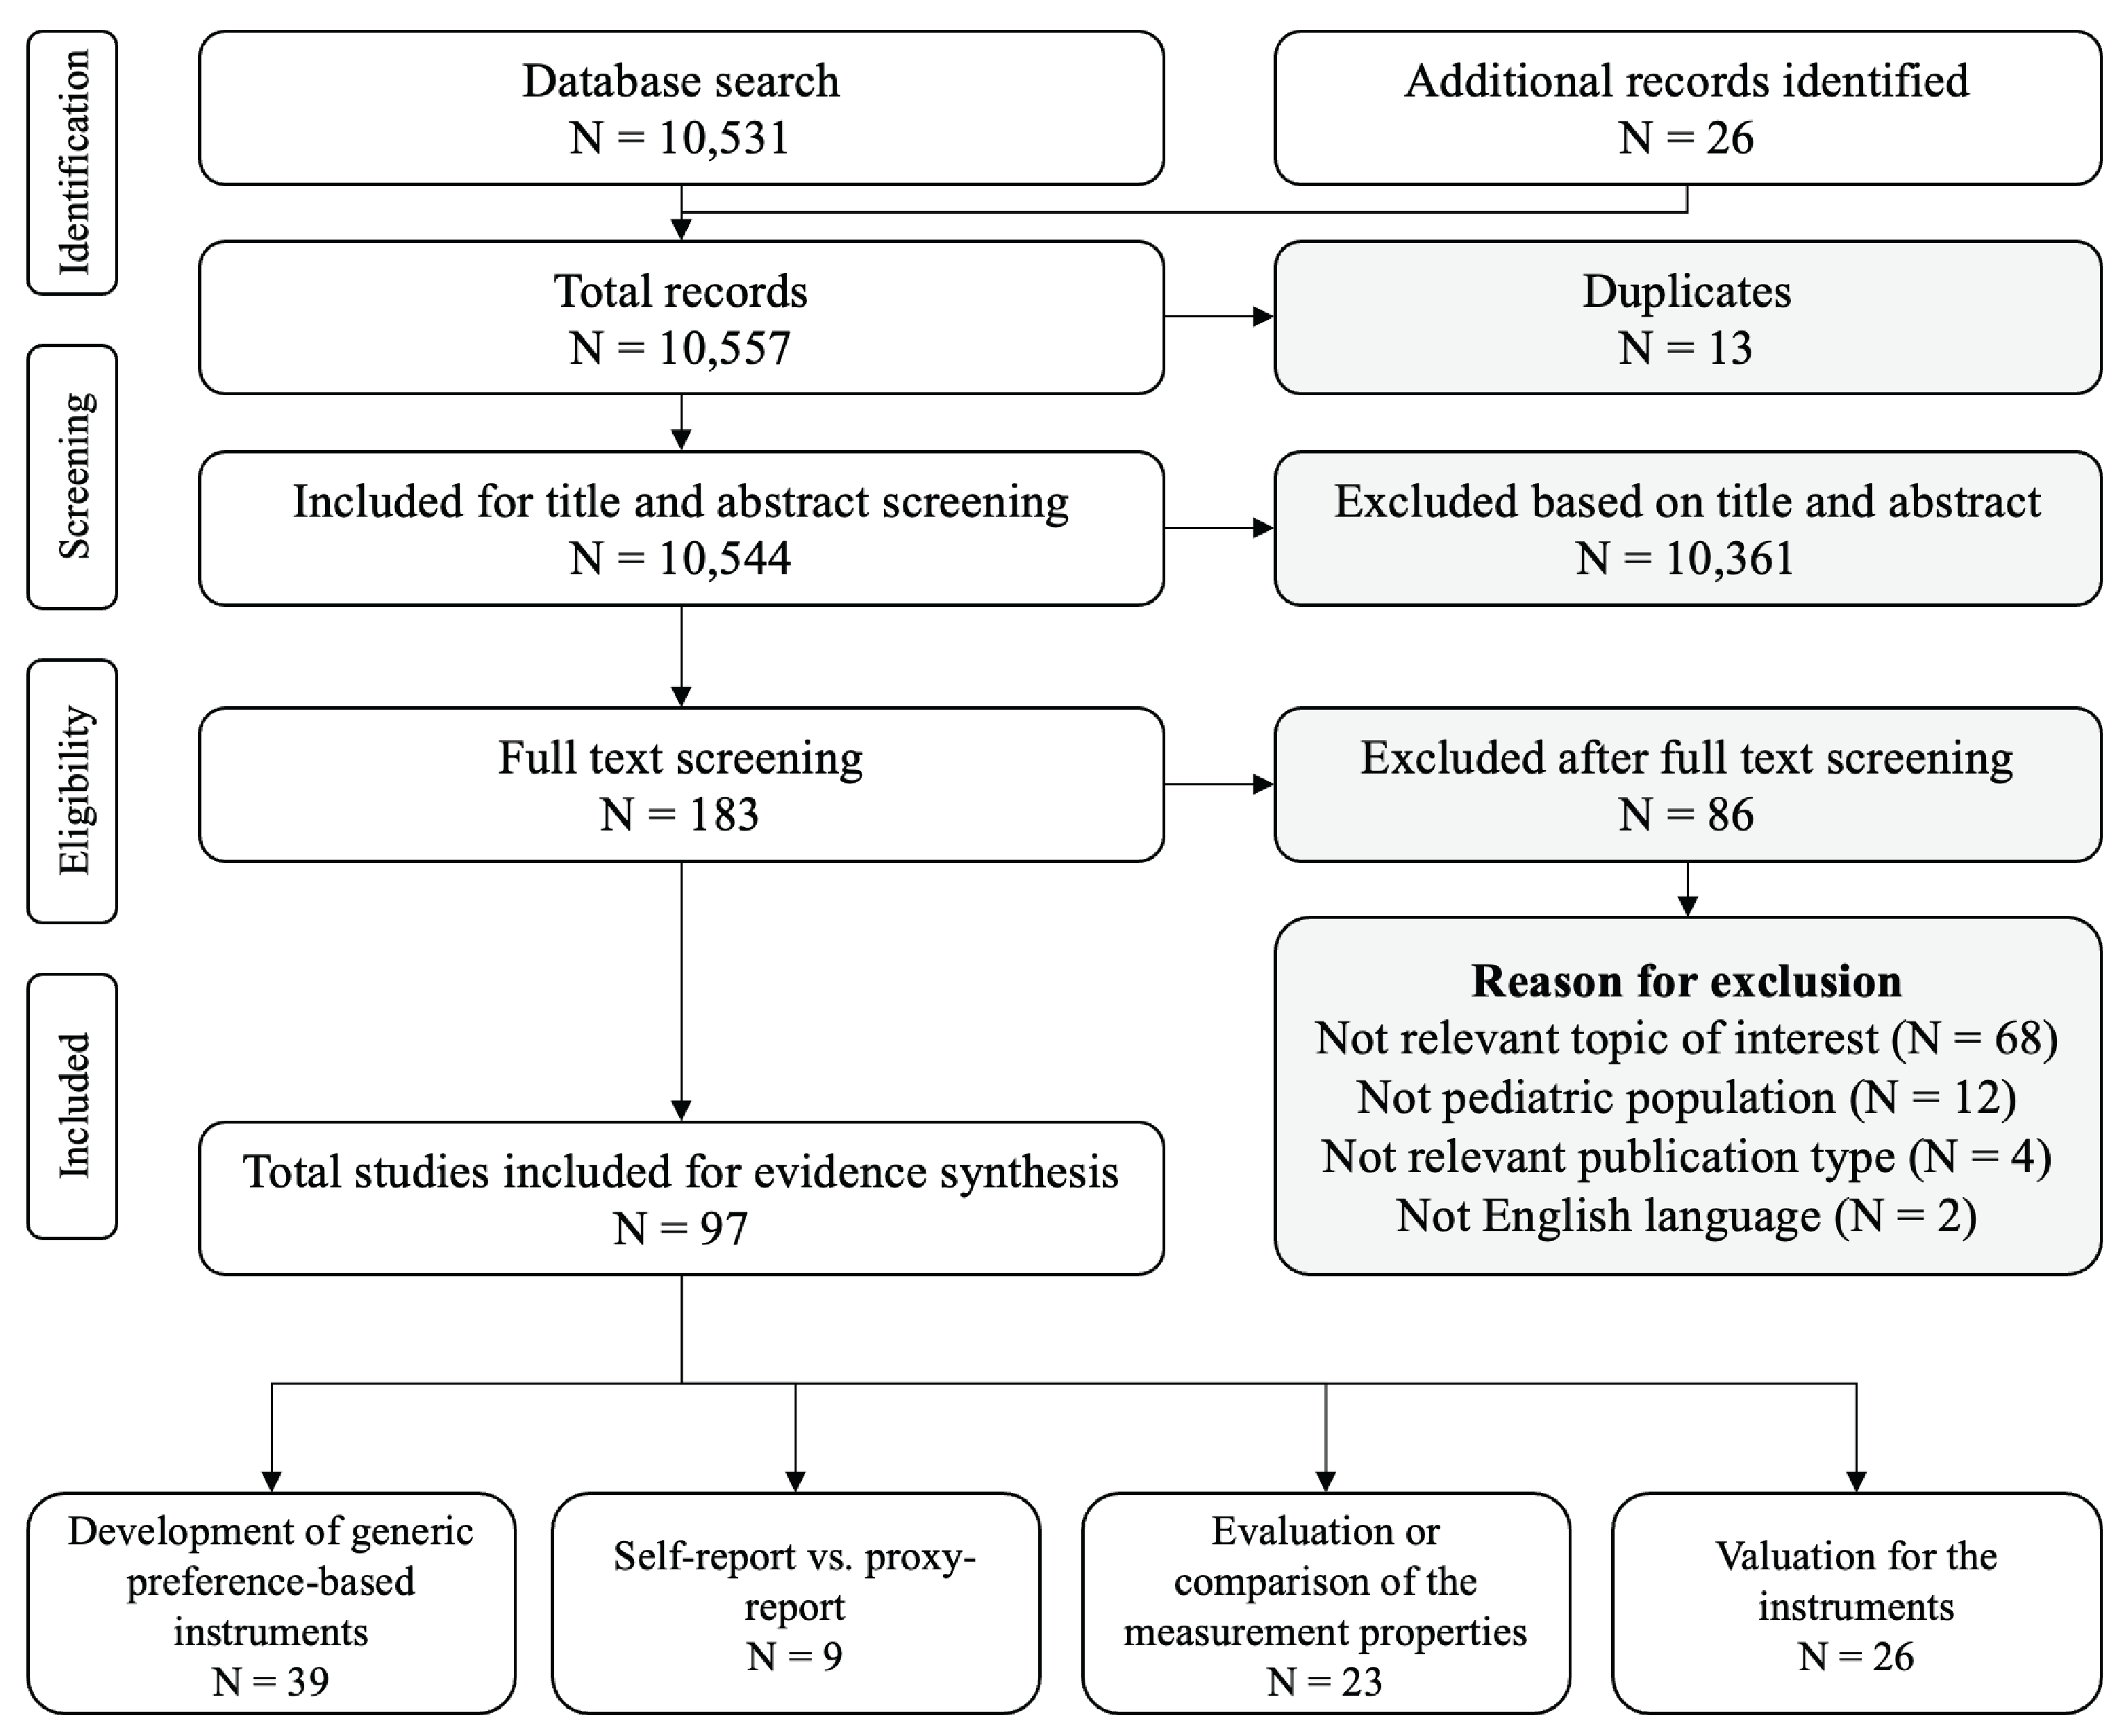
PRISMA = Preferred Reporting Items for Systematic Reviews and Meta-Analyses; vs. = versus.
Key Findings
A total of 15 generic preference-based instruments for children were identified. The characteristics of the instruments included in our review are presented in Table 3. A variety of age groups, administration methods, and dimensions of HRQoL were considered across instruments. Proxy report was most common method of administration among instruments designed for younger ages (i.e., children aged < 8 years). Seven instruments (46.7%) allow a mix of proxy report and self-report (the HUI2, HUI3, EQ-5D-Y-3L, EQ-5D-Y-5L, Child Health Utility 9D [CHU-9D], 16-dimensional measure of quality of life [16D], and 17-dimensional measure of quality of life [17D]). Four instruments (the Infant Health-Related Quality of Life Instrument [IQI], EQ-5D-Y-3L, EQ-5D-Y-5L, and Preschool Health Status Classification System [HSCS-PS]) specify who should serve as the proxy respondent (i.e., caregiver, parent, clinician), while others use the term proxy without specification. Among the instruments that have both self-report and proxy report, evidence suggests that there was poor agreement between self-report and proxy-report results.11-13
Additional information about the health dimensions for each included instrument is provided in Table 4. The number of dimensions ranged from 4 in the Quality of Well-Being Scale – Self-Administered (QWB-SA) to 17 in the 17D. The most frequently included dimensions are pain and mobility (both n = 12, 80%), followed by emotion (n = 11, 73%), speech (n = 8, 53%), vision (n = 8, 53%), and hearing (n = 7, 47%). The dimensions considered by each instrument generally reflect aspects of health that are relevant to the developmental stage of the targeted age group. Some identified instruments include health dimensions tailored to specific age groups (e.g., breathing, excretion, and sleeping in the IQI), while others include dimensions important for both children and adults (e.g., mobility, usual activities, and pain in the EQ-5D).
A previous systematic literature review conducted by Rowen et al. (2021) examined the measurement properties — including acceptability, feasibility, validity, reliability, and responsiveness — of 4 instruments: the CHU-9D, EQ-5D-Y-3L, HUI2, and HUI3.14 These instruments were among the most frequently used instruments for children in the UK specifically and worldwide.14 Among the studies identified by the review, 15 were conducted in Canada, all of which pertained to the HUI2 or HUI3.14 The evidence indicated acceptable measurement properties of these 2 instruments among children in Canada with respect to acceptability and feasibility, validity, reliability, and responsiveness. We additionally identified a recent study that evaluated the feasibility and validity of the Toddler and Infant (TANDI) HRQoL questionnaire in children aged 3 to 4 years.15 It concluded that the TANDI is a valid instrument for measuring HRQoL in children aged 3 to 4 years, with or without a health condition, in South Africa.15 Beyond these studies, the evidence on the measurement properties of all other instruments is lacking.14,16 We also identified 2 studies pertaining to the Canadian French translation and cross-cultural adaptation of the CHU-9D and HuPS.17,18
Twenty-six value sets were identified for 10 of the 15 instruments. No value sets were identified for the HuPS, TANDI, Adolescent Health Utility Measure (AHUM), Child Health – 6 Dimension (CH-6D), or HSCS-PS. As such, these instruments may be used to measure health status but not to calculate utility values. The characteristics of available value sets are summarized in Table 5. Most value sets (n = 18, 69.2%) were developed based on the preferences of the general adult population. RS, despite ongoing debate regarding its appropriateness in measuring utility values, was the most commonly used preference elicitation technique (n = 8, 33.3%), followed by the combination of discrete choice experiment (DCE) and TTO (n = 7, 29.2%) and SG (n = 6, 25.0%). Fifteen out of 26 (58%) value sets contained negative values, representing health states perceived as worse than dead. Slovenia has the lowest utility (–0.691), which may be attributable to the nature of the country-specific value set.
We identified 2 instruments for which there has been a comparison of adult and child preferences (the CHU-9D and Assessment of Quality of Life – 6 Dimension [AQoL-6D]). The adult value set in both instruments generated lower utility values than the child value set, especially for severe health states.19-22
Table 3: Characteristics of Generic Preference-Based Instruments for Children
Instrument | Country | Year of publication | Age range, years | Mode of administration | Recall period | Number of dimensions | Response levels |
|---|---|---|---|---|---|---|---|
IQI23 | UK, New Zealand, Singapore | 2018 | 0 to 1 | Proxy report | Today | 7 | 4 |
International | 2020 | 0 to 3 | Proxy report | Today | 6 | 3 | |
HSCS-PS25 | Canada, Australia | 2005 | 2 to 5 | Proxy report | Past week | 12 | 3 to 5 |
HuPS26 | Canada | 2022 | 2 to 6 | Proxy report | Not stated | 8 | 4 to 6 |
EQ-5D-Y-3L27 | International | 2010 | 4 to 15 | 4 to 7 years: proxy report 8 to 15 years: self-report | Today | 5 | 3 |
EQ-5D-Y-5L28 | International | 2019 | 4 to 15 | 4 to 7 years: proxy report 8 to 15 years: self-report | Today | 5 | 5 |
CHU-9D29 | UK | 2009 | 5 to 1 | 5 to 7 years: proxy report 7 to 17 years: self-report | Today | 9 | 4 |
HUI230 | Canada | 1992 | 5+ | < 8 years: proxy report > 9 years: proxy or self-report | Past 1, 2, 4-weeks, or usual health | 7 | 3 to 5 |
HUI331 | Canada | 1995 | 5+ | < 8 years: proxy report > 9 years: proxy or self-report | Past 1, 2, 4-weeks, or usual health | 8 | 5 to 6 |
CH-6D32 | South Korea | 2016 | 7 to 12 | Self-report | Not stated | 6 | 3 to 4 |
17D33 | Finland | 1996 | 8 to 11 | 8 to 11 years: primarily self but proxy is possible | Right now | 17 | 5 |
16D34 | Finland | 1996 | 12 to 15 | Self-report but proxy report is possible | Right now | 16 | 5 |
AHUM35 | UK | 2012 | 12 to 18 | Self-report | Today | 6 | 4 to 7 |
AQoL-6D Adolescent21 | Australia, New Zealand, Fiji, Tonga | 2010 | 15 to 17 | Self-report | Past week | 6 | 4 to 6 |
QWB-SA36, b | US | 1996 | Not explicitly stated (for children) | Self-report | Past 3 days | 4 | 2 to 4 |
16D = 16-Dimensional Measure of Health-Related Quality of Life; 17D = 17-Dimensional Measure of Health-Related Quality of Life; AHUM = Adolescent Health Utility Measure; AQoL-6D = Assessment of Quality of Life 6-Dimension; CH-6D = Child Health-6 Dimension; CHU-9D = Child Health Utility 9D; EQ-5D-Y-3L = EQ-5D Youth Version – 3 Level; EQ-5D-Y-5L = EQ-5D Youth Version – 5 Level; EQ TIPS = EuroQol Toddler and Infant Populations; HSCS-PS = Pre-School Health Status Classification System; HUI2 = Health Utility Index Mark 2; HUI3 = Health Utility Index Mark 3; HuPS = Health Utilities Preschool; IQI = Infant Health-Related Quality of Life Instrument; QWB-SA = Quality of Well-Being Scale – Self-Administered; TANDI = Toddler and Infant (TANDI) HRQoL Instrument.
aThe TANDI HRQoL instrument has been renamed to EQ TIPS.
bThe QWB was developed in the 1970s but is seldomly used now. The self-administered version (QWB-SA) was developed in 1996 in response to the limitations of the QWB, and throughout this report the focus is on the QWB-SA.
Table 4: Health Dimensions Included in Generic Preference-Based Instruments for Children
Instrument | Pain (n = 12) | Mobility (n = 12) | Emotion (n = 11) | Speech (n = 8) | Vision (n = 7) | Hearing (n = 7) | Interaction (n = 6) | Mentality and cognition (n = 6) | Self-care (n = 5) | Doing usual activities (n = 4) |
|---|---|---|---|---|---|---|---|---|---|---|
IQI | — | — | Yes | — | — | — | Yes | — | — | — |
TANDI HRQoL instrument | Yes | Yes | — | Yes | — | — | Yes | — | — | Yes |
HSCS-PS | Yes | Yes | Yes | Yes | Yes | Yes | — | Yes | Yes | Yes |
HuPS) | Yes | Yes | Yes | Yes | Yes | Yes | — | Yes | — | — |
EQ-5D-Y-3L | Yes | Yes | Yes | — | — | — | — | — | Yes | Yes |
EQ-5D-Y-5L | Yes | Yes | Yes | — | — | — | — | — | Yes | Yes |
CHU-9D | Yes | Yes | Yes | — | — | — | — | — | — | Yes |
HUI2 | Yes | Yes | Yes | Yes | Yes | Yes | — | — | Yes | — |
HUI3 | Yes | Yes | Yes | Yes | Yes | Yes | — | Yes | — | — |
CH-6D | — | — | — | — | — | — | — | — | — | — |
17D | Yes | Yes | Yes | Yes | Yes | Yes | Yes | Yes | — | — |
16D | Yes | Yes | Yes | Yes | Yes | Yes | Yes | Yes | — | — |
AHUM | Yes | Yes | — | — | — | — | — | — | Yes | Yes |
AQoL-6D Adolescent | Yes | Yes | Yes | Yes | Yes | Yes | Yes | Yes | — | — |
QWB | — | Yes | — | — | — | — | Yes | — | — | — |
16D = 16-Dimensional Measure of Health-Related Quality of Life; 17D = 17-Dimensional Measure of Health-Related Quality of Life; AHUM = Adolescent Health Utility Measure; AQoL-6D = Assessment of Quality of Life 6-Dimension; CH-6D = Child Health – 6 Dimension; CHU-9D = Child Health Utility 9 Dimensions; EQ-5D-Y-3L = EQ-5D Youth Version – 3 Level; EQ-5D-Y-5L = EQ-5D Youth Version – 5 Level; HSCS-PS = Pre-School Health Status Classification System; HUI2 = Health Utility Index Mark 2; HUI3 = Health Utility Index Mark 3; HuPS = Health Utilities Preschool; IQI = Infant Health-Related Quality of Life Instrument; QWB = Quality of Well-Being Scale; TANDI = Toddler and Infant Health-Related Quality of Life Instrument.
Note: The categories of the dimensions reported in this table were summarized based on the concept of the dimensions included in the instruments, not the original names of the dimensions.
Table 5: Value Sets for Generic Preference-Based Instruments for Children
Instrument | Country | Source of preference | Sample size | Elicitation technique | Perspective | Value range |
|---|---|---|---|---|---|---|
IQI | China–Hong Kong, UK, United States37 | General adult population and primary caregivers of children aged 0 to 3 years | 2,638 | DCE | Imagining a hypothetical infant aged 0 to 3 years | 0.015 to 1 |
EQ-5D-Y-3L | China38 | General adult population | 1,476 | DCE and cTTO | Imagining a hypothetical child aged 10 years | –0.089 to 1 |
Belgium39 | General adult population | 1,172 | DCE and cTTO | Imagining a hypothetical child aged 10 years | –0.475 to 1 | |
Indonesia40 | General adult population | 1,294 | DCE and cTTO | Imagining a hypothetical child aged 10 years | –0.086 to 1 | |
Germany41 | General adult population | 1,245 | DCE and cTTO | Imagining a hypothetical child aged 10 years | –0.283 to 1 | |
Slovenia42 | General adult population | 1,276 | DCE and cTTO | Imagining a hypothetical child aged 10 years | −0.691 to 1 | |
Hungary43 | General adult population | 1,196 | DCE and cTTO | Imagining a hypothetical child aged 10 years | –0.485 to 1 | |
Netherlands44 | General adult population | 1,156 | DCE and cTTO | Imagining a hypothetical child aged 10 years | –0.218 to 1 | |
United States45 | General adult population | 4,155 | DCE | Imagining a hypothetical child aged 7 to 10 years | Unclear | |
Japan46 | General adult population (20 to 79 years) | 1,047 | DCE and cTTO | Imagining a hypothetical child aged 10 years | 0.288 to 1 | |
CHU-9D | UK47 | General adult population | 300 | SG | Adult’s own health | 0.337 to 1 |
Australia20 | Convenient sample of university students aged 18 to 29 years | 38 | TTO | Adult’s own health | –0.2118 to 1 | |
Australia19 | Community-based sample of children aged 11 to 17 years | 1982 | BWS | Child’s own health | –0.1059 to 1 | |
China48 | BWS: Convenient sample of primary and high school students aged 9 to 17 years TTO: Convenient sample of first-year undergraduate students | 940 | BWS and TTO | Child’s or young adult’s own health | 0.0563 to 1 | |
Netherlands49 | General adult population | 1,276 | DCETTO | Adult’s own health | –0.568 to 1 | |
HUI3 | Canada50 | General population aged ≥ 16 years | 256 | SG and RS | Adult’s own health | –0.359 to 1 |
Japan51 | General adult population (aged 20 to 79 years) | 774 | SG and RS | Adult’s own health | –0.002 to 1 | |
France52 | General adult population (aged 20 to 65 years) | 365 | SG and RS | Adult’s own health | Uncleara | |
HUI2 | Canada53 | Parents of school-aged children from general population | 194 | SG and RS | Imagining a hypothetical child aged 10years | –0.025 to 1 |
UK54 | General adult population | 175 | SG | Imagining a hypothetical child aged 10 years | –0.08 to 1 | |
16D | Finland34 | School children aged 12 to 15 | 213 | RS | Child’s own health | Unclear |
17D | Finland33 | Parents of children aged 8 to 11 years: School children; children surviving organ transplant; children with genetic skeletal dysplasias | 115 | RS | Imagining a hypothetical 8 to 11-year-old child | Unclear |
AHUM | UK35 | General adult population | 312 | TTO | Adult’s own health | 0.419 to 1 |
AQoL-6D Adolescent | Australia22 | General adult population | 411 | TTO | Adult’s own health | –0.149 to 1 |
Australia, Fiji, New Zealand, Tonga21 | Children | 279 | TTO | Child’s own health | Australia: 0.072 to 1 Fiji: 0.094 to 1 New Zealand: 0.053 to 1 Tonga: 0.068 to 1 | |
QWB-SA | United States55 | Adults from primary care and 2 college campuses in San Diego | 430 | RS | Adult’s own health | 0.09 to 1 |
16D = 16-Dimensional Measure of Health-Related Quality of Life; 17D = 17-Dimensional Measure of Health-Related Quality of Life; AHUM = Adolescent Health Utility Measure; AQoL-6D = Assessment of Quality of Life 6-Dimension; BWS = best–worst scaling; CHU-9D = Child Health Utility 9 Dimensions; cTTO = composite time trade-off; DCE = discrete choice experiment; DCETTO = DCE with duration; EQ-5D-Y-3L = EQ-5D Youth Version – 3 Level; HUI2 = Health Utility Index Mark 2; HUI3 = Health Utility Index Mark 3; IQI = Infant Health-Related Quality of Life Instrument; QWB = Quality of Well-Being Scale; RS = rating scale; SG = standard gamble; TTO = time trade-off.
aUnclear whether death is anchored at zero.
Review 2: Comparison of Preferences for Health States Between Adults and Children
Study Selection
The literature search identified 9,356 records, of which 28 were retained for full-text screening and 9 were included in the evidence synthesis (Figure 2).
Figure 2: PRISMA Flow Chart of Study Selection for Review 2
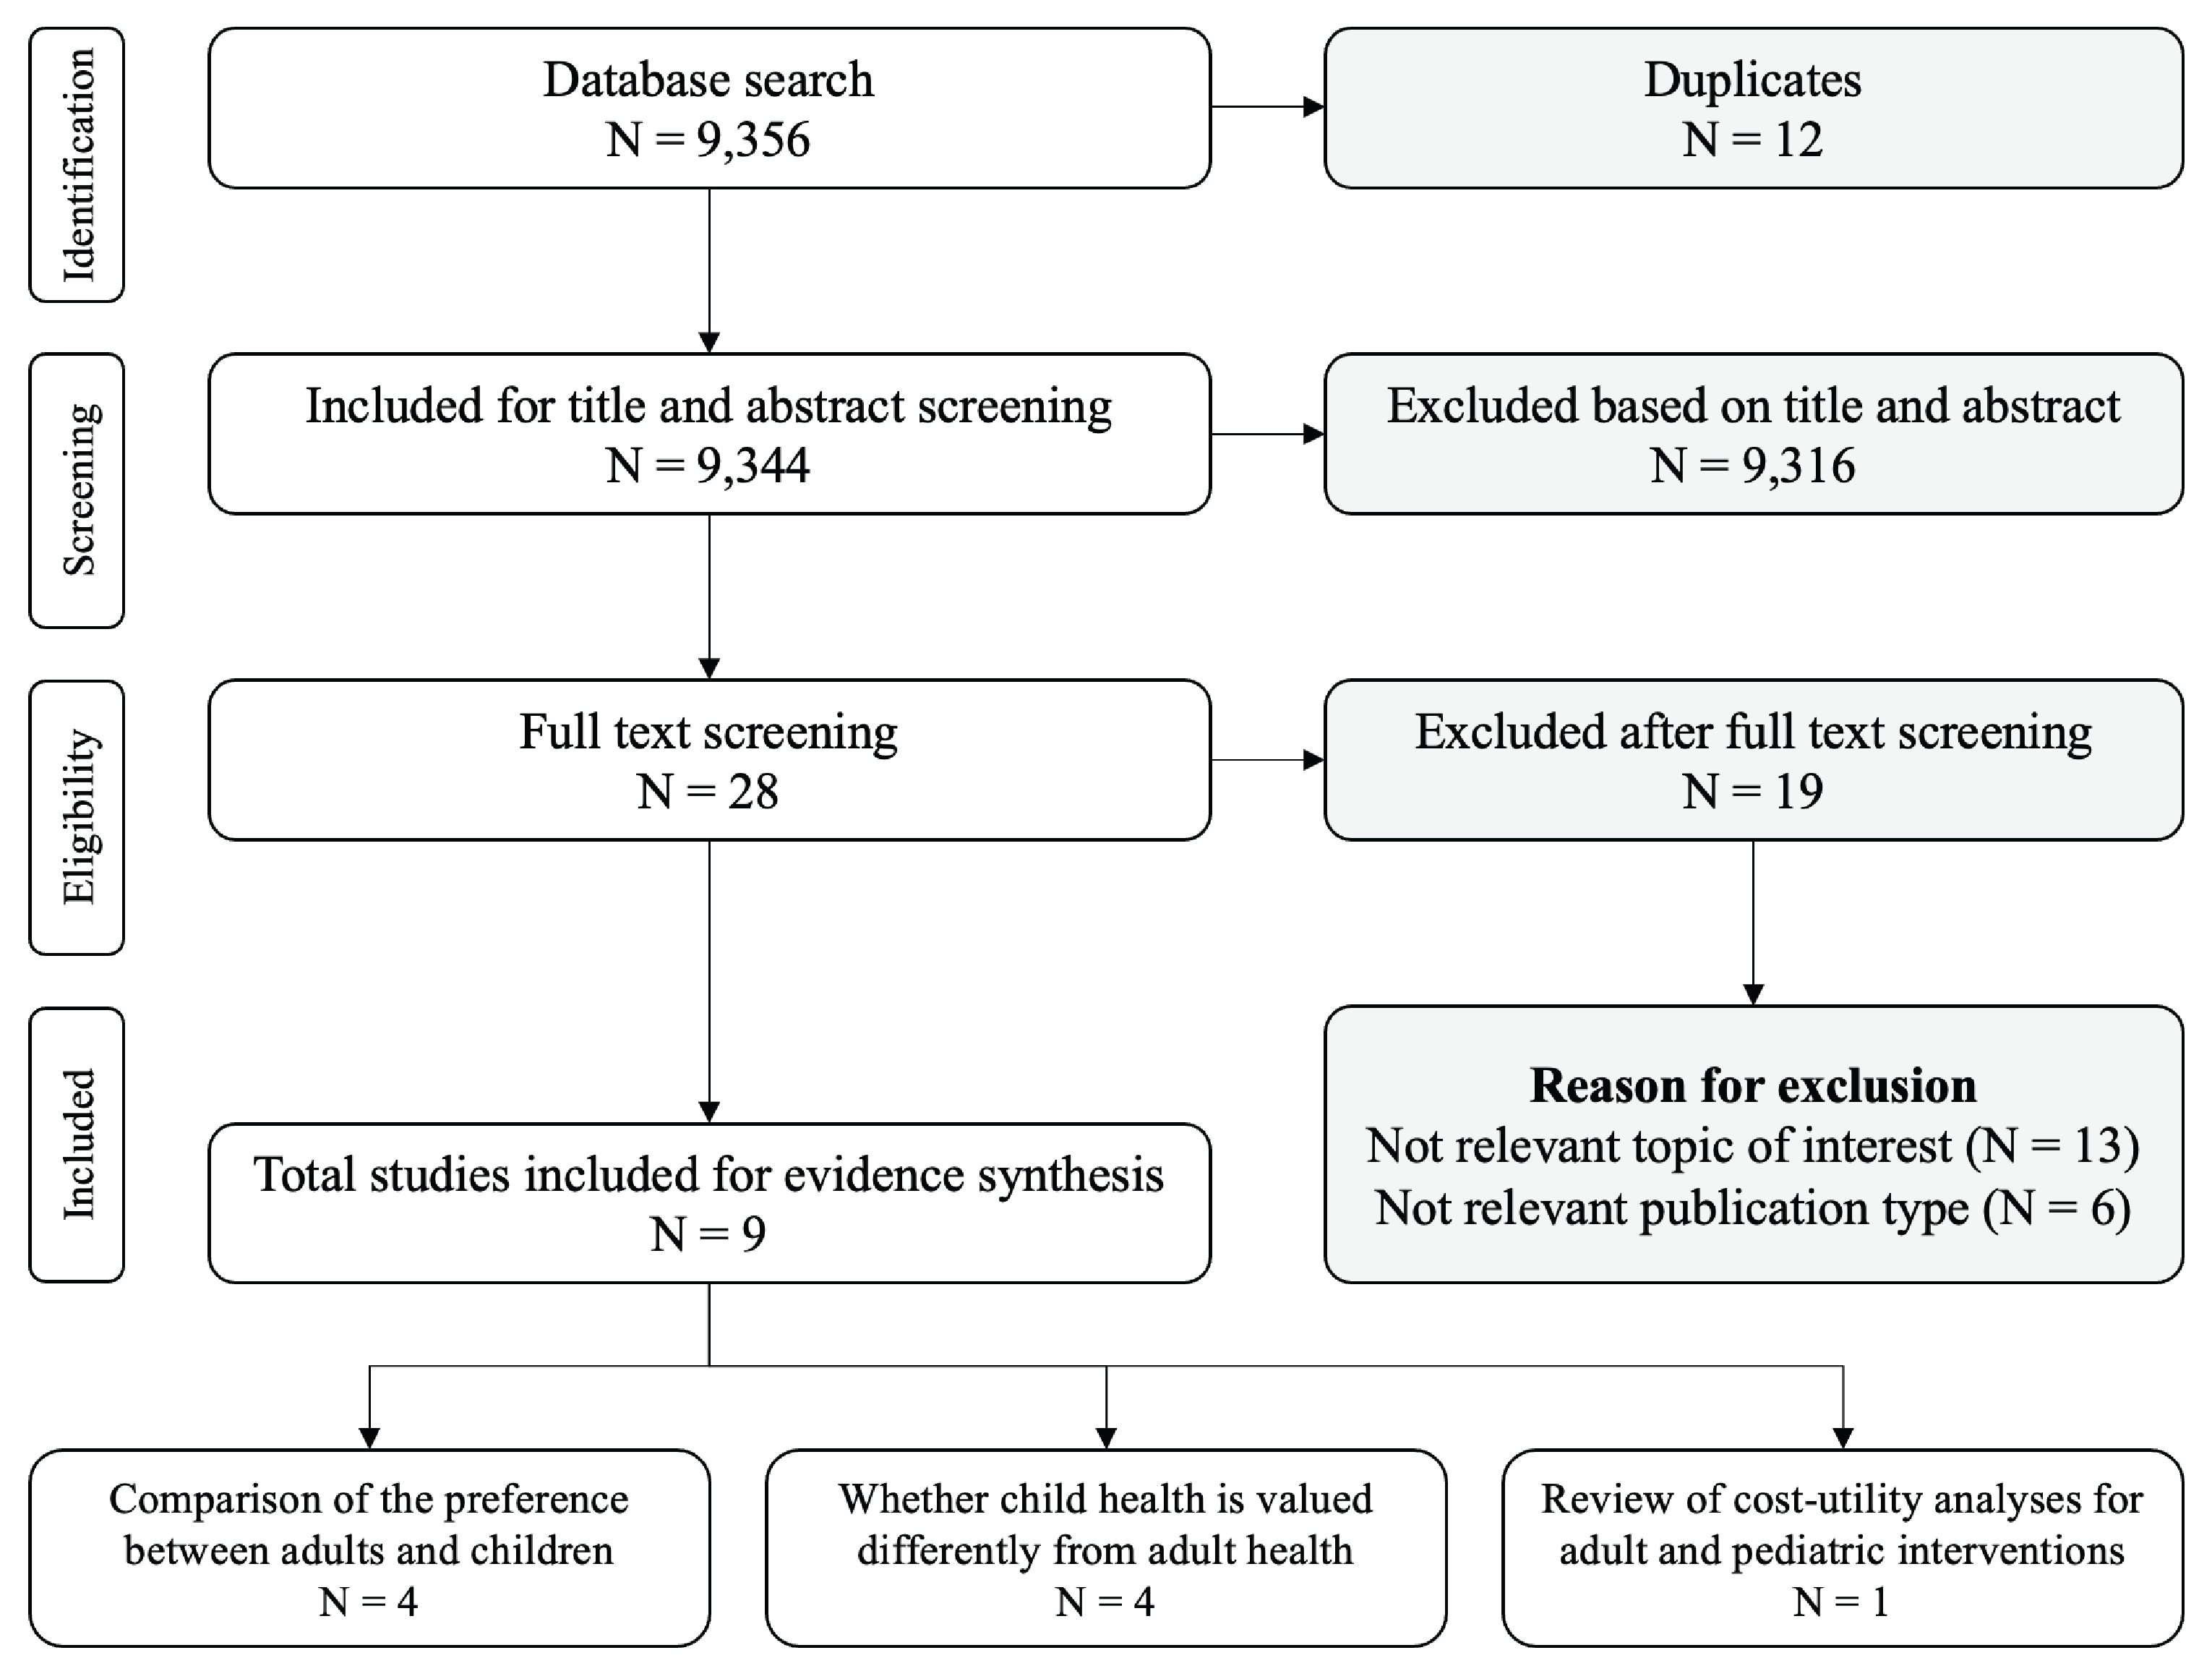
PRISMA = Preferred Reporting Items for Systematic Reviews and Meta-Analyses.
Key Findings
Four studies have quantitatively compared health-state preferences between adults and children (Table 6).56-59 Across these studies, children (aged 8 to 17 years) generally reported different utility values than adults. Notably, several studies found that children gave a lower weight to dimensions of usual activities and pain or discomfort as described by the EQ-5D-Y-3L.57-59
Four studies involving adults in the Netherlands, the US, Germany, Spain, and England were conducted to explore differences in preferences when adults value the same health states but adopt different perspectives based on age.60-63 Generally, these studies found that adults placed a higher value on child health than the health of adults, whether comparing to themselves or62 to another adult,61,63 or when comparing hypothetical public health programs.60
We found no empirical studies comparing the impact of adult versus child health-state preferences on CUAs; however, we identified 1 literature review from 2007 that compared the methodologic characteristics of CUAs for adult and child interventions.64 CUAs evaluating child interventions tended to have lower incremental cost-utility ratios (ICERs) than those for adult interventions, even after stratification by intervention or disease. While this review does not specifically explore the impact of using child versus adult utilities in economic evaluations, it provides important information on how various methodological issues were handled in published CUAs for adults and children.
Table 6: Comparisons of Health-State Preferences Between Adults and Children
Country | Population | Sample size | Perspective | Health-state description | Elicitation technique | Differences in preferences |
|---|---|---|---|---|---|---|
UK, France, Germany, Slovakia56 | Adults: Sample of general population Children: Sample of general population aged 8 to 11 years | 1,454 1,082 | Adults: Own health Children: Own health | Vignette-based health states | SG VAS | Utilities reported by children were generally lower than adults. |
UK57 | Adults: Sample of general population Children: Sample of general population aged 11 to 17 years | 1,000 1,005 | Adults: Imagined child aged 10 years Children: Own health | EQ-5D-Y-3L | DCE | Children gave less weight to usual activities, pain or discomfort, and anxiety or depression than adults. |
Germany, Slovenia, Spain58 | Adults: Sample of general population Children: Sample of general population aged 11 to 17 years | 3,109 2,129 | Adults: Imagined child aged 10 years Children: own health | EQ-5D-Y-3L | DCE | Children gave less weight to anxiety or depression, but more weight to mobility and self-care. |
Australia, Spain59 | Adults: Sample of general population Children: Sample of general population aged 11 to 17 years | 4,141 2,010 | Adults: Own health (N = 2,020) or imagined child aged 10 years (N = 2,121) Children: Own health | EQ-5D-Y-3L | BWS | Children gave less weight to usual activities and pain or discomfort, but more weight to anxiety or depression. |
BWS = best-worst scaling; DCE = discrete choice experiment; SG = standard gamble; VAS = visual analogue scale.
Note: Studies using DCE and BWS did not conduct latent utility anchoring, so they could not derive utility values.
Review 3: Incorporating Spillover Effects in Pediatric Economic Evaluations
Study Selection
A total of 379 records were identified through the literature search (Figure 3) and 3 additional records were identified from the literature search for the first research question. After title and abstract screening, 9 records were retained for full-text screening, and 7 were included in the review.
Figure 3: PRISMA Flow Chart of Study Selection for Review 3
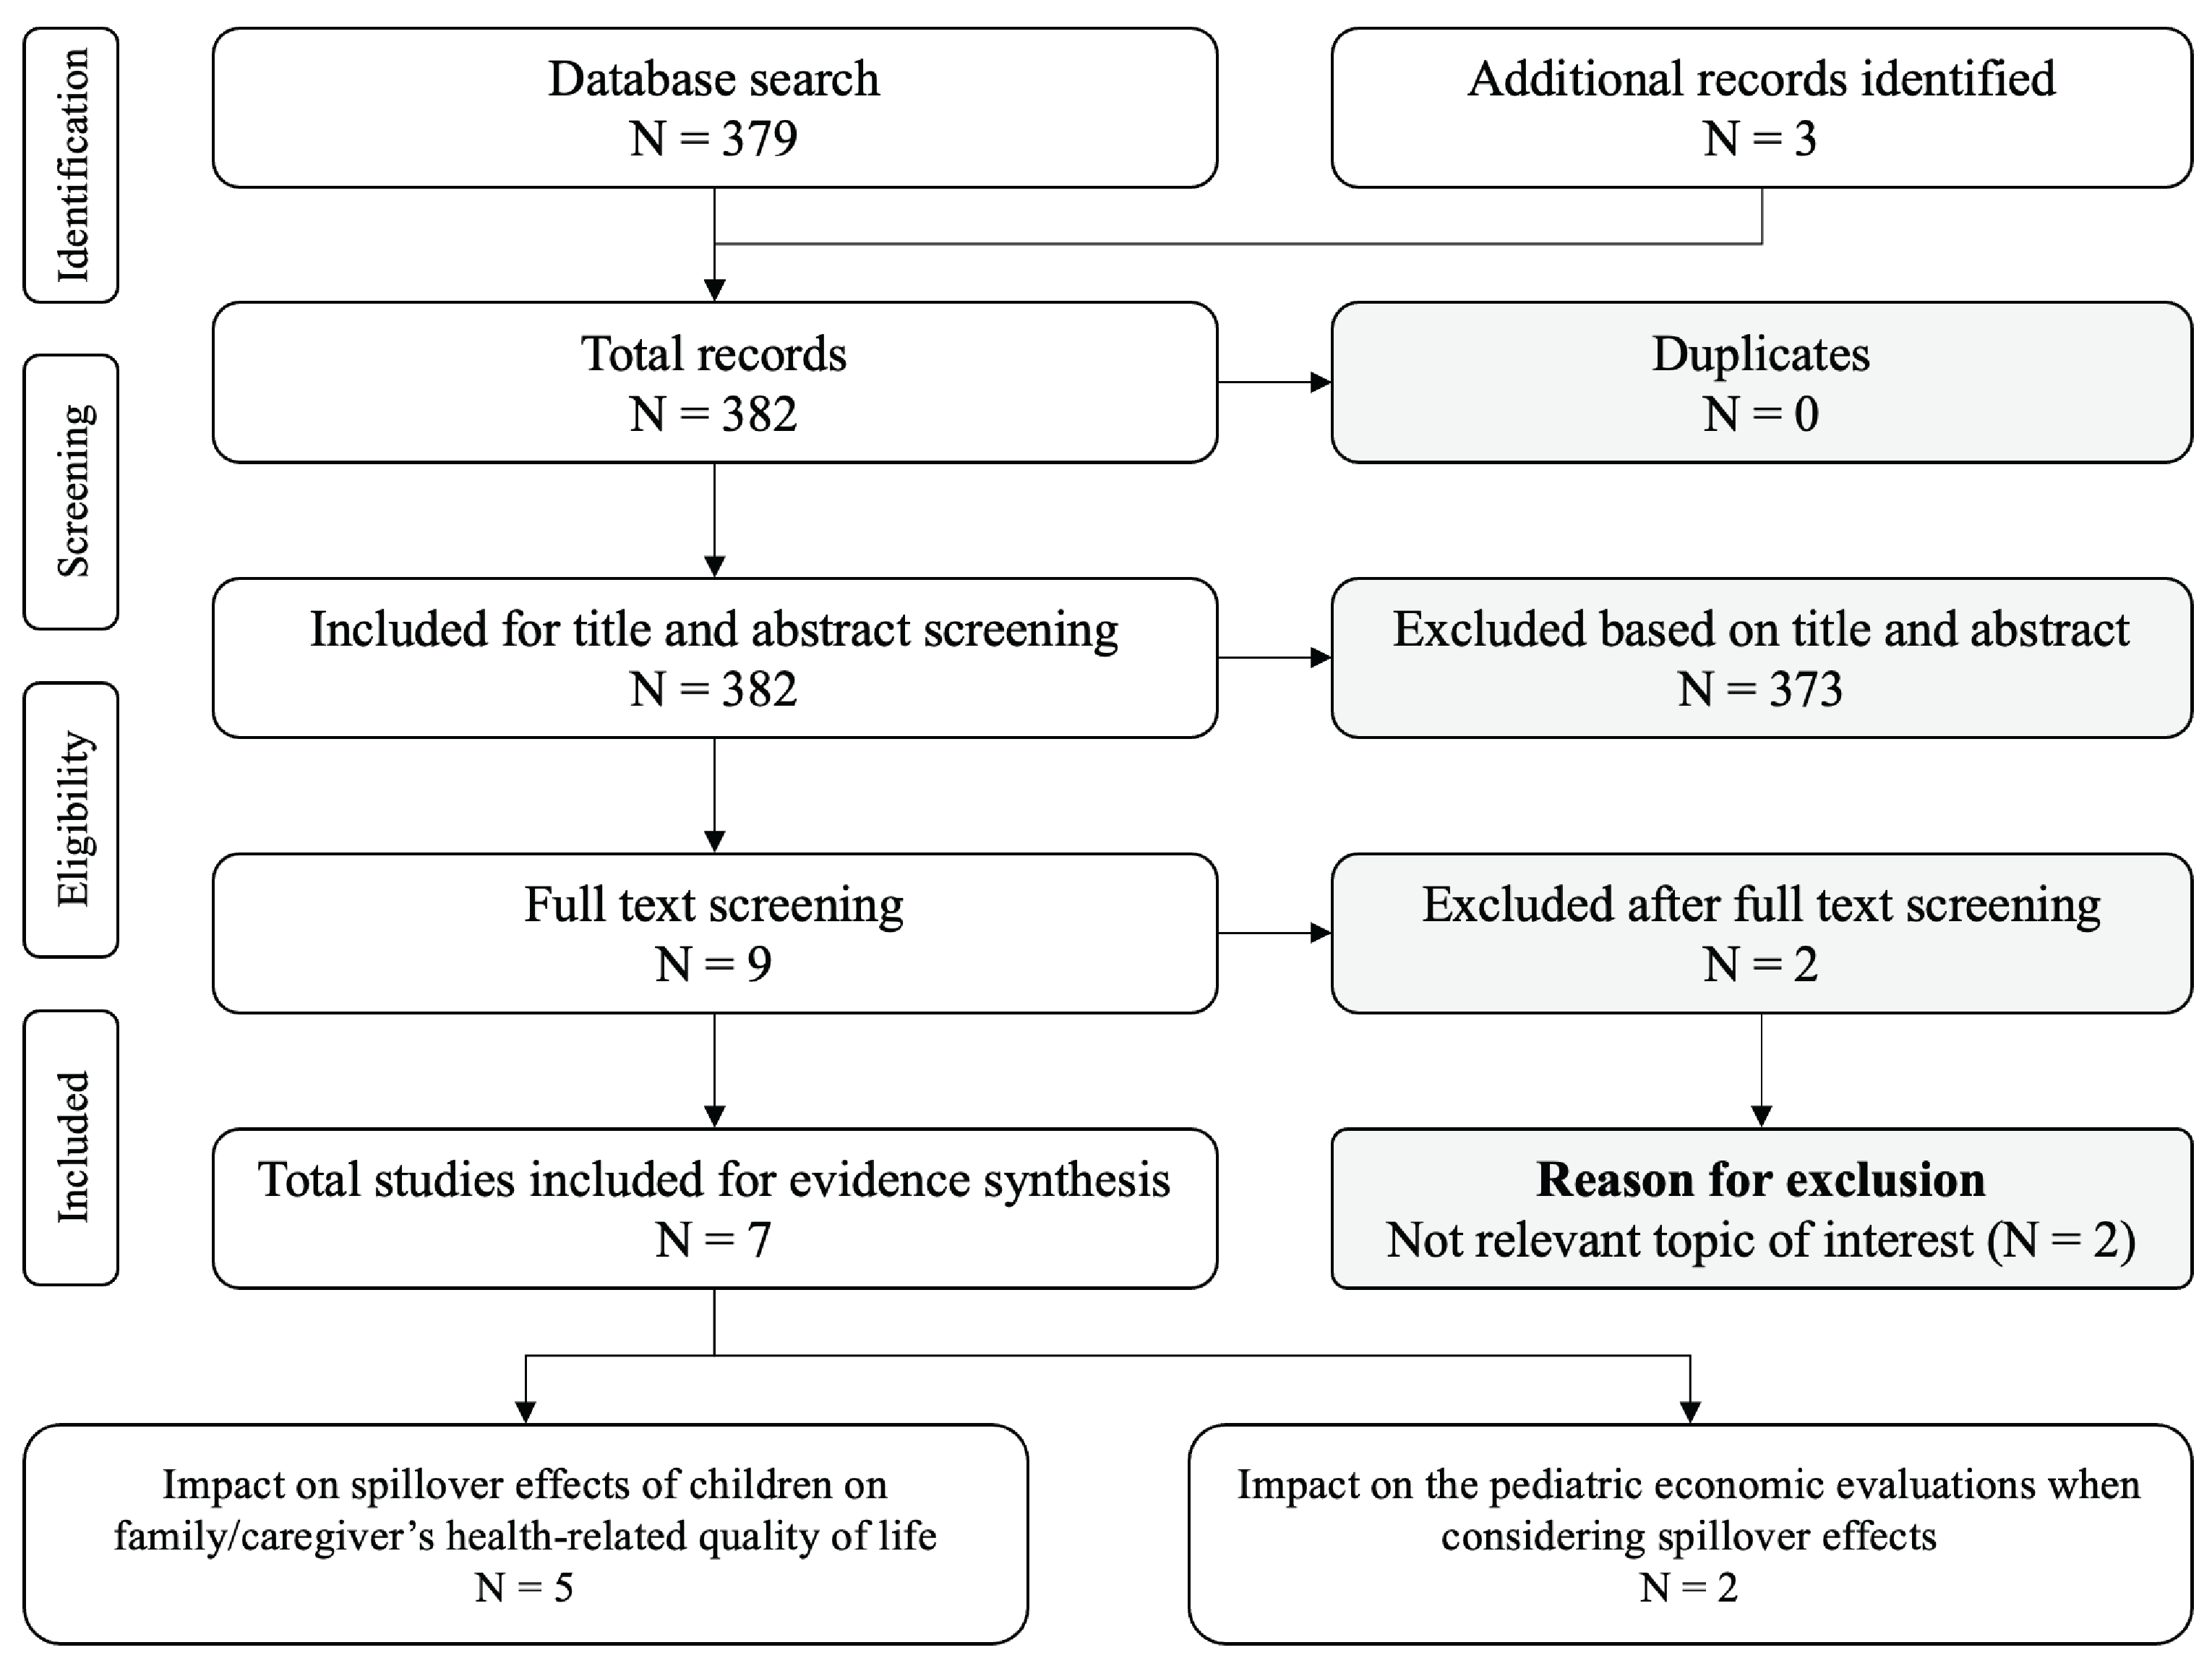
PRISMA = Preferred Reporting Items for Systematic Reviews and Meta-Analyses.
Summary of Findings
Of the 5 studies on the impact of spillover effects on the HRQoL of children’s family or caregivers, 3 reported the impact in quantitative format (Table 7).65-67 While these studies demonstrated a non-negligible impact of the spillover effect on caregivers’ HRQoL, the small number of studies found in our search precludes a robust discussion of the impact of spillover on economic evaluations. We note that findings have been inconsistent with respect to the type of illness of the child, the relationship of the caregiver to the child (e.g., parent, grandparent, sibling, other), and the number of caregivers considered.68,69
Further research is needed to understand the impact of using different methods of estimating spillover effects and incorporating them into economic evaluations. The single empirical review70 captured in our search considered 5 potential methods for estimating health utility for spillover effects:
Relative spillover: This method estimates the change in a family member's health status relative to a change in the patient’s health status.
Relative health spillover per treatment arm: This method accounts for heterogeneity in health spillover according to the treatment received by estimating relative health spillover coefficients within each treatment arm.
Absolute health spillover: This method estimates the absolute health spillover for a family member by estimating coefficients separately on a subsample of patients with and without the primary outcome.
Absolute global health spillover per treatment arm: This method estimates the absolute health spillover among 4 different samples (those who did or did not receive the treatment, and those who did or did not experience the primary outcome).
Additive accrued health benefits: This method uses an additive approach, in which the QALY gain of each individual in the carer-patient dyad is calculated independently and then the 2 sets of QALYs are summed.
The review found that, depending on the method used, an ICER calculated with spillover effects in parents could be meaningfully different (ranging from slightly higher to much lower) from an ICER that only considers the health of the child.70 A separate study conducted by Al-Jabani et al. suggested that the choice of spillover quantification method should depend on the specific context of the condition being studied and the study design itself.69
Table 7: Studies Assessing the Spillover Effects of Children’s Health on Caregivers’ HRQoL
Country | Population | Methods of assessing spillover effects | Sample size | Elicitation technique or instrument | Results |
|---|---|---|---|---|---|
Australia65 | Parents of children with rare genetic conditions (genetic kidney diseases, mitochondrial diseases, epileptic encephalopathies, and brain malformations) | Absolute parental health spillover effect: Parents in this study were 1:4 matched to parents from the general population in Australia based on parental age, gender, marital status, education level, and their child’s age. The absolute spillover was estimated by comparing the HRQoL of the 2 groups using a 2-sample t test. | 162 | SF-6D | Having a child with a rare disease was associated with a disutility of 0.06 in parental HRQoL. |
Relative parental health spillover effect: Multiple linear regression was used to model parental HRQoL as a function of the child’s HRQoL, adjusting for parent and child characteristics that potentially confound the association. | 61 | A spillover coefficient of 0.032 was associated with every 0.1 increment or decrement in child HRQoL. | |||
US66 | Caregivers of children aged 4 to 17 years with an ASD diagnosis | Responses for the instruments of measuring children’s health — including the PedsQL, HUI-3, Vineland-II, CBCL, and CSHQ — were reported by the caregiver. The mean values of instruments in children for each level of the EQ-5D-3L and SF-6D dimensions in caregivers were compared using 2-way t tests. | 224 | Adults: SF-6D, EQ-5D-3L Children: PedsQL, HUI3, Vineland-II, CBCL, and CSHQ | Health utilities of caregivers of children with ASD varied by the health outcomes of the child (ranged for SF-6D and for EQ-5D-3L). |
US67 | Sample of general population using the perspective of a parent | Respondents were asked to value their own health if their children were in disease-specific (Krabbe disease, phenylketonuria, and Pompe disease) health states. Disutility (1 minus the health state valued) was calculated for the spillover health states. | 862 | TTO | Disutility was evident for all health states evaluated (range, 0.07 to 0.19). |
ASD = autism spectrum disorder; CBCL = Child Behaviour Checklist; CSHQ = Children’s Sleep Habits Questionnaire; EQ-5D-3L = EQ-5D – 3 Level; HRQoL = health-related quality of life; HUI3 = Health Utility Index Mark 3; PedsQL = Pediatric Quality of Life Inventory; SF-6D = Short-Form 6-Dimensions; SG = standard gamble; TTO = time trade-off.
Recommendations From International HTA Agencies and Organizations
We searched the websites of 10 HTA agencies and 3 organizations for recommendations and guidelines on measuring or valuing health for children and the incorporation of family or caregiver HRQoL. A summary of the identified recommendations is presented in Table 8.
Generic Versus Disease-Specific Instruments
Two HTA agencies (NICE in the UK, Haute Autorité de santé [HAS] in France) and 1 international organization (WHO) provide recommendations on the use of generic instruments specifically for children.71-73 HAS explicitly recommends the use of child instruments for those younger than 16 years, and the EQ-5D for patients aged 16 years or older,72 while NICE does not recommend any specific instruments. HAS additionally specifies that disease-specific quality-of-life data may be collected for informational purposes (e.g., to compare utility scores estimated from a generic system),72 while NICE recommends against the use of disease-specific measures for children. In the absence of generic measures for estimating children’s utilities, NICE recommends a hierarchy of preferred sources of HRQoL data. Within this hierarchy, the elicitation methods following generic preference-based measures in order of preference are condition-specific preference-based measures, vignettes, and the direct valuation of one’s own health.71 WHO indicates that instruments should be generic, with options to include disease-specific measures.73 Only the Pharmaceutical Benefits Advisory Committee (PBAC) in Australia recommends that a specific instrument (HUI2) be used.74
Value Sets
None of the HTA agencies provide any recommendation on the value set, with the exception of HAS, which notes that foreign value sets may be used in the absence of a French value set for child instruments.72
Self-Report Versus Proxy Report
Few recommendations were identified pertaining to the use of proxy reporting or self-reporting for children (Table 8). HAS and the Belgian Federal Health Care Knowledge Centre indicate that proxy measures should be used only if patients are unable to describe their condition themselves, such as with very young children (for whom the definition is not provided by the organizations); otherwise, self-reporting is preferred.72,75 Both agencies recommend that justification should be provided for the use of proxy reporting. NICE recommends that it be reported whether the assessment is completed through self-report or proxy report, with no indicated preference.71
Spillover Effects
Only NICE, CADTH, and PBAC provide recommendations pertaining to spillover effects. NICE guidelines state that evaluations should consider all health effects for patients and, when relevant, carers. In performing the evaluation of health effects for carers, NICE recommends that evidence should be provided to show that the condition is associated with a substantial effect on the carer’s HRQoL.71 CADTH recommends considering potential spillover impacts beyond the individual being assessed (i.e., in caregivers) via a non–reference-case analysis.4 PBAC indicates that a supplementary analysis is recommended to include broader beneficiaries — such as the community, carers, and dependents — when assessing health or other relevant outcomes beyond the treated patient population.74 It is acknowledged that the quantification of the caregiver’s health state may be particularly challenging due to factors such as limited data and lack of consensus on methods. Thus, in measuring utility on spillover effects, an analysis of uncertainty is noted to be especially important, requiring categorization of estimates in terms of parameter uncertainty and methodological uncertainty. It is highlighted that parameter uncertainty resulting from a lack of data should be addressed through probabilistic analyses that utilize increases in the width of interval estimates, while methodological uncertainty should be explored in analyses that can be contrasted to the reference case.
Age Transition
No guidance was identified pertaining to the methodology used to assess utility as age changes.
Table 8: Recommendations From HTA Agencies and Other Organizations
Agency (jurisdiction) | Generic or specific measure | Instrument and value set recommendations | Instrument development guidelines | Age range, years | Self-report or proxy report | Spillover |
|---|---|---|---|---|---|---|
HTA agencies | ||||||
NICE71 (UK) |
|
| No recommendations | < 18 | Indicate whether proxy or self-report |
|
HAS72 (France) |
|
| No recommendations | No recommendations | Self or proxya | No recommendations |
Belgian Federal Health Care Knowledge Centre75 (Belgium) | No recommendations | No recommendations | No recommendations | No recommendations | Self or proxya | No recommendations |
CADTH4 (Canada) | No recommendations | No recommendations | No recommendations | No recommendations | No recommendations |
|
PBAC74 (Australia) | No recommendations | CHU-9D should be used for childhood conditions | No recommendations | No recommendations | No recommendations | In circumstances where the beneficiaries of health or other relevant outcomes are broader than the treated patient population (e.g., community, carers, dependents), include these as supplementary analyses |
Other organizations | ||||||
No recommendations | No recommendations |
| < 18 | No recommendations | No recommendations | |
Generic measures preferred, with the option to include disease-specific elements | No recommendations |
| No recommendations | No recommendations | No recommendations | |
No recommendations | No recommendations |
| No recommendations | No recommendations | No recommendations | |
CHU-9D = Child Health Utility 9 Dimensions; HAS = Haute Autorité de santé; HRQoL = health-related quality of life; ISPOR = International Society for Pharmacoeconomics and Outcomes Research; NICE = National Institute for Health and Care Excellence; PBAC = Pharmaceutical Benefits Advisory Committee.
aSelf-report is preferred; however, proxy report is recommended if patients cannot describe health states themselves (e.g., very young children).
Note: HTA agencies not included in the table did not have specific recommendations on measuring utilities of children.
Discussion
Over the last decade, there has been a growing interest in developing instruments to measure and value HRQoL for children, as well as in measuring and incorporating the impact of having an ill child on family members’ or caregivers’ HRQoL. In this paper, we have conducted 3 literature reviews to provide an overview of the current state of evidence related to the development, measurement, and valuation of generic preference-based instruments for children; comparison of health-state preferences between adults and children; and spillover effects on family or caregiver HRQoL. The following section summarizes the findings from each review, highlighting evidence gaps and recommendations for future research.
Review 1: Generic Preference-Based Instruments for Children
Measurement: Preference-based instruments are tools that can be used to evaluate and quantify an individual’s health status. Our review identified 15 preference-based instruments that have been developed for children. Given the range of options available, there are specific considerations when determining whether an instrument is fit for purpose:
Age range: All identified instruments were developed for specific age ranges, with the exception of 3 instruments (QWB-SA, HUI2, and HUI3) that can be used for both children and adults.
Dimensions: Some identified instruments include health dimensions tailored to specific age groups (e.g., breathing, excretion, and sleeping in IQI), while others include dimensions important for both children and adults (e.g., mobility, usual activities, and pain in EQ-5D). The dimensions considered by each instrument generally reflect aspects of health that are relevant to the developmental stage of the targeted age group. This is because certain dimensions of HRQoL that are important to adolescents are likely to differ from infants or younger children. For instruments that target multiple age groups, balancing age-specific health dimensions and comparability across age groups is a difficult task.
Method of administration: Several instruments have a proxy version that can be completed by a parent or caregiver for younger children (e.g., those aged 0 to 7 years). Proxy report is commonly used for young children who may not be able to communicate their symptoms, express feelings accurately, or comprehend the questions in the instrument.76 However, although parents or caregivers may be able to report on observable functioning, studies suggest they are less accurate in assessing subjective functioning and emotional aspects for children,79 and evidence suggests that there is poor agreement between self-report and proxy-report results. Specifically, systematic reviews have described poor interrater agreement for overall HRQoL between proxy report and self-report,11-13 with the direction and magnitude of differences varying across health conditions, valuation methods, and proxy types.11,12 It may be difficult for a parent to separate their own HRQoL from that of their children, which may cause potential bias.80 Therefore, self-reporting by children should be used whenever feasible and appropriate.
Credibility: Our review found that a few of the commonly used child instruments — such as the EQ-5D-Y, CHU9D, and HUI — have demonstrated acceptable psychometric properties through multiple validation studies.14 Psychometric tests conducted in the jurisdiction of interest are preferred, given they are specific to the population assessed. All validation studies conducted in Canada pertain to the HUI2 or HUI3 and were completed more than 10 years ago.14 Little is known about the extent to which changes in society over the last decade (e.g., internet usage, smartphones) may have impacted the perception of health and quality of life among children and youth in Canada. There is a need for new evidence on the psychometric properties of commonly used child instruments in Canada, as well as head-to-head comparisons with the HUI.
Valuation: Preference-based instruments not only measure but also value health. Canadian value sets were identified only for HUI2 and HUI3, with preferences obtained from the adult general population (often called societal preferences).Societal preferences from an informed, representative sample of adults in the general public are commonly recommended to develop value set for adult instruments.19,81 However, it is unclear whether preferences of adults should be used for developing children’s value sets. In a recent qualitative study, affected and interested parties in Canada recommended that preferences be elicited directly from children.82
Valuing health from a child’s perspective faces unique theoretical, methodological, and applicational challenges.80,83,84 An international protocol for valuing the EQ-5D-Y-3L has provided recommendations on the target source of preference (adults), the perspective of the valuation questions (a child aged 10 years), the preference elicitation methods (DCE and TTO), and the experimental design.81 The intention of the protocol was to promote the comparison across valuation studies. Several countries have used the protocol to produce the value set for the EQ-5D-Y-3L.85 However, theoretical, methodological, and normative issues in valuing child health remain.83 Due to the nature and complexity of these issues, engagement with affected groups and parties of interest is recommended to inform the discussion and to address these issues in local context.83
Summary of Recommendations
Based on the findings from this review, there is a need for researchers to conduct:
validation studies on child instruments in Canada (e.g., EQ-5D-Y)
head-to-head studies comparing the psychometric performance of other child instruments with the HUI2 or HUI3
qualitative and quantitative studies engaging local parties of interest and children to assess the feasibility and acceptability of using a child’s perspective for the development of value sets
methodological exploration regarding the optimal method of health-state preference elicitation (e.g., TTO, DCE) for children.
Review 2: Comparison of Health-State Preferences Between Adults and Children
In addition to addressing the challenges in measuring and valuing children and adolescents’ health, there is a need to understand any differences in preferences according to the perspective used and the implications for health economic evaluations. We identified several studies that demonstrate that children and adults have different preferences,56-59 which may be attributed to the perspective used or the method of preference elicitation.60,61,63,86 In a roundtable discussion on developing a value set of the EQ-5D-Y-3L for the US, affected groups and parties of interest felt that children could relate to a 10-year-old's perspective better than adults, and noted that adults may be inconsistent in their views about a 10-year-old, partly depending on parental status.87 Additional methodological explorations conducted as part of the development of the EQ-5D-Y-3L value set found that VAS and DCE with duration yielded lower values for children, while TTO produced higher values for children, when compared with adults.81 One possible explanation is that a stronger preference for the length of life for children leads to less willingness to trade off time.81
Given that children’s preferences are different from those of adults, there are practical issues to consider when conducting economic evaluations for children. For example, how should health utilities be handled at age transitions when modelling a lifetime time horizon? How would different approaches affect the outcomes of the economic evaluation? We did not find any empirical studies comparing the impact of using adult versus child health-state preferences on CUAs, nor did we identify any evidence on using health utilities at age transitions. Only 1 commentary provided an overview of issues and implications arising from valuing child health states using a mixed sample of children and adults.88 According to the authors, this mixed approach has the advantage of allowing children to express their views around matters that may affect them as well as including the preferences of taxpayers and voters. The proportions of adults and children for a valuation sample and the elicitation technique require careful consideration.
There are additional fundamental questions for child health valuation that have not yet been addressed in the literature, including whether instruments that have both child and adult versions should be preferred. If different instruments that assess different dimensions of HRQoL are used to generate utilities for the child period and the adult period in the same economic evaluation, this may lead to incomparable or inconsistent health outcomes. Another question is whether a separate value set is needed for a child instrument if there is already 1 for the adult version, and whether and under what conditions would 2 (or more) sets of societal preferences be required, and what impact this would have on decision-making.
Summary of Recommendations
Based on the findings from this review, there is a need for researchers to conduct:
studies comparing the impact of using child versus adult health-state preferences in CUA
methodological exploration to determine how health utilities should be handled at age transitions when modelling a lifetime time horizon, addressing whether the same preference-based instruments should be used for children and adults (e.g., EQ-5D-Y and EQ-5D), and the impact that different approaches to handling age transitions have on cost-effectiveness results.
Review 3: Incorporating Spillover Effects in Pediatric Economic Evaluations
Another consideration when measuring and valuing child health is the spillover effect (the impact of the child’s health on the health of family members or caregivers). Most pediatric CUAs conducted from a societal perspective have included family costs but few have incorporated family spillover health effects.89 However, studies have demonstrated that there is a non-negligible impact of the spillover effect on caregivers’ HRQoL.65-67
Our review found that there is currently no consensus on how spillover effects on family members or caregivers should be measured and quantified. Few studies have assessed whether spillover effects vary according to the type of illness and there is inconsistent evidence on its relationship with type and number of caregivers.68,69 Adding to this complexity is that a range of methods have been used to quantify the impact of spillover effects (i.e., as relative health spillover, relative health spillover per treatment arm, absolute health spillover, absolute global health spillover per treatment arm, or additive accrued health benefits).69,70,90 Incorporating spillover effects can affect the ICER, but the magnitude of impact will vary according to the method used to quantify spillover.70 Ethical implications of including spillover must also be considered. For example, the spillover effect may disproportionally affect subgroups of people (e.g., those who are married) who may receive greater benefits from treatments than others (e.g., those who are single).
Summary of Recommendations
Based on the findings from this review, there is a need for researchers to conduct:
methodological studies exploring the number (e.g., single or multiple) and type of caregiver (e.g., parent, child, spouse, grandparent) that should be included in the assessment of spillover effects
methodological studies exploring how to quantify spillover effect and the impact of using different approaches on cost-effectiveness results.
Limitations
Methodological limitations of this paper include the potential for missing studies, given that the search was undertaken in a single database, limited grey literature sources were searched, and only English-language studies were included; however, we remain unaware at the time of writing of any other generic preference-based instruments, value sets, or studies pertaining to spillover that would be eligible for inclusion in this paper. We additionally note that quality assessment of the included studies was not undertaken.
Summary
We found a dearth of guidance from HTA agencies regarding the measurement and valuation of child HRQoL, as well as the incorporation of spillover effects into economic evaluations involving pediatric populations. The existing literature lacks consensus on optimal methods for measuring and valuing HRQoL, and the impact of methodological and normative choices on cost-effectiveness estimates requires further study. Because this remains an evolving area, CADTH has deemed that no updates to the 2017 Guidelines for the Economic Evaluation of Health Technologies are warranted at this time. CADTH recommends that sponsors provide sufficient detail and transparency in submissions with respect to the methodologies used to measure and value child HRQoL, as well as justify the choice of generic preference-based instrument(s) and value set for the intended age range(s). Should sponsors wish to consider spillover to populations beyond the Health Canada indication, this should be done in non–reference-case analyses, consistent with guidance in the 2017 guidelines. In scenarios where spillover is included, sponsors should justify the number and type of caregivers for whom spillover is incorporated, and provide methodological details describing how spillover was measured and incorporated into the economic evaluation.
Authors
Shitong Xie, PhD, Department of Health Research Methods, Evidence, and Impact, McMaster University
Brittany Humphries, PhD, Department of Health Research Methods, Evidence, and Impact, McMaster University
Preston Tse, BHSc, Department of Health Research Methods, Evidence, and Impact, McMaster University
Jesse Elliott, PhD, Lead, Health Economics, CADTH
Feng Xie, PhD, Department of Health Research Methods, Evidence, and Impact, McMaster University; Centre for Health Economics and Policy Analysis, McMaster University
Contributors
CADTH would like to thank the following individuals for their input into this paper:
Bernice Tsoi, PhD, Manager, Health Economics, CADTH
Luiza Grazziotin, PhD, Health Economist, CADTH
Ian Cromwell, PhD, Manager, Health Economics, CADTH
References
1.Weinstein MC, Torrance G, McGuire A. QALYs: the basics. Value Health. Mar 2009;12 Suppl 1:S5-9. doi:10.1111/j.1524-4733.2009.00515.x PubMed
2.Chen G, Ratcliffe J. A Review of the Development and Application of Generic Multi-Attribute Utility Instruments for Paediatric Populations. Pharmacoeconomics. Oct 2015;33(10):1013-28. doi:10.1007/s40273-015-0286-7 PubMed
3.Rowen D, Azzabi Zouraq I, Chevrou-Severac H, van Hout B. International Regulations and Recommendations for Utility Data for Health Technology Assessment. Pharmacoeconomics. Dec 2017;35(Suppl 1):11-19. doi:10.1007/s40273-017-0544-y PubMed
4.Canadian Agency for Drugs and Technologies in Health (CADTH). Guidelines for the Economic Evaluation of Health Technologies: Canada. 4th ed. https://www.cadth.ca/guidelines-economic-evaluation-health-technologies-canada-0. Accessed March 22, 2024.
5.Guide to the Methods of Technology Appraisal (2013).
6.Denburg AE, Giacomini M, Ungar WJ, Abelson J. 'The problem is small enough, the problem is big enough': a qualitative study of health technology assessment and public policy on drug funding decisions for children. Int J Equity Health. Mar 30 2020;19(1):45. doi:10.1186/s12939-020-01164-w PubMed
7.Denburg AE, Ungar WJ, Greenberg M. Public drug policy for children in Canada. CMAJ. Jul 31 2017;189(30):E990-E994. doi:10.1503/cmaj.170380 PubMed
8.National Institute for Health and Care Excellence. The NICE methods of health technology evaluation: the case for change. 2020. https://www.nice.org.uk/about/what-we-do/our-programmes/nice-guidance/chte-methods-consultation. Accessed March 22, 2024.
9.Kwon J, Freijser L, Huynh E, et al. Systematic Review of Conceptual, Age, Measurement and Valuation Considerations for Generic Multidimensional Childhood Patient-Reported Outcome Measures. Pharmacoeconomics. Apr 2022;40(4):379-431. doi:10.1007/s40273-021-01128-0 PubMed
10.Janssens A, Thompson Coon J, Rogers M, et al. A systematic review of generic multidimensional patient-reported outcome measures for children, part I: descriptive characteristics. Value Health. Mar 2015;18(2):315-33. doi:10.1016/j.jval.2014.12.006 PubMed
11.Jiang M, Ma Y, Li M, Meng R, Ma A, Chen P. A comparison of self-reported and proxy-reported health utilities in children: a systematic review and meta-analysis. Health Qual Life Outcomes. Feb 5 2021;19(1):45. doi:10.1186/s12955-021-01677-0 PubMed
12.Khadka J, Kwon J, Petrou S, Lancsar E, Ratcliffe J. Mind the (inter-rater) gap. An investigation of self-reported versus proxy-reported assessments in the derivation of childhood utility values for economic evaluation: A systematic review. Soc Sci Med. Nov 2019;240:112543. doi:10.1016/j.socscimed.2019.112543 PubMed
13.Khanna D, Khadka J, Mpundu-Kaambwa C, Lay K, Russo R, Ratcliffe J. Are We Agreed? Self- Versus Proxy-Reporting of Paediatric Health-Related Quality of Life (HRQoL) Using Generic Preference-Based Measures: A Systematic Review and Meta-Analysis. Pharmacoeconomics. Nov 2022;40(11):1043-1067. doi:10.1007/s40273-022-01177-z PubMed
14.Rowen D, Keetharuth AD, Poku E, Wong R, Pennington B, Wailoo A. A Review of the Psychometric Performance of Selected Child and Adolescent Preference-Based Measures Used to Produce Utilities for Child and Adolescent Health. Value Health. Mar 2021;24(3):443-460. doi:10.1016/j.jval.2020.09.012 PubMed
15.Verstraete J, Lloyd AJ, Jelsma J. Performance of the Toddler and Infant (TANDI) Health-Related Quality of Life Instrument in 3-4-Year-Old Children. Children (Basel). Oct 15 2021;8(10)doi:10.3390/children8100920 PubMed
16.Ngwira LG, Khan K, Maheswaran H, et al. A Systematic Literature Review of Preference-Based Health-Related Quality-of-Life Measures Applied and Validated for Use in Childhood and Adolescent Populations in Sub-Saharan Africa. Value Health Reg Issues. Sep 2021;25:37-47. doi:10.1016/j.vhri.2020.11.009 PubMed
17.Poder TG, Carrier N, Mead H, Stevens KJ. Canadian French translation and linguistic validation of the child health utility 9D (CHU9D). Health Qual Life Outcomes. Aug 29 2018;16(1):168. doi:10.1186/s12955-018-0998-4 PubMed
18.Poder TG, Guertin JR, Touré M, et al. Canadian French translation and linguistic validation of the health-related quality of life utility measure for pre-school children. Expert Rev Pharmacoecon Outcomes Res. Dec 2021;21(6):1195-1201. doi:10.1080/14737167.2021.1895754 PubMed
19.Ratcliffe J, Huynh E, Chen G, et al. Valuing the Child Health Utility 9D: Using profile case best worst scaling methods to develop a new adolescent specific scoring algorithm. Soc Sci Med. May 2016;157:48-59. doi:10.1016/j.socscimed.2016.03.042 PubMed
20.Ratcliffe J, Chen G, Stevens K, et al. Valuing Child Health Utility 9D Health States with Young Adults: Insights from a Time Trade Off Study. Appl Health Econ Health Policy. Oct 2015;13(5):485-92. doi:10.1007/s40258-015-0184-3 PubMed
21.Moodie M, Richardson J, Rankin B, Iezzi A, Sinha K. Predicting time trade-off health state valuations of adolescents in four Pacific countries using the Assessment of Quality-of-Life (AQoL-6D) instrument. Value Health. Dec 2010;13(8):1014-27. doi:10.1111/j.1524-4733.2010.00780.x PubMed
22.Richardson J, Atherton Day N, Peacock S, Iezzi A. Measurement of the Quality of Life for Economic Evaluation and the Assessment of Quality of Life (AQoL) Mark 2 Instrument. Australian Economic Review. 2004;37(1):62-88.
23.Jabrayilov R, van Asselt ADI, Vermeulen KM, et al. A descriptive system for the Infant health-related Quality of life Instrument (IQI): Measuring health with a mobile app. PLoS One. 2018;13(8):e0203276. doi:10.1371/journal.pone.0203276 PubMed
24.Verstraete J, Ramma L, Jelsma J. Item generation for a proxy health related quality of life measure in very young children. Health Qual Life Outcomes. Jan 14 2020;18(1):11. doi:10.1186/s12955-020-1271-1 PubMed
25.Saigal S, Rosenbaum P, Stoskopf B, et al. Development, reliability and validity of a new measure of overall health for pre-school children. Qual Life Res. Feb 2005;14(1):243-57. doi:10.1007/s11136-004-4228-7 PubMed
26.Furlong W, Rae C, Feeny D, et al. Generic Health-Related Quality of Life Utility Measure for Preschool Children (Health Utilities Preschool): Design, Development, and Properties. Value Health. Aug 25 2022;doi:10.1016/j.jval.2022.07.015 PubMed
27.Wille N, Badia X, Bonsel G, et al. Development of the EQ-5D-Y: a child-friendly version of the EQ-5D. Qual Life Res. Aug 2010;19(6):875-86. doi:10.1007/s11136-010-9648-y PubMed
28.Kreimeier S, Åström M, Burström K, et al. EQ-5D-Y-5L: developing a revised EQ-5D-Y with increased response categories. Qual Life Res. Jul 2019;28(7):1951-1961. doi:10.1007/s11136-019-02115-x PubMed
29.Stevens K. Developing a descriptive system for a new preference-based measure of health-related quality of life for children. Qual Life Res. Oct 2009;18(8):1105-13. doi:10.1007/s11136-009-9524-9 PubMed
30.Feeny D, Furlong W, Barr RD, Torrance GW, Rosenbaum P, Weitzman S. A comprehensive multiattribute system for classifying the health status of survivors of childhood cancer. J Clin Oncol. Jun 1992;10(6):923-8. doi:10.1200/jco.1992.10.6.923 PubMed
31.Feeny D, Furlong W, Boyle M, Torrance GW. Multi-attribute health status classification systems. Health Utilities Index. Pharmacoeconomics. Jun 1995;7(6):490-502. doi:10.2165/00019053-199507060-00004 PubMed
32.Kang E. Validity of child health-6 dimension(CH-6D) for adolescents. Conference Abstract. Value in Health. 2016;19(7):A854.
33.Apajasalo M, Rautonen J, Holmberg C, et al. Quality of life in pre-adolescence: a 17-dimensional health-related measure (17D). Qual Life Res. Dec 1996;5(6):532-8. doi:10.1007/bf00439227 PubMed
34.Apajasalo M, Sintonen H, Holmberg C, et al. Quality of life in early adolescence: a sixteen-dimensional health-related measure (16D). Qual Life Res. Apr 1996;5(2):205-11. doi:10.1007/bf00434742 PubMed
35.Beusterien KM, Yeung JE, Pang F, Brazier J. Development of the multi-attribute Adolescent Health Utility Measure (AHUM). Health Qual Life Outcomes. Aug 28 2012;10:102. doi:10.1186/1477-7525-10-102 PubMed
36.Kaplan RM, Ganiats TG, and Sieber WJ. The Quality of Well-Being Self Administered. 1996 Copyrighted material.
37.Krabbe PFM, Jabrayilov R, Detzel P, Dainelli L, Vermeulen KM, van Asselt ADI. A two-step procedure to generate utilities for the Infant health-related Quality of life Instrument (IQI). PLoS One. 2020;15(4):e0230852. doi:10.1371/journal.pone.0230852 PubMed
38.Yang Z, Jiang J, Wang P, et al. Estimating an EQ-5D-Y-3L Value Set for China. Pharmacoeconomics. Nov 18 2022;doi:10.1007/s40273-022-01216-9 PubMed
39.Dewilde S, Roudijk B, Tollenaar NH, Ramos-Goñi JM. An EQ-5D-Y-3L Value Set for Belgium. Pharmacoeconomics. Nov 1 2022:1-12. doi:10.1007/s40273-022-01187-x PubMed
40.Fitriana TS, Roudijk B, Purba FD, Busschbach JJV, Stolk E. Estimating an EQ-5D-Y-3L Value Set for Indonesia by Mapping the DCE onto TTO Values. Pharmacoeconomics. Nov 9 2022;doi:10.1007/s40273-022-01210-1 PubMed
41.Kreimeier S, Mott D, Ludwig K, Greiner W. EQ-5D-Y Value Set for Germany. Pharmacoeconomics. May 23 2022:1-13. doi:10.1007/s40273-022-01143-9 PubMed
42.Prevolnik Rupel V, Ogorevc M. EQ-5D-Y Value Set for Slovenia. Pharmacoeconomics. Apr 2021;39(4):463-471. doi:10.1007/s40273-020-00994-4 PubMed
43.Rencz F, Ruzsa G, Bató A, Yang Z, Finch AP, Brodszky V. Value Set for the EQ-5D-Y-3L in Hungary. Pharmacoeconomics. Sep 20 2022:1-11. doi:10.1007/s40273-022-01190-2 PubMed
44.Roudijk B, Sajjad A, Essers B, Lipman S, Stalmeier P, Finch AP. A Value Set for the EQ-5D-Y-3L in the Netherlands. Pharmacoeconomics. Oct 10 2022:1-11. doi:10.1007/s40273-022-01192-0 PubMed
45.Craig BM, Greiner W, Brown DS, Reeve BB. Valuation of Child Health-Related Quality of Life in the United States. Health Econ. Jun 2016;25(6):768-77. doi:10.1002/hec.3184 PubMed
46.Shiroiwa T, Ikeda S, Noto S, Fukuda T, Stolk E. Valuation Survey of EQ-5D-Y Based on the International Common Protocol: Development of a Value Set in Japan. Med Decis Making. Jul 2021;41(5):597-606. doi:10.1177/0272989x211001859 PubMed
47.Stevens K. Valuation of the Child Health Utility 9D Index. Pharmacoeconomics. Aug 1 2012;30(8):729-47. doi:10.2165/11599120-000000000-00000 PubMed
48.Chen G, Xu F, Huynh E, Wang Z, Stevens K, Ratcliffe J. Scoring the Child Health Utility 9D instrument: estimation of a Chinese child and adolescent-specific tariff. Qual Life Res. Jan 2019;28(1):163-176. doi:10.1007/s11136-018-2032-z PubMed
49.Rowen D, Mulhern B, Stevens K, Vermaire JH. Estimating a Dutch Value Set for the Pediatric Preference-Based CHU9D Using a Discrete Choice Experiment with Duration. Value Health. Oct 2018;21(10):1234-1242. doi:10.1016/j.jval.2018.03.016 PubMed
50.Feeny D, Furlong W, Torrance GW, et al. Multiattribute and single-attribute utility functions for the health utilities index mark 3 system. Med Care. Feb 2002;40(2):113-28. doi:10.1097/00005650-200202000-00006 PubMed
51.Noto S, Uemura T. Japanese health utilities index mark 3 (HUI3): measurement properties in a community sample. J Patient Rep Outcomes. Jan 29 2020;4(1):9. doi:10.1186/s41687-020-0175-5 PubMed
52.Le GC, Buron C, Costet N, Rosman S, Slama PR. Development of a preference-weighted health status classification system in France: the Health Utilities Index 3. Health Care Manag Sci. Feb 2002;5(1):41-51. doi:10.1023/a:1013201102918 PubMed
53.Torrance GW, Feeny DH, Furlong WJ, Barr RD, Zhang Y, Wang Q. Multiattribute utility function for a comprehensive health status classification system. Health Utilities Index Mark 2. Med Care. Jul 1996;34(7):702-22. doi:10.1097/00005650-199607000-00004 PubMed
54.McCabe C, Stevens K, Roberts J, Brazier J. Health state values for the HUI 2 descriptive system: results from a UK survey. Health Econ. Mar 2005;14(3):231-44. doi:10.1002/hec.925 PubMed
55.Seiber WJ, Groessl EJ, David KM, Ganiats TG, Kaplan RM. Quality of well being self-administered (QWB-SA) scale. San Diego: Health Services Research Center, University of California; 2008.
56.Retzler J, Grand TS, Domdey A, Smith A, Romano Rodriguez M. Utility elicitation in adults and children for allergic rhinoconjunctivitis and associated health states. Qual Life Res. Sep 2018;27(9):2383-2391. doi:10.1007/s11136-018-1910-8 PubMed
57.Mott DJ, Shah KK, Ramos-Goñi JM, Devlin NJ, Rivero-Arias O. Valuing EQ-5D-Y-3L Health States Using a Discrete Choice Experiment: Do Adult and Adolescent Preferences Differ? Med Decis Making. Jul 2021;41(5):584-596. doi:10.1177/0272989x21999607 PubMed
58.Prevolnik Rupel V, Ramos-Goñi JM, Ogorevc M, Kreimeier S, Ludwig K, Greiner W. Comparison of Adult and Adolescent Preferences Toward EQ-5D-Y-3L Health States. Value Health. Sep 2021;24(9):1350-1359. doi:10.1016/j.jval.2021.03.019 PubMed
59.Dalziel K, Catchpool M, García-Lorenzo B, Gorostiza I, Norman R, Rivero-Arias O. Feasibility, Validity and Differences in Adolescent and Adult EQ-5D-Y Health State Valuation in Australia and Spain: An Application of Best-Worst Scaling. Pharmacoeconomics. May 2020;38(5):499-513. doi:10.1007/s40273-020-00884-9 PubMed
60.Eisenberg D, Freed GL, Davis MM, Singer D, Prosser LA. Valuing health at different ages: evidence from a nationally representative survey in the US. Appl Health Econ Health Policy. May 1 2011;9(3):149-56. doi:10.2165/11587340-000000000-00000 PubMed
61.Prosser LA, Payne K, Rusinak D, Shi P, Uyeki T, Messonnier M. Valuing health across the lifespan: health state preferences for seasonal influenza illnesses in patients of different ages. Value Health. Jan 2011;14(1):135-43. doi:10.1016/j.jval.2010.10.026 PubMed
62.Reckers-Droog V, Karimi M, Lipman S, Verstraete J. Why Do Adults Value EQ-5D-Y-3L Health States Differently for Themselves Than for Children and Adolescents: A Think-Aloud Study. Value Health. Jul 2022;25(7):1174-1184. doi:10.1016/j.jval.2021.12.014 PubMed
63.Kind P, Klose K, Gusi N, Olivares PR, Greiner W. Can adult weights be used to value child health states? Testing the influence of perspective in valuing EQ-5D-Y. Qual Life Res. Oct 2015;24(10):2519-39. doi:10.1007/s11136-015-0971-1 PubMed
64.Ladapo JA, Neumann PJ, Keren R, Prosser LA. Valuing children's health: a comparison of cost-utility analyses for adult and paediatric health interventions in the US. Pharmacoeconomics. 2007;25(10):817-28. doi:10.2165/00019053-200725100-00002 PubMed
65.Wu Y, Al-Janabi H, Mallett A, et al. Parental health spillover effects of paediatric rare genetic conditions. Qual Life Res. Sep 2020;29(9):2445-2454. doi:10.1007/s11136-020-02497-3 PubMed
66.Brown CC, Tilford JM, Payakachat N, et al. Measuring Health Spillover Effects in Caregivers of Children with Autism Spectrum Disorder: A Comparison of the EQ-5D-3L and SF-6D. Pharmacoeconomics. Apr 2019;37(4):609-620. doi:10.1007/s40273-019-00789-2 PubMed
67.Simon NJ, Richardson J, Ahmad A, et al. Health utilities and parental quality of life effects for three rare conditions tested in newborns. J Patient Rep Outcomes. Jan 22 2019;3(1):4. doi:10.1186/s41687-019-0093-6 PubMed
68.Prosser LA, Lamarand K, Gebremariam A, Wittenberg E. Measuring family HRQoL spillover effects using direct health utility assessment. Med Decis Making. Jan 2015;35(1):81-93. doi:10.1177/0272989x14541328 PubMed
69.Al-Janabi H, Van Exel J, Brouwer W, et al. Measuring Health Spillovers for Economic Evaluation: A Case Study in Meningitis. Health Econ. Dec 2016;25(12):1529-1544. doi:10.1002/hec.3259 PubMed
70.Tubeuf S, Saloniki EC, Cottrell D. Parental Health Spillover in Cost-Effectiveness Analysis: Evidence from Self-Harming Adolescents in England. Pharmacoeconomics. Apr 2019;37(4):513-530. doi:10.1007/s40273-018-0722-6 PubMed
71.NICE health technology evaluations: the manual (National Institute for Health and Care Excellence) (2022).
72.Choices in Methods for Economic Evaluation (HAS) (2020).
73.Mpundu-Kaambwa C, Bulamu N, Lines L, et al. A Systematic Review of International Guidance for Self-Report and Proxy Completion of Child-Specific Utility Instruments. Value Health. Oct 2022;25(10):1791-1804. doi:10.1016/j.jval.2022.04.1723 PubMed
74.Pharmaceutical Benefits Advisory Committee. Guidelines for preparing submissions to the Pharmaceutical Benefits Advisory Committee (Version 5.0). September 2016.
75.Cleemput I, Neyt M, Van De Sande S, Thiry N. Belgian guidelines for economic evaluations and budget impact analyses: second edition. Health Technology Assessment (HTA). 2012. KCE Reports. 183C.
76.Matza LS, Patrick DL, Riley AW, et al. Pediatric patient-reported outcome instruments for research to support medical product labeling: report of the ISPOR PRO good research practices for the assessment of children and adolescents task force. Value Health. Jun 2013;16(4):461-79. doi:10.1016/j.jval.2013.04.004 PubMed
77.World Health Organization Guidelines. World Health Organization. https://www.who.int/publications/who-guidelines. Accessed March 22, 2024.
78.Health USDo, Human Services FDACfDE, Research, et al. Guidance for industry: patient-reported outcome measures: use in medical product development to support labeling claims: draft guidance. Health Qual Life Outcomes. Oct 11 2006;4:79. doi:10.1186/1477-7525-4-79 PubMed
79.Eiser C, Morse R. Can parents rate their child's health-related quality of life? Results of a systematic review. Qual Life Res. 2001;10(4):347-57. doi:10.1023/a:1012253723272 PubMed
80.Ungar WJ. Challenges in health state valuation in paediatric economic evaluation: are QALYs contraindicated? Pharmacoeconomics. Aug 2011;29(8):641-52. doi:10.2165/11591570-000000000-00000 PubMed
81.Ramos-Goñi JM, Oppe M, Stolk E, et al. International Valuation Protocol for the EQ-5D-Y-3L. Pharmacoeconomics. Jul 2020;38(7):653-663. doi:10.1007/s40273-020-00909-3 PubMed
82.Xie F, Xie S, Pullenayegum E, Ohinmaa A. Understanding Canadian stakeholders' views on measuring and valuing health for children and adolescents: a qualitative study. Qual Life Res. Mar 5 2024;doi:10.1007/s11136-024-03618-y PubMed
83.Devlin N, Pan T, Kreimeier S, et al. Valuing EQ-5D-Y: the current state of play. Health Qual Life Outcomes. Jul 6 2022;20(1):105. doi:10.1186/s12955-022-01998-8 PubMed
84.Prosser LA, Hammitt JK, Keren R. Measuring health preferences for use in cost-utility and cost-benefit analyses of interventions in children: theoretical and methodological considerations. Pharmacoeconomics. 2007;25(9):713-26. doi:10.2165/00019053-200725090-00001 PubMed
85.Devlin N, Roudijk B, Viney R, Stolk E. EQ-5D-Y-3L Value Sets, Valuation Methods and Conceptual Questions. Pharmacoeconomics. Dec 2022;40(Suppl 2):123-127. doi:10.1007/s40273-022-01226-7 PubMed
86.Kreimeier S, Oppe M, Ramos-Goñi JM, et al. Valuation of EuroQol Five-Dimensional Questionnaire, Youth Version (EQ-5D-Y) and EuroQol Five-Dimensional Questionnaire, Three-Level Version (EQ-5D-3L) Health States: The Impact of Wording and Perspective. Value Health. Nov 2018;21(11):1291-1298. doi:10.1016/j.jval.2018.05.002 PubMed
87.Nazari JL, Pickard AS, Gu NY. Findings from a Roundtable Discussion with US Stakeholders on Valuation of the EQ-5D-Y-3L. Pharmacoeconomics. Dec 2022;40(Suppl 2):139-146. doi:10.1007/s40273-022-01222-x PubMed
88.Rowen D, Mukuria C, Powell PA, Wailoo A. Exploring the Issues of Valuing Child and Adolescent Health States Using a Mixed Sample of Adolescents and Adults. Pharmacoeconomics. May 2022;40(5):479-488. doi:10.1007/s40273-022-01133-x PubMed
89.Lavelle TA, D'Cruz BN, Mohit B, et al. Family Spillover Effects in Pediatric Cost-Utility Analyses. Appl Health Econ Health Policy. Apr 2019;17(2):163-174. doi:10.1007/s40258-018-0436-0 PubMed
90.Al-Janabi H, van Exel J, Brouwer W, Coast J. A Framework for Including Family Health Spillovers in Economic Evaluation. Med Decis Making. Feb 2016;36(2):176-86. doi:10.1177/0272989X15605094 PubMed
Appendix 1: Summary of Search Strategy for Review 1
Note this appendix has not been copy-edited.
Table 9: Search Strategy for Review 1
Step number | Query | Number of records identified |
|---|---|---|
1 | (utilit*[Title/Abstract] OR preference*[Title/Abstract]) AND (health[Title/Abstract] OR quality of life[Title/Abstract] OR QoL[Title/Abstract] OR QL[Title/Abstract] OR measur*[Title/Abstract] OR instrument*[Title/Abstract] OR estimat*[Title/Abstract] OR elicit*[Title/Abstract] OR valu*[Title/Abstract] OR score*[Title/Abstract] OR index[Title/Abstract] OR weight*[Title/Abstract] OR scale*[Title/Abstract] OR questionnaire*[Title/Abstract]) | 235,399 |
2 | adolescent*[Title/Abstract] OR child*[Title/Abstract] OR kid*[Title/Abstract] OR teenager*[Title/Abstract] OR pediatric*[Title/Abstract] OR pediatric*[Title/Abstract] OR youth[Title/Abstract] OR youngster*[Title/Abstract] OR infant*[Title/Abstract] OR newborn[Title/Abstract] OR neonat*[Title/Abstract] OR schoolchild*[Title/Abstract] or preschool*[Title/Abstract] or pre-school*[Title/Abstract] OR self-assess*[Title/Abstract] OR self-report*[Title/Abstract] OR self-complet*[Title/Abstract] OR proxy[Title/Abstract] OR proxies[Title/Abstract] OR parent*[Title/Abstract] OR physician*[Title/Abstract] OR nurse*[Title/Abstract] OR teacher*[Title/Abstract] OR caregiver*[Title/Abstract] | 3,679,725 |
3 | 1 AND 2 | 50,242 |
4 | Limit 3 to 2012-current | 33,069 |
5 | Limit 3 to 2020-10-01 to 2022-12-06 | 9,897 |
6 | “adolescent health utility measure*”[Title] OR ahum [Title] OR “a-hum”[Title] OR “adolescent hum”[Title] | 1 |
7 | “assessment of quality of life 6-dimension*”[Title] OR “assessment of quality of life 6dimension*”[Title] OR “assessment of quality of life 6-d”[Title] OR “assessment of quality of life 6d”[Title] OR “assessment of qol 6-dimension”[Title] OR “assessment of qol 6dimension”[Title] OR “assessment of qol 6-d”[Title] OR “assessment of qol 6d”[Title] OR aqol-6d[Title] OR aqol6d[Title] | 5 |
8 | “child health utility 9d”[Title] OR “child health utility 9-d”[Title] OR chu9d[Title] OR chu-9d[Title] OR “child health utility 9-dimension*”[Title] OR “child health utility 9dimension*”[Title] | 38 |
9 | eq-5d-y*[Title] OR eq-5dy*[Title] OR eq-5d-5l-y[Title] OR eq-5d5ly[Title] OR “european quality of life 5d youth”[Title] OR “european quality of life 5-d youth”[Title] OR “european quality of life 5 dimension* youth”[Title] OR “euroqol 5dy”[Title] OR “euroqol 5d-y”[Title] OR “euroqol 5 dimension* youth*”[Title] OR “euroqol 5d youth*”[Title] OR “euroqol 5-d youth”[Title] | 84 |
10 | “health utilities index”[Title] OR “hui mark 2”[Title] OR hui2[Title] OR hui-2[Title] OR huiii[Title] OR hui-ii[Title] OR “hui mark 3”[Title] OR hui3[Title] OR hui-3[Title] OR huiiii[Title] OR hui-iii[Title] | 145 |
11 | “quality of wellbeing”[Title] OR “quality of well-being”[Title] OR qwb[Title] | 59 |
12 | 16-dimension*[Title] OR 16dimension*[Title] OR 16-days[Title] OR 16d[Title] | 45 |
13 | 17-dimension*[Title] OR 17dimension*[Title] OR17-days[Title] OR 17d[Title] | 270 |
14 | ch-6d[Title] OR ch6d[Title] OR “ch 6dimension*”[Title] OR “ch 6 dimension*”[Title] OR “child health 6d*”[Title] OR “child health 6-d*”[Title] OR “child health-6 d*”[Title] | 1 |
15 | “health status classification system pre-school”[Title] OR “health status pre-school “[Title] OR hscs-ps[Title] OR hscsps[Title] | 1 |
16 | iqi[Title] OR “infant health related quality of life instrument*”[Title] OR “infant quality of life instrument”[Title] OR “infant qol instrument”[Title] OR “infant hrqol instrument*”[Title] OR “infant hr-qol instrument”[Title] | 18 |
17 | tandi[Title] OR “toddler and infant health related quality of life”[Title] OR “toddler and infant hrqol”[Title] OR “toddler and infant hr-qol”[Title] OR “toddler and infant quality of life”[Title] OR “toddler and infant qol”[Title] | 2 |
18 | “health utilit* preschool”[Title] OR hups[Title] OR “health utilit* pre-school”[Title] | 6 |
19 | OR (6 to 18) | 665 |
20 | 5 OR 19 | 10,531 |
Note: The search was performed in PubMed (October 1, 2020, to December 6, 2022).
Appendix 2: Summary of Search Strategy for Review 2
Note this appendix has not been copy-edited.
Table 10: Search Strategy for Review 2
Step number | Query | Number of records identified |
|---|---|---|
1 | adolescent*[Title/Abstract] OR child*[Title/Abstract] OR kid*[Title/Abstract] OR teenager*[Title/Abstract] OR pediatric*[Title/Abstract] OR pediatric*[Title/Abstract] OR youth[Title/Abstract] OR youngster*[Title/Abstract] OR infant*[Title/Abstract] OR newborn[Title/Abstract] OR neonat*[Title/Abstract] OR schoolchild*[Title/Abstract] or preschool*[Title/Abstract] or pre-school*[Title/Abstract] | 2,579,550 |
2 | adult*[Title/Abstract] | 1,509,364 |
3 | utilit*[Title/Abstract] OR preference*[Title/Abstract] | 438,751 |
4 | health[Title/Abstract] OR quality of life[Title/Abstract] OR QoL[Title/Abstract] OR QL[Title/Abstract] OR measur*[Title/Abstract] OR instrument*[Title/Abstract] OR elicit*[Title/Abstract] OR valu*[Title/Abstract] OR index[Title/Abstract] OR weight*[Title/Abstract] OR scale*[Title/Abstract] OR questionnaire*[Title/Abstract]) OR quality-adjusted life-year*[Title/Abstract] OR QALY*[Title/Abstract] | 9,921,190 |
5 | 3 AND 4 | 222,882 |
6 | 1 AND 2 AND 5 | 5,117 |
7 | cost-effective*[Title/Abstract] OR CEA*[Title/Abstract] OR cost-utilit*[Title/Abstract] OR CUA*[Title/Abstract] OR economic evaluation*[Title/Abstract] OR pharmacoecnomic*[Title/Abstract] | 203,519 |
8 | model*[Title/Abstract] | 3,621,934 |
9 | 7 AND 8 | 44,679 |
10 | 1 AND 9 | 4,351 |
11 | Age transit*[Title/Abstract] | 84 |
12 | 7 AND 11 | 4 |
13 | 8 AND 11 | 20 |
14 | 6 OR 10 OR 12 OR 13 | 9,356 |
Note: The search was performed in PubMed (inception to January 21, 2023).
Appendix 3: Summary of Search for Review 3
Note this appendix has not been copy-edited.
Table 11: Search Strategy for Review 3
Step number | Query | Number of records identified |
|---|---|---|
1 | adolescent*[Title/Abstract] OR child*[Title/Abstract] OR kid*[Title/Abstract] OR teenager*[Title/Abstract] OR pediatric*[Title/Abstract] OR pediatric*[Title/Abstract] OR youth[Title/Abstract] OR youngster*[Title/Abstract] OR infant*[Title/Abstract] OR newborn[Title/Abstract] OR neonat*[Title/Abstract] OR schoolchild*[Title/Abstract] or preschool*[Title/Abstract] or pre-school*[Title/Abstract] | 2,579,550 |
2 | spillover*[Title/Abstract] OR spill over*[Title/Abstract] | 7,985 |
3 | (carer*[Title/Abstract] OR caring[Title/Abstract] OR caregiv*[Title/Abstract] OR family[Title/Abstract] OR partner*[Title/Abstract] OR husband[Title/Abstract] OR wife[Title/Abstract] OR spous*[Title/Abstract] OR parent*[Title/Abstract] OR mother*[Title/Abstract] OR maternal[Title/Abstract] OR father*[Title/Abstract] OR paternal[Title/Abstract] OR sibling*[Title/Abstract] OR brother*[Title/Abstract] OR sister*[Title/Abstract] OR grandparent*[Title/Abstract] OR grandmother*[Title/Abstract] OR grandfather*[Title/Abstract] OR close person*[Title/Abstract] OR next of kin[Title/Abstract] | 2,083,410 |
4 | 2 AND 3 | 911 |
5 | 1 AND 4 | 379 |
Note: The search was performed in PubMed (inception to January 21, 2023).
Appendix 4: Websites for Generic Preference-Based Instruments for Children
Note this appendix has not been copy-edited.
Table 12: Websites for Generic Preference-Based Instruments for Children
Instrument | Website |
|---|---|
HuPS21 | Not available |
Not available | |
EQ-5D-Y-5L23 | |
IQI18 | Not available |
CH-6D27 | Not available |
AHUM30 | Not available |
EQ-5D-Y-3L22 | |
AQoL-6D Adolescent16 | |
CHU-9D24 | |
HSCS-PS20 | Not available |
HUI326 | |
17D28 | |
16D29 | |
HUI225 | |
QWB31 |
16D = 16-Dimensional Measure of Health-Related Quality of Life; 17D = 17-Dimensional Measure of Health-Related Quality of Life; AHUM = Adolescent Health Utility Measure; AQoL-6D = Assessment of Quality of Life – 6-Dimension; CH-6D = Child Health – 6 Dimension; CHU-9D = Child Health Utility – 9 Dimension; EQ-5D-Y-3L = EQ-5D Youth Version – 3 Level; EQ-5D-Y-5L = EQ-5D Youth Version – 5 Level; HSCS-PS = Pre-School Health Status Classification System; HUI2 = Health Utility Index Mark 2; HUI3 = Health Utility Index Mark 3; HuPS = Health Utilities Preschool; IQI = Infant Health-Related Quality of Life Instrument; QWB = Quality of Well-Being Scale; TANDI = Toddler and Infant Health-Related Quality of Life Instrument.
Appendix 5: Grey Literature Sources
Note this appendix has not been copy-edited.
Table 13: Grey Literature Sources
Group | Country |
|---|---|
Health technology assessment agencies | |
CADTH | Canada |
INESSS | Canada |
NICE | UK |
HAS | France |
Belgian Federal Health Care Knowledge Centre | Belgium |
Zorginstituut Nederland | Netherlands |
SMC | UK |
PBAC | Australia |
IQWiG | Germany |
TLV | Sweden |
Other organizations | |
ISPOR | International |
WHO | International |
FDA | US |
HAS = Haute Autorité de santé; INESSS = Institut national d'excellence en santé et en services sociaux; IQWiG = Institut für Qualität und Wirtschaftlichkeit im Gesundheitswesen; ISPOR = International Society for Pharmacoeconomics and Outcomes Research; NICE = National Institute for Health and Care Excellence; PBAC = Pharmaceutical Benefits Advisory Committee; SMC = Scottish Medicines Consortium; TLV = Dental and Pharmaceutical Benefits Agency.
ISSN: 2563-6596
Disclaimer: The information in this document is intended to help Canadian health care decision-makers, health care professionals, health systems leaders, and policy-makers make well-informed decisions and thereby improve the quality of health care services. While patients and others may access this document, the document is made available for informational purposes only and no representations or warranties are made with respect to its fitness for any particular purpose. The information in this document should not be used as a substitute for professional medical advice or as a substitute for the application of clinical judgment in respect of the care of a particular patient or other professional judgment in any decision-making process. The Canadian Agency for Drugs and Technologies in Health (CADTH) does not endorse any information, drugs, therapies, treatments, products, processes, or services.
While care has been taken to ensure that the information prepared by CADTH in this document is accurate, complete, and up-to-date as at the applicable date the material was first published by CADTH, CADTH does not make any guarantees to that effect. CADTH does not guarantee and is not responsible for the quality, currency, propriety, accuracy, or reasonableness of any statements, information, or conclusions contained in any third-party materials used in preparing this document. The views and opinions of third parties published in this document do not necessarily state or reflect those of CADTH.
CADTH is not responsible for any errors, omissions, injury, loss, or damage arising from or relating to the use (or misuse) of any information, statements, or conclusions contained in or implied by the contents of this document or any of the source materials.
This document may contain links to third-party websites. CADTH does not have control over the content of such sites. Use of third-party sites is governed by the third-party website owners’ own terms and conditions set out for such sites. CADTH does not make any guarantee with respect to any information contained on such third-party sites and CADTH is not responsible for any injury, loss, or damage suffered as a result of using such third-party sites. CADTH has no responsibility for the collection, use, and disclosure of personal information by third-party sites.
Subject to the aforementioned limitations, the views expressed herein are those of CADTH and do not necessarily represent the views of Canada’s federal, provincial, or territorial governments or any third-party supplier of information.
This document is prepared and intended for use in the context of the Canadian health care system. The use of this document outside of Canada is done so at the user’s own risk.
This disclaimer and any questions or matters of any nature arising from or relating to the content or use (or misuse) of this document will be governed by and interpreted in accordance with the laws of the Province of Ontario and the laws of Canada applicable therein, and all proceedings shall be subject to the exclusive jurisdiction of the courts of the Province of Ontario, Canada.
The copyright and other intellectual property rights in this document are owned by CADTH and its licensors. These rights are protected by the Canadian Copyright Act and other national and international laws and agreements. Users are permitted to make copies of this document for noncommercial purposes only, provided it is not modified when reproduced and appropriate credit is given to CADTH and its licensors.
About CADTH: CADTH is an independent, not-for-profit organization responsible for providing Canada’s health care decision-makers with objective evidence to help make informed decisions about the optimal use of drugs, medical devices, diagnostics, and procedures in our health care system.
Funding: CADTH receives funding from Canada’s federal, provincial, and territorial governments, with the exception of Quebec.
Questions or requests for information about this report can be directed to Requests@ CADTH .ca