CADTH Health Technology Review
Formulary Management of Biologics in Plaque Psoriasis
Technology Review
Authors: Chris Vannabouathong, Peter Dyrda
Abbreviations
IL
interleukin
LoE
loss of exclusivity
NMA
network meta-analysis
NOC
Notice of Compliance
PASI
Psoriasis Area and Severity Index
pCPA
pan-Canadian Pharmaceutical Alliance
PLA
product listing agreement
PsO
plaque psoriasis
TNF
tumour necrosis factor
Key Messages
Unlike the new-generation biologics (interleukin [IL]-17 and IL-23 inhibitors), all old-generation biologics (anti–tumour necrosis factor [TNF] and anti–IL-12/23 biologics) for plaque psoriasis (PsO) have now lost their exclusivity status and most were launched prior to the pan-Canadian Pharmaceutical Alliance. In addition, biosimilar versions of the old-generation biologics have had limited uptake and delayed launches in Canada spanning multiple years, suggesting a significant opportunity cost paid for these drugs after loss of exclusivity.
Modern clinical evidence, which is more rigorous than the evidence supporting the old-generation drugs and includes head-to-head trials comparing IL-17 and IL-23 inhibitors with anti-TNF and anti–IL-12/23 biologics, have demonstrated greater efficacy with the new-generation biologics.
In Canada, despite access to newer and more efficacious treatments, physicians continue to prescribe old-generation drugs to patients newly initiating a biologic for PsO (25% of patients in 2020), and the new-generation biologics are also less costly on an average per patient basis at list price compared with the most utilized old-generation biologic (ustekinumab).
Public payers have spent $28 million (at list price) on biologics initiated for PsO beyond their loss of exclusivity from 2016 to 2020 ($600 million for biologics initiated for any indication), and that figure is likely much higher today. Notably, some IL-17 biologics will lose data protection within the next 2 years, which will further increase this opportunity cost.
It is prudent that decision-makers review the place in therapy of biologics for PsO. Based on the findings of this report, the policy recommendation is to assess the clinical and economic value of old-generation biologics in the context of current evidence standards in PsO. The promotion of the use of new-generation biologics should be considered by payers to support the appropriate use of biologics in PsO, which would improve patient outcomes with budget savings or neutrality (assuming no confidential pricing agreements with the old-generation biologics) versus the status quo.
Summary
Why Did We Study Biologics for Plaque Psoriasis?
Biologics, categorized as old-generation (anti–tumour necrosis factor [TNF] and anti–interleukin (IL)-12/23 biologics) and new-generation (IL-17 and IL-23 inhibitors), are often used to treat plaque psoriasis (PsO), a commonly treated condition with a rising prevalence in Canada.
PsO trials are now more rigorous compared with earlier evidence, using more stringent primary end points and more efficacious comparators in head-to-head trials; the old-generation biologics have not been held to this new standard.
All old-generation biologics are now beyond their loss of exclusivity (LoE), yet biosimilar versions have had limited uptake and their delayed launches in Canada have spanned multiple years, suggesting a significant opportunity cost paid for these drugs after LoE. Moreover, new-generation biologics were launched in the era of the pan-Canadian Pharmaceutical Alliance (pCPA), meaning they likely have confidential pricing agreements in place.
How Did We Study Biologics for PsO?
This report combined key insights from several related CADTH reports: an Environmental Scan of the status (e.g., regulatory, exclusivity) of biologics, critical appraisals of systematic reviews and network meta-analyses (NMAs), a drug utilization analysis, expenditures since LoE, and the cost impact of a proposed policy change.
What Did We Find?
Efficacy: NMAs have consistently demonstrated greater efficacy with the new-generation biologics relative to the old-generation biologics. Direct evidence informing these NMAs included head-to-head trials comparing anti–IL-17 and anti–IL-23 biologics to anti-TNF and anti–IL-12/23 drugs.
Modern trials have more stringent primary outcomes in terms of Psoriasis Area and Severity Index (PASI) response rates, using higher thresholds (PASI 90 or 100) relative to older trials (PASI 75). PASI 90 is also associated with improved patient quality of life compared to PASI 75 and has become the standard in measuring therapeutic efficacy in PsO.
Costs: New-generation biologics are less costly compared to the most utilized old-generation biologic (ustekinumab) on an average per patient basis at list price for patients with PsO newly initiating therapy. Assuming no pricing agreements are in place with the old-generation drugs, the new-generation biologics are also likely to be less costly from a net price perspective (after discounts) given their Letters of Intent with the pCPA.
Utilization: Despite access to newer and more efficacious treatment options, physicians continue to prescribe old-generation drugs to patients newly initiating a biologic for PsO (25% of patients in 2020).
Exclusivity: Although launched several years after their eligibility, biosimilars are now available for most old-generation biologics, except for ustekinumab and certolizumab pegol. Public payers have spent $28 million (at list price) on biologics initiated for PsO beyond their LoE from 2016 to 2020 ($600 million for biologics initiated for any indication), and that figure is likely much higher today. Notably, some IL-17 biologics will lose data protection within the next 2 years, which will further increase this opportunity cost.
Impact: If patients initiating a biologic for PsO were prescribed new-generation biologics instead of old-generation drugs, this would likely result in better patient outcomes and system savings or neutrality (assuming no pricing agreements with the old-generation drugs) versus the status quo.
What Does This Mean?
In light of these findings, if the old-generation biologics were launched in today’s market, it is likely that they would not be viewed favourably by payers; therefore, it is prudent that decision-makers review their place in therapy.
The policy recommendation is to assess the clinical and economic value of old-generation biologics in the context of current evidence standards in PsO. The promotion of new-generation biologics should be considered by payers to support the appropriate use of biologics in PsO.
Furthermore, with the delayed launch of biosimilars in Canada, there is even more reason to review biologics at or beyond exclusivity given their significant expenditures and impending LoE of the new-generation molecules.
Background
Plaque Psoriasis
PsO is a chronic, immune-mediated skin condition characterized by red, scaly, raised patches that frequently produce itching, pain, and lowered quality of life.1,2 PsO is a multisystemic disease that is associated with serious comorbidities.3 PsO is common in Canada; 2.5% of adults in Ontario are diagnosed with PsO. Estimates also show that its prevalence has been steadily increasing over the past decade due to a combination of an aging population, population growth, and increasing life expectancy.4 The economic burden of moderate to severe PsO in Canada has been estimated to be $1.7 billion (95% confidence interval, $0.8 billion to $2.6 billion) annually, with 43% of this cost attributed to productivity loss.5
Treatments
There are many treatment options for PsO, including topical medications, phototherapy, and systemic medications. Choice of treatment involves consideration of many patient-centric factors, including disease severity, presence of comorbidities, response to prior therapies, and patient treatment goals. Patients who are unresponsive to topical medications and phototherapy, or who cannot access phototherapy, are offered systemic therapies, including conventional immunosuppressives and biologics. Biologics include monoclonal antibodies and fusion proteins that are derived from living systems and are among the highest and fastest-growing drug expenditures for public drug plans.6 The first class of biologics approved for PsO were TNF-alpha inhibitors (i.e., adalimumab, etanercept, and infliximab) and an IL-12/23 inhibitor (i.e., ustekinumab).7 Several other biologics, known as “new-generation biologics,” have since been developed, and include anti–IL-17 drugs (e.g., secukinumab, ixekizumab, brodalumab, bimekizumab) and anti–IL-23 drugs (e.g., risankizumab, tildrakizumab, guselkumab).8 CADTH has previously reviewed and recommended the new-generation biologics secukinumab (2014),9 ixekizumab (2016),10 brodalumab (2018),11 guselkumab (2018),12 risankizumab (2019),13 tildrakizumab (2021),14 and bimekizumab (2022)15 for the treatment of moderate to severe PsO.
Old- and New-Generation Biologics
Biologics for PsO can be classified according to their Health Canada Notice of Compliance (NOC) and mechanism of action. The old-generation molecules, including anti-TNF and anti–IL-12/23 biologics, have a first NOC before 2010 and the new-generation drugs, including the IL-17 and IL-23 inhibitors, have a first NOC in 2015 or later.
Although their applicability to the Canadian context is uncertain, multiple health economic evaluations conducted in other countries have evaluated the cost-effectiveness of new-generation versus old-generation biologics.16 Studies conducted in Germany and Japan found that secukinumab was cost-effective relative to ustekinumab, adalimumab, infliximab, and etanercept.17-19 Another study conducted in Italy showed that both ixekizumab and secukinumab resulted in the lowest cost per PASI responder relative to adalimumab, etanercept, and ustekinumab.20 In addition, studies conducted in the US also determined that IL-17 biologics (i.e., brodalumab, ixekizumab, and secukinumab) were cost-effective strategies for patients with PsO.16,21-23
Loss of Exclusivity and Biosimilar Availability
Exclusivity status is a function of patent and data protection. In Canada, patent protection is a 20-year period offered to innovative drugs from the date of filing that can be applied in various manners (e.g., chemical, change in use).24 Data protection regulations in Canada are governed by the Food and Drug Regulations published in 2006.25,26 These regulations provide data protection for an 8-year term with a possibility of adding 6 more months for submissions that include pediatric studies. During this time, only the owner or generator of preclinical and clinical trial data can use these data to obtain marketing authorization for drugs, preventing a second-entry manufacturer from filing a submission for a copy of that innovative drug. Data protection begins from the time of issuance of a Health Canada NOC and when the drug is added to Health Canada’s Register of Innovative Drugs.25,26 Data protection for biologics is longer in the US than it is in Canada; in the US, it is 12 years from approval.27
Biosimilar competition has not reduced expenditures to the degree that policy-makers had hoped for;28 therefore, there may be a significant opportunity cost paid by society for originator biologics after LoE because the resources spent on these drugs could be reallocated to other health care priorities.29 Delays in biosimilar launches, which can span multiple years, are likely the result of, but not limited to, agreements between the originator and biosimilar manufacturers.30,31 In addition, because the US market presents the largest opportunity for biosimilar developers,32 global development timelines for biosimilars may be based around US exclusivity timelines, which could explain the delays that occur for biosimilar launches in Canada.
Canada is not the only market to experience delays in the marketing of biosimilars.33-35 Prior investigations have demonstrated the financial effect that biologics have had on health care systems. In an analysis of Australian Medicare expenditure data for biologics from 2015 to 2016, the authors estimated that AU$367 million would have been saved if biosimilars were available and listed, and the authors advocated for the reduction of monopoly protection length because this would save payers hundreds of millions of dollars per year.29 A study conducted in Slovakia found that €35 million to €50 million per year could have been saved if biosimilars with European Medicines Agency marketing authorization had been on the country’s reimbursement list at the time of the analysis in 2018.34 Dickson et al. performed an analysis on US Medicare spending and estimated the cost savings between 2015 and 2019 would have been US$1.6 billion if biologics and biosimilars were subjected to the same Medicare reimbursement framework as brand name and generic drugs.36 Finally, Lee et al. calculated the cost of the delayed entry of the adalimumab biosimilars in the US between 2016 and 2019 (the biosimilars could not be marketed due to patent dispute settlements) and found that US$2.2 billion would have been saved with timely biosimilar availability.33 These studies demonstrate the substantial costs associated with originator biologics and how policy decisions (e.g., biosimilar substitution) can save health care dollars that could instead be used to fund other drugs and improve patient access to treatment. As such, spending on old-generation biologics may hinder the reimbursement of new-generation biologics.
Policy Issue
The prevalence of PsO in Canada is increasing; therefore, the use of and spending on PsO biologics will also continue to rise. A patient’s access to biologics for the treatment of PsO is dependent on meeting drug plan eligibility and coverage criteria. In addition, before the pCPA, there was no formal process by which federal, provincial, and territorial drug plans could discuss harmonized coverage criteria when listing new drugs on public formularies. Because treatment paradigms change over time with the availability of new therapies and evidence, so can coverage criteria and policy decisions. New evidence has emerged related to the use of new- versus old-generation biologics in PsO demonstrating greater efficacy with the new-generation molecules; moreover, new-generation biologics were launched in the era of the pCPA, meaning these drugs are likely to have confidential pricing agreements with payers. Given the significant expenditures on biologics and changing dynamics regarding LoE and the entry of new-generation biologics in the market, there was a need to assess the place in therapy of biologics used to treat adults with moderate to severe PsO.
Formulary management strategies across drug plans can also facilitate national harmonization and can help ensure that all people in Canada have the same access to and can receive drugs for PsO, while also limiting the financial impact costly biologics have on health care spending and encouraging their appropriate use.
Purpose of This Report
This report sought to combine insights from several related CADTH reports to provide evidence for federal, provincial, and territorial payers to foster discussions on the reimbursement of biologics for PsO.
Methods
Research Questions
This report aimed to summarize insights for the following questions:
What are the regulatory, exclusivity, CADTH review, and reimbursement statuses of biologics indicated for PsO?
What is the clinical efficacy of new-generation biologics compared to old-generation biologics in patients with PsO?
What are the utilization patterns of old- versus new-generation biologics indicated for PsO?
What are the gross expenditures on old-generation originator biologics indicated for PsO since LoE?
What is the estimated 1-year cost impact to Canadian public drug plans of implementing a biologic tiering policy for PsO?
Report Selection
This report provides a summary of insights extracted from previously completed CADTH reports. These reports aimed to answer the research questions within 5 domains: an Environmental Scan of the regulatory, exclusivity, CADTH review, and reimbursement statuses; critical appraisals of systematic reviews and NMAs; a technology review to assess utilization and gross expenditures since originator LoE; and a cost analysis to estimate the 1-year impact of implementing a biologic tiering policy.
Within these domains, CADTH has previously published 3 reports (links to reports are in Table 1) and 1 report was completed as an internal CADTH report.
Table 1: Summary of CADTH Reports Referenced in This Report
Domain | Research question | CADTH report type | Year completed | Report title and link |
|---|---|---|---|---|
Regulatory, exclusivity, CADTH review, and reimbursement status | 1. What are the regulatory, exclusivity, CADTH review, and reimbursement statuses of biologics indicated for PsO? | Environmental Scan | 2021 | |
Critical appraisals of systematic reviews and network meta-analyses | 2. What is the clinical efficacy of new-generation biologics compared to old-generation biologics in patients with PsO? | Rapid Review: Summary and Critical Appraisal | 2021 | |
Utilization | 3. What are the utilization patterns of old- vs. new-generation biologics indicated for PsO? | Technology Review: Utilization Study | 2022 | Utilization of Old- Versus New-Generation Biologics for Public and Private Insurers in Canada38 |
Gross expenditures since LoE | 4. What are the gross expenditures on old-generation originator biologics indicated for PsO since LoE? | |||
Cost impact of a proposed policy change | 5. What is the estimated 1-year cost impact to Canadian public drug plans of implementing a biologic tiering policy for PsO? | Cost analysis | 2022 |
LoE = loss of exclusivity; PsO = plaque psoriasis.
Consultations
The findings from this report and individual reports were shared with members of the CADTH Pharmaceutical Advisory Committee Formulary Working Group for Health Technology Assessments (FWG-HTA), which includes representatives from federal, provincial, and territorial health ministries and related health organizations. The information related to the Environmental Scan,24 Rapid Review,37 and utilization analysis38 are up-to-date as of November 2021, September 2021, and June 2022, respectively.
Findings
Status of Biologics Indicated for PsO in Canada
At the time of the completion of the Environmental Scan (November 2021), Health Canada had approved 11 biologics for the treatment of moderate to severe PsO in adults.24 Five of these drugs are old-generation biologics (adalimumab, certolizumab pegol, etanercept, infliximab, and ustekinumab) and the remaining 6 drugs (brodalumab, guselkumab, ixekizumab, risankizumab, tildrakizumab, and secukinumab) are new-generation biologics. The CADTH Canadian Drug Expert Committee (CDEC) reviewed 3 of the old-generation biologics (adalimumab, certolizumab pegol, and ustekinumab) and all the new-generation biologics. All drugs that have been reviewed by CDEC received a similar recommendation, which was to list and reimburse the drug but with clinical criteria and conditions. Since the completion of the Environmental Scan, 1 other biologic — bimekizumab (an IL-17 inhibitor) — received Health Canada approval for PsO in February 2022. CDEC also recommended that bimekizumab be reimbursed with clinical criteria and conditions.15,39 Given its mechanism of action and NOC date, bimekizumab is considered a new-generation biologic.
All old-generation biologics have expired exclusivity status (defined here as expiry of data protection, expiry of patent protection, or regulatory approval of a biosimilar version); however, biosimilar versions of etanercept and adalimumab were launched several years after their eligibility (approximately 3 years for adalimumab and approximately 4 years for etanercept) and 2 other old-generation molecules (i.e., ustekinumab and certolizumab pegol) do not currently have a biosimilar on the Canadian market. All new-generation biologics currently have active exclusivity status.
Most of the old-generation biologics, except certolizumab pegol, predated the pCPA, whereas all new-generation biologics included in the Environmental Scan have undergone pCPA negotiations (bimekizumab was under consideration for negotiation as of August 24, 2022), implying disparate product listing agreements (PLAs) across public drug plans for the old-generation biologics. At the time of the Environmental Scan, certolizumab pegol, guselkumab, and tildrakizumab were the only biologics that were not listed on any public formularies; however, tildrakizumab had yet to begin pCPA negotiations at that time. Since the completion of the Environmental Scan, the pCPA negotiation for tildrakizumab concluded with a letter of intent in December 2021. Across public drug plans, the listing status of biologics fell under a restricted benefit (Appendix 2), but differed in terms of active (e.g., review through special authorization forms) versus passive (e.g., Limited Use codes in Ontario). In addition, 3 public drug plans (Alberta, Correctional Services of Canada, and Manitoba) currently employ a 2-tiered formulary, which requires a trial of a new-generation biologic or biosimilar before access to an old-generation originator biologic.
Clinical Efficacy of Old- Versus New-Generation Biologics for PsO
Eight systematic reviews with NMAs, with an extensive overlap of primary trials, were identified that compared new- and old-generation biologics in patients with moderate to severe PsO.37 All NMAs demonstrated greater efficacy with the new-generation biologics brodalumab, ixekizumab, risankizumab, and secukinumab compared to the old-generation biologics adalimumab, etanercept, and ustekinumab in terms of 90% or 100% skin clearance on the PASI (Appendix 3). Additionally, the risk of side effects was similar between these therapies.
Direct evidence informing these NMAs included head-to-head trials comparing anti–IL-17 and anti–IL-23 biologics versus etanercept, adalimumab, and ustekinumab. In addition, there has been a trend toward more stringent primary outcomes in PsO trials over time in terms of PASI response rates, with more modern trials using higher thresholds (i.e., PASI 90 or 100) relative to older trials that used PASI 75. PASI 90 is also associated with improved patient quality of life compared to PASI 75 and has become the standard in measuring therapeutic efficacy in PsO.40,41
Utilization Patterns of Old- Versus New-Generation Biologics for PsO
Despite broad access to biologics, 25% of patients with PsO who initiated biologic therapy in 2020 were prescribed an old-generation biologic across all public drug plans (Figure 1).38 The most frequently prescribed old-generation biologic was ustekinumab (9.6% market share), which was also associated with the highest cost of utilization per claimant (based on list prices) across all biologics at $16,047 per year (Figure 2). Originators secukinumab ($15,229) and etanercept ($14,862) had the second and third highest cost per claimant, respectively.38 In addition, jurisdictions with a biologic tiering policy (i.e., Alberta and Manitoba) exhibited the highest number of prescriptions of new-generation biologics in 2020; these drugs had a 100% and 90.7% market share in Manitoba and Alberta, respectively (Figure 1).
Figure 1: Market Share of Old- Versus New-Generation Biologics Among New Claimants With PsO Across Public Drug Plans in Canada by Jurisdiction (2018 to 2020)
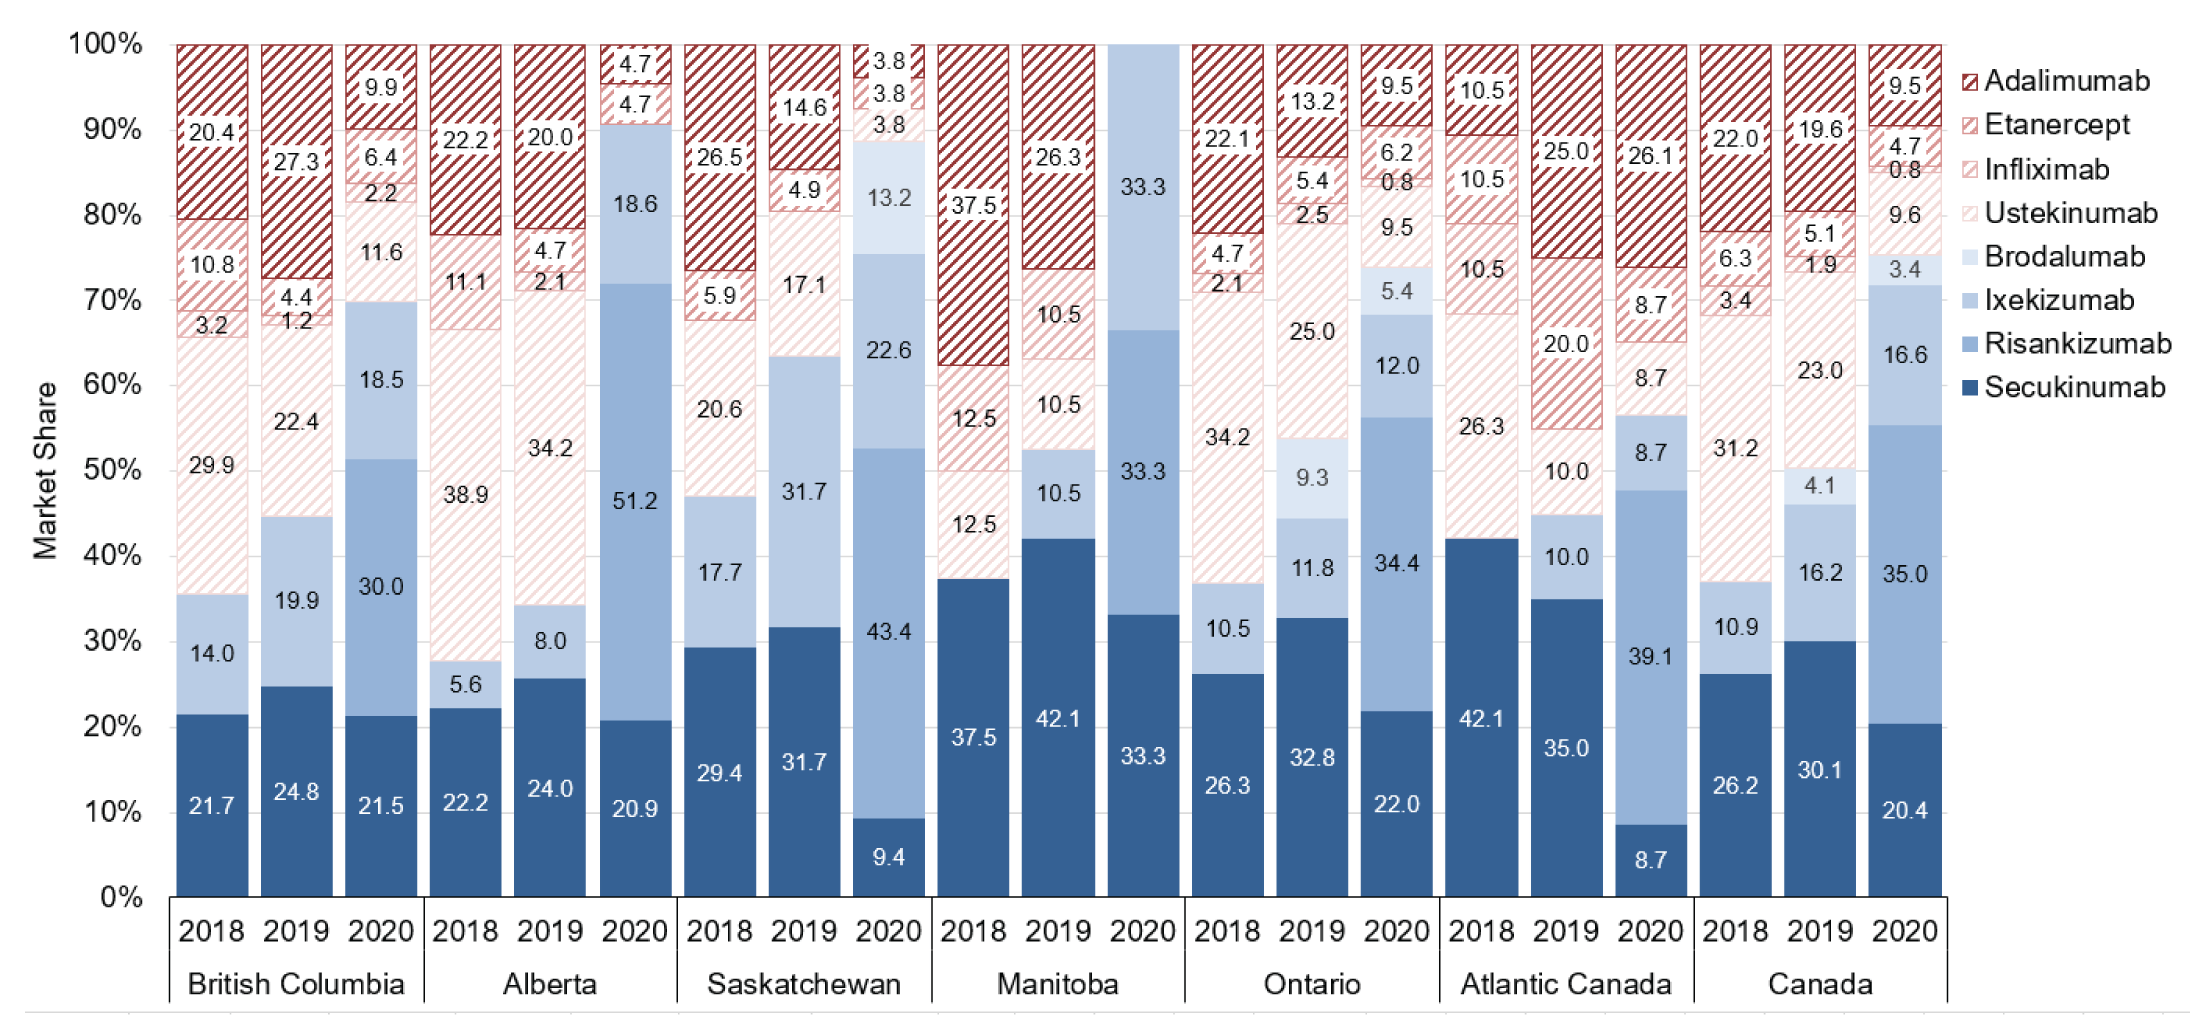
PsO = plaque psoriasis.
Note: Solid blue bars = new-generation biologics; red striped bars = old-generation biologics.
Expenditures on Old-Generation Originator Biologics Indicated for PsO Since LoE
For old-generation originator biologics indicated for PsO that lost exclusivity between 2016 and 2020, it is estimated that Canadian public drug plans spent more than $3 billion on all claims ($600 million among those who newly initiated treatment) for these drugs across all indications (Figure 3).38 Originator infliximab had the greatest share of this spending (40.4%), followed by adalimumab (30.6%), etanercept (18.1%), ustekinumab (8.4%), and certolizumab pegol (2.5%).
For patients with PsO, public drug plan expenditures on old-generation originator biologics since LoE between 2016 and 2020 was estimated to be $124 million nationally (ranging from $74 million to $516 million across sensitivity analyses) among all biologic drug claimants (i.e., new biologic starts and existing biologic users) and $28 million nationally (ranging from $18 million to $116 million across sensitivity analyses) among new biologic starts only. The old-generation biologic with the greatest share of this spending was ustekinumab (49.0% among all biologic drug claimants and 71.4% among new biologic starts).
Figure 2: National Average Annual Cost of Utilization Per Claimant for PsO Biologics Among New Claimants With PsO Across Public Drug Plans in Canada (2020)
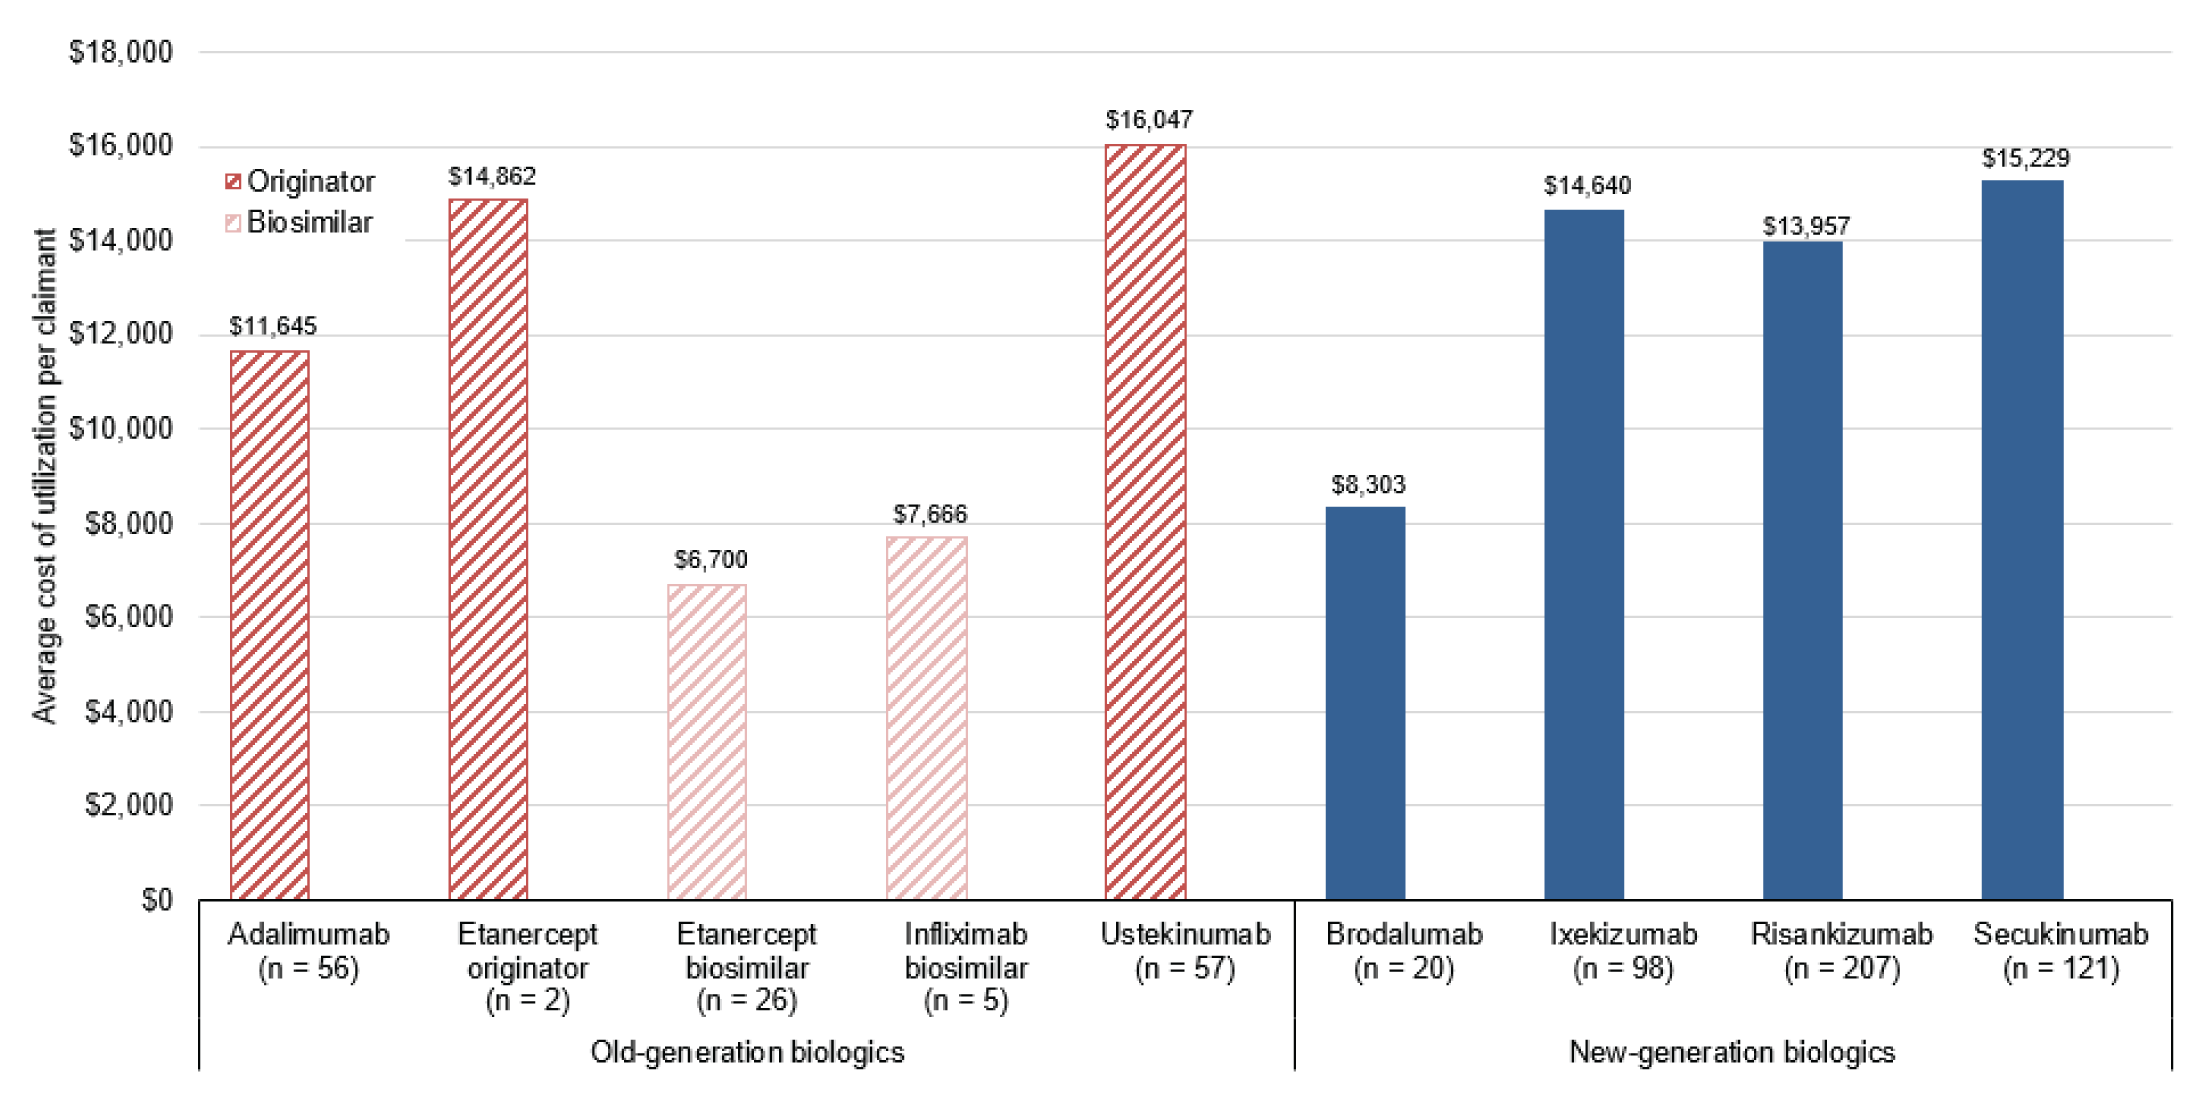
PsO = plaque psoriasis.
Notes: Solid blue bars = new-generation biologics; red striped bars = old-generation biologics.
Costs do not reflect product listing agreements between drug plans and manufacturers. There were no claims for the infliximab originator among new claimants with PsO in 2020.
Figure 3: Cumulative Public Drug Plan Expenditures on All Claims for Old-Generation Originator Biologics Indicated for PsO Since Loss of Exclusivity (2016 to 2020)
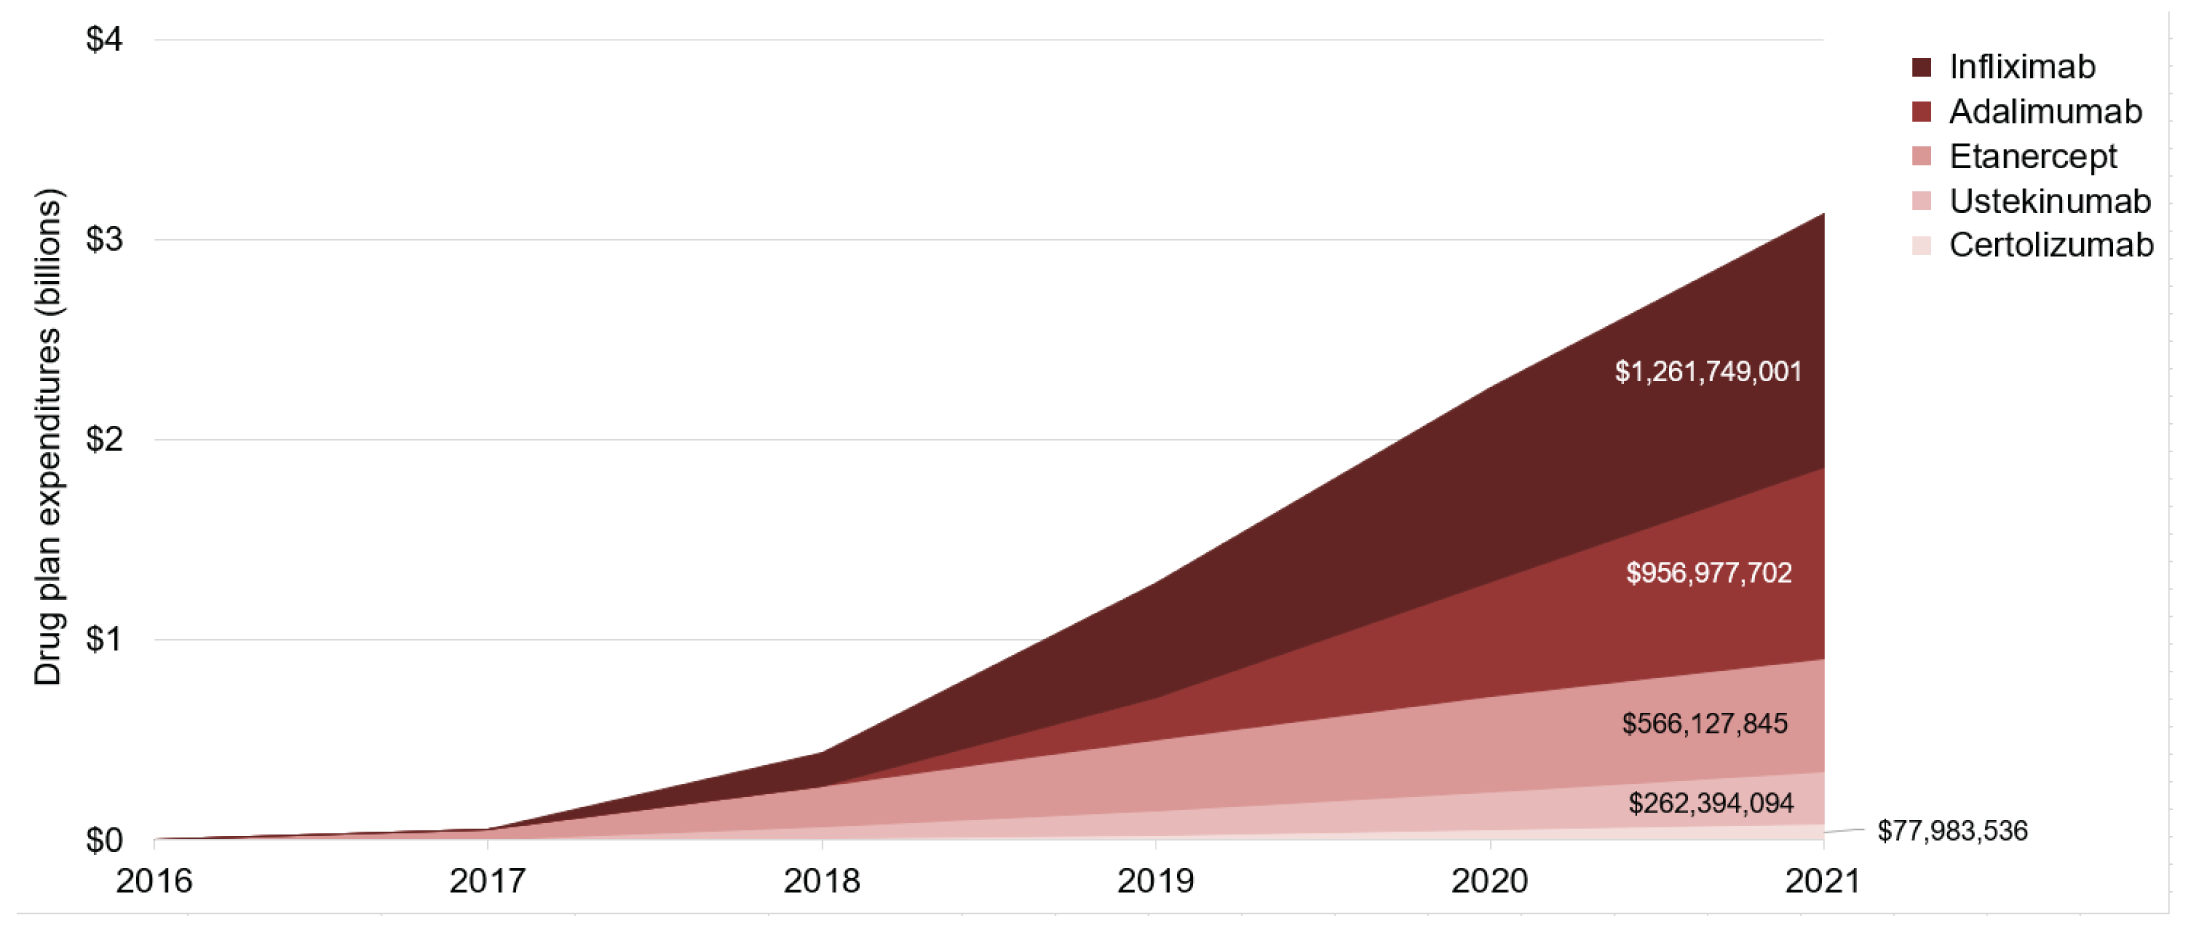
PsO = plaque psoriasis.
Note: For each molecule, expenditures accumulated in the year when exclusivity was lost. Costs do not reflect PLAs between drug plans and manufacturers.
Estimated Cost Impact of Implementing a Biologic Tiering Policy for PsO in Canada
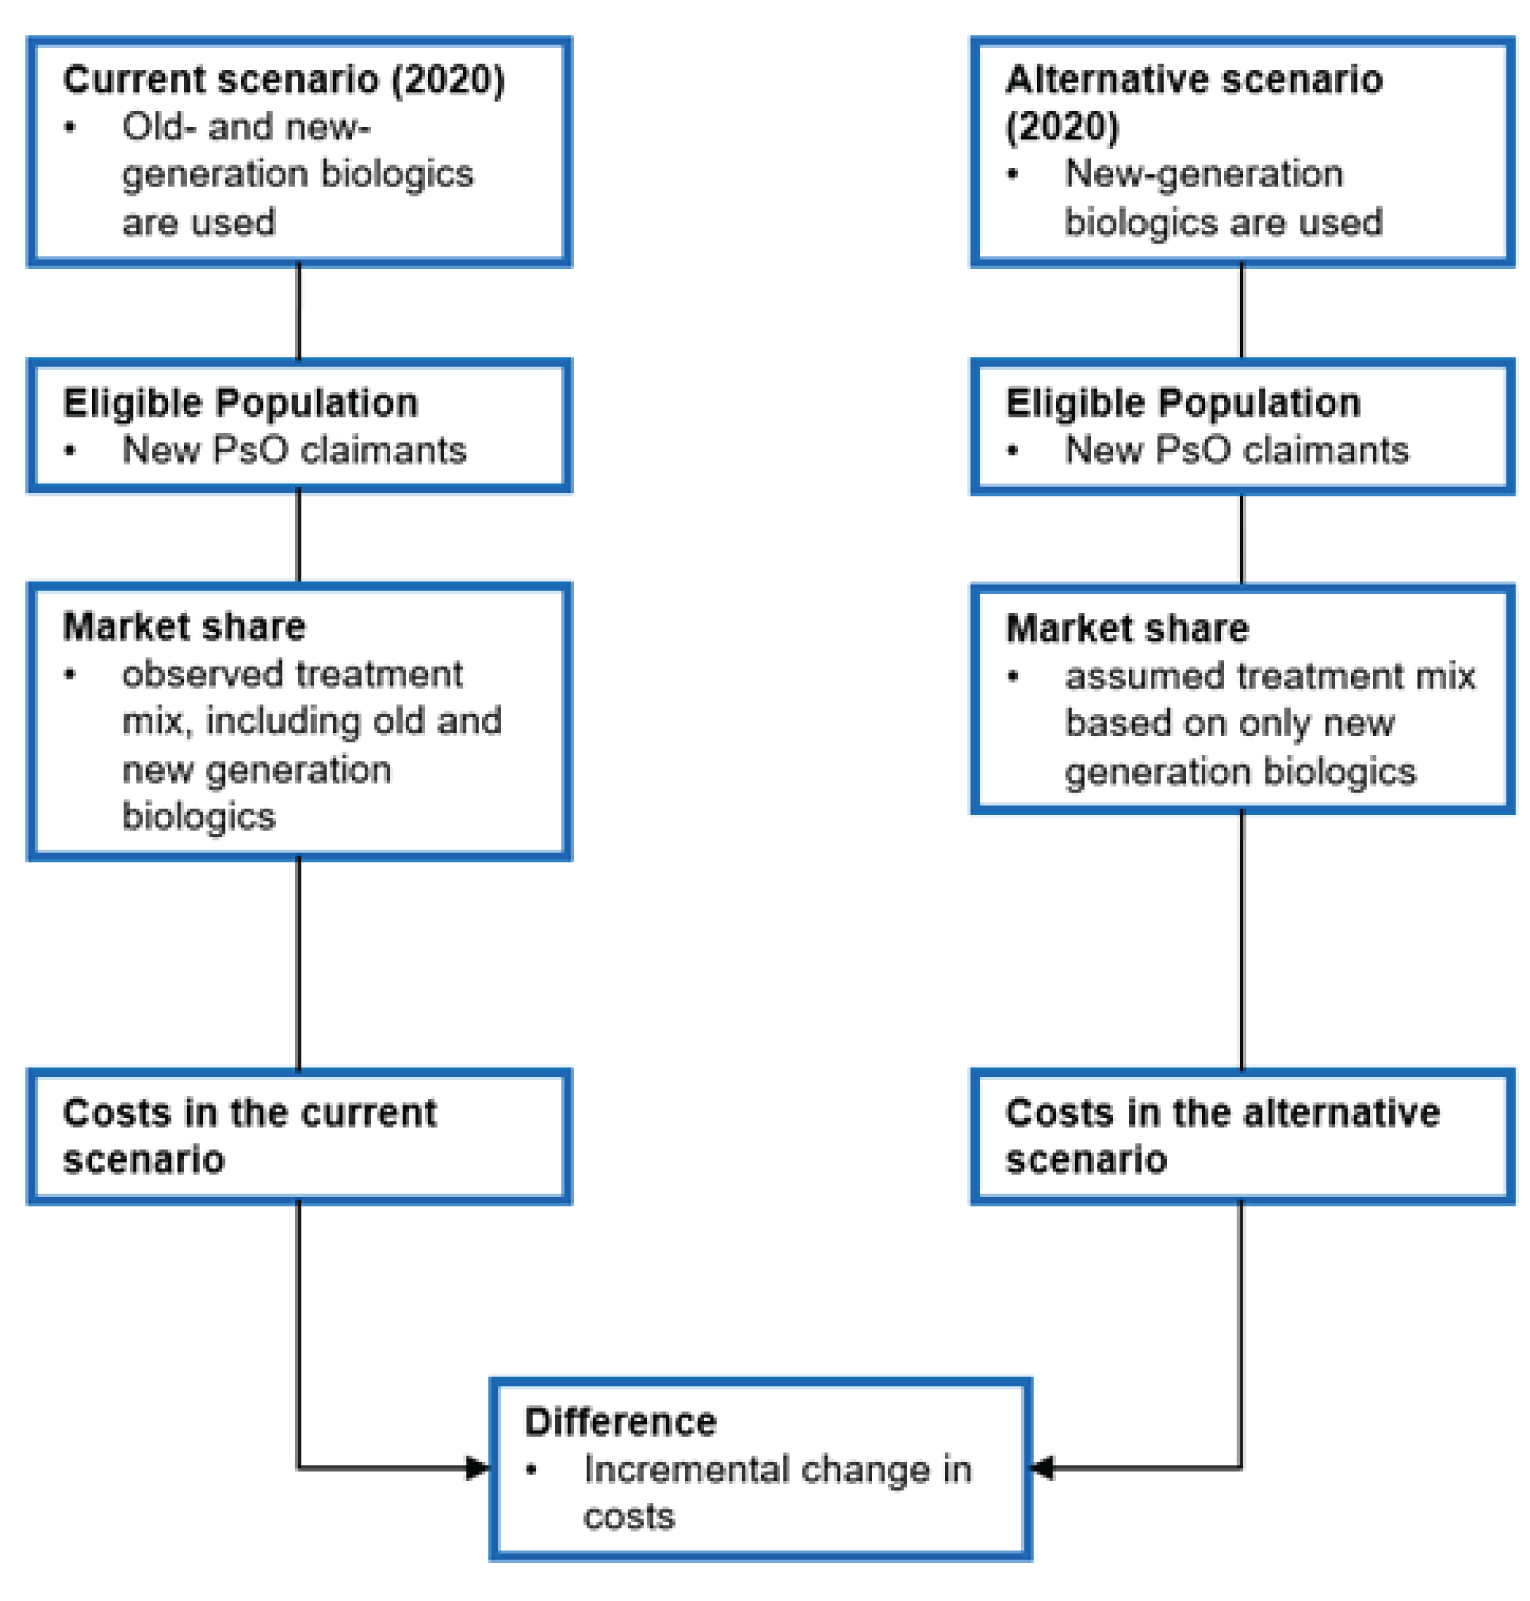
A costs analysis was conducted to estimate the 1-year cost impact to Canadian public drug plans (excluding Quebec) of implementing a policy whereby new biologic drug claimants with PsO initiated biologic treatment only with a new-generation biologic (Appendix 1). The inputs for this analysis were based on the previously described utilization analysis.38 In this alternative scenario, the 25% of new biologic drug claimants with PsO who were prescribed an old-generation biologic in 2020 received a new-generation biologic instead. Several assumptions were made for this analysis, including assumptions around drug prices because actual costs paid by drug plans are uncertain due to confidential PLAs between the drug plans and manufacturers. The base-case analysis assumed that the new-generation biologic received would be priced the same as the least costly new-generation biologic reported in 2020 ($8,303 annually per new biologic drug claimant). A scenario analysis was also conducted assuming that the average annual cost per new drug claimant for the least costly new-generation biologic would be equivalent to the least costly biosimilar regimen, etanercept ($6,700).
From the pan-Canadian perspective (excluding Quebec), it was estimated that the alternative scenario would produce first-year cost savings ranging from $543,161 (a 6.7% decrease in spending) in the base-case analysis to $788,420 (a 9.7% decrease in spending) in the scenario analysis. The projected absolute savings were highest in British Columbia and Ontario; the 2020 market shares for old-generation biologics in these jurisdictions were 30% in British Columbia and 26% in Ontario. Alberta and Manitoba demonstrated a negligible or no change in first-year cost savings in this analysis; however, this was expected because these jurisdictions have already implemented a biologic tiering policy.
The limitations of this analysis are described further in Appendix 1. Of note, the use of old-generation biologics is more frequent among existing claimants compared to new biologic drug claimants with PsO (65% of existing biologic drug claimants with PsO versus 25% of new claimants are using old-generation biologics). Furthermore, the number of existing biologic drug claimants with PsO is estimated to be more than 4 times the number of new biologic drug claimants with PsO.38 Considering these factors, it is reasonable to assume that if a biologic tiering policy is implemented for both biologic-experienced (i.e., patients using an old-generation biologic would be switched to a new-generation biologic) and biologic-naive patients, substantially more cost savings would be realized if relative price differences in the current analysis reflected PLAs. However, implementing a tiering policy for biologic-experienced patients would be challenging in real-world clinical practice because there would be issues about patient and provider autonomy and tiering for biologic-naive patients may be the only realistic scenario. Because only data from 2020 were included, there is uncertainty about the impact of the entry of the adalimumab biosimilar, so it was not considered in this analysis. Additionally, this analysis was limited to a 1-year time horizon and assumed a closed cohort (i.e., the size of the patient population remains the same over the analytical time horizon). To conduct a more comprehensive assessment of a biologic tiering policy, a longer time horizon may be required to capture the effect of adopting such a policy to allow for budgetary planning purposes. In such an analysis, it is hypothesized that cost savings would accumulate year-over-year and additional savings would be realized if the yearly incidence of new biologic drug claimants with PsO increases over time.
Implications for Policy-Making
For the majority of the old-generation biologics, biosimilar versions were launched several years after their eligibility or are not currently available on the Canadian market. In addition, most of the old-generation biologics predated pCPA, implying disparate PLAs across drug plans for these medications; the new-generation biologics all currently have active exclusivity status and have all undergone pCPA negotiations. Clinical trial evidence has consistently demonstrated greater efficacy with the new-generation biologics relative to the old-generation biologics, with no difference in the risk of side effects.
Despite access to new-generation biologics, there is still significant use of old-generation biologics in Canada in patients with PsO who are newly initiating a biologic, although jurisdictions with a biologic tiering policy demonstrate the greatest use of new-generation biologics (> 90% market share in 2020). In addition, the annual cost (based on list prices) per patient tends to be higher for the old-generation originator biologics; it is estimated that Canadian public drug plans spent more than $3 billion from 2016 to 2020 on old-generation originator biologics indicated for PsO after LoE.
Old-generation biologics appear to be less efficacious and more costly than new-generation biologics. If the old-generation biologics were launched in today’s market, it is unlikely they would be viewed favourably by payers; therefore, decision-makers need to review their place in therapy.
References
1.Kim WB, Jerome D, Yeung J. Diagnosis and management of psoriasis. Can Fam Physician. 2017;63(4):278-285. PubMed
2.Armstrong AW, Read C. Pathophysiology, Clinical Presentation, and Treatment of Psoriasis: A Review. Jama. 2020;323(19):1945-1960. PubMed
3.Oliveira Mde F, Rocha Bde O, Duarte GV. Psoriasis: classical and emerging comorbidities. An Bras Dermatol. 2015;90(1):9-20. PubMed
4.Eder L, Widdifield J, Rosen C, et al. Trends in the Prevalence and Incidence of Psoriasis and Psoriatic Arthritis in Ontario, Canada: A Population-Based Study. Arthritis Care & Research. 2018;71. PubMed
5.Levy AR, Davie AM, Brazier NC, et al. Economic burden of moderate to severe plaque psoriasis in Canada. Int J Dermatol. 2012;51(12):1432-1440. PubMed
6.Canadian Institute for Health Information (CIHI). Prescribed Drug Spending in Canada. 2020; https://secure.cihi.ca/free_products/prescribed-drug-spending-in-canada-2020-report-en.pdf. Accessed 2021 Aug 31.
7.Boehncke WH, Schön MP. Psoriasis. Lancet (London, England). 2015;386(9997):983-994. PubMed
8.Tseng J-C, Chang Y-C, Huang C-M, Hsu L-C, Chuang T-H. Therapeutic Development Based on the Immunopathogenic Mechanisms of Psoriasis. Pharmaceutics. 2021;13(7):1064. PubMed
9.Reimbursement Reviews: Secukinumab. Ottawa: CADTH; 2014: https://cadth.ca/secukinumab. Accessed 2021 Aug 30.
10.Reimbursement Reviews: Ixekizumab. Ottawa: CADTH; 2016: https://cadth.ca/ixekizumab Accessed 2021 Aug 30.
11.Reimbursement Reviews: Brodalumab. Ottawa: CADTH; 2018: https://cadth.ca/brodalumab. Accessed 2021 Aug 30.
12.Reimbursement Reviews: Guselkumab. Ottawa: CADTH; 2018: https://www.cadth.ca/guselkumab. Accessed 2022 Apr 20.
13.Reimbursement Reviews: Risankizumab. Ottawa: CADTH; 2019: https://cadth.ca/risankizumab Accessed 2021 Aug 30.
14.Reimbursement Reviews: Tildrakizumab. Ottawa: CADTH; 2021: https://www.cadth.ca/tildrakizumab. Accessed 2022 Apr 20.
15.Reimbursement Review: Bimekizumab. Ottawa: CADTH; 2022: https://www.cadth.ca/bimekizumab. Accessed 2022 Aug 24.
16.Bagel J, Lain T, Green LJ. What Does Efficacy Cost? Evidence for Relative Cost-Effectiveness of Biologic Therapies for Psoriasis. Practical Dermatology. 2019 Oct. https://practicaldermatology.com/articles/2019-oct/what-does-efficacy-cost-evidence-for-relative-cost-effectiveness-of-biologic-therapies-for-psoriasis. Accessed 2022 Apr 20.
17.Igarashi A, Igarashi A, Graham CN, Gilloteau I, Tani Y. Evaluating the cost-effectiveness of secukinumab in moderate-to-severe psoriasis: a Japanese perspective. J Med Econ. 2018:1-9. PubMed
18.Imafuku S, Nakano A, Dakeshita H, Li J, Betts KA, Guerin A. Number needed to treat and costs per responder among biologic treatments for moderate-to-severe plaque psoriasis in Japan. J Dermatolog Treat. 2018;29(1):24-31. PubMed
19.Augustin M, McBride D, Gilloteau I, O'Neill C, Neidhardt K, Graham CN. Cost-effectiveness of secukinumab as first biologic treatment, compared with other biologics, for moderate to severe psoriasis in Germany. J Eur Acad Dermatol Venereol. 2018;32(12):2191-2199. PubMed
20.Ravasio R, Antonelli S, Maiorino A, Costanzo A, Losi S. Cost per responder for ixekizumab and other biologic drugs approved for the treatment of moderate-to-severe plaque psoriasis in Italy. Global & Regional Health Technology Assessment. 2019;2019:2284240318822289.
21.Hendrix N, Ollendorf DA, Chapman RH, et al. Cost-Effectiveness of Targeted Pharmacotherapy for Moderate to Severe Plaque Psoriasis. J Manag Care Spec Pharm. 2018;24(12):1210-1217. PubMed
22.Wu JJ, Feldman SR, Rastogi S, Menges B, Lingohr-Smith M, Lin J. Comparison of the cost-effectiveness of biologic drugs used for moderate-to-severe psoriasis treatment in the United States. Journal of Dermatological Treatment. 2018;29(8):769-774. PubMed
23.Feldman SR, Wu JJ, Armstrong AW, et al. Evaluating Costs of Biologic Drugs for the Treatment of Moderate-to-Severe Psoriasis in the United States. Journal of Psoriasis and Psoriatic Arthritis. 2019;4(3):133-142.
24.Dyrda P, Pant S. Biologics in Plaque Psoriasis. CADTH Health Technology Review. Pre-publication ed. Ottawa: CADTH; 2021: https://www.cadth.ca/biologics-plaque-psoriasis. Accessed 2022 Sep 15.
25.Kendall M, Hamill D. A Decade of Data Protection for Innovative Drugs in Canada: Issues, Limitations, and Time for a Reassessment. Biotechnol Law Rep. 2016;35(6):259-267. PubMed
26.Guidance document: data protection under C.08.004.1 of the Food and Drug Regulations. Ottawa (ON): Health Canada; 2011: https://www.canada.ca/en/health-canada/services/drugs-health-products/drug-products/applications-submissions/guidance-documents/guidance-document-data-protection-under-08-004-1-food-drug-regulations.html. Accessed 2021 Jul 20.
27.Reducing data protection for biologics would slow medical progress and chill R&D investment in the U.S. Washington (DC): PhRMA; 2015: http://phrma-docs.phrma.org/sites/default/files/pdf/data-exclusivity-for-biologics-fact-sheet.pdf. Accessed 2021 Oct 19.
28.Yu N, Bach P, Trusheim M. Biosimilars: Market Changes do not equal policy success. 2021; https://www.drugpricinglab.org/research/biosimilars-market-growth-give-a-false-sense-of-security/. Accessed 2021 Aug 30.
29.Gleeson D, Townsend B, Lopert R, Lexchin J, Moir H. Financial costs associated with monopolies on biologic medicines in Australia. Aust Health Rev. 2019;43(1):36-42. PubMed
30.Mathias T. AbbVie, Samsung Bioepis in deal; Humira biosimilar U.S. release in 2023. Reuters 2018; https://www.reuters.com/article/us-abbvie-biogen-idUSKCN1HC1SP. Accessed 2021 Aug 10.
31.Courage N, Shivakumar S. The biosimilar landscape in Canada. Lexology 2018; https://www.lexology.com/library/detail.aspx?g=bc06ea65-d2bc-4ffe-bf04-9b497b10fce0. Accessed 2021 Oct 14.
32.Blackstone EA, Joseph PF. The economics of biosimilars. Am Health Drug Benefits. 2013;6(8):469-478. PubMed
33.Lee CC, Najafzadeh M, Kesselheim AS, Sarpatwari A. Cost to Medicare of Delayed Adalimumab Biosimilar Availability. Clin Pharmacol Ther. 2021;110(4):1050-1056. PubMed
34.Tesar T, Golias P, Kobliskova Z, Wawruch M, Kawalec P, Inotai A. Potential Cost-Savings From the Use of the Biosimilars in Slovakia. Frontiers in Public Health. 2020;8. PubMed
35.Van de Wiele VL, Beall RF, Kesselheim AS, Sarpatwari A. The characteristics of patents impacting availability of biosimilars. Nature Biotechnology. 2022;40(1):22-25. PubMed
36.Dickson SR, Kent T. Association of Generic Competition With Price Decreases in Physician-Administered Drugs and Estimated Price Decreases for Biosimilar Competition. JAMA Netw Open. 2021;4(11):e2133451. PubMed
37.Subramonian A, Walter M. Newer Biologics for the Treatment of Plaque Psoriasis. CADTH Health Technology Review. Ottawa: CADTH; 2021: https://www.cadth.ca/newer-biologics-treatment-plaque-psoriasis-0. Accessed 2022 Sep 15.
38.Dyrda P, Vannabouathong C, Peter K, Bansback N, Tadrous M. Utilization of Old- Versus New-Generation Biologics for Plaque Psoriasis for Public and Private Payers in Canada CADTH Health Technology Review. Ottawa: CADTH; 2022: https://www.cadth.ca/utilization-old-versus-new-generation-biologics-public-and-private-insurers-canada. Accessed 2022 Aug 18.
39.UCB Canada Inc. Product Monograph: Bimzelx (bimekizumab injection). 2022; https://pdf.hres.ca/dpd_pm/00064702.PDF. Accessed 2022 Aug 24.
40.Puig L. PASI90 response: the new standard in therapeutic efficacy for psoriasis. J Eur Acad Dermatol Venereol. 2015;29(4):645-648. PubMed
41.Elewski BE, Puig L, Mordin M, et al. Psoriasis patients with psoriasis Area and Severity Index (PASI) 90 response achieve greater health-related quality-of-life improvements than those with PASI 75-89 response: results from two phase 3 studies of secukinumab. J Dermatolog Treat. 2017;28(6):492-499. PubMed
42.Gordon KB, Strober B, Lebwohl M, et al. Efficacy and safety of risankizumab in moderate-to-severe plaque psoriasis (UltIMMa-1 and UltIMMa-2): results from two double-blind, randomised, placebo-controlled and ustekinumab-controlled phase 3 trials. The Lancet. 2018;392(10148):650-661. PubMed
43.Griffiths CEM, Reich K, Lebwohl M, et al. Comparison of ixekizumab with etanercept or placebo in moderate-to-severe psoriasis (UNCOVER-2 and UNCOVER-3): results from two phase 3 randomised trials. The Lancet. 2015;386(9993):541-551. PubMed
44.Langley RG, Tsai TF, Flavin S, et al. Efficacy and safety of guselkumab in patients with psoriasis who have an inadequate response to ustekinumab: results of the randomized, double-blind, phase III NAVIGATE trial. Br J Dermatol. 2018;178(1):114-123. PubMed
45.Lebwohl M, Strober B, Menter A, et al. Phase 3 Studies Comparing Brodalumab with Ustekinumab in Psoriasis. N Engl J Med. 2015;373(14):1318-1328. PubMed
46.Reich K, Gooderham M, Thaçi D, et al. Risankizumab compared with adalimumab in patients with moderate-to-severe plaque psoriasis (IMMvent): a randomised, double-blind, active-comparator-controlled phase 3 trial. The Lancet. 2019;394(10198):576-586. PubMed
47.Reich K, Griffiths CEM, Gordon KB, et al. Maintenance of clinical response and consistent safety profile with up to 3 years of continuous treatment with guselkumab: Results from the VOYAGE 1 and VOYAGE 2 trials. J Am Acad Dermatol. 2020;82(4):936-945. PubMed
48.Reich K, Iversen L, Puig L, et al. Long-term efficacy and safety of brodalumab in moderate-to-severe plaque psoriasis: a post hoc pooled analysis of AMAGINE-2 and −3. Journal of the European Academy of Dermatology and Venereology. 2022;36(8):1275-1283. PubMed
49.Government of the Northwest Territories Health and Social Services. Extended health benefits for specified disease conditions program. 2019; https://www.hss.gov.nt.ca/en/services/supplementary-health-benefits/extended-health-benefits-specified-disease-conditions. Accessed 2021 Jun 22.
50.Government of Nunavut. EHB full coverage plan. 2020; https://www.gov.nu.ca/health/information/ehb-full-coverage-plan. Accessed 2021 Jun 22.
51.Government of Alberta. Interactive Drug Benefit List (iDBL). 2021; https://www.ab.bluecross.ca/dbl/publications.php. Accessed 2021 Jun 22.
52.Express Scripts Canada. Drug benefit list. 2020; https://nihb.express-scripts.ca/dbl. Accessed 2021 Aug 18.
53.New Brunswick drug plans formulary. Frederiction (NB): Government of New Brunswick; 2021: https://www2.gnb.ca/content/dam/gnb/Departments/h-s/pdf/en/NBDrugPlan/NewBrunswickDrugPlansFormulary.pdf. Accessed 2021 Jun 22.
54.CADTH Canadian Drug Expert Committee (CDEC) final recommendation: tildrakizumab (Ilumya – Sun Pharma Canada). Ottawa (ON): CADTH; 2021 Jun 21: https://cadth.ca/tildrakizumab. Accessed 2021 Jun 28.
55.Correctional Service Canada. National drug formulary. 2021. Accessed 2021 Aug 18.
56.Health Canada. Product information for Ilumya. 2021; https://health-products.canada.ca/dpd-bdpp/info.do?lang=en&code=100544. Accessed 2021 Jun 22.
57.Veterans Affairs Canada. Drug formulary search form. 2019; https://www.veterans.gc.ca/eng/financial-support/medical-costs/treatment-benefits/poc10/search. Accessed 2021 Jun 22.
58.National Defence and the Canadian Armed Forces. Drug benefit list. 2019; http://www.cmp-cpm.forces.gc.ca/hs/en/drug-benefit-list/index.asp. Accessed 2021 Aug 18.
59.Formulary. Halifax (NS): Nova Scotia Department of Health; 2021: https://novascotia.ca/dhw/pharmacare/documents/formulary.pdf. Accessed 2021 Jun 22.
60.British Columbia Ministry of Health. Special authority drug list. 2021; https://www2.gov.bc.ca/gov/content/health/practitioner-professional-resources/pharmacare/prescribers/special-authority#Druglist. Accessed 2021 Jun 25.
61.Special authority request: adalimumab / etanercept / infliximab / risankizumab / secukinumab / ustekinumab / ixekizumab for the treatment of moderate to severe plaque psoriasis. Victoria (BC): British Columbia Ministry of Health; 2021: https://www2.gov.bc.ca/assets/gov/health/forms/5380fil.pdf. Accessed 2021 Jun 21.
62.Part 3 exception drug status (EDS). Winnipeg (MB): Manitoba Health; 2021: https://www.gov.mb.ca/health/mdbif/docs/edsnotice.pdf. Accessed 2021 Aug 18.
63.PEI Pharmacare formulary. Charlottetown (PEI): Government of Prince Edward Island; 2021: https://www.princeedwardisland.ca/sites/default/files/publications/pei_pharmacare_formulary.pdf. Accessed 2021 Jun 22.
64.Government of Ontario. Ontario Drug Benefit formulary search. 2021; https://www.formulary.health.gov.on.ca/formulary/. Accessed 2021 Jun 22.
65.Saskatchewan formulary bulletin #200: update to the 62nd edition of the Saskatchewan formulary. Regina (SK): Government of Saskatchewan; 2021: https://formulary.drugplan.ehealthsask.ca/Bulletins/Bulletin-0200-Jun-2021.pdf. Accessed 2021 Jun 22.
66.Government of Saskatchewan. Saskatchewan drug plan. 2021; https://formulary.drugplan.ehealthsask.ca/SearchFormulary/BG/682840. Accessed 2021 Jun 22.
67.Appendix A: exception drug status program. Regina (SK): Government of Saskatchewan; 2021: https://formulary.drugplan.ehealthsask.ca/PDFs/APPENDIXA.pdf. Accessed 2021 Jun 25.
68.Newfoundland and Labrador Health and Community Services. NLPDP drug product database. 2021; https://www.health.gov.nl.ca/health/prescription/newformulary.asp. Accessed 2021 Aug 18.
69.Government of Yukon. Yukon drug formulary. 2021: https://ihs.gov.yk.ca/drugs/f?p=161:9000. Accessed 2021 Jun 22.
70.Armstrong AW, Soliman AM, Betts KA, et al. Comparative Efficacy and Relative Ranking of Biologics and Oral Therapies for Moderate-to-Severe Plaque Psoriasis: A Network Meta-analysis. Dermatol Ther (Heidelb). 2021;11(3):885-905. PubMed
71.Sbidian E, Chaimani A, Garcia-Doval I, et al. Systemic pharmacological treatments for chronic plaque psoriasis: a network meta-analysis. Cochrane Database of Systematic Reviews. 2021;2021(12). PubMed
72.Xu S, Gao X, Deng J, Yang J, Pan F. Comparative efficacy and safety of biologics in moderate to severe plaque psoriasis: a multiple-treatments meta-analysis. J. 2021;19(1):47-56.
73.Mahil SK, Ezejimofor MC, Exton LS, et al. Comparing the efficacy and tolerability of biologic therapies in psoriasis: an updated network meta-analysis. Br J Dermatol. 2020;183(4):638-649. PubMed
74.Xue W, Saharia P, Gray E, et al. Efficacy of Brodalumab for Moderate to Severe Plaque Psoriasis: A Canadian Network Meta-Analysis. J Cutan Med Surg. 2020;24(6):561-572. PubMed
75.Shi J, Xu J, Chen Y. A network meta-analysis for the comparison of efficacy and safety of interleukin (IL)-23 targeted drugs in the treatment of moderate to severe psoriasis. Dermatol Ther. 2020;33(4):e13802. PubMed
76.Yasmeen N, Sawyer LM, Malottki K, Levin LA, Didriksen Apol E, Jemec GB. Targeted therapies for patients with moderate-to-severe psoriasis: a systematic review and network meta-analysis of PASI response at 1 year. Journal of Dermatological Treatment. 2020:1-15. PubMed
Appendix 1: Cost Analysis — Methods and Results
Note that this appendix has not been copy-edited.
Research Question
What is the estimated 1-year cost impact to Canadian public drug plans of implementing a policy whereby biologic-naive patients with plaque psoriasis (PsO) begin biologic treatment with a new-generation biologic?
Economic Analysis
All calculations were done using an Excel-based tool developed for this project. This tool has the flexibility to explore various scenarios and to report the estimates of the cost impact disaggregated by jurisdictions.
Patient Population
The population considered within this analysis consists of new biologic drug claimants with PsO. Specifically, the population included patients with PsO who are biologic-naive during the analyzed time period. The population size was identified from an existing drug utilization analysis that used a drug marker algorithm to selectively identify the patients who are receiving biologic treatment for PsO from the National Prescription Drug Utilization Information System (NPDUIS) database.38 A closed cohort was considered (i.e., no new claimants were added to the patient cohort and mortality was assumed to be negligible during the analyzed time period).
Scenarios Evaluated
The current scenario reflected the existing situation in which new biologic drug claimants with PsO may be prescribed either an old- or new-generation biologic, with utilization based on observed clinical practice in 2020.38 Old-generation biologics for PsO included etanercept, infliximab, adalimumab, and ustekinumab. New-generation biologics for PsO included brodalumab, ixekizumab, risankizumab and secukinumab. The alternative scenario reflected a hypothetical situation whereby the same cohort of patients would have instead initiated biologic treatment with new-generation biologics only, largely reflecting what would be expected if a biologic tiering policy was to be introduced.
Time Horizon
The time horizon of the analysis was 1 year (2020).
Perspective
The perspective of this analysis was from the Canadian publicly funded drug plan, excluding Quebec and federal drug plans. Therefore, only drug costs covered by public drug plans were captured. Broader health care system costs, costs to individuals (i.e., out-of-pocket costs), and costs to private payers were not included within this analysis.
The analysis was performed at the provincial-level, with Atlantic provinces pooled (i.e., New Brunswick, Nova Scotia, Prince Edward Island, and Newfoundland and Labrador) to align with how results are presented in the utilization report.38 Pan-Canadian results are also reported and were obtained by summing up the results of individual jurisdictions.
Analytic Framework Description
An applied, policy-oriented, cost-calculator was created to calculate the cost impact between the current and alternative scenario. The total costs of the current and alternative scenarios were compared to estimate the cost impact resulting from the use of only new-generation biologics among patients with PsO who are biologic-naive in 2020 (Figure 4).
As noted previously, the current scenario was taken from an existing utilization report that reported the national average annual costs of biologics amongst new biologic drug claimants with PsO. Patient volumes (e.g., number of new claimants with PsO by type of biologic), disaggregated by provincial public drug plans, were used to inform the size of the patient population. Details on the parameterization of the current scenario and relevant assumptions can be found within the utilization report.38
The alternative scenario represented the implementation of a policy whereby the identified patient population (i.e., patients with PsO who are biologic-naive in 2020) begin biologic treatment with new-generation biologics only. Overall, 25% of new biologic drug claimant received an old-generation biologic in 2020. In the alternative scenario, although any new-generation biologic could be initiated, it was assumed that the new-generation biologic received would be priced the same as the least costly new-generation biologic reported in 2020 (Table 2; i.e., brodalumab). The market share of ixekizumab, risankizumab and secukinumab did not otherwise change between the current and alternative scenarios, and this assumption was considered valid based on CADTH obtained clinical expert feedback.
It was also assumed that the infliximab originator and etanercept originator would have no market share in both the current and alternative scenarios. This assumption was considered appropriate based on the volume data reported in the utilization report. There were no reported claims for infliximab originator while the proportion of claims for etanercept originator was nearly zero amongst new biologic drug claimants with PsO in 2020 across all jurisdictions.
As the number of new biologic drug claimants was assumed to be static, no additional forecasting on the size of the patient population was undertaken. In both scenarios, the costs for each biologic were multiplied by its patient volume (i.e., number of new biologic drug claimants associated or expected with that biologic). These costs were summed across biologics to inform the total scenario costs.
Inputs
The national average annual cost per new biologic drug claimant with PsO was calculated by dividing the total drug expenditures by the total number of new drug claimants with PsO nationally for each biologic in 2020. These cost estimates incorporated drug cost, associated professional fees and markup, if applicable. NPDUIS costing is based on real-world utilization and, as such, incorporates treatment aspects, such as adherence and time on treatment, to estimate the total drug expenditure.
While the utilization report only presented patient volumes at a national level, the number of new biologic drug claimants by type of biologic at a jurisdictional level was available from the data extracted from the NPDUIS database. These data were used to inform the cost analysis.
The inputs used in this analysis are presented in Table 1 and Table 2.
Table 4 summarizes the key assumptions informing the base-case cost analysis.
Scenario Analyses
The analyses are based on publicly available prices for all comparators. The actual price of drugs paid by public drug plans is uncertain due to PLAs between the drug plans and manufacturers. New-generation biologics have all gone through negotiations at the pan-Canadian Pharmaceutical Alliance (pCPA), while old-generation biologics may have confidential listing agreements with individual provincial drug plans. While the base-case analysis assumed that patients who were prescribed an old-generation biologic in the current scenario would initiate treatment with the least costly new-generation biologic in the alternative scenario, a scenario analysis was conducted assuming that the national average annual cost per claimant for the least costly new-generation biologic would be equivalent to the least costly biosimilar regimen, etanercept (i.e., $6,700).
Biologic | National average annual cost per new biologic drug claimant ($) |
|---|---|
Adalimumab | $11,645 |
Ustekinumab | $16,047 |
Etanercept (biosimilar) | $6,700 |
Infliximab (biosimilar) | $7,666 |
Ixekizumab | $14,640 |
Risankizumab | $13,957 |
Secukinumab | $15,229 |
Brodalumab | $8,303 |
Source: The cost inputs were obtained from Figure 3 of the utilization report.38
Table 3: Inputs — Number of New Biologic Drug Claimants With PsO
Jurisdiction | Number of patients |
|---|---|
Total | 599 |
By jurisdiction | |
Alberta | 43 |
Atlantic Canada | 23 |
British Columbia | 233 |
Manitoba | 6 |
Ontario | 241 |
Saskatchewan | 53 |
Source: National Prescription Drug Utilization Information System (NPDUIS) database.38
Table 4: Base-Case Assumptions
Parameter | Assumption |
|---|---|
Analytical time horizon | A single calendar year (2020) was selected. As such, the analysis estimates the first year’s cost impact of a scenario in which new biologic drug claimants would first be prescribed a new-generation biologic. This is a simplification of a scenario exploring the impact of introducing a biologic tiering policy. To comprehensively quantify the budget impact of a tiering policy, a longer time horizon may be required. Whereas the cost analysis currently explores the impact of the first tier (i.e., all patients on old-generation biologics prescribed the cheapest new-generation biologic), an analysis adopting a longer time horizon would be able to capture the impact of the entire tiered structure introduced for PsO. A longer time horizon would also capture the cost impact of patients who may fail or become intolerant to their first or subsequent biologic treatments and require switching to the next drug tier. |
Patient cohort | Only new claimants were considered. The number of users in the cohort was assumed to be constant over the 1-year time horizon (i.e., no new users were added to the cohort, and mortality was assumed to be negligible). This assumption was considered reasonable given the short analytic time frame. |
Perspective | The public drug payer was considered. As such, any differences in costs from a broader health care system perspective were not considered. If there are differences in the efficacy and safety of biologics that may impact health care resource utilization beyond drug programs, a broader perspective may be required. |
Costs | Publicly available, national average cost of utilization was included. It was assumed there are no negotiated prices or discounts between drug plan and manufacturers. This was a simplification of the analysis as actual prices paid by public drug plans are confidential. Different prices may have been negotiated by jurisdictions, which will impact the estimated results. Given the uncertainty in costs, a scenario analysis was conducted assuming the national average annual cost of biologic treatment for those who would have had initiated treatment with a new-generation biologic in the alternative scenario would be equal to the national average annual costs of the least costly biosimilar regimen (i.e., etanercept). This scenario analysis was considered to present the most optimistic results (i.e., produces the biggest cost impact estimate) as it assumes a price discount is present upon the introduction of a policy on starting biologic-naive patients on new-generation biologics that would apply to patients who would have otherwise been on an old-generation biologic or the least costly new-generation biologic (i.e., brodalumab). |
Coverage | No switch between public and private coverage was assumed. This permitted simplification of the analysis, which was considered reasonable given the analytical time horizon was only 1 year. |
Policy implemented | All jurisdictions have the same listing policy that new patients with PsO initiate therapy with a new-generation biologic instead of an old-generation biologic. This is a simplification reflecting what would be expected if tiering was introduced (e.g., first tier would be a new-generation biologic). |
Health impacts | Not considered. The real-world impact of this assumption is unclear although there is direct comparative clinical trial evidence available that demonstrates new-generation biologics have improved efficacy compared to old-generation biologics.42-48 |
Treatment switch | No treatment switch was assumed during the analytical time frame. This was considered a simplification of the analysis. It remains unclear how treatment switch may impact the cost analysis as it would depend on what subsequent biological treatment patients would receive. |
Market share | It was assumed that the etanercept and infliximab originators had no market share in the current and alternative scenario. In the alternative scenario, the least costly new-generation biologics were assumed to capture all market share of old-generation biologics, such as adalimumab, etanercept and ustekinumab. The market share of new-generation biologics was assumed to otherwise remain unchanged between the current and alternative scenario. The market assumptions were informed by feedback received from the clinical expert consulted by CADTH for this analysis. This was a simplified assumption given it was not clear under the alternative scenario, which new-generation biologic patients would receive. A different mix of new-generation biologics in the alternative scenario would be expected to lead to a different cost estimate. |
PsO = plaque psoriasis.
Results
The pan-Canadian and jurisdiction-level results are presented in Table 5. The first-year cost of treating patients with PsO who are biologic-naive was estimated to be $8,144,742 under the current scenario (i.e., the existing situation in which new biologic drug claimants with PsO may be prescribed with either old- or new-generation biologics). The first-year cost of treating this same cohort of patients in the alternative scenario (i.e., the implementation of a policy whereby new biologic drug claimants with PsO begin on new-generation biologics only) was $7,601,581. From the pan-Canadian perspective (excluding Quebec), the alternative scenario would produce cost savings of $543,161 (i.e., a 6.67% decrease) in the first year of implementation. For the Atlantic provinces combined, it was estimated that this new policy would result in a 10.72% decrease in first-year costs. The projected savings were also high in British Columbia and Ontario, with an estimated decrease in first-year costs by 8.07% and 7.06%, respectively. Alberta and Manitoba demonstrated a negligible or no change in first-year costs (a 0.58% and 0% decrease, respectively); however, this was expected as these jurisdictions have already implemented a biologic tiering policy.
Scenario Analyses
The analyses are based on publicly available prices for all old- and new-generation biologics. Based on publicly available cost data, this new policy under the alternative scenario would be expected to divert patients on less costly biosimilars to more expensive new-generation biologics. However, new-generation biologics have gone through negotiations at the pCPA, and the true confidentially negotiated prices may lead to additional cost savings. This uncertainty in costs was explored in a scenario analysis.
A scenario analysis was conducted that assumed a price discount is present upon the introduction of a policy on starting biologic-naive patients on the least costly new-generation biologic (i.e., brodalumab). Assuming that the national average annual cost for these patients would be equivalent to the least costly biosimilar regimen, etanercept, decreased estimated first-year drug plan costs by 9.72% (compared to 6.67% in the base-case analysis). Table 6 presents the pan-Canadian and jurisdiction-level results of this scenario analysis.
Table 5: Base-Case Analysis Results
Jurisdiction | Current scenario | Alternative scenario | Incremental cost impact (%) |
|---|---|---|---|
Costs ($) | |||
Total | 8,144,742 | 7,601,581 | –543,161 (–6.67%) |
By jurisdiction | |||
Alberta | 597,925 | 594,447 | –3,478 (–0.58%) |
Atlantic Canadaa | 300,715 | 268,381 | –32,334 (–10.72%) |
British Columbia | 3,207,894 | 2,949,170 | –258,724 (–8.07%) |
Manitoba | 87,652 | 87,652 | 0 (0%) |
Ontario | 3,250,815 | 3,021,156 | –229,659 (–7.06%) |
Saskatchewan | 699,741 | 680,775 | –18,966 (–2.71%) |
aAtlantic Canada includes the following jurisdictions: New Brunswick, Nova Scotia, Prince Edward Island, and Newfoundland and Labrador.
Note: Cost savings are reflected by the negative value.
Table 6: Scenario Analysis Results
Jurisdiction | Current scenario | Alternative scenario | Incremental cost impact (%) |
|---|---|---|---|
Costs ($) | |||
Total | 8,112,682 | 7,324,262 | –788,420 (–9.72%) |
By jurisdiction | |||
Alberta | 597,925 | 588,035 | –9,890 (–1.65%) |
Atlantic Canadaa | 300,715 | 252,351 | –48,364 (–16.08%) |
British Columbia | 3,207,894 | 2,836,960 | –370,934 (–11.56%) |
Manitoba | 87,652 | 87,652 | 0 (0%) |
Ontario | 3,229,976 | 2,899,328 | –330,648 (–10.24%) |
Saskatchewan | 688,520 | 659,936 | –28,584 (–4.15%) |
aAtlantic Canada includes the following jurisdictions: New Brunswick, Nova Scotia, Prince Edward Island, and Newfoundland and Labrador.
Note: Cost savings are reflected by the negative value.
Conclusions and Future Directions
CADTH estimated the first-year cost impact to Canadian public drug plans of a biologic tiering policy where new biologic drug claimants with PsO initiate biologic treatment with only new-generation biologics. Specifically, all patients who were prescribed an old-generation biologic were assumed to instead have started treatment on the least costly new-generation biologic in the alternative scenario. The impact of implementing this tiering policy was estimated to reduce first-year costs by approximately 7% across Canada, with largest cost savings seen in British Columbia and Ontario (i.e., savings of $258,724 [8% reduction] and $229,659 [7% reduction] respectively in the first year of a new claimant cohort). A limitation to this analysis was the fact that publicly available costs were used, which introduced uncertainty in the estimated cost impact. Should confidentially negotiated prices for new-generation biologics result in lower annual treatment costs while the annual costs of old-generation products were to remain similar to the values used in this analysis, additional cost savings may be realized as seen in the scenario analysis conducted.
Although it was outside of the scope of the current cost analysis to explore the potential impact of switching biologics in a population of existing biologic drug claimants with PsO, the use of old-generation biologics is higher among existing claimants compared to new biologic drug claimants with PsO (65% of existing claimants with PsO, as opposed to 25% of new claimants, are using old-generation biologics). Furthermore, the number of existing claimants with PsO is more than 4 times more than the number of new claimants with PsO.38 If a tiering policy is implemented for both biologic-experienced (i.e., patients using an old-generation biologic would be switched to a new-generation biologic) and biologic-naive patients, additional cost savings would be realized if relative price differences in the current analysis reflected PLAs.
Given the analysis was restricted to the year of 2020, the introduction of an adalimumab biosimilar and its impact on the average cost per new biologic drug claimant for adalimumab and estimated cost savings have not been captured in this analysis. This analysis was limited to a 1-year time horizon to illustrate the potential first-year cost savings associated with a hypothetical biologic tiering policy based on new biologic drug claimants with PsO initiating treatment with only new-generation biologics. The 1-year time horizon was selected as a simplification. As such, the analysis was able to assume a closed cohort (i.e., the size of the patient population remains the same over the analytical time horizon) and it was assumed that no patients would discontinue and switch from their biologic treatment over the 1-year period; it is likely that there would indeed be a proportion of these patients who discontinued or switched treatment within this time frame. Additionally, the first year cost of biologic treatment exceeds that of subsequent years because of the more frequent dosing during the induction phase and maintenance phase dosing would need to be considered in an analysis conducted over a longer time horizon. Furthermore, patients with PsO were identified by a drug marker algorithm in the utilization analysis report;38 therefore, estimates of the population size may be higher or lower actual prevalence estimates in each jurisdiction were employed instead. To conduct a more comprehensive assessment of a tiering drug policy, a longer time horizon may be required to capture the impact of adopting such a policy to allow for budgetary planning purposes. In such an analysis, it is hypothesized that cost savings would accumulate year-over-year and additional savings would be realized if the yearly incidence of new biologic drug claimants with PsO increases over time.
Appendix 2: Listing Status of Biologics for PsO Across Public Drug Plans
Table 7: Listing Status of Biologics for PsO Across Public Drug Plans
Generic name | Brand name | AB | BC | SK | MB | ON | NB | NS | NL | PE | YT | NIHBa | VACb | CSC | CAF |
|---|---|---|---|---|---|---|---|---|---|---|---|---|---|---|---|
Adalimumab | Humira | NAB | NAB | EDS | EDS | LU | NAB | ESD | SA | SA | EDS | LU/PA | SA | Tier 2 | SA |
Amgevita (biosimilar) | SA | LCD/SA | EDS | EDS | LU | SA | NAB | SA | NAB | EDS | LU/PA | SA | CM | NAB | |
Hadlima (biosimilar) | SA | LCD/SA | EDS | EDS | LU | SA | NAB | SA | NAB | NAB | LU/PA | SA | CM | NAB | |
Hulio (biosimilar) | SA | LCD/SA | EDS | EDS | LU | SA | NAB | SA | NAB | EDS | LU/PA | SA | CM | NAB | |
Hyrimoz (biosimilar) | SA | LCD/SA | EDS | EDS | LU | SA | NAB | SA | NAB | NAB | LU/PA | SA | CM | NAB | |
Idacio (biosimilar) | SA | LCD/SA | EDS | EDS | LU | SA | NAB | SA | NAB | NAB | LU/PA | SA | CM | NAB | |
Certolizumab | Cimzia | NAB | |||||||||||||
Etanercept | Enbrel | NAB | NAB | EDS | Tier 2 | LU | NAB | ESD | NAB | SA | EDS | NAB | SA | NAB | SA |
Brenzys (biosimilar) | SA | LCD/SA | EDS | EDS | LU | SA | NAB | SA | NAB | EDS | NAB | SA | CM | SA | |
Erelzi (biosimilar) | SA | LCD/SA | EDS | EDS | LU | SA | NAB | SA | NAB | EDS | LU/PA | SA | CM | SA | |
Infliximab | Remicade | NAB | NAB | EDS | Tier 2 | NAB | NAB | ESD | SA | SA | EDS | LU/PA | SA | NAB | SA |
Inlfectra (biosimilar) | SA | LCD/SA | EDS | EDS | LU | SA | ESD | SA | SA | EDS | LU/PA | SA | CM | SA | |
Renflexis (biosimilar) | SA | LCD/SA | EDS | EDS | LU | SA | ESD | SA | SA | NAB | LU/PA | SA | CM | SA | |
Avsola (biosimilar) | SA | LCD/SA | EDS | EDS | LU | SA | NAB | SA | NAB | NAB | LU/PA | SA | NAB | NAB | |
Ustekinumab | Stelara | Tier 2 | LCD/SA | EDS | Tier 2 | LU | SA | ESD | SA | SA | EDS | LU/PA | SA | Tier 2 | SA |
Guselkumab | Tremfya | NAB | |||||||||||||
Risankizumab | Skyrizi | SA | LCD/SA | EDS | EDS | LU | SA | ESD | SA | SA | EDS | LU/PA | SA | NAB | NAB |
Tildrakizumab | Ilumya | SA | NAB | EDS | EDS | LU | SA | ESD | NAB | NAB | NAB | NAB | SA | NAB | NAB |
Brodalumab | Siliq | NAB | NAB | EDS | EDS | LU | SA | ESD | SA | SA | NAB | LU/PA | SA | NAB | SA |
Ixekizumab | Taltz | SA | LCD/SA | EDS | EDS | LU | SA | ESD | SA | SA | NAB | LU/PA | SA | NAB | SA |
Secukinumab | Cosentyx | SA | LCD/SA | EDS | EDS | LU | SA | ESD | SA | SA | EDS | LU/PA | SA | NAB | SA |
AB = Alberta; BC = British Columbia; CAF = Canadian Armed Forces; CM = Criteria Medicine; CSC = Correctional Services Canada; EDS = Exception Drug Status; ESD = Exception Status Drug; LU = Limited Use; MB = Manitoba; NAB = not a benefit; NB = New Brunswick; NIHB = Non-Insured Health Benefits; NL = Newfoundland and Labrador; NS = Nova Scotia; ON = Ontario; PA = Prior Approval; PE = Prince Edward Island; SA = Special Authorization; SK = Saskatchewan; UR = under review; VAC = Veterans Affairs Canada; YT = Yukon.
Notes: Tier 2 refers to reimbursement only after tier 1 drugs have been trialled. Shaded cells indicated drugs that are not listed.
This table has not been copy-edited.
aAlso applicable to Nunavut and the Northwest Territories.49,50
bInformation is based on a personal communication with the jurisdictional representative (Anne Bastarache: personal communication, July 2021).
Sources: Listing statuses were captured from payer formulary websites.49-69
Appendix 3: Main Study Findings From the NMAs
Note that this appendix has not been copy-edited.
Table 8: Summary of PASI 90 Results
Comparison | Study citation | Treatment response |
|---|---|---|
Short-term treatment (up to 16 or 24 weeks) | ||
Secukinumab vs. adalimumab | Armstrong et al. (2021)70 | Indirect evidence from NMA: OR = 2.46 (95% CrI = 1.91 to 3.13) |
Sbidian et al. (2021)71 | Indirect evidence from NMA: RR = 1.45 (95% CI = 1.27 to 1.65) | |
Xu et al. (2021)72 | Indirect evidence from NMA: RR = 2.7 (95% CrI = 1.51 to 4.5) | |
Mahil et al. (2020)73 | Indirect evidence from NMA: All doses: OR = 2.29 (95% CrI = 1.37 to 3.84) Licensed doses: OR = 2.99 (95% CrI = 1.78 to 5.00) | |
Secukinumab vs. etanercept | Armstrong et al. (2021)70 | Indirect evidence from NMA: OR = 8.42 (95% CrI = 6.22 to 11.46) |
Sbidian et al. (2021)71 | Direct evidence: RR = 2.32 (95% CI = 1.85 to 2.92) [1 RCT] Indirect evidence from NMA: RR = 2.40 (95% CI = 2.12 to 2.72) | |
Xu et al. (2021)72 | Indirect evidence from NMA: RR = 4.5 (95% CrI = 3.03 to 6.25) | |
Mahil et al. (2020)73 | Indirect evidence from NMA: All doses: OR = 4.51 (95% CI = 3.24 to 6.27) Licensed doses: OR = 5.27 (95% CI = 3.84 to 7.24) | |
Secukinumab vs. ustekinumab | Armstrong et al. (2021)70 | Indirect evidence from NMA: secukinumab vs. ustekinumab 90mg, OR = 2.01 (95% CrI = 1.50 to 2.74) secukinumab vs. ustekinumab 45mg, OR = 2.31 (95% CrI = 1.77 to 3.02) secukinumab vs. ustekinumab (weight-based dosing), OR = 2.21 (95% CrI = 1.77 to 2.72) |
Sbidian et al. (2021)71 | Direct evidence: RR = 1.40 (95% CI = 1.30 to 1.50) [2 RCTs]; I2 = 0% Indirect evidence from NMA: RR = 1.40 (95% CI = 1.31 to 1.49) | |
Xu et al. (2021)72 | Indirect evidence from NMA: RR = 2.23 (95% CrI = 1.54 to 2.98) | |
Mahil et al. (2020)73 | Indirect evidence from NMA: All doses: OR = 2.03 (95% CI = 1.46 to 2.81) Licensed doses: OR = 2.44 (95% CI = 1.80 to 3.32) | |
Ixekizumab vs. adalimumab | Armstrong et al. (2021)70 | Indirect evidence from NMA: OR = 3.58 (95% CrI = 2.67 to 4.74) |
Sbidian et al. (2021)71 | Indirect evidence from NMA: RR = 1.82 (95% CI = 1.63 to 2.04) | |
Xu et al. (2021)72 | Indirect evidence from NMA: RR = 4.35 (95% CrI = 2.5 to 7.69) | |
Mahil et al. (2020)73 | Indirect evidence from NMA: All doses: OR = 3.70 (95% CI = 2.23 to 6.12) Licensed doses: OR = 4.59 (95% CI = 2.77 to 7.60) | |
Ixekizumab vs. etanercept | Armstrong et al. (2021)70 | Indirect evidence from NMA: OR = 12.23 (95% CrI = 8.74 to 17.19) |
Sbidian et al. (2021)71 | Direct evidence: RR = 2.98 (95% CI = 2.24 to 3.98) [2 RCTs]; I2 = 76% Indirect evidence from NMA: RR = 3.02 (95% CI = 2.69 to 3.38) | |
Xu et al. (2021)72 | Indirect evidence from NMA: RR = 7.14 (95% CrI = 5.2 to 10) | |
Mahil et al. (2020)73 | Indirect evidence from NMA: All doses: OR = 7.26 (95% CI = 5.50 to 9.59) Licensed doses: OR = 8.10 (95% CI = 6.21 to 10.55) | |
Ixekizumab vs. ustekinumab | Armstrong et al. (2021)70 | Indirect evidence from NMA: ixekizumab vs. ustekinumab 90mg, OR = 2.93 (95% CrI = 2.11 to 4.11) ixekizumab b vs. ustekinumab 45mg, OR = 3.35 (95% CrI = 2.49 to 4.56) ixekizumab vs. ustekinumab (weight-based dosing), OR = 3.21 (95% CrI = 2.44 to 4.18) |
Sbidian et al. (2021)71 | Direct evidence: RR = 1.73 (95% CI = 1.41 to 2.12) [1 RCT] Indirect evidence from NMA: RR = 1.76 (95% CI = 1.56 to 1.98) | |
Xu et al. (2021)72 | Indirect evidence from NMA: RR = 3.60 (95% CrI = 2.47 to 5.21) | |
Mahil et al. (2020)73 | Indirect evidence from NMA: All doses: OR = 3.26 (95% CI = 2.36 to 4.51) Licensed doses: OR = 3.75 (95% CI = 2.74 to 5.14) | |
Brodalumab vs. adalimumab | Armstrong et al. (2021)70 | Indirect evidence from NMA: OR = 3.41 (95% CrI = 2.61 to 4.57) |
Sbidian et al. (2021)71 | Indirect evidence from NMA: RR = 1.32 (95% CI = 1.13 to 1.54) | |
Xu et al. (2021)72 | Indirect evidence from NMA: RR = 2.12 (95% CrI = 1.19 to 3.84) | |
Mahil et al. (2020)73 | Indirect evidence from NMA: All doses: OR = 1.95 (95% CI = 1.18 to 3.23) Licensed doses: OR = 3.25 (95% CI = 1.93 to 5.49) | |
Xue et al. (2020)74 | Indirect evidence from NMA: RR = 2.11 (95% CrI = 1.72 to 2.67) | |
Brodalumab vs. etanercept | Armstrong et al. (2021)70 | Indirect evidence from NMA: OR = 11.69 (95% CrI = 8.35 to 16.77) |
Sbidian et al. (2021)71 | Indirect evidence from NMA: RR = 2.19 (95% CI = 1.89 to 2.54) | |
Xu et al. (2021)72 | Indirect evidence from NMA: RR = 3.47 (95% CrI = 2.33 to 5.54) | |
Mahil et al. (2020)73 | Indirect evidence from NMA: All doses: OR = 3.84 (95% CI = 2.64 to 5.57) Licensed doses: OR = 5.74 (95% CI = 3.92 to 8.39) | |
Xue et al. (2020)74 | Indirect evidence from NMA: RR = 2.84 (95% CrI = 2.35 to 3.52) | |
Brodalumab vs. ustekinumab | Armstrong et al. (2021)70 | Indirect evidence from NMA: brodalumab vs. ustekinumab 90mg, OR = 2.80 (95% CrI = 2.00 to 4.06) brodalumab vs. ustekinumab 45mg, OR = 3.20 (95% CrI = 2.36 to 4.49) brodalumab vs. ustekinumab (weight-based dosing), OR = 3.06 (95% CrI = 2.39 to 3.99) |
Sbidian et al. (2021)71 | Direct evidence: RR = 1.27 (95% CI = 1.16 to 1.39) [2 RCTs]; I2 = 0% Indirect evidence from NMA: RR = 1.28 (95% CI = 1.17 to 1.39) | |
Xu et al. (2021)72 | Indirect evidence from NMA: RR = 1.73 (95% CrI = 1.24 to 2.48) | |
Mahil et al. (2020)73 | Indirect evidence from NMA: All doses: OR = 1.73 (95% CI = 1.31 to 2.27) Licensed doses: OR = 2.66 (95% CI = 2.06 to 3.44) | |
Xue et al. (2020)74 | Indirect evidence from NMA: brodalumab vs. ustekinumab 90mg, RR = 1.43 (95% CrI = 1.23 to 1.69) brodalumab vs. ustekinumab 45mg, RR = 1.62 (95% CrI = 1.43 to 1.86) | |
Risankizumab vs. adalimumab | Armstrong et al. (2021)70 | Indirect evidence from NMA: OR = 3.49 (95% CrI = 2.75 to 4.46) |
Sbidian et al. (2021)71 | Direct evidence: RR = 1.53 (95% CI = 1.33 to 1.75) [1 RCT] Indirect evidence from NMA: RR = 1.62 (95% CI = 1.44 to 1.81) | |
Xu et al. (2021)72 | Indirect evidence from NMA: RR = 3.84 (95% CrI = 2.0 to 7.14) | |
Mahil et al. (2020)73 | Indirect evidence from NMA: All doses: OR = 3.66 (95% CI = 2.10 to 6.37) Licensed doses: OR = 4.23 (95% CI = 2.39 to 7.48) | |
Risankizumab vs. etanercept | Armstrong et al. (2021)70 | Indirect evidence from NMA: OR = 11.96 (95% CrI = 8.60 to 16.86) |
Sbidian et al. (2021)71 | Indirect evidence from NMA: RR = 2.67 (95% CI = 2.33 to 3.07) | |
Xu et al. (2021)72 | Indirect evidence from NMA: RR = 6.25 (95% CrI = 3.70 to 10) | |
Mahil et al. (2020)73 | Indirect evidence from NMA: All doses: OR = 7.18 (95% CI = 4.69 to 11.01) Licensed doses: OR = 7.47 (95% CI = 4.83 to 11.54) | |
Risankizumab vs. ustekinumab | Armstrong et al. (2021)70 | Indirect evidence from NMA: risankizumab vs. ustekinumab 90mg, OR = 2.86 (95% CrI = 2.05 to 4.08) risankizumab vs. ustekinumab 45mg, OR = 3.27 (95% CrI = 2.43 to 4.50) risankizumab vs. ustekinumab (weight-based dosing), OR = 3.13 (95% CrI = 2.44 to 4.04) |
Sbidian et al. (2021)71 | Direct evidence: RR = 1.67 (95% CI = 1.43 to 1.93) [3 RCTs]; I2 = 0% Indirect evidence from NMA: RR = 1.56 (95% CI = 1.41 to 1.72) | |
Xu et al. (2021)72 | Indirect evidence from NMA: RR = 3.14 (95% CI = 2.05 to 4.68) | |
Mahil et al. (2020)73 | Indirect evidence from NMA: All doses: OR = 3.23(95% CI = 2.27 to 4.59) Licensed doses: OR = 3.46 (95% CI = 2.41 to 4.96) | |
Shi et al. (2020)75 | Direct evidence: Ustekinumab (weight-based dosing) vs risankizumab 150 mg, OR = 0.27 (95% CI = 0.16 to 0.45) [2 RCTs]; I2= 0% Ustekinumab (weight-based dosing) vs risankizumab 180 mg, OR = 0.15 (95% CI = 0.033 to 0.70) [1 RCT] Ustekinumab (weight-based dosing) vs risankizumab 18 mg, OR = 1.4 (95% CI = 0.37 to 0.5.1) [1 RCT] Ustekinumab (weight-based dosing) vs risankizumab 90 mg, OR = 0.24 (95% CI = 0.058 to 1.0) [1 RCT] Indirect evidence from NMA: Risankizumab 18 mg: vs. ustekinumab 45 mg, OR = 0.41 (95%CrI = 0.0039 to 4.3) vs. ustekinumab 90 mg, OR = 0.28 (95%CrI = 0.025 to 2.9) vs. ustekinumab weight-based dosing, OR = 0.63 (95%CrI = 0.11 to 3.6) Risankizumab 75 mg: vs. ustekinumab 45 mg, OR = 1.4 (95%CrI = 0.20 to 9.9) vs. ustekinumab 90 mg, OR = 0.96 (95%CrI = 0.13 to 6.8) vs. ustekinumab weight-based dosing, OR = 2.2 (95%CrI = 0.29 to 16) Risankizumab 90 mg: vs. ustekinumab 45 mg, OR = 15 (95%CrI = 0.81 to 6.8e+02) vs. ustekinumab 90 mg, OR = 10 (95%CrI = 0.52 to 4.8e+02) vs. ustekinumab weight-based dosing, OR = 2.2 (95%CrI = 2.0 to 8.1e+02) Risankizumab 150 mg: vs. ustekinumab 45 mg, OR = 2.2 (95%CrI = 0.58 to 8.4) vs. ustekinumab 90 mg, OR = 1.5 (95%CrI =0.37 to 5.9) vs. ustekinumab weight-based dosing, OR = 3.4 (95%CrI = 1.2 to 10) Risankizumab 180mg: vs. ustekinumab 45 mg, OR = 1.9 (95%CrI =0.17 to 23) vs. ustekinumab 90 mg, OR = 1.3 (95%CrI = 0.11 to 16) vs. ustekinumab weight-based dosing, OR = 2.9(95%CrI = 0.46 to 20) | |
Long-term treatment (48 to 52 weeks) | ||
Secukinumab vs. adalimumab | Armstrong et al. (2021)70 | Indirect evidence from NMA: OR = 1.91 (95% CrI = 1.35 to 2.71) |
Yasmeen et al. (2020)76 | Indirect evidence from NMA: Analysis 1: RR = 1.29 (95% CrI = 1.09 to 1.76) Analysis 2: RR = 1.32 (95% CrI = 1.11 to 1.79) | |
Secukinumab vs. etanercept | Armstrong et al. (2021)70 | Indirect evidence from NMA: OR = 3.34 (95% CrI = 2.54 to 4.41) |
Yasmeen et al. (2020)76 | Indirect evidence from NMA: Analysis 1: RR = 1.76 (95% CrI = 1.31 to 2.71) Analysis 2: RR = 1.74 (95% CrI = 1.31 to 2.61) | |
Secukinumab vs. ustekinumab | Armstrong et al. (2021)70 | Indirect evidence from NMA: secukinumab vs. ustekinumab (weight-based dosing), OR = 1.66 (95% CrI = 1.42 to 1.95) |
Yasmeen et al. (2020)76 | Indirect evidence from NMA: Analysis 1: RR = 1.22 (95% CrI = 1.08 to 1.49) Analysis 2: RR = 1.25 (95% CrI = 1.1to 1.53) | |
Sbidian et al. (2021)71 | Direct evidence: RR = 1.23 (95% CI = 1.15 to 1.31) [2 RCTs]; I2 = 0% Indirect evidence from NMA: NR | |
Ixekizumab vs. adalimumab | Armstrong et al. (2021)70 | Indirect evidence from NMA: OR = 2.43 (95% CrI = 1.37 to 4.33) |
Yasmeen et al. (2020)76 | Indirect evidence from NMA: Analysis 1: RR = 1.37 (95% CrI = 1.08 to 2.09) Analysis 2: RR = 1.4 (95% CrI = 1.12 to 2.06) | |
Ixekizumab vs. etanercept | Armstrong et al. (2021)70 | Indirect evidence from NMA: OR = 4.24 (95% CrI = 2.51 to 7.26) |
Yasmeen et al. (2020)76 | Indirect evidence from NMA: Analysis 1: RR = 1.87 (95% CrI = 1.32 to 3.24) Analysis 2: RR = 1.85 (95% CrI = 1.33 to 3.02) | |
Ixekizumab vs. ustekinumab | Armstrong et al. (2021)70 | Indirect evidence from NMA: ixekizumab vs. ustekinumab (weight-based dosing), OR = 2.11 (95% CrI = 1.39 to 3.26) |
Yasmeen et al. (2020)76 | Indirect evidence from NMA: Analysis 1: RR = 1.3 (95% CrI = 1.11 to 1.7) Analysis 2: RR = 1.33 (95% CrI = 1.13 to 1.73) | |
Sbidian et al. (2021)71 | Direct evidence: RR = 1.30 (95% CI = 1.11 to 1.52) [1 RCT] Indirect evidence: NR | |
Brodalumab vs. adalimumab | Armstrong et al. (2021)70 | Indirect evidence from NMA: OR = 3.49 (95% CrI = 2.21 to 5.52) |
Yasmeen et al. (2020)76 | Indirect evidence from NMA: Analysis 1: RR = 1.51 (95% CrI = 1.17 to 2.37) Analysis 2: RR = 1.53 (95% CrI = 1.18 to 2.38) | |
Brodalumab vs. etanercept | Armstrong et al. (2021)70 | Indirect evidence from NMA: OR = 6.09 (95% CrI = 4.07 to 9.16) |
Yasmeen et al. (2020)76 | Indirect evidence from NMA: Analysis 1: RR = 2.05 (95% CrI = 1.39 to 3.72) Analysis 2: RR = 2.02 (95% CrI = 1.39 to 3.52) | |
Brodalumab vs. ustekinumab | Armstrong et al. (2021)70 | Indirect evidence from NMA: brodalumab vs. ustekinumab (weight-based dosing), OR = 3.03 (95% CrI = 2.37 to 3.92) |
Yasmeen et al. (2020)76 | Indirect evidence from NMA: Analysis 1: RR = 1.43 (95% CrI = 1.18 to 1.92) Analysis 2: RR = 1.46 (95% CrI = 1.19 to 1.97) | |
Risankizumab vs. adalimumab | Armstrong et al. (2021)70 | Indirect evidence from NMA: OR = 5.48 (95% CrI = 3.49 to 8.61) |
Yasmeen et al. (2020)76 | Indirect evidence from NMA: Analysis 1: RR = 1.6 (95% CrI = 1.2 to 2.63) Analysis 2: RR = 1.62 (95% CrI = 1.21 to 2.61) | |
Risankizumab vs. etanercept | Armstrong et al. (2021)70 | Indirect evidence from NMA: OR = 9.56 (95% CrI = 6.46 to 14.28) |
Yasmeen et al. (2020)76 | Indirect evidence from NMA: Analysis 1: RR = 2.18 (95% CrI = 1.43 to 4.14) Analysis 2: RR = 2.13 (95% CrI = 1.42 to 3.86) | |
Risankizumab vs. ustekinumab | Armstrong et al. (2021)70 | Indirect evidence from NMA: risankizumab vs. ustekinumab (weight-based dosing), OR = 4.76 (95% CrI = 3.64 to 6.29) |
Yasmeen et al. (2020)76 | Indirect evidence from NMA: Analysis 1: RR = 1.52 (95% CrI = 1.2 to 2.15) Analysis 2: RR = 1.54 (95% CrI = 1.22 to 2.17) | |
Sbidian et al. (2021)71 | Direct evidence: RR = 1.73 (95% CrI = 1.46 to 2.05) [2 RCTs]; I2= 20% Indirect evidence from NMA: NR | |
CI = confidence interval; CrI = credible interval; NMA = network meta-analysis; OR = odds ratio; PASI = Psoriasis Area Severity Index; RCT = randomized controlled trial; RR = risk ratio.
Notes: Direct evidence for pairwise comparisons may have been reported by more than 1 systematic review, but are only presented once in the table, to avoid reporting results in duplicate (where possible).
A value > 1 favours the first drug.
For studies from Yasmeen et al. (2020),76 analysis 1 indicates an analysis of studies with comparative evidence at 52 weeks, and analysis 2 indicates analysis of long-term extension studies and induction phase results for placebo patients who switched to active therapy in long-term extension phase.
Table 9: Summary of PASI 100 Results
Comparison | Study citation and study design | Treatment response |
|---|---|---|
Short -term treatment (up to 16 or 24 weeks) | ||
Secukinumab vs. adalimumab | Armstrong et al. (2021)70 | Indirect evidence from NMA: OR = 2.62 (95% CrI = 2.00 to 3.40) |
Xue et al. (2020)74 | Indirect evidence from NMA: RR = 2.47 (95% CrI = 1.75 to 3.51) | |
Secukinumab vs. etanercept | Armstrong et al. (2021)70 | Indirect evidence from NMA: OR = 11.52 (95% CrI = 8.03 to 16.66) |
Xue et al. (2020)74 | Indirect evidence from NMA: RR = 3.86 (95% CrI = 2.93 to 5.12) | |
Secukinumab vs. ustekinumab | Armstrong et al. (2021)70 | Indirect evidence from NMA: secukinumab vs. ustekinumab 90mg, OR = 2.09 (95% CrI = 1.53 to 2.92) secukinumab vs. ustekinumab 45mg, OR = 2.43 (95% CrI = 1.83 to 3.27) secukinumab vs. ustekinumab (weight-based dosing), OR = 2.32 (95% CrI = 1.84 to 2.90) |
Xue et al. (2020)74 | Indirect evidence from NMA: secukinumab vs. ustekinumab 90mg, RR = 1.32 (95% CrI = 0.99 to 1.76) secukinumab vs. ustekinumab 45mg, RR = 1.63 (95% CrI = 1.28 to 2.05) | |
Ixekizumab vs. adalimumab | Armstrong et al. (2021)70 | Indirect evidence from NMA: OR = 3.78 (95% CrI = 2.80 to 5.05) |
Xue et al. (2020)74 | Indirect evidence from NMA: RR = 3.56 (95% CrI = 2.61 to 4.98) | |
Ixekizumab vs. etanercept | Armstrong et al. (2021)70 | Indirect evidence from NMA: OR = 16.60 (95% CrI = 11.31 to 24.53) |
Xue et al. (2020)74 | Indirect evidence from NMA: RR = 5.57 (95% CrI = 4.42 to 7.18) | |
Ixekizumab vs. ustekinumab | Armstrong et al. (2021)70 | Indirect evidence from NMA: ixekizumab vs. ustekinumab 90mg, OR = 3.02 (95% CrI = 2.15 to 4.32) ixekizumab vs. ustekinumab 45mg, OR = 3.51 (95% CrI = 2.58 to 4.85) ixekizumab vs. ustekinumab (weight-based dosing), OR = 3.35 (95% CrI = 2.52 to 4.39) |
Xue et al. (2020)74 | Indirect evidence from NMA: ixekizumab vs. ustekinumab 90mg, RR = 1.91 (95% CrI = 1.48 to 2.48) ixekizumab vs. ustekinumab 45mg, RR = 2.35 (95% CrI = 1.91 to 2.9) | |
Brodalumab vs. adalimumab | Armstrong et al. (2021)70 | Indirect evidence from NMA: OR = 3.62 (95% CrI = 2.74 to 4.86) |
Xue et al. (2020)74 | Indirect evidence from NMA: RR = 3.48 (95% CrI = 2.52 to 5.0) | |
Brodalumab vs. etanercept | Armstrong et al. (2021)70 | Indirect evidence from NMA: OR = 15.90 (95% CrI = 10.83 to 23.92) |
Xue et al. (2020)74 | Indirect evidence from NMA: RR = 5.43 (95% CrI = 4.09 to 7.51) | |
Brodalumab vs. ustekinumab | Armstrong et al. (2021)70 | Indirect evidence from NMA: brodalumab vs. ustekinumab 90mg, OR = 2.89 (95% CrI = 2.04 to 4.26) brodalumab vs. ustekinumab 45mg, OR = 3.36 (95% CrI = 2.45 to 4.78) brodalumab vs. ustekinumab (weight-based dosing), OR = 3.20 (95% CrI = 2.48 to 4.19) |
Xue et al. (2020)74 | Indirect evidence from NMA: brodalumab vs. ustekinumab 90mg, OR = 1.85 (95% CrI = 1.45 to 2.48) brodalumab vs. ustekinumab 45mg, OR = 2.29 (95% CrI = 1.86 to 2.88) | |
Risankizumab vs. adalimumab | Armstrong et al. (2021)70 | Indirect evidence from NMA: OR = 3.69 (95% CrI = 2.89 to 4.76) |
Risankizumab vs. etanercept | Armstrong et al. (2021)70 | Indirect evidence from NMA: OR = 16.26 (95% CrI = 11.13 to 24.11) |
Risankizumab vs. ustekinumab | Armstrong et al. (2021)70 | Indirect evidence from NMA: risankizumab vs. ustekinumab 90mg, OR = 2.95 (95% CrI = 2.09 to 4.29) risankizumab vs. ustekinumab 45mg, OR = 3.43 (95% CrI = 2.52 to 4.80) risankizumab vs. ustekinumab (weight-based dosing), OR = 3.27 (95% CrI = 2.53 to 4.25) |
Long-term treatment (48 to 52 weeks) | ||
secukinumab vs. adalimumab | Armstrong et al. (2021)70 | Indirect evidence from NMA: OR = 1.93 (95% CrI = 1.34 to 2.81) |
Yasmeen et al. (2020)76 | Indirect evidence from NMA: Analysis 1: RR = 1.53 (95% CrI = 1.17 to 2.33) Analysis 2: RR = 1.57 (95% CrI = 1.21 to 2.36) | |
Secukinumab vs. etanercept | Armstrong et al. (2021)70 | Indirect evidence from NMA: OR = 3.53 (95% CrI = 2.62 to 4.84) |
Yasmeen et al. (2020)76 | Indirect evidence from NMA: Analysis 1: RR = 2.46 (95% CrI = 1.66 to 4.2) Analysis 2: RR = 2.4 (95% CrI = 1.65 to 3.9) | |
Secukinumab vs. ustekinumab | Armstrong et al. (2021)70 | Indirect evidence from NMA: OR = 1.67 (95% CrI = 1.43 to 1.95) |
Yasmeen et al. (2020)76 | Indirect evidence from NMA: Analysis 1: RR = 1.4 (95% CrI = 1.16 to 1.88) Analysis 2: RR = 1.45 (95% CrI = 1.2 to 1.83) | |
Ixekizumab vs. adalimumab | Armstrong et al. (2021)70 | Indirect evidence from NMA: OR = 2.43 (95% CrI = 1.37 to 4.34) |
Yasmeen et al. (2020)76 | Indirect evidence from NMA: Analysis 1: RR = 1.72 (95% CrI = 1.16 to 3.08) Analysis 2: RR = 1.76 (95% CrI = 1.25 to 2.94) | |
Ixekizumab vs. etanercept | Armstrong et al. (2021)70 | Indirect evidence from NMA: OR = 4.45 (95% CrI = 2.60 to 7.66) |
Yasmeen et al. (2020)76 | Indirect evidence from NMA: Analysis 1: RR = 2.75 (95% CrI = 1.66 to 5.62) Analysis 2: RR = 2.67 (95% CrI = 1.71 to 4.93) | |
Ixekizumab vs. ustekinumab | Armstrong et al. (2021)70 | Indirect evidence from NMA: OR = 2.10 (95% CrI = 1.40 to 3.16) |
Yasmeen et al. (2020)76 | Indirect evidence from NMA: Analysis 1: RR = 1.57 (95% CrI = 1.21 to 2.27) Analysis 2: RR = 1.62 (95% CrI = 1.27 to 2.29) | |
Brodalumab vs. adalimumab | Armstrong et al. (2021)70 | Indirect evidence from NMA: OR = 3.42 (95% CrI = 2.16 to 5.49) |
Yasmeen et al. (2020)76 | Indirect evidence from NMA: Analysis 1: RR = 2.04 (95% CrI = 1.37 to 3.76) Analysis 2: RR = 2.06 (95% CrI = 1.39 to 3.7) | |
Brodalumab vs. etanercept | Armstrong et al. (2021)70 | Indirect evidence from NMA: OR = 6.26 (95% CrI = 4.12 to 9.60) |
Yasmeen et al. (2020)76 | Indirect evidence from NMA: Analysis 1: RR = 3.27 (95% CrI = 1.9 to 6.92) Analysis 2: RR = 3.13 (95% CrI = 1.87 to 6.27) | |
Brodalumab vs. ustekinumab | Armstrong et al. (2021)70 | Indirect evidence from NMA: OR = 2.96 (95% CrI = 2.35 to 3.73) |
Yasmeen et al. (2020)76 | Indirect evidence from NMA: Analysis 1: RR = 1.87 (95% CrI = 1.42 to 2.71) Analysis 2: RR = 1.91 (95% CrI = 1.43 to 2.78) | |
Risankizumab vs. adalimumab | Armstrong et al. (2021)70 | Indirect evidence from NMA: OR = 5.14 (95% CrI = 3.29 to 8.13) |
Yasmeen et al. (2020)76 | Indirect evidence from NMA: Analysis 1: RR = 2.28 (95% CrI = 1.47 to 4.44) Analysis 2: RR = 2.28 (95% CrI = 1.49 to 4.27) | |
Risankizumab vs. etanercept | Armstrong et al. (2021)70 | Indirect evidence from NMA: risankizumab vs. etanercept, OR = 9.40 (95% CrI = 6.30 to 14.23) |
Yasmeen et al. (2020)76 | Indirect evidence from NMA: Analysis 1: RR = 3.66 (95% CrI = 2.03 to 8.26) Analysis 2: RR = 3.47 (95% CrI = 1.98 to 7.29) | |
Risankizumab vs. ustekinumab | Armstrong et al. (2021)70 | Indirect evidence from NMA: OR = 4.44 (95% CrI = 3.49 to 5.68) |
Yasmeen et al. (2020)76 | Indirect evidence from NMA: Analysis 1: RR = 2.1 (95% CrI = 1.5 to 3.28) Analysis 2: RR = 2.11 (95% CrI = 1.51 to 3.26) | |
CI = confidence interval; CrI = credible interval; NMA = network meta-analysis; OR = odds ratio; PASI = Psoriasis Area Severity Index; RCT = randomized controlled trial; RR = risk ratio.
Notes: Direct evidence for pairwise comparisons may have been reported by more than 1 systematic review, but are only presented once in the table, to avoid reporting results in duplicate (where possible).
A value > 1 favours the first drug.
For studies from Yasmeen et al. (2020),76 analysis 1 indicates an analysis of studies with comparative evidence at 52 weeks, and analysis 2 indicates analysis of long-term extension studies and induction phase results for placebo patients who switched to active therapy in long-term extension phase.
Acknowledgments: Kevin Peter, Aneeka Hafeez, Bernice Tsoi
ISSN: 2563-6596
Disclaimer: The information in this document is intended to help Canadian health care decision-makers, health care professionals, health systems leaders, and policy-makers make well-informed decisions and thereby improve the quality of health care services. While patients and others may access this document, the document is made available for informational purposes only and no representations or warranties are made with respect to its fitness for any particular purpose. The information in this document should not be used as a substitute for professional medical advice or as a substitute for the application of clinical judgment in respect of the care of a particular patient or other professional judgment in any decision-making process. The Canadian Agency for Drugs and Technologies in Health (CADTH) does not endorse any information, drugs, therapies, treatments, products, processes, or services.
While care has been taken to ensure that the information prepared by CADTH in this document is accurate, complete, and up-to-date as at the applicable date the material was first published by CADTH, CADTH does not make any guarantees to that effect. CADTH does not guarantee and is not responsible for the quality, currency, propriety, accuracy, or reasonableness of any statements, information, or conclusions contained in any third-party materials used in preparing this document. The views and opinions of third parties published in this document do not necessarily state or reflect those of CADTH.
CADTH is not responsible for any errors, omissions, injury, loss, or damage arising from or relating to the use (or misuse) of any information, statements, or conclusions contained in or implied by the contents of this document or any of the source materials.
This document may contain links to third-party websites. CADTH does not have control over the content of such sites. Use of third-party sites is governed by the third-party website owners’ own terms and conditions set out for such sites. CADTH does not make any guarantee with respect to any information contained on such third-party sites and CADTH is not responsible for any injury, loss, or damage suffered as a result of using such third-party sites. CADTH has no responsibility for the collection, use, and disclosure of personal information by third-party sites.
Subject to the aforementioned limitations, the views expressed herein are those of CADTH and do not necessarily represent the views of Canada’s federal, provincial, or territorial governments or any third-party supplier of information.
This document is prepared and intended for use in the context of the Canadian health care system. The use of this document outside of Canada is done so at the user’s own risk.
This disclaimer and any questions or matters of any nature arising from or relating to the content or use (or misuse) of this document will be governed by and interpreted in accordance with the laws of the Province of Ontario and the laws of Canada applicable therein, and all proceedings shall be subject to the exclusive jurisdiction of the courts of the Province of Ontario, Canada.
The copyright and other intellectual property rights in this document are owned by CADTH and its licensors. These rights are protected by the Canadian Copyright Act and other national and international laws and agreements. Users are permitted to make copies of this document for non-commercial purposes only, provided it is not modified when reproduced and appropriate credit is given to CADTH and its licensors.
About CADTH: CADTH is an independent, not-for-profit organization responsible for providing Canada’s health care decision-makers with objective evidence to help make informed decisions about the optimal use of drugs, medical devices, diagnostics, and procedures in our health care system.
Funding: CADTH receives funding from Canada’s federal, provincial, and territorial governments, with the exception of Quebec.