CADTH Health Technology Review
Canadian Medical Imaging Inventory 2022–2023: SPECT and SPECT-CT
CMII Report
Abbreviations
AI
artificial intelligence
CDST
clinical decision support tool
CIHI
Canadian Institute for Health Information
CMII
Canadian Medical Imaging Inventory
FTE
full-time equivalent
MRT
medical radiation technologist
PACS
picture archiving and communication system
Key Messages
SPECT is a nuclear imaging technique that provides 3D information on functional and molecular processes in the body. SPECT has been integrated with CT to combine the imaging strengths of both modalities in SPECT-CT.
In total, 331 SPECT-CT units in 10 provinces and 210 SPECT units operating in 9 provinces were identified by the Canadian Medical Imaging Inventory (CMII) in its 2022–2023 national survey. There are no SPECT-CT and SPECT units operating in Yukon, Northwest Territories, and Nunavut.
Canada has 8.3 SPECT-CT units per million people and 5.3 SPECT units per million people. The greatest density of units per million people for SPECT-CT is in Newfoundland and Labrador and the greatest density for SPECT are in Alberta and New Brunswick.
The combined volume of SPECT-CT and SPECT exams conducted in 2022–2023 has decreased by approximately 37.5% since 2015, which is attributed to the gradual decommissioning of SPECT units and replacement of these technologies with other imaging modalities.
SPECT-CT is primarily used for oncology exams, followed by cardiology exams and musculoskeletal exams. SPECT is primarily used for cardiology exams, followed by oncology and musculoskeletal exams.
On average, SPECT-CT and SPECT units operate approximately 42 hours per week across jurisdictions in Canada that have capacity.
What Is the Context?
SPECT is a nuclear imaging technique that provides 3D information on functional and molecular processes in the body. SPECT has been integrated with CT to create a hybrid modality known as SPECT-CT. This hybrid imaging modality combines functional and anatomic imaging into a single session to provide complementary information and improve diagnostic accuracy.1,2 Although there is a distinct trend toward the replacement of SPECT with SPECT-CT, compared to the hybrid modality of PET-CT, the transition from SPECT to SPECT-CT has been slower in Canada.3
Radiopharmaceuticals are essential in SPECT-CT and SPECT imaging, and are used, with 1 or more gamma cameras, to detect radiation in specific organs, bones, or tissues.2 The type of radiopharmaceutical used depends on the diagnostic requirement, with different radiopharmaceuticals used for imaging different body parts.4 SPECT-CT and SPECT are primarily used to evaluate physiology and monitor oncological and cardiovascular disease, central nervous system disorders, and brain functions.5
Technological advances with cadmium zinc telluride (CZT) detectors and imaging reconstruction software continue to expand the applications of SPECT imaging.5 Artificial intelligence (AI) tools that improve the imaging analysis and efficiency, including enhancing spatial resolution, shortening scan times, and reducing radiotracer dose, further enable novel clinical applications with these imaging modalities.5,6 Ongoing developments in compact and portable SPECT-CT and SPECT systems may extend the accessibility of these modalities, especially in remote or underserved areas.2 As well, innovations in radiopharmaceuticals may expand the clinical applications of SPECT, leading to more targeted imaging and improving the early detection and monitoring of many conditions.2,6,7
The Canadian Medical Imaging Inventory (CMII) was created in 2015 to track, compare, and map trends over time related to the availability, distribution, technical specifications, and use of advanced imaging equipment in Canada (i.e., CT, MRI, PET-CT, PET-MRI, SPECT, and SPECT-CT). In 2001, CADTH’s predecessor (then the Canadian Coordinating Office for Health Technology Assessment) conducted its first inventory of diagnostic medical imaging technologies in Canada, and the Canadian Institute for Health Information (CIHI) continued this work from 2003 to 2012. 10-13 This is the fourth iteration of the CMII since CADTH resumed the collection of this data in 2015.
The CMII collects data through a survey conducted approximately once every 2 years and details the use of strategies for improving appropriate imaging, enhancing system efficiencies, reducing wait lists, and addressing other systemic challenges. Through this work, the CMII provides health care decision-makers with information on the imaging landscape in Canada that may be used to identify and address service and medical equipment gaps and inform strategic planning.
This report summarizes the SPECT- and SPECT-CT-related findings of the 2022–2023 national CMII survey.
What Did We Do?
The purpose of this CMII report is to document current practices and developments in the supply, distribution, technical operations, and general clinical use of SPECT and SPECT-CT across Canada. This report is part of a series of publications that CADTH has produced as part of the CMII national survey that also includes CT, MRI, and PET-CT and PET-MRI.
Why Did We Do This?
The CMII provides information on the medical imaging landscape across Canada to help support health care decision-making. Robust data are required to ensure health systems can deliver the imaging required to provide timely, safe, patient-centred care; improve health outcomes; and deliver health care efficiencies. Further details on the purpose of the CMII are provided in the Canadian Medical Imaging Inventory 2022–2023: Provincial and Territorial Overview report located on the CMII webpage.
Methods Overview
Data were collected on 6 imaging modalities, including SPECT-CT and SPECT, primarily using a web-based self-report survey that was sent to all identified health care facilities with advanced imaging equipment in Canada (refer to the Canadian Medical Imaging Inventory 2022–2023: Methods document located on the CMII webpage). Data were supplemented with information from provincial and territorial validators who are senior medical imaging–related health care decision-makers who are tasked with validating unit and exam counts for consistency. As well, data from peer reviewers, literature searches, CIHI, and previous iterations of CMII data were incorporated into the report. Both English and French versions of the survey were provided.
The CMII survey collected the following data:
number and location of imaging equipment
volume of exams
hours of equipment operation
age of imaging equipment
technical specifications of machines
adoption of new and emerging supportive tools and technologies
imaging storing and communication services.
The survey opened on May 5, 2023, and primary data collection and validator responses were collected up until October 31, 2023. The full data collection and analysis strategy, including survey development, respondent identification, sources of data used, and data validation procedures can be found in the Canadian Medical Imaging Inventory 2022–2023: Methods document located on the CMII webpage.
The CMII also presents data from all data sources relating to human resources, funding structures, ordering and referral practices, and the adoption of tools that may support appropriate imaging, system efficiencies, and wait list reductions.
Comparisons between data from Canada and data from other Organisation for Economic Co-operation and Development countries are reported, as are trends and projections on imaging capacity.
Provincial and territorial validators provided high-level information for nonresponding publicly funded health facilities. Data obtained from the previous survey iteration, and from other sources (e.g., personal communications, websites of health care facilities), were used to inform the status of the remaining sites. Data from freestanding sites with private imaging capacity supplemented data for public capacity; detailed information for private imaging facilities is limited because of the low number of survey responses.
The survey questions, full data collection, and analysis strategy, including survey development, respondent identification, sources of data used, and data validation procedures can be found in the Canadian Medical Imaging Inventory 2022–2023: Methods document on the CMII webpage. Definitions for the type of facility included in the survey are provided in Appendix 2.
Response Rate for the 2022–2023 National Survey
A total of 504 sites were invited to participate in the survey. Data on modalities and unit counts were available for 467 sites (92.7%).
A 100% participation rate was received from publicly funded facilities (i.e., hospitals) in 7 provinces and all territories. The participation rate for the remaining provinces ranged from 51% to 93% for publicly funded facilities.
A complete response rate was received for unit counts and exam volumes by provincial and territorial validators, while the response rate varied for other survey questions. A total of approximately 308 sites provided updated or new information (72%), reflecting an increased response rate of 34% since the CMII 2019–2020 survey.
While the overall survey participation rate was high, in some instances, not all survey questions were answered. This may lead to a nonresponse bias, which may result in the over generalization of some findings. To enable readers to assess representativeness of each data point, the number of sites who responded to each question are included alongside the reported data.
Provincial and territorial validators provided high-level information for nonresponding publicly funded health facilities. Data obtained from the previous survey iteration, and from other sources (e.g., personal communications, websites of health care facilities), were used to inform the status of the remaining sites. Data from freestanding sites with private imaging capacity supplemented data for public capacity; detailed information for private imaging facilities is limited due to the low number of survey responses.
The survey questions and full data collection and analysis strategy, including survey development, respondent identification, sources of data used, and data validation procedures can be found in the Canadian Medical Imaging Inventory 2022–2023: Methods document on the CMII webpage. Definitions for the type of facility included in the survey are provided in Appendix 2.
SPECT-CT and SPECT Imaging Facility Overview
Characteristics of Facilities With SPECT-CT and SPECT Equipment
A summary of the geographic distribution, type, location, and funding source for facilities in Canada with SPECT-CT or SPECT equipment that responded to the 2022–2023 update is provided subsequently.
Overall, 331 SPECT-CT units are distributed across 180 sites in all 10 provinces and no territories in Canada (Figure 1).
Overall, 210 SPECT units are distributed across 138 sites in 9 provinces and no territories in Canada (Figure 2).
Figure 1: Geographic Distribution of SPECT-CT Units in Canada, 2022–2023
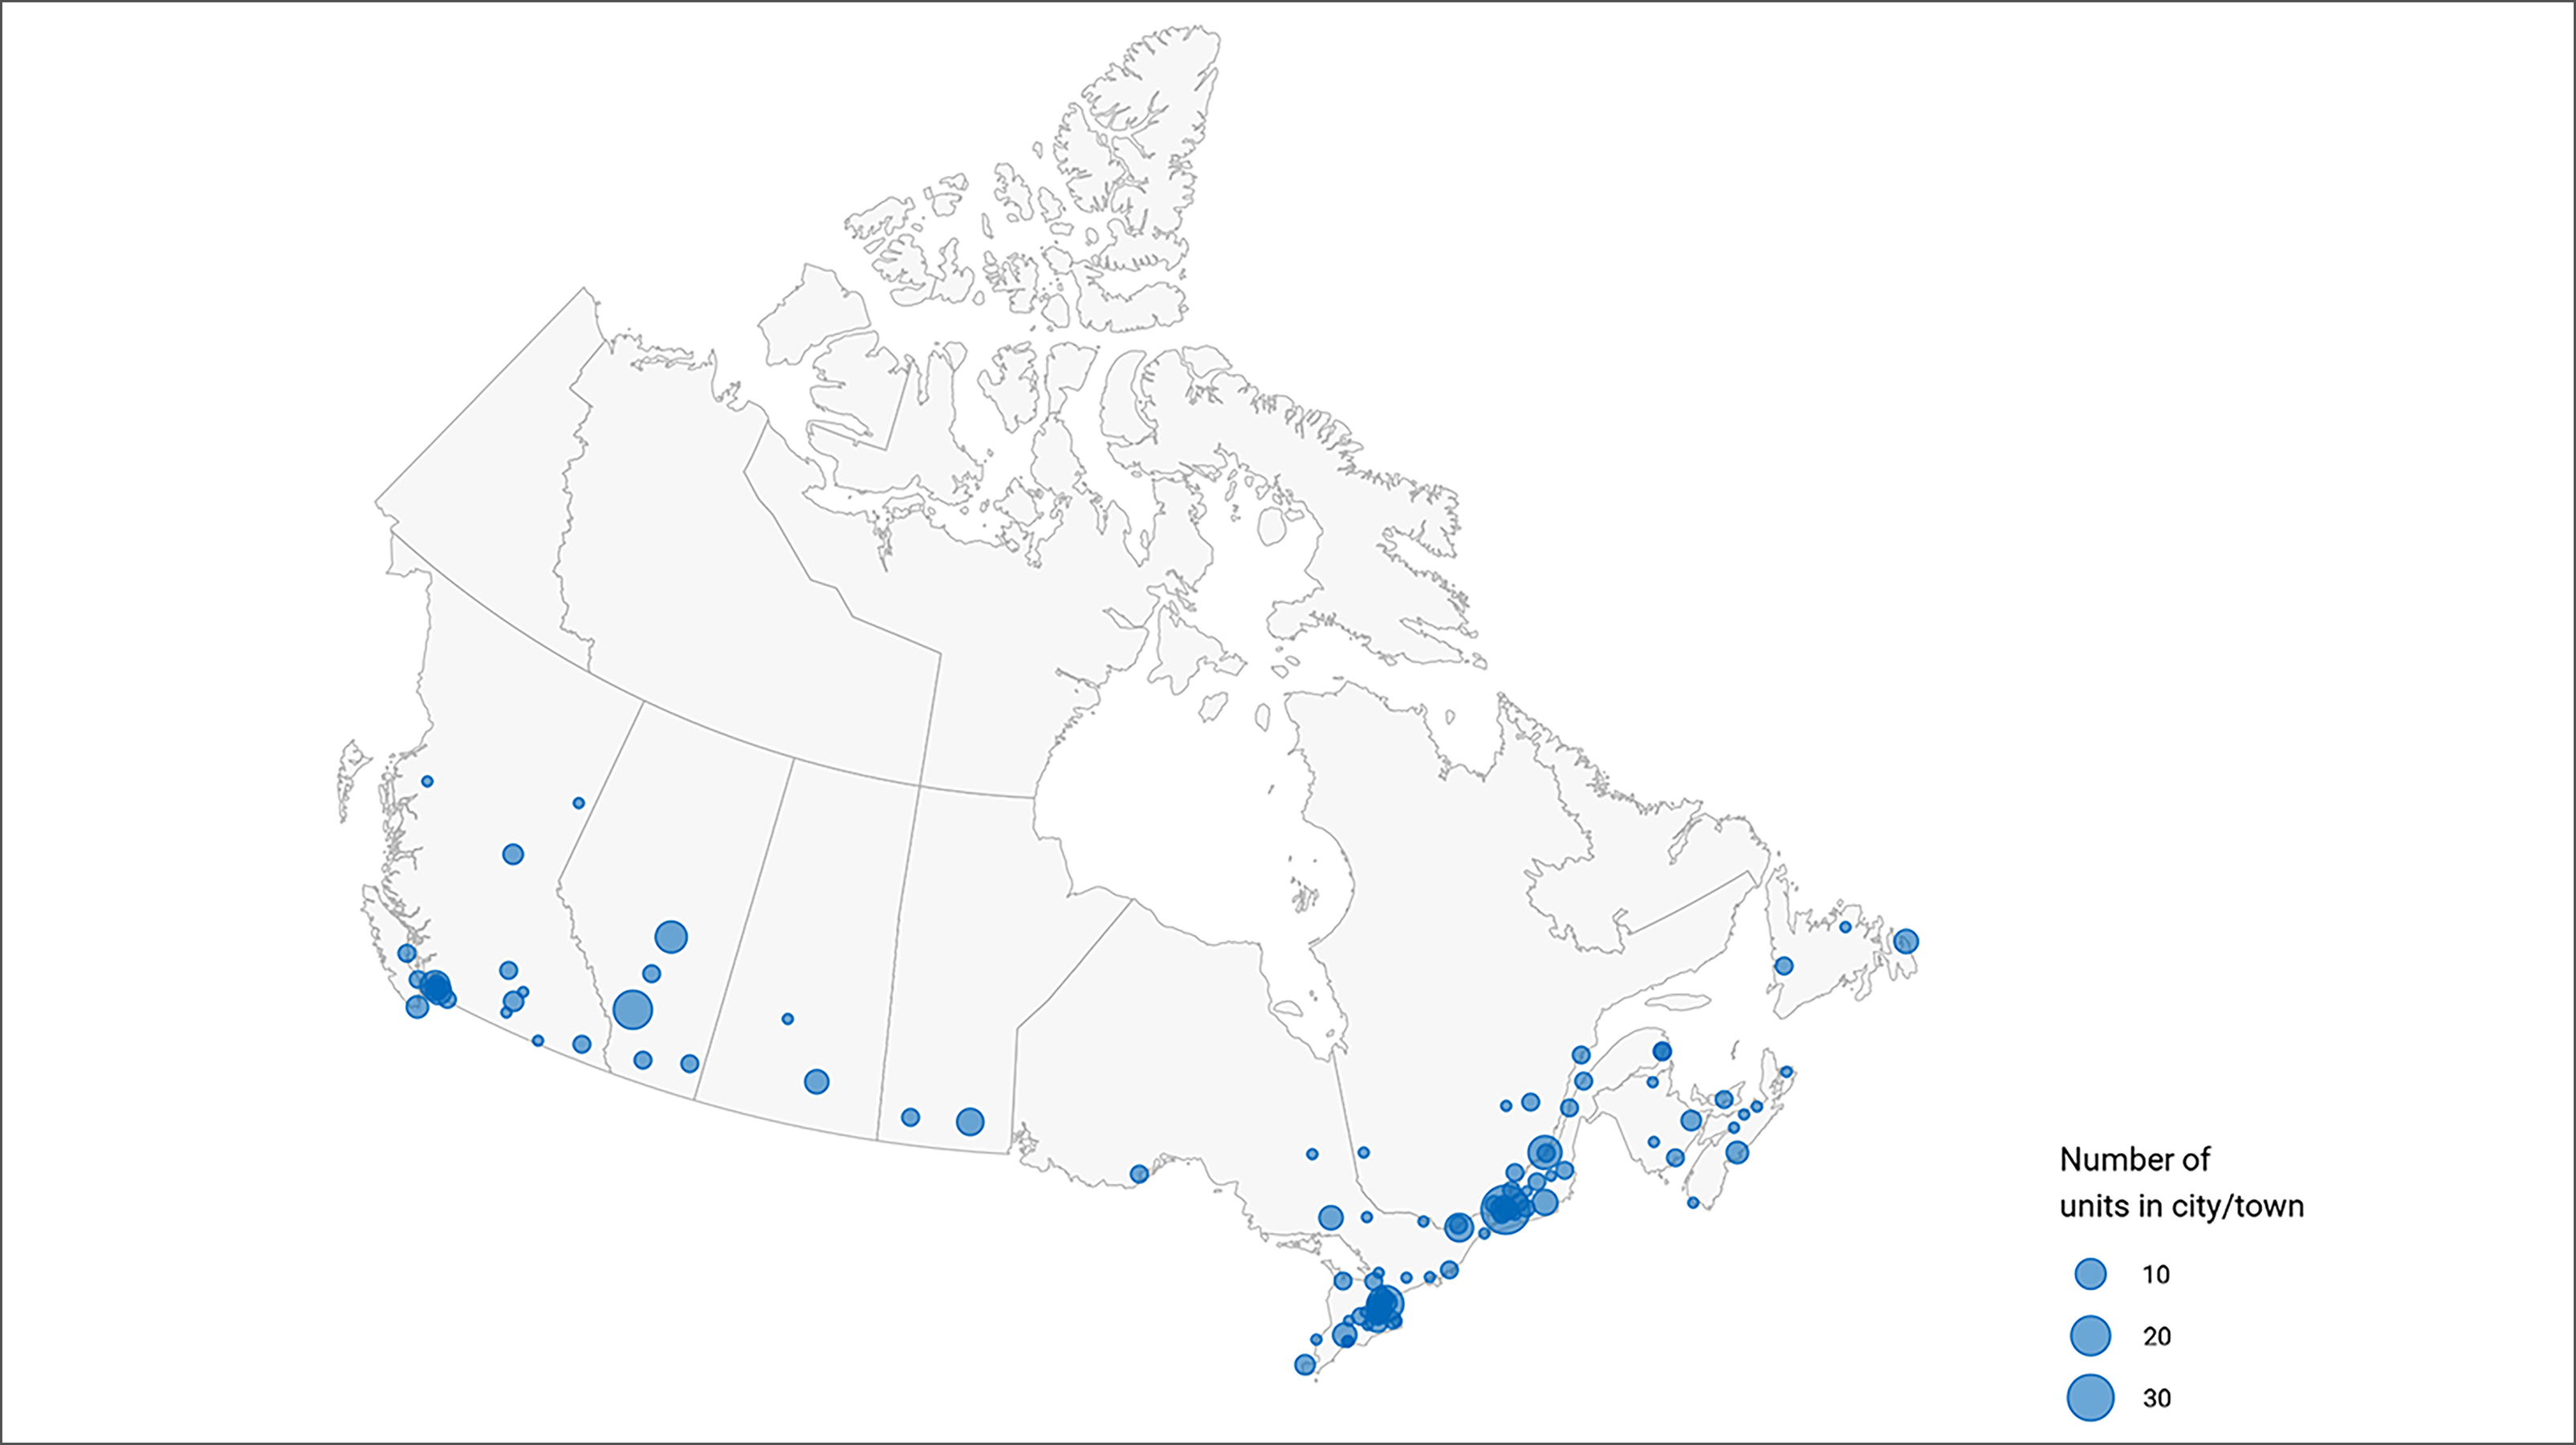
Notes: Location information is available for all units across all jurisdictions with SPECT-CT capacity.
Location was derived from the survey and validator data. Mobile units appear as 1 unit at each of the sites served.
Figure 2: Geographic Distribution of SPECT Units in Canada, 2022–2023
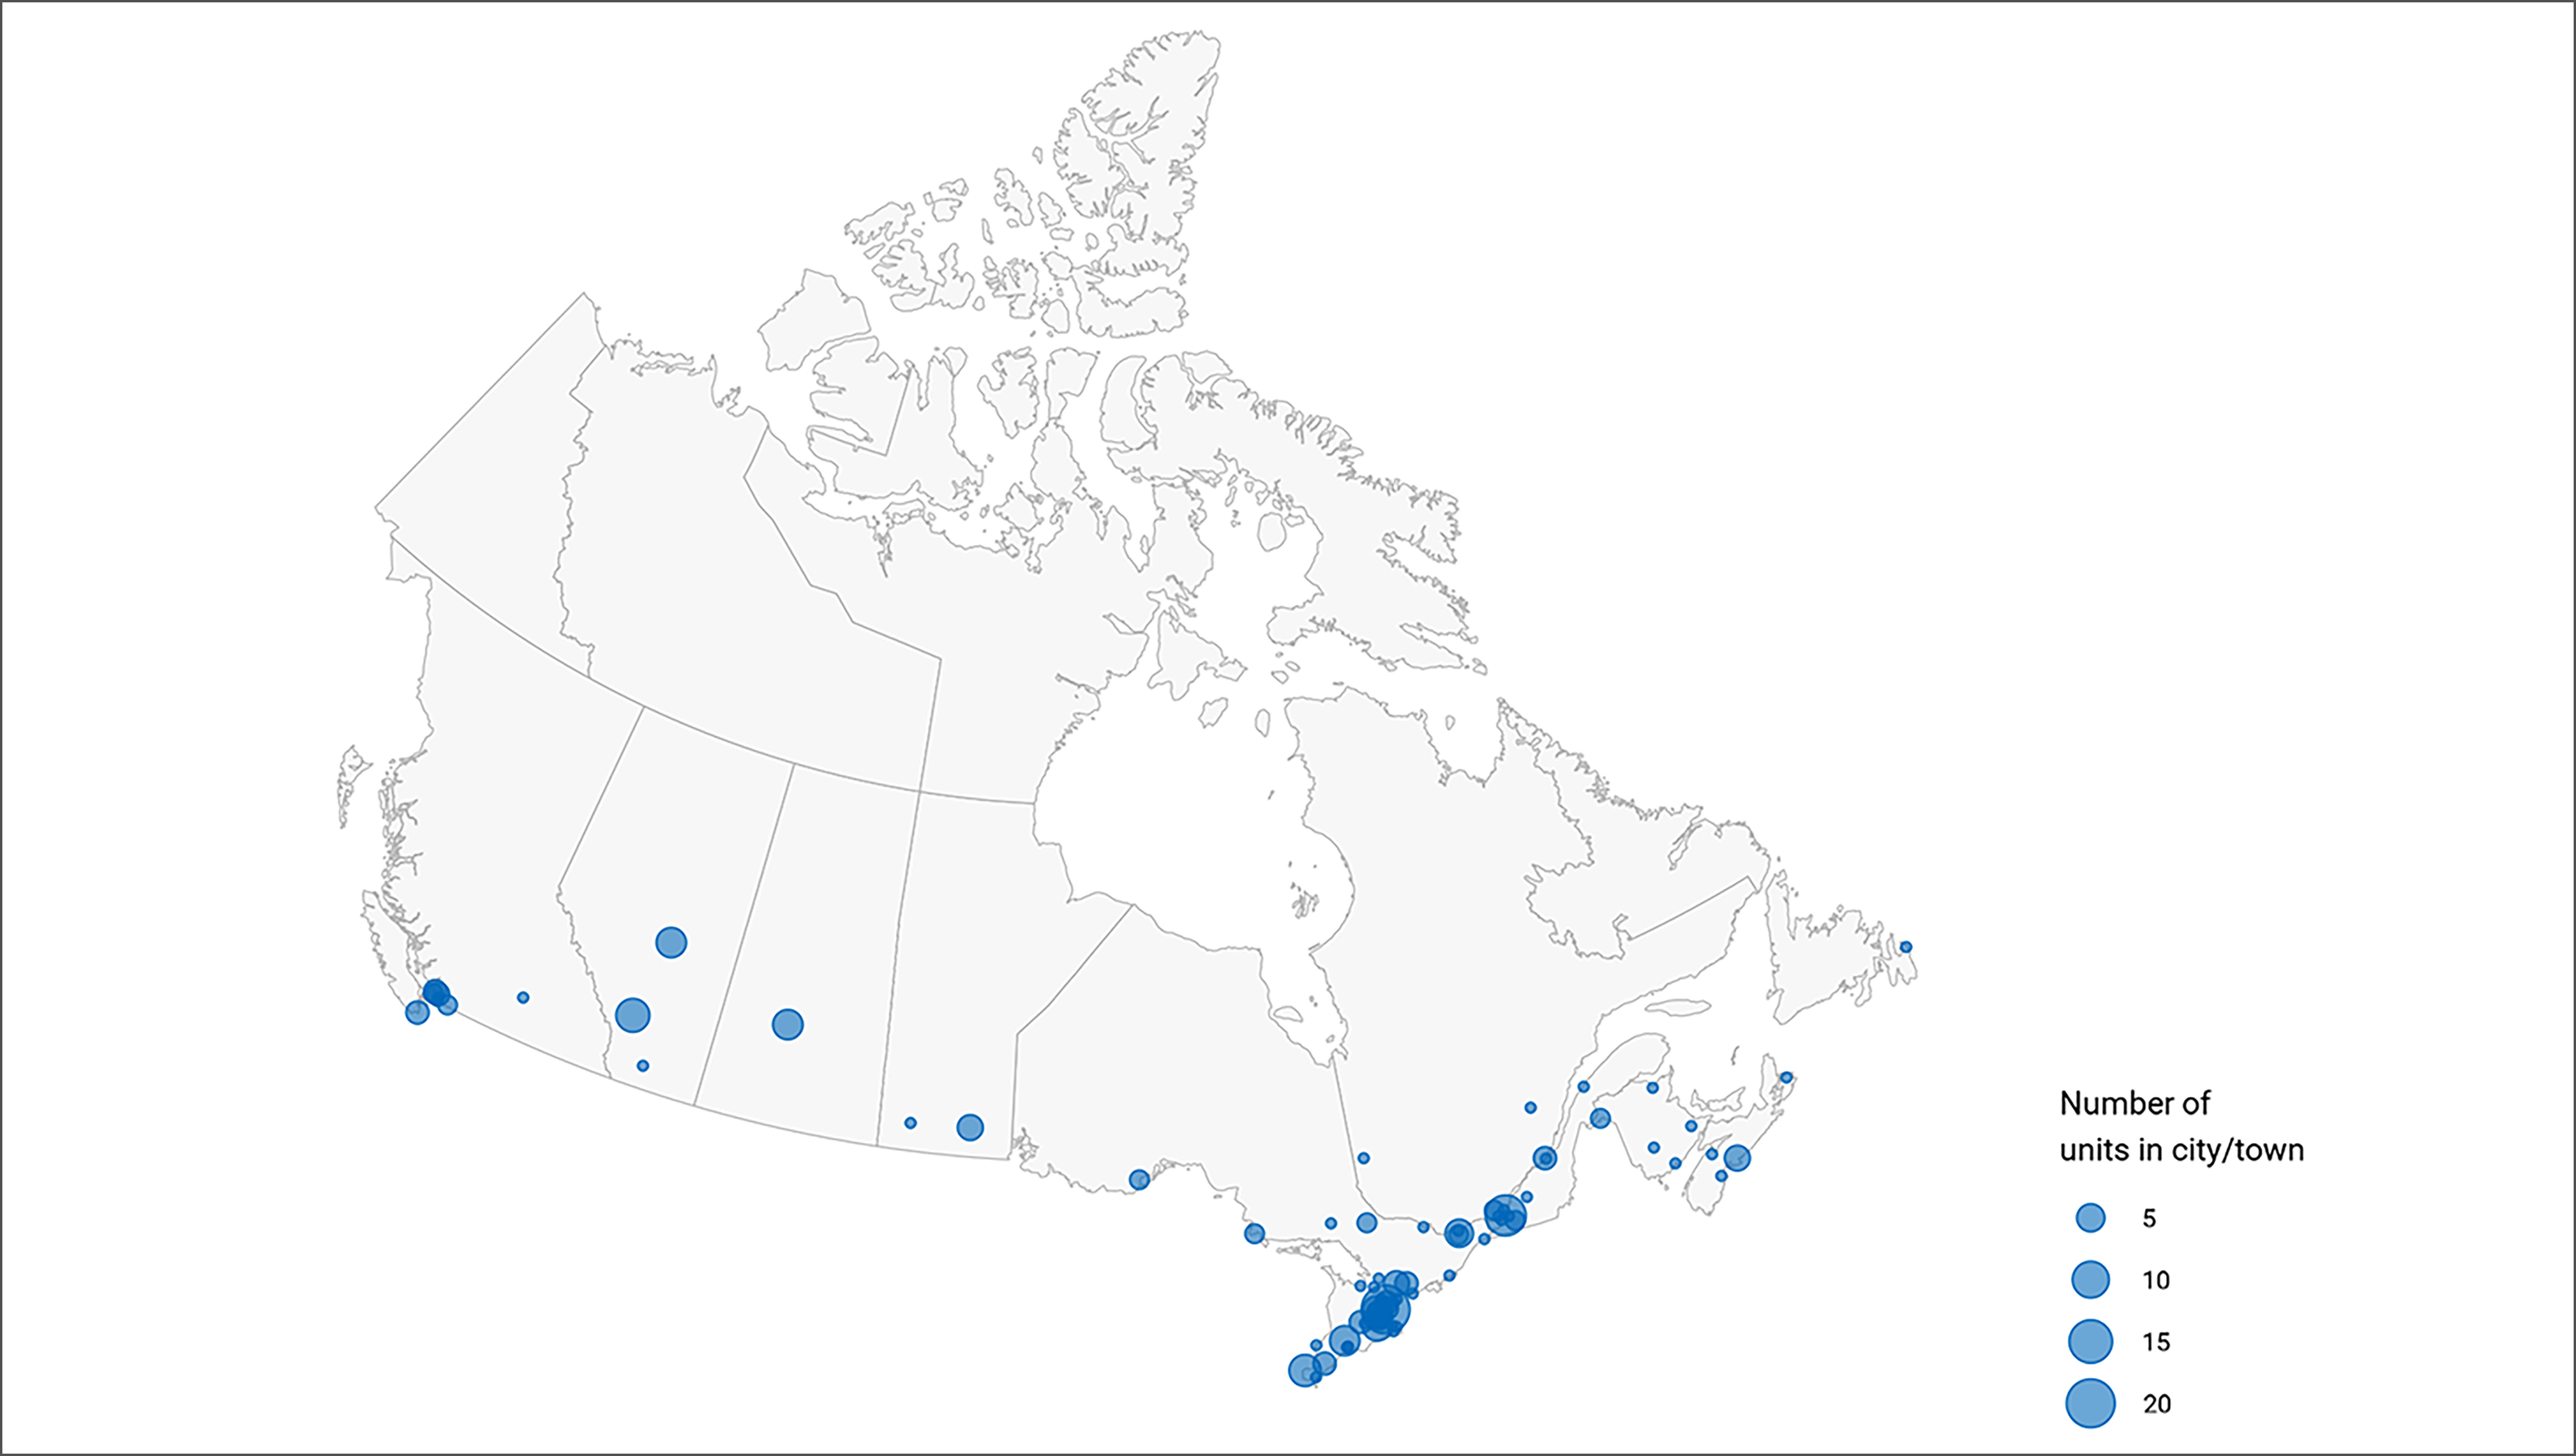
Notes: Location information is available for all units across all jurisdictions with SPECT capacity.
Location was derived from the survey and validator data. Mobile units appear as 1 unit at each of the sites served.
Location and Facility Characteristics of SPECT-CT Units
Overall, 87.9% of sites with SPECT-CT units were reported that operate in urban settings, while 12.1% reported rural operation (Appendix 3, Table 10). No SPECT-CT equipment operate in the Northwest Territories, Nunavut, or Yukon.
In total, 73.0% of sites with SPECT-CT units identified themselves as hospitals, 17.8% as tertiary care centres, 4.6% as private facilities, and 4.6% as community hospitals (Figure 3 and Appendix 3, Table 11). The data came from 152 sites with responses to this survey question. Definitions for the type of facility included in the survey are provided in Appendix 2.
Regarding funding, 96.5% of sites reported being publicly funded, 0.9% reported private funding, and 2.6% reported receiving funds from both public and private sources (Figure 4 and Appendix 3, Table 12). The data came from 114 sites that responded to this survey question.
Figure 3: Types of SPECT-CT Imaging Facilities in Canada, 2022–2023
![A treemap of the types of SPECT-CT imaging facilities in Canada, across provinces and territories, in 2022–2023. The proportion of sites that correspond to each facility type (hospital [73%], community [4.6%], tertiary [17.8%], or private [4.6%]) is displayed.](https://canjhealthtechnol.ca/index.php/cjht/article/download/HC0024-07/version/953/2075/8023/HC0024-007-fig03.png)
Notes: Survey response data were available for 152 out of 180 sites across all jurisdictions with SPECT-CT capacity.
Data were derived from the survey question: “What type of facility is this?”
Data summaries by province and territory are available in Appendix 3, Table 11.
Figure 3 presents the number of sites as proportions according to facility type of all reported sites. Survey responses for facility type from private sites were limited because of a low response rate.
Definitions for type of facility are provided in Appendix 2.
Figure 4: Sources of Funding for SPECT-CT Imaging Facilities, 2022–2023
![A treemap of the sources of funding for each SPECT-CT imaging facility, across provinces and territories, in 2022–2023. The proportion of sites that correspond to the funding source (public [96.5%], private [0.9%], or both [2.6%]) is displayed.](https://canjhealthtechnol.ca/index.php/cjht/article/download/HC0024-07/version/953/2075/8024/HC0024-007-fig04.png)
Notes: Survey response data were available for 114 out of 180 sites across all jurisdictions with SPECT-CT capacity.
Data were derived from the survey question: “How is this facility funded?”
Data summaries by province and territory are available in Appendix 3, Table 12.
Figure 4 presents the number of sites as proportions according to the funding source of all reported sites. Survey responses for funding source from private sites were limited because of a low response rate.
Location and Facility Characteristics of SPECT Units
Overall, 91.8% of sites with SPECT units indicated that they operate in urban settings, while 8.2% reported rural operation. No SPECT equipment operates in Prince Edward Island or the Northwest Territories, Nunavut, or Yukon. The data came from 98 sites with responses to this survey question.
In total, 61.7% of sites with SPECT units identified themselves as hospitals, 19.6% as tertiary care centres, 9.3% as private facilities, and 9.3% as community hospitals (Figure 5 and Appendix 3, Table 13). The data are from 107 sites with responses to this survey question. Definitions for the type of facility included in the survey are provided in Appendix 2.
Regarding funding, 97% of sites reported being publicly funded and 3% reported receiving funds from both public and private sources (Figure 6 and Appendix 3, Table 14). The data are from 67 sites that responded to this survey question.
Figure 5: Types of SPECT Imaging Facilities in Canada, 2022–2023
![A treemap of the types of SPECT imaging facilities in Canada, across provinces and territories, in 2022–2023. The proportion of sites that correspond to each facility type (hospital [61.7%], community [9.3%], tertiary [19.6%], or private [9.3%]) is displayed.](https://canjhealthtechnol.ca/index.php/cjht/article/download/HC0024-07/version/953/2075/8025/HC0024-007-fig05.png)
Notes: Survey response data were available for 107 out of 138 sites across all jurisdictions with SPECT capacity.
Data were derived from the survey question: “What type of facility is this?”
Data summaries by province and territory are available in Appendix 3, Table 13.
Figure 5 presents the number of sites as proportions according to facility type of all reported sites. Survey responses for facility type from private sites were limited because of a low response rate.
Definitions for type of facility are provided in Appendix 2.
Figure 6: Sources of Funding for SPECT Imaging Facilities, 2022–2023
![A treemap of the sources of funding for each SPECT imaging facility, across provinces and territories, in 2022–2023. The proportion of sites that correspond to the funding source (public [97%] or both public and private [3.0%]) is displayed.](https://canjhealthtechnol.ca/index.php/cjht/article/download/HC0024-07/version/953/2075/8026/HC0024-007-fig06.png)
Notes: Survey response data were available for 67 out of 138 sites across all jurisdictions with SPECT capacity.
Data were derived from the survey question: “How is this facility funded?”
Data summaries by province and territory are available in Appendix 3, Table 14.
Figure 6 presents the number of sites as proportions according to the funding source of all reported sites. Survey responses for funding source from private sites were limited because of a low response rate.
Inventory of SPECT-CT and SPECT Imaging Equipment
SPECT-CT Unit and Exams in 2022–2023
Total Number of SPECT-CT Units in 2022–2023
A total of 331 SPECT-CT units are reported for 2022–2023, an increase from the 271 units reported in 2019–20203 (Table 1 and Figure 7):
The provinces with the highest number of SPECT-CT units are Quebec and Ontario, with 107 and 92 units, respectively. No SPECT-CT units operate in the Northwest Territories, Nunavut, or Yukon.
Canada has 8.3 SPECT-CT units per million population. The jurisdictions with the greatest density of SPECT-CT units per million are Newfoundland and Labrador (15.0), Quebec (12.1), and Prince Edward Island (11.4). This does not reflect accessibility, particularly in provinces with large rural and remote areas where travel to urban centres is required.
No sites reported the operation of mobile SPECT-CT units.
Overall, 11 SPECT-CT units are reported to operate in 10 private sites in Alberta and 1 in Nova Scotia.
Table 1: Inventory of SPECT-CT for Public and Private Facilities in Canada, 2022–2023
Province or territory | Number of sites (private sites)a,b | Total units (private)c | Units per million population (private) | Populationd |
|---|---|---|---|---|
Alberta | 23 (10) | 39 (11) | 8.3 (2.3) | 4,703,772 |
British Columbia | 25 (0) | 50 (0) | 9.2 (0) | 5,437,722 |
Manitoba | 5 (0) | 10 (0) | 6.9 (0) | 1,444,190 |
New Brunswick | 5 (0) | 8 (0) | 9.6 (0) | 831,618 |
Newfoundland and Labrador | 3 (0) | 8 (0) | 15 (0) | 533,710 |
Northwest Territories | NA | NA | NA | 45,668 |
Nova Scotia | 9 (1) | 9 (0) | 8.6 (0) | 1,047,232 |
Nunavut | NA | NA | NA | 40,715 |
Ontario | 56 (0) | 92 (0) | 5.9 (0) | 15,500,632 |
Prince Edward Island | 1 (0) | 2 (0) | 11.4 (0) | 176,113 |
Quebec | 50 (0) | 107 (0) | 12.1 (0) | 8,831,257 |
Saskatchewan | 3 (0) | 6 (0) | 4.9 (0) | 1,221,439 |
Yukon | NA | NA | NA | 44,412 |
Canada | 180 (11) | 331 (11) | 8.3 (0.3) | 39,858,480 |
NA = not applicable.
Notes: Data were derived from the survey question, “Do you have the following fixed, mobile, or portable units at the site?” Options included CT, MRI, PET-CT, PET-MRI, SPECT-CT, and SPECT.
For the 2022–2023 survey, complete unit count data were available for 180 sites with SPECT-CT capacity out of 467 participating sites with advanced imaging capacity (i.e., SPECT-CT, SPECT, CT, MRI, PET-CT, PET-MRI).
aThese are per-jurisdiction site availability according to the validator if the validator provided lists of sites with SPECT-CT availability; where these were unavailable, the data were taken from the survey and from private sites.
bPrivate units are a unit located in a health care facility that operates privately but that is either privately or publicly funded.
cThese are per-jurisdiction unit counts according to the validator if the validator provided lists of units; where these were unavailable, the data were taken from the survey and responses from private sites.
dThe population (estimated) as of the first quarter of 2023.14
Figure 7: Units and Units per Million Population for SPECT-CT, 2022–2023
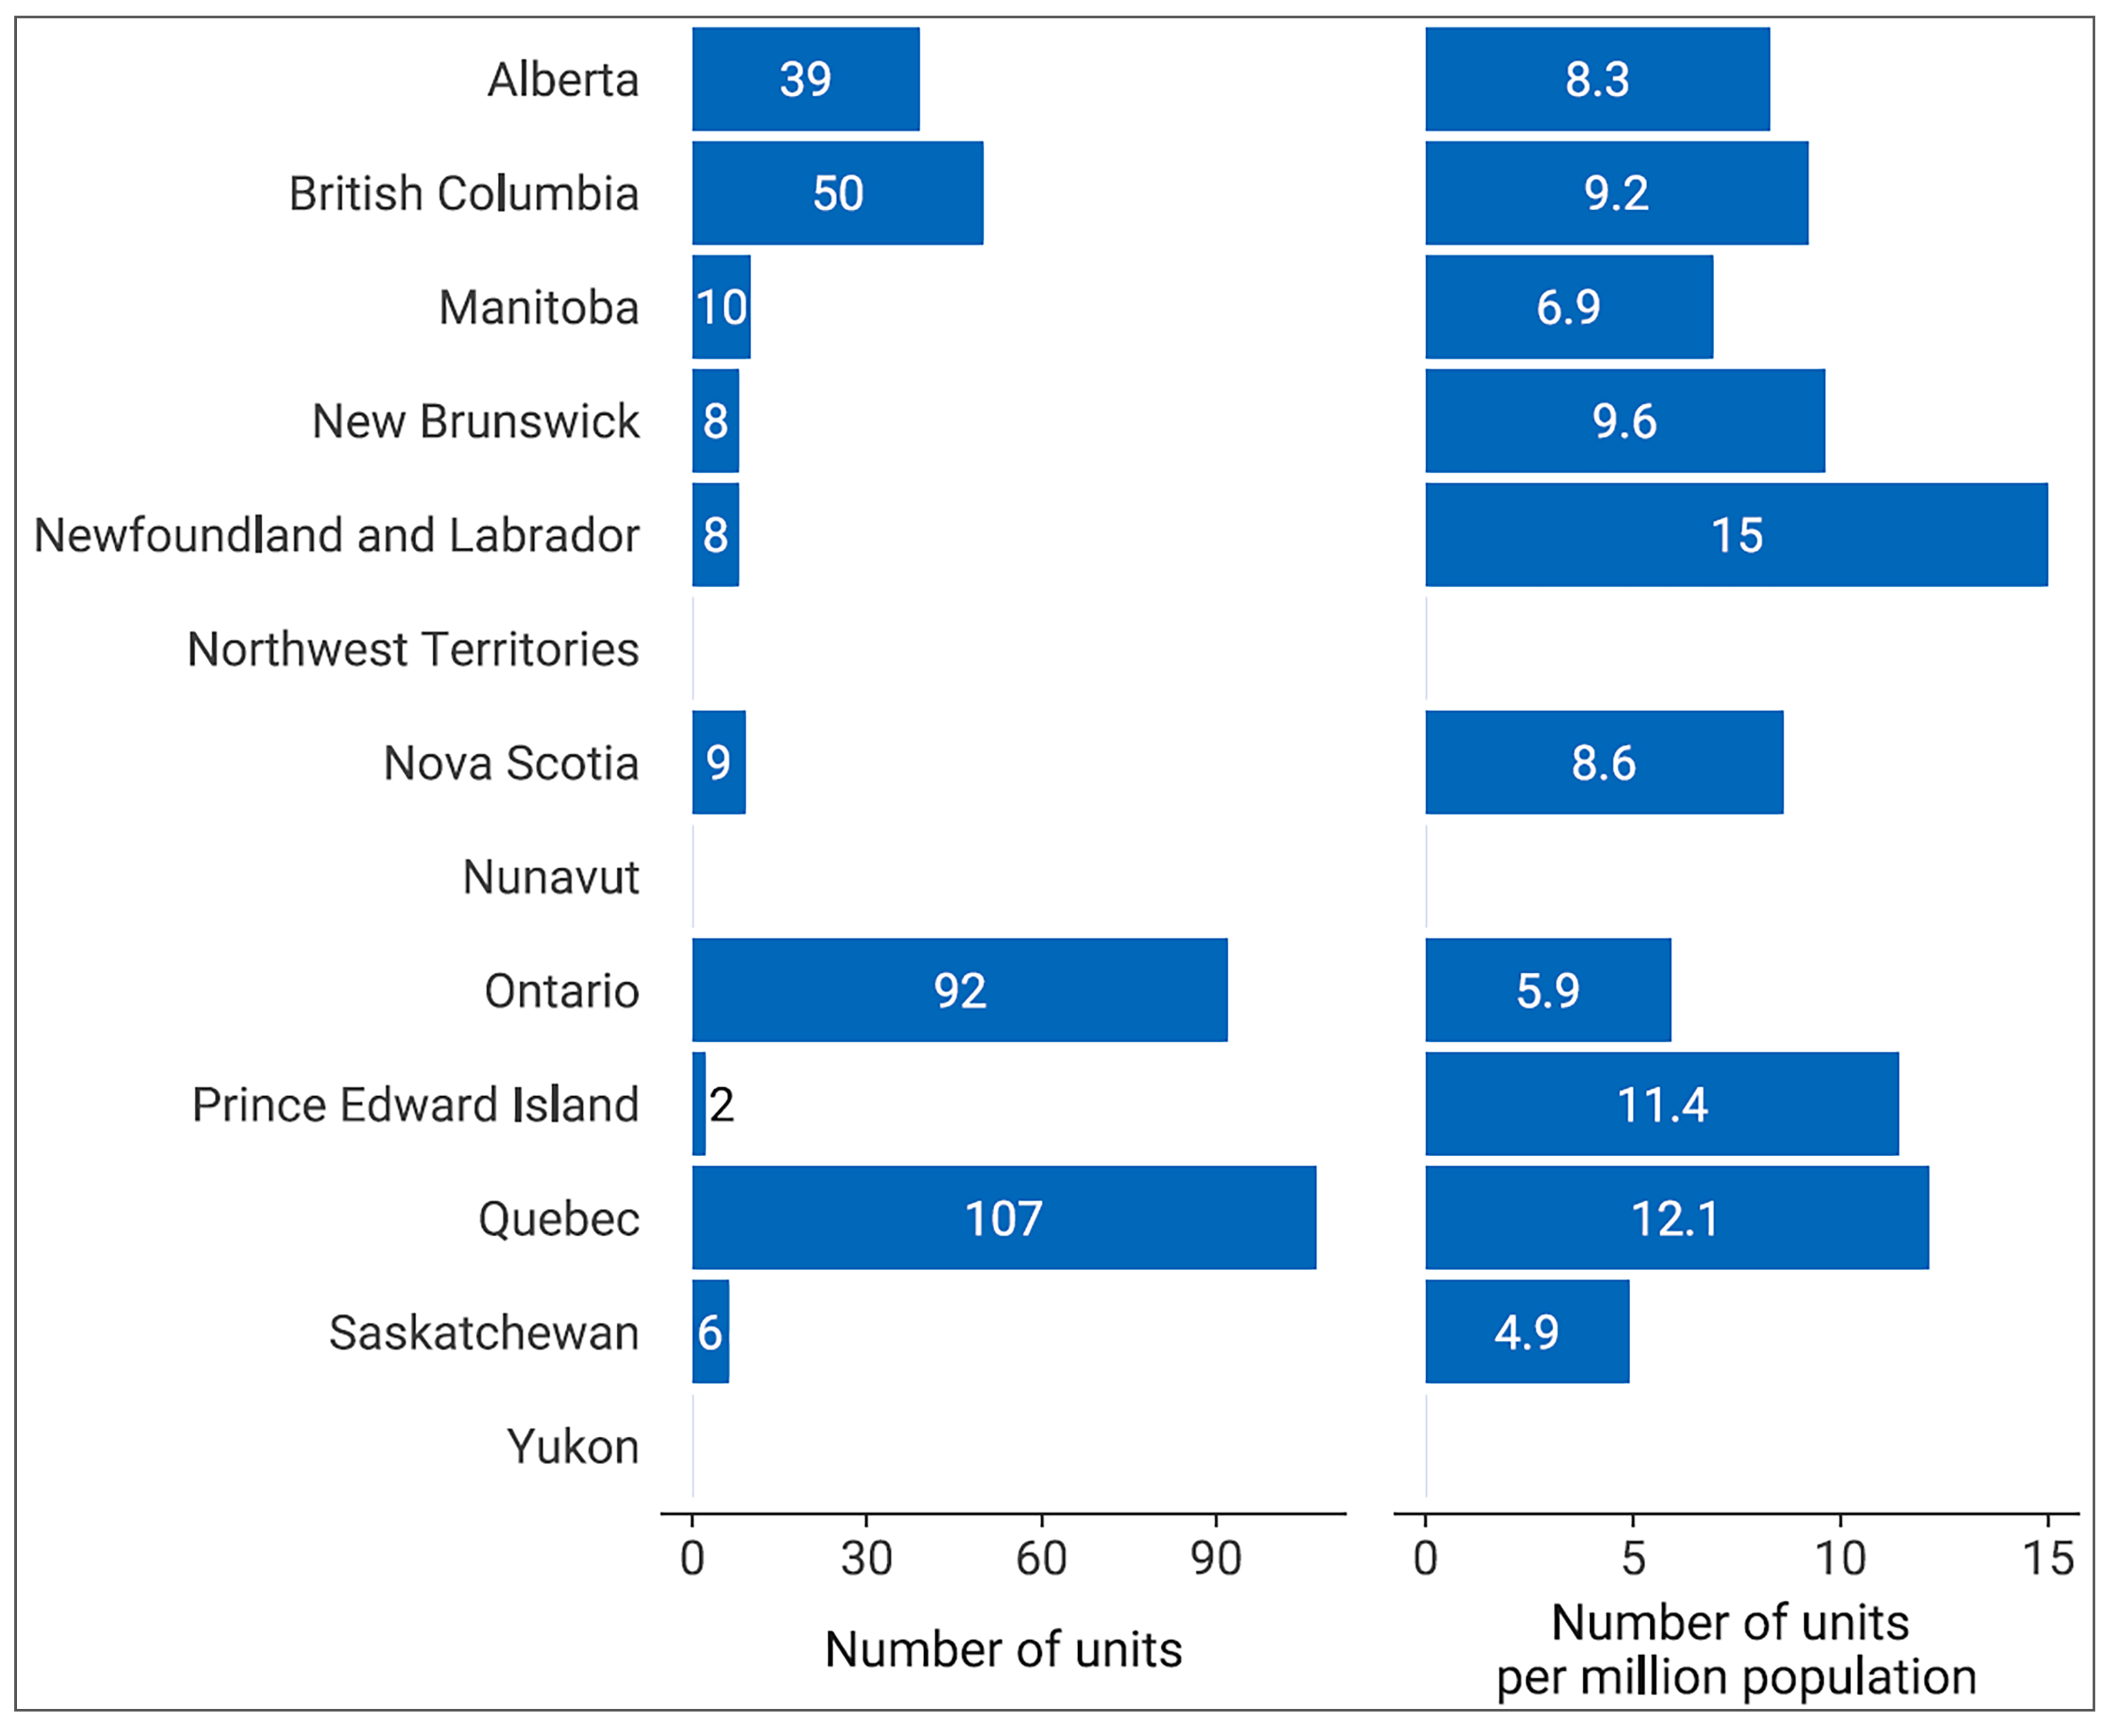
Notes: For the 2022–2023 survey, complete unit count data were available for 180 sites with SPECT-CT capacity out of 467 participating sites with advanced imaging capacity (i.e., SPECT-CT, SPECT, CT, MRI, PET-CT, PET-MRI).
Data were derived from the survey question “Do you have the following fixed, mobile, or portable units at the site?” Options included: CT, MRI, PET-CT, PET-MRI, SPECT-CT, and SPECT.
Total Volume of SPECT-CT and SPECT Exams in Canada 2022–2023
The total number of overall examinations and the total per capita (per 1,000 population) are combined for SPECT-CT and SPECT units. They are reported for the most recent fiscal (or calendar) year and are presented in Table 2 and Figure 8.
British Columbia and Ontario did not submit the number of SPECT-CT or SPECT exams for 2022–2023. The number reported in the 2019–2020 national CMII survey is used for comparison.
In total, 929,010 SPECT-CT and SPECT exams were performed, representing a national average of 23.3 exams per 1,000 population, ranging from 11.3 to 56.3 across all jurisdictions with capacity.
An average of 2,806.7 exams per SPECT-CT or SPECT unit were conducted across Canada in 2022–2023.
Quebec, Ontario, and British Columbia have the highest volume of SPECT-CT or SPECT exams of reporting jurisdictions with capacity in Canada, at 496,843, 192,189, and 66,604 exams, respectively.
Quebec, Newfoundland and Labrador, and New Brunswick have the highest density of SPECT-CT or SPECT exams of reporting jurisdictions in Canada, at 56.3, 42.9, and 34.2 exams per 1,000 people, respectively.
Table 2: Total Exams for the Latest Fiscal (Or Calendar) Year With Data Availability for SPECT-CT and SPECT Across Canada for Public Facilities, 2022–2023
Province or territory | Populationa | Total examsb,c | Exams per unit | Exams per thousand population |
|---|---|---|---|---|
Alberta | 4,703,772 | 59,099 | 1,515.4 | 12.6 |
British Columbia | 5,437,722 | 66,604d | 1,332.1 | 12.2 |
Manitoba | 1,444,190 | 22,378 | 2,237.8 | 15.5 |
New Brunswick | 831,618 | 28,408 | 3,551.0 | 34.2 |
Newfoundland and Labrador | 533,710 | 22,910 | 2,863.8 | 42.9 |
Northwest Territories | 45,668 | NA | NA | NA |
Nova Scotia | 1,047,232 | 12,511 | 1,390.1 | 11.9 |
Nunavut | 40,715 | NA | NA | NA |
Ontario | 15,500,632 | 192,189e | 2,089.0 | 12.4 |
Prince Edward Island | 176,113 | 1,985f | 992.5 | 11.3 |
Quebec | 8,831,257 | 496,843g | 4,643.4 | 56.3 |
Saskatchewan | 1,221,439 | 26,083 | 4,347.2 | 21.4 |
Yukon | 44,412 | NA | NA | NA |
Canada | 39,858,480 | 929,010 | 2,806.7 | 23.3 |
NA = not applicable.
Note: Complete exam volume data for public facilities was reported by validators for 8 out of 10 jurisdictions with capacity.
aThe population (estimated) as of the first quarter of 2023.14
bData were derived from the number of units with reported exam data and from the survey question: “For all units, how many examinations on average were conducted in the last fiscal/calendar year?”
cThese are per-jurisdiction public exam volumes according to the validator.
dData from 2019–2020.
eData from 2017.
fPrince Edward Island reported to have 2 SPECT-CT units and no SPECT unit.
gData from 2021–2022.
Figure 8: SPECT-CT and SPECT Exams per 1,000 Population for the Latest Fiscal (or Calendar) Year With Data Availability Across Canada in Public Facilities, 2022–2023
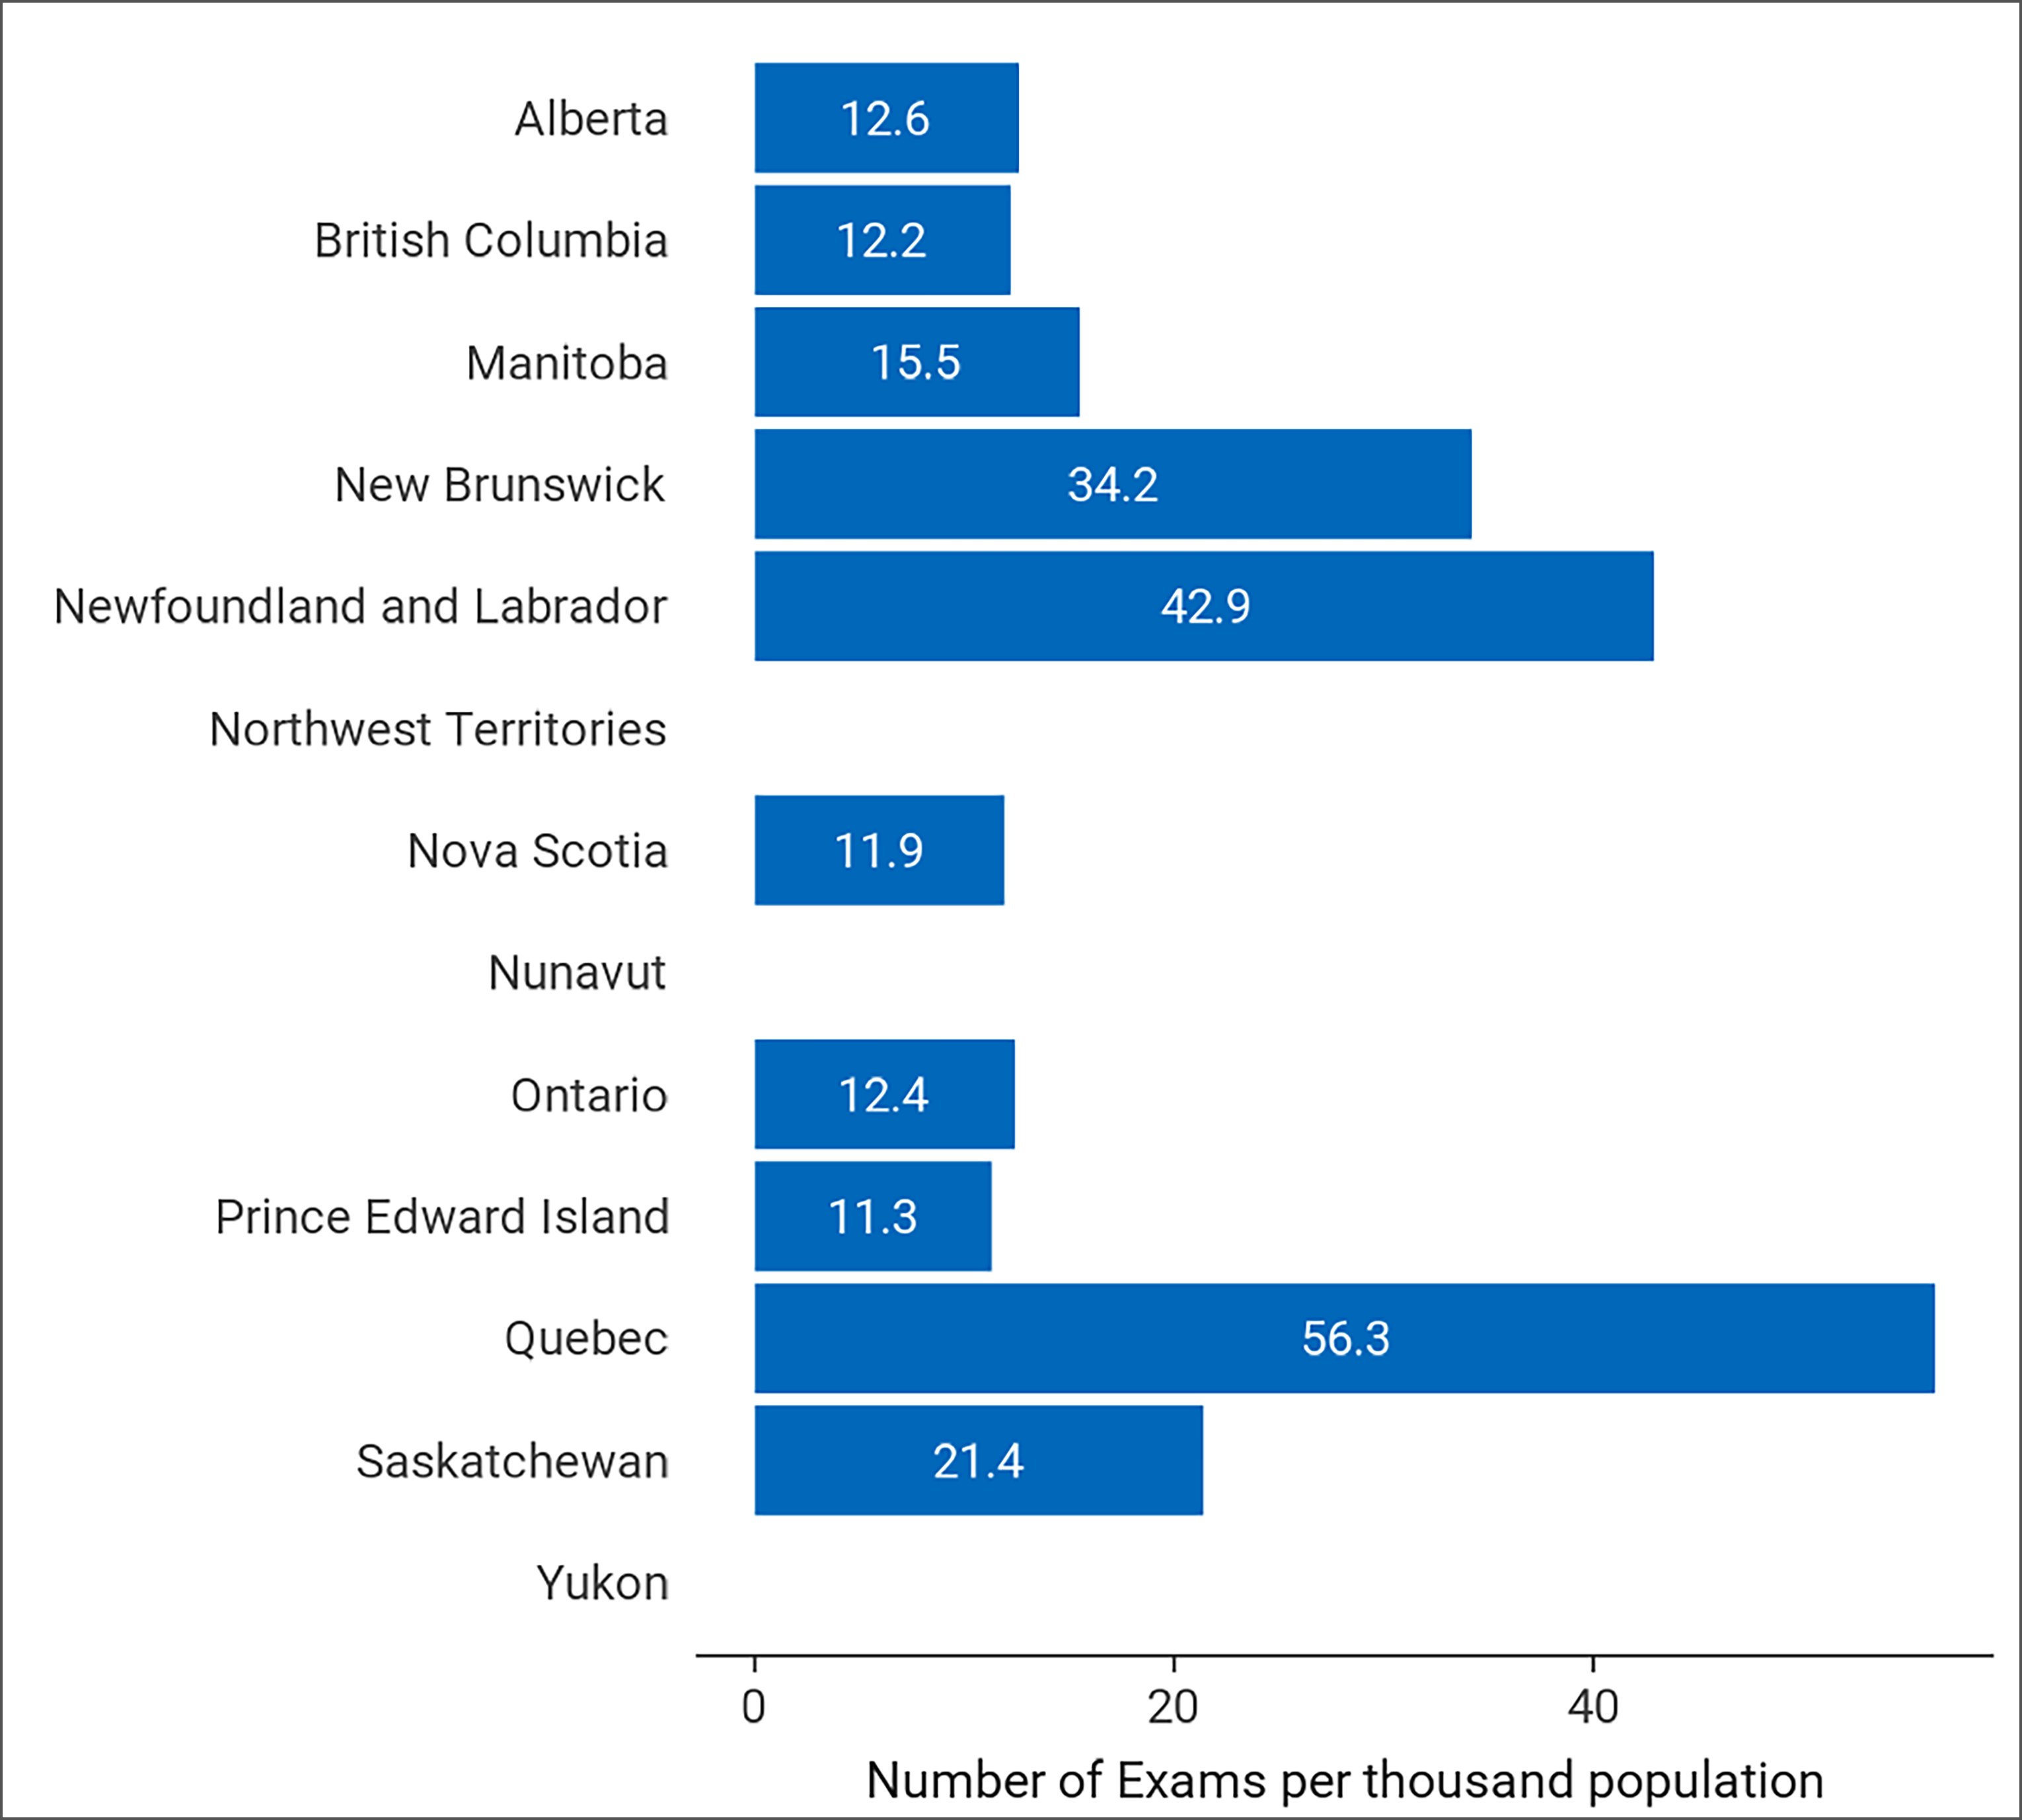
Notes: Complete exam volume data for public facilities was reported by validators for 8 out of 10 jurisdictions with capacity.
Data were derived from the survey question “For all units, how many examinations on average were conducted in the last fiscal/calendar year?”
SPECT Units in 2022–2023
Total Number of SPECT Units in 2022–2023
Overall, 210 SPECT units were reported for 2022–2023, distributed across 9 jurisdictions with capacity, down from 305 in 2019–20203 (Table 3 and Figure 9).
The provinces with the highest number of SPECT units are Ontario and Alberta, with 102 and 36 units, respectively. No SPECT units operate in Prince Edward Island or the Northwest Territories, Nunavut, or Yukon.
Canada has 5.3 SPECT units per million population. The jurisdictions with the greatest density of SPECT units per million people are Alberta (7.7), New Brunswick (7.2), and Nova Scotia (6.7). This does not reflect accessibility, particularly in provinces with large rural and remote areas where travel to urban centres is required.
SPECT is delivered in the private setting at 17 sites in Alberta and 9 sites in Ontario.
No sites reported the operation of mobile SPECT units.
Table 3: Inventory of SPECT for Public and Private Facilities in Canada, 2022–2023
Province or territory | Number of sites (private sites)a | Total unitsb (private) | Units per million population | Populationc |
|---|---|---|---|---|
Alberta | 23 (17) | 36 (27) | 7.7 (5.7) | 4,703,772 |
British Columbia | 10 (0) | 16 (0) | 2.9 (0) | 5,437,722 |
Manitoba | 3 (0) | 4 (0) | 2.8 (0) | 1,444,190 |
New Brunswick | 5 (0) | 6 (0) | 7.2 (0) | 831,618 |
Newfoundland and Labrador | 1 (0) | 1 (0) | 1.9 (0) | 533,710 |
Northwest Territories | NA | NA | NA | 45,668 |
Nova Scotia | 7 (0) | 7 (0) | 6.7 (0) | 1,047,232 |
Nunavut | NA | NA | NA | 40,715 |
Ontario | 63 (9) | 102 (9) | 6.6 (0.6) | 15,500,632 |
Prince Edward Island | NA | NA | NA | 176,113 |
Quebec | 23 (0) | 32 (0) | 3.6 (0) | 8,831,257 |
Saskatchewan | 3 (0) | 6 (0) | 4.9 (0) | 1,221,439 |
Yukon | NA | NA | NA | 44,412 |
Canada | 138 (26) | 210 (36) | 5.3 (0.9) | 39,858,480 |
NA = not applicable.
Notes: Data were derived from the survey question: “Do you have the following fixed, mobile, or portable units at the site?” Options included CT, MRI, PET-CT, PET-MRI, SPECT-CT, and SPECT.
For the 2022–2023 survey, complete unit count data were available for 138 sites with SPECT capacity out of 467 participating sites with advanced imaging capacity (i.e., SPECT-CT, SPECT, CT, MRI, PET-CT, PET-MRI).
aThese are per-jurisdiction site availability according to the validator if the validator provided lists of sites with SPECT availability; where these were unavailable, the data came from the survey.
cThese are per-jurisdiction unit counts according to the validator if the validator provided lists of units; where these were unavailable, the data were taken from the survey and responses from private sites.
bThese are per-jurisdiction unit counts according to the validator and responses from private sites.
cThe population (estimated) as of the first quarter of 2023.14
Figure 9: Units and Units per Million Population for SPECT, 2022–2023
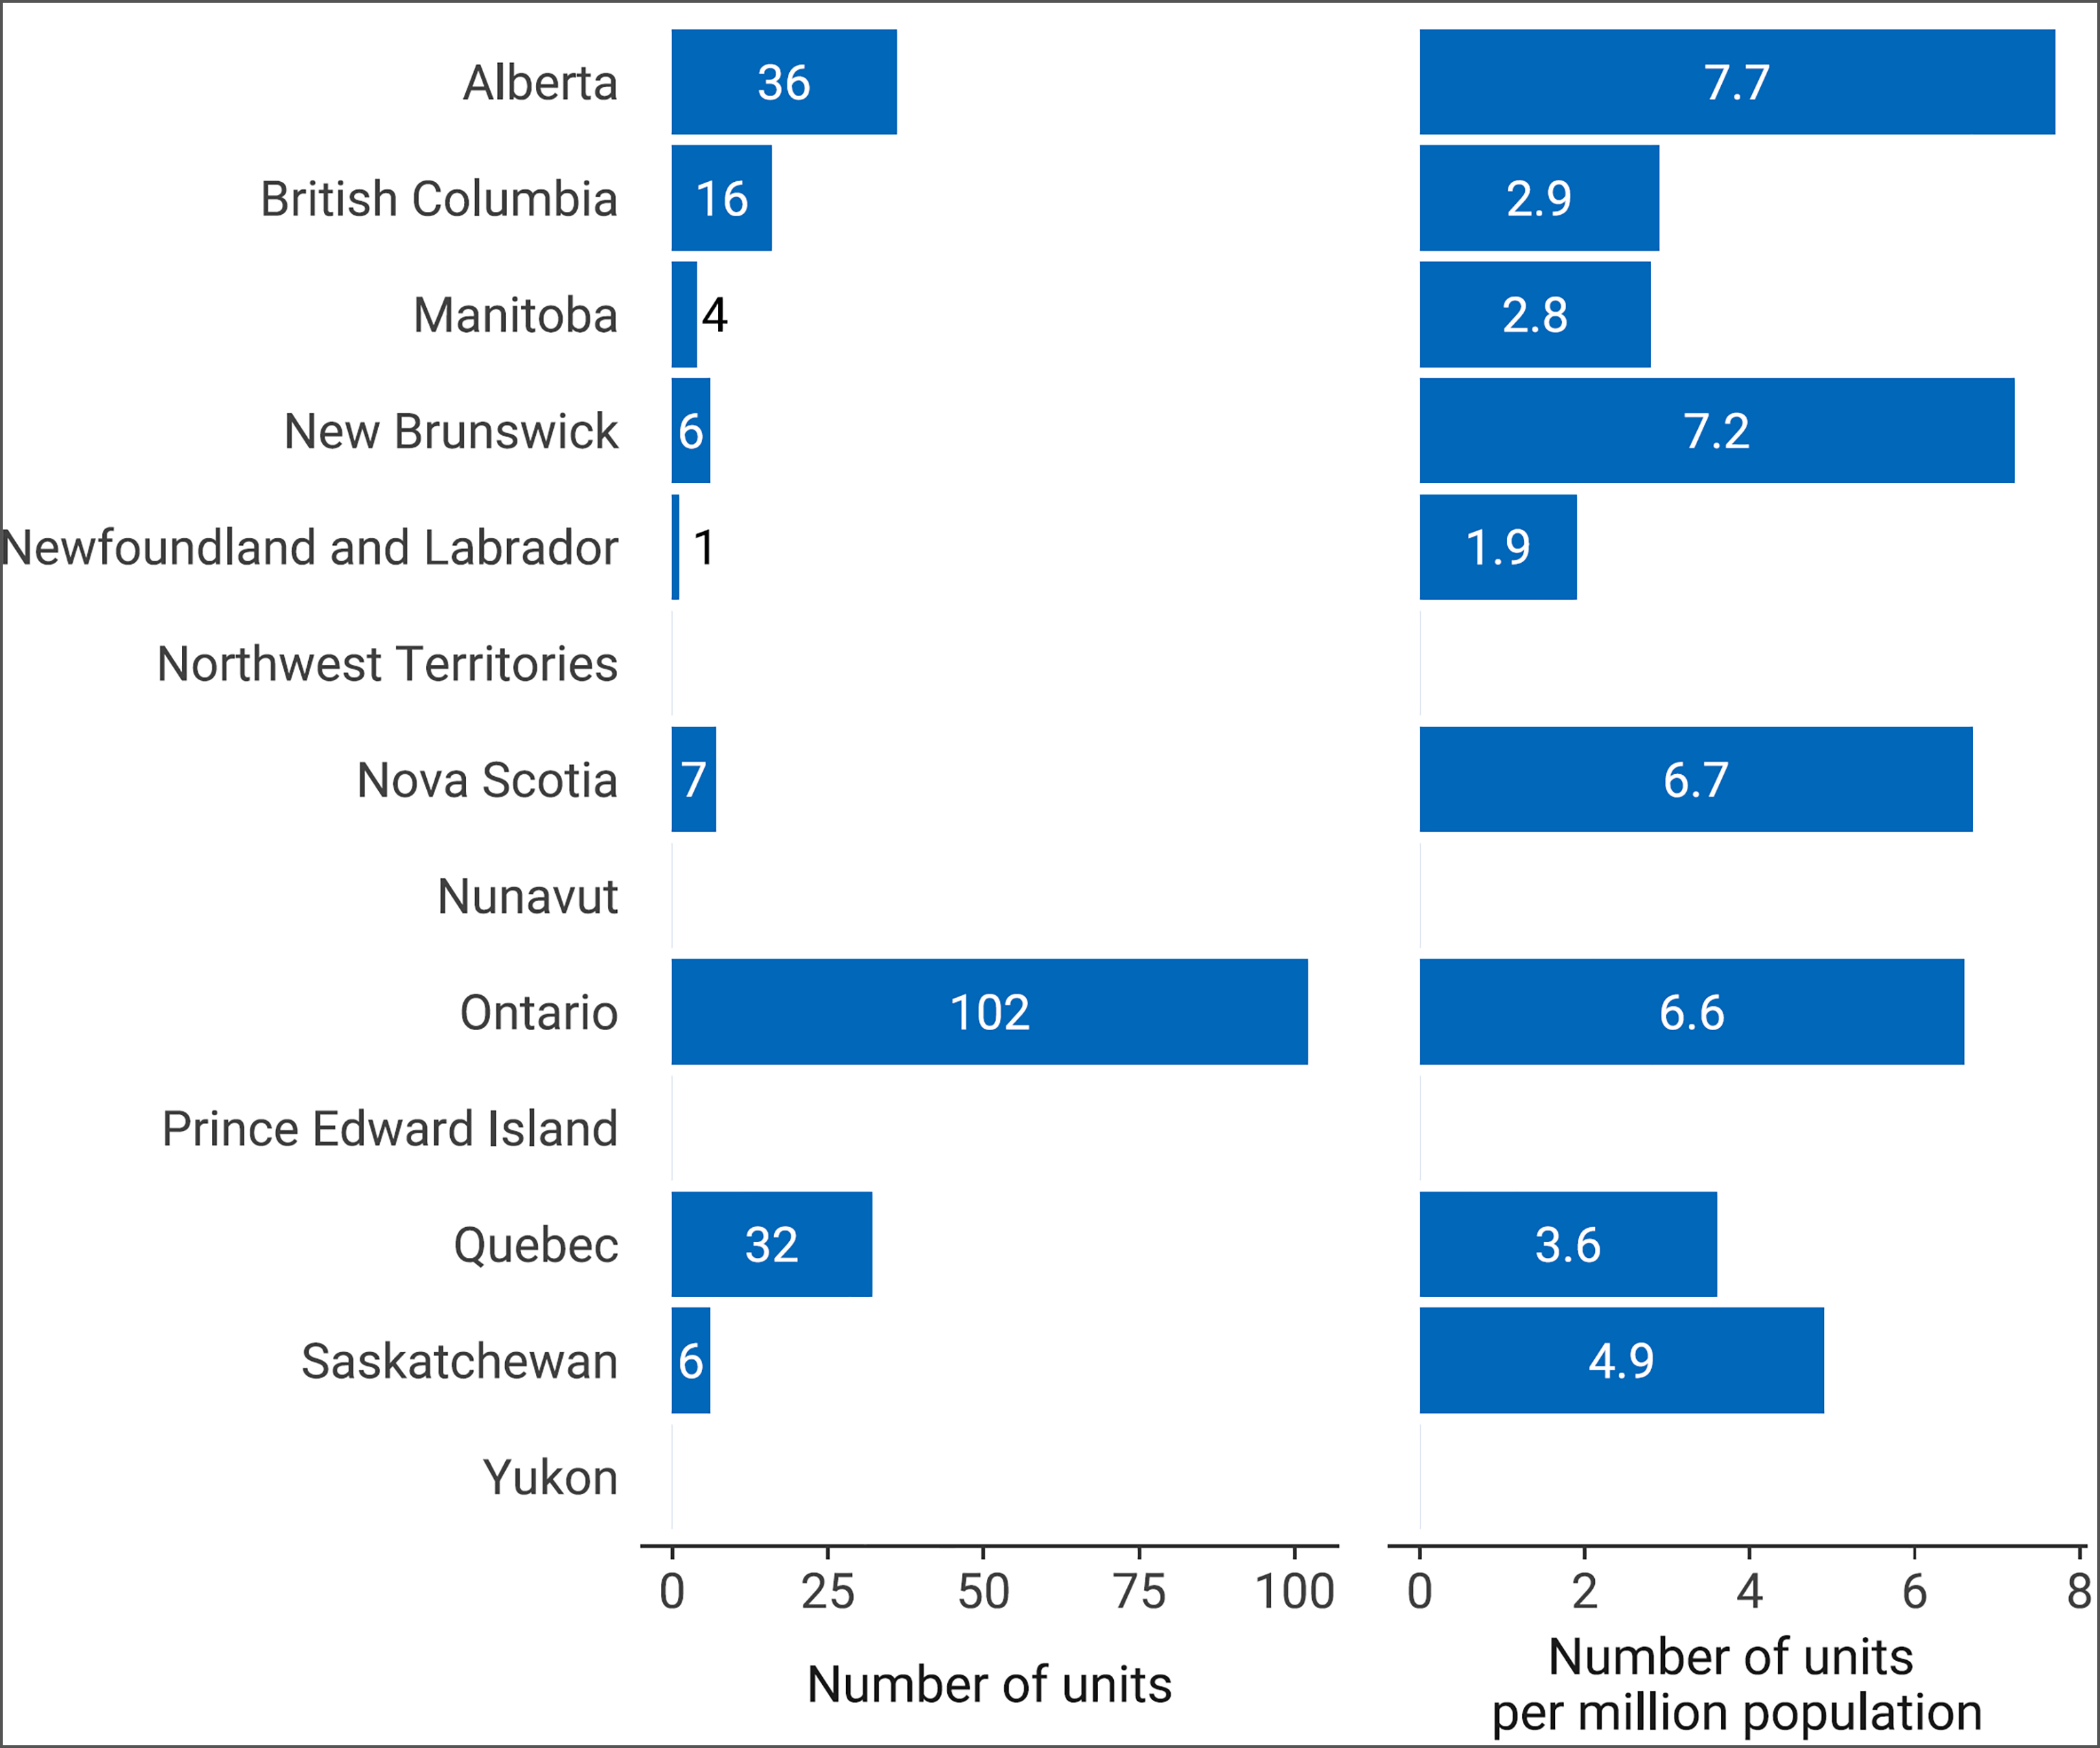
Notes: For the 2022–2023 survey, complete unit count data were available for 138 sites with SPECT capacity out of 467 participating sites with advanced imaging capacity (i.e., SPECT-CT, SPECT, CT, MRI, PET-CT, PET-MRI).
Per-jurisdiction unit counts according to the validator if the validator provided lists of units; where these were unavailable, the data came from the survey and responses from private sites.
Data were derived from the survey question “Do you have the following fixed, mobile, or portable units at the site?” Options included: CT, MRI, PET-CT, PET-MRI, SPECT-CT, and SPECT.
Change in SPECT-CT Units Since 2015
Trends in Number of Units and Units per Million People, 2015 to 2022–2023
The number of SPECT-CT units and units per million people between 2015 and 2022–2023 are presented in Appendix 3, Table 15.3,8,9 Over the past 10 years, more accurate SPECT-CT technology has been steadily replacing the use of SPECT.
Since 2015, the number of SPECT-CT units in Canada has increased by 54.7%, from 214 to 331 units.
Between 2015 and 2022–2023, the number of units per million people has increased by 38.3%, from 6.0 to 8.3 units per million. During this time, Newfoundland and Labrador, Prince Edward Island, and Quebec maintained some of the highest numbers of units per capita among jurisdictions with SPECT-CT capacity.
Since 2017, Newfoundland and Labrador, Nova Scotia, Prince Edward Island, and Saskatchewan experienced a decrease in the number of units per million people of all jurisdictions with SPECT-CT capacity.
Change in SPECT-CT and SPECT Exams Across Public Facilities Since 2015
Trends in Exam Volume Across Public Facilities per 1,000 People, 2015 to 2022–2023
Information on the number of exams across public facilities per 1,000 people for both SPECT-CT and SPECT between 2015 and 2022–2023 are combined and are presented in Appendix 3, Table 16.3,8,9 Overall, the replacement of SPECT and planar technology with SPECT-CT over the past decade, and investment in the use of other advanced imaging modalities, has contributed to lower SPECT and SPECT-CT exam volumes.
Since 2015, the volume of SPECT-CT and SPECT exams across public facilities in Canada has decreased by 37.5%, from 1,485,296 to 929,010 exams.
Between 2015 and 2022–2023 the number of exams across public facilities per 1,000 people has decreased by 43.7%, from 41.4 to 23.3 exams per 1,000. During this time, Quebec maintained the highest number of exams per capita among jurisdictions with SPECT-CT and SPECT capacity.
Since 2019 to 2020, Alberta and New Brunswick have experienced an increase in the volume of exams per capita among jurisdictions with SPECT-CT or SPECT capacity.
Change in SPECT Units Since 2015
Trends in Number of Units and Units per Million People, 2015 to 2022–2023
Information of the number of SPECT units and units per million people between 2015 and 2022–2023 are presented in Appendix 3, Table 17.3,8,9 The decline in SPECT is attributed to its gradual replacement by SPECT-CT.
Since 2015, the number of SPECT units in Canada has decreased by 20.5%, from 264 to 210 units.
Between 2015 and 2022–2023, the number of units per million people has decreased by 28.4%, from 7.4 to 5.3 units per million.
Since 2019–2020, no provinces experienced an increase in number of units per million people with SPECT capacity.
Operation of SPECT-CT and SPECT Imaging Equipment
Hours of Operation for SPECT-CT Equipment
Hours Per Day and 24-Hour Use for SPECT-CT Units
SPECT-CT units operate an average of 8.6 hours per day in Canada, ranging from 7 to 14 hours across all jurisdictions with capacity (Appendix 3, Table 18). Table 44 in Appendix 4 presents the average daily hours of operation reported for publicly funded sites with capacity.
Saskatchewan and Nova Scotia reported the highest average hours of use per day across all jurisdictions with capacity, at 9.3 hours.
Approximately 92% of sites with SPECT-CT capacity in Canada reported use between 8 and 12 hours per day, 3.2% reported use for more than 12 hours per day, and 5.3% reported use for less than 8 hours per day (Figure 10). The data came from 94 sites that responded to this survey question.
One site with capacity reported SPECT-CT operation 24 hours per day in New Brunswick (Appendix 3, Table 19).
Figure 10: Average Hours of Operation per 24-Hour Day of SPECT-CT Use, 2022–2023
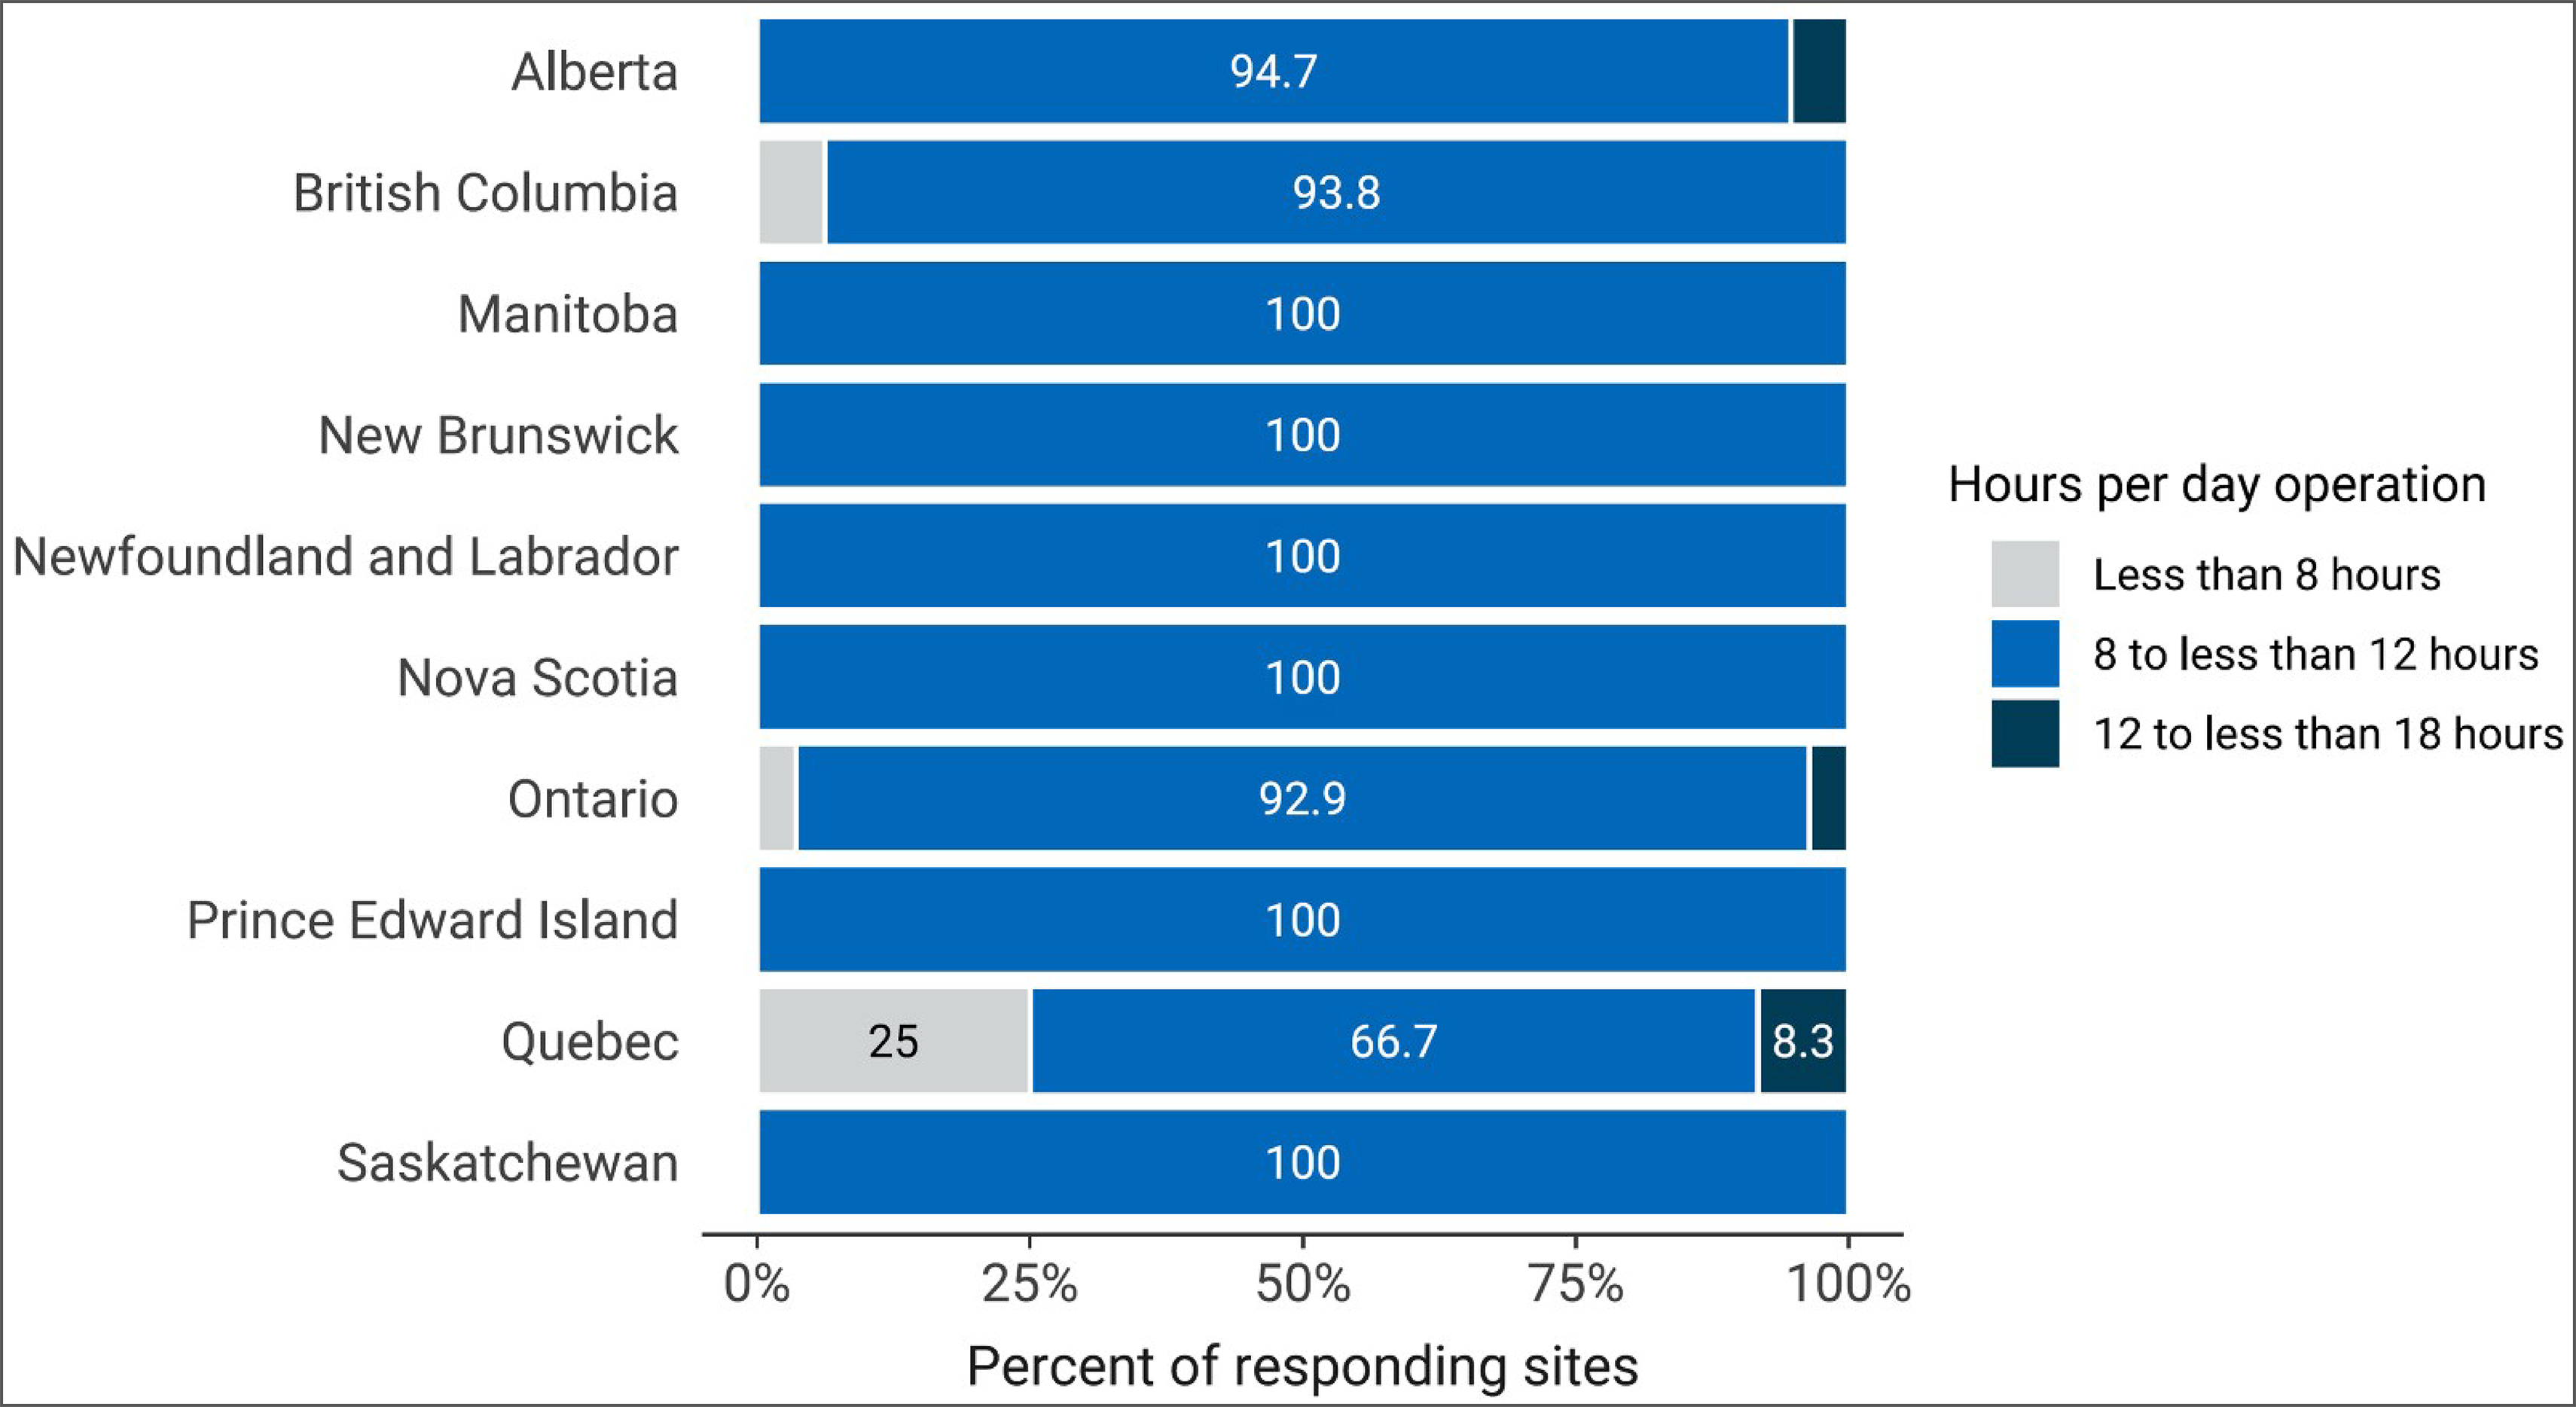
Notes: Survey response data were available for 94 out of 180 sites across all jurisdictions with SPECT-CT capacity.
Data were derived from the survey question: “In an average 24-hour day, how many hours are the units staffed through regular scheduled service capacity (do not include hours where staff are only on call)”.
Hours Per Week and Weekend Use for SPECT-CT Units
SPECT-CT units operate an average of 43.2 hours per week in Canada, ranging from 10 to 88 hours across jurisdictions with capacity (Appendix 3, Table 20). Table 45 (Appendix 4) presents the average weekly hours of operation reported for publicly funded sites with capacity.
Nova Scotia and Saskatchewan reported the highest average hours of use per week of all jurisdictions with capacity, both at 46.7 hours.
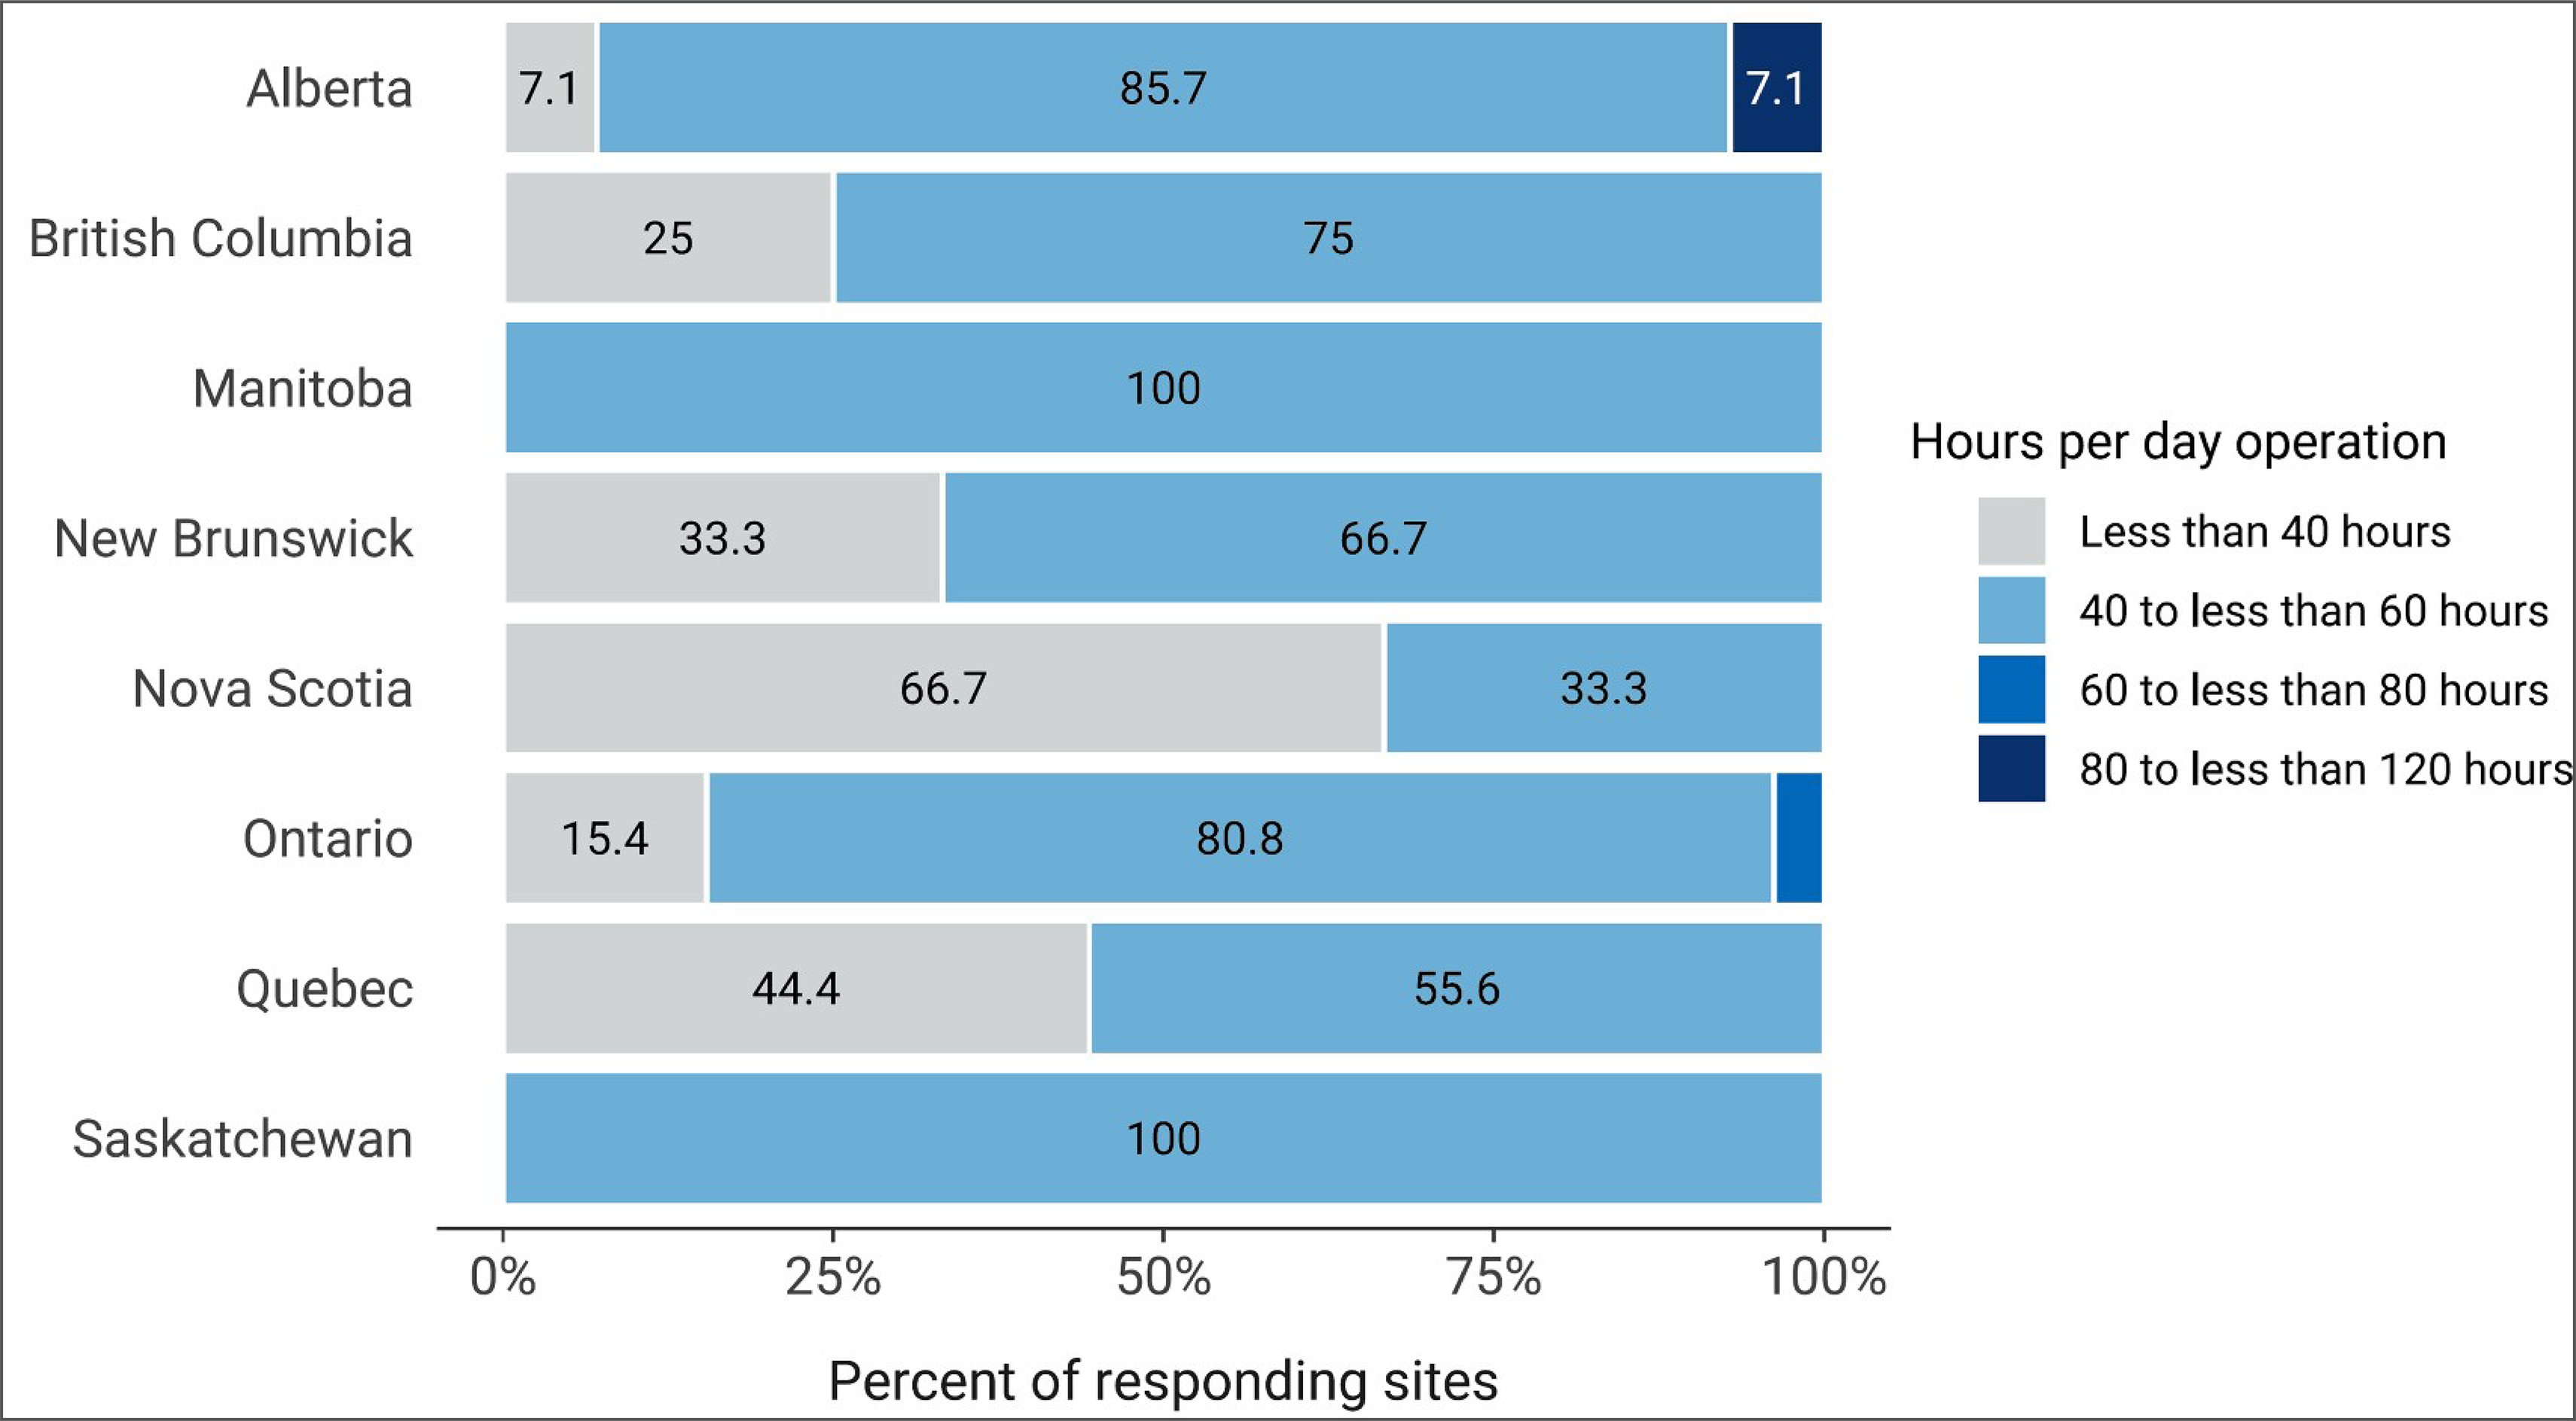
About 12% of SPECT-CT units in Canada operate less than 40 hours per week, 84% operate between 40 to 60 hours, and 4% exceed 60 hours of operation per week (Figure 11).
Overall, 10 sites (10.5%) in 5 jurisdictions reported that at least 1 SPECT-CT unit is used on weekends (Appendix 3, Table 19).
Figure 11: Average Hours of Operation per Week of SPECT-CT Use, 2022–2023
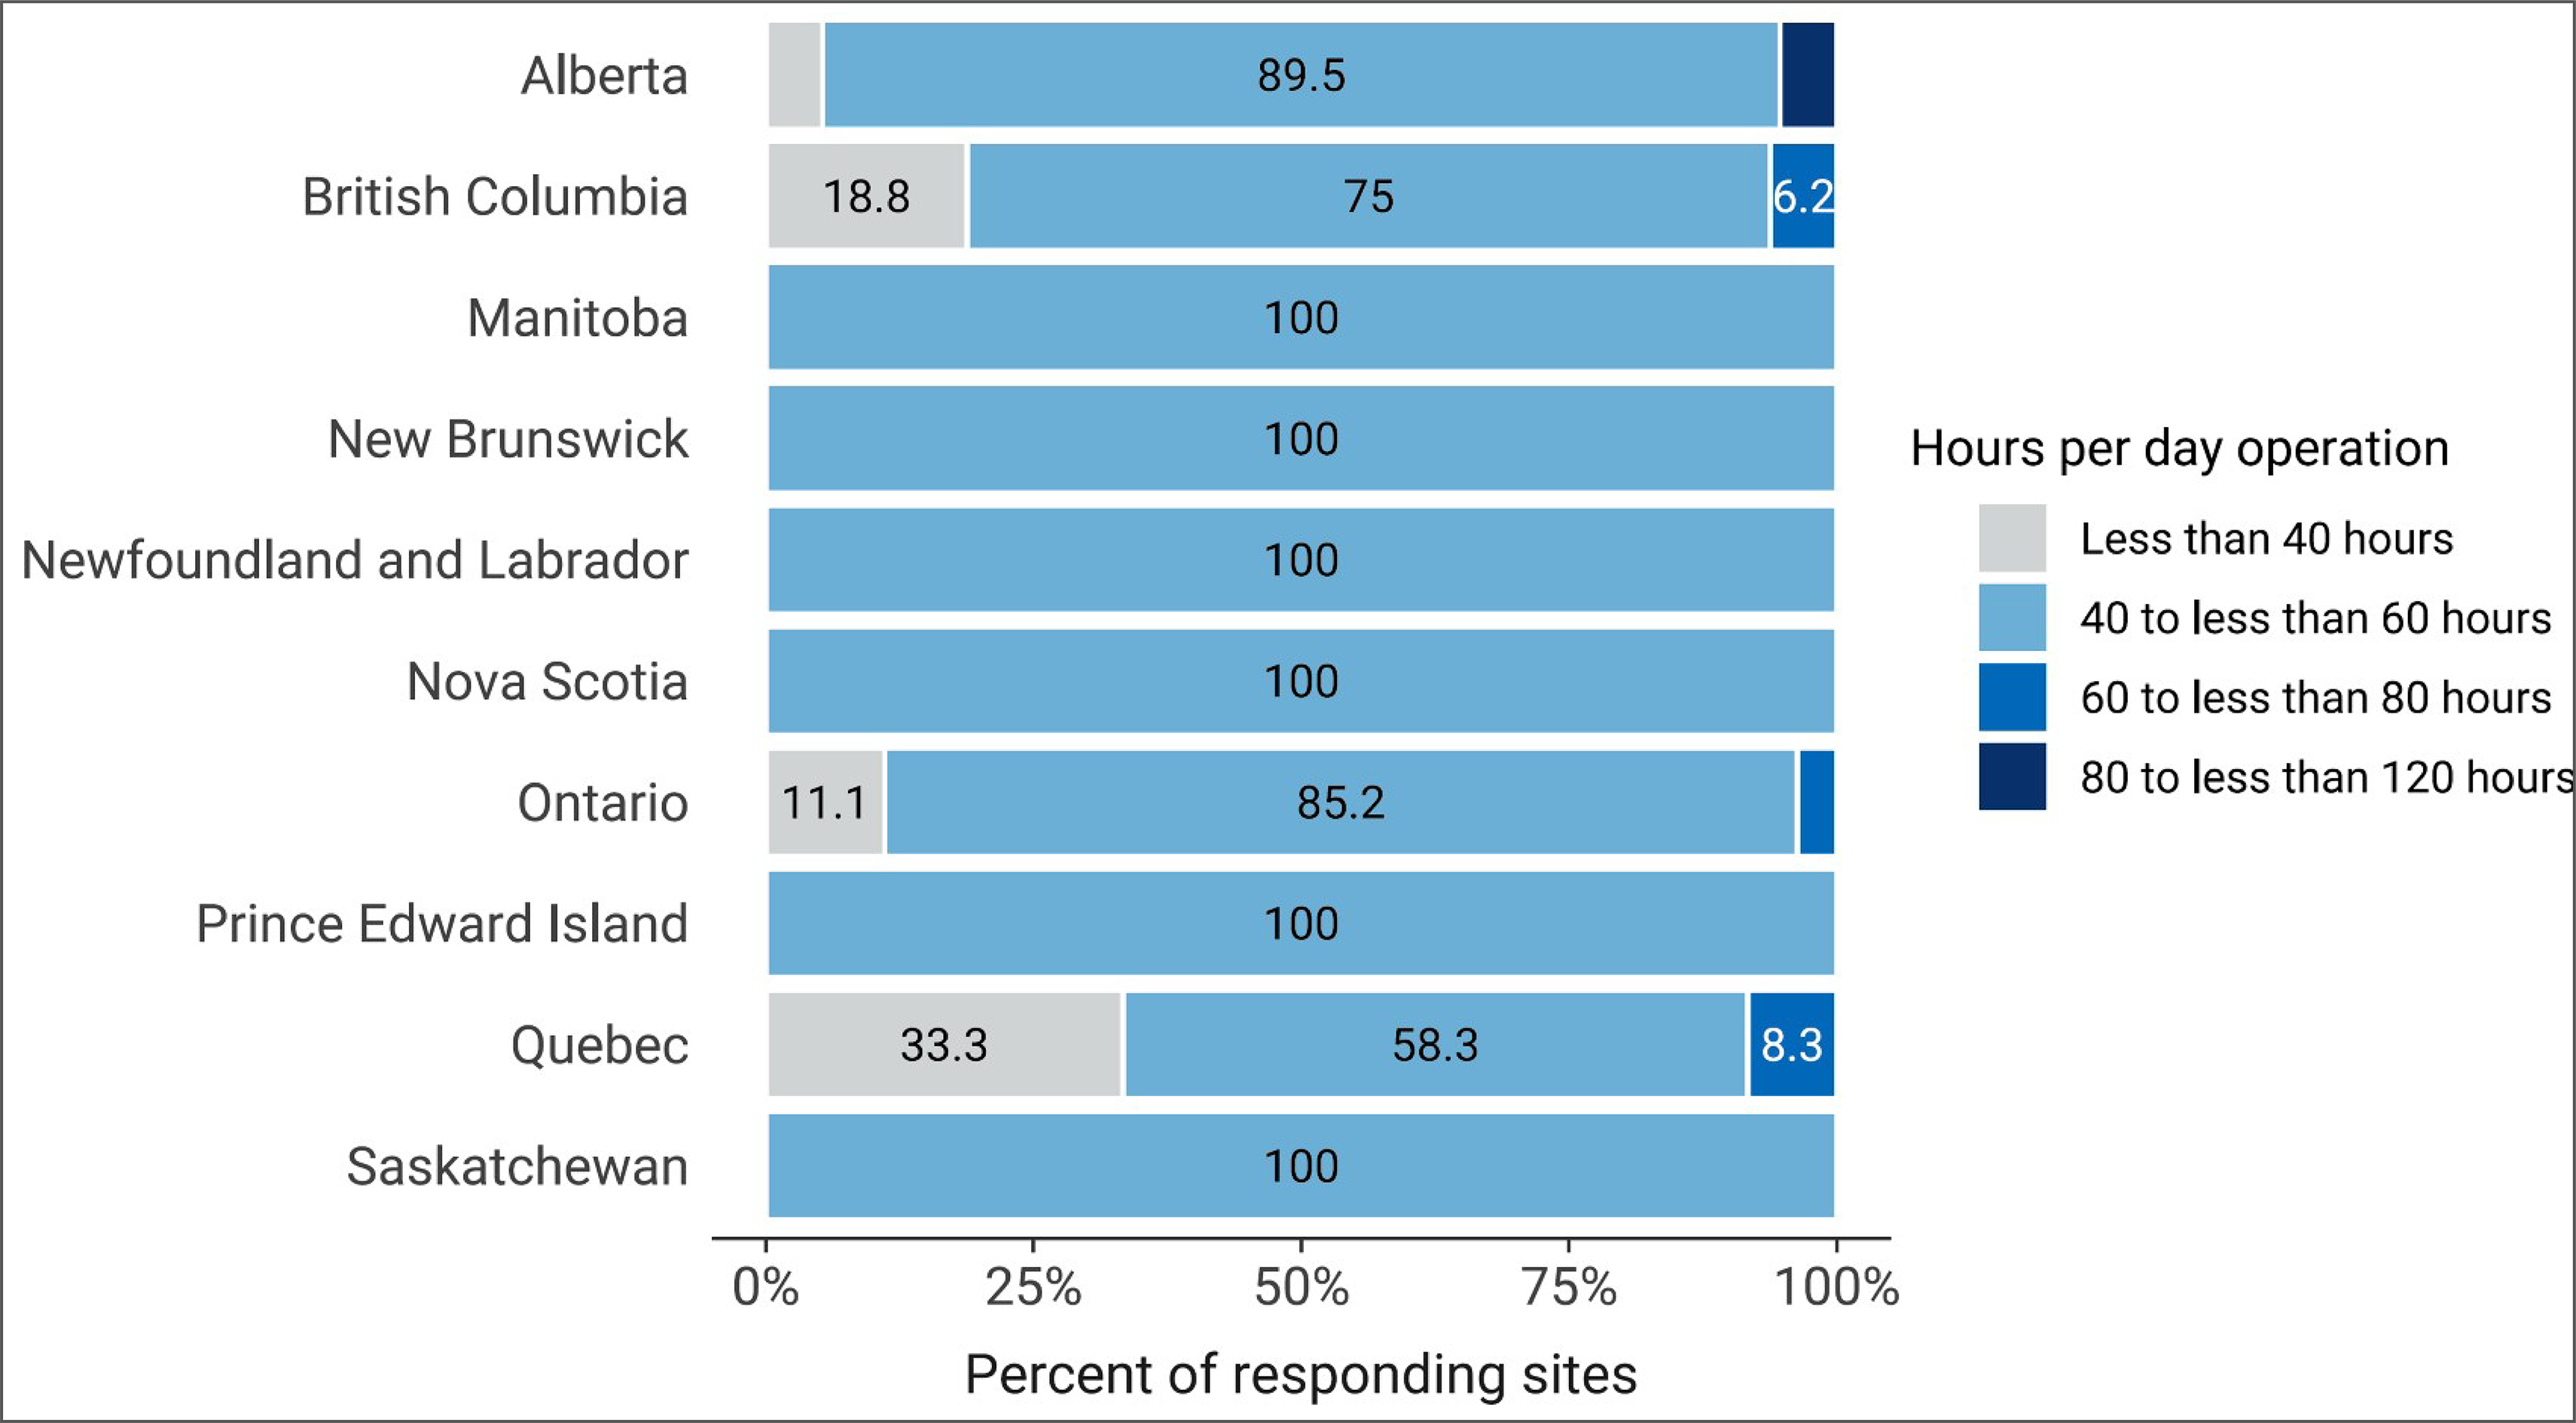
Notes: Survey response data were available for 93 out of 180 sites across all jurisdictions with SPECT-CT capacity.
Data were derived from the survey question: “In an average 24-hour day, how many hours are the units staffed through regular scheduled service capacity (do not include hours where staff are only on call).”
Hours of Operation for SPECT Equipment
Hours Per Day and 24-Hour Use for SPECT Units
SPECT units operate for an average of 8.6 hours per day, ranging from 5 to 14 hours across all jurisdictions with capacity (Appendix 3, Table 21). Table 46 (Appendix 4) presents the average daily hours of operation reported for publicly funded sites with capacity. Data are drawn from 64 sites that provided data for the average number of hours per day of use.
About 91% of SPECT units in Canada operate between 8 and less than 12 hours per day (Figure 12).
One site reported the use of a SPECT unit 24 hours per day in New Brunswick (Appendix 3, Table 22).
Hours Per Week and Weekend Use for SPECT Units
SPECT units operate an average of 41.6 hours a week, ranging from 8 to 88 hours across all jurisdictions with capacity. Table 47 (Appendix 4) presents the average daily hours of operation reported for publicly funded sites with capacity. The data are drawn from 64 sites that provided data for the average number of hours per week of use (Appendix 3, Table 23).
About 20% of SPECT units in Canada are used less than 40 hours per week, 77% are used between 40 to 60 hours, and 3% exceed 60 hours of use per week (Figure 13).
Three sites reported the use of SPECT units on weekends (Appendix 3, Table 22).
Figure 12: Average Hours of Operation per 24-Hour Day of SPECT Use, 2022–2023
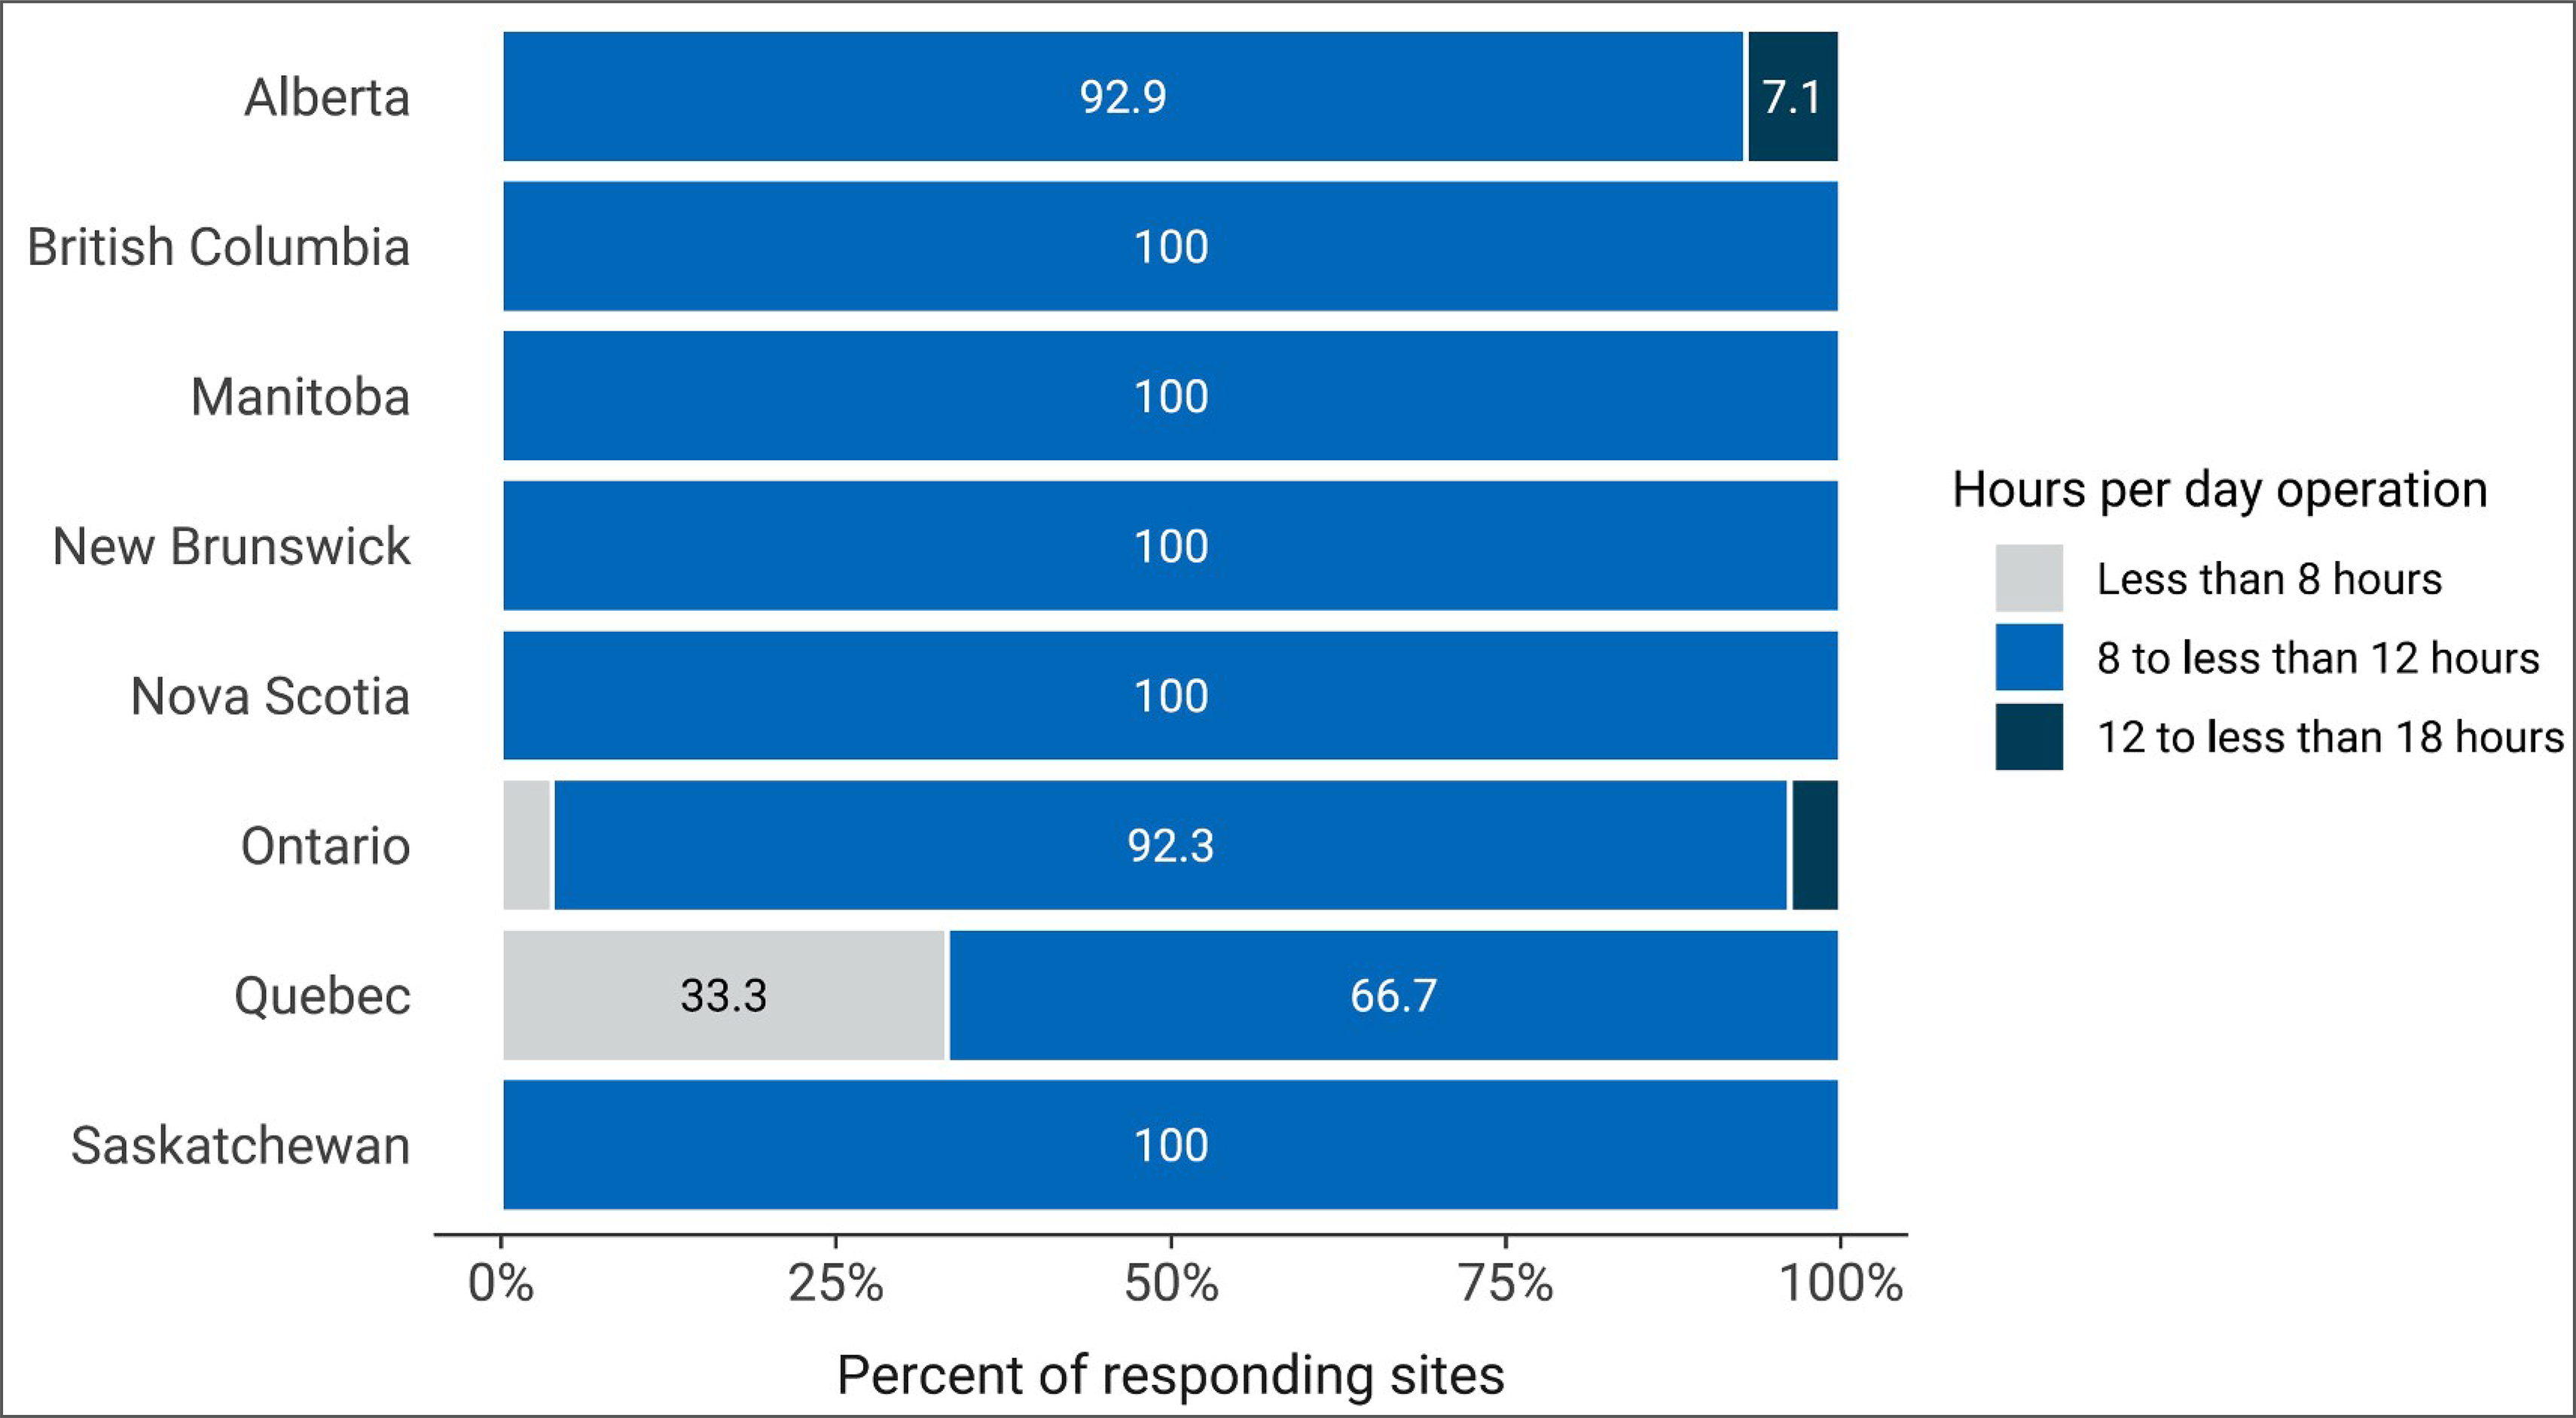
Notes: Survey response data were available for 64 out of 138 sites across 8 of the 9 jurisdictions with SPECT capacity. No data were available for Newfoundland and Labrador.
Data were derived from the survey question: “In an average 168-hour week, how many hours are the [modality] units staffed through regular scheduled service capacity (do not include hours where staff are only on call)?”
Figure 13: Average Hours of Operation per Week of SPECT Use, 2022–2023
Notes: Survey response data were available for 64 out of 138 sites across 8 of the 9 jurisdictions with SPECT capacity. No data were available for Newfoundland and Labrador.
Data were derived from the survey question: “In an average 168-hour week, how many hours are the [modality] units staffed through regular scheduled service capacity (do not include hours where staff are only on call)?”
Annual Planned and Unplanned Downtime for SPECT-CT and SPECT Units
SPECT-CT Annual Downtime
The average planned downtime for SPECT-CT units is 34.0 hours per year, ranging from 7 to 112 hours across 79 sites with reported data (Appendix 3, Table 24). Figure 14 presents the annual planned downtime for each jurisdiction with SPECT-CT capacity.
The average unplanned downtime for SPECT-CT is 70.4 hours per year, ranging from 7 to 534 hours across 67 sites with reported data. Figure 14 presents the annual unplanned downtime for each jurisdiction with SPECT-CT capacity.
Three sites in British Columbia reported unplanned downtime that exceeded 400 hours because of low staffing levels and major part failures.
Some commonly reported reasons for unplanned downtime for SPECT-CT units include equipment and system failure, software issues, and recalibration requirements.
SPECT Annual Downtime
The average planned downtime for SPECT units is 26.4 hours per year, ranging from 7 to 108 hours across 50 sites with reported data (Appendix 3, Table 25). Figure 15 presents the annual planned downtime for each jurisdiction with SPECT capacity.
The average unplanned downtime for SPECT is 82.8 hours per year, ranging from 1 to 1,000 hours across 44 sites with reported data. Figure 15 presents the annual unplanned downtime for each jurisdiction with SPECT capacity.
Four sites located in British Columbia and Quebec reported unplanned downtime that exceeded 600 hours because of low staffing levels and equipment breakdown. Data were only available for 2 sites each in Nova Scotia and Saskatchewan; therefore, average downtime for all units within these jurisdictions may not be reflected in this report.
Some commonly reported reasons for unplanned downtime for SPECT units include equipment and system failure, aging machine, and recalibration requirements.
Figure 14: Average Downtime at Sites With SPECT-CT Units by Reporting Jurisdictions With Capacity, 2022–2023
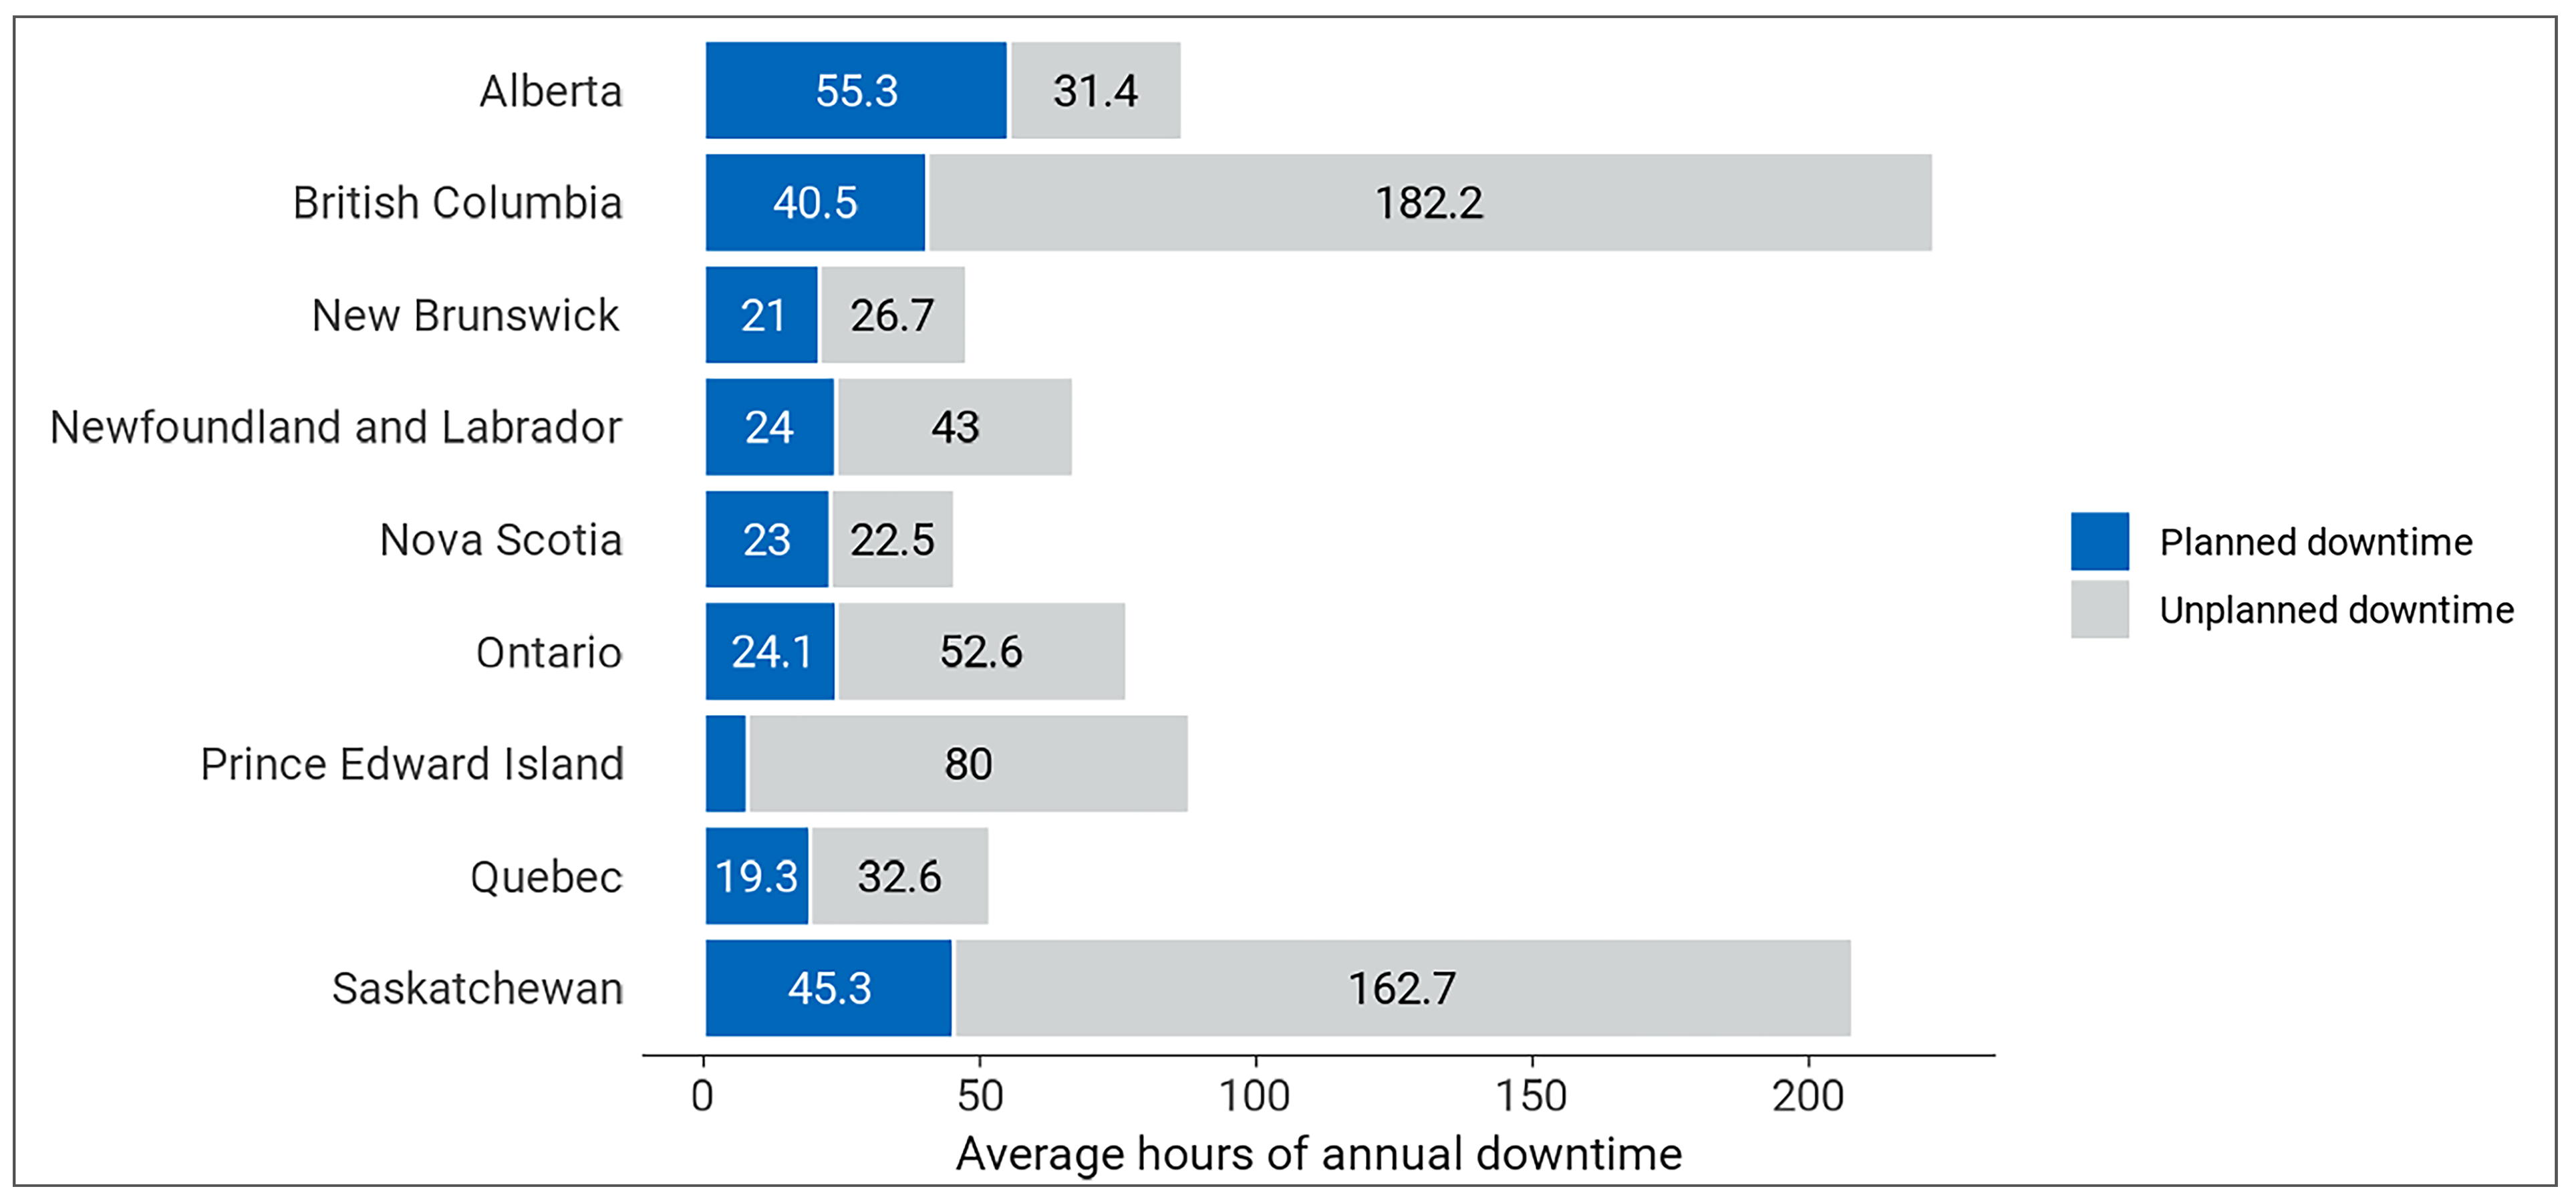
Notes: Survey response data for planned downtime were available for 79 out of 180 sites across 9 of the 10 jurisdictions with SPECT-CT capacity. No data were available for Manitoba. Survey response data for unplanned downtime were available for 67 out of 180 sites across 9 of the 10 jurisdictions with SPECT-CT capacity. No data were available for Manitoba.
Data were derived from the survey questions: “How much planned downtime is anticipated for scheduled maintenance for all units in a given year? (expressed in hours)” and “How much unplanned downtime is experienced for all units in a given year? (expressed in hours).” Bars are labelled with the number of hours in each category.
Figure 15: Average Downtime at Sites With SPECT Units by Reporting Jurisdictions With Capacity, 2022–2023
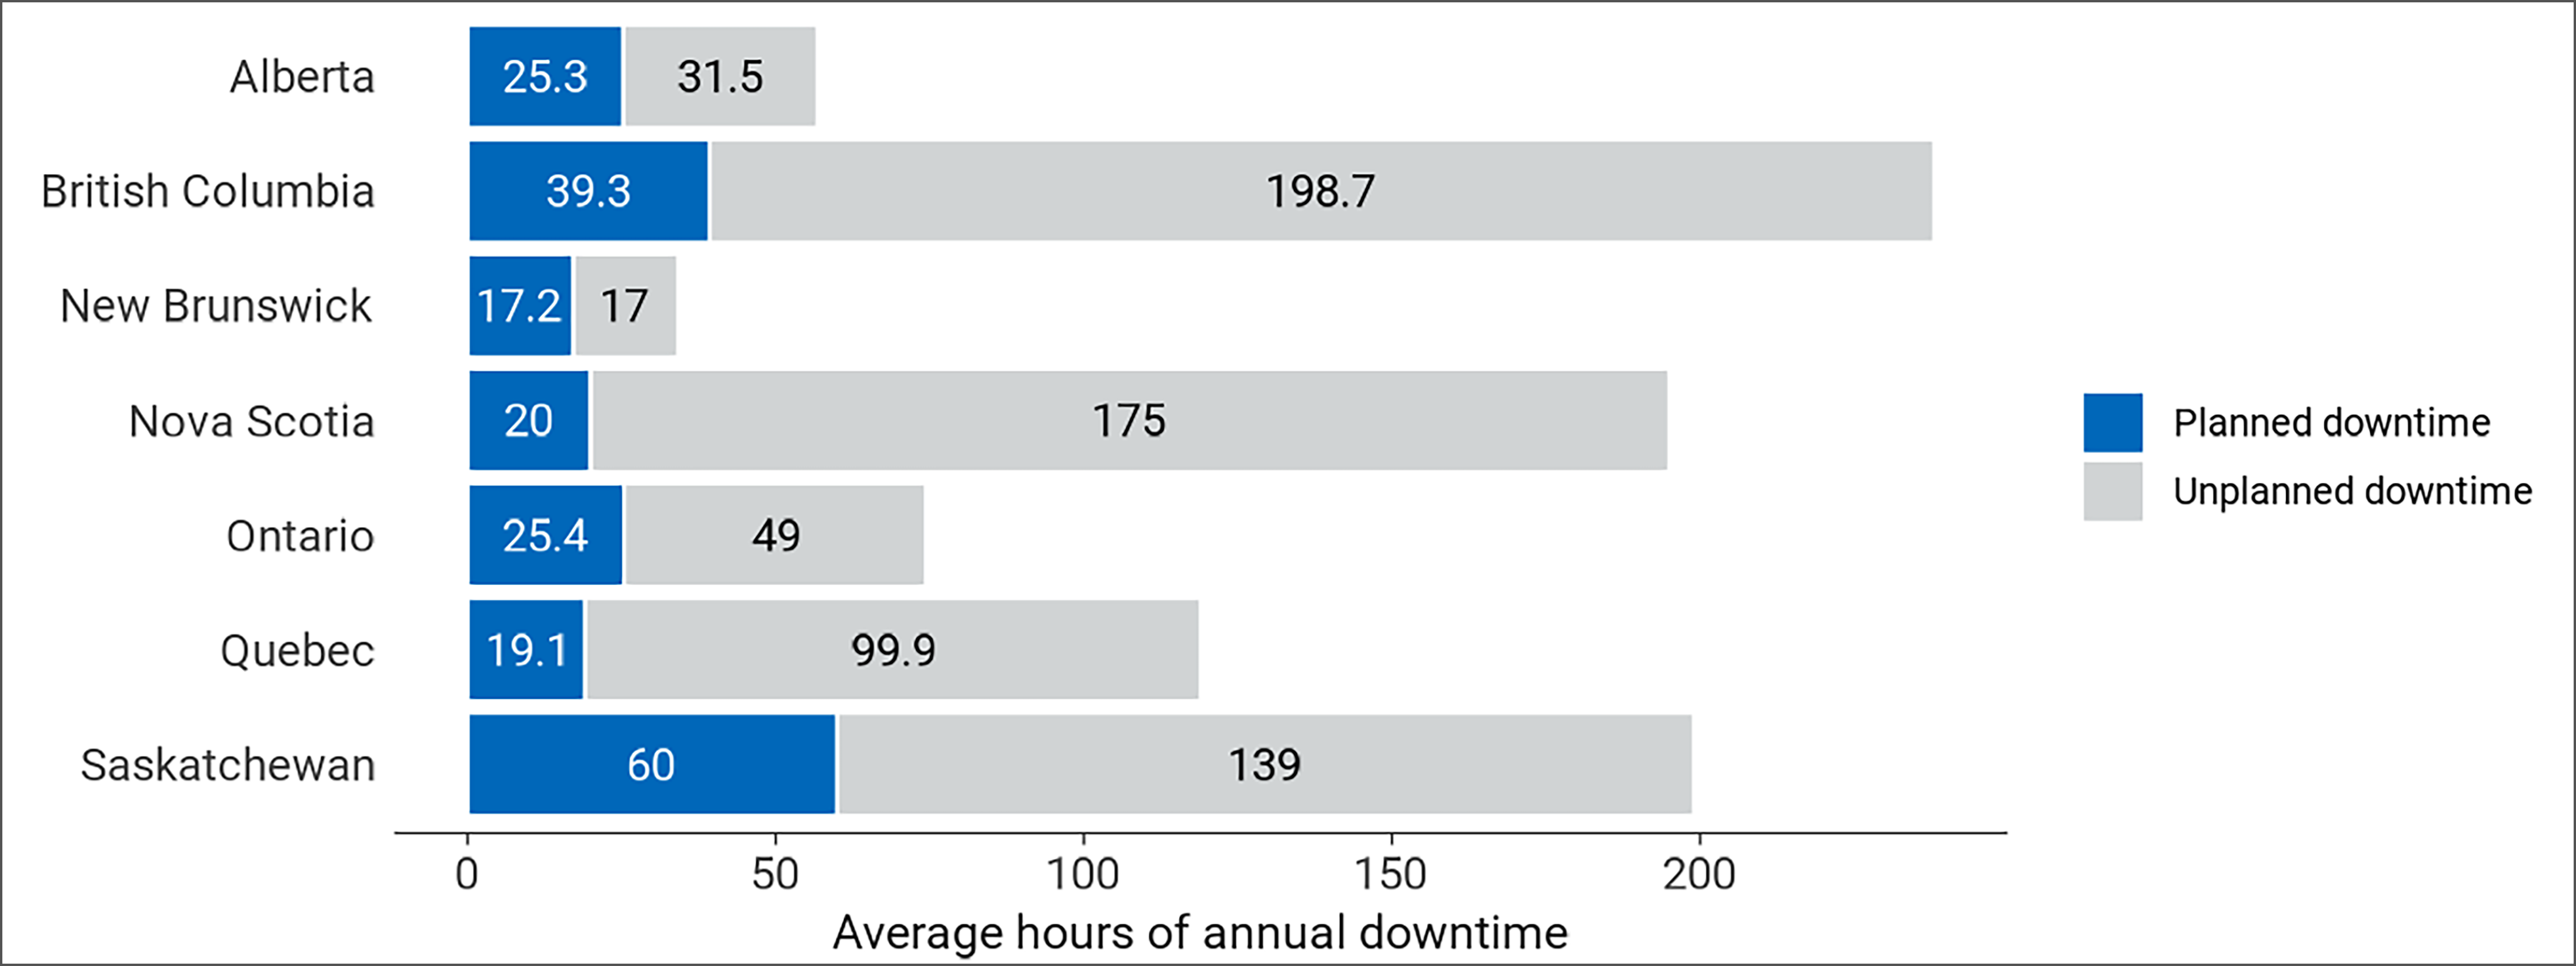
Notes: Survey response data for planned downtime were available for 50 out of 138 sites across 7 of the 9 jurisdictions with SPECT capacity. No data were available for Manitoba and Newfoundland and Labrador. Survey response data for unplanned downtime were available for 44 out of 138 sites across 7 of the 9 jurisdictions with SPECT capacity. No data were available for Manitoba and Newfoundland and Labrador.
Data were derived from the survey questions: “How much planned downtime is anticipated for scheduled maintenance for all units in a given year? (expressed in hours)” and “How much unplanned downtime is experienced for all units in a given year? (expressed in hours).” Bars are labelled with the number of hours in each category.
Equipment Servicing at Sites With SPECT-CT and SPECT Imaging
The routine maintenance, inspection, and calibration of imaging equipment is usually managed though different types of equipment service agreements. Equipment servicing is part of health technology management and is intended to optimize the use of imaging equipment across its life cycle. The survey participants were asked to report on methods of servicing imaging equipment. The servicing methods included à la carte, full vendor, insurance, managed service contracts, shared service, third party, under warranty, and others. Definitions for types of servicing methods are available in Appendix 2.
Data were derived from the survey question: “How is imaging equipment serviced?”
Survey participants were asked to report these data at the modality level rather than the unit level. We received feedback indicating that, at sites with more than 1 unit, in some instances, different servicing agreements may be used for different units.
For SPECT-CT, the most commonly used equipment servicing method is full vendor service, with 54.3% of sites, followed by shared service (36.2%) (Table 4).
For SPECT, the most commonly used equipment servicing method is full vendor service, with 45% sites, followed by shared service (35%) (Table 5).
Table 4: Imaging Equipment Servicing Methods at Sites With SPECT-CT Units by Reporting Jurisdictions With Capacity, 2022–2023
Province or territory | À la carte (time and parts by external service provider) | Full vendor service contract | Insurance | Managed equipment service | Other | Shared service (between vendor and in house or a third party) | Third party |
|---|---|---|---|---|---|---|---|
Alberta | 0 (0) | 13 (72.2) | 0 (0) | 0 (0) | 0 (0) | 5 (27.8) | 0 (0) |
British Columbia | 0 (0) | 9 (47.4) | 0 (0) | 0 (0) | 0 (0) | 10 (52.6) | 0 (0) |
Manitoba | 0 (0) | 2 (20) | 0 (0) | 0 (0) | 0 (0) | 8 (80) | 0 (0) |
New Brunswick | 0 (0) | 2 (50) | 0 (0) | 0 (0) | 0 (0) | 2 (50) | 0 (0) |
Newfoundland and Labrador | 0 (0) | 3 (100) | 0 (0) | 0 (0) | 0 (0) | 0 (0) | 0 (0) |
Northwest Territories | NA | NA | NA | NA | NA | NA | NA |
Nova Scotia | 0 (0) | 6 (100) | 0 (0) | 0 (0) | 0 (0) | 0 (0) | 0 (0) |
Nunavut | NA | NA | NA | NA | NA | NA | NA |
Ontario | 0 (0) | 14 (48.3) | 0 (0) | 4 (13.8) | 1 (3.4) | 7 (24.1) | 3 (10.3) |
Prince Edward Island | 0 (0) | 1 (100) | 0 (0) | 0 (0) | 0 (0) | 0 (0) | 0 (0) |
Quebec | 0 (0) | 6 (50) | 0 (0) | 1 (8.3) | 1 (8.3) | 4 (33.3) | 0 (0) |
Saskatchewan | 0 (0) | 1 (33.3) | 0 (0) | 0 (0) | 0 (0) | 2 (66.7) | 0 (0) |
Yukon | NA | NA | NA | NA | NA | NA | NA |
Canada | 0 (0) | 57 (54.3) | 0 (0) | 5 (4.8) | 2 (1.9) | 38 (36.2) | 3 (2.9) |
NA = not applicable.
Notes: Survey response data were available for 105 out of 180 sites across all jurisdictions with SPECT-CT capacity.
Table 5: Imaging Equipment Servicing Methods at Sites With SPECT Units by Reporting Jurisdictions With Capacity, 2022–2023
Province or territory | À la carte (time and parts by external service provider) | Full vendor service contract | Insurance | Managed equipment service | Other | Shared service (between vendor and in house or a third party) | Third party |
|---|---|---|---|---|---|---|---|
Alberta | 0 (0) | 3 (50) | 0 (0) | 0 (0) | 0 (0) | 3 (50) | 0 (0) |
British Columbia | 1 (14.3) | 1 (14.3) | 0 (0) | 0 (0) | 0 (0) | 5 (71.4) | 0 (0) |
Manitoba | 0 (0) | 1 (25) | 0 (0) | 0 (0) | 0 (0) | 3 (75) | 0 (0) |
New Brunswick | 0 (0) | 2 (50) | 0 (0) | 0 (0) | 0 (0) | 2 (50) | 0 (0) |
Newfoundland and Labrador | NR | NR | NR | NR | NR | NR | NR |
Northwest Territories | NA | NA | NA | NA | NA | NA | NA |
Nova Scotia | 0 (0) | 4 (100) | 0 (0) | 0 (0) | 0 (0) | 0 (0) | 0 (0) |
Nunavut | NA | NA | NA | NA | NA | NA | NA |
Ontario | 0 (0) | 9 (33.3) | 1 (3.7) | 3 (11.1) | 2 (7.4) | 7 (25.9) | 5 (18.5) |
Prince Edward Island | NA | NA | NA | NA | NA | NA | NA |
Quebec | 0 (0) | 5 (83.3) | 0 (0) | 0 (0) | 0 (0) | 1 (16.7) | 0 (0) |
Saskatchewan | 0 (0) | 2 (100) | 0 (0) | 0 (0) | 0 (0) | 0 (0) | 0 (0) |
Yukon | NA | NA | NA | NA | NA | NA | NA |
Canada | 1 (1.7) | 27 (45.0) | 1 (1.7) | 3 (5.0) | 2 (3.3) | 21 (35.0) | 5 (8.3) |
NA = not applicable; NR = not reported.
Notes: Survey response data were available for 60 out of 138 sites across 8 of the 9 jurisdictions with SPECT capacity. No data were available for Newfoundland and Labrador.
Data were derived from the survey question: “How is imaging equipment serviced?”
Full-Time Equivalent Medical Radiation Technologists for SPECT-CT and SPECT Units
Sites were asked to provide information on the number of full-time equivalent (FTE) medical radiation technologists (MRTs) assigned at the site level. An FTE position for an MRT was defined as an 8-hour workday, 5 days per week. The reported number of FTE MRTs may not reflect the total number of filled FTE MRTs in jurisdictions with SPECT-CT or SPECT capacity, but rather the total number of budgeted positions. MRTs that work with SPECT and SPECT-CT are often the same staff. In some instances, jurisdiction-reported data may include combined MRT counts.
For SPECT-CT, an average of 4 FTE MRTs are assigned per site, ranging from 1 to 18 (Table 6).
For SPECT, an average of 4 FTE MRT are assigned per site, ranging from 1 to 18 (Table 7).
Table 6: Number of Full-time Equivalent MRT for SPECT-CT, 2022–2023
Province or territory | Number of reporting sites | Total FTE MRTs | Average FTE MRTs per site (minimum to maximum) | FTE MRTs per million populationa | Total unitsb |
|---|---|---|---|---|---|
Alberta | 19 | 76 | 4 (1 to 9) | 16.2 | 39 |
British Columbia | 18 | 85 | 4.7 (2 to 10) | 15.6 | 50 |
Manitoba | 5c | 37 | 7.4 (3 to 14) | 25.6 | 10 |
New Brunswick | 4 | 15 | 3.8 (2 to 6) | 18 | 8 |
Newfoundland and Labrador | 3 | 15 | 5 (2 to 10) | 28.1 | 8 |
Northwest Territories | NA | NA | NA | NA | NA |
Nova Scotia | 3 | 7 | 2.3 (2 to 3) | 6.7 | 9 |
Nunavut | NA | NA | NA | NA | NA |
Ontario | 28 | 97 | 3.5 (1 to 12) | 6.3 | 92 |
Prince Edward Island | 1 | 3 | 3 (3 to 3) | 17 | 2 |
Quebec | 12 | 58 | 4.8 (1 to 18) | 6.6 | 107 |
Saskatchewan | 3 | 17 | 5.7 (1 to 8) | 13.9 | 6 |
Yukon | NA | NA | NA | NA | NA |
Canada | 96 | 410 | 4.3 (1 to 18) | 10.3 | 331 |
FTE = full-time equivalent; MRT = medical radiation technologist; NA = not applicable.
Notes: Survey response data available for 96 out of 180 sites across all jurisdictions with SPECT-CT capacity.
Data were derived from the survey question: “How many full-time equivalents (FTE) technologists are assigned to all units (collective number of FTEs for all units)?”
aThe population (estimated) as of the first quarter of 2023.14
bThese are per-jurisdiction unit counts according to the validator if the validator provided lists of units; where these were unavailable, the data came from the survey and responses from private sites.
cThis is a combined SPECT and SPECT-CT FTE MRT count.
Table 7: Number of Full-time Equivalent MRT for SPECT, 2022–2023
Province or territory | Number of reporting sites | Total FTE MRTs | Average FTE MRTs per site (minimum to maximum) | FTE MRTs per million populationa | Total SPECT unitsb |
|---|---|---|---|---|---|
Alberta | 14 | 68 | 4.9 (2 to 9) | 14.5 | 36 |
British Columbia | 5 | 16 | 3.2 (1 to 10) | 2.9 | 16 |
Manitoba | 0c | NA | NA | NA | 4 |
New Brunswick | 4 | 13 | 3.2 (2 to 6) | 15.6 | 6 |
Newfoundland and Labrador | 0 | NR | NR | NR | 1 |
Northwest Territories | NA | NA | NA | NA | NA |
Nova Scotia | 4 | 9 | 2.2 (2 to 3) | 8.6 | 7 |
Nunavut | NA | NA | NA | NA | NA |
Ontario | 24 | 83 | 3.5 (1 to 12) | 5.4 | 102 |
Prince Edward Island | NA | NA | NA | NA | NA |
Quebec | 9 | 28 | 3.1 (2 to 11) | 3.2 | 32 |
Saskatchewan | 2 | 20 | 10 (2 to 18) | 16.4 | 6 |
Yukon | NA | NA | NA | NA | NA |
Canada | 62 | 237 | 3.8 (1 to 18) | 5.9 | 210 |
FTE = full-time equivalent; MRT = medical radiation technologist; NA = not applicable; NR = no response.
Notes: Survey response data available for 62 out of 138 sites across 8 of the 9 jurisdictions with SPECT capacity. No data were available for Newfoundland and Labrador.
Data were derived from the survey question: “How many full-time equivalents (FTE) technologists are assigned to all units (collective number of FTEs for all units)?”
aThe population (estimated) as of the first quarter of 2023.14
bUnit count includes data from all sites included in the national survey that reported information for number of units.
cCombined SPECT-CT and SPECT FTE MRT counts are reported in Table 6.
Age of SPECT-CT and SPECT Imaging Equipment
Average Age of SPECT-CT
The average age of SPECT-CT equipment in Canada is 9.5 years, ranging between 0 and 19 years (Appendix 3, Table 26). More than half (54.6%) of SPECT-CT units were operational within the past 10 years and a fifth (18.9%) began operation within the past 5 years (Figure 16 and Appendix 3, Table 27). Table 48 (Appendix 4) presents the average age of equipment for publicly funded sites with capacity.
Ontario installed 3 new SPECT-CT units in 2022–2023. British Columbia and Quebec have each installed 2 new SPECT-CT units in 2022 to 2023, and New Brunswick installed 1 new SPECT-CT unit in 2022–2023.
Figure 16: Average Year of SPECT-CT Operation by Province and Territory, 2022– 2023
Notes: Survey response data were available for 185 of 331 SPECT-CT units across all jurisdictions with capacity.
Age for each unit was calculated from the survey question: “What year did (or will) the [modality] unit become operational?” subtracted from 2023.
Average Age of SPECT
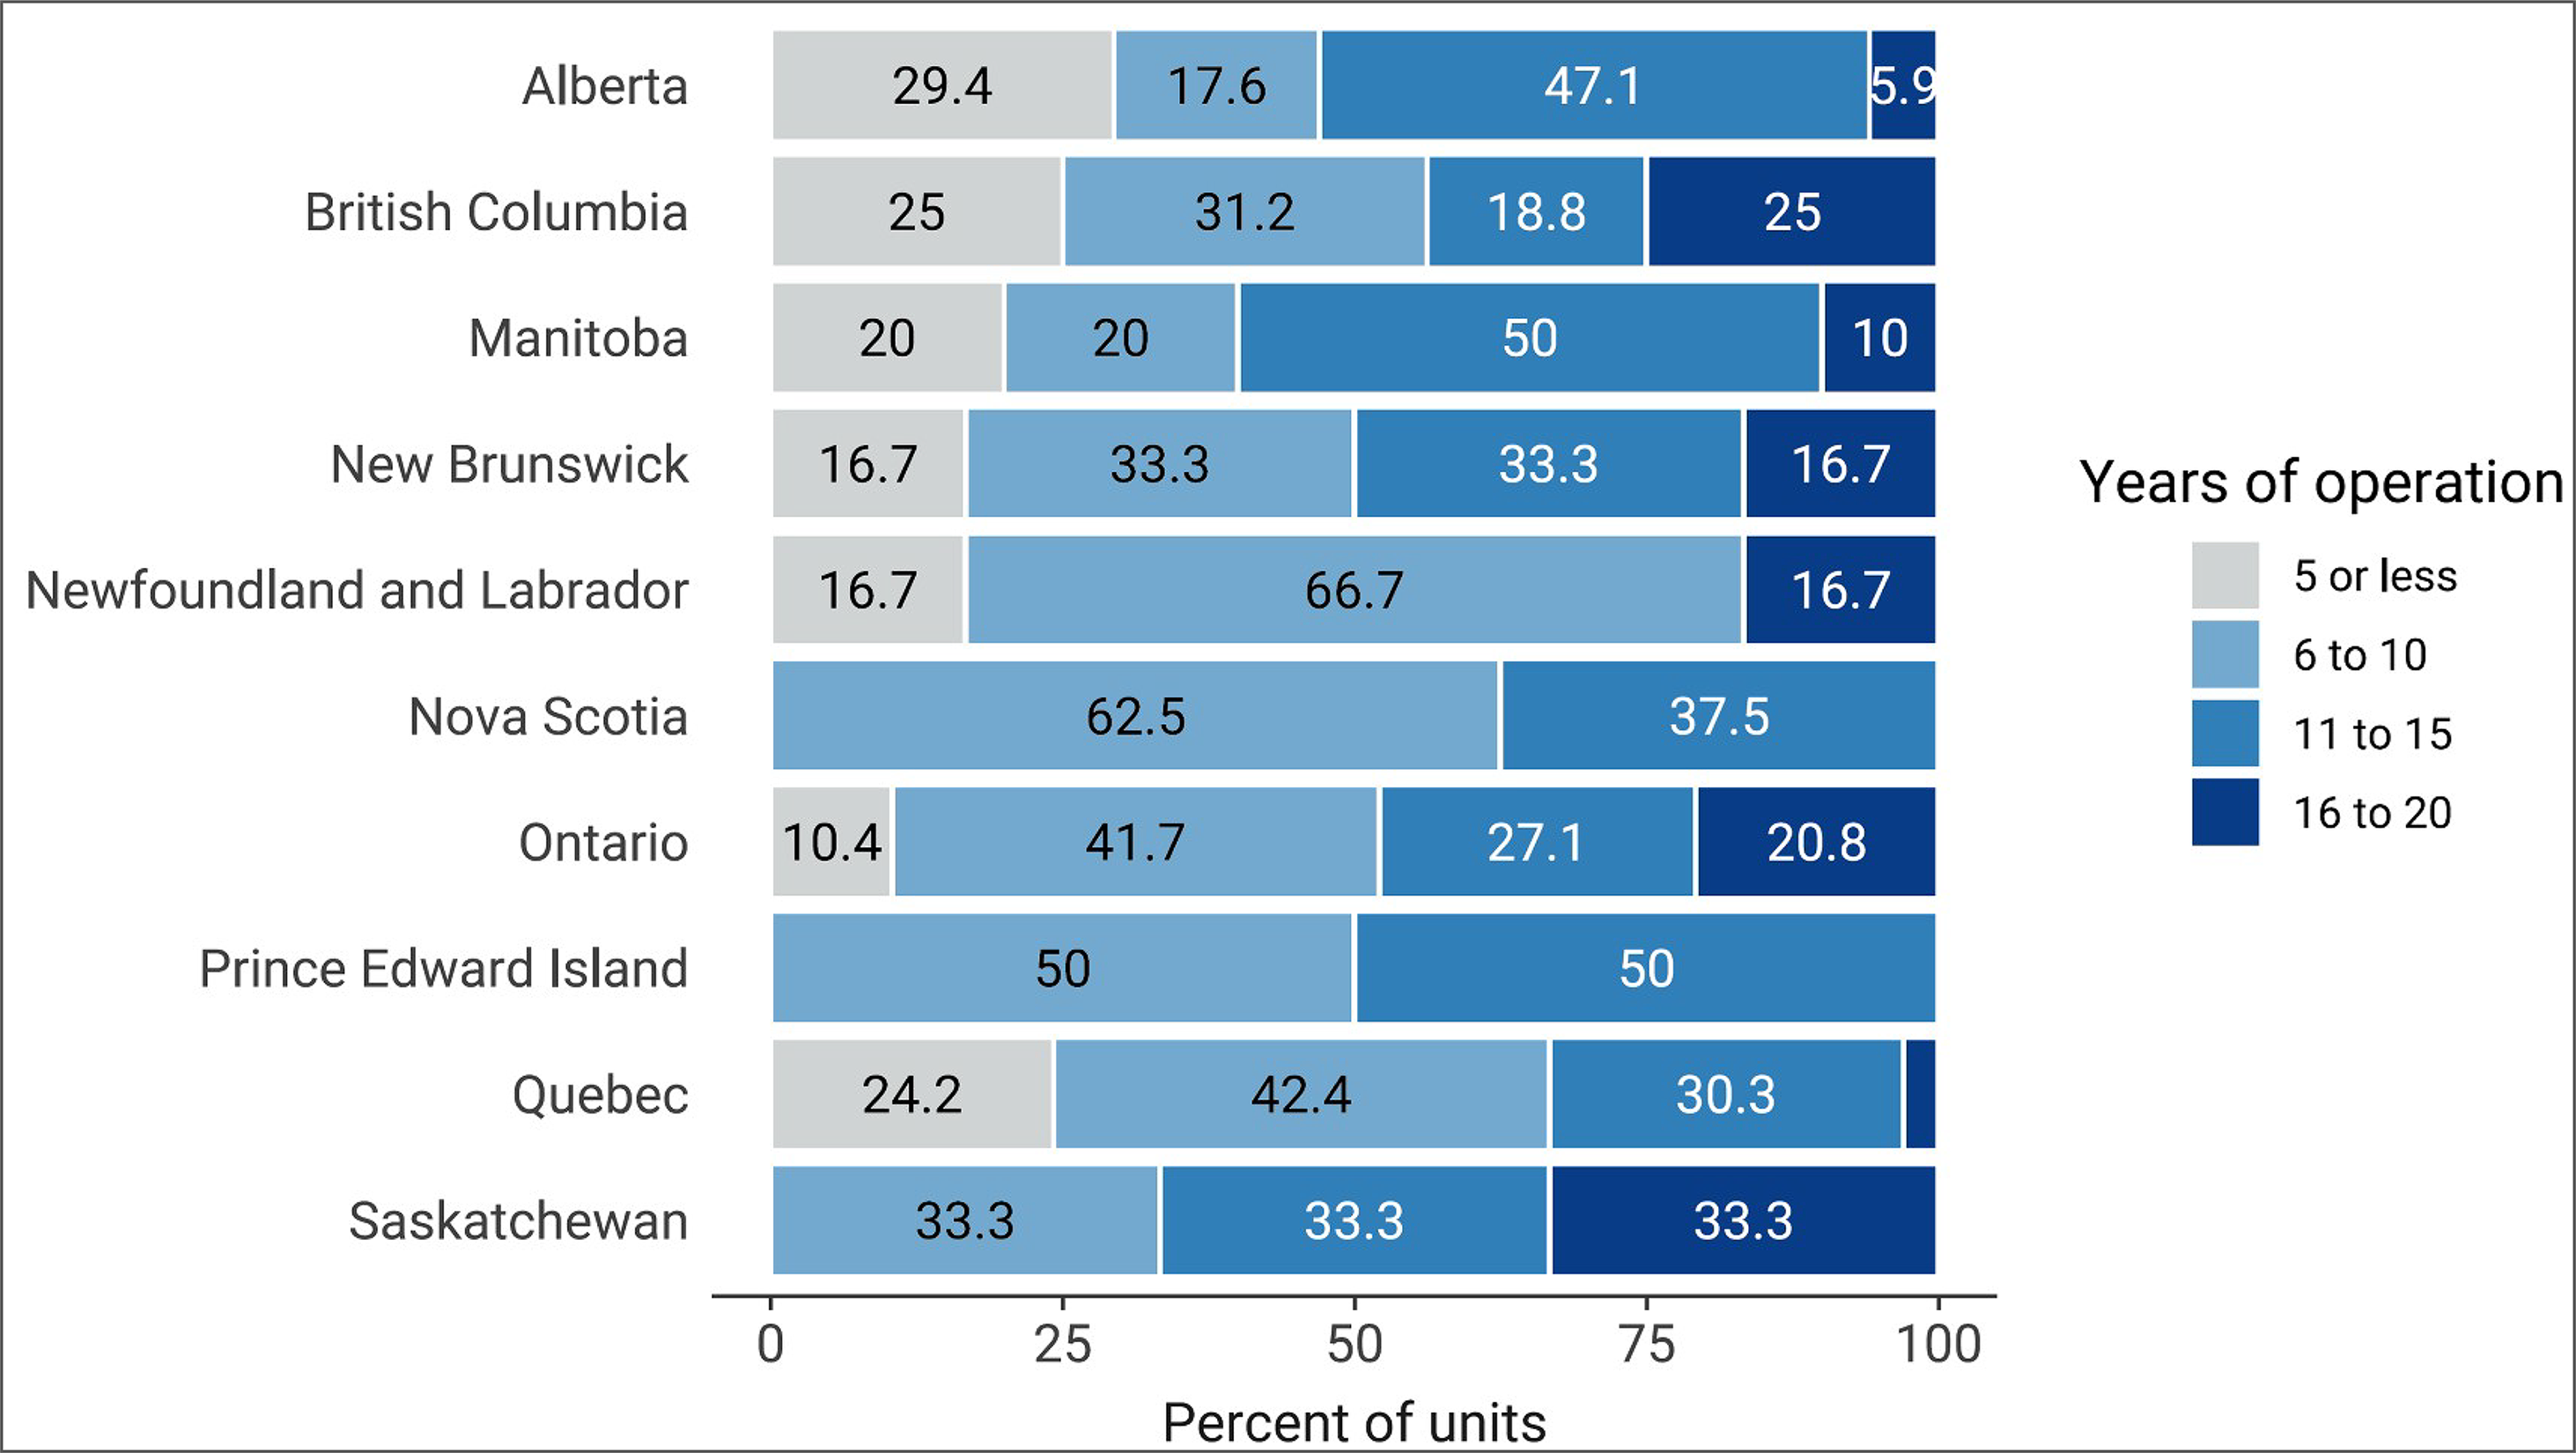
The average age of SPECT equipment in Canada is 14.5 years, ranging between 0 and 26 years (Appendix 3, Table 26). More than a fourth (27.8%) of SPECT units were operational within the past 10 years and less than a 10th (8.9%) began operation within the past 5 years (Figure 17 and Appendix 3, Table 28). Table 49 (Appendix 4) presents the average age of equipment for publicly funded sites with capacity.
Figure 17: Average Year of SPECT Operation by Province and Territory, 2022–2023
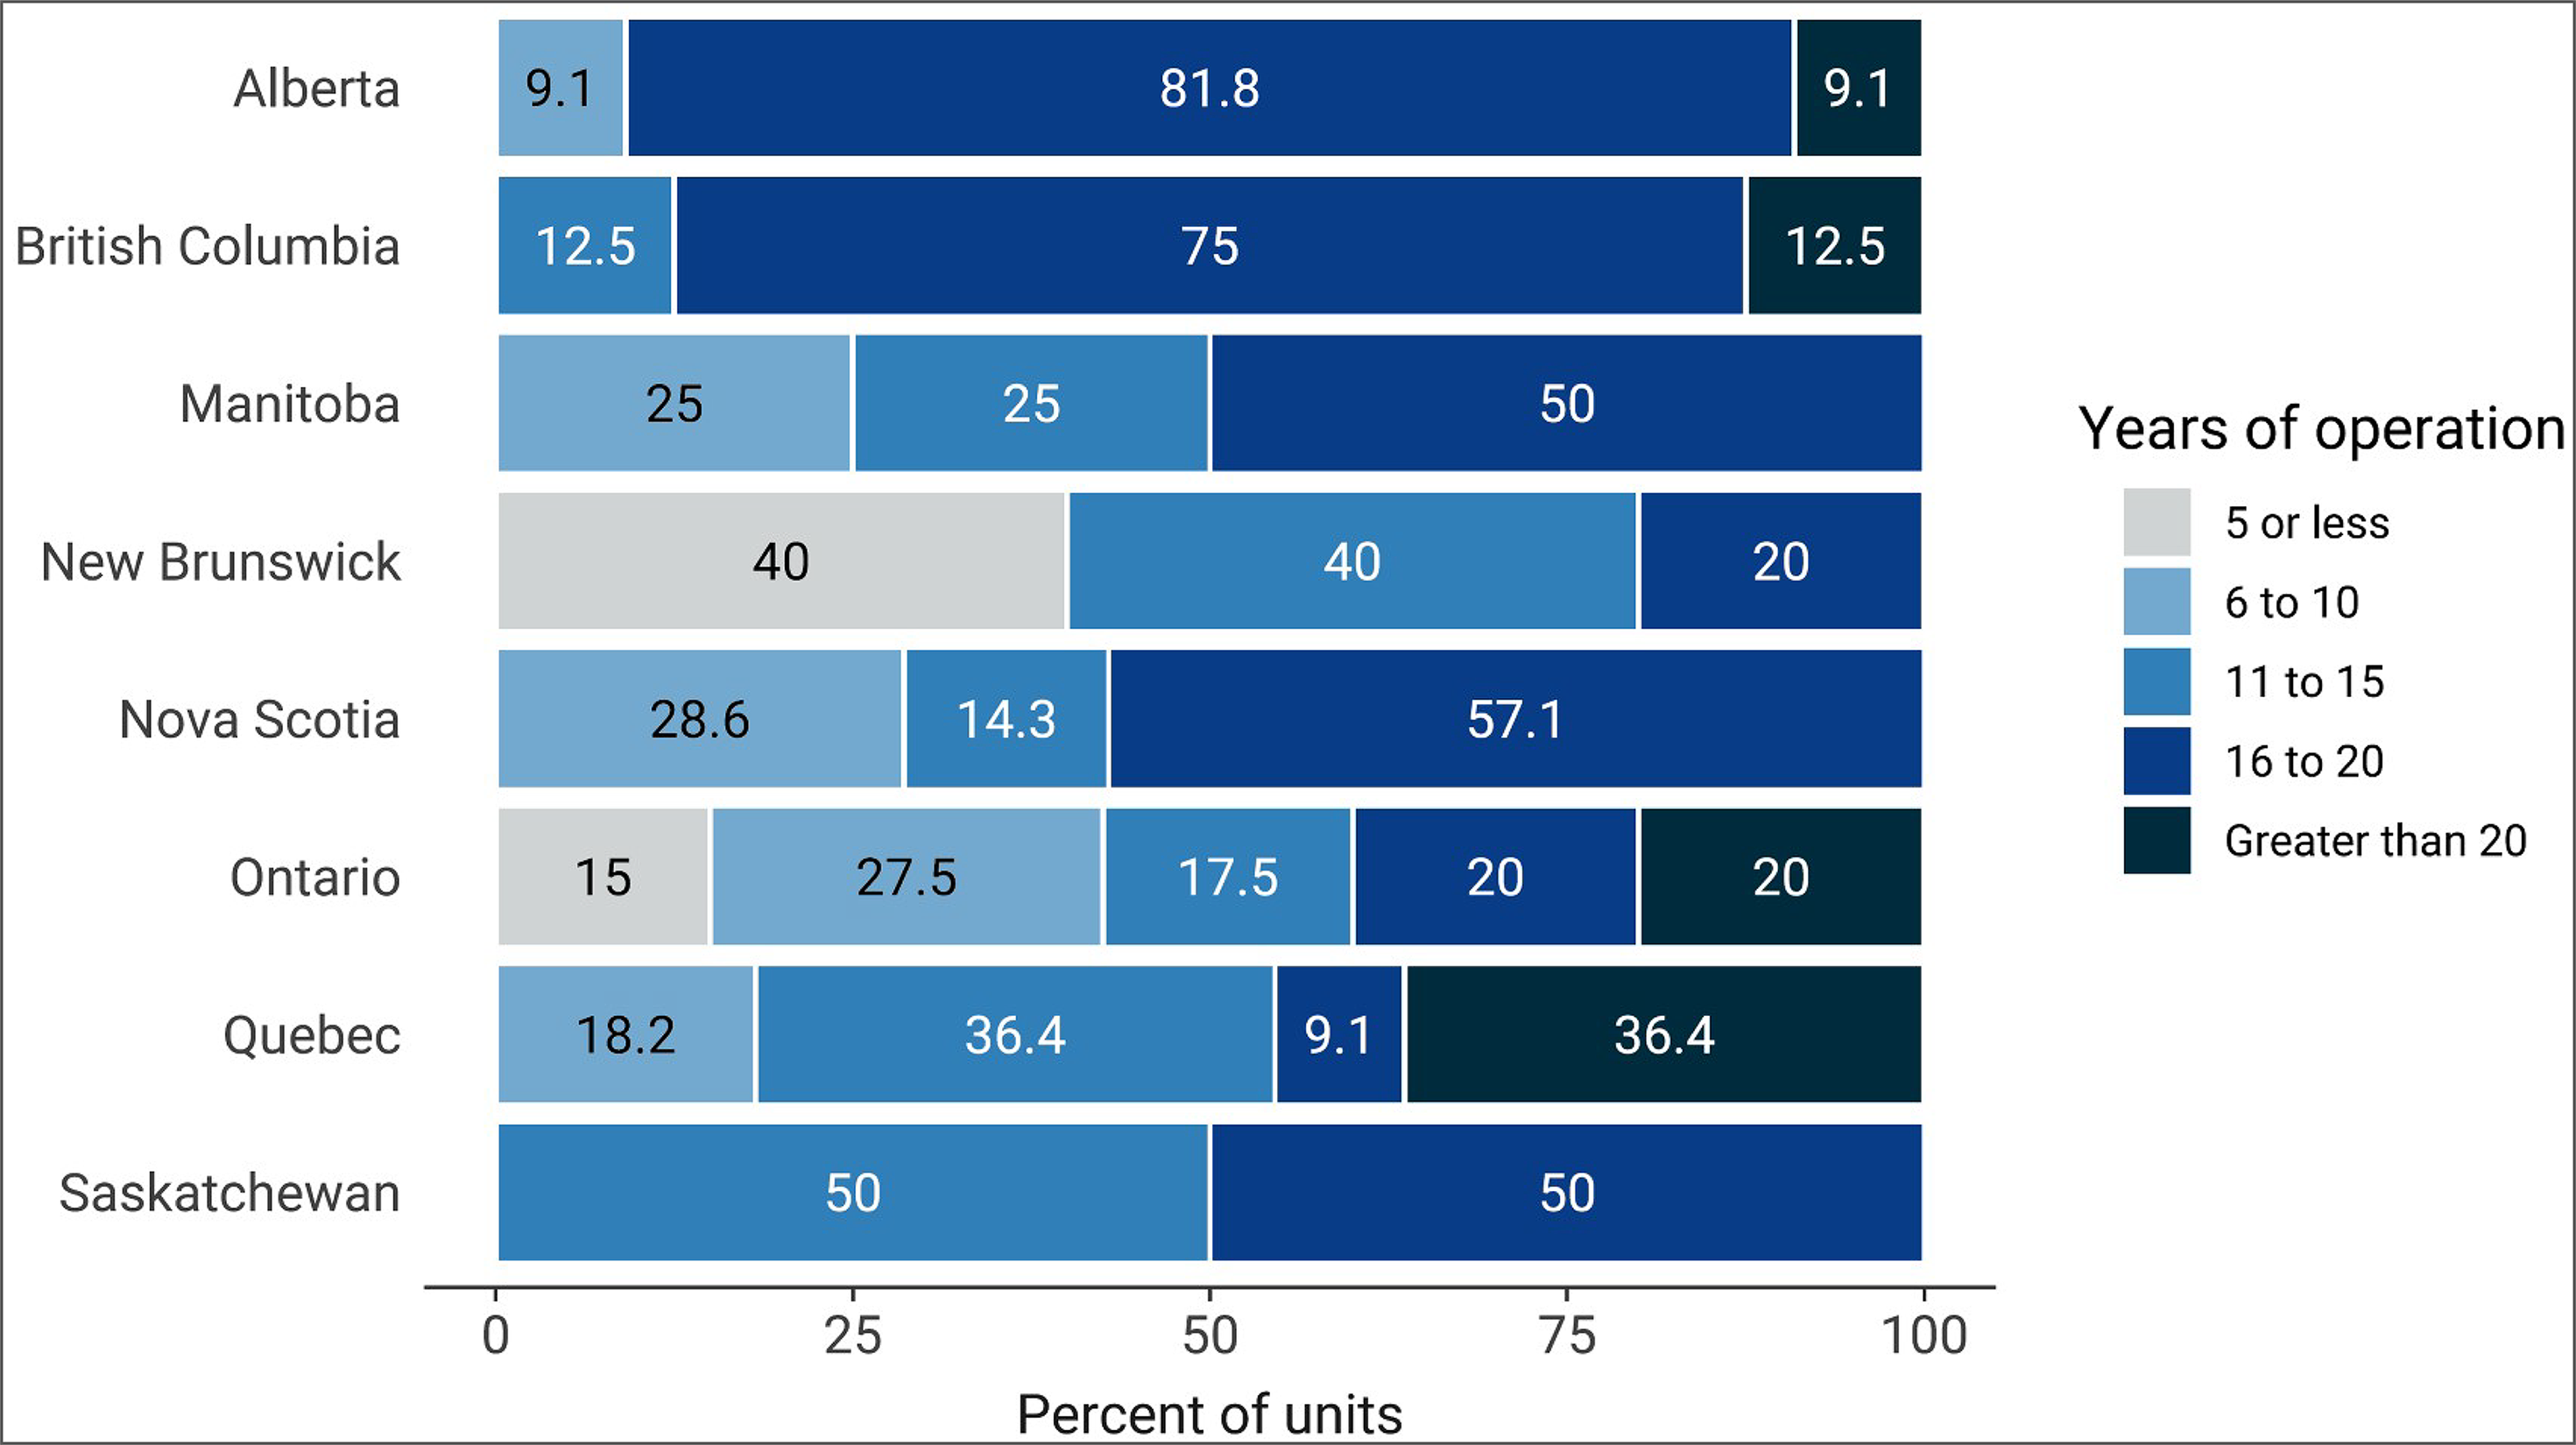
Notes: Survey response data were available for 90 of 210 SPECT units across 8 of the 9 jurisdictions with capacity. No data were available for Newfoundland and Labrador.
Age for each unit was calculated from the survey question: “What year did (or will) the [modality] unit become operational?” subtracted from 2023.
Patterns of Use of SPECT-CT and SPECT Imaging Equipment
Purpose and Indication for SPECT-CT and SPECT Units
Purpose of SPECT-CT Use
For all sites that provided exam use data, on average, SPECT-CT exams are most often indicated for oncology, at 26.6% (use at individual sites ranged from 0% to 65%), followed by cardiology at 23.7% (use at individual sites ranged from 0% to 100%), and musculoskeletal diseases at 23.1% (use at individual sites ranged from 0% to 100%) (Figure 18 and Appendix 3, Table 29).
SPECT-CT, on average, is most often used for diagnostic non-cardiac purposes (73.0%), followed by diagnostic cardiac purposes (27.3%), and research purposes (0.3%) (Figure 19 and Appendix 3, Table 30).
Figure 18: SPECT-CT Use by Clinical Specialty, 2022–2023
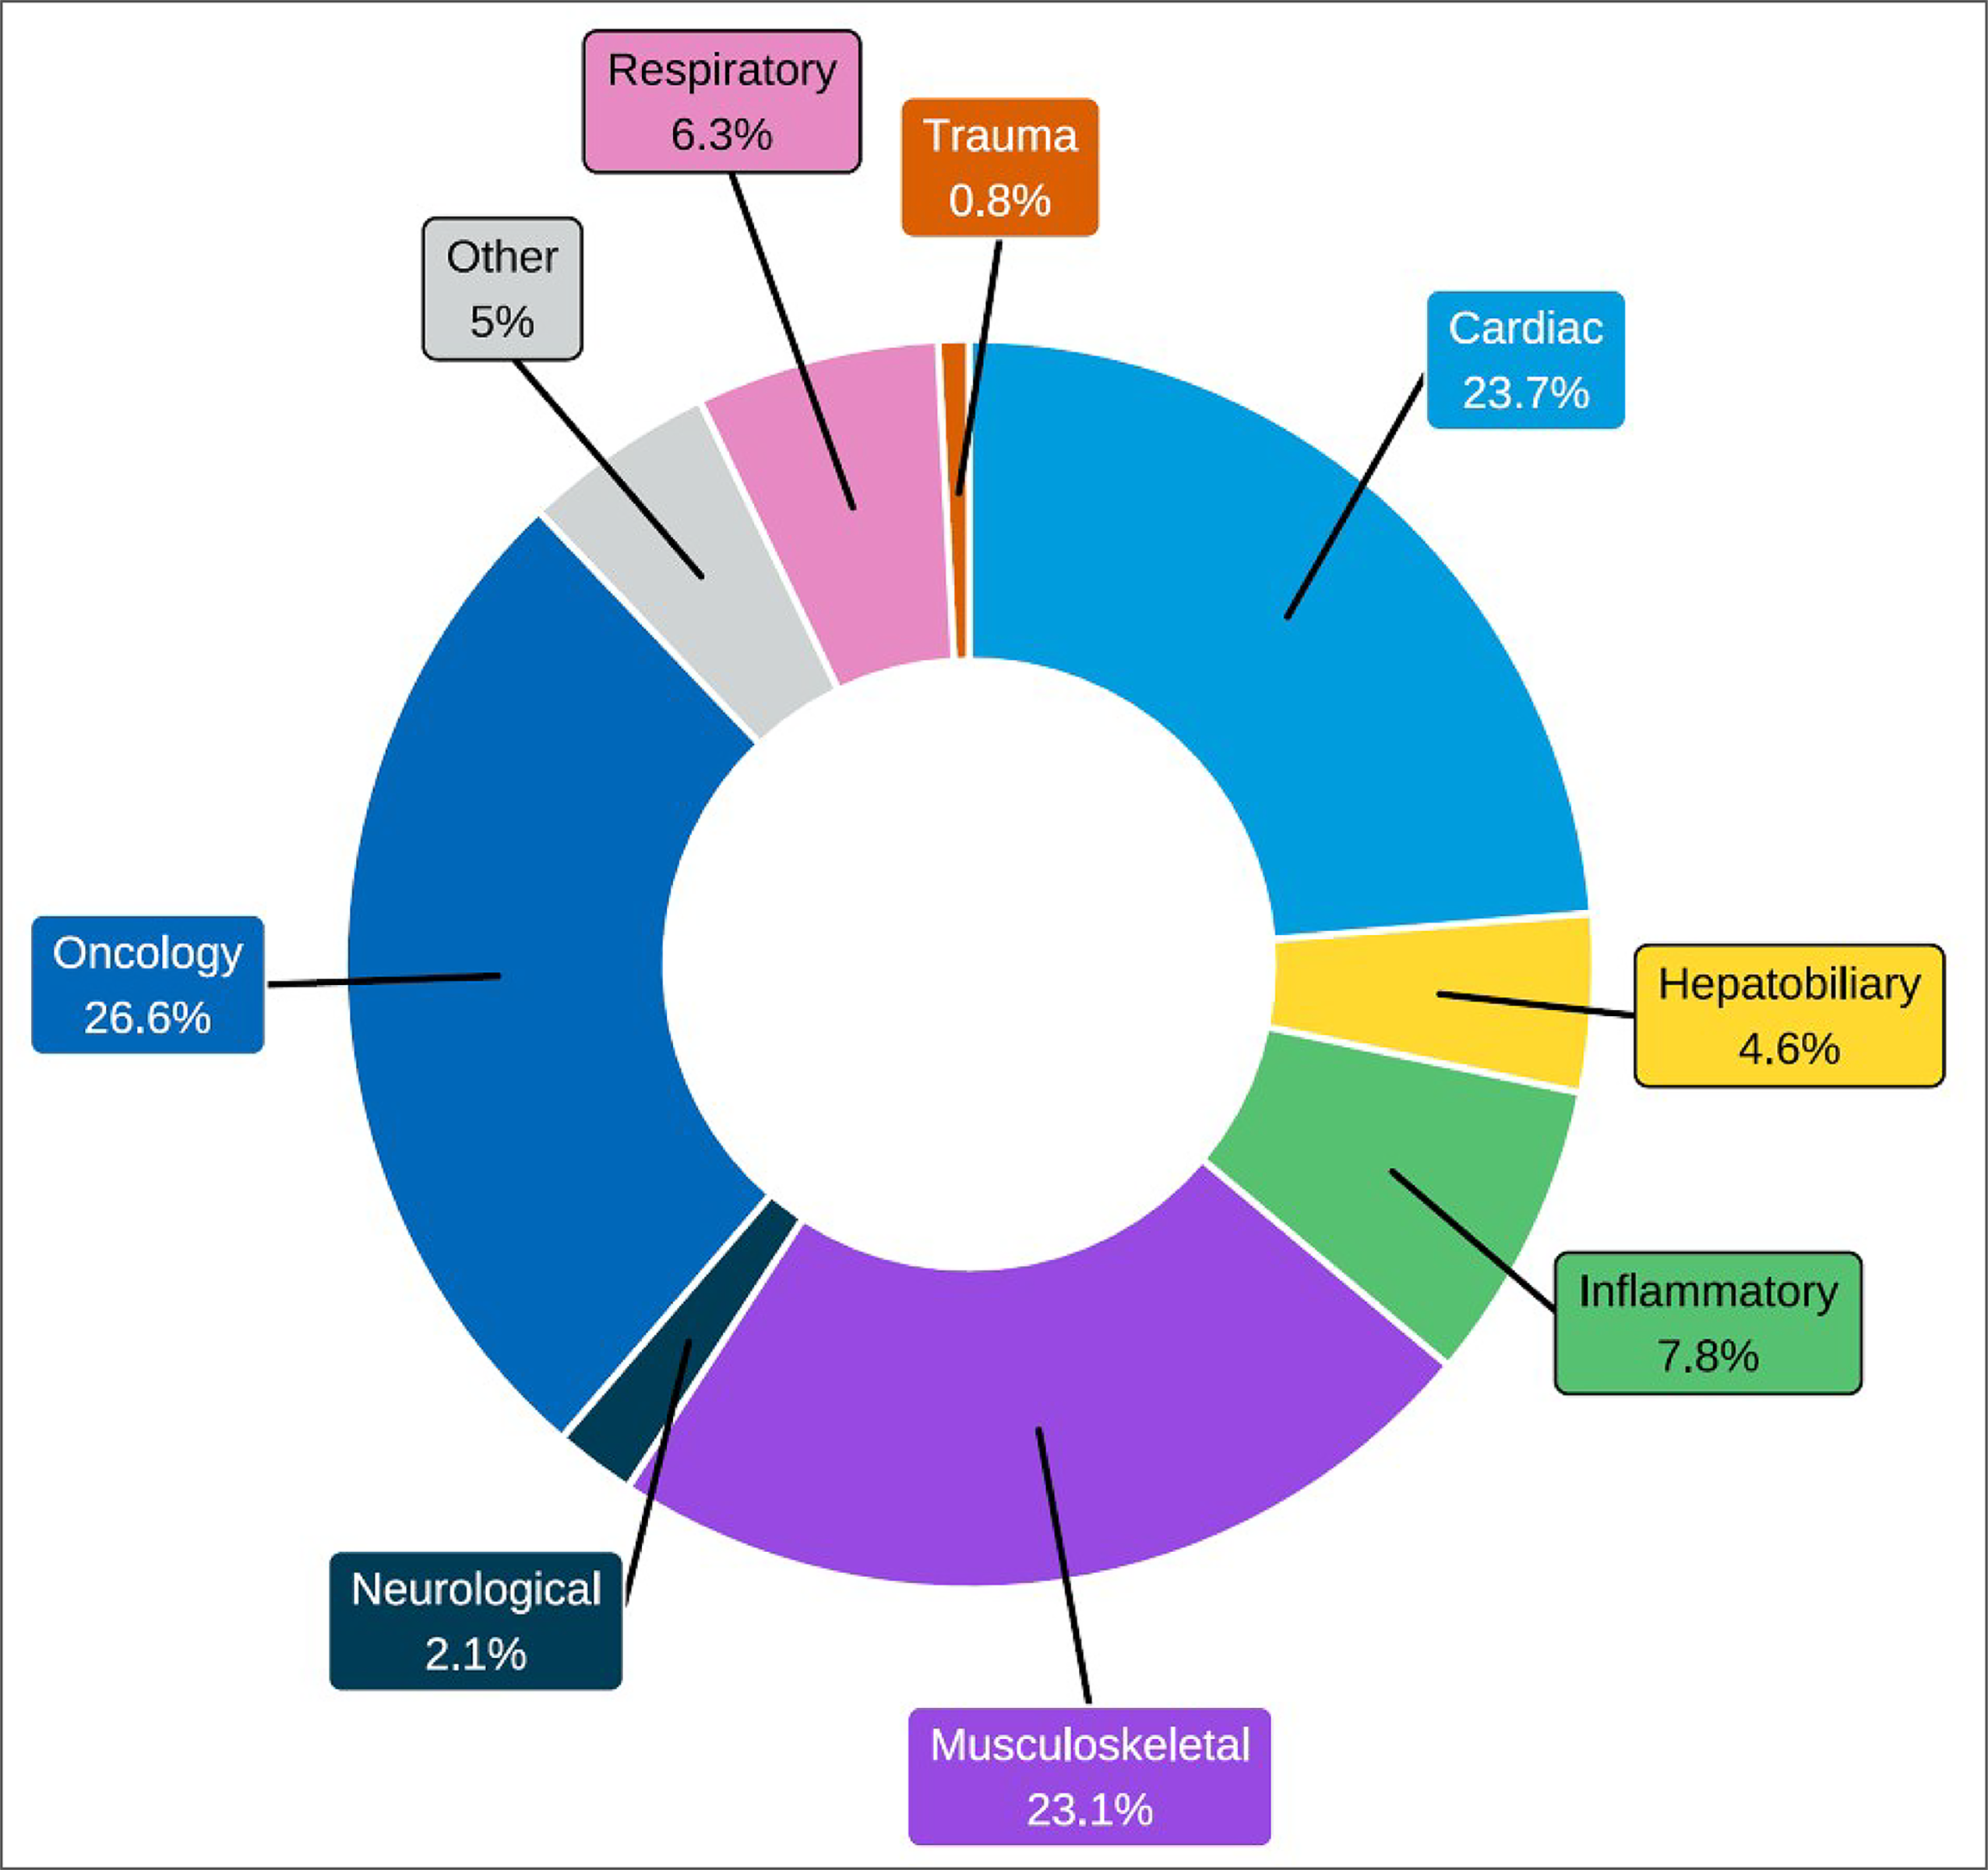
Notes: Survey response data on the average percentage of SPECT-CT use by discipline were available for 44 out of 180 sites across all 10 jurisdictions with SPECT-CT capacity.
Data were derived from the survey question: “On average, what percentage of these exams fall into the following categories? The total percentage, expressed as a number, must add up to 100.” The following categories were offered: oncology, respiratory, hepatobiliary, musculoskeletal, inflammatory or infectious disease, neurologic, cardiac, trauma, and other.
Figure 19: Purpose of SPECT-CT Use by Medical Category, 2022–2023
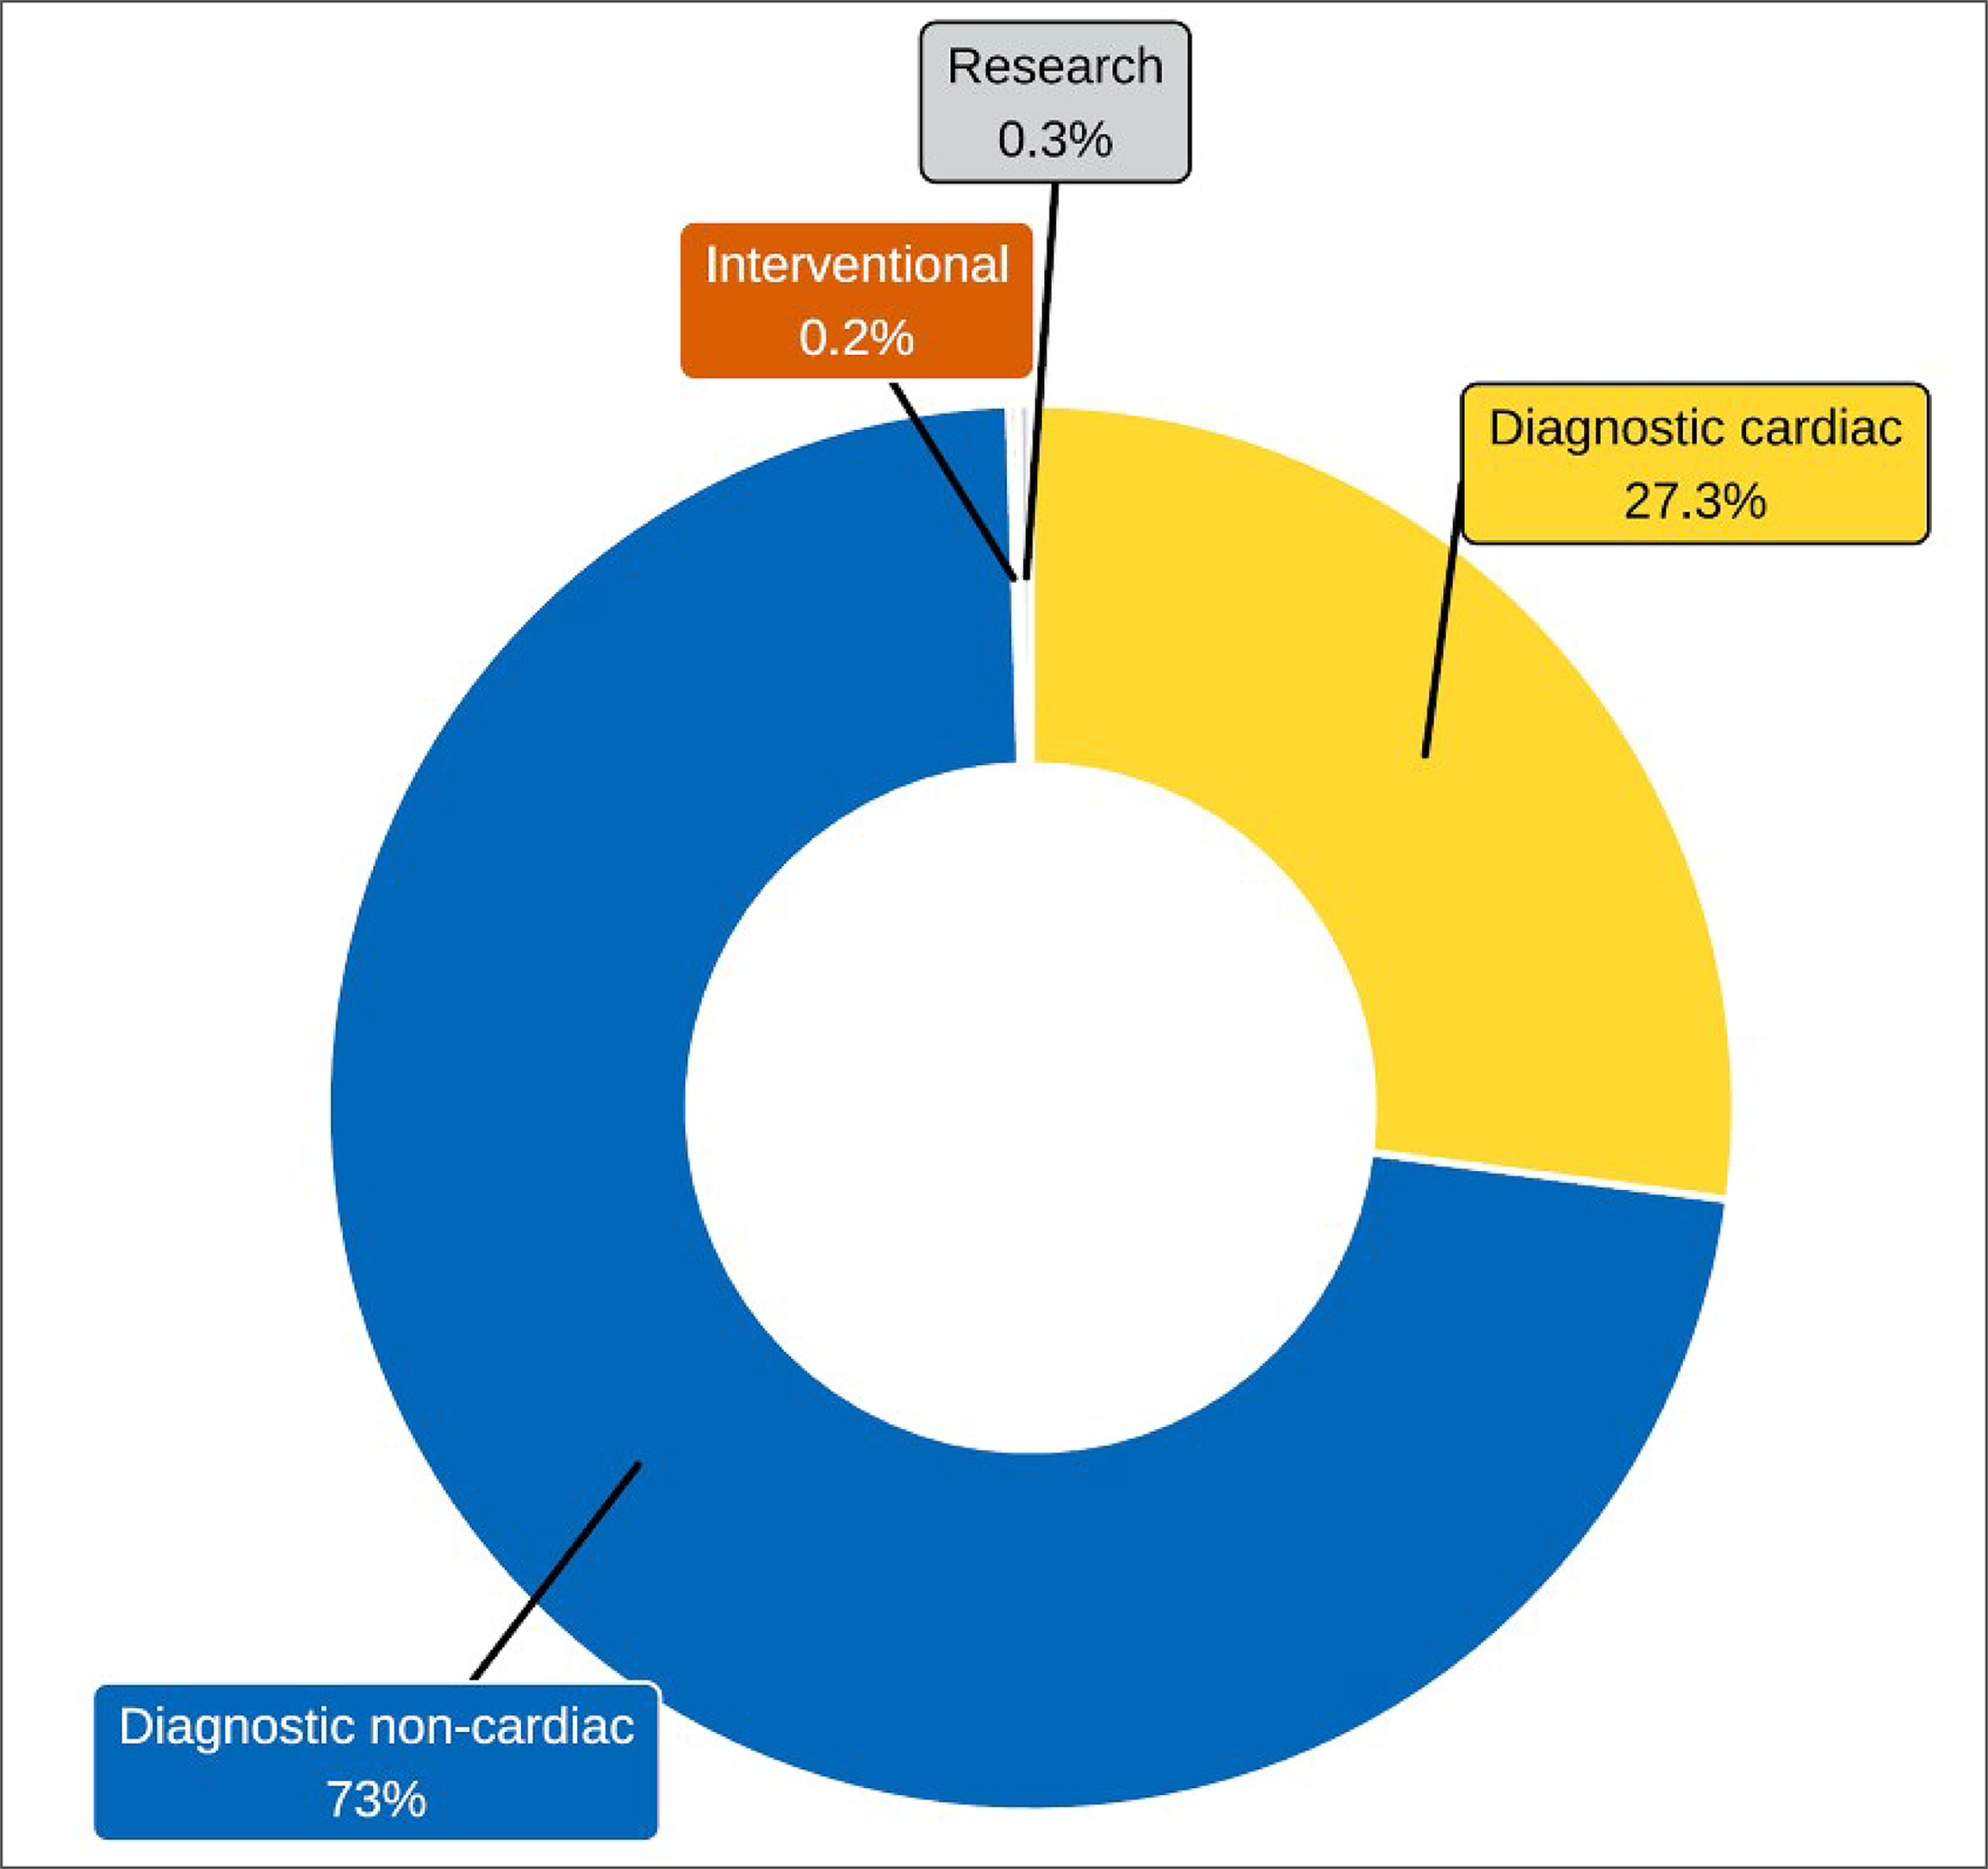
Notes: Survey response data were available for 78 sites out of 180 sites across 9 out of 10 jurisdictions with SPECT-CT capacity. No data were available for Manitoba.
Data were derived from the survey question: “Based on your practice in the last fiscal year, what percentage of time are all units used for? The total percentage, expressed as a number, must add up to 100.” The following categories were offered: Diagnostic purposes (cardiac only), Diagnostic purposes (non-cardiac), Research, Interventional, and Other.
Purpose of SPECT Use
For all sites that provided exam use data, on average, SPECT exams are most often indicated for cardiac conditions, at 32.1% (use at individual sites ranged from 0% to 100%), followed by oncology at 26.1% (use at individual sites ranged from 0% to 80%), and musculoskeletal diseases at 13.4% (use at individual sites ranged from 0% to 55%) (Figure 20 and Appendix 3, Table 31).
SPECT, on average, was most often used for diagnostic non-cardiac purposes (71.2%), followed by diagnostic cardiac purposes (27.8%). None of the responding sites reported using SPECT for interventional use or other use (Figure 21 and Appendix 3, Table 32).
Figure 20: SPECT Use by Clinical Specialty, 2022–2023
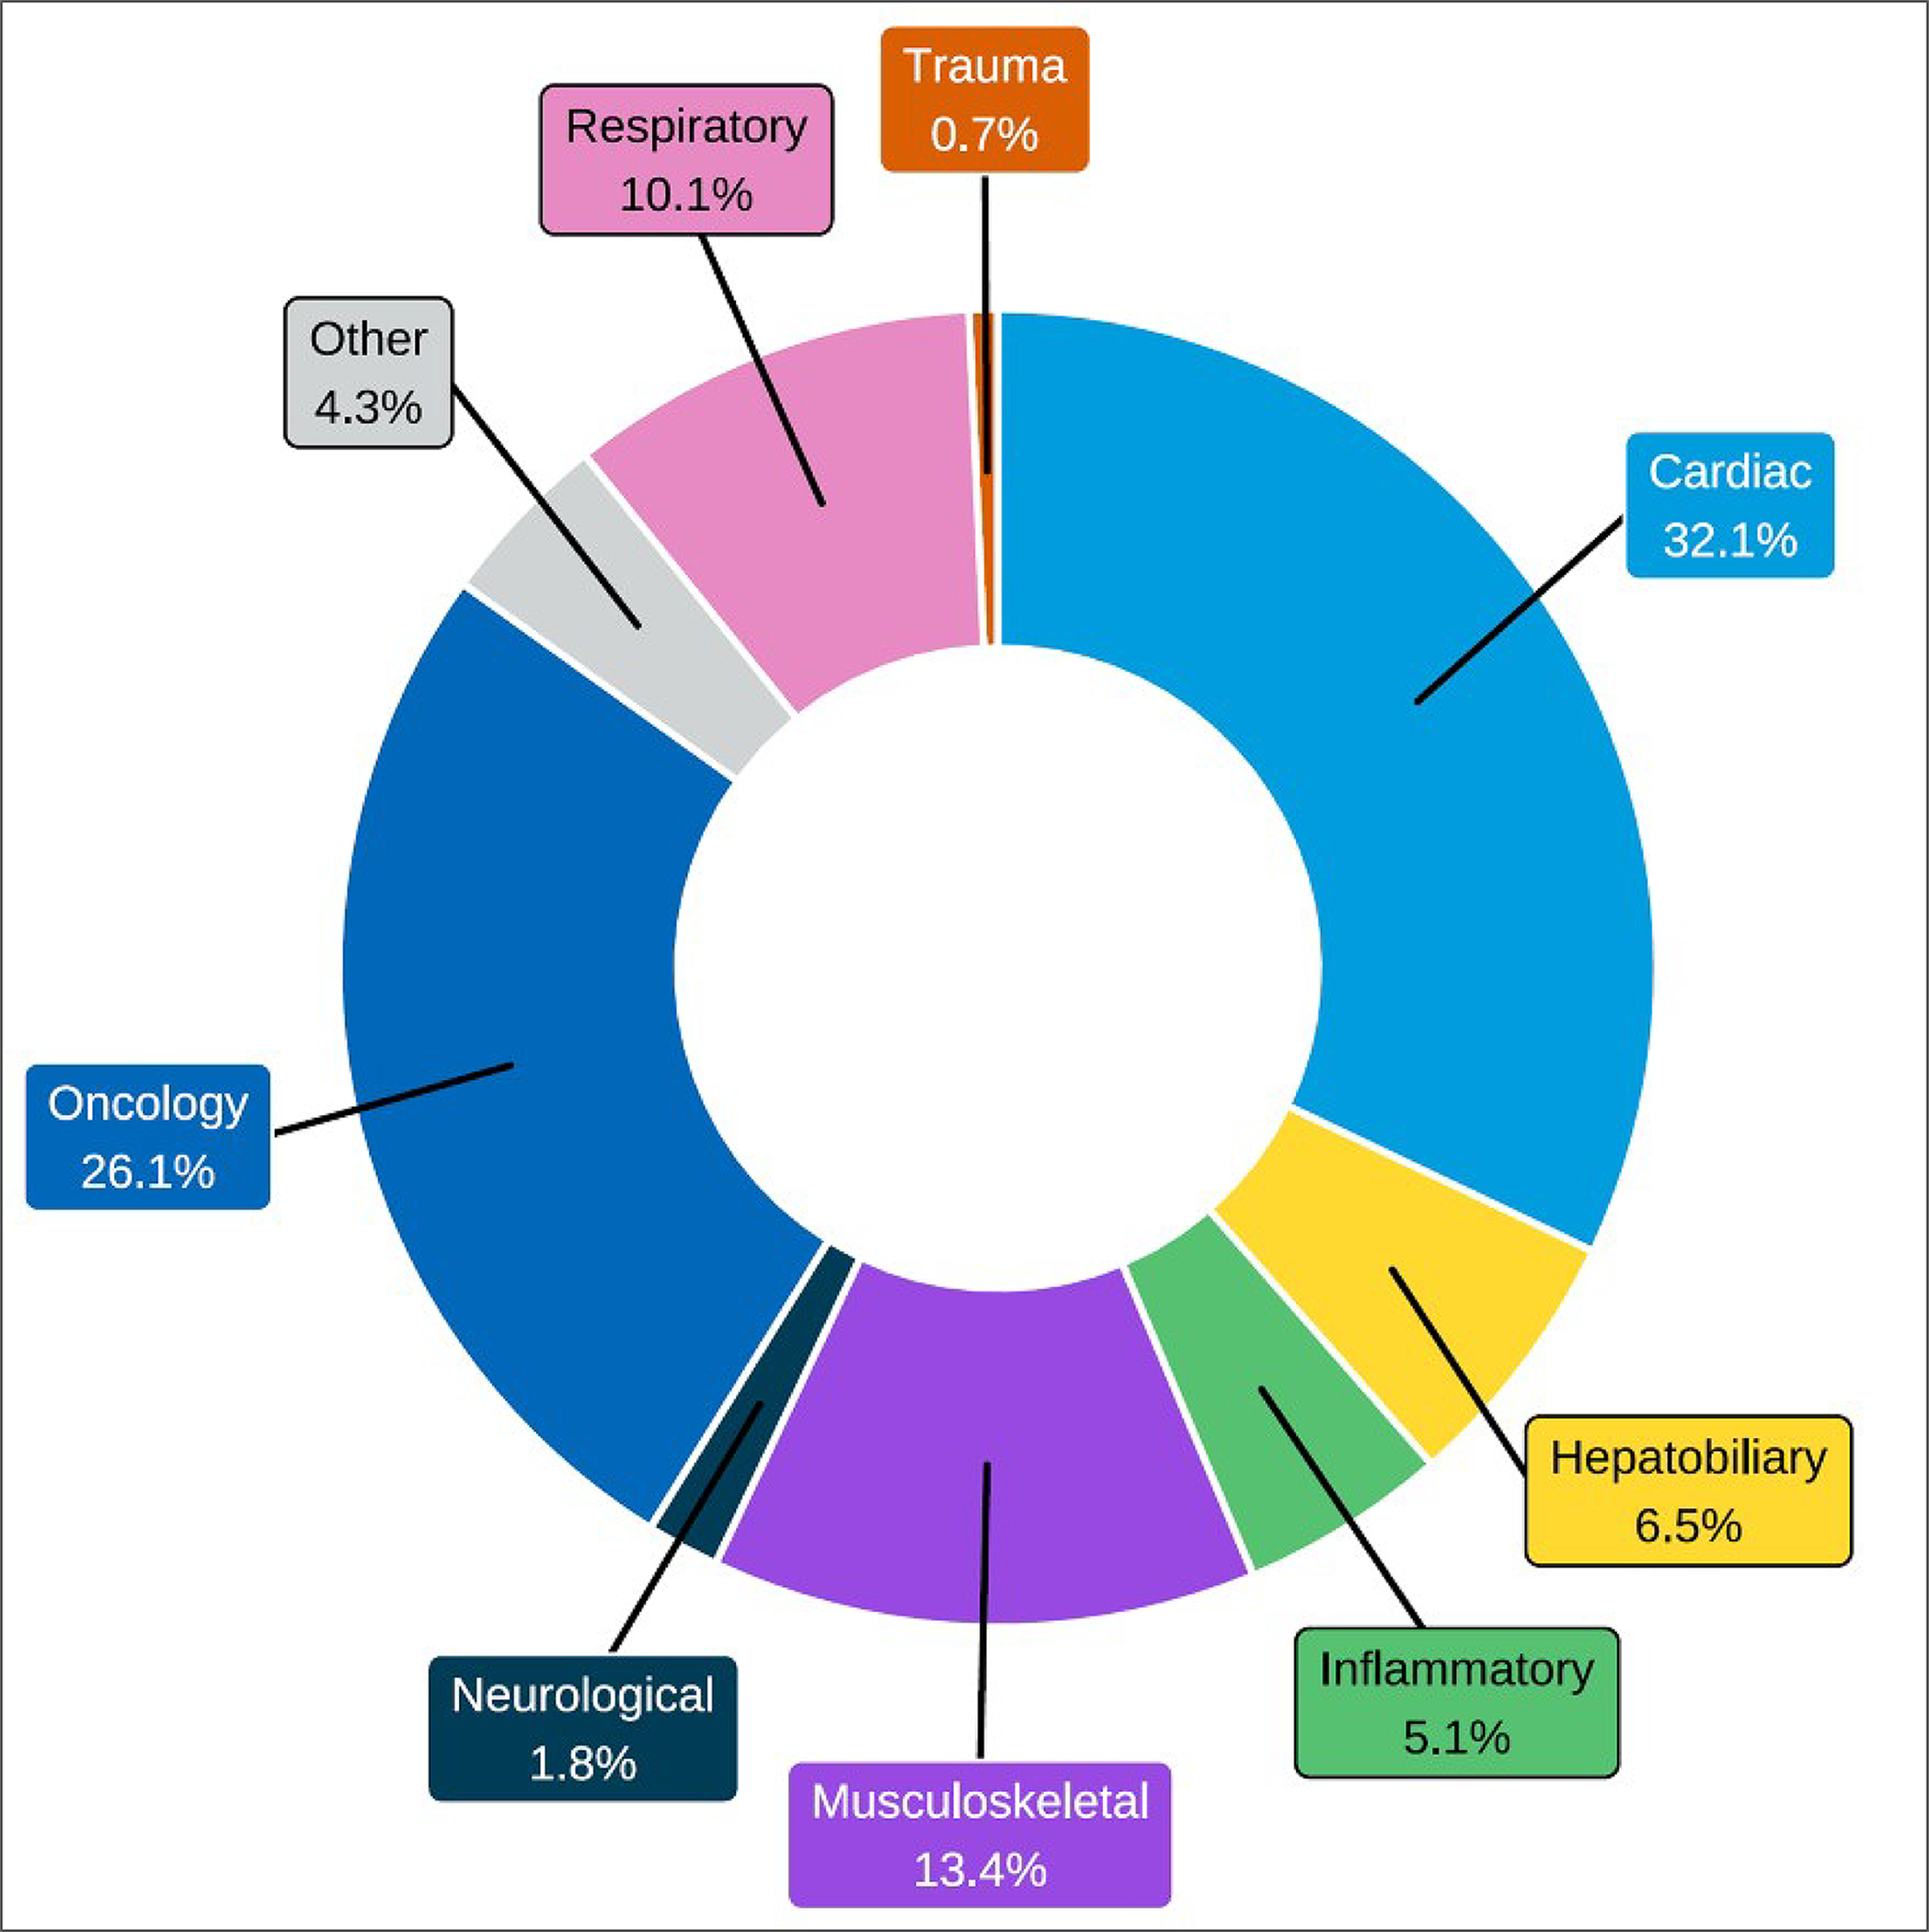
Notes: Survey response data were available for 31 out of 138 sites across 6 out of 9 jurisdictions with SPECT capacity. No data were available for Alberta, Manitoba, and Newfoundland and Labrador.
Data were derived from the survey question: “On average, what percentage of these exams fall into the following categories? The total percentage, expressed as a number, must add up to 100.” The following categories were offered: oncology, respiratory, hepatobiliary, musculoskeletal, inflammatory or infectious disease, neurologic, cardiac, trauma, and other.
Figure 21: Purpose of SPECT Use by Medical Category, 2022–2023
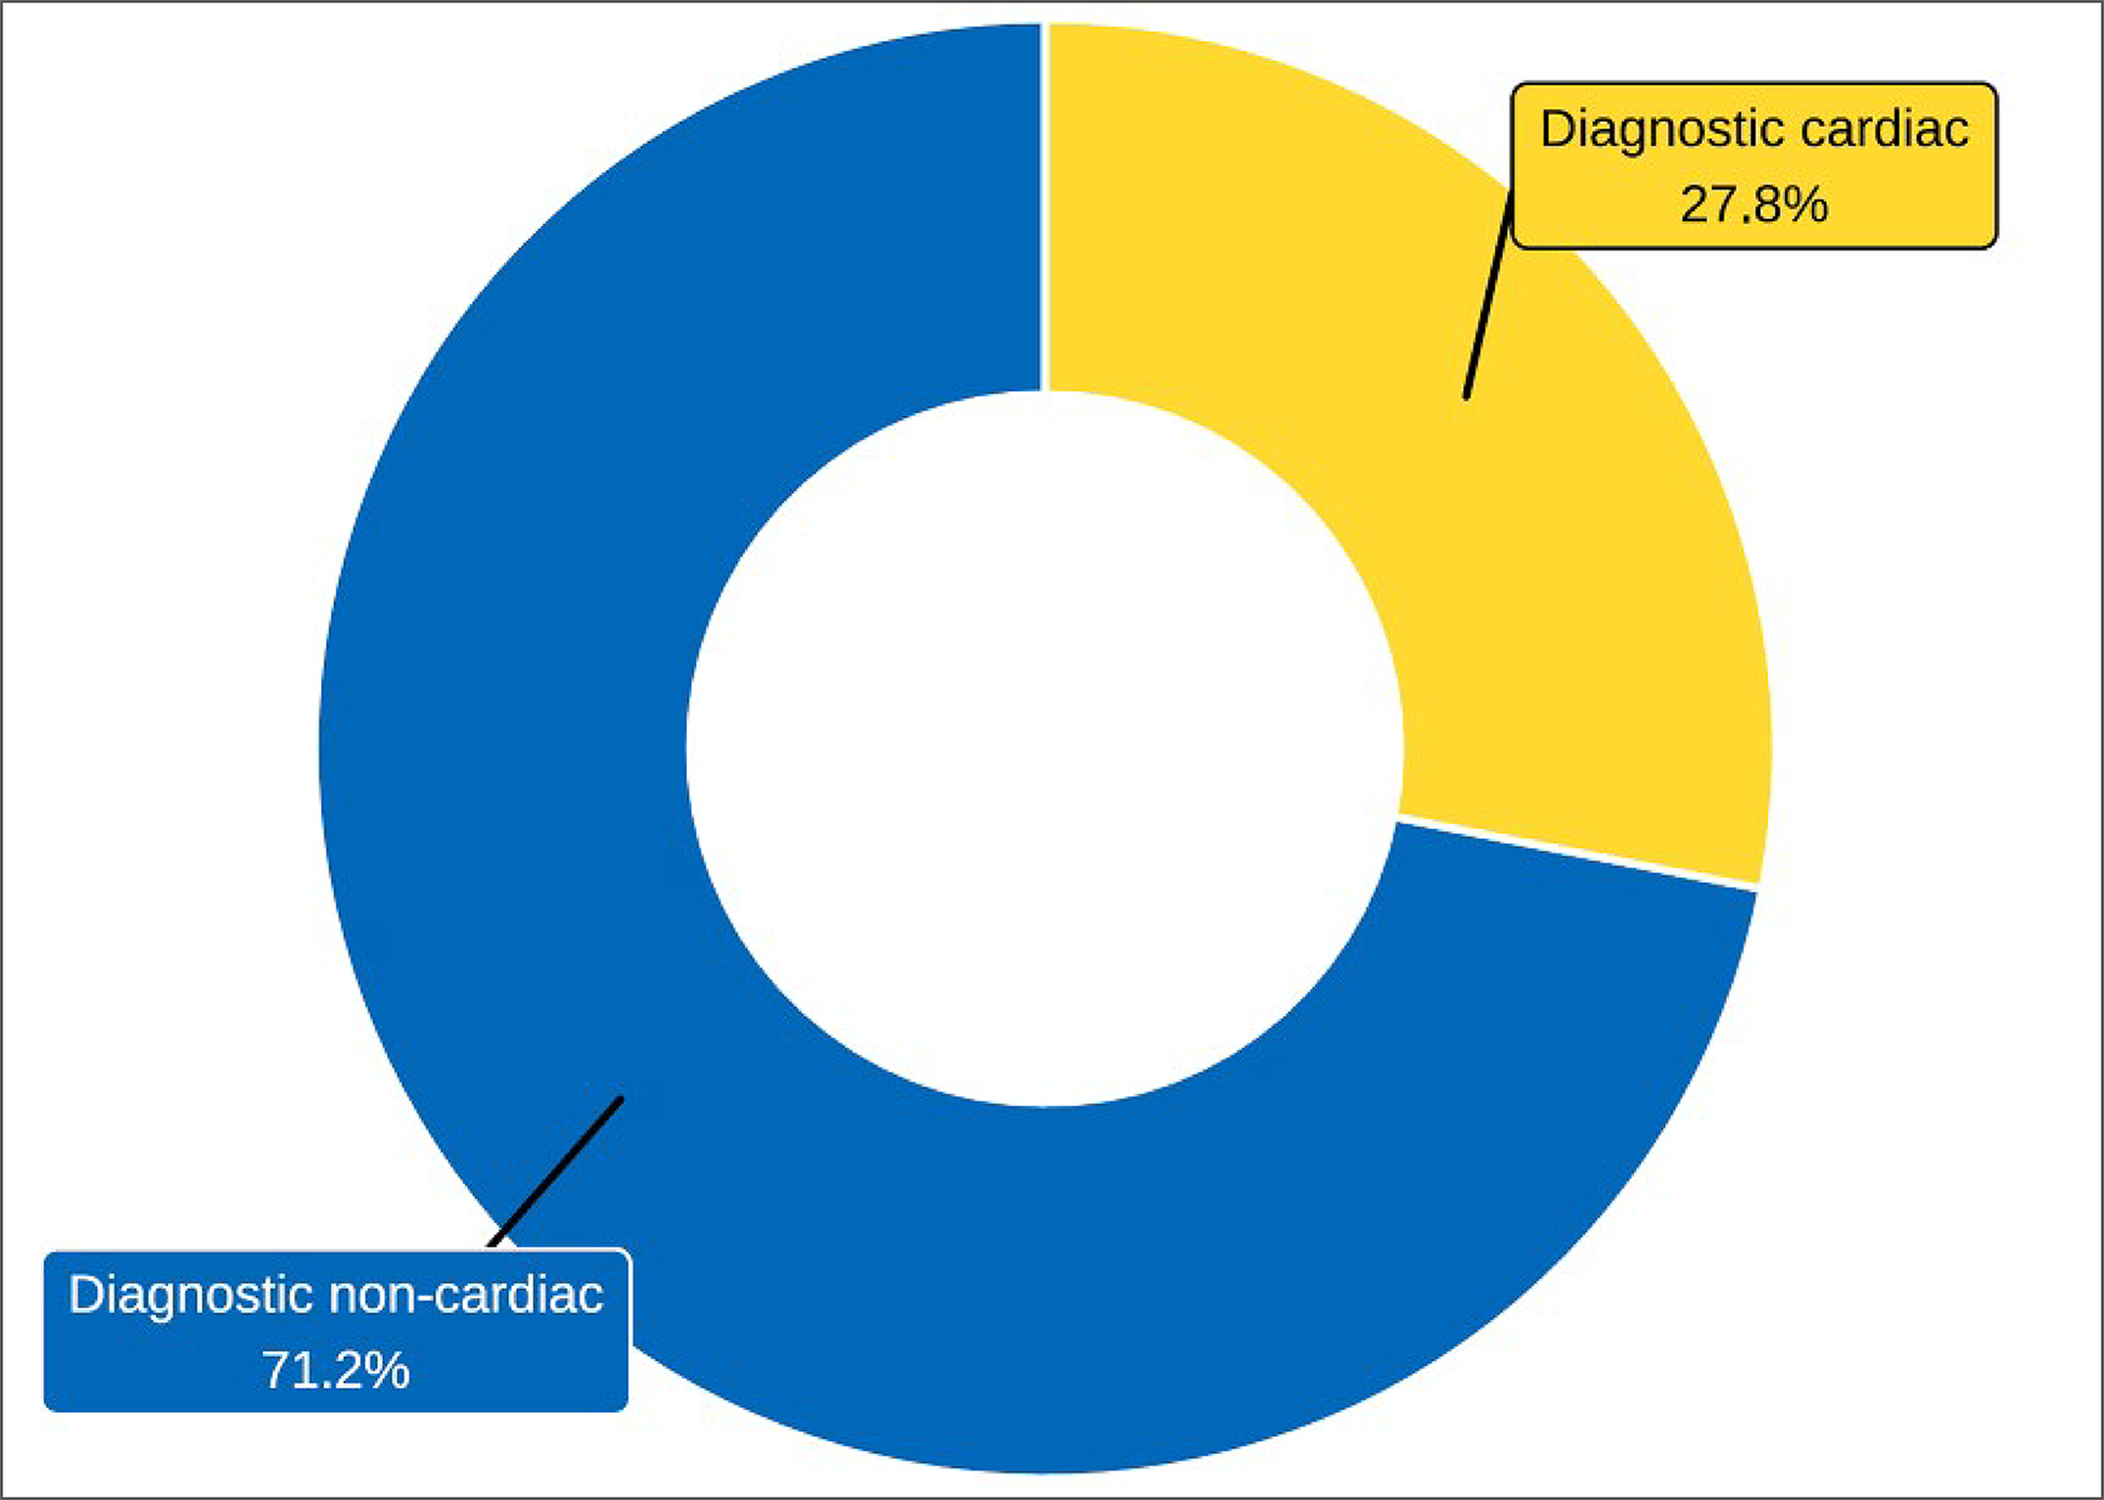
Notes: Survey response data were available for 60 out of 138 sites across 7 out of 9 jurisdictions with SPECT capacity. No data were available for Manitoba and Newfoundland and Labrador.
Data were derived from the survey question: “Based on your practice in the last fiscal year, what percentage of time are all units used for? The total percentage, expressed as a number, must add up to 100.” The following categories were offered: diagnostic purposes (cardiac only), diagnostic purposes (non-cardiac), research, interventional, and other.
Integration of Use of AI in SPECT-CT and SPECT Imaging
AI is a branch of computer science concerned with the development of systems that can perform problem solving, reasoning, and recognition tasks.15,16
The current focus of AI in medical imaging departments in Canada includes, but is not limited to, assisting imaging professionals in lowering radiation dose, reading and interpreting images, image reconstruction, planning treatment, predicting outcomes, and carrying out administrative tasks.15,16
The survey participants were asked to report on the use of AI for SPECT-CT and SPECT in the clinical and/or research setting. Most sites either did not respond to the questions on AI use or answered with “no,” indicating that it was not used.
Use of AI for SPECT-CT
Data were available for 76 to 88 sites with SPECT-CT capacity, depending on how AI was used, and the results are presented in Appendix 3, Table 33.
In total, 13 sites located in British Columbia, New Brunswick, Nova Scotia, Ontario, and Quebec reported the use of AI with SPECT-CT for image reconstruction.
One site in British Columbia used AI with SPECT-CT in the research setting.
Use of AI for SPECT
Data were available for 46 to 56 sites with SPECT capacity, depending on how AI was used, and the results are presented in Appendix 3, Table 34.
Eight sites located in New Brunswick and Ontario reported the use of AI with SPECT for image reconstruction.
No sites reported using AI with SPECT in the research setting for lowering radiation dose, image reconstruction, or carrying out administrative tasks.
Ordering and Receiving Exams
Exam Ordering Privileges at Sites With SPECT-CT and SPECT Units
Jurisdictional validators were asked to provide details on which regulated health professionals working in the public setting were authorized to order SPECT-CT and SPECT exams in their jurisdictions. The responses are summarized in Appendix 3, Table 35. The results show that:
All clinical specialists in all provinces are authorized to order SPECT-CT and SPECT exams.
Family physicians, general practitioners, and nurse practitioners have the same SPECT-CT and SPECT exam ordering privileges within each jurisdiction. In Newfoundland and Labrador, these health care professionals cannot order myocardial perfusion imaging exams, which requires consultation from a cardiology or internal medicine specialist; in Quebec, there are specific conditions (not specified) under which family doctors and nurse practitioners can order these exams. In Alberta, chiropractors and podiatrists also have exam ordering privileges. Data from New Brunswick was not provided for this question.
In British Columbia, some health care professionals, such as chiropractors, dentists, and podiatric surgeons, can order SPECT-CT and SPECT exams.
In the Northwest Territories, referrals for SPECT-CT and SPECT exams are made out of territory.
No data were received for Yukon.
How Exam Requests are Received at Sites With SPECT-CT and SPECT Imaging
The survey participants were asked to report their exam ordering practices from the following options: requests by automated order entry, paper, fax, telephone, and centralized order entry for some, or all, exams.
For SPECT-CT exam requests, the most commonly reported exam ordering methods are fax (96.9%), paper form (91.7%), and centralized order entry booking (54.8%), based on 96 sites with responses (Figure 22 and Appendix 3, Table 36).
For SPECT exam requests, the most commonly reported exam ordering methods are also fax (94.6%), paper form (90.9%), and centralized order entry booking (70.3%), based on 56 sites with responses (Figure 23 and Appendix 3, Table 37).
Figure 22: Summary of SPECT-CT Exam Ordering Practices at Sites That Reported a Process, 2022–2023
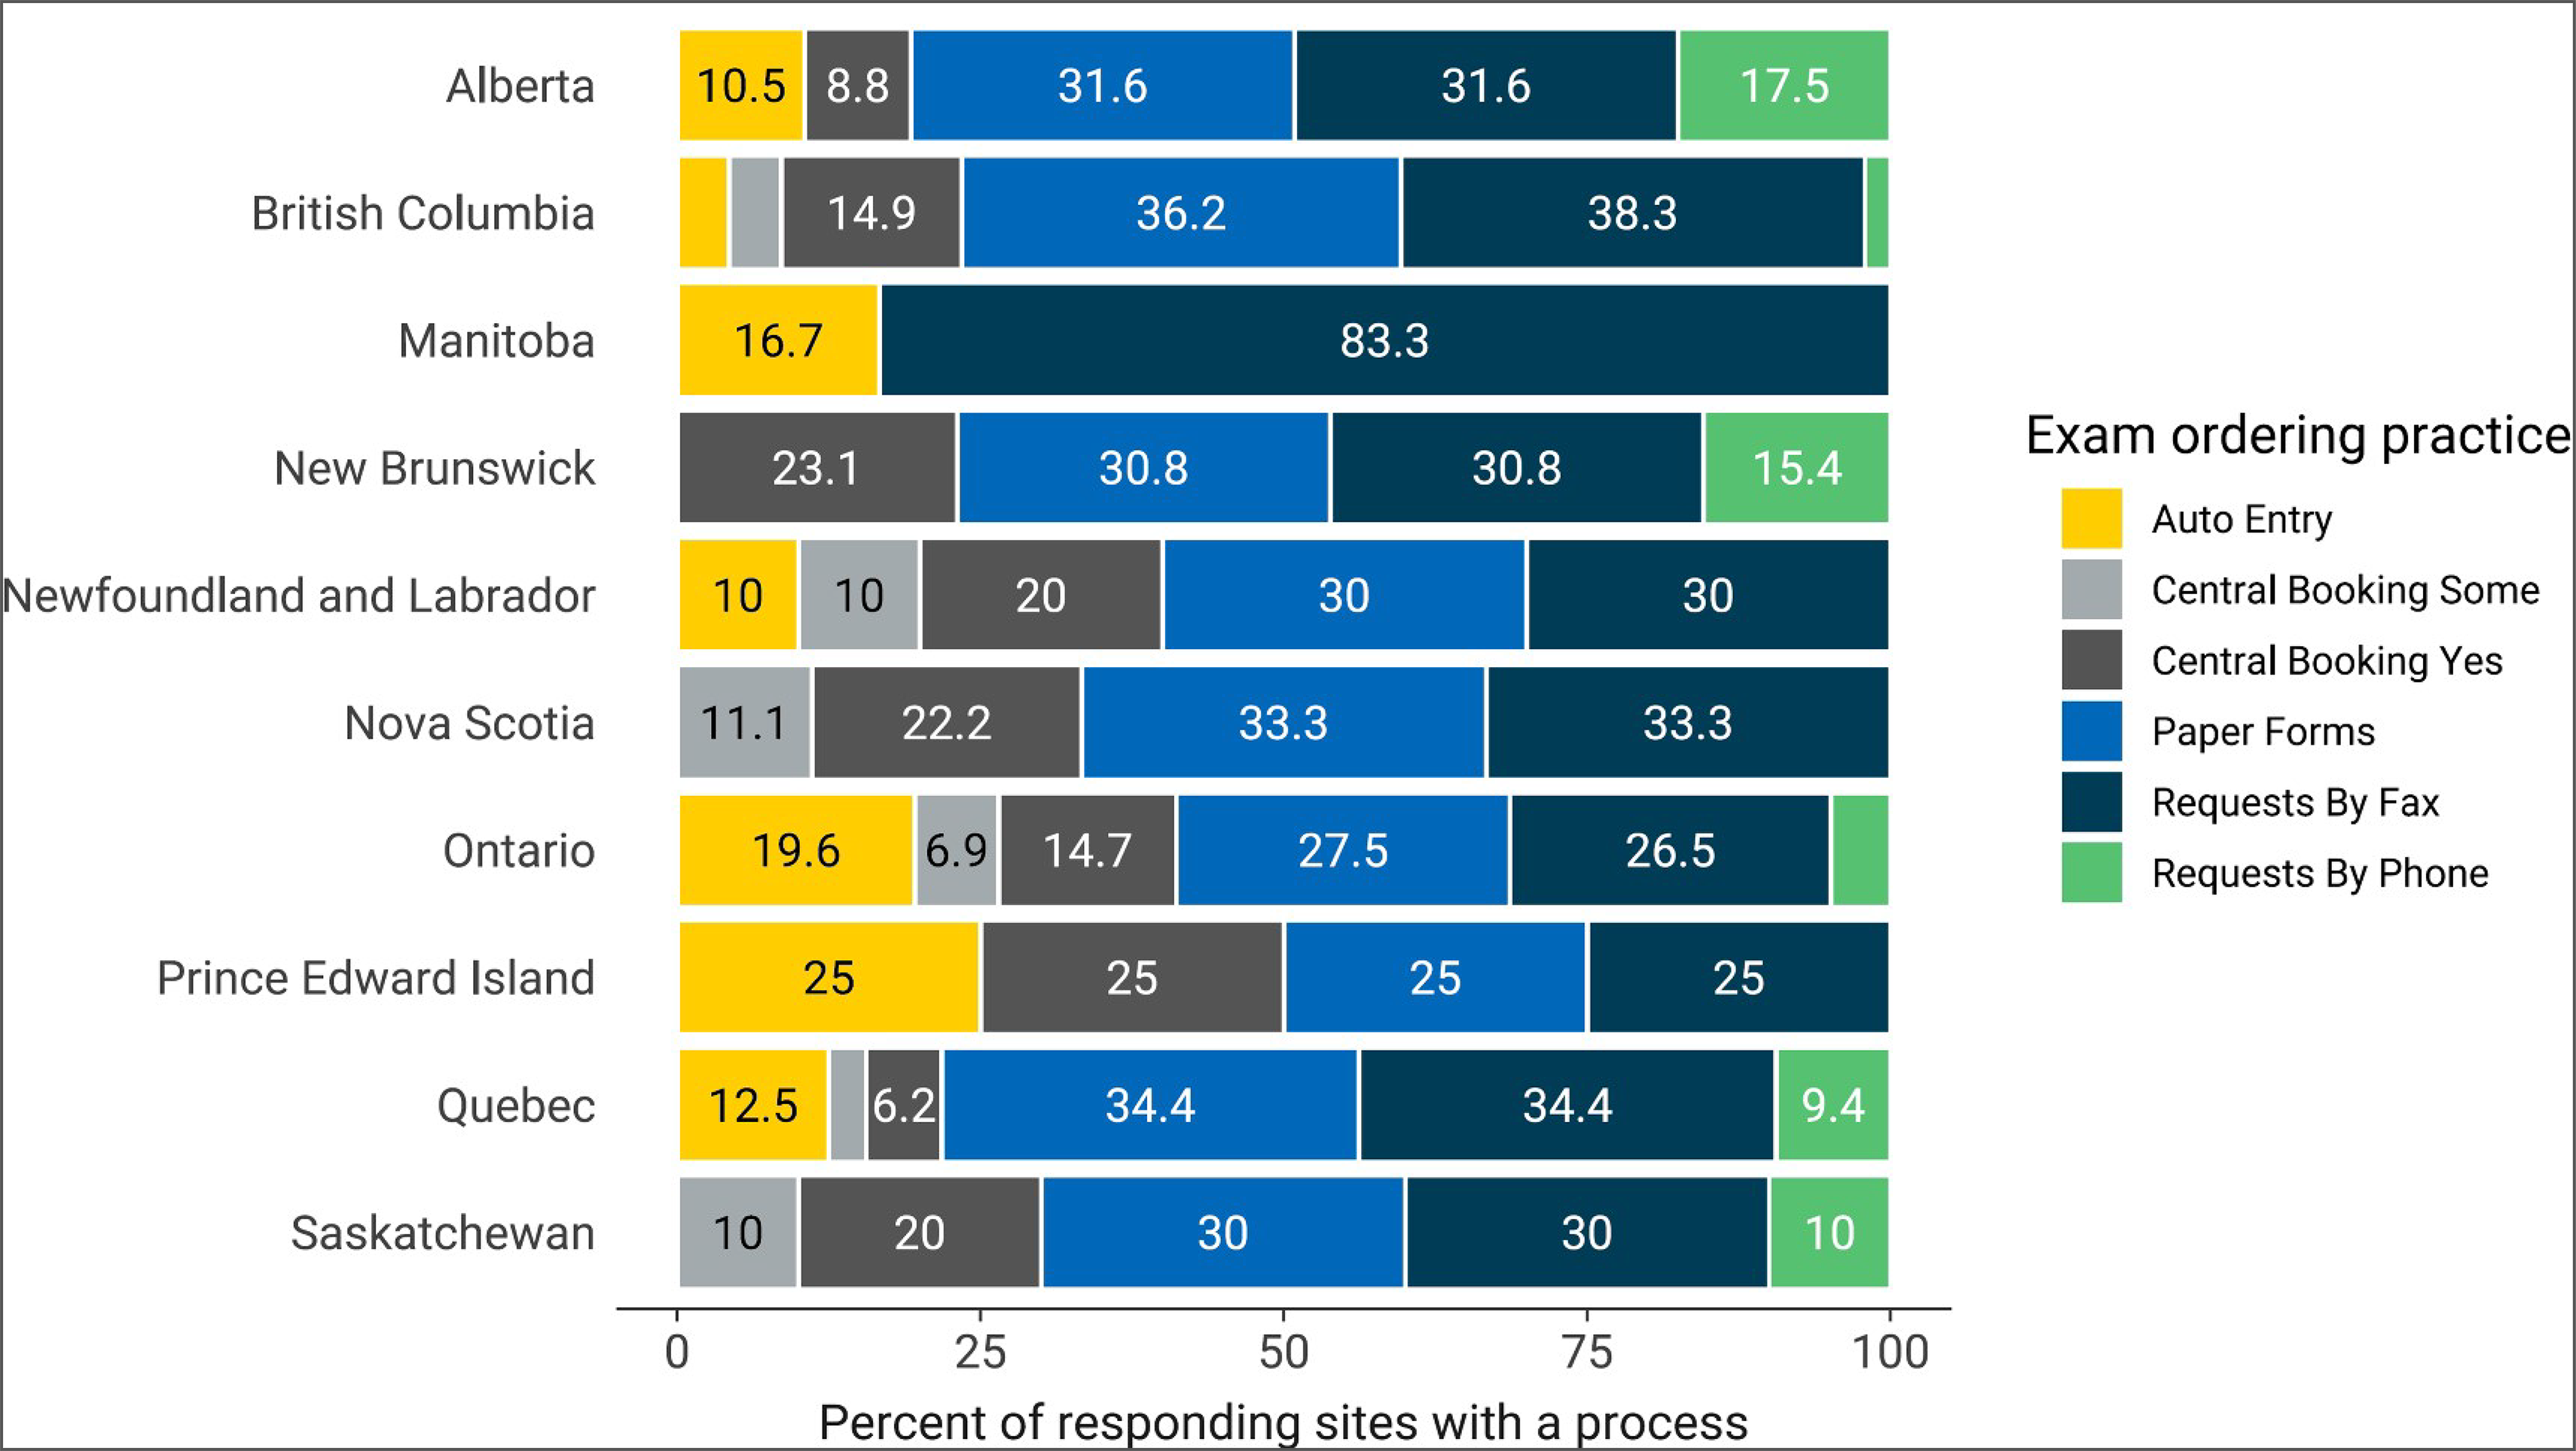
Notes: Survey response data are available for 96 out of 180 sites across all jurisdictions with SPECT-CT capacity.
Data were derived from the survey question: “Are automated order entry forms (exams request) used?”; “Are paper forms (exams requests) used?”; “Are requests received by fax?”; “Are requests received by phone?”; and “Is a centralized order entry (booking) system used? For all exams: Yes/no; For some exams: yes/no.”
Figure 23: Summary of SPECT Exam Ordering Practices at Sites That Reported a Process, 2022–2023
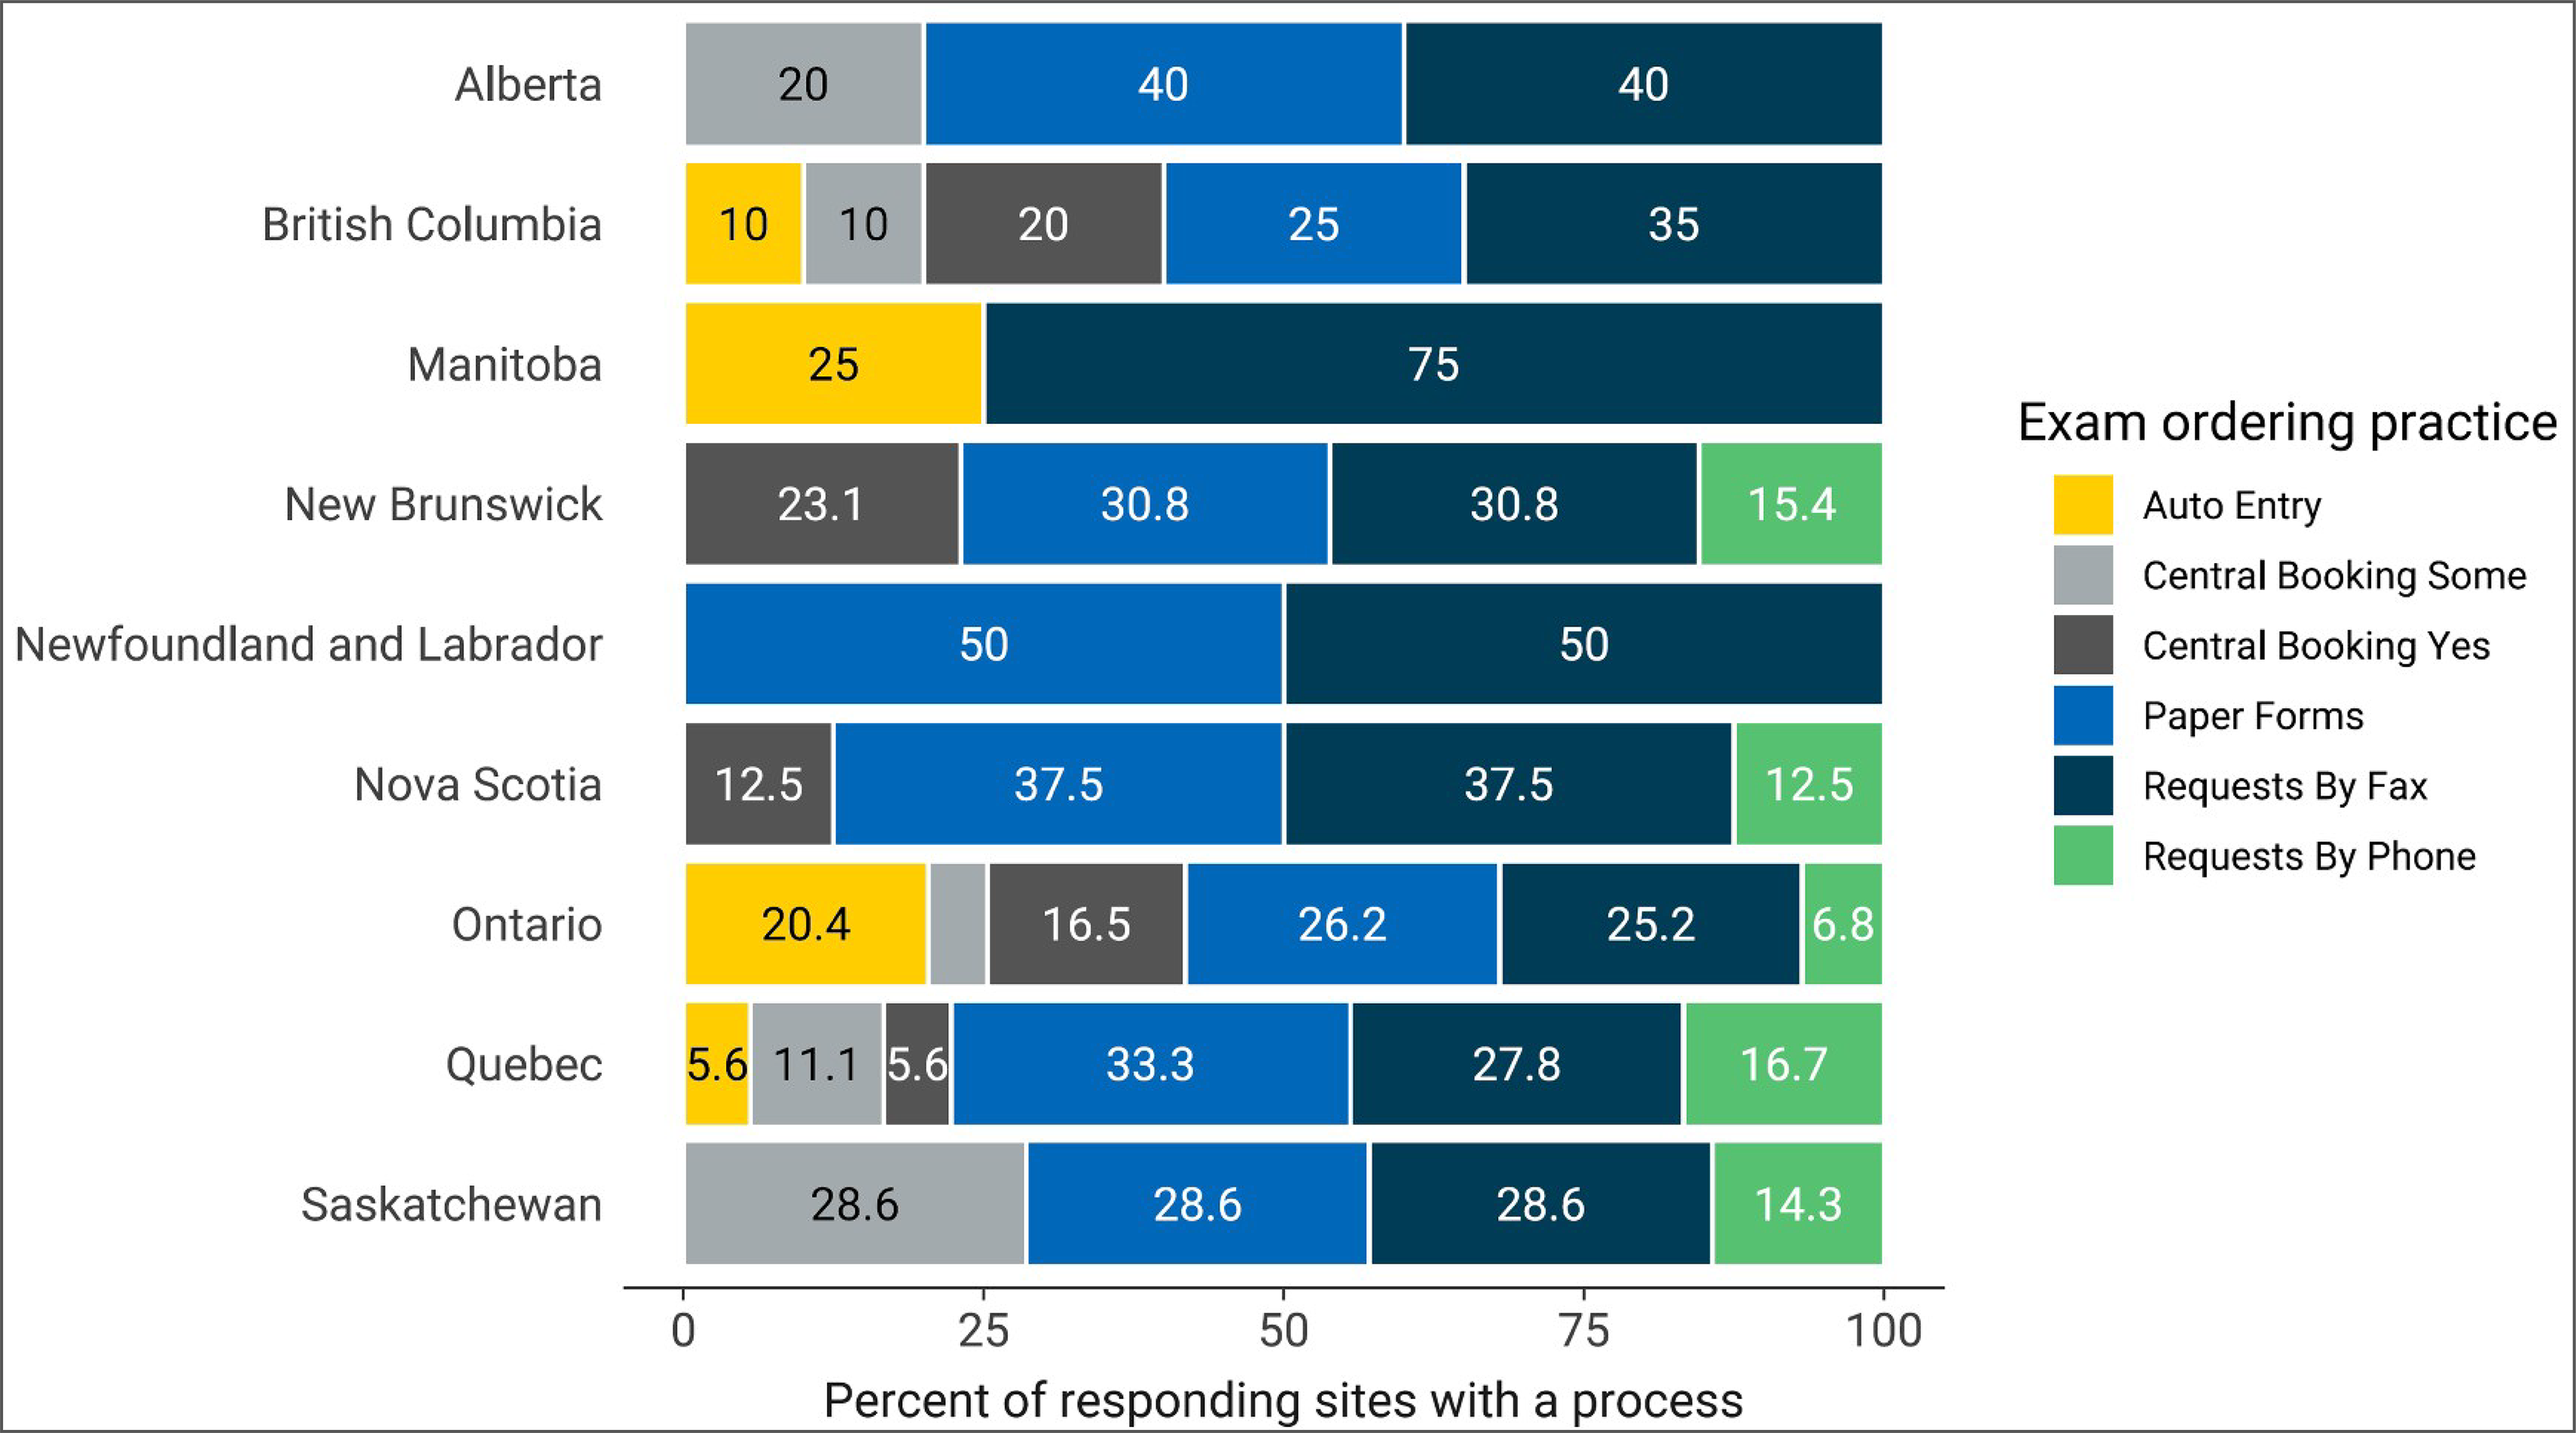
Notes: Survey response data are available for 56 out of 138 sites across all jurisdictions with SPECT capacity.
Data derived from the survey question: “Are automated order entry forms (exams request) used?”; “Are paper forms (exams requests) used?”; “Are requests received by fax?”; “Are requests received by phone?”; and “Is a centralized order entry (booking) system used? For all exams: Yes/no; For some exams: yes/no.”
Appropriateness and Quality Assurance Tools for SPECT-CT and SPECT Imaging
Low-value exam referrals can impact exam wait times.17 To help minimize low-value imaging, appropriateness processes, decision support tools, and peer review programs may be implemented.
Use of Clinical Decision Support Tools in SPECT-CT and SPECT
A clinical decision support tool (CDST) is a tool that provides real-time guidance to physicians on the appropriateness of diagnostic imaging tests for a given patient during the ordering process.3
Four sites (4.3%) reported that referring physicians use CDSTs for ordering SPECT-CT exams (Table 8).
Three sites (5.7%) reported that referring physicians use CDSTs for ordering SPECT exams (Table 9).
Use of Peer Learning in SPECT-CT and SPECT
Peer learning is a tool that is widely used in diagnostic imaging. Radiologists undertake peer review as part of the peer learning workflow, often anonymously, in clinical practice to provide ongoing feedback to improve performance, reduce discrepancies and errors, maintain standards, provide credibility, support learning, and identify gaps in education.18
In total, 48 sites (44.4%) with SPECT-CT units reported using peer review of images for quality assurance (Table 8).
Overall, 32 sites (53.3%) with SPECT units reported using peer review of images for quality assurance (Table 9).
Table 8: Use of Clinical Decision Support Tools and Peer Learning at Sites With SPECT-CT, 2022–2023
Province or territory | CDST | Peer review | ||
|---|---|---|---|---|
Number of sites reporting “Yes” (% of sites) | Number of reporting sites | Number of sites reporting “Yes” (% of sites) | Number of reporting sites | |
Alberta | 0 (0) | 18 | 8 (42.1) | 19 |
British Columbia | 2 (11.8) | 17 | 11 (57.9) | 19 |
Manitoba | 0 (0) | 5 | 0 (0) | 5 |
New Brunswick | 0 (0) | 4 | 1 (20) | 5 |
Newfoundland and Labrador | 0 (0) | 3 | 0 (0) | 3 |
Northwest Territories | NA | NA | NA | NA |
Nova Scotia | 0 (0) | 3 | 3 (60) | 5 |
Nunavut | NA | NA | NA | NA |
Ontario | 2 (7.4) | 27 | 23 (65.7) | 35 |
Prince Edward Island | 0 (0) | 1 | 0 (0) | 1 |
Quebec | 0 (0) | 12 | 2 (15.4) | 13 |
Saskatchewan | 0 (0) | 3 | 0 (0) | 3 |
Yukon | NA | NA | NA | NA |
Canada | 4 (4.3) | 93 | 48 (44.4) | 108 |
CDST = clinical decision support tool; NA = not applicable.
Notes: Survey response data about CDSTs were available for 93 out of 180 sites across all jurisdictions with SPECT-CT capacity. Survey response data about peer review were available for 108 out of 180 sites across all jurisdictions with SPECT-CT capacity.
CDST data were derived from the survey question: “Is a clinical decision support tool used at the point of care by medical professionals referring patients to medical imaging? A clinical decision support tool provides real-time guidance to physicians on the appropriateness of diagnostic imaging tests for a given patient during the ordering process.” Options were: Yes, No, Don’t know. Additional data were supplemented from the following survey question: “Do you have a process for determining the appropriateness of orders that are received? If yes, which process is used?”
Peer review data were derived from the survey question: “Do radiologists at your facility participate in a peer review program for image reading and interpretation for the purpose of quality assurance?” Options were: Yes, No, Don’t know.
Table 9: Use of Clinical Decision Support Tools and Peer Learning at Sites With SPECT, 2022–2023
Province or territory | CDST | Peer review | ||
|---|---|---|---|---|
Number of sites reporting “Yes” (% of sites) | Number of reporting sites | Number of sites reporting “Yes” (% of sites) | Number of reporting sites | |
Alberta | 0 (0) | 2 | 1 (50) | 2 |
British Columbia | 1 (14.3) | 7 | 4 (44.4) | 9 |
Manitoba | 0 (0) | 3 | 0 (0) | 3 |
New Brunswick | 0 (0) | 4 | 1 (33.3) | 3 |
Newfoundland and Labrador | 0 (0) | 1 | 0 (0) | 1 |
Northwest Territories | NA | NA | NA | NA |
Nova Scotia | 0 (0) | 3 | 1 (25) | 4 |
Nunavut | NA | NA | NA | NA |
Ontario | 2 (7.7) | 26 | 24 (75) | 32 |
Prince Edward Island | NA | NA | NA | NA |
Quebec | 0 (0) | 6 | 1 (25) | 4 |
Saskatchewan | 0 (0) | 1 | 0 (0) | 2 |
Yukon | NA | NA | NA | NA |
Canada | 3 (5.7) | 53 | 32 (53.3) | 60 |
CDST = clinical decision support tools; NA = not applicable; NR = not reported.
Notes: Survey response data about CDSTs were available for 53 out of 138 sites across all jurisdictions with SPECT capacity. Survey response data about peer review were available for 60 out of 138 sites across all jurisdictions with SPECT capacity.
CDST data were derived from the survey question: “Is a clinical decision support tool used at the point of care by medical professionals referring patients to medical imaging? A clinical decision support tool provides real-time guidance to physicians on the appropriateness of diagnostic imaging tests for a given patient during the ordering process.” Options were: Yes, No, Don’t know. Additional data were supplemented from the following survey question: “Do you have a process for determining the appropriateness of orders that are received? If yes, which process is used?”
Peer review data were derived from the survey question: “Do radiologists at your facility participate in a peer review program for image reading and interpretation for the purpose of quality assurance?” Options were: Yes, No, Don’t know.
Picture Archiving and Communication Systems
Picture archiving and communication systems (PACS) are electronic systems used to digitally manage images, including transmission, filing, storage, distribution, and retrieval of medical images. A detailed definition is provided in Appendix 2.
SPECT-CT
Sites with SPECT-CT capacity were asked whether medical images were stored on a PACS and accessible throughout the jurisdiction in which the site operates. Data were available for 135 sites with a PACS:
82.2% of responding sites with SPECT-CT capacity reported PACS access throughout the provincial health care system without the need of manual retrieval (111 of 135 sites)
17.8% of sites reported local access to a PACS (24 of 135 sites)
29.6% of sites had regional access to a PACS (40 of 135 sites)
34.8% of sites had intraprovincial access to a PACS (47 of 135 sites)
97.0% of sites reported that PACS images were accessible to referring physicians located in areas of the hospital outside of diagnostic imaging (131 of 135 sites).
SPECT
Sites with SPECT capacity were asked whether medical images were stored on a PACS and accessible throughout the jurisdiction in which the site operates. Data were available for 110 sites with a PACS:
80.9% of responding sites with SPECT capacity reported PACS access throughout the provincial health care system without the need of manual retrieval (89 of 110 sites)
26.4% of sites reported local access to a PACS (29 of 110 sites)
28.2% of sites had regional access to a PACS (31 of 110 sites)
26.4% of sites had intraprovincial access to a PACS (29 of 110 sites)
95.5% of sites reported that PACS images were accessible to referring physicians located in areas of the hospital outside of diagnostic imaging (105 of 110 sites).
Technical Characteristics of SPECT-CT and SPECT Equipment
Technical Specifications of SPECT-CT Units
The number of common multidetector slices available in the CT component of SPECT-CT units was available for 154 units (Figure 24 and Appendix 3, Table 38).
In total, 16-slice multidetectors were most commonly used, reported in 51 units (32.7%), followed by 4-slice scanning in 29 units (18.6%), and 8-slice scanning in 22 units (14.1%).
The number of detector heads available in SPECT-CT units was available for 142 units located in 9 provinces.
One SPECT-CT unit in Ontario was reported to have 1 detector head (0.7%). The other units located in all 9 responding provinces were reported to have 2 detector heads (99.3%).
Information on field of view in SPECT-CT units was available for 140 units.
More than 97% of units were reported to have a standard multipurpose field of view.
Information on whether iterative reconstruction or filtered back projection software is used in SPECT-CT units was available for 140 units.
Overall, 84 units (60%) had the feature of iterative reconstruction and the other 56 units (40%) were reported to have the feature of filtered back projection.
The CT component is used independently to provide extra CT capacity in 10.6% of units located in 8 provinces (21 of 199 units reported): Alberta (3 of 35 units), British Columbia (4 of 36 units), Manitoba (2 of 7 units), New Brunswick (2 of 7 units), Nova Scotia (3 of 8 units), Ontario (5 of 62 units), Quebec (1 of 28 units), and Saskatchewan (1 of 6 units). For Newfoundland and Labrador and Prince Edward Island, no SPECT-CT units were reported to use the CT component independently (10 units).
In total, 64.7% of SPECT-CT units located in 9 provinces have dose-management controls (97 of 150 units with information): Alberta (24 of 34 units), British Columbia (7 of 29 units), New Brunswick (4 of 5 units), Newfoundland and Labrador (5 of 6 units), Nova Scotia (1 of 1 units), Ontario (38 of 48 units), Prince Edward Island (1 of 2 units), Quebec (11 of 19 units), and Saskatchewan (6 of 6 units).
Overall, 73.6% of units located in all provinces record the patient radiation dose per exam (142 of 193 units with information): Alberta (31 of 35 units), British Columbia (20 of 34 units), Manitoba (2 of 2 units), New Brunswick (5 of 6 units), Newfoundland and Labrador (1 of 7 units), Nova Scotia (6 of 9 units), Ontario (45 of 63 units), Prince Edward Island (1 of 2 units), Quebec (25 of 29 units), and Saskatchewan (6 of 6 units).
The information on future cumulative dose tracking in SPECT-CT units was available for 128 units. Dose tracking was planned in the future for 38.3% of reported units: Alberta (28 of 34 units), British Columbia (5 of 25 units), New Brunswick (1 of 3 units), Ontario (12 of 36 units), Prince Edward Island (2 of 2), and Quebec (1 of 13 units). Manitoba, Newfoundland and Labrador, Nova Scotia, and Saskatchewan did not report plans for future dose tracking in SPECT-CT units (0 of 15).
Figure 24: Reported Proportion of Slices in SPECT-CT Units in 2022–2023 for Jurisdictions With Capacity, 2022–2023
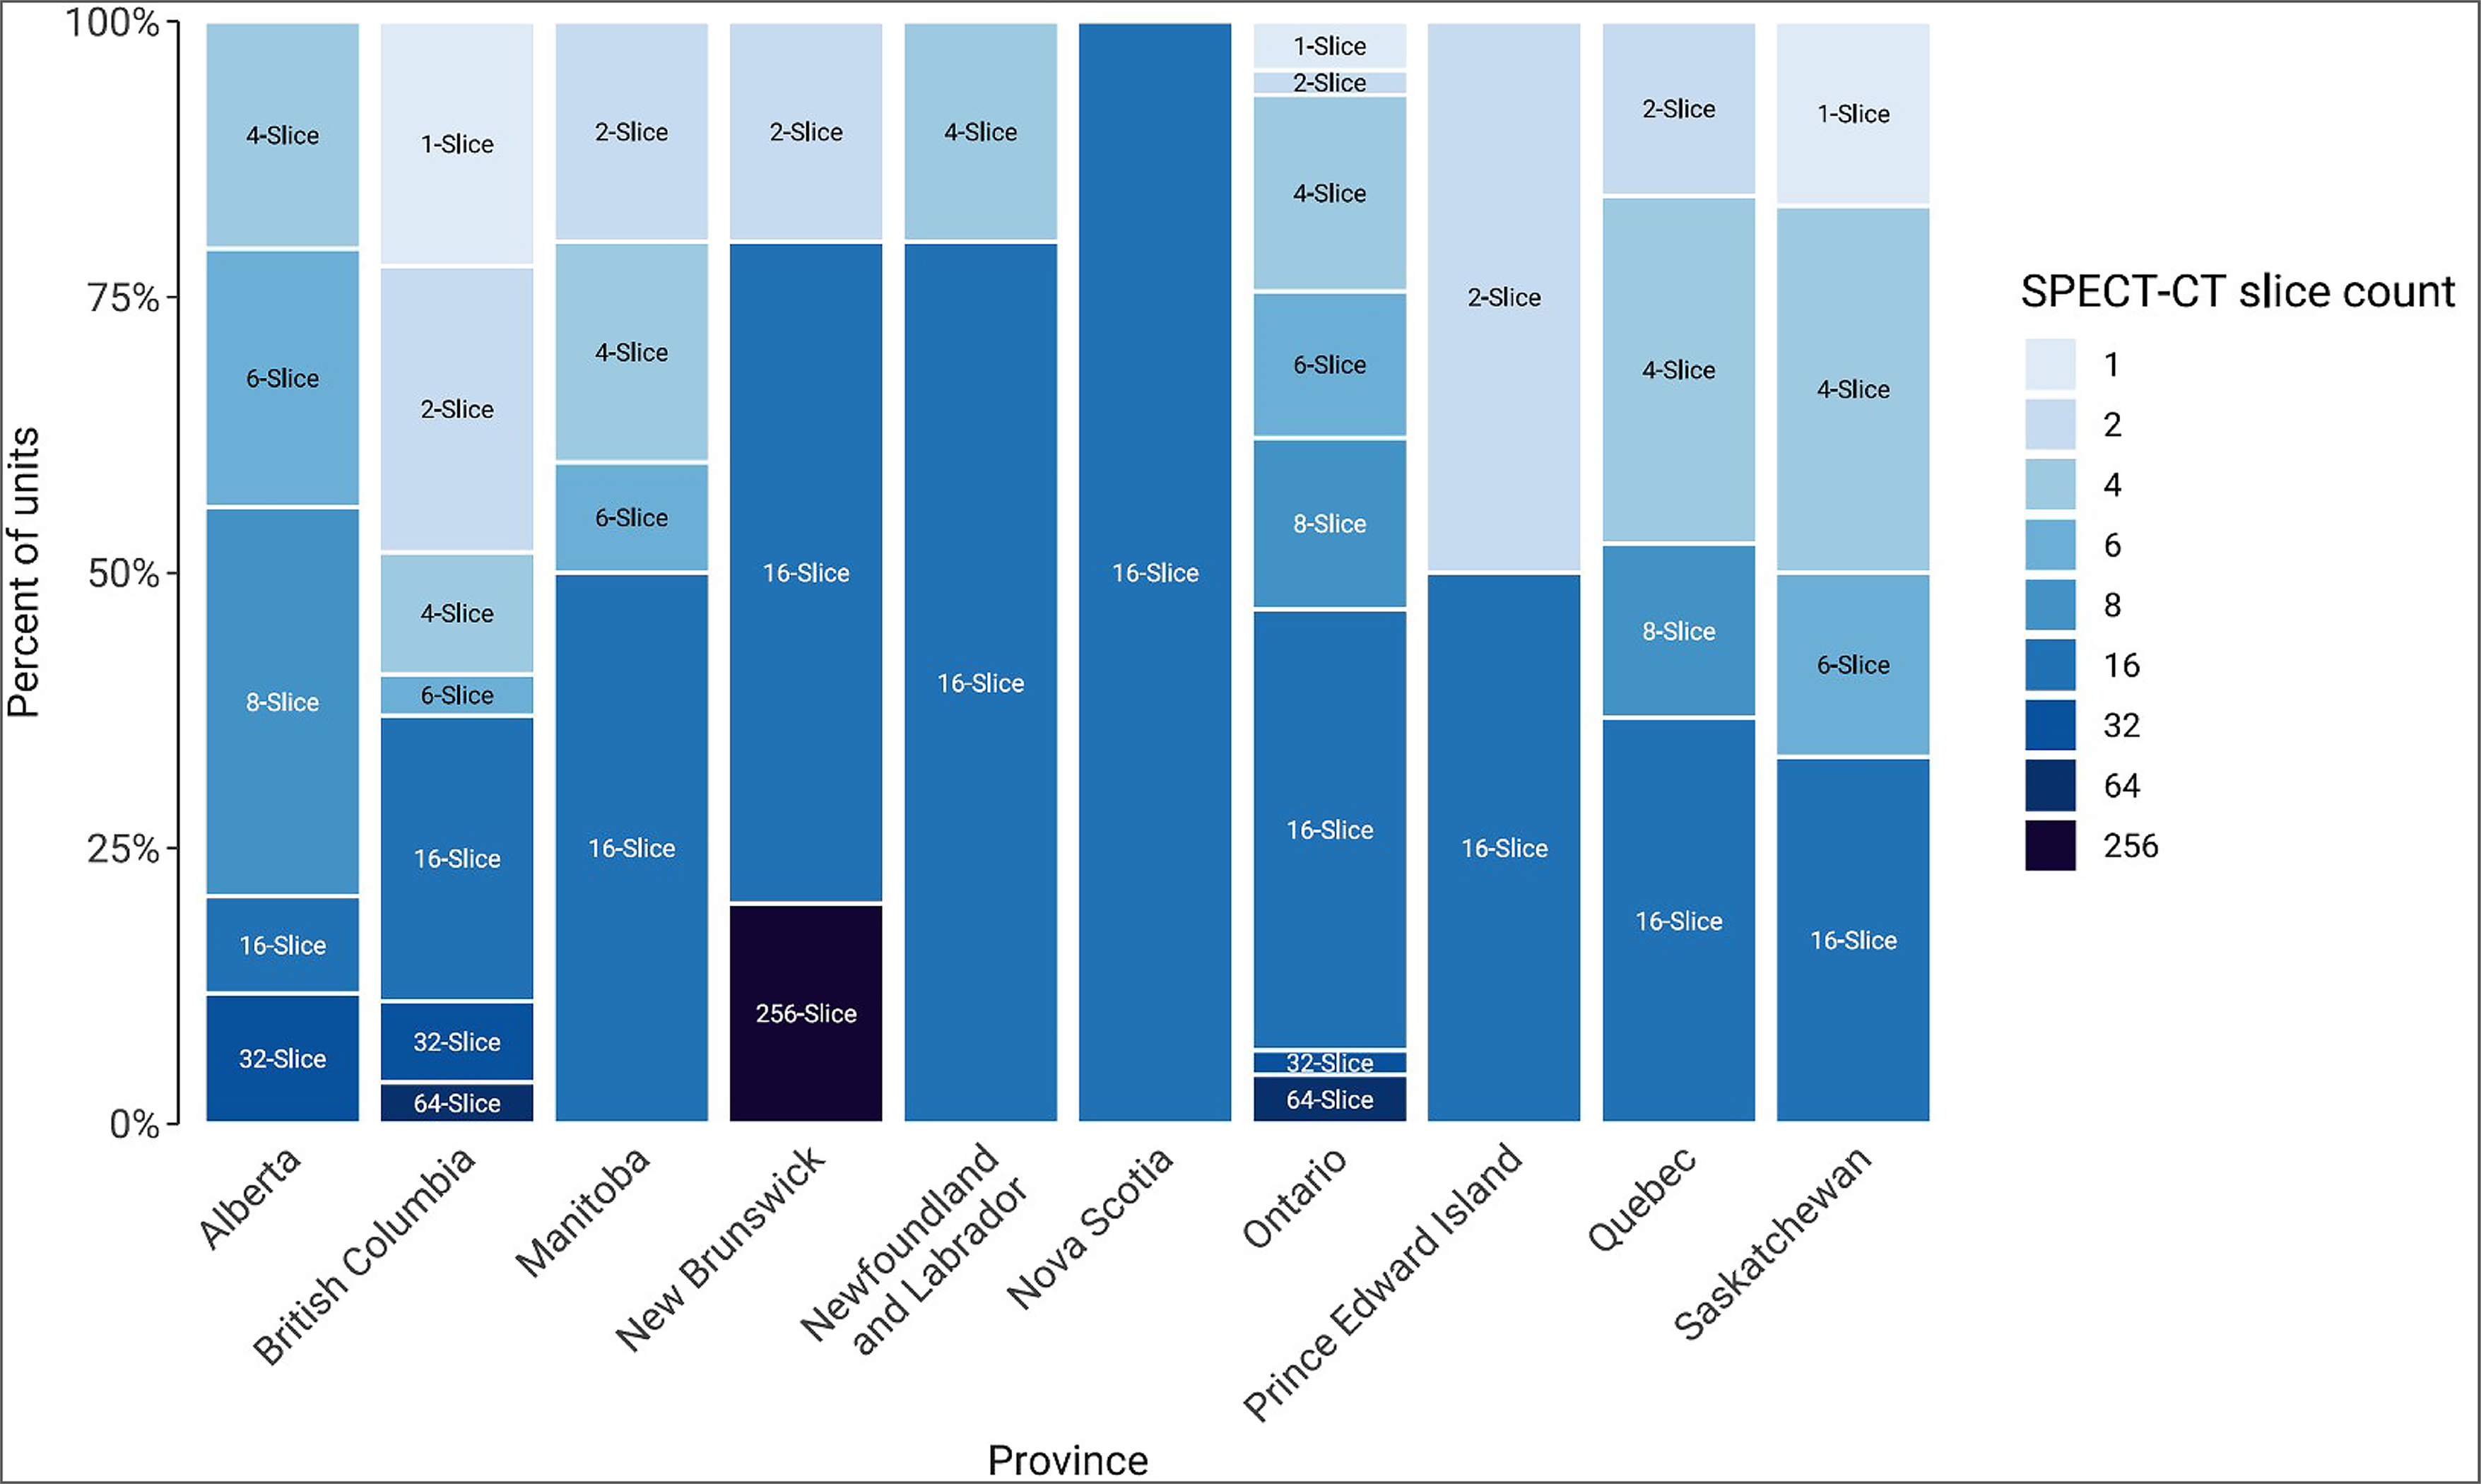
Notes: Survey response data for specific slice count were available for 154 out of 331 units in all jurisdictions with SPECT-CT capacity.
Data were derived from the survey question: “How many multi-detectors does the SPECT-CT unit have (how many slices)?”
Technical Specifications of SPECT Units
The number of detector heads available in SPECT units was available for 71 units.
Overall, 16.9% of the reported SPECT units had 1 detector head (12 units). The other 83.1% had 2 detector heads (59 units).
The information on field of view in SPECT units was available for 76 units.
In total, 71.1% of the units had a standard multipurpose field of view (54 units), 26.3% of the units had a dedicated and limited field of view (20 units), and 1 unit in British Columbia and 1 unit in Saskatchewan had other field of view (2.6%).
Information on whether iterative reconstruction or filtered back projection software is used in SPECT units was available for 66 units.
Overall, 50% of units with information had the feature of iterative reconstruction and the other 50% were reported to have the feature of filtered back projection.
Trends in Technical Specifications of SPECT-CT
Trends are only reported for SPECT-CT as, because of a low survey response for technical specifications of SPECT, trends data on technical characteristics was not possible for that modality.
Trends Over Time in Number of Slices in SPECT-CT Units
In 2012, 4-slice was the most common scanning option used by SPECT-CT units. Since 2012, the percentage of SPECT-CT units with 4-slice scanning has decreased from 45.7% of units in 2012 to 18.6% of units in 2022–2023. (Figure 25 and Appendix 3, Table 38).
Since 2012, the percentage of SPECT-CT units with 16-slice scanning has steadily increased from 6.4% of units in 2012 to 32.7% of units in 2022–2023.
In 2022–2023, 0.6% of SPECT-CT units used 256-slice scanning (1 of 154 reported units, which was located in New Brunswick).
Figure 25: Trends in Number of Slices in SPECT-CT Units, 2012 to 2022–2023
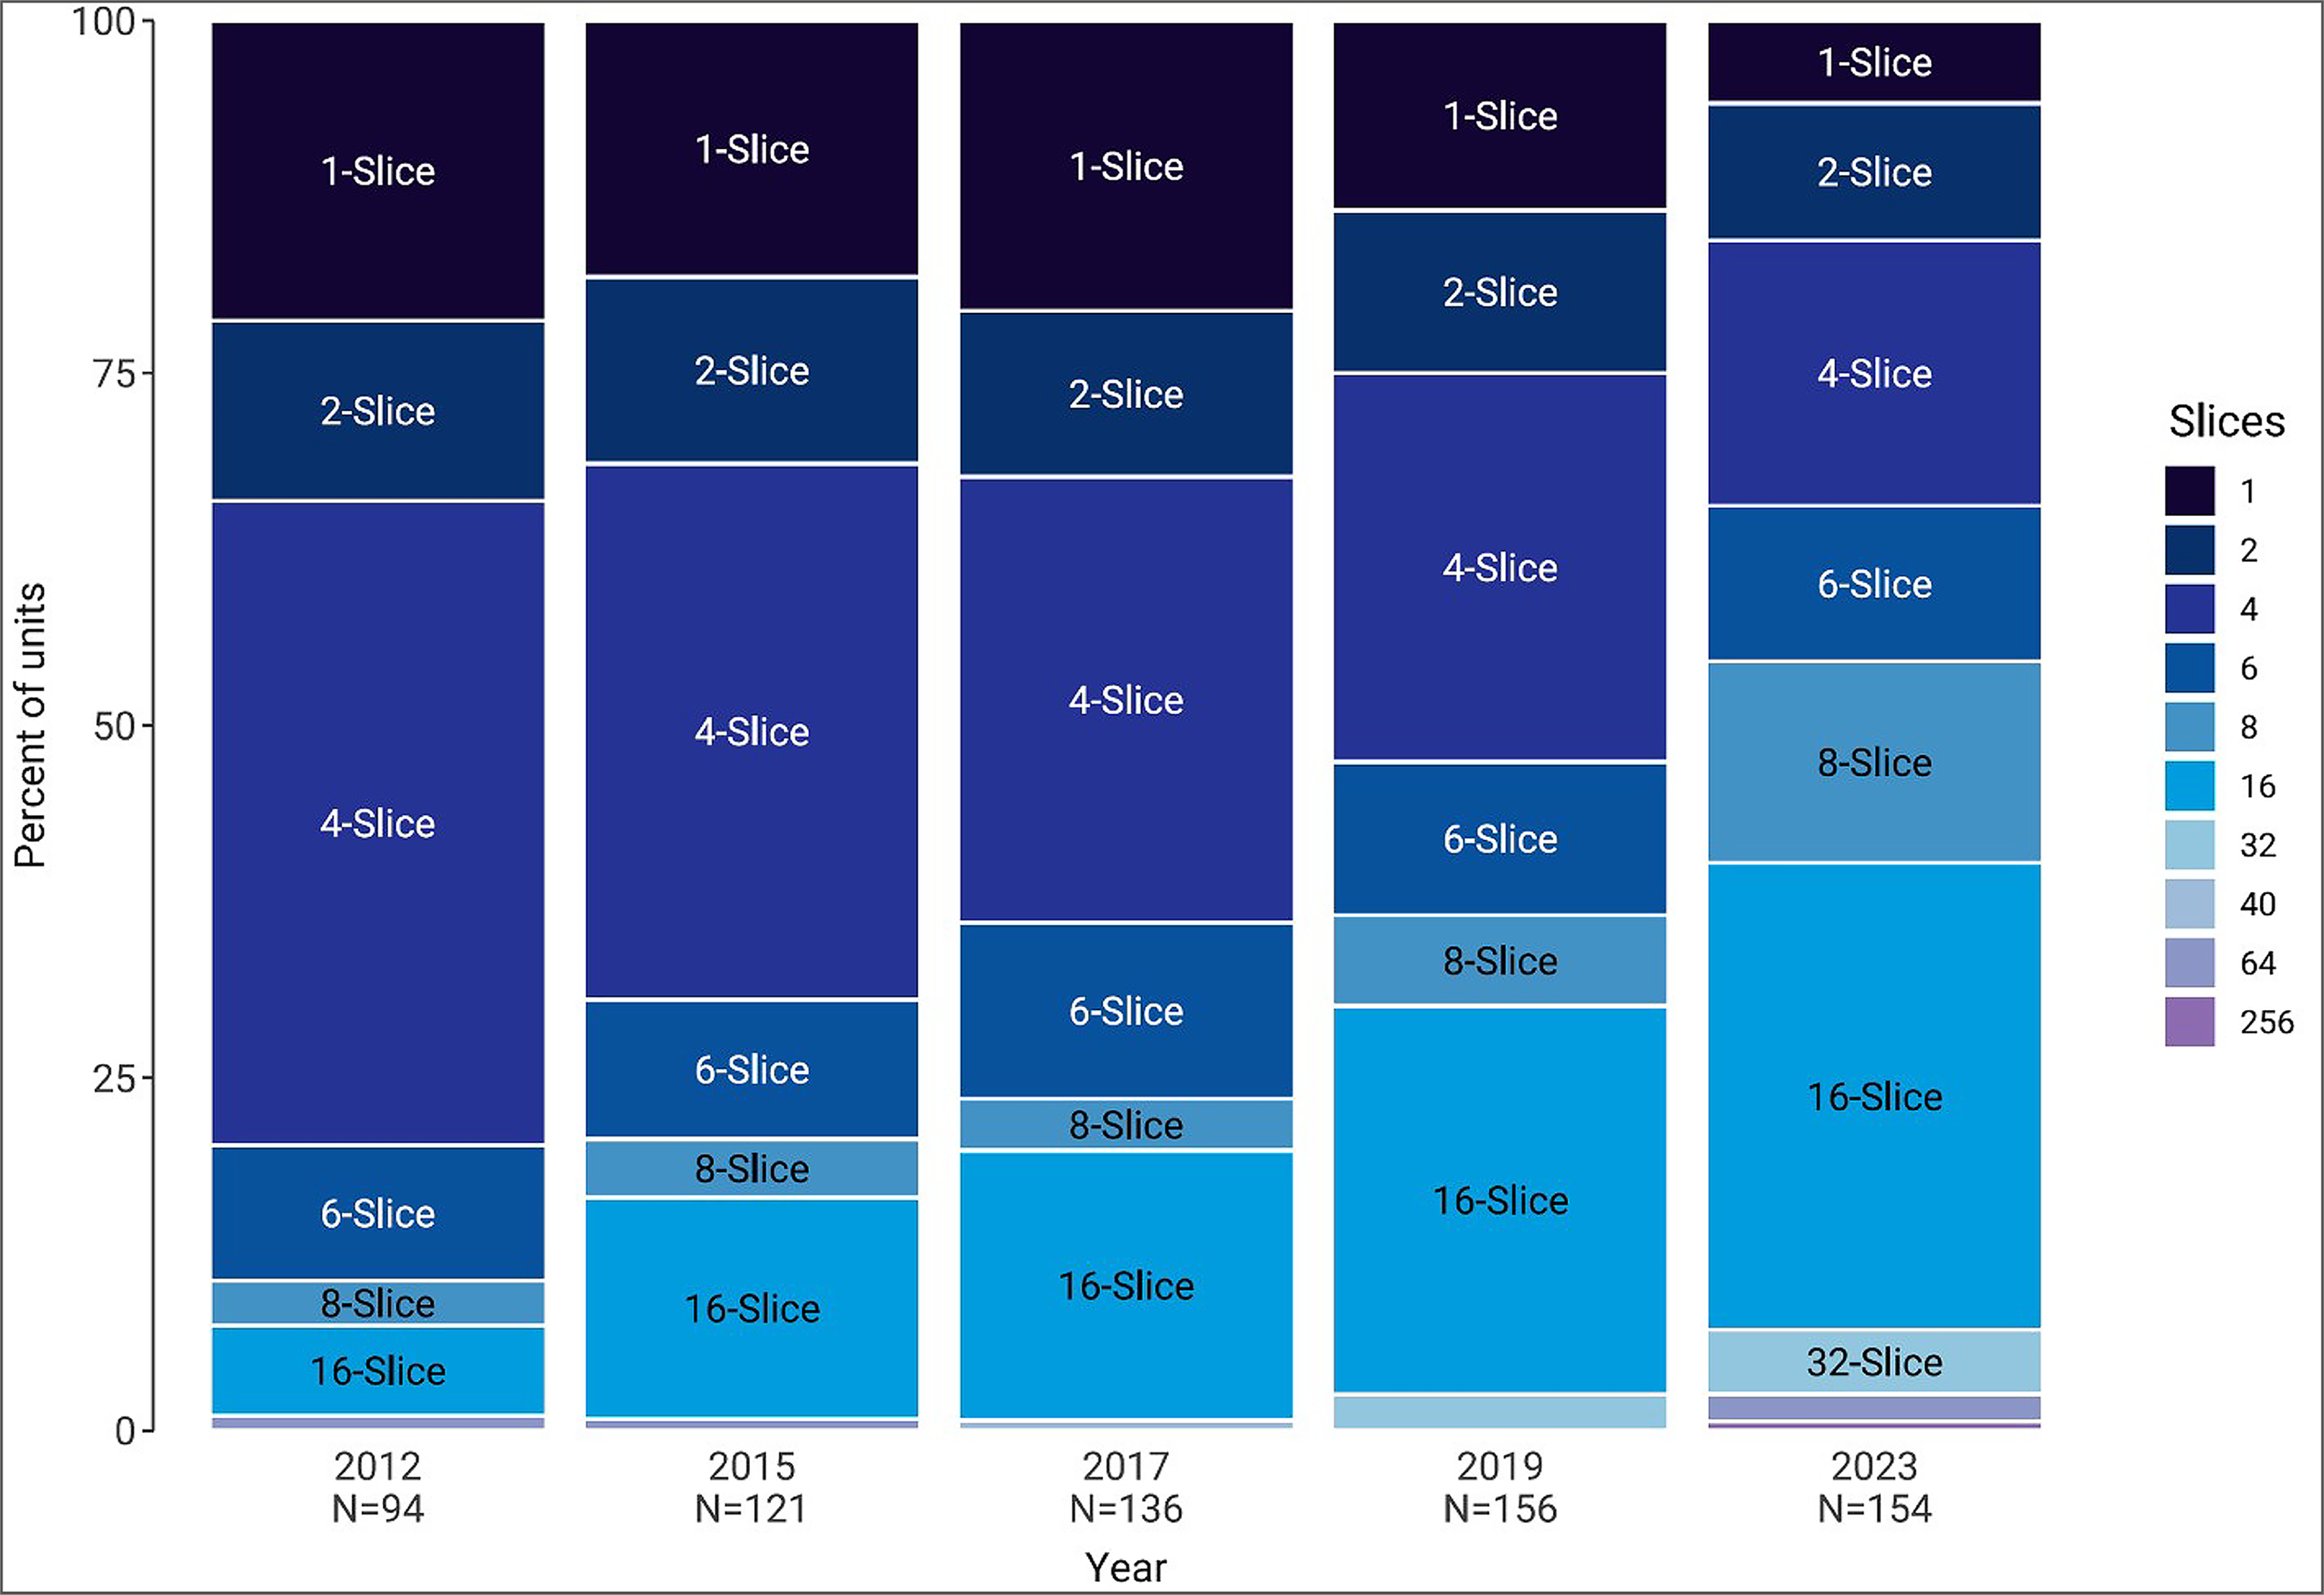
Notes: The number of units with data available for each year is indicated with the year.
The 2023 data were derived from the survey question: “How many multi-detectors does the SPECT-CT unit have (how many slices)?”
Source: Canadian Institute for Health Information (2012),19 the Canadian Institute for Health Information QuickStats dataset,20 Canadian Medical Imaging Inventory (CMII) (2015),8 CMII (2017),9 CMII (2020),3 and CMII (2022–2023). The 2015 data were subject to additional data-cleaning before being uploaded for the 2017 survey, and this cleaned dataset was used.
Availability of Technologies for Control of Radiation Exposure, 2015 to 2022–2023
Since 2015, the percentage of SPECT-CT units reported to have dose-management controls, increased from 16.1% in 2015 to 29.3% in 2022 to 2023 (Appendix 3, Table 39).
Patient Radiation Dose Recording for Control of Radiation Exposure, 2015 to 2022–2023
All provinces reported the use of dose recording in SPECT-CT. Appendix 3, Table 39 presents the availability of radiation exposure in SPECT-CT units from CMII surveys conducted between 2015 and 2022–2023 for units with available information.
In 2015, the number of SPECT- CT units reported to record patient radiation dose by exam increased from 14.8% in 2015 to 42.9% in 2022–2023.
Projections of the Number of Units and Exams for SPECT-CT and SPECT
The CMII forecasts the number of SPECT-CT and SPECT units and the volume of exams needed to maintain current levels of service based on estimations of population growth in Canada for 2025, 2030, 2035, and 2040.
Our projections use a simple model based on 2022–2023 SPECT-CT and SPECT imaging unit and exam findings, which were applied to estimated population projections from Statistics Canada. Three different population scenarios are envisioned for low, medium, and high projected growth and are presented in 5-year increments to 2040 growth (refer to Appendix 3, Table 40 for population projections). The projections use the current per capita number of unit and exam volumes for 2022–2023 and assume that population change is the only driver of growth over the forecasted period. Additional limitations of the data are summarized later in this section of this report.
Projected Number of SPECT-CT Units for 2025, 2030, 2035, and 2040
For each jurisdiction with existing SPECT-CT capacity, projections for the number of units needed to maintain current levels of service are presented in Figure 26 and Appendix 3, Table 41. Assuming medium population growth:
In Canada, the number of SPECT-CT units is projected to increase by 18.4%, from 331 units in 2022–2023 to 392 units in 2040 (range, 357.5 to 423.4).
The number of SPECT-CT units is projected to increase for all provinces with existing capacity, except for Newfoundland and Labrador and Prince Edward Island.
Three provinces are projected to have the largest increase in units by 2040: Ontario, from 92 to 111 units; Alberta, from 39 to 53 units; and British Columbia, from 50 to 60 units.
When low population growth is assumed, the number of SPECT-CT units is projected to increase in Alberta, British Columbia, Manitoba, Ontario, and Saskatchewan. New Brunswick, Nova Scotia, Prince Edward Island, and Quebec are projected to remain unchanged from 2022–2023.
Newfoundland and Labrador is the only province that has a projected population decline across growth scenarios.
Northwest Territories, Nunavut, and Yukon do not currently have any SPECT-CT units, and so estimated growth projections could not be calculated.
Figure 26: Projected Number of SPECT-CT Units for 2025, 2030, 2035, and 2040
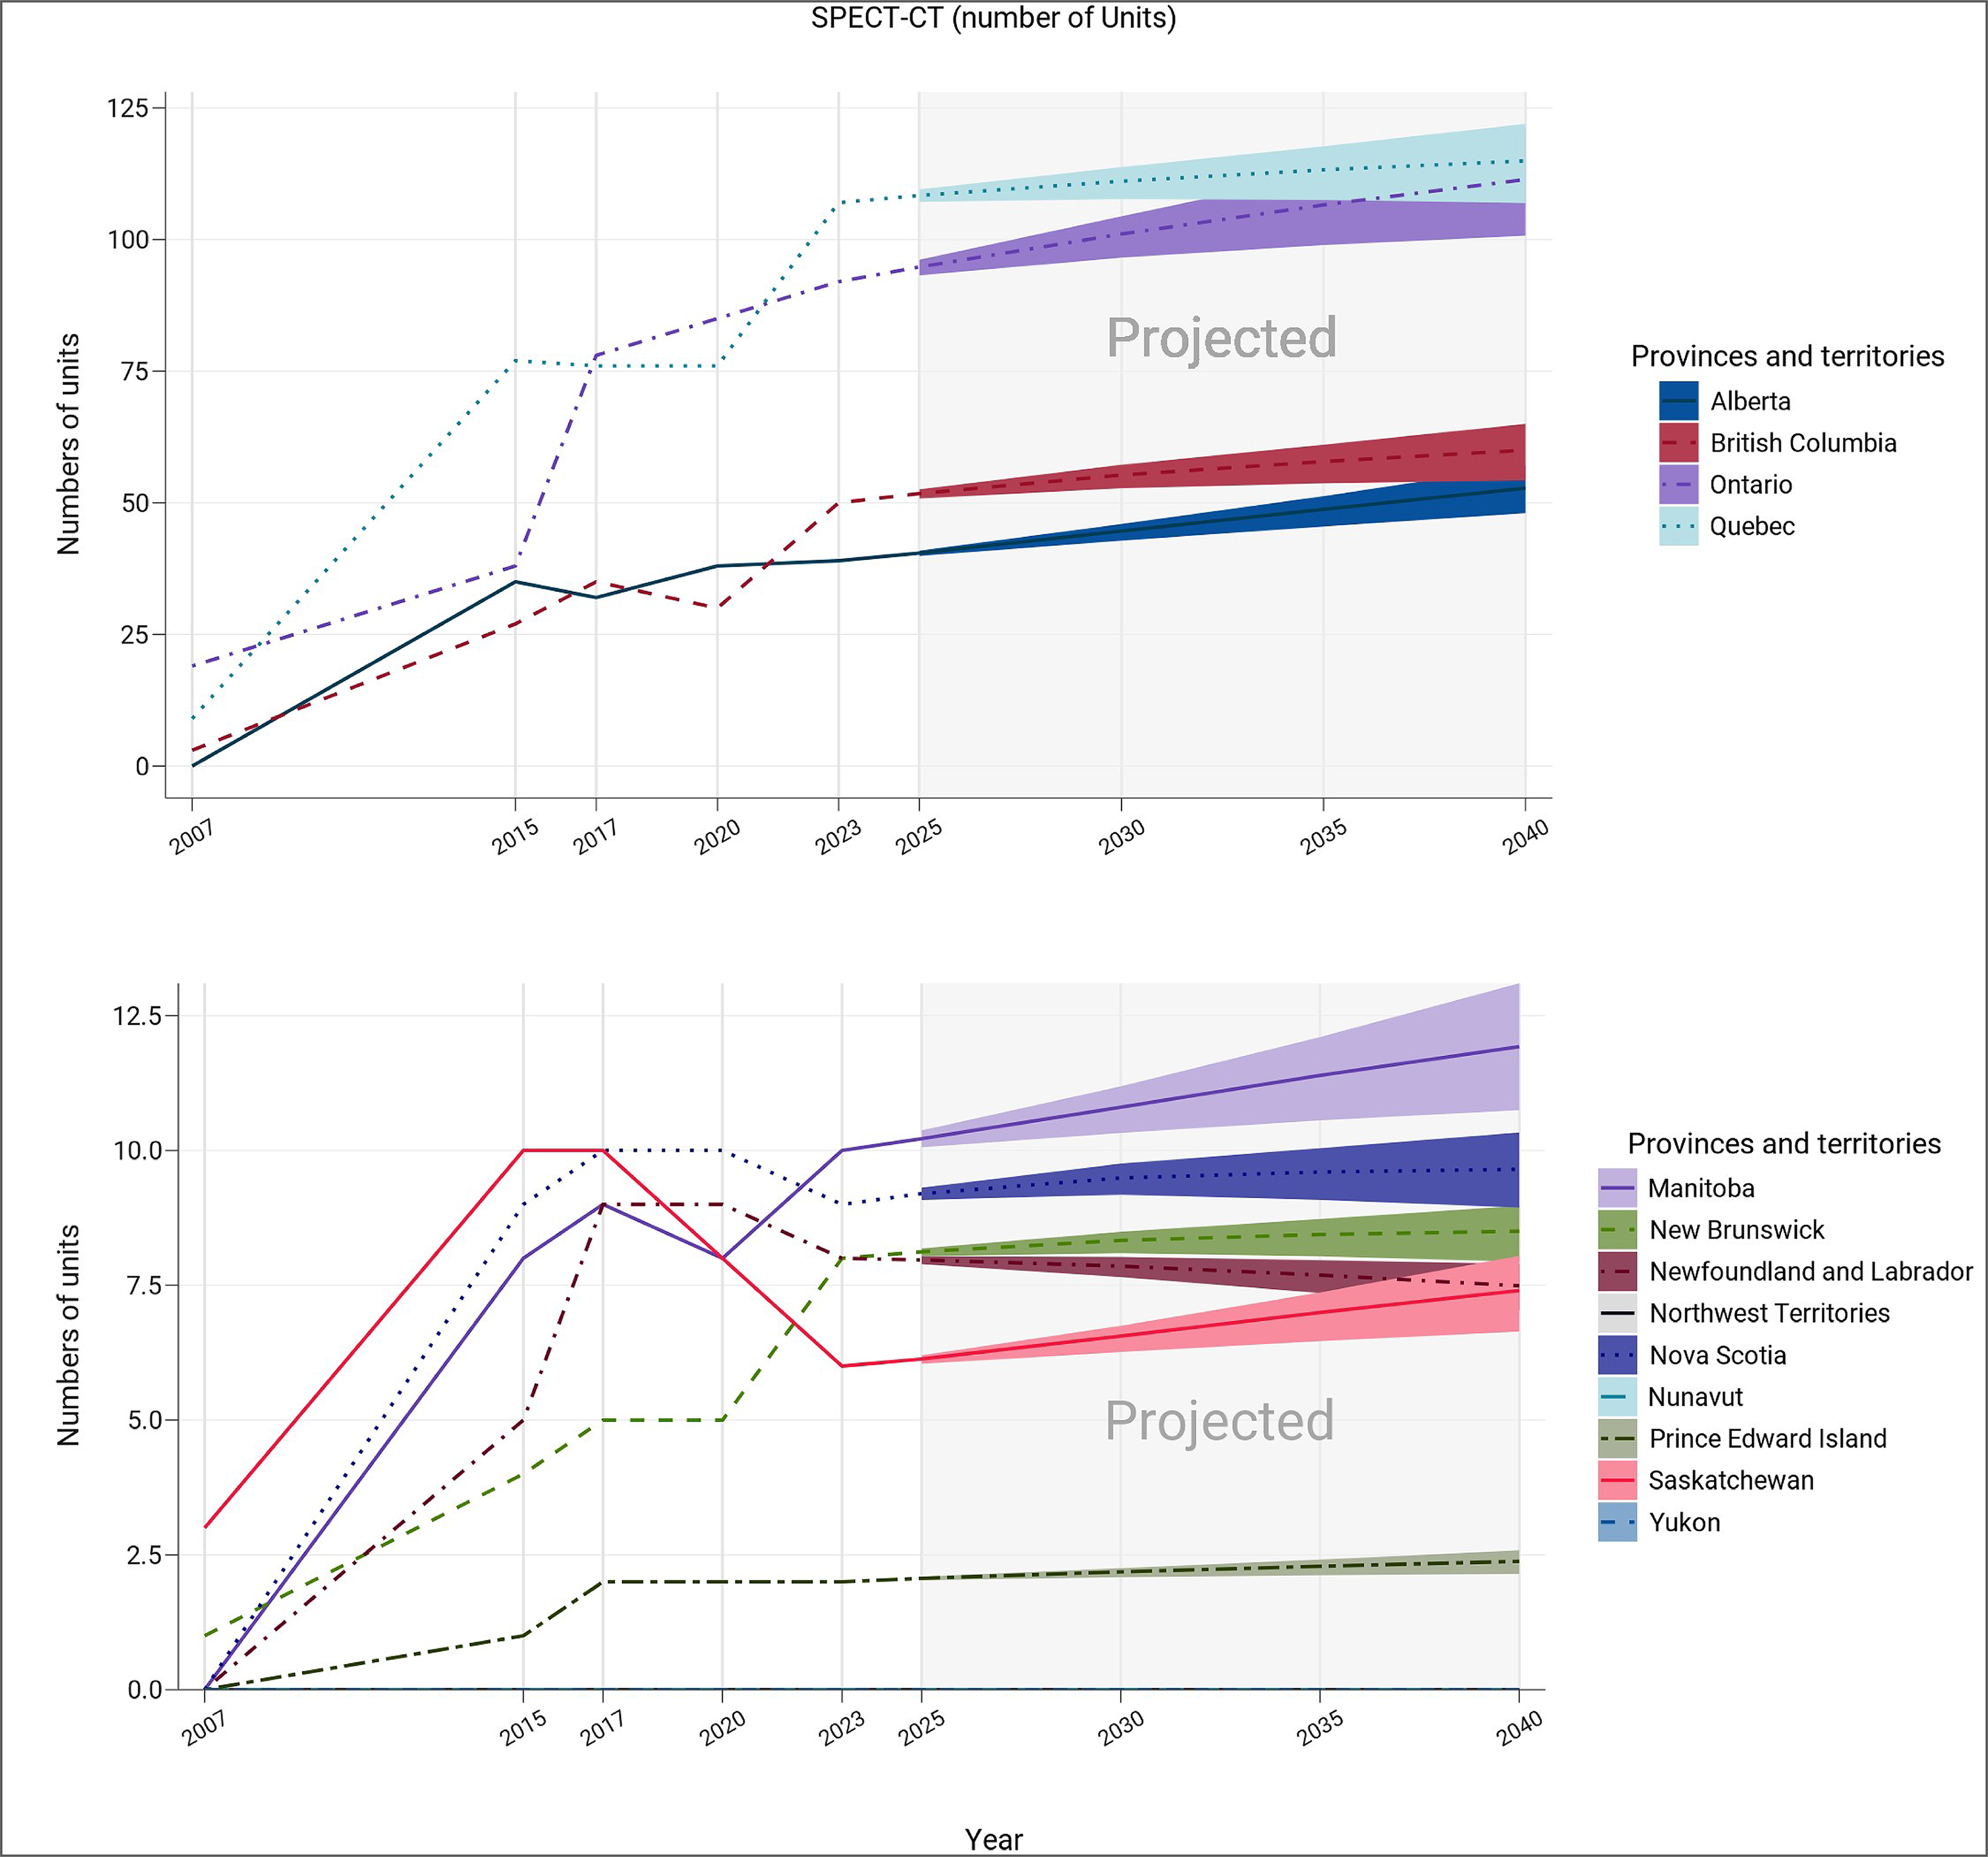
Notes: The projection was calculated from the products of the numbers of per capita units in 2022–2023 and the population projections in 2025, 2030, 2035, and 2040.
The numbers of imaging units or exams were provided by provincial or territorial validators in 2023.
The population projections were retrieved from the Statistics Canada website on January 18, 2024.21
The solid lines of projections were based on the population projection, assuming medium growth.
The upper and lower bounds were based on population projections, assuming high and low growth, respectively.
The data displayed in this figure are presented in greater detail in Appendix 3, Table 41.
Projected Number of SPECT Units for 2025, 2030, 2035, and 2040
For each jurisdiction with existing SPECT capacity, the projections for the number of units needed to maintain current levels of service are presented in Figure 27 and Appendix 3, Table 42. Assuming medium population growth:
In Canada, the number of SPECT units is projected to increase by 18.6%, from 210 units in 2022–2023 to 249 units in 2040 (range, 226.8 to 268.6).
The number of SPECT units is projected to increase for all provinces with existing capacity, except for Newfoundland and Labrador and New Brunswick.
Three provinces are projected to have the largest increase in units by 2040: Ontario, from 102 to 124 units; Alberta, from 36 to 49 units; and British Columbia, from 16 to 19 units.
When low population growth is assumed, the number of SPECT units is projected to increase in Alberta, British Columbia, Ontario, and Saskatchewan. Manitoba, New Brunswick, Nova Scotia, and Quebec are projected to remain unchanged from 2022–2023.
Newfoundland and Labrador is the only province that has a projected population decline across growth scenarios.
Prince Edward Island, Northwest Territories, Nunavut, and Yukon do not currently have any SPECT units, and so estimated growth projections could not be calculated.
Figure 27: Projected Number of SPECT Units for 2025, 2030, 2035, and 2040
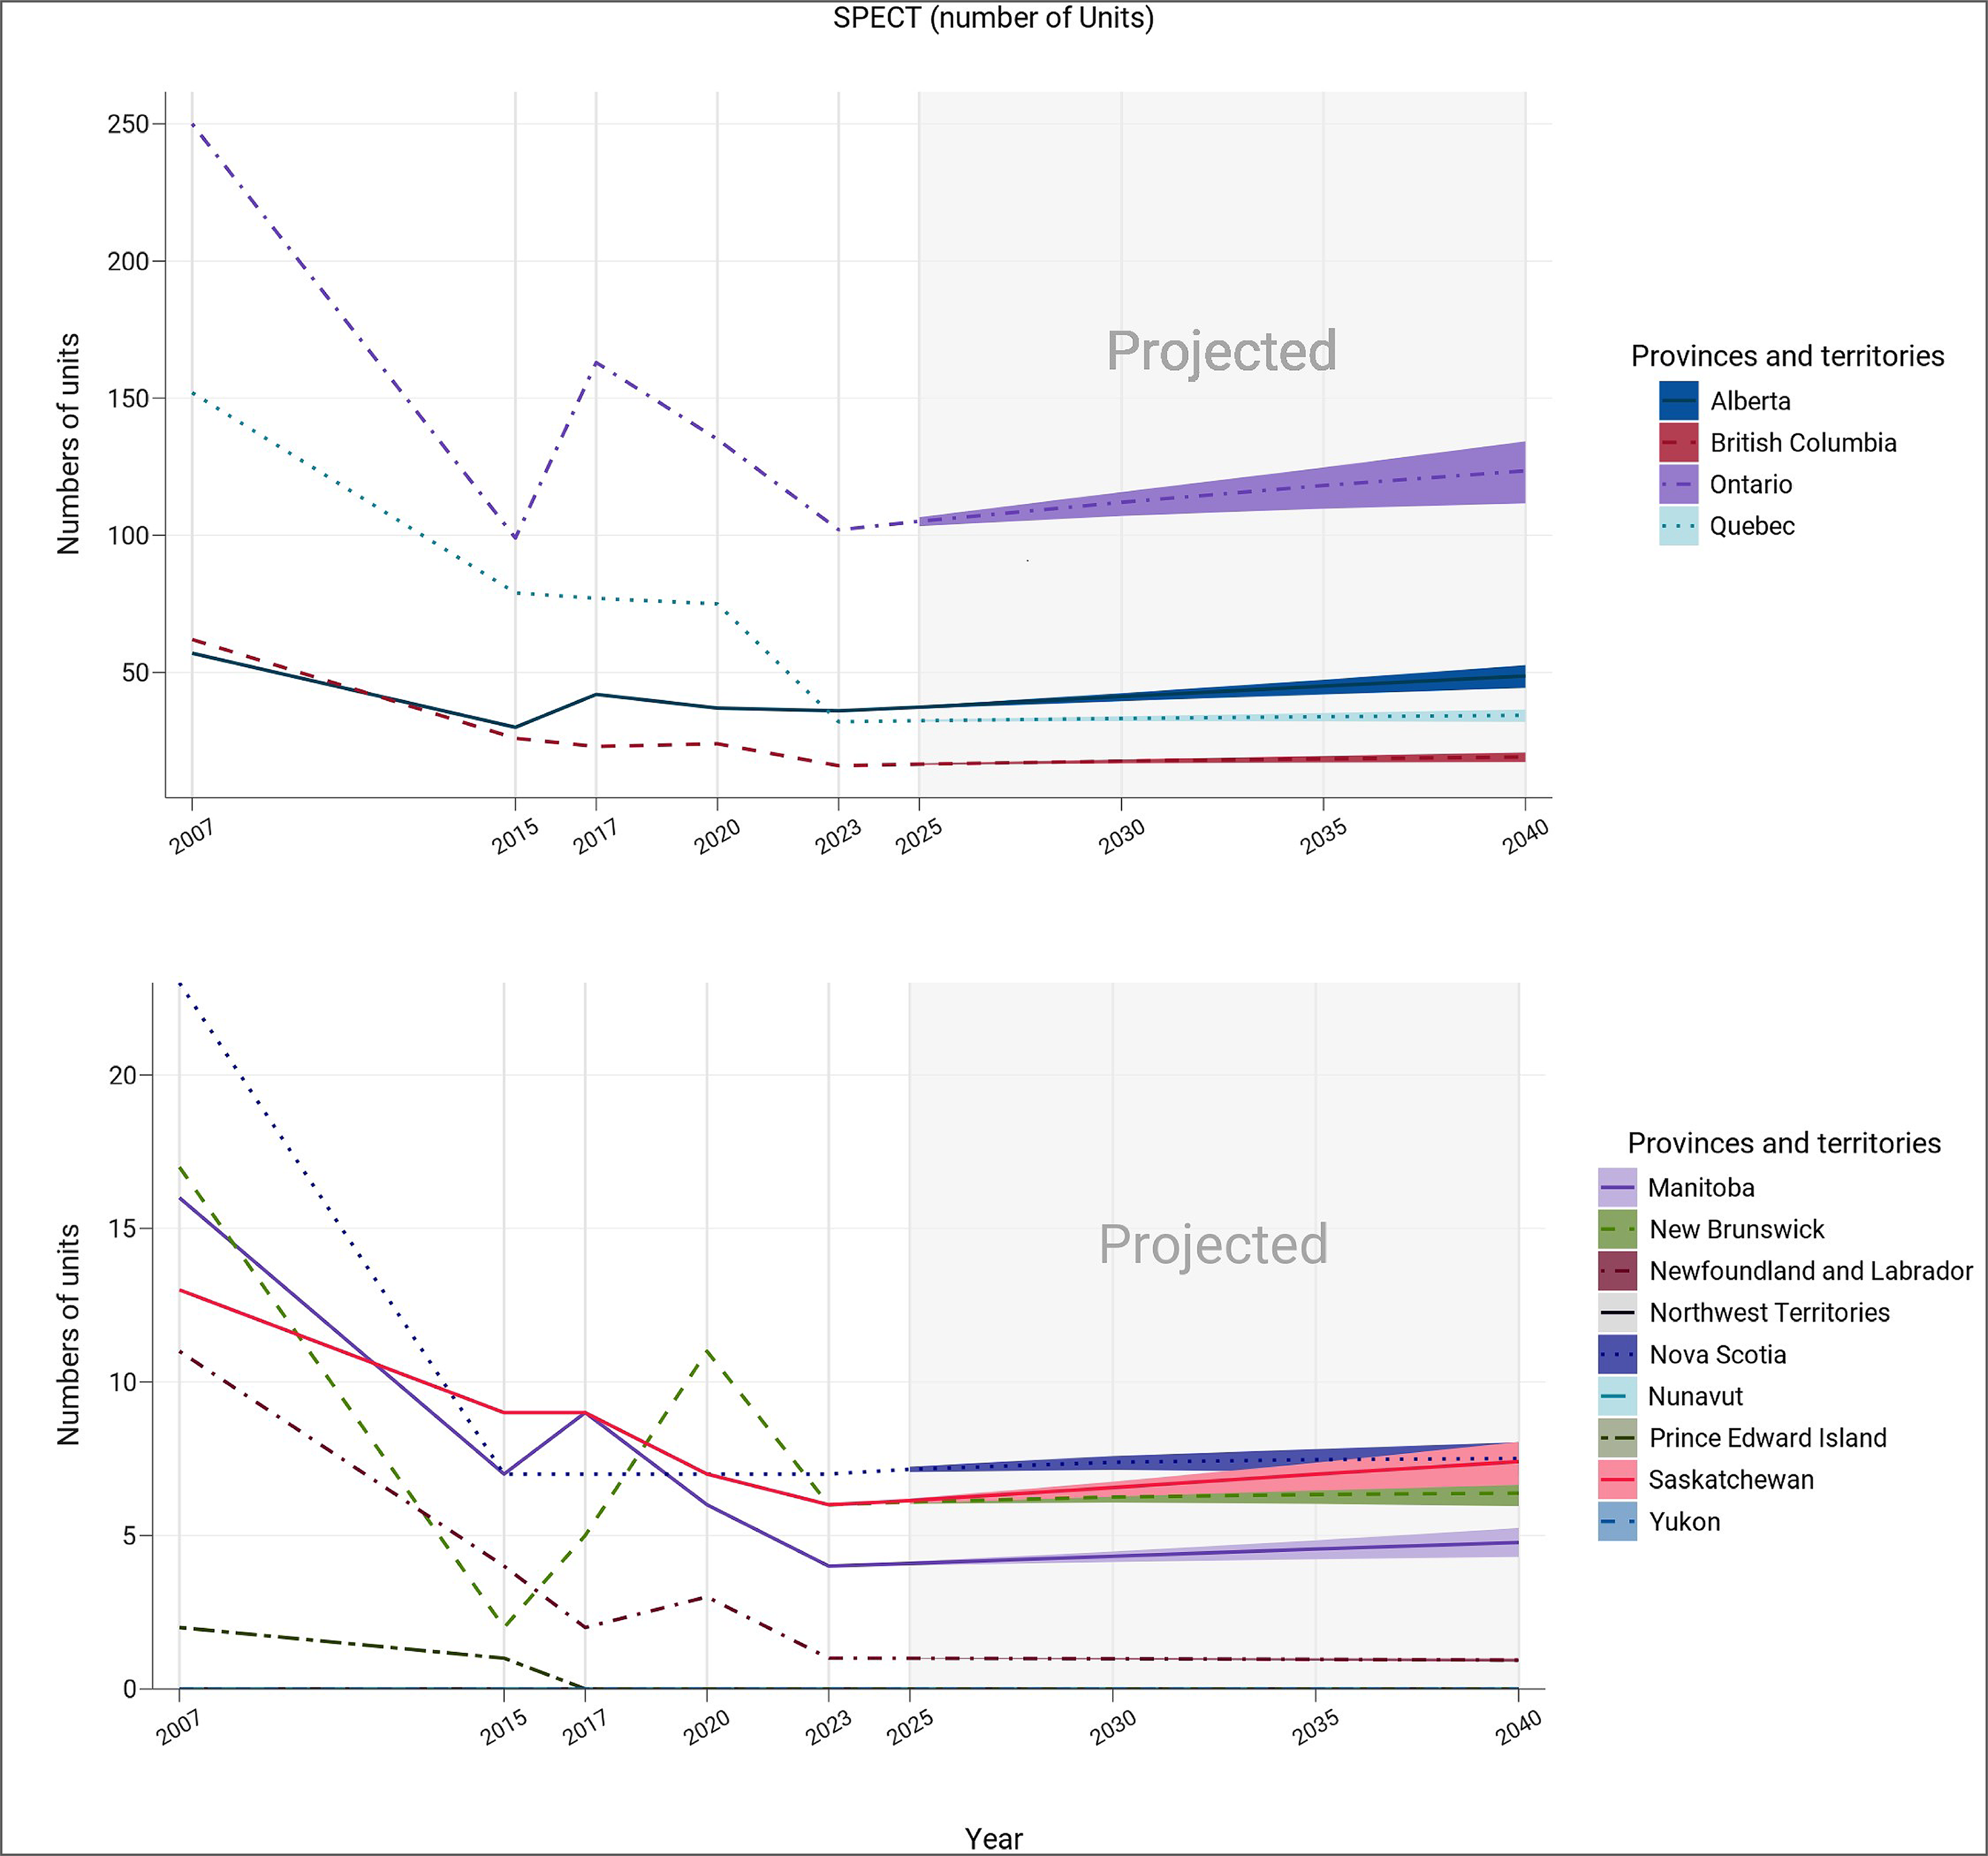
Notes: The projection was calculated from the products of the numbers of per capita units in 2022–2023 and the population projections in 2025, 2030, 2035, and 2040.
The numbers of imaging units or exams were provided by provincial or territorial validators in 2023.
The population projections were retrieved from the Statistics Canada website on January 18, 2024.21
The solid lines of projections were based on the population projection, assuming medium growth.
The upper and lower bounds were based on population projections, assuming high and low growth, respectively.
The data displayed in this figure are presented in greater detail in Appendix 3, Table 41.
Projected Number of SPECT-CT and SPECT Exams for 2025, 2030, 2035, and 2040
The projections for the number of exams for each province with existing SPECT-CT or SPECT capacity are presented in Figure 28 and Appendix 3, Table 43). Assuming medium population growth:
In Canada, the number of SPECT-CT or SPECT exams is projected to increase by 18.5%, from 929,010 to 1,100,980 by 2040 (range, 1,003,423 to 1,188,389)
The number of SPECT-CT or SPECT exams is projected to increase for all provinces with existing capacity, except for Newfoundland and Labrador.
Alberta, Saskatchewan, and Ontario are projected to have the largest increase in exams by 2040, at 35%, 23%, and 21%, respectively, as they are projected to have the largest increase in medium population growth from 2022–2023 to 2040.
When low population growth is assumed, the number of SPECT-CT or SPECT exams is projected to increase in Alberta, British Columbia, Manitoba, Ontario, Prince Edward Island, and Saskatchewan.
Figure 28: Projection of SPECT-CT or SPECT Examinations (Thousands) for 2025, 2030, 2035, and 2040
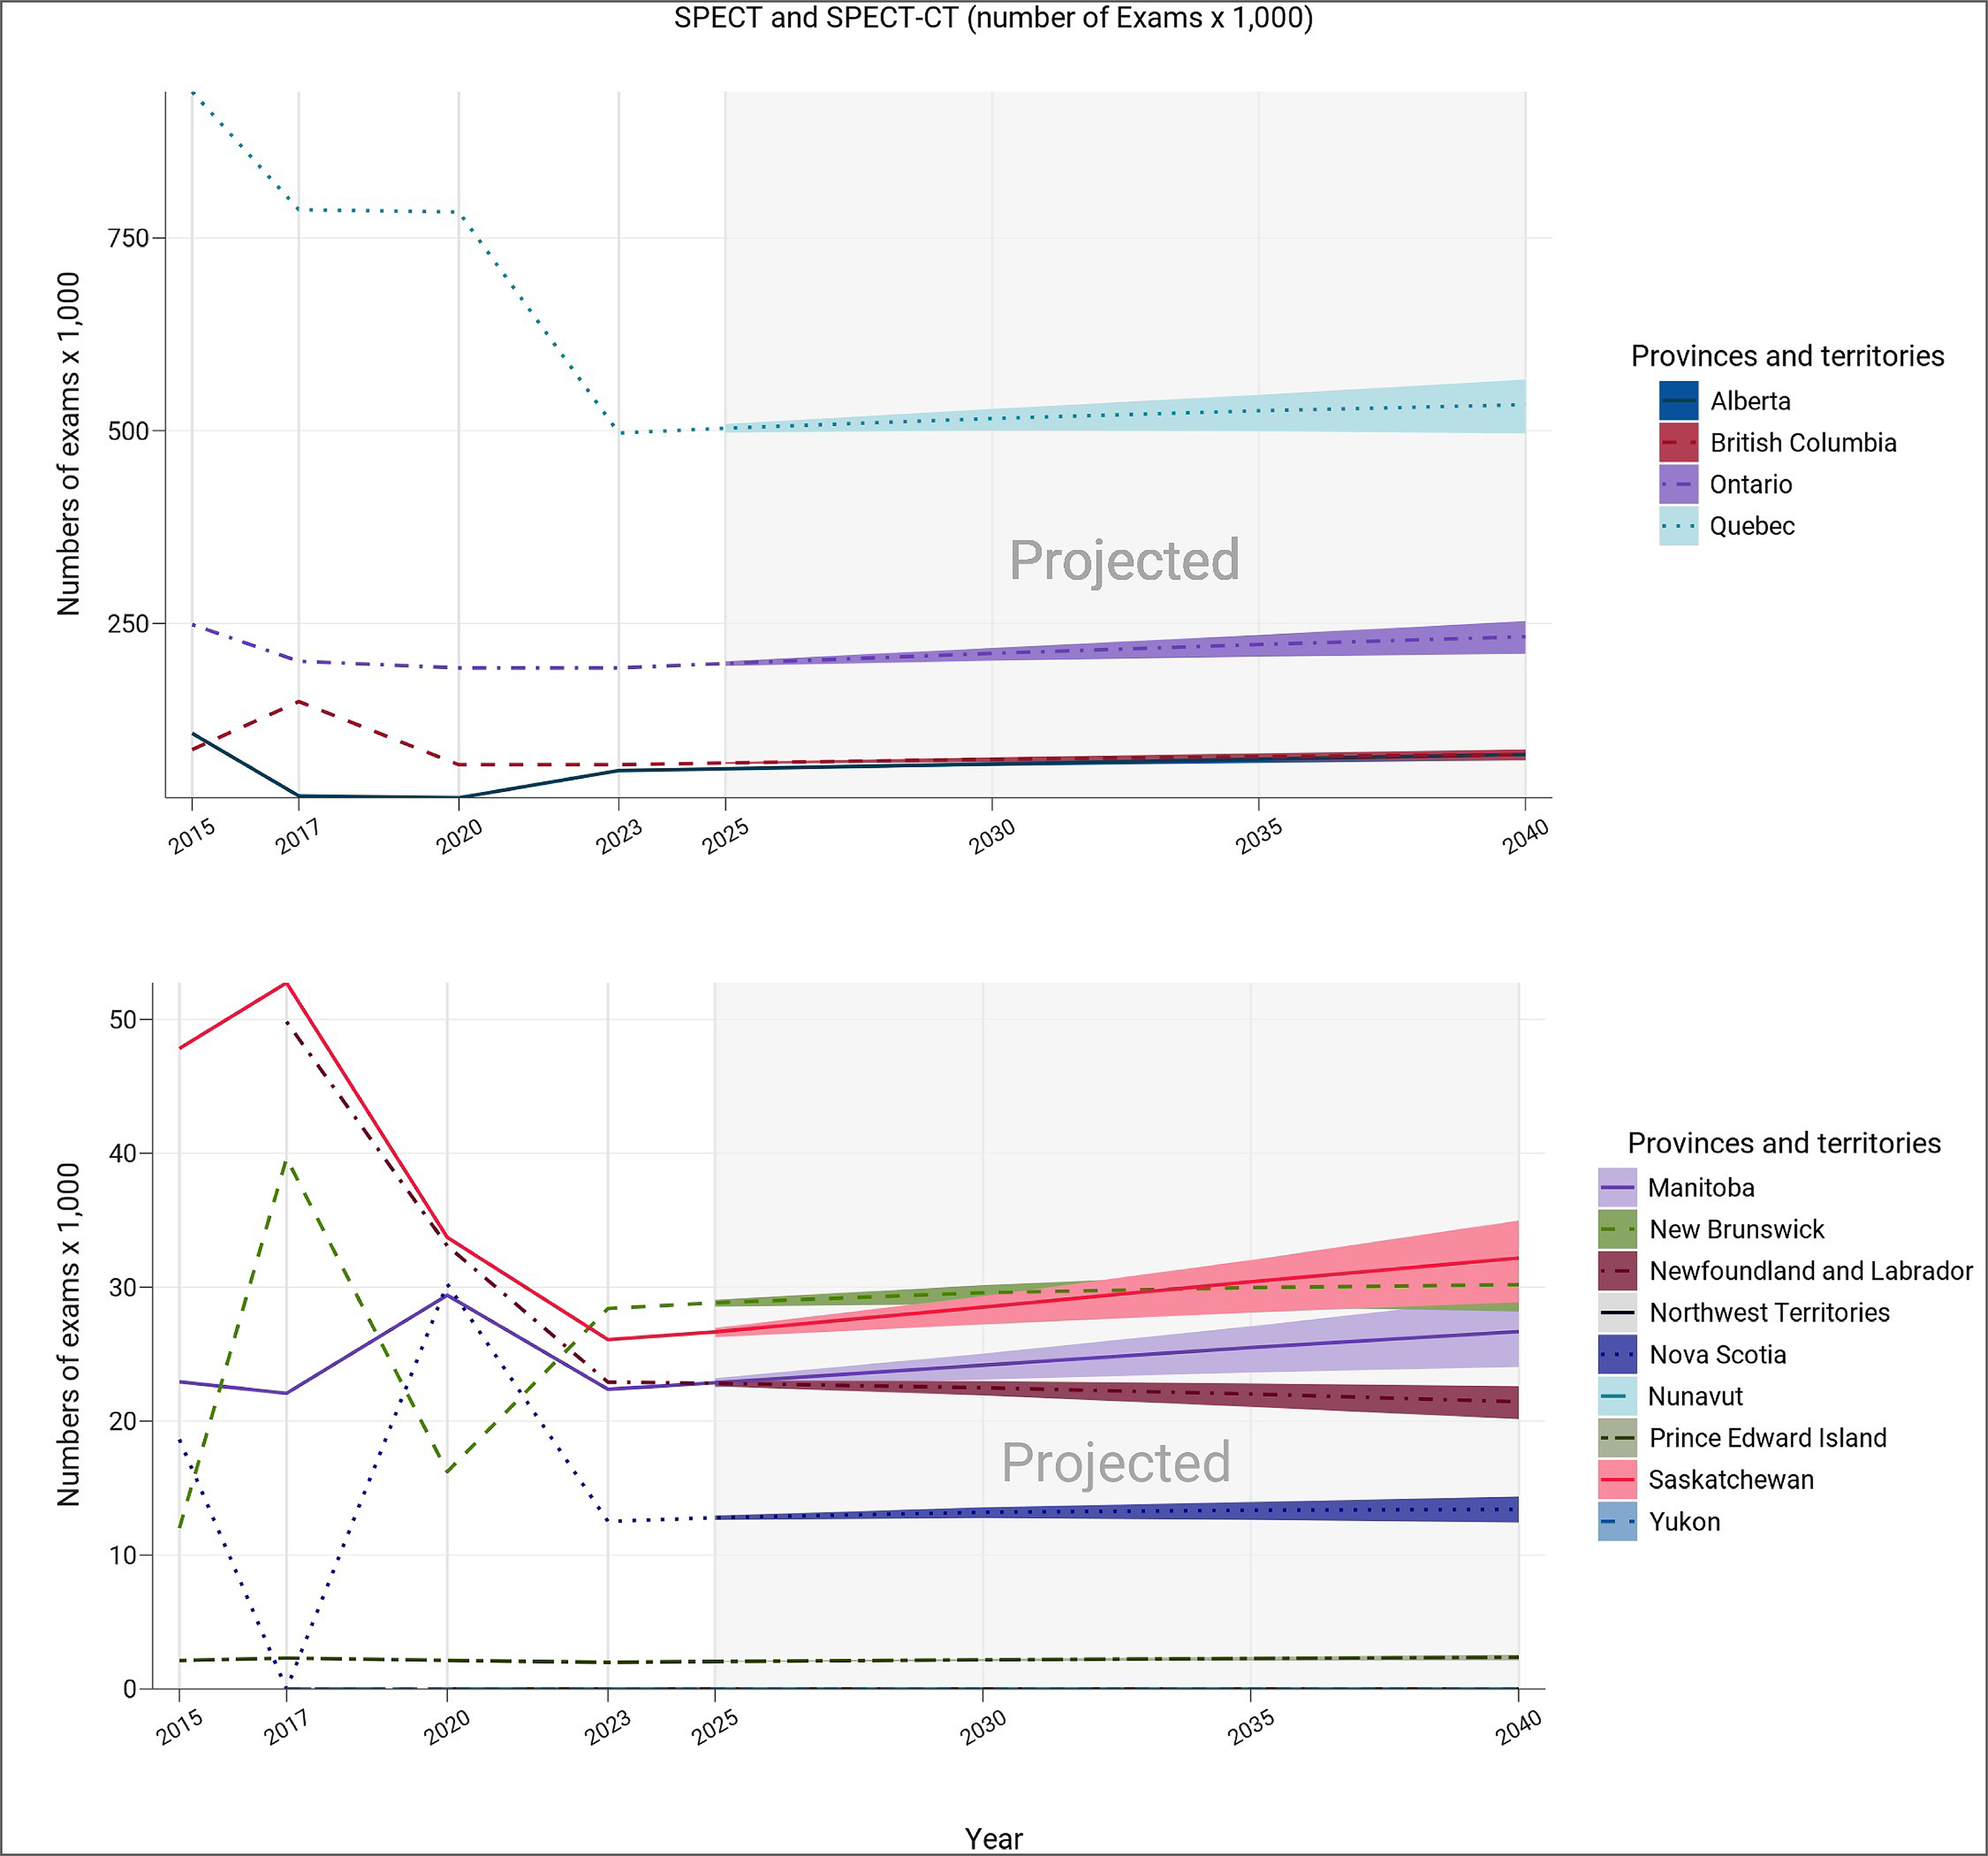
Notes: The projection was calculated from the products of the numbers of per capita exams in 2022–2023 and the population projections in 2025, 2030, 2035, and 2040.
The numbers of imaging units or exams were provided by provincial or territorial validators in 2023.
The population projections were retrieved from the Statistics Canada website on January 18, 2024.21
The solid lines of projections were based on the population projection, assuming medium growth.
The upper and lower bounds were based on population projections, assuming high and low growth, respectively.
The data displayed in this figure are presented in greater detail in Appendix 3, Table 43.
Projection Considerations and Limitations
Since 2015, the number of SPECT-CT units in Canada has increased by 54.7%, while the number of SPECT units and SPECT-CT or SPECT exam volumes have decreased, which is driven by the replacement of SPECT and planar technology with SPECT-CT and the use of other advanced imaging modalities. Additionally, when considering 2019–2020 CMII projections that expected the number of units or exams of both SPECT-CT and SPECT to increase in 2025,3 it is clear that other factors, in addition to population growth, influence projections.
To assist with policy development and planning around changing equipment and exam volumes, it may be helpful to consider additional factors such as:
changing health care priorities and policies
an aging population
increasing disease prevalence
the widening scope of clinical indications for which SPECT-CT and SPECT can be used
funding (with a set level of funding, there may be a limited number of exams that can be performed).
Limitations of Findings
While complete data are available from provincial and territorial validators for units and exams in the public setting, there is no equivalent publicly available repository for the private imaging sector; therefore, data for unit and exam counts are not reflective of overall private imaging facility operations. Challenges identifying private facilities and contacts within these facilities also contributed to the low number of survey responses for this category of imaging facility. Therefore, this may lead to underestimating the total number of units and exams, particularly in jurisdictions where privately run imaging facilities contribute to the overall use.
For some survey questions, a low number of responses were received by participating sites, warranting caution when interpreting the data. For instance, while 138 sites reported SPECT capacity, 64 sites reported data for hours of operation. The number of sites that responded to each question are included alongside the reported data, to enable readers to assess representativeness. Future work will be undertaken to identify patterns in missing data and how this may impact reporting bias.
To document the age of equipment, dates provided by reporting sites were variably reported as year of installation or first year of operation (depending on data availability). This frequently varied across datasets, leading to a 1- or 2-year uncertainty in the age of individual units, and a corresponding uncertainty in the reported mean age of equipment.
For specific survey questions, the accuracy of the data in this report relies in part on the survey participants’ personal knowledge of their particular health care setting (e.g., hours of operation, hours of unplanned downtime). For these survey questions, recall bias could not be avoided, as we were unable to assess whether all information was visually verified and based on real-time observations or whether questions were answered from memory. As a result, the accuracy and completeness of reporting may be affected.
Since 2015, the CMII national survey forms have been prepopulated with responses from sites that participated in previous CMII national survey iterations. Invited survey respondents were asked to update their data to reflect the status at the time of responding to the survey. If the survey data were not updated, it was assumed that no changes had been made from the previous CMII survey response. While this method improved survey respondent engagement and reduced fatigue, in some instances not all data may be up-to-date for some sites.
SPECT and SPECT-CT accounting has been variable. Possible reasons include sites' and validators' uncertain identification of units with low CT resolution as SPECT rather than as SPECT-CT and the tendency for some jurisdictions to report combined unit and exam counts, leading us to estimate how many were SPECT and how many were SPECT-CT.
What Else Are We Doing?
This Canadian Medical Imaging Inventory 2022–2023: SPECT and SPECT-CT report is part of a series of publications that CADTH has produced as part of the CMII national survey.
The following additional publications, which can be found on the CMII webpage, are available to provide jurisdiction-level information on medical imaging modalities and resources:
Canadian Medical Imaging Inventory 2022–2023: Provincial and Territorial Overview
Canadian Medical Imaging Inventory 2022–2023: CT
Canadian Medical Imaging Inventory 2022–2023: MRI
Canadian Medical Imaging Inventory 2022–2023: PET-CT and PET-MRI
Canadian Medical Imaging Inventory 2022–2023: The Medical Imaging Team
provincial and territorial summaries.
What Else Have We Done?
Other CMII-related reports that CADTH has released in 2023–2024 in response to specific decision-maker needs are listed here and published on the CMII website:
General Ultrasound Examination Volumes per Sonographer 8-Hour Workday
Average Volume of MRI Exams Conducted per Hour Across Canada
Use of MRI and CT in Private Imaging Facilities in Canada: Service Report
Imaging Implementation Advice Panel: Guidance for PSMA-PET Implementation
Individuals’ Access to Medical Imaging Results via Patient Portals
References
1.Massari R, Mok GSP. Editorial: New trends in single photon emission computed tomography (SPECT). Front Med (Lausanne). 2023;10:1349877. PubMed
2.Open Medscience. The future of SPECT imaging and emerging technological advances https://openmedscience.com/the-future-of-spect-imaging-and-emerging-technological-advances/. Accessed 2024 Mar 24.
3.Chao Y-S, Sinclair A, Morrison A, Hafizi D, Pyke L. Health Technology Reivew: The Canadian Medical Imaging Inventory 2019-2020. Can J Health Technol. 2021;1(1). https://www.canjhealthtechnol.ca/index.php/cjht/article/view/op0546/op0546. Accessed 2024 Jan 10.
4.Djekidel M. The changing landscape of nuclear medicine and a new era: the “NEW (Nu) CLEAR Medicine”: a framework for the future. Front Nucl Med. 2023;3:1213714.
5.Shao W, Rowe SP, Du Y. Artificial intelligence in single photon emission computed tomography (SPECT) imaging: a narrative review. Ann Transl Med. 2021;9(9):820. PubMed
6.Van den Wyngaert T, Elvas F, De Schepper S, Kennedy JA, Israel O. SPECT/CT: standing on the shoulders of giants, it is time to reach for the sky! J Nucl Med. 2020;61(9):1284-1291. PubMed
7.Ritt P. Recent Developments in SPECT/CT. Semin Nucl Med. 2022;52(3):276-285. PubMed
8.Sinclair A, Quay T, Pyke L, Morrison A. The Canadian Medical Imaging Inventory, 2015. (Optimal use report). Ottawa (ON): CADTH; 2016: https://www.cadth.ca/sites/default/files/pdf/canadian_medical_imaging_inventory_2015_e.pdf. Accessed 2024 Jan 10.
9.Sinclair A, Morrison A, Young C, Pyke L. The Canadian Medical Imaging Inventory, 2017. (Optimal use report). Ottawa (ON): CADTH; 2018: https://www.cadth.ca/sites/default/files/pdf/canadian_medical_imaging_inventory_2017.pdf. Accessed 2024 Jan 10.
10.Canadian Institute for Health Information. QuickStats. Selected medical imaging equipment in Canada. 2012; https://www.cihi.ca/en/selected-medical-imaging-equipment-in-canada. Accessed 2024 Mar 24.
11.Canadian Institute for Health Information. Medical imaging in Canada 2012 (executive summary). Ottawa (ON): CIHI; 2013.
12.Canadian Institute for Health Information. Medical imaging in Canada 2007. Ottawa (ON): CIHI; 2008: https://publications.gc.ca/collections/collection_2008/cihi-icis/H118-13-2007E.pdf. Accessed 2024 Jan 10.
13.Canadian Institute for Health Information. Medical imaging in Canada. Ottawa (ON): CIHI; 2003: https://publications.gc.ca/Collection/H118-13-2003E.pdf. Accessed 2024 Jan 10.
14.Statistics Canada. Canada's population estimates, first quarter 2023. The Daily. Ottawa (ON): Government of Canada; 2023: https://www150.statcan.gc.ca/n1/daily-quotidien/230628/dq230628c-eng.htm. Accessed 2024 Jan 5.
15.Mason J, Morrison A, Visintini S. An overview of clinical applications of artificial intelligence. (Issues in emerging health technologies, issue 174). Ottawa (ON): CADTH; 2018: https://www.cadth.ca/sites/default/files/pdf/eh0070_overview_clinical_applications_of_AI.pdf. Accessed 2024 Mar 09.
16.Najjar R. Redefining radiology: a review of artificial intelligence integration in medical imaging. Diagnostics (Basel). 2023;13(17):2760. PubMed
17.Health Council of Canada. Decisions, decisions: family doctors as gatekeepers to prescription drugs and diagnostic imaging in Canada. Toronto (ON): Health Council; 2010: https://publications.gc.ca/collections/collection_2011/ccs-hcc/H174-19-2010-eng.pdf. Accessed 2024 Mar 22.
18.Peer review: a diagnostic imaging quality initiative for Ontario. Toronto (ON): Health Quality Ontario; 2016: https://www.hqontario.ca/Portals/0/documents/health-quality/di-expert-panel-report-en.pdf. Accessed 2024 Mar 09.
19.Medical imaging in Canada 2012 (executive summary). Ottawa (ON): Canadian Institute for Health Information (CIHI); 2013.
20.QuickStats: Selected medical imaging equipment in Canada. Ottawa (ON): Canadian Institute for Health Information (CIHI); 2012.
21.Population projections for Canada (2021 to 2068), provinces and territories (2021 to 2043): technical report on methodology and assumptions. Ottawa (ON): Statistics Canada; 2023: https://www150.statcan.gc.ca/n1/en/pub/91-620-x/91-620-x2022001-eng.pdf. Accessed 2024 Mar 24.
Appendix 1: Introduction to SPECT-CT and SPECT
Note that this appendix has not been copy-edited.
SPECT-CT
SPECT-CT combines SPECT and CT to create three-dimensional images of the body part of interest, such as brain, bone, and heart. Its main advantage is that it offers both metabolic and physiologic information, coupled with the resolution of CT. During a hybrid SPECT-CT, both scans are performed in sequence; the images are then computationally aligned with each other to show anatomic and functional detail, and to enable attenuation correction of the SPECT signal. Medical specialties that commonly use SPECT-CT imaging include oncology, neurology, cardiology, internal medicine, and orthopedics.
The challenges of SPECT-CT are those of the component modalities, both of which involve exposure to ionizing radiation,66 and concerns about availability of radioisotopes.
SPECT
In nuclear medicine imaging, trace amounts of radiopharmaceuticals are administered to patients intravenously or by injection (e.g., subcutaneously or intradermally), ingestion, or inhalation to visualize areas of radioisotope uptake within the body.47,61 Depending on the radiopharmaceutical administered, the function (i.e., physiology) of almost any organ system can be observed. Nuclear medicine gamma cameras detect the gamma rays emanating from the radioisotope and form flat images; most cameras are also capable of cross-sectional imaging (SPECT).62
Nuclear medicine exams identify and evaluate a variety of pathologies, including cancer, heart disease, as well as gastrointestinal, endocrine, and neurologic disorders. Medical specialties that commonly use SPECT imaging include oncology, neurology, cardiology, internal medicine, orthopedics, pediatrics, pneumology, and infectious disease.47,61
Appendix 2: Definitions of Terms Used in This Report
Note that this appendix has not been copy-edited.
Type of Facility Operating Imaging Equipment
Hospital
An institution where patients are provided with continuing medical care and supporting diagnostic and therapeutic services. Hospitals are licensed or approved as hospitals by a provincial or territorial government or are operated by the Government of Canada. Included are those providing acute care.
Tertiary Care
A hospital that provides tertiary care, which is health care from specialists who investigate and treat patients in a large hospital after referral from primary care and secondary care facilities.
Private
A health care facility that operates privately but that is either privately or publicly funded, that ranges from specialized services by physicians, radiologists, dentists, chiropractors, or via mammography programs, to broad-based imaging centres offering a wide range of tests.
Community Hospital
A short-term (average length of stay with fewer than 30 days) hospital that provides acute care.
Picture Archiving and Communication Systems
PACS refers to an electronic system used to digitally manage images, including transmission, filing, storage, distribution, and retrieval of medical images. It is networked and frequently web-based. Combined with other web-based telehealth technologies, PACS allows timely access to medical images and specialists. PACS has replaced film and film library systems.
Access to images outside medical imaging departments by referring and consulting physicians is important for efficient patient care, particularly so in a country like Canada, with its large geographic size and dispersed population.
Type of Equipment Servicing Method Reported by Sites
À la Carte
Services and parts that are paid by the imaging facility on an as-needed basis, with the service provider charging for parts, labour, and travel.
Full Vendor Service Contracts
Full vendor contracts provide a wide range of services, such as corrective maintenance, operational maintenance, planned maintenance, and extended warranty, along with insurance maintenance programs for a set period.
Insurance
Insurance policy service contracts may vary, but most equipment insurance companies specialize in risk management, cost avoidance, or service billing audit functions.
Managed Equipment Service
This service package entails ownership, acquisition, installation and commissioning, user training, asset management, maintenance, and ongoing replacement of medical technology and equipment.
Shared Service
Organizations that have in-house expertise and resources may service their own imaging equipment and may use external service contracts for certain types of equipment.
Third Party
Third-party agreements may often be used for hardware support and to provide services offered through a company separate from the original equipment manufacturer.
Under Warranty
Equipment maintenance according to warranty service agreement. At the end of the warranty period, health care systems must select their service contract type.
Appendix 3: Supplementary Summary Tables for SPECT-CT and SPECT, the 2022–2023 CMII
Note that this appendix has not been copy-edited.
Table 10: Summary of Location of SPECT-CT Facilities Included in the CMII, 2022–2023
Province or territory | Rural | Urban | Remote |
|---|---|---|---|
Number of sites (% in each jurisdiction) | |||
Alberta | 3 (15) | 17 (85) | 0 (0) |
British Columbia | 4 (16) | 21 (84) | 0 (0) |
Manitoba | 0 (0) | 5 (100) | 0 (0) |
New Brunswick | 0 (0) | 5 (100) | 0 (0) |
Newfoundland and Labrador | 1 (33.3) | 2 (66.7) | 0 (0) |
Northwest Territories | — | — | — |
Nova Scotia | 4 (50) | 4 (50) | 0 (0) |
Nunavut | — | — | — |
Ontario | 4 (8.5) | 43 (91.5) | 0 (0) |
Prince Edward Island | 0 (0) | 1 (100) | 0 (0) |
Quebec | 1 (4.2) | 23 (95.8) | 0 (0) |
Saskatchewan | 0 (0) | 3 (100) | 0 (0) |
Yukon | — | — | — |
Canada | 17 (12.1) | 124 (87.9) | 0 (0) |
“–” = not applicable.
Notes: Survey response data were available for 141 out of 180 sites across all jurisdictions with SPECT-CT capacity.
Data derived from survey question: “In which of the following settings are you located?”
Table 11: Summary of Type of SPECT-CT Facility Included in the CMII, 2022–2023
Province or territory | Community hospital | Private facilities | Hospital | Tertiary care |
|---|---|---|---|---|
Number of sites (% in each jurisdiction) | ||||
Alberta | 1 (5) | 7 (35) | 11 (55) | 1 (5) |
British Columbia | 0 (0) | 0 (0) | 19 (76) | 6 (24) |
Manitoba | 0 (0) | 0 (0) | 3 (60) | 2 (40) |
New Brunswick | 0 (0) | 0 (0) | 4 (80) | 1 (20) |
Newfoundland and Labrador | 0 (0) | 0 (0) | 3 (100) | 0 (0) |
Northwest Territories | — | — | — | — |
Nova Scotia | 0 (0) | 0 (0) | 5 (62.5) | 3 (37.5) |
Nunavut | — | — | — | — |
Ontario | 6 (11.1) | 0 (0) | 40 (74.1) | 8 (14.8) |
Prince Edward Island | 0 (0) | 0 (0) | 1 (100) | 0 (0) |
Quebec | 0 (0) | 0 (0) | 25 (89.3) | 3 (10.7) |
Saskatchewan | 0 (0) | 0 (0) | 0 (0) | 3 (100) |
Yukon | — | — | — | — |
Canada | 7 (4.6) | 7 (4.6) | 111 (73.0) | 27 (17.8) |
“–” = not applicable.
Notes: Survey response data were available for 152 out of 180 sites across all jurisdictions with SPECT-CT capacity.
Data were derived from the survey question: “What type of facility is this?” The table includes only those facilities that responded to the survey question. In some instances, validator data, CMII data, and data from other publicly available sources supplemented survey responses. Definitions for the type of facility included in the survey are provided in Appendix 2.
Table 12: Summary of Source of Funding for SPECT-CT Sites Included in the CMII, 2022–2023
Province or territory | Public | Private | Both |
|---|---|---|---|
Number of sites (% in each jurisdiction) | |||
Alberta | 17 (94.4) | 0 (0) | 1 (5.6) |
British Columbia | 23 (100) | 0 (0) | 0 (0) |
Manitoba | 5 (100) | 0 (0) | 0 (0) |
New Brunswick | 4 (80) | 0 (0) | 1 (20) |
Newfoundland and Labrador | 3 (100) | 0 (0) | 0 (0) |
Northwest Territories | — | — | — |
Nova Scotia | 6 (100) | 0 (0) | 0 (0) |
Nunavut | — | — | — |
Ontario | 32 (97) | 0 (0) | 1 (3) |
Prince Edward Island | 1 (100) | 0 (0) | 0 (0) |
Quebec | 16 (94.1) | 1 (5.9) | 0 (0) |
Saskatchewan | 3 (100) | 0 (0) | 0 (0) |
Yukon | — | — | — |
Canada | 110 (96.5) | 1 (0.9) | 3 (2.6) |
“–” = not applicable; SPECT-CT = single-photon emission CT-CT.
Notes: Survey response data were available for 114 out of 180 sites across all jurisdictions with SPECT-CT capacity.
Data were derived from the survey question: “How is this facility funded?” The table includes only those facilities that responded to the survey question. In some instances, validator data, CMII data, and data from other publicly available sources supplemented survey responses.
Table 13: Summary of Type of SPECT Facility Included in the CMII, 2022–2023
Province or territory | Community hospital | Private facilities | Hospital | Tertiary care |
|---|---|---|---|---|
Number of sites (% in each jurisdiction) | ||||
Alberta | 1 (10) | 4 (40) | 4 (40) | 1 (10) |
British Columbia | 0 (0) | 0 (0) | 7 (70) | 3 (30) |
Manitoba | 0 (0) | 0 (0) | 1 (33.3) | 2 (66.7) |
New Brunswick | 0 (0) | 0 (0) | 4 (80) | 1 (20) |
Newfoundland and Labrador | 0 (0) | 0 (0) | 1 (100) | 0 (0) |
Northwest Territories | — | — | — | — |
Nova Scotia | 0 (0) | 0 (0) | 2 (33.3) | 4 (66.7) |
Nunavut | — | — | — | — |
Ontario | 9 (16.4) | 6 (10.9) | 34 (61.8) | 6 (10.9) |
Prince Edward Island | — | — | — | — |
Quebec | 0 (0) | 0 (0) | 13 (92.9) | 1 (7.1) |
Saskatchewan | 0 (0) | 0 (0) | 0 (0) | 3 (100) |
Yukon | — | — | — | — |
Canada | 10 (9.3) | 10 (9.3) | 66 (61.7) | 21 (19.6) |
“–” = not applicable.
Notes: Survey response data were available for 107 out of 138 sites across all jurisdictions with SPECT capacity.
Data derived from survey question: “What type of facility is this?” The table includes only those facilities that responded to the survey question. In some instances, validator data, CMII data, and data from other publicly available sources supplemented survey responses. Definitions for the type of facility included in the survey are provided in Appendix 2.
Table 14: Summary of Source of Funding for SPECT Sites Included in the CMII, 2022–2023
Province or territory | Public | Private | Both |
|---|---|---|---|
Number of sites (% in each jurisdiction) | |||
Alberta | 6 (100) | 0 (0) | 0 (0) |
British Columbia | 8 (100) | 0 (0) | 0 (0) |
Manitoba | 3 (100) | 0 (0) | 0 (0) |
New Brunswick | 4 (80) | 0 (0) | 1 (20) |
Newfoundland and Labrador | 1 (100) | 0 (0) | 0 (0) |
Northwest Territories | — | — | — |
Nova Scotia | 4 (100) | 0 (0) | 0 (0) |
Nunavut | — | — | — |
Ontario | 27 (96.4) | 0 (0) | 1 (3.6) |
Prince Edward Island | — | — | — |
Quebec | 9 (100) | 0 (0) | 0 (0) |
Saskatchewan | 3 (100) | 0 (0) | 0 (0) |
Yukon | — | — | — |
Canada | 65 (97.0) | 0 (0) | 2 (3.0) |
“–” = not applicable.
Notes: Survey response data were available for 67 out of 138 sites across all jurisdictions with SPECT capacity.
Data derived from survey question: “How is this facility funded?” The table includes only those facilities that responded to the survey question. In some instances, validator data, CMII data, and data from other publicly available sources supplemented survey responses.
Table 15: Number of SPECT-CT Units and Units per Capita, 2015 to 2022– 2023
Province or territory | 2015 | 2017 | 2019–2020 | 2022–2023 | ||||
|---|---|---|---|---|---|---|---|---|
Units | Units per million population | Units | Units per million population | Units | Units per million population | Units | Units per million population | |
Alberta | 35 | 8.3 | 32 | 7.5 | 38 | 8.6 | 39 | 8.3 |
British Columbia | 27 | 5.8 | 31 | 6.5 | 30 | 5.9 | 50 | 9.2 |
Manitoba | 8 | 6.2 | 8 | 6.0 | 8 | 5.8 | 10 | 6.9 |
New Brunswick | 4 | 5.3 | 5 | 6.6 | 5 | 6.4 | 8 | 9.6 |
Newfoundland and Labrador | 5 | 9.5 | 9 | 17.0 | 9 | 17.2 | 8 | 15 |
Northwest Territories | 0 | — | 0 | — | — | — | — | — |
Nova Scotia | 9 | 9.5 | 10 | 10.5 | 10 | 10.2 | 9 | 8.6 |
Nunavut | 0 | — | 0 | — | — | — | — | — |
Ontario | 38 | 2.8 | 78 | 5.5 | 85 | 5.8 | 92 | 5.9 |
Prince Edward Island | 1 | 6.9 | 2 | 13.4 | 2 | 12.7 | 2 | 11.4 |
Quebec | 77 | 9.3 | 76 | 9.1 | 76 | 8.9 | 107 | 12.1 |
Saskatchewan | 10 | 8.8 | 10 | 8.6 | 8 | 6.8 | 6 | 4.9 |
Yukon | 0 | — | 0 | — | — | — | — | — |
Canada | 214 | 6.0 | 261 | 7.1 | 271 | 7.2 | 331 | 8.3 |
“—” = not applicable.
Notes: Complete unit count data were available for all public SPECT units across all jurisdictions with capacity.
For the 2022–2023 survey, complete unit count data were available for 180 sites with SPECT-CT capacity out of 467 participating sites with advanced imaging capacity (i.e., SPECT-CT, SPECT, CT, MRI, PET-CT, PET-MRI). For 2019–2020, complete unit count data were available for 160 sites with SPECT-CT capacity out of 455 participating sites with advanced imaging capacity. For 2017, complete unit count data were available for 155 sites with SPECT-CT capacity out of 505 participating sites with advanced imaging capacity. For 2015, complete unit count data were available for 91 sites with SPECT-CT capacity out of 392 participating sites with advanced imaging capacity.
Data derived from survey question: “Do you have the following fixed, mobile, or portable units at the site?” Options included: CT, MRI, PET-CT, PET-MRI, SPECT-CT, and SPECT.
Source: CADTH (2015),8 CADTH (2017),9 CADTH (2020),3 CADTH (2024).
Table 16: Volume of SPECT-CT and SPECT Exams and Exams per Thousand People Across Canadian Public Facilities, 2015 to 2022–2023
Province or territory | 2015 | 2017 | 2019 to 2020 | 2022 to 2023 | ||||
|---|---|---|---|---|---|---|---|---|
Exams | Exams per thousand | Exams | Exams per thousand | Exams | Exams per thousand | Exams | Exams per thousand | |
Alberta | 107,325 | 25.6 | 26,130 | 6.1 | 23,732 | 5.4 | 59,099 | 12.6 |
British Columbia | 86,264 | 18.4 | 148,578 | 31.0 | 66,604 | 12.9 | 66,604a | 12.2 |
Manitoba | 22,935 | 17.7 | 22,074 | 16.6 | 29,400 | 21.4 | 22,378 | 15.5 |
New Brunswick | 12,000 | 15.9 | 39,635 | 52.3 | 16,219 | 20.8 | 28,408 | 34.2 |
Newfoundland and Labrador | — | — | 49,835 | 94.3 | 33,095 | 63.4 | 22,910 | 42.9 |
Northwest Territories | — | — | — | — | — | — | — | — |
Nova Scotia | 18,633 | 19.8 | 25,413 | 26.7 | 30,235 | 31 | 12,511 | 11.9 |
Nunavut | — | — | — | — | — | — | — | — |
Ontario | 248,494 | 18.0 | 200,833 | 14.2 | 192,189b | 13.1 | 192,189b | 12.4 |
Prince Edward Island | 2,119 | 14.5 | 2,299 | 15.3 | 2,129 | 13.5 | 1,985 | 11.3 |
Quebec | 939,700 | 113.7 | 786,594 | 94.0 | 783,667 | 91.9 | 496,843 | 56.3 |
Saskatchewan | 47,826 | 42.2 | 52,730 | 45.4 | 33,723 | 28.6 | 26,083 | 21.4 |
Yukon | — | — | — | — | — | — | — | — |
Canada | 1,485,296 | 41.4 | 1,354,121 | 37 | 1,210,993 | 32 | 929,010 | 23.3 |
“—” = not applicable; SPECT = single-photon emission CT; SPECT-CT = single-photon emission CT–CT.
Note: 2022–2023 combined SPECT-CT and SPECT exam volume was reported by validators for 8 of 10 jurisdictions with capacity.
a2019–2020 exam data for British Columbia.
b2017 exam data for Ontario.
Data derived from survey question: ““For all units, how many examinations on average were conducted in the last fiscal/calendar year?”
Source: CADTH (2015),8 CADTH (2017),9 CADTH (2020),3 CADTH (2024).
Table 17: Number of SPECT Units and Units per Capita, 2015 to 2022 to 2023
Province or territory | 2015 | 2017 | 2019–2020 | 2022–2023 | ||||
|---|---|---|---|---|---|---|---|---|
Units | Units per million population | Units | Units per million population | Units | Units per million population | Units | Units per million population | |
Alberta | 30 | 7.2 | 42 | 9.8 | 37 | 8.4 | 36 | 7.7 |
British Columbia | 26 | 5.6 | 28 | 5.9 | 24 | 4.7 | 16 | 2.9 |
Manitoba | 7 | 5.4 | 9 | 6.8 | 6 | 4.4 | 4 | 2.8 |
New Brunswick | 2 | 2.7 | 5 | 6.6 | 11 | 14.2 | 6 | 7.2 |
Newfoundland and Labrador | 4 | 7.6 | 2 | 3.8 | 3 | 5.7 | 1 | 1.9 |
Northwest Territories | 0 | — | 0 | — | 0 | — | 0 | — |
Nova Scotia | 7 | 7.4 | 7 | 7.3 | 7 | 7.2 | 7 | 6.7 |
Nunavut | 0 | — | 0 | — | 0 | — | 0 | — |
Ontario | 99 | 7.2 | 151 | 10.7 | 135 | 9.2 | 102 | 6.6 |
Prince Edward Island | 1 | 6.8 | 0 | 0.0 | 0 | 0 | 0 | 0 |
Quebec | 79 | 9.6 | 77 | 9.2 | 75 | 8.8 | 32 | 3.6 |
Saskatchewan | 9 | 7.9 | 9 | 7.8 | 7 | 5.9 | 6 | 4.9 |
Yukon | 0 | — | 0 | — | 0 | — | 0 | — |
Canada | 264 | 7.4 | 330 | 9.0 | 305 | 8.1 | 210 | 5.3 |
“—” = not applicable.
Notes: Complete unit count data were available for all public SPECT units across all jurisdictions with capacity.
For the 2022–2023 survey, complete unit count data were available for 138 sites with SPECT capacity out of 467 participating sites with advanced imaging capacity (i.e., SPECT-CT, SPECT, CT, MRI, PET-CT, PET-MRI). For 2019–2020, complete unit count data were available for 174 sites with SPECT capacity out of 455 participating sites with advanced imaging capacity. For 2017, complete unit count data were available for 181 sites with SPECT capacity out of 505 participating sites with advanced imaging capacity. For 2015, complete unit count data were available for 130 sites with SPECT capacity out of 392 participating sites with advanced imaging capacity.
Data derived from survey question: “Do you have the following fixed, mobile, or portable units at the site?” Options included: CT, MRI, PET-CT, PET-MRI, SPECT-CT, and SPECT.
Source: CADTH (2015),8 CADTH (2017),9 CADTH (2020),3 CADTH (2024).
Table 18: Summary of Average Hours per Day of SPECT-CT Use by Province and Territory, 2022–2023
Province or territory | Number of reporting sites | Mean hours | Median hours (min to max) |
|---|---|---|---|
Alberta | 19 | 8.89 | 8 (8 to 14) |
British Columbia | 16 | 8.62 | 8 (7 to 11) |
Manitoba | 5 | 8.5 | 8 (8 to 10) |
New Brunswick | 4 | 8.5 | 8.5 (8 to 9) |
Newfoundland and Labrador | 3 | 8.33 | 8 (8 to 9) |
Northwest Territories | — | — | — |
Nova Scotia | 3 | 9.33 | 10 (8 to 10) |
Nunavut | — | — | — |
Ontario | 28 | 8.61 | 8 (7 to 13) |
Prince Edward Island | 1 | 8 | 8 (8 to 8) |
Quebec | 12 | 8.17 | 8 (7 to 12) |
Saskatchewan | 3 | 9.33 | 10 (8 to 10) |
Yukon | — | — | — |
Canada | 94 | 8.63 | 8 (7 to 14) |
“–” = not applicable.
Notes: Survey response data were available for 94 out of 180 sites across all jurisdictions with SPECT-CT capacity.
Data derived from the survey question: “In an average 24-hour day, how many hours are the units staffed through regular scheduled service capacity (do not include hours where staff are only on call)”.
Table 19: Summary of 24-Hour and Weekend Use of SPECT-CT by Province and Territory, 2022–2023
Province or territory | SPECT-CT operates 24-hours a day | SPECT-CT operates on the weekend |
|---|---|---|
Number of sites (percent of responding sites) | ||
Alberta | 0 (0% of 18) | 2 (11.1% of 18) |
British Columbia | 0 (0% of 17) | 2 (11.8% of 17) |
Manitoba | 0 (0% of 5) | 0 (0% of 5) |
New Brunswick | 1 (25% of 4) | 2 (50% of 4) |
Newfoundland and Labrador | 0 (0% of 3) | 0 (0% of 3) |
Northwest Territories | — | — |
Nova Scotia | 0 (0% of 3) | 0 (0% of 3) |
Nunavut | — | — |
Ontario | 0 (0% of 27) | 1 (3.4% of 29) |
Prince Edward Island | 0 (0% of 1) | 0 (0% of 1) |
Quebec | 0 (0% of 12) | 3 (25% of 12) |
Saskatchewan | 0 (0% of 3) | 0 (0% of 3) |
Yukon | — | — |
Canada | 1 (1.1% of 93) | 10 (10.5% of 95) |
“—” = not applicable.
Notes: Survey response data for 24-hours a day operation were available for 93 out of 180 sites across all jurisdictions with SPECT-CT capacity. Survey response data for weekend operation were available for 95 out of 180 sites across all jurisdictions with SPECT-CT capacity.
Data derived from the survey questions: ” Do any units operate 24 hours a day?” and “Do any units operate on the weekend?”
Table 20: Average Hours per Week of SPECT-CT Use by Province and Territory, 2022–2023
Province or territory | Number of reporting sites | Mean hours | Median hours (min to max) |
|---|---|---|---|
Alberta | 19 | 45.58 | 41 (38 to 88) |
British Columbia | 16 | 41.88 | 40 (10 to 66) |
Manitoba | 5 | 42.5 | 40 (40 to 50) |
New Brunswick | 4 | 42.5 | 42.5 (40 to 45) |
Newfoundland and Labrador | 3 | 46.33 | 43 (40 to 56) |
Northwest Territories | — | — | — |
Nova Scotia | 3 | 46.67 | 50 (40 to 50) |
Nunavut | — | — | — |
Ontario | 27 | 41.7 | 40 (10 to 68) |
Prince Edward Island | 1 | 40 | 40 (40 to 40) |
Quebec | 12 | 42.58 | 40 (35 to 60) |
Saskatchewan | 3 | 46.67 | 50 (40 to 50) |
Yukon | — | — | — |
Canada | 93 | 43.2 | 40 (10 to 88) |
“–” = not applicable.
Notes: Survey response data were available for 93 out of 180 sites across all jurisdictions with SPECT-CT capacity.
Data derived from survey question: “In an average 168-hour week, how many hours are the [modality] units staffed through regular scheduled service capacity (do not include hours where staff are only on call)?”
Table 21: Summary of Average Hours per Day of SPECT Use by Province and Territory, 2022–2023
Province or territory | Number of reporting sites | Mean hours | Median hours (min to max) |
|---|---|---|---|
Alberta | 14 | 9.21 | 9 (8 to 14) |
British Columbia | 4 | 8.5 | 8 (8 to 10) |
Manitoba | 3 | 8.5 | 8 (8 to 10) |
New Brunswick | 3 | 8.33 | 8 (8 to 9) |
Newfoundland and Labrador | NR | NR | NR |
Northwest Territories | — | — | — |
Nova Scotia | 3 | 8.67 | 8 (8 to 10) |
Nunavut | — | — | — |
Ontario | 26 | 8.62 | 8 (5 to 14) |
Prince Edward Island | — | — | — |
Quebec | 9 | 7.78 | 8 (7 to 9) |
Saskatchewan | 2 | 8 | 8 (8 to 8) |
Yukon | — | — | — |
Canada | 64 | 8.6 | 8 (5 to 14) |
“–” = not applicable; NR = not reported.
Notes: Survey response data were available for 64 out of 138 sites across 8 of the 9 jurisdictions with SPECT capacity. No data were available for Newfoundland and Labrador.
Data derived from the survey question: “In an average 24-hour day, how many hours are the units staffed through regular scheduled service capacity (do not include hours where staff are only on call)”.
Table 22: Summary of 24-Hour and Weekend Use of SPECT by Province and Territory, 2022–2023
Province or territory | SPECT operates 24-hours a day | SPECT operates on the weekend |
|---|---|---|
Number of sites (percent of responding sites) | ||
Alberta | 0 (0% of 6) | 0 (0% of 6) |
British Columbia | 0 (0% of 7) | 0 (0% of 7) |
Manitoba | 0 (0% of 3) | 0 (0% of 3) |
New Brunswick | 1 (25% of 4) | 2 (50% of 4) |
Newfoundland and Labrador | 0 (0% of 1) | 0 (0% of 1) |
Northwest Territories | — | — |
Nova Scotia | 0 (0% of 3) | 0 (0% of 3) |
Nunavut | — | — |
Ontario | 0 (0% of 28) | 1 (3.6% of 28) |
Prince Edward Island | — | — |
Quebec | 0 (0% of 6) | 0 (0% of 6) |
Saskatchewan | 0 (0% of 2) | 0 (0% of 2) |
Yukon | — | — |
Canada | 1 (1.7% of 60) | 3 (5.0% of 60) |
“—” = not applicable.
Notes: Survey response data for 24-hours a day operation and weekend operation were available for 60 out of 138 sites across all jurisdictions with SPECT capacity.
Data derived from the survey questions: “Do any units operate 24 hours a day?” and “Do any units operate on the weekend?”
Table 23: Average Hours per Week of SPECT Use by Province and Territory, 2022–2023
Province or territory | Number of reporting sites | Mean hours | Median hours (min to max) |
|---|---|---|---|
Alberta | 14 | 47 | 43.5 (38 to 88) |
British Columbia | 4 | 34.5 | 40 (8 to 50) |
Manitoba | 3 | 42.5 | 40 (40 to 50) |
New Brunswick | 3 | 41 | 40 (38 to 45) |
Newfoundland and Labrador | NR | NR | NR |
Northwest Territories | — | — | — |
Nova Scotia | 3 | 42 | 38 (38 to 50) |
Nunavut | — | — | — |
Ontario | 26 | 40.38 | 40 (10 to 68) |
Prince Edward Island | — | — | — |
Quebec | 9 | 40.11 | 40 (35 to 56) |
Saskatchewan | 2 | 40 | 40 (40 to 40) |
Yukon | — | — | — |
Canada | 64 | 41.6 | 40 (8 to 88) |
“–” = not applicable; NR = not reported.
Notes: Survey response data were available for 64 out of 138 sites across 8 of the 9 jurisdictions with SPECT capacity. No data were available for Newfoundland and Labrador.
Data derived from survey question: “In an average 168-hour week, how many hours are the [modality] units staffed through regular scheduled service capacity (do not include hours where staff are only on call)?”
Table 24: Planned and Unplanned Downtime at Sites With SPECT-CT Units, 2022–2023
Province or territory | Annual planned downtime | Annual unplanned downtime | ||
|---|---|---|---|---|
Number of reporting sites | Mean hours (min to max) | Number of reporting sites | Mean hours (min to max) | |
Alberta | 18 | 55.3 (18 to 96) | 18 | 31.4 (10 to 85) |
British Columbia | 15 | 40.5 (8 to 112) | 12 | 182.2 (10 to 534) |
Manitoba | NR | NR | NR | NR |
New Brunswick | 4 | 21 (15 to 30) | 3 | 26.7 (20 to 30) |
Newfoundland and Labrador | 2 | 24 (16 to 32) | 2 | 43 (30 to 56) |
Northwest Territories | — | — | — | — |
Nova Scotia | 2 | 23 (16 to 30) | 2 | 22.5 (15 to 30) |
Nunavut | — | — | — | — |
Ontario | 22 | 24.1 (10 to 80) | 17 | 52.6 (7 to 300) |
Prince Edward Island | 1 | 8 (8 to 8) | 1 | 80 (80 to 80) |
Quebec | 12 | 19.3 (7 to 35) | 9 | 32.6 (7 to 100) |
Saskatchewan | 3 | 45.3 (24 to 64) | 3 | 162.7 (8 to 350) |
Yukon | — | — | — | — |
Canada | 79 | 34 (7 to 112) | 67 | 70.4 (7 to 534) |
“–” = not applicable; NR = not reported.
Notes: Survey response data for planned downtime were available for 79 out of 180 sites across 9 of the 10 jurisdictions with SPECT-CT capacity. No data were available for Manitoba. Survey response data for unplanned downtime were available for 67 out of 180 sites across 9 of the 10 jurisdictions with SPECT-CT capacity. No data were available for Manitoba.
Data derived from the survey question: “How much planned downtime is anticipated for scheduled maintenance for all units in a given year? (expressed in hours)” and “How much unplanned downtime is experienced for all units in a given year? (expressed in hours).”
Table 25: Planned and Unplanned Downtime at Sites With SPECT Units, 2022–2023
Province or territory | Annual planned downtime | Annual unplanned downtime | ||
|---|---|---|---|---|
Number of reporting sites | Mean hours (min to max) | Number of reporting sites | Mean hours (min to max) | |
Alberta | 6 | 25.3 (16 to 48) | 6 | 31.5 (16 to 55) |
British Columbia | 6 | 39.3 (8 to 108) | 6 | 198.7 (16 to 1,000) |
Manitoba | NR | NR | NR | NR |
New Brunswick | 4 | 17.2 (8 to 30) | 3 | 17 (1 to 30) |
Newfoundland and Labrador | NR | NR | NR | NR |
Northwest Territories | — | — | — | — |
Nova Scotia | 2 | 20 (16 to 24) | 2 | 175 (100 to 250) |
Nunavut | — | — | — | — |
Ontario | 21 | 25.4 (8 to 80) | 18 | 49 (2 to 300) |
Prince Edward Island | — | — | — | — |
Quebec | 9 | 19.1 (7 to 42) | 7 | 99.9 (7 to 600) |
Saskatchewan | 2 | 60 (24 to 96) | 2 | 139 (8 to 270) |
Yukon | — | — | — | — |
Canada | 50 | 26.4 (7 to 108) | 44 | 82.8 (1 to 1,000) |
“–” = not applicable; NR = not reported.
Notes: Survey response data for planned downtime were available for 50 out of 138 sites across 7 of the 9 jurisdictions with SPECT capacity. No data were available for Manitoba and Newfoundland and Labrador. Survey response data for unplanned downtime were available for 44 out of 138 sites across 7 of the 9 jurisdictions with SPECT capacity. No data were available for Manitoba and Newfoundland and Labrador.
Data derived from the survey question: “How much planned downtime is anticipated for scheduled maintenance for all units in a given year? (expressed in hours)” and “How much unplanned downtime is experienced for all units in a given year? (expressed in hours).”
Table 26: Average Age of SPECT-CT and SPECT Imaging Equipment, 2022–2023
Province or territory | Number of SPECT-CT units | Average age SPECT-CT (years, min to max) | Number of SPECT units | Average age SPECT (years, min to max) |
|---|---|---|---|---|
Alberta | 34 | 9.2 (1 to 17) | 11 | 17.1 (9 to 22) |
British Columbia | 32 | 9.3 (0 to 19) | 8 | 18.2 (11 to 22) |
Manitoba | 10 | 10 (2 to 17) | 4 | 14.8 (8 to 19) |
New Brunswick | 6 | 9 (1 to 18) | 5 | 9 (2 to 19) |
Newfoundland and Labrador | 6 | 8.2 (2 to 17) | NR | NR |
Northwest Territories | — | — | — | — |
Nova Scotia | 8 | 9.8 (6 to 13) | 7 | 15.1 (6 to 20) |
Nunavut | — | — | — | — |
Ontario | 48 | 10.4 (0 to 18) | 40 | 12.9 (0 to 24) |
Prince Edward Island | 2 | 9.5 (6 to 13) | — | — |
Quebec | 33 | 8.3 (0 to 16) | 11 | 16.2 (8 to 26) |
Saskatchewan | 6 | 13.3 (7 to 18) | 4 | 15.8 (15 to 17) |
Yukon | — | — | — | — |
Canada | 185 | 9.5 (0 to 19) | 90 | 14.5 (0 to 26) |
“–” = not applicable; NR = not reported.
Notes: Survey response data were available for 185 out of 331 SPECT-CT units across all jurisdictions with capacity. Survey response data were available for 90 out of 210 SPECT units in 8 of the 9 jurisdictions with capacity. No data were available for Newfoundland and Labrador.
Age for each unit was calculated from the survey question: “What year did (or will) the [modality] unit become operational?” subtracted from 2023.
Table 27: Age of SPECT-CT Units in Years, 2022–2023
Province or territory | Years | |||||||
|---|---|---|---|---|---|---|---|---|
5 or less | 6 to 10 | 11 to 15 | 16 to 20 | Greater than 20 | ||||
Number of units (% of age categories) | ||||||||
Alberta | 10 (29.4) | 6 (17.6) | 16 (47.1) | 2 (5.9) | 0 (0) | |||
British Columbia | 8 (25) | 10 (31.2) | 6 (18.8) | 8 (25) | 0 (0) | |||
Manitoba | 2 (20) | 2 (20) | 5 (50) | 1(10) | 0 (0) | |||
New Brunswick | 1 (16.7) | 2 (33.3) | 2 (33.3) | 1 (16.7) | 0 (0) | |||
Newfoundland and Labrador | 1 (16.7) | 4 (66.7) | 0 (0) | 1 (16.7) | 0 (0) | |||
Northwest Territories | — | — | — | — | — | |||
Nova Scotia | 0 (0) | 5 (62.5) | 3 (37.5) | 0 (0) | 0 (0) | |||
Nunavut | — | — | — | — | — | |||
Ontario | 5 (10.4) | 20 (41.7) | 13 (27.1) | 10 (20.8) | 0 (0) | |||
Prince Edward Island | 0 (0) | 1 (50) | 1 (50) | 0 (0) | 0 (0) | |||
Quebec | 8 (24.2) | 14 (42.4) | 10 (30.3) | 1 (3) | 0 (0) | |||
Saskatchewan | 0 (0) | 2 (33.3) | 2 (33.3) | 2 (33.3) | 0 (0) | |||
Yukon | — | — | — | — | — | |||
Canada | 35 (18.9) | 66 (35.7) | 58 (31.4) | 26 (14.1) | 0 (0) | |||
“–” = not applicable.
Notes: Survey response data were available for 185 of 331 SPECT-CT units across all jurisdictions with capacity.
Age for each unit was calculated from the survey question: “What year did (or will) the [modality] unit become operational?” subtracted from 2023.
Table 28: Age of SPECT Units in Years, 2022–2023
Province or territory | Years | ||||
|---|---|---|---|---|---|
5 or less | 6 to 10 | 11 to 15 | 16 to 20 | Greater than 20 | |
Number of units (% of age categories) | |||||
Alberta | 0 (0) | 1 (9.1) | 0 (0) | 9 (81.8) | 1 (9.1) |
British Columbia | 0 (0) | 0 (0) | 1 (12.5) | 6 (75) | 1 (12.5) |
Manitoba | 0 (0) | 1 (25) | 1 (25) | 2 (50) | 0 (0) |
New Brunswick | 2 (40) | 0 (0) | 2 (40) | 1 (20) | 0 (0) |
Newfoundland and Labrador | NR | NR | NR | NR | NR |
Northwest Territories | — | — | — | — | — |
Nova Scotia | 0 (0) | 2 (28.6) | 1 (14.3) | 4 (57.1) | 0 (0) |
Nunavut | — | — | — | — | — |
Ontario | 6 (15) | 11 (27.5) | 7 (17.5) | 8 (20) | 8 (20) |
Prince Edward Island | — | — | — | — | — |
Quebec | 0 (0) | 2 (18.2) | 4 (36.4) | 1 (9.1) | 4 (36.4) |
Saskatchewan | 0 (0) | 0 (0) | 2 (50) | 2 (50) | 0 (0) |
Yukon | — | — | — | — | — |
Canada | 8 (8.9) | 17 (18.9) | 18 (20) | 33 (36.7) | 14 (15.6) |
“–” = not applicable; NR = not reported.
Notes: Survey response data were available for 90 of 210 SPECT units across 8 of the 9 jurisdictions with capacity. No data were available for Newfoundland and Labrador.
Age for each unit was calculated from the survey question: “What year did (or will) the [modality] unit become operational?” subtracted from 2023.
Table 29: Summary of Type of Use by Clinical Specialty for SPECT-CT, 2022–2023
Use category | Average percent | Median percent (min to max) |
|---|---|---|
Oncology | 26.6 | 30 (0 to 65) |
Cardiac | 23.7 | 22.5 (0 to 100) |
Musculoskeletal | 23.1 | 10 (0 to 100) |
Inflammatory | 7.8 | 5 (0 to 75) |
Respiratory | 6.3 | 5 (0 to 30) |
Hepatobiliary | 4.6 | 5 (0 to 20) |
Neurologic | 2.1 | 0 (0 to 16) |
Trauma | 0.8 | 0 (0 to 21.74) |
Other | 5 | 0 (0 to 100) |
Notes: Survey response data on the average percentage of SPECT-CT use by discipline were available for 44 out of 180 sites across all 10 jurisdictions with SPECT-CT capacity.
Data derived from survey question: “On average, what percentage of these exams fall into the following categories? The total percentage, expressed as a number, must add up to 100.” The following categories were asked: oncology, respiratory disease, hepatobiliary or gastrointestinal, musculoskeletal disorders, inflammatory or infectious diseases, cardiac, neurologic disorders, trauma, and other use.
Table 30: Summary of Type of Use by Medical Category for SPECT-CT Units, 2022–2023
Use category | Average percent | Median percent (min to max) |
|---|---|---|
Diagnostic non-cardiac | 73.0 | 77.5 (0 to 100) |
Diagnostic cardiac | 27.3 | 22.5 (0 to 100) |
Research | 0.3 | 0 (0 to 10) |
Interventional | 0.2 | 0 (0 to 10) |
Other | 0.0 | 0 (0 to 0) |
Notes: Survey response data on the average percentage of SPECT-CT use were available for 78 out of 180 sites across 9 of the 10 jurisdictions with SPECT-CT capacity. No data were available for Manitoba.
Data derived from survey question: “Based on your experience in the last fiscal year, what is the average percentage of overall time SPECT-CT units are used for?” The following categories were asked: cardiac, noncardiac, research, interventional, and other use.
Table 31: Summary of Type of Use by Clinical Specialty for SPECT, 2022–2023
Use category | Average percent | Median percent (min to max) |
|---|---|---|
Cardiac | 32.1 | 20 (0 to 100) |
Oncology | 26.1 | 20 (0 to 80) |
Musculoskeletal | 13.4 | 10 (0 to 55) |
Respiratory | 10.1 | 5 (0 to 100) |
Hepatobiliary | 6.5 | 5 (0 to 31) |
Inflammatory | 5.1 | 5 (0 to 20) |
Neurologic | 1.8 | 0 (0 to 15) |
Trauma | 0.7 | 0 (0 to 5) |
Other | 4.3 | 0 (0 to 100) |
Notes: Survey response data on the average percentage of SPECT use by discipline were available for 31 out of 138 sites across 6 of the 9 jurisdictions with SPECT capacity. No data were available for Alberta, Manitoba, and Newfoundland and Labrador.
Data derived from survey question: “On average, what percentage of these exams fall into the following categories? The total percentage, expressed as a number, must add up to 100.” The following categories were asked: oncology, respiratory disease, hepatobiliary or gastrointestinal, musculoskeletal disorders, inflammatory or infectious diseases, cardiac, neurologic disorders, trauma, and other use.
Table 32: Summary of Type of Use by Medical Category for SPECT Units, 2022–2023
Use category | Average percent | Median percent (min to max) |
|---|---|---|
Diagnostic non-cardiac | 71.2 | 82.3 (0 to 100) |
Diagnostic cardiac | 27.8 | 13.5 (0 to 100) |
Interventional | 0 | 0 (0 to 0) |
Research | 0 | 0 (0 to 1) |
Other | 0 | 0 (0 to 0) |
Notes: Survey response data on the average percentage of SPECT use were available for 60 out of 138 sites across 7 of the 9 jurisdictions with SPECT capacity. No data were available for Manitoba and Newfoundland and Labrador.
Data derived from survey question: “Based on your experience in the last fiscal year, what is the average percentage of overall time SPECT units are used for?” The following categories were asked: cardiac, noncardiac, research, interventional, and other use.
Table 33: Summary of Use of AI in SPECT-CT, 2022–2023
Use of AI in SPECT-CT | Number of responses | Number of sites – yes (%) | Used in clinical/research/both | Provinces (number of sites) |
|---|---|---|---|---|
Lowering radiation dose | 76 | 4 (5.3) | 3/0/1 | BC (1), ON (2), QC (1) |
Reading and interpreting images | 88 | 1 (1.1) | 1/0/0 | ON (1) |
Image reconstruction | 78 | 13 (16.7) | 8/0/0 | BC (1), NB (1), NS (1), ON (8), QC (2) |
Treatment planning | 79 | 3 (3.8) | 2/0/0 | NB (1), ON (1), QC (1) |
Predicting outcomes | 79 | 0 (0) | 0 (0) | 0 (0) |
Administrative tasks | 81 | 2 (2.5) | 1/0/0 | ON (1), QC (1) |
AI = artificial intelligence; BC = British Columbia; NB = New Brunswick; NS = Nova Scotia; ON = Ontario; QC = Quebec.
Notes: Number of sites out of 180 sites with SPECT-CT capacity that provided survey response data are indicated in the “Number of responses” column.
Data derived from the survey questions: “Is artificial intelligence used to support: The reading/interpretation of images? Predicting outcomes? Lower radiation dose? Image resolution/reconstruction enhancement? Treatment planning? Administrative tasks?”
Table 34: Summary of Use of AI in SPECT, 2022–2023
Use of AI in SPECT | Number of responses | Number of sites – yes (%) | Used in clinical/research/botha | Provinces (number of sites) |
|---|---|---|---|---|
Lowering radiation dose | 47 | 1 (2.1) | 2/0/0 | QC (1) |
Reading and interpreting images | 56 | 2 (3.6) | 2/0/0 | ON (2) |
Image reconstruction | 46 | 8 (17.4) | 3/0/0 | NB (1), ON (7) |
Treatment planning | 50 | 1 (2) | NR | ON (1) |
Predicting outcomes | 50 | 1 (2) | 2/0/0 | ON (1) |
Administrative tasks | 51 | 4 (7.8) | NR | ON (4) |
AI = artificial intelligence; NB = New Brunswick; NR = no response; ON = Ontario; QC = Quebec.
Notes: Number of sites out of 138 sites with SPECT capacity that provided survey response data are indicated in the “Number of Responses” column.
Data derived from the survey questions: “Is artificial intelligence used to support: The reading/interpretation of images? Predicting outcomes? Lower radiation dose? Image resolution/reconstruction enhancement? Treatment planning? Administrative tasks?”
aThe “Used in clinical/research” column includes sites that did not select “yes” for the use of AI, but provided responses for the setting of use (clinical/research).
Table 35: Types of Health Care Professionals That Have SPECT-CT and SPECT Exam-Ordering Privileges, 2022–2023
Province or territory | Clinical specialists | Family physicians/general practitioners | Nurse practitioners |
|---|---|---|---|
Alberta | Yes, all | Yes | Yes |
Other: chiropractor, podiatrist | |||
British Columbia | Yes, all | Yes | Yes |
Other: chiropractor, dentist, podiatric surgeon | |||
Manitoba | Yes | Yes | Yes |
New Brunswicka | Yes, all | NR | NR |
Newfoundland and Labrador | Yes, all | All with exception of myocardial perfusion studies which requires consult from cardiology or internal medicine | |
Northwest Territories | SPECT are referred to a southern facility. No unit available in the Northwest Territories. | Yes | Uncertain; may need physician co-signature |
Nova Scotia | Yes | Yes | Yes |
Nunavut | NR | Yes | Yes |
Ontario | NR | Yes | Yes |
Prince Edward Island | Yes, all | Yes | Yes |
Quebec | Yes, all | Under certain conditions | Under certain conditions |
Saskatchewan | Yes, all | Yes | Yes |
Yukon | NR | NR | NR |
NR = not reported.
Notes: Survey response data were available from 12 out of 13 jurisdictions. No data were available for the Yukon.
Data derived from the question: “Which health care professionals can order imaging exams for SPECT-CT/SPECT?”
aFor New Brunswick, the responses came from one of the two regional health authorities, the Horizon Health Network.
Table 36: Exam-Ordering Practice at Sites With SPECT-CT Units, 2022–2023
Province or territory | Automated entry | Paper forms | Requests by fax | Requests by telephone | Central booking | ||||||
|---|---|---|---|---|---|---|---|---|---|---|---|
Yes | No | Yes | No | Yes | No | Yes | No | All exams | Some exams | Not used | |
Number (%) of sites that use these exam-ordering practices | |||||||||||
Alberta | 6 (33.3) | 12 (66.7) | 18 (100) | 0 (0) | 18 (100) | 0 (0) | 10 (55.6) | 8 (44.4) | 5 (27.8) | 0 (0) | 13 (72.2) |
British Columbia | 2 (11.1) | 16 (88.9) | 17 (94.4) | 1 (5.6) | 18 (100) | 0 (0) | 1 (5.9) | 16 (94.1) | 7 (38.9) | 2 (11.1) | 9 (50) |
Manitoba | 1(20) | 4 (80) | 0 (0) | 5 (100) | 5 (100) | 0 (0) | 0 (0) | 5 (100) | 0 (0) | 0 (0) | 5 (100) |
New Brunswick | 0 (0) | 3 (100) | 4 (100) | 0 (0) | 4 (100) | 0 (0) | 2 (50) | 2 (50) | 3 (75) | 0 (0) | 1 (25) |
Newfoundland and Labrador | 1 (33.3) | 2 (66.7) | 3 (100) | 0 (0) | 3 (100) | 0 (0) | 0 (0) | 3 (100) | 2 (66.7) | 1 (33.3) | 0 (0) |
Northwest Territories | — | — | — | — | — | — | — | — | — | — | — |
Nova Scotia | 0 (0) | 3 (100) | 3 (100) | 0 (0) | 3 (100) | 0 (0) | 0 (0) | 3 (100) | 2 (66.7) | 1 (33.3) | 0 (0) |
Nunavut | — | — | — | — | — | — | — | — | — | — | — |
Ontario | 20 (71.4) | 8 (28.6) | 28 (96.6) | 1 (3.4) | 27 (93.1) | 2 (6.9) | 5 (17.9) | 23 (82.1) | 15 (53.6) | 7 (25) | 6 (21.4) |
Prince Edward Island | 1 (100) | 0 (0) | 1 (100) | 0 (0) | 1 (100) | 0 (0) | 0 (0) | 1 (100) | 1 (100) | 0 (0) | 0 (0) |
Quebec | 4 (33.3) | 8 (66.7) | 11 (91.7) | 1 (8.3) | 11 (91.7) | 1 (8.3) | 3 (25) | 9 (75) | 2 (16.7) | 1 (8.3) | 9 (75) |
Saskatchewan | 0 (0) | 3 (100) | 3 (100) | 0 (0) | 3 (100) | 0 (0) | 1 (33.3) | 2 (66.7) | 2 (66.7) | 1 (33.3) | 0 (0) |
Yukon | — | — | — | — | — | — | — | — | — | — | — |
Canada | 35 (37.2) | 59 (62.8) | 88 (91.7) | 8 (8.3) | 93 (96.9) | 3 (3.1) | 22 (23.4) | 72 (76.6) | 39 (41.1) | 13 (13.7) | 43 (45.3) |
“–” = not applicable.
Notes: Survey response data are available for 96 out of 180 sites across all jurisdictions with SPECT-CT capacity.
Data derived from the survey question: “Are automated order entry forms (exams request) used?”; “Are paper forms (exams requests) used?”; “Are requests received by fax?”; “Are requests received by phone?”; and “Is a centralized order entry (booking) system used? For all exams: Yes/no; For some exams: yes/no.”
Table 37: Exam-Ordering Practice at Sites With SPECT Units, 2022–2023
Province or territory | Automated entry | Paper forms | Requests by fax | Requests by telephone | Central booking | ||||||
|---|---|---|---|---|---|---|---|---|---|---|---|
Yes | No | Yes | No | Yes | No | Yes | No | All exams | Some exams | Not used | |
Number (%) of sites that use these exam-ordering practices | |||||||||||
Alberta | 0 (0) | 2 (100) | 2 (100) | 0 (0) | 2 (100) | 0 (0) | 0 (0) | 2 (100) | 0 (0) | 1 (50) | 1 (50) |
British Columbia | 2 (28.6) | 5 (71.4) | 5 (83.3) | 1 (16.7) | 7 (100) | 0 (0) | 0 (0) | 6 (100) | 4 (57.1) | 2 (28.6) | 1 (14.3) |
Manitoba | 1 (33.3) | 2 (66.6) | 0 (0) | 3 (100) | 3 (100) | 0 (0) | 0 (0) | 3 (100) | 0 (0) | 0 (0) | 3 (100) |
New Brunswick | 0 (0) | 3 (100) | 4 (100) | 0 (0) | 4 (100) | 0 (0) | 2 (50) | 2 (50) | 3 (75) | 0 (0) | 1 (25) |
Newfoundland and Labrador | 0 (0) | 1 (100) | 1 (100) | 0 (0) | 1 (100) | 0 (0) | 0 (0) | 1 (100) | 0 (0) | 0 (0) | 0 (0) |
Northwest Territories | — | — | — | — | — | — | — | — | — | — | — |
Nova Scotia | 0 (0) | 3 (100) | 3 (100) | 0 (0) | 3 (100) | 0 (0) | 1 (33.3) | 2 (66.7) | 1 (33.3) | 0 (0) | 2 (66.7) |
Nunavut | — | — | — | — | — | — | — | — | — | — | — |
Ontario | 21 (77.8) | 6 (22.2) | 27 (96.4) | 1 (3.6) | 26 (92.9) | 2 (7.1) | 7 (26.9) | 19 (73.1) | 17 (63) | 5 (18.5) | 5 (18.5) |
Prince Edward Island | — | — | — | — | — | — | — | — | — | — | — |
Quebec | 1 (16.7) | 5 (83.3) | 6 (100) | 0 (0) | 5 (83.3) | 1 (16.7) | 3 (50) | 3 (50) | 1 (16.7) | 2 (33.3) | 3 (50) |
Saskatchewan | 0 (0) | 2 (100) | 2 (100) | 0 (0) | 2 (100) | 0 (0) | 1 (50) | 1 (50) | 0 (0) | 2 (100) | 0 (0) |
Yukon | — | — | — | — | — | — | — | — | — | — | — |
Canada | 25 (46.3) | 29 (53.7) | 50 (90.9) | 5 (9.1) | 53 (94.6) | 3 (5.4) | 14 (26.4) | 39 (73.6) | 26 (48.1) | 12 (22.2) | 16 (29.6) |
“–” = not applicable.
Notes: Survey response data are available for 56 out of 138 sites across all jurisdictions with SPECT capacity.
Data derived from the survey question: “Are automated order entry forms (exams request) used?”; “Are paper forms (exams requests) used?”; “Are requests received by fax?”; “Are requests received by phone?”; and “Is a centralized order entry (booking) system used? For all exams: Yes/no; For some exams: yes/no.”
Table 38: Trends in Reported Slices for SPECT-CT Units, 2012 to 2022–2023
Slices | 2012 | 2015 | 2017 | 2019–2020 | 2022–2023a |
|---|---|---|---|---|---|
Number of units (% of total responses per survey year) | |||||
1 | 20 (21.3) | 22 (18.2) | 28 (20.6) | 21 (13.5) | 9 (5.8) |
2 | 12 (12.8) | 16 (13.2) | 16 (11.8) | 18 (11.5) | 15 (9.6) |
4 | 43 (45.7) | 46 (38) | 43 (31.6) | 43 (27.6) | 29 (18.6) |
6 | 9 (9.6) | 12 (9.9) | 17 (12.5) | 17 (10.9) | 17 (10.9) |
8 | 3 (3.2) | 5 (4.1) | 5 (3.7) | 10 (6.4) | 22 (14.1) |
16 | 6 (6.4) | 19 (15.7) | 26 (19.1) | 43 (27.6) | 51 (32.7) |
32 | 0 (0) | 0 (0) | 0 (0) | 4 (2.6) | 7 (4.5) |
40 | 0 (0) | 0 (0) | 1 (0.7) | 0 (0) | 0 (0) |
64 | 1 (1.1) | 1 (0.8) | 0 (0) | 0 (0) | 3 (1.9) |
128 | 0 (0) | 0 (0) | 0 (0) | 0 (0) | 0 (0) |
256 | 0 (0) | 0 (0) | 0 (0) | 0 (0) | 1 (0.6) |
Notes: 2022 to 2023 survey response data for specific slice count were available for 154 out of 331 SPECT-CT units across all 10 jurisdictions with capacity.
Data derived from the survey question: “How many multi-detectors does the CT unit have (how many slices)?”
a2 units (1.3%) were reported in 2022 to 2023 to use a slice configuration not otherwise specified.
Table 39: Availability and Use of Technologies for Control of Radiation Exposure for SPECT-CT, 2015 to 2022–2023
Response | 2015 n (%) | 2017 n (%) | 2019–2020 n (%) | 2022–2023 n (%) |
|---|---|---|---|---|
Does the SPECT-CT unit have dose-management controls? | ||||
Yes | 24 (16.1) | 58 (20.5) | 84 (30.5) | 97 (29.3) |
No | 6 (4) | 34 (12) | 42 (15.3) | 30 (9.1) |
Don't know | 0 (0) | 11 (3.9) | 22 (8) | 23 (6.9) |
Missing | 119 (79.9) | 180 (63.6) | 127 (46.2) | 181 (54.7) |
If yes, are the dose-management controls used? | ||||
Yes | NA | 39 (13.8) | 75 (27.3) | NA |
No | NA | 7 (2.5) | 7 (2.5) | NA |
Don't know | NA | 1 (0.4) | 2 (0.7) | NA |
Missing | NA | 236 (83.4) | 191 (69.5) | NA |
Does the SPECT-CT unit incorporate image reconstruction techniques for dose reduction? | ||||
Yes | 22 (14.8) | 44 (15.5) | 82 (29.8) | NA |
No | 8 (5.4) | 35 (12.4) | 31 (11.3) | NA |
Don't know | 0 (0) | 13 (4.6) | 27 (9.8) | NA |
Missing | 119 (79.9) | 191 (67.5) | 135 (49.1) | NA |
Does the SPECT-CT unit record patient radiation dose by exam (e.g., as a save screen on PACS)? | ||||
Yes | 22 (14.8) | 58 (20.5) | 90 (32.7) | 142 (42.9) |
No | 8 (5.4) | 37 (13.1) | 33 (12) | 34 (10.3) |
Don't know | 0 (0) | 8 (2.8) | 23 (8.4) | 17 (5.1) |
Missing | 119 (79.9) | 180 (63.6) | 129 (46.9) | 138 (41.7) |
PACS = picture archiving and communication system.
Notes: NA = not applicable; question not asked during survey time point.
2022 to 2023 survey response data available for 331 SPECT-CT units across all 10 jurisdictions with SPECT-CT capacity.
Data derived from survey question: “Does the SPECT-CT unit have dose management controls?”, “Does the modality make regularly use of dose management controls?”; “Does the SPECT-CT unit incorporate image reconstruction techniques for dose reduction?”; “Does the SPECT-CT unit record patient SPECT-CT radiation dose (e.g., as a save screen on PACS)?”; “Do you capture patient cumulative radiation dose tracking?”; and “If no, do you plan to capture patient cumulative radiation tracking in the future?.” A definition for PACS is provided in Appendix 2.
Table 40: Population Estimates and Projections, 2007–2040
Province or territory | 2007 | 2015 | 2017 | 2020 | 2023 | 2025 (low- to high-growth projections) | 2030 (low- to high-growth projections) | 2035 (low- to high-growth projections) | 2040 (low- to high-growth projections) |
|---|---|---|---|---|---|---|---|---|---|
Alberta | 3,533,414 | 4,163,048 | 4,253,530 | 4,412,013 | 4,591,100 | 4,761,500 (4,696,600 to 4,816,400) | 5,254,600 (5,040,300 to 5,411,900) | 5,739,800 (5,356,300 to 6,033,800) | 6,212,900 (5,654,900 to 6,714,200) |
British Columbia | 4,312,048 | 4,795,547 | 4,962,706 | 5,173,896 | 5,451,700 | 5,642,800 (5,541,600 to 5,729,700) | 6,027,500 (5,752,300 to 6,238,900) | 6,306,700 (5,855,000 to 6,653,900) | 6,541,200 (5,917,400 to 7,085,800) |
Manitoba | 1,191,684 | 1,298,120 | 1,340,426 | 1,381,809 | 1,414,400 | 1,445,300 (1,422,700 to 1,467,000) | 1,527,900 (1,460,300 to 1,582,600) | 1,611,300 (1,493,300 to 1,711,800) | 1,686,700 (1,520,100 to 1,852,900) |
New Brunswick | 746,136 | 759,971 | 768,029 | 783,814 | 804,300 | 816,400 (808,200 to 822,800) | 837,700 (813,900 to 853,700) | 848,700 (808,100 to 877,500) | 854,700 (798,100 to 902,100) |
Newfoundland and Labrador | 510,256 | 528,843 | 530,153 | 526,046 | 519,500 | 517,500 (512,500 to 522,000) | 510,100 (496,900 to 521,200) | 499,300 (477,700 to 517,200) | 486,300 (456,900 to 512,600) |
Northwest Territories | 43,286 | 44,443 | 44,825 | 44,395 | 46,300 | 47,100 (46,500 to 47,600) | 48,600 (46,900 to 49,900) | 49,500 (46,600 to 51,800) | 50,100 (46,100 to 54,000) |
Nova Scotia | 935,433 | 938,914 | 956,074 | 989,154 | 1,023,500 | 1,046,100 (1,032,900 to 1,058,600) | 1,079,200 (1,043,800 to 1,109,400) | 1,091,800 (1,033,100 to 1,142,000) | 1,097,600 (1,016,900 to 1,175,100) |
Nunavut | 31,560 | 36,602 | 37,829 | 39,581 | 40,200 | 41,000 (40,700 to 41,300) | 43,000 (42,100 to 43,700) | 45,300 (43,600 to 46,500) | 47,700 (45,200 to 49,700) |
Ontario | 12,807,497 | 13,759,762 | 14,610,084 | 14,757,582 | 15,372,100 | 15,837,800 (15,573,200 to 16,067,500) | 16,883,800 (16,134,300 to 17,446,900) | 17,807,200 (16,534,000 to 18,795,500) | 18,615,400 (16,830,000 to 20,232,300) |
Prince Edward Island | 138,020 | 144,949 | 150,595 | 159,179 | 171,800 | 177,400 (174,300 to 179,900) | 187,700 (179,200 to 193,600) | 196,600 (182,200 to 207,200) | 204,400 (184,400 to 222,000) |
Quebec | 7,712,616 | 8,190,074 | 8,326,075 | 8,551,865 | 8,746,600 | 8,859,200 (8,757,800 to 8,953,600) | 9,080,500 (8,802,700 to 9,298,900) | 9,256,500 (8,788,300 to 9,621,900) | 9,396,500 (8,739,100 to 9,970,200) |
Saskatchewan | 1,007,305 | 1,125,588 | 1,151,044 | 1,165,963 | 1,199,500 | 1,226,100 (1,208,100 to 1,239,500) | 1,311,100 (1,251,800 to 1,349,100) | 1,398,300 (1,292,400 to 1,472,700) | 1,479,800 (1,327,800 to 1,608,600) |
Yukon | 32,663 | 37,730 | 39,705 | 42,109 | 45,000 | 46,500 (45,900 to 47,000) | 48,900 (47,600 to 50,200) | 50,100 (47,500 to 52,300) | 50,900 (47,200 to 54,300) |
Canada | 33,001,918 | 35,823,491 | 36,722,075 | 38,027,406 | 39,426,000 | 40,647,000 (39,861,100 to 40,992,800) | 42,840,800 (41,111,900 to 44,150,000) | 44,901,100 (41,958,100 to 47,184,200) | 46,724,200 (42,584,000 to 50,433,700) |
Note: Data retrieved from Statistics Canada website.21
Table 41: Reported and Projected Numbers of SPECT-CT Units by Province and Territory, 2007–2040
Province or territory | 2007 | 2015 | 2017 | 2020 | 2023 | 2025 (low- to high-growth projections) | 2030 (low- to high-growth projections) | 2035 (low- to high-growth projections) | 2040 (low- to high-growth projections) |
|---|---|---|---|---|---|---|---|---|---|
Alberta | 0 | 35 | 32 | 38 | 39 | 40.4 (39.9 to 40.9) | 44.6 (42.8 to 46.0) | 48.8 (45.5 to 51.3) | 52.8 (48.0 to 57.0) |
British Columbia | 3 | 27 | 35 | 30 | 50 | 51.8 (50.8 to 52.5) | 55.3 (52.8 to 57.2) | 57.8 (53.7 to 61.0) | 60.0 (54.3 to 65.0) |
Manitoba | 0 | 8 | 9 | 8 | 10 | 10.2 (10.1 to 10.4) | 10.8 (10.3 to 11.2) | 11.4 (10.6 to 12.1) | 11.9 (10.7 to 13.1) |
New Brunswick | 1 | 4 | 5 | 5 | 8 | 8.1 (8.0 to 8.2) | 8.3 (8.1 to 8.5) | 8.4 (8.0 to 8.7) | 8.5 (7.9 to 9.0) |
Newfoundland and Labrador | 0 | 5 | 9 | 9 | 8 | 8.0 (7.9 to 8.0) | 7.9 (7.7 to 8.0) | 7.7 (7.4 to 8.0) | 7.5 (7.0 to 7.9) |
Northwest Territories | 0 | 0 | 0 | 0 | 0 | 0 (0 to 0) | 0 (0 to 0) | 0 (0 to 0) | 0 (0 to 0) |
Nova Scotia | 0 | 9 | 10 | 10 | 9 | 9.2 (9.1 to 9.3) | 9.5 (9.2 to 9.8) | 9.6 (9.1 to 10.0) | 9.7 (8.9 to 10.3) |
Nunavut | 0 | 0 | 0 | 0 | 0 | 0 (0 to 0) | 0 (0 to 0) | 0 (0 to 0) | 0 (0 to 0) |
Ontario | 19 | 38 | 78 | 85 | 92 | 94.8 (93.2 to 96.2) | 101.0 (96.6 to 104.4) | 106.6 (99.0 to 112.5) | 111.4 (100.7 to 121.1) |
Prince Edward Island | 0 | 1 | 2 | 2 | 2 | 2.1 (2.0 to 2.1) | 2.2 (2.1 to 2.3) | 2.3 (2.1 to 2.4) | 2.4 (2.1 to 2.6) |
Quebec | 9 | 77 | 76 | 76 | 107 | 108.4 (107.1 to 109.5) | 111.1 (107.7 to 113.8) | 113.2 (107.5 to 117.7) | 115.0 (107.0 to 122.0) |
Saskatchewan | 3 | 10 | 10 | 8 | 6 | 6.1 (6.0 to 6.2) | 6.6 (6.3 to 6.7) | 7.0 (6.5 to 7.4) | 7.4 (6.6 to 8.0) |
Yukon | 0 | 0 | 0 | 0 | 0 | 0 (0 to 0) | 0 (0 to 0) | 0 (0 to 0) | 0 (0 to 0) |
Canada | 35 | 214 | 266 | 271 | 331 | 339.7 (334.7 to 344.2) | 359.7 (345.2 to 370.7) | 377.0 (352.3 to 396.1) | 392.3 (357.5 to 423.4) |
Note: The projection was calculated as the product of the numbers of per capita units in 2022–2023 and the population projections in 2025, 2030, 2035, and 2040. The numbers of imaging units were provided by provincial or territorial validators in 2023. The population projections were retrieved from Statistics Canada website on January 18, 2024.21 The population projection assumed medium, low, and high growth.
Table 42: Reported and Projected Numbers of SPECT Units by Province and Territory, 2007–2040
Province or territory | 2007 | 2015 | 2017 | 2020 | 2023 | 2025 (low- to high-growth projections) | 2030 (low- to high-growth projections) | 2035 (low- to high-growth projections) | 2040 (low- to high-growth projections) |
|---|---|---|---|---|---|---|---|---|---|
Alberta | 57 | 30 | 42 | 37 | 36 | 37.3 (36.8 to 37.8) | 41.2 (39.5 to 42.4) | 45.0 (42.0 to 47.3) | 48.7 (44.3 to 52.6) |
British Columbia | 62 | 26 | 23 | 24 | 16 | 16.6 (16.3 to 16.8) | 17.7 (16.9 to 18.3) | 18.5 (17.2 to 19.5) | 19.2 (17.4 to 20.8) |
Manitoba | 16 | 7 | 9 | 6 | 4 | 4.1 (4.0 to 4.1) | 4.3 (4.1 to 4.5) | 4.6 (4.2 to 4.8) | 4.8 (4.3 to 5.2) |
New Brunswick | 17 | 2 | 5 | 11 | 6 | 6.1 (6.0 to 6.1) | 6.2 (6.1 to 6.4) | 6.3 (6.0 to 6.5) | 6.4 (6.0 to 6.7) |
Newfoundland and Labrador | 11 | 4 | 2 | 3 | 1 | 1.0 (1.0 to 1.0) | 1.0 (1.0 to 1.0) | 1.0 (0.9 to 1.0) | 0.9 (0.9 to 1.0) |
Northwest Territories | 0 | 0 | 0 | 0 | 0 | 0 (0 to 0) | 0 (0 to 0) | 0 (0 to 0) | 0 (0 to 0) |
Nova Scotia | 23 | 7 | 7 | 7 | 7 | 7.2 (7.1 to 7.2) | 7.4 (7.1 to 7.6) | 7.5 (7.1 to 7.8) | 7.5 (7.0 to 8.0) |
Nunavut | 0 | 0 | 0 | 0 | 0 | 0 (0 to 0) | 0 (0 to 0) | 0 (0 to 0) | 0 (0 to 0) |
Ontario | 250 | 99 | 163 | 135 | 102 | 105.1 (103.3 to 106.6) | 112.0 (107.1 to 115.8) | 118.2 (109.7 to 124.7) | 123.5 (111.7 to 134.2) |
Prince Edward Island | 2 | 1 | 0 | 0 | 0 | 0 (0 to 0) | 0 (0 to 0) | 0 (0 to 0) | 0 (0 to 0) |
Quebec | 152 | 79 | 77 | 75 | 32 | 32.4 (32.0 to 32.8) | 33.2 (32.2 to 34.0) | 33.9 (32.2 to 35.2) | 34.4 (32.0 to 36.5) |
Saskatchewan | 13 | 9 | 9 | 7 | 6 | 6.1 (6.0 to 6.2) | 6.6 (6.3 to 6.7) | 7.0 (6.5 to 7.4) | 7.4 (6.6 to 8.0) |
Yukon | 0 | 0 | 0 | 0 | 0 | 0 (0 to 0) | 0 (0 to 0) | 0 (0 to 0) | 0 (0 to 0) |
Canada | 603 | 264 | 337 | 305 | 210 | 215.5 (212.3 to 218.3) | 228.2 (219.0 to 235.2) | 239.2 (223.5 to 251.3) | 248.9 (226.8 to 268.6) |
Note: The projection was calculated as the product of the numbers of per capita units in 2022–2023 and the population projections in 2025, 2030, 2035, and 2040. The numbers of imaging units were provided by provincial or territorial validators in 2023. The population projections were retrieved from Statistics Canada website on January 18, 2024.21 The population projection assumed medium, low, and high growth.
Table 43: Reported and Projected Numbers of SPECT-CT and SPECT Exams by Province and Territory, 2007–2040
Province or territory | 2007 | 2015 | 2017 | 2020 | 2023 | 2025 (low- to high-growth projections) | 2030 (low- to high-growth projections) | 2035 (low- to high-growth projections) | 2040 (low- to high-growth projections) |
|---|---|---|---|---|---|---|---|---|---|
Alberta | NA | 107,325 | 26,130 | 23,732 | 59,099 | 61,292.0 (60,457.1 to 61,999.2) | 67,640.0 (64,881.3 to 69,664.8) | 73,886.0 (68,949.0 to 77,670.2) | 79,976.0 (72,792.8 to 86,428.6) |
British Columbia | NA | 86,264 | 148,578 | 66,604 | 66,604a | 68,939.0 (67,702.3 to 70,000.4) | 73,639.0 (70,276.5 to 76,221.3) | 77,050.0 (71,531.2 to 81,291.4) | 79,915.0 (72,293.5 to 86,568.0) |
Manitoba | NA | 22,935 | 22,074 | 29,400 | 22,378 | 22,866.9 (22,509.3 to 23,210.2) | 24,173.7 (23,104.2 to 25,039.2) | 25,493.3 (23,626.3 to 27,083.3) | 26,686.2 (24,050.3 to 29,315.7) |
New Brunswick | NA | 12,000 | 39,635 | 16,219 | 28,408 | 28,835.0 (28,545.7 to 29,061.4) | 29,588.0 (28,747.1 to 30,152.8) | 29,976.0 (28,542.2 to 30,993.4) | 30,188.0 (28,189.0 to 31,862.3) |
Newfoundland and Labrador | NA | 49,835 | 33,095 | 22,910 | 49,835 | 22,822.0 (22,601.3 to 23,020.3) | 22,495.0 (21,913.3 to 22,985.0) | 22,019.0 (21,066.6 to 22,808.6) | 21,446.0 (20,149.3 to 22,605.7) |
Northwest Territories | NA | 0 | 0 | 0 | 0 | 0 (0 to 0) | 0 (0 to 0) | 0 (0 to 0) | 0 (0 to 0) |
Nova Scotia | NA | 18,633 | 0 | 30,235 | 12,511 | 12,787.0 (12,625.9 to 12,940.1) | 13,192.0 (12,759.1 to 13,561.0) | 13,346.0 (12,628.3 to 13,959.5) | 13,417.0 (12,430.3 to 14,364.1) |
Nunavut | NA | 0 | 0 | 0 | 0 | 0 (0 to 0) | 0 (0 to 0) | 0 (0 to 0) | 0 (0 to 0) |
Ontario | NA | 248,494 | 200,833 | 192,189 | 192,189a | 198,011.0 (194,703.2 to 200,883.2) | 211,089.0 (201,718.4 to 218,129.1) | 222,634.0 (206,715.6 to 234,989.9) | 232,738.0 (210,416.3 to 252,953.4) |
Prince Edward Island | NA | 2,119 | 2,299 | 2,129 | 1,985 | 2,050.0 (2,013.9 to 2,078.6) | 2,169.0 (2,070.5 to 2,236.9) | 2,272.0 (2,105.2 to 2,394.0) | 2,362.0 (2,130.6 to 2,565.0) |
Quebec | NA | 939,700 | 786,594 | 783,667 | 496,843 | 503,239.0 (497,479.2 to 508,601.5) | 515,810.0 (500,029.7 to 528,215.9) | 525,807.0 (499,211.7 to 546,563.7) | 533,760.0 (496,417.0 to 566,348.5) |
Saskatchewan | NA | 47,826 | 52,730 | 33,723 | 26,083 | 26,661.0 (26,270.0 to 26,952.8) | 28,510.0 (27,220.3 to 29,336.0) | 30,406.0 (28,103.1 to 32,023.7) | 32,178.0 (28,872.9 to 34,978.8) |
Yukon | NA | 0 | 0 | 0 | 0 | 0 (0 to 0) | 0 (0 to 0) | 0 (0 to 0) | 0 (0 to 0) |
Canada | NA | 1,485,296 | 1,354,121 | 1,210,993 | 929,010 | 953,485.3 (939,262.4 to 965,929.1) | 1,009,474.2 (968,735.5 to 1,040,323.4) | 1,058,021.9 (988,674.8 to 1,111,819.5) | 1,100,980.3 (1,003,423.2 to 1,188,388.7) |
NA = not available.
Notes: The projection was calculated as the product of the numbers of per capita exams in 2022–2023 and the population projections in 2025, 2030, 2035, and 2040. The numbers of imaging exams were provided by provincial or territorial validators in 2023. The population projections were retrieved from Statistics Canada website on January 18, 2024.21 The population projection assumed medium, low, and high growth.
aBritish Columbia and Ontario did not report 2022–2023 exam values and so values from 2019–2022 and 2017 were used for the projections, respectively.
Appendix 4: Supplementary Summary Tables for Publicly Funded Sites With SPECT-CT or SPECT Units, 2022–2023
Note that this appendix has not been copy-edited.
Table 44: Average Hours per Day of SPECT-CT Use at Publicly Funded Sites by Province and Territory, 2022–2023
Province or territory | Number of reporting sites | Mean hours | Median hours (min to max) |
|---|---|---|---|
Alberta | 15 | 9.1 | 9 (8 to 14) |
British Columbia | 16 | 8.6 | 8 (7 to 11) |
Manitoba | 5 | 8.5 | 8 (8 to 10) |
New Brunswick | 4 | 8.5 | 8.5 (8 to 9) |
Newfoundland and Labrador | 3 | 8.3 | 8 (8 to 9) |
Northwest Territories | — | — | — |
Nova Scotia | 3 | 9.3 | 10 (8 to 10) |
Nunavut | — | — | — |
Ontario | 28 | 8.6 | 8 (7 to 13) |
Prince Edward Island | 1 | 8 | 8 (8 to 8) |
Quebec | 12 | 8.2 | 8 (7 to 12) |
Saskatchewan | 3 | 9.3 | 10 (8 to 10) |
Yukon | — | — | — |
Canada | 90 | 8.7 | 8 (7 to 14) |
“–” = not applicable.
Notes: 90 out of 94 sites that reported information for SPECT-CT daily operation identified as public facilities.
Data derived from the survey question: “In an average 24-hour day, how many hours are the units staffed through regular scheduled service capacity (do not include hours where staff are only on call)”.
Table 45: Average Hours per Week of SPECT-CT Use at Publicly Funded Sites by Province and Territory, 2022–2023
Province or territory | Number of reporting sites | Mean hours | Median hours (min to max) |
|---|---|---|---|
Alberta | 15 | 46.5 | 43 (38 to 88) |
British Columbia | 16 | 41.9 | 40 (10 to 66) |
Manitoba | 5 | 42.5 | 40 (40 to 50) |
New Brunswick | 4 | 42.5 | 42.5 (40 to 45) |
Newfoundland and Labrador | 3 | 46.3 | 43 (40 to 56) |
Northwest Territories | — | — | — |
Nova Scotia | 3 | 46.7 | 50 (40 to 50) |
Nunavut | — | — | — |
Ontario | 27 | 41.7 | 40 (10 to 68) |
Prince Edward Island | 1 | 40 | 40 (40 to 40) |
Quebec | 12 | 42.6 | 40 (35 to 60) |
Saskatchewan | 3 | 46.7 | 50 (40 to 50) |
Yukon | — | — | — |
Canada | 89 | 43.2 | 40 (10 to 88) |
“–” = not applicable.
Notes: 89 out of 93 sites that reported information for SPECT-CT weekly operation identified as public facilities.
Data derived from survey question: “In an average 168-hour week, how many hours are the [modality] units staffed through regular scheduled service capacity (do not include hours where staff are only on call)?”
Table 46: Average Hours per Day of SPECT Use at Publicly Funded Sites by Province and Territory, 2022–2023
Province or territory | Number of reporting sites | Mean hours | Median hours (min to max) |
|---|---|---|---|
Alberta | 14 | 9.2 | 9 (8 to 14) |
British Columbia | 4 | 8.5 | 8 (8 to 10) |
Manitoba | 3 | 8.5 | 8 (8 to 10) |
New Brunswick | 3 | 8.3 | 8 (8 to 9) |
Newfoundland and Labrador | NR | NR | NR |
Northwest Territories | — | — | — |
Nova Scotia | 3 | 8.7 | 8 (8 to 10) |
Nunavut | — | — | — |
Ontario | 23 | 8.6 | 8 (5 to 14) |
Prince Edward Island | — | — | — |
Quebec | 9 | 7.8 | 8 (7 to 9) |
Saskatchewan | 2 | 8 | 8 (8 to 8) |
Yukon | — | — | — |
Canada | 61 | 8.6 | 8 (5 to 14) |
“–” = not applicable; NR = not reported.
Note: 61 out of 64 sites that reported information for SPECT daily operation identified as public facilities.
Note: Data derived from the survey question: “In an average 24-hour day, how many hours are the units staffed through regular scheduled service capacity (do not include hours where staff are only on call)”.
Table 47: Average Hours per Week of SPECT Use at Publicly Funded Sites by Province and Territory, 2022–2023
Province or territory | Number of reporting sites | Mean hours | Median hours (min to max) |
|---|---|---|---|
Alberta | 14 | 47 | 43.5 (38 to 88) |
British Columbia | 4 | 34.5 | 40 (8 to 50) |
Manitoba | 3 | 42.5 | 40 (40 to 50) |
New Brunswick | 3 | 41 | 40 (38 to 45) |
Newfoundland and Labrador | NR | NR | NR |
Northwest Territories | — | — | — |
Nova Scotia | 3 | 42 | 38 (38 to 50) |
Nunavut | — | — | — |
Ontario | 23 | 41.4 | 40 (10 to 68) |
Prince Edward Island | — | — | — |
Quebec | 9 | 40.1 | 40 (35 to 56) |
Saskatchewan | 2 | 40 | 40 (40 to 40) |
Yukon | — | — | — |
Canada | 61 | 42 | 40 (8 to 88) |
“–” = not applicable.
Notes: 61 out of 64 sites that reported information for SPECT weekly operation identified as public facilities.
Data derived from survey question: “In an average 168-hour week, how many hours are the [modality] units staffed through regular scheduled service capacity (do not include hours where staff are only on call)?”
Table 48: Average Age of Publicly Funded SPECT-CT Imaging Equipment, 2022–2023
Province or territory | Number of SPECT-CT units | Average age SPECT-CT (years, min to max) |
|---|---|---|
Alberta | 29 | 10.1 (3 to 17) |
British Columbia | 32 | 9.3 (0 to 19) |
Manitoba | 10 | 10 (2 to 17) |
New Brunswick | 6 | 9 (1 to 18) |
Newfoundland and Labrador | 6 | 8.2 (2 to 17) |
Northwest Territories | — | — |
Nova Scotia | 8 | 9.8 (6 to 13) |
Nunavut | — | — |
Ontario | 48 | 10.4 (0 to 18) |
Prince Edward Island | 2 | 9.5 (6 to 13) |
Quebec | 33 | 8.3 (0 to 16) |
Saskatchewan | 6 | 13.3 (7 to 18) |
Yukon | — | — |
Canada | 180 | 9.6 (0 to 19) |
“–” = not applicable.
Notes: 180 out of 185 SPECT-CT units with information reported for operational age were located at public facilities.
Age for each unit was calculated from the survey question: “What year did (or will) the [modality] unit become operational?” subtracted from 2023.
Table 49: Average Age of Publicly Funded SPECT Imaging Equipment, 2022–2023
Province or territory | Number of SPECT units | Average age SPECT (years, min to max) |
|---|---|---|
Alberta | 9 | 16.6 (9 to 20) |
British Columbia | 8 | 18.2 (11 to 22) |
Manitoba | 4 | 14.8 (8 to 19) |
New Brunswick | 5 | 9 (2 to 19) |
Newfoundland and Labrador | NR | NR |
Northwest Territories | — | — |
Nova Scotia | 7 | 15.1 (6 to 20) |
Nunavut | — | — |
Ontario | 39 | 12.7 (0 to 24) |
Prince Edward Island | — | — |
Quebec | 11 | 16.2 (8 to 26) |
Saskatchewan | 4 | 15.8 (15 to 17) |
Yukon | — | — |
Canada | 87 | 14.3 (0 to 26) |
“–” = not applicable; NR = not reported.
Notes: 87 out of 90 SPECT units with information reported for operational age were located at public facilities.
Age for each unit was calculated from the survey question: “What year did (or will) the [modality] unit become operational?” subtracted from 2023.
ISSN: 2563-6596
Disclaimer: The information in this document is intended to help Canadian health care decision-makers, health care professionals, health systems leaders, and policy-makers make well-informed decisions and thereby improve the quality of health care services. While patients and others may access this document, the document is made available for informational purposes only and no representations or warranties are made with respect to its fitness for any particular purpose. The information in this document should not be used as a substitute for professional medical advice or as a substitute for the application of clinical judgment in respect of the care of a particular patient or other professional judgment in any decision-making process. The Canadian Agency for Drugs and Technologies in Health (CADTH) does not endorse any information, drugs, therapies, treatments, products, processes, or services.
While care has been taken to ensure that the information prepared by CADTH in this document is accurate, complete, and up-to-date as at the applicable date the material was first published by CADTH, CADTH does not make any guarantees to that effect. CADTH does not guarantee and is not responsible for the quality, currency, propriety, accuracy, or reasonableness of any statements, information, or conclusions contained in any third-party materials used in preparing this document. The views and opinions of third parties published in this document do not necessarily state or reflect those of CADTH.
CADTH is not responsible for any errors, omissions, injury, loss, or damage arising from or relating to the use (or misuse) of any information, statements, or conclusions contained in or implied by the contents of this document or any of the source materials.
This document may contain links to third-party websites. CADTH does not have control over the content of such sites. Use of third-party sites is governed by the third-party website owners’ own terms and conditions set out for such sites. CADTH does not make any guarantee with respect to any information contained on such third-party sites and CADTH is not responsible for any injury, loss, or damage suffered as a result of using such third-party sites. CADTH has no responsibility for the collection, use, and disclosure of personal information by third-party sites.
Subject to the aforementioned limitations, the views expressed herein are those of CADTH and do not necessarily represent the views of Canada’s federal, provincial, or territorial governments, or any third-party supplier of information.
This document is prepared and intended for use in the context of the Canadian health care system. The use of this document outside of Canada is done so at the user’s own risk.
This disclaimer and any questions or matters of any nature arising from or relating to the content or use (or misuse) of this document will be governed by and interpreted in accordance with the laws of the Province of Ontario and the laws of Canada applicable therein, and all proceedings shall be subject to the exclusive jurisdiction of the courts of the Province of Ontario, Canada.
The copyright and other intellectual property rights in this document are owned by CADTH and its licensors. These rights are protected by the Canadian Copyright Act and other national and international laws and agreements. Users are permitted to make copies of this document for noncommercial purposes only, provided it is not modified when reproduced and appropriate credit is given to CADTH and its licensors.
About CADTH: CADTH is an independent, not-for-profit organization responsible for providing Canada’s health care decision-makers with objective evidence to help make informed decisions about the optimal use of drugs, medical devices, diagnostics, and procedures in our health care system.
Funding: CADTH receives funding from Canada’s federal, provincial, and territorial governments, with the exception of Quebec.
Questions or requests for information about this report can be directed to Requests@CADTH.ca.