CADTH Health Technology Review
Canadian Medical Imaging Inventory 2022–2023: MRI
CMII Report
Abbreviations
AI
artificial intelligence
CCOHTA
Canadian Coordinating Office for Health Technology Assessment
CDST
clinical decision support tool
CIHI
Canadian Institute for Health Information
CMII
Canadian Medical Imaging Inventory
FTE
full-time equivalent
MRT
medical radiation technologist
OECD
Organisation for Economic Co-operation and Development
PACS
picture archiving and communication system
Key Messages
MRI is a noninvasive imaging modality that uses powerful electromagnetic and radiofrequency fields to produce cross-sectional images of the body.
MRI is primarily used for neurologic exams (28%), followed by musculoskeletal (23%) and oncology exams (17%).
In total, 432 MRI units in 11 jurisdictions were identified by the Canadian Medical Imaging Inventory (CMII) in its 2022 to 2023 national survey. Most sites are publicly funded hospitals located in urban centres.
Canada has an average of 10.8 MRI units per million people. The greatest density of units per million people is in Yukon, Quebec, and New Brunswick.
Overall, 2,214,157 publicly funded MRI examinations were performed in the 2022–2023 fiscal year. This represents a national average of 55.6 exams per 1,000 people, an increase of 4.3% since 2019–2020.
Canada is positioned in the bottom 25% of Organisation for Economic Co-operation and Development (OECD) countries in units per million population and the bottom 50% of OECD countries for average volume of publicly funded MRI exams per 1,000 population.
The average age of MRI equipment in Canada is 8.4 years; 62.8% of MRI units are 10 years old or newer, 23.3% are 11 to 15 years old, and 13.9% are more than 15 years old.
On average, MRI units operate 15.3 hours per day and 97.4 hours per week. Overall, 76.0% of sites reported MRI operation on weekends and 17% of sites reported operating 24 hours a day.
What Is the Context?
MRI is a widely used imaging technique that uses powerful electromagnetic and radiofrequency fields combined with computation to generate cross-sectional images of the body (Appendix 1). These images allow for visualization of anatomy and pathologies with high sensitivity, including soft-tissue details.1-3 This places MRI in an integral role for clinical management of patients in Canada when combined with other medical procedures. MRI is frequently employed for investigating and staging cancer as well as examining neurologic and musculoskeletal abnormalities or diseases, gastrointestinal organs, orthopedic joints, and cardiac structure and function.1
The main advantage of MRI compared to other imaging modalities is that it does not use X-rays or ionizing radiation to generate its images and, therefore, may be more preferrable over other modalities when seeking comparable information. In addition, MRI produces better contrast in soft tissues compared to CT which can lead to diagnoses of certain diseases that might otherwise remain undetected.1,3 However, the strong magnetic fields of MRI units contraindicate patients with embedded metallic objects, and scan times for MRI exams are often long and require patients to remain motionless.2,3
MRI has undergone continuous technological advancements since its adoption, such as portable and point-of-care technologies, remote access capabilities, the implementation of artificial intelligence (AI) tools, and hardware and software improvements for data acquisition and processing.4-7 These advancements aim to improve patient access, diagnostic accuracy, and scan times.
Although MRI is the second most commonly available advanced imaging modality in Canada, in 2023, wait times for medically necessary semi-urgent MRI exams exceeded the recommended 30-day maximum target, with a national average wait time of 90 days.8,9 When considering other factors that contribute to MRI use, such as an aging population and the growing incidence of cancer, dementia, and other diseases, there are concerns about whether Canada’s inventory of MRI units can accommodate current and future demand and the potential impact on wait times.1,8,10,11
As MRI technology advances, decision-makers and clinicians face complex procurement and implementation decisions within the context of a finite health care budget and limited availability of clinical and technical expertise.
To better understand the medical imaging landscape in Canada, the Canadian Medical Imaging Inventory (CMII) was created in 2015 to track, compare, and map trends over time related to the availability, distribution, technical specifications, and use of advanced imaging equipment in Canada (i.e., CT, MRI, PET-CT, PET-MRI, SPECT, and SPECT-CT). In 2001, CADTH’s predecessor (then the Canadian Coordinating Office for Health Technology Assessment [CCOHTA]) conducted its first inventory of diagnostic medical imaging technologies in Canada, and the Canadian Institute for Health Information (CIHI) continued this work from 2003 to 2012. This is the fourth iteration of the CMII since CADTH resumed the collection of these data in 2015.
The CMII collects data through a survey conducted approximately once every 2 years and details the use of strategies for improving appropriate imaging, enhancing system efficiencies, reducing wait lists, and addressing other systemic challenges. Through this work, the CMII provides health care decision-makers with information on the imaging landscape in Canada that may be used to identify and address service and medical equipment gaps and inform strategic planning.
This report summarizes the MRI-related findings of the 2022–2023 national CMII survey.
What Did We Do?
The purpose of this CMII report is to document current practices and developments in the supply, distribution, technical operations, and general clinical use of MRI in jurisdictions in Canada. This report is part of a series of publications produced for the CMII national survey, which also includes reports on CT, PET-CT, PET-MRI, SPECT, and SPECT-CT.
Why Did We Do This?
The CMII provides information on the medical imaging landscape across Canada to help support health care decision-making. Robust data are required to ensure health systems can deliver the imaging required to provide timely, safe, patient-centred care, improve health outcomes, and deliver health care efficiencies. Further details on the purpose of the CMII are provided in the Canadian Medical Imaging Inventory 2022–2023: Provincial and Territorial Overview report located on the CMII webpage.
Methods Overview
Data were primarily collected on 6 imaging modalities, including MRI, using a web-based self-report survey (refer to the Canadian Medical Imaging Inventory 2022–2023: Methods document located on the CMII webpage). Data were supplemented with information from provincial and territorial validators who are senior medical imaging–related health care decision-makers. In addition, data from peer reviewers, literature searches, CIHI, and previous iterations of CMII data were incorporated into the report. Both English and French versions of the survey were provided.
The CMII survey collected the following data:
number and location of imaging equipment
volume of exams
hours of equipment operation
age of imaging equipment
technical specifications of machines
adoption of new and emerging supportive tools and technologies
imaging storing and communication services.
The survey opened on May 5, 2023, and primary data collection and validator responses were collected until October 31, 2023. The full data collection and analysis strategy, including survey development, respondent identification, sources of data used, and data validation procedures, can be found in the Canadian Medical Imaging Inventory 2022–2023: Methods document on the CMII webpage.
The CMII also presents data from both the survey and other sources relating to human resources, funding structures, ordering and referral practices, and the adoption of tools that may support appropriate imaging, system efficiencies, and wait-list reductions.
Comparisons between Canadian data and data from other OECD countries are reported, as are trends and projections on imaging capacity.
Response Rate for the 2022–2023 National Survey
A total of 504 sites were invited to participate in the survey. Data on modalities and unit counts were available for 467 sites (92.7%).
A 100% participation rate was received from publicly funded facilities (i.e., hospitals) in 7 provinces and all territories. The participation rate for the remaining provinces ranged from 51% to 93% for publicly funded facilities.
A complete response rate was received for unit counts and exam volumes by provincial and territorial validators, while the response rate varied for other survey questions. A total of 308 sites provided updated or new information (72%), reflecting an increased response rate of 34% since the CMII 2019–2020 survey.
While the overall survey participation rate was high, in some instances, not all survey questions were answered. This may have led to a nonresponse bias, which may result in the overgeneralization of some findings. To enable readers to assess the representativeness of each data point, the number of sites that responded to each question have been included alongside the reported data.
Provincial and territorial validators provided high-level information for nonresponding publicly funded health facilities. Data obtained from the previous survey iteration, and from other sources (e.g., personal communications, websites of health care facilities), were used to inform the status of the remaining sites. Data from free-standing sites with private imaging capacity supplemented data for public capacity; detailed information for private imaging facilities is limited due to the low number of survey responses.
The survey questions and full data collection and analysis strategy, including survey development, respondent identification, sources of data used, and data validation procedures, can be found in the Canadian Medical Imaging Inventory 2022–2023: Methods document on the CMII webpage. Definitions for the types of facilities included in the survey are provided in Appendix 2.
MRI Facility Overview
Characteristics of Facilities With MRI Equipment
A summary of the geographic distribution, type, location, and funding source for facilities in Canada with MRI equipment that responded to the 2022–2023 survey is provided in the sections that follow.
Overall, 432 MRI units are distributed across 296 sites in all provinces and 1 territory in Canada (Figure 1).
Figure 1: Geographic Distribution of MRI Units in Canada, 2022 to 2023
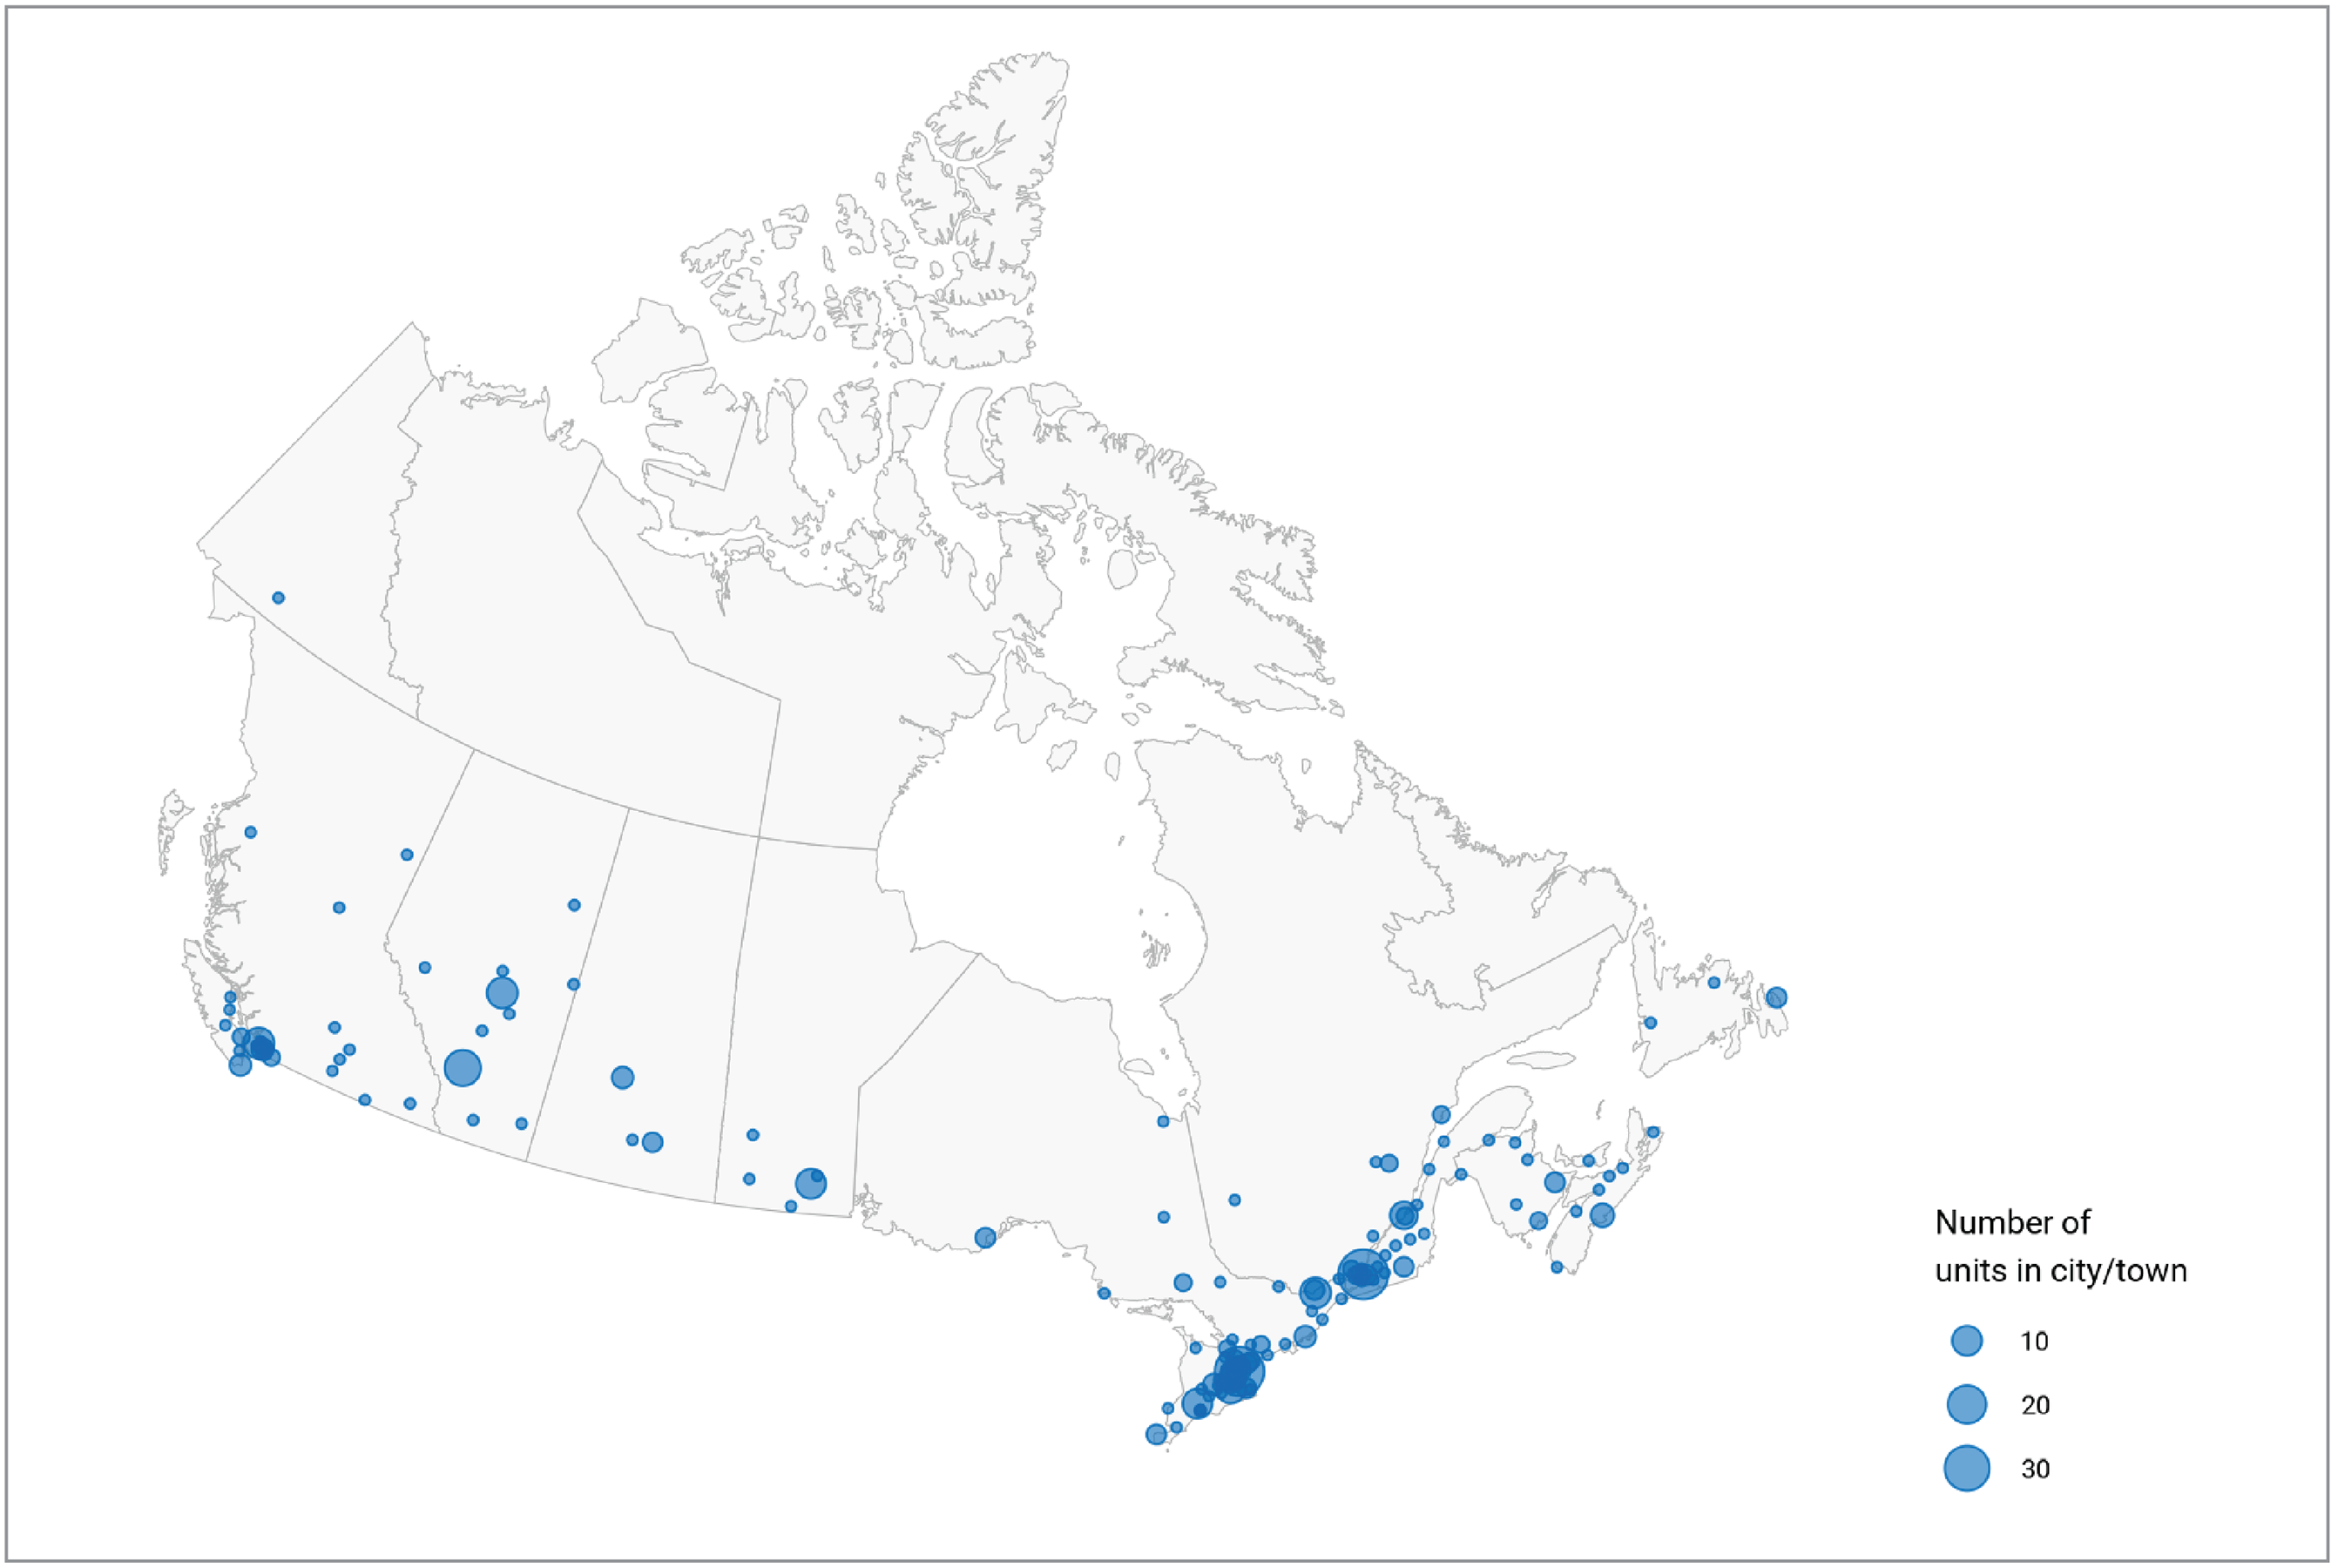
Notes: Location information is available for all units.
Location was derived from the survey and validator data. Mobile units appear as one unit at each of the sites served.
Location and Facility Characteristics of MRI Units
Overall, 68.1% of sites with MRI units reported that they were hospitals, 15.7% reported that they were tertiary care centres, 8.3% identified as community hospitals, and 7.8% of identified as private facilities (Figure 2 and Appendix 3, Table 6). Data came from 204 of 296 sites with responses to this survey question. Definitions for the type of facility included in the survey are provided in Appendix 2.
A total of 79.7% of sites reported operation in an urban setting, 19.3% reported rural operation, and 1% of sites reported remote operation (Figure 3 and Appendix 3, Table 7). Data came from 192 sites that responded to this survey question.
In total, 95.5% of sites reported being publicly funded, 1.3% reported private funding, and 3.2% reported receiving funds from both public and private sources (Figure 4 and Appendix 3, Table 8). Data came from 154 sites that responded to this survey question.
No conventional MRI units operate in the Northwest Territories or Nunavut, as confirmed by territorial validators.
Figure 2: Types of MRI Facilities in Canada, 2022 to 2023
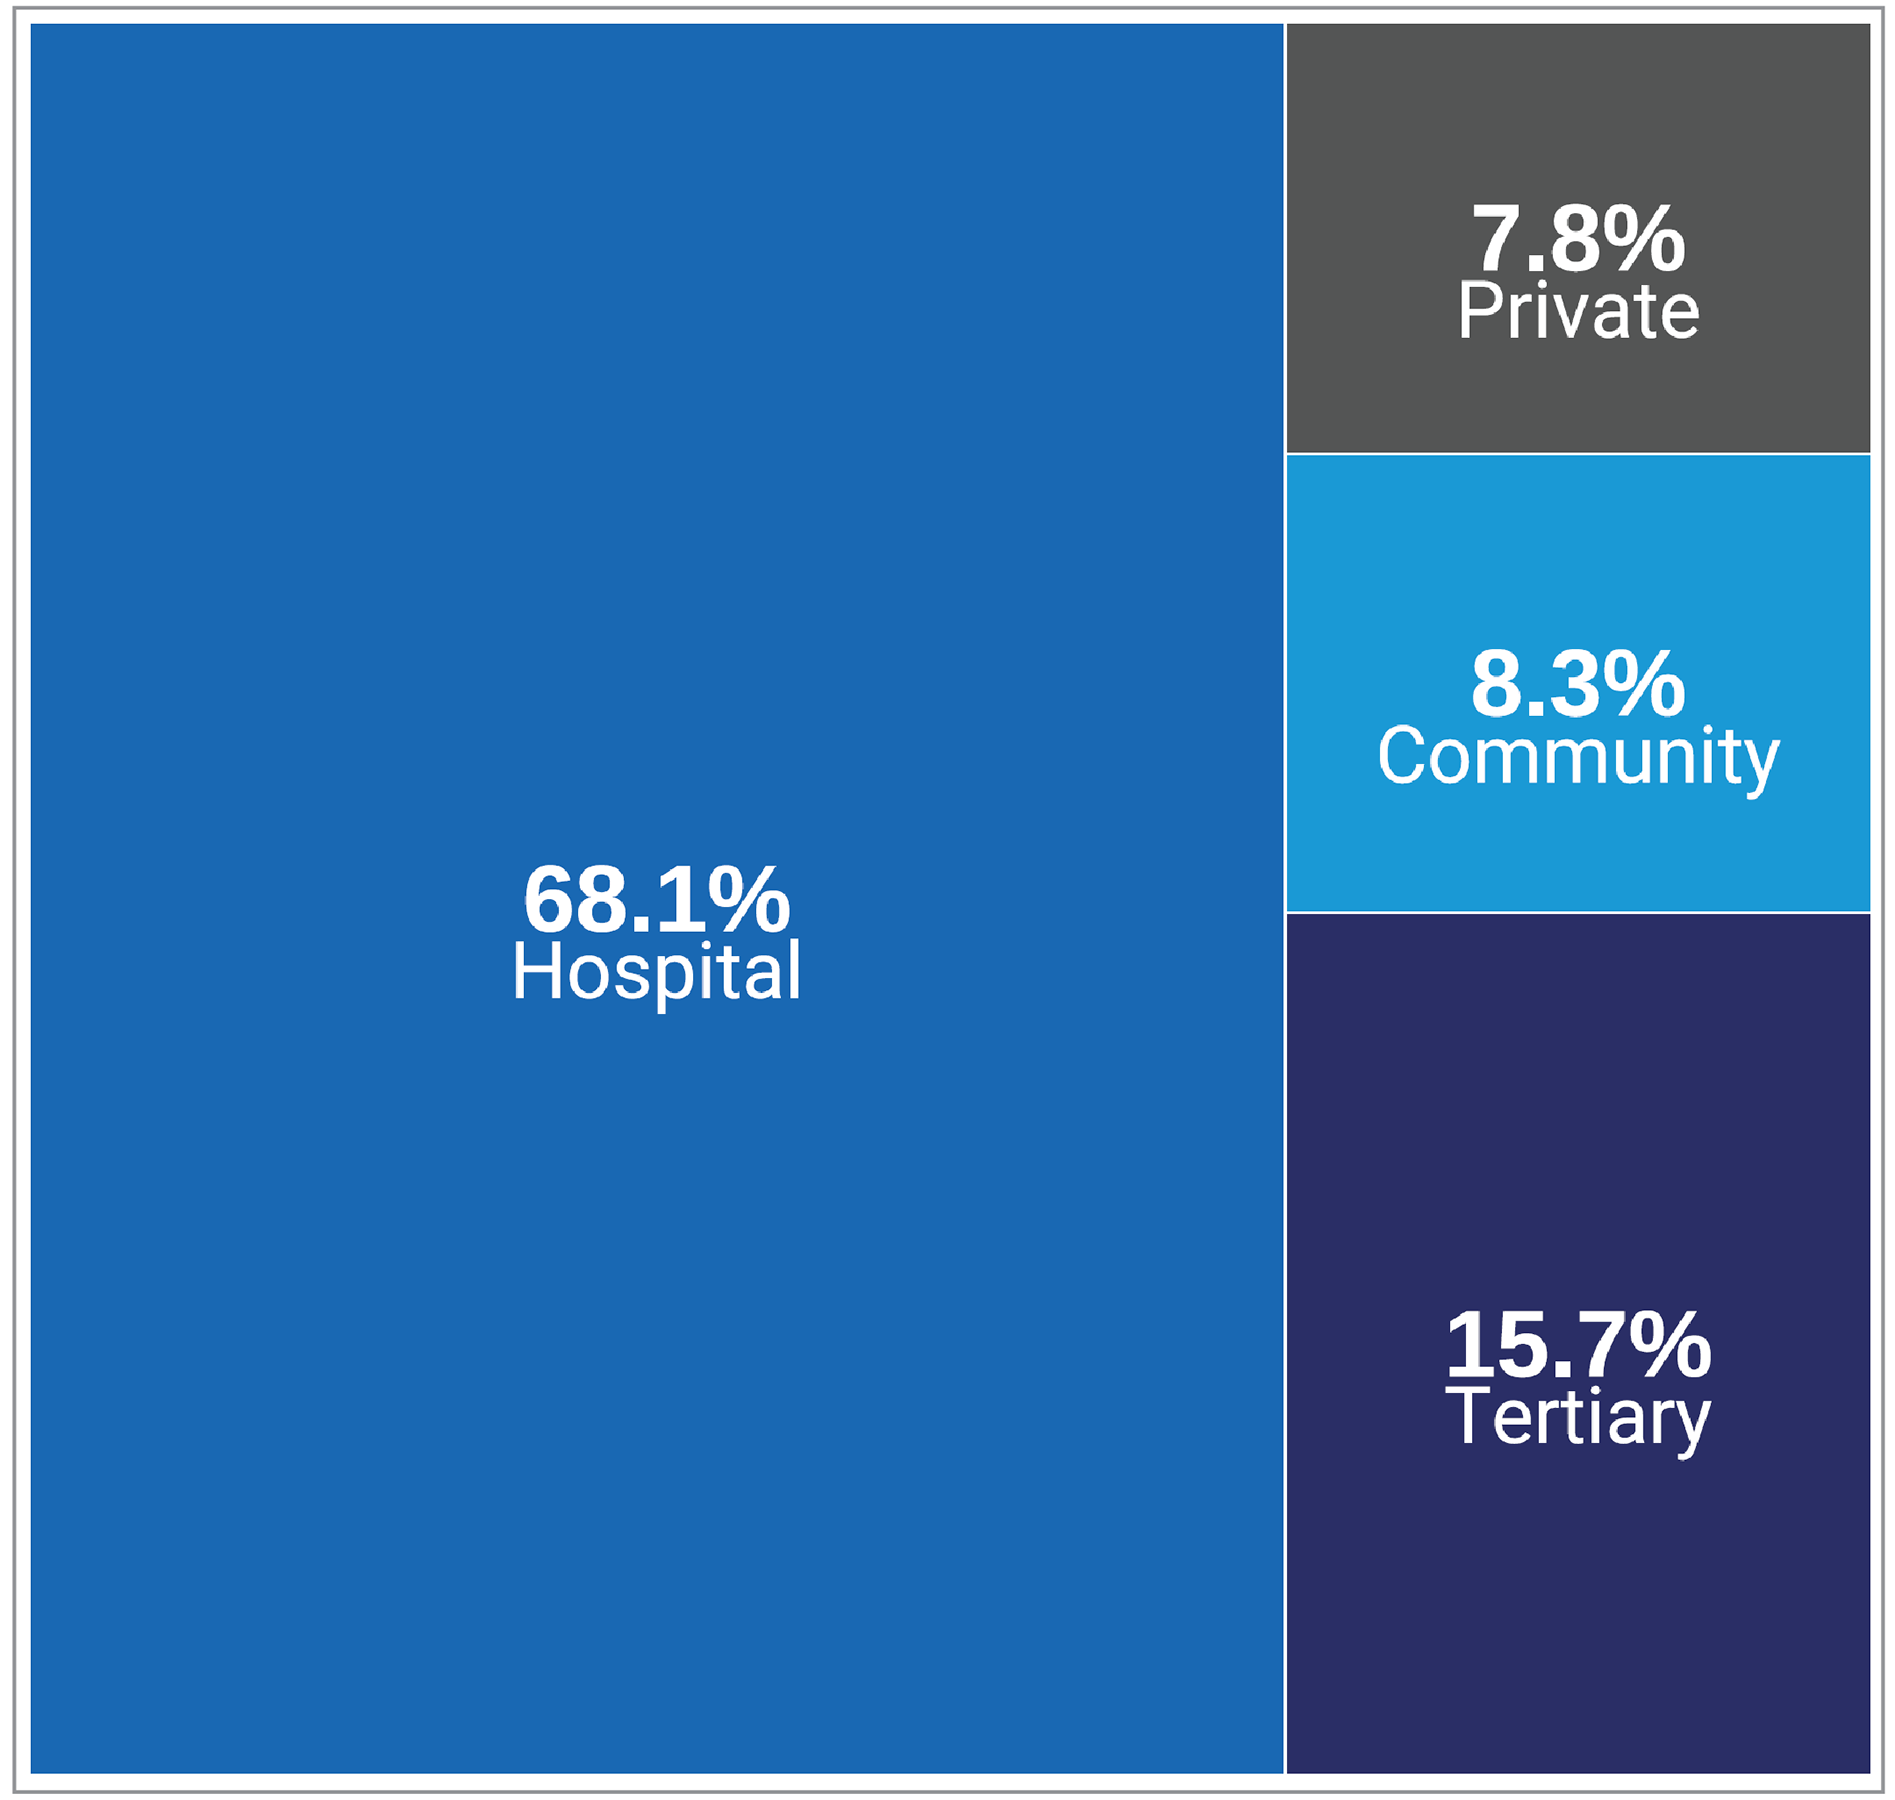
Notes: Survey response data were available for 204 out of 296 sites across all jurisdictions with MRI capacity.
Data were derived from the following survey question: “What type of facility is this?”
Data summaries by province and territory are available in Appendix 3, Table 6.
Figure 2 presents the number of sites as proportions according to facility type of all reported sites. Survey responses for facility type from private sites were limited due to a low response rate.
Definitions for type of facility are provided in Appendix 2.
Figure 3: Geographic Setting of MRI Facilities in Canada, 2022 to 2023
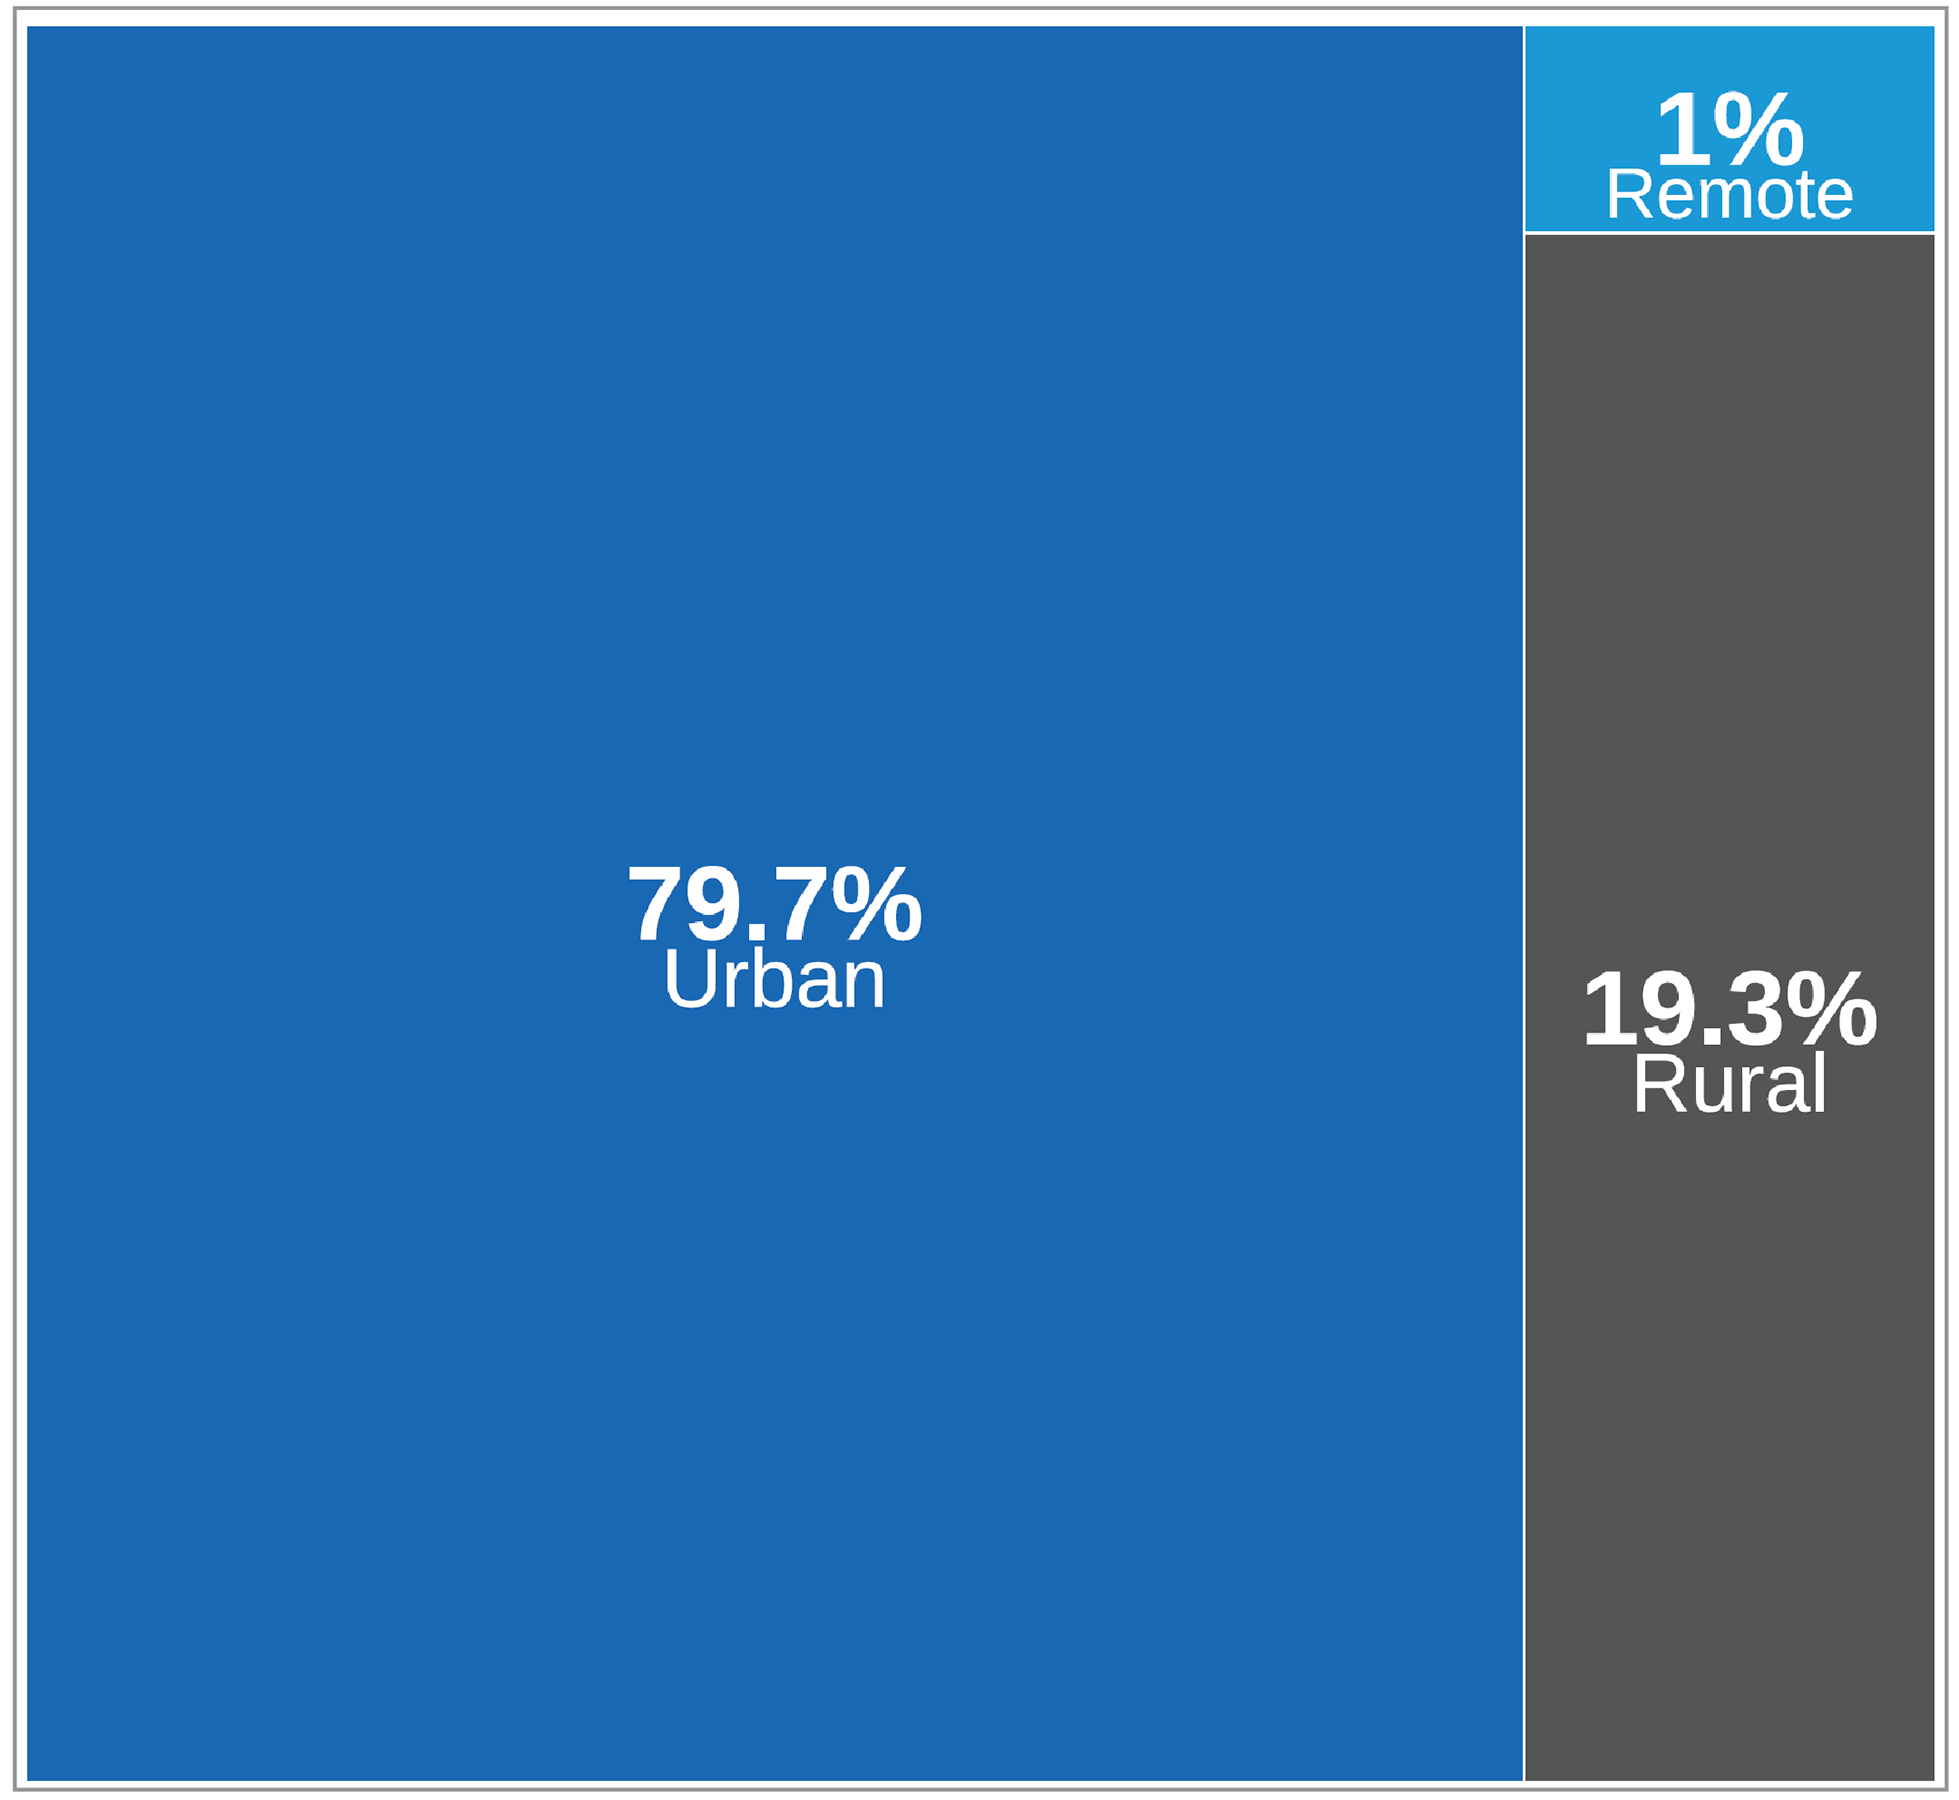
Notes: Survey response data were available for 192 out of 296 sites across all jurisdictions with MRI capacity.
Data were derived from the following survey question: “In which of the following settings are you located?” The figure includes only those facilities that responded to the survey question. In some instances, validator data, CMII data, and data from other publicly available sources supplemented survey responses.
Figure 3 presents the number of sites as proportions according to facility location of all reported sites.
Data summaries by province and territory are available in Appendix 3, Table 7.
Figure 4: Sources of Funding for MRI Facilities in Canada, 2022 to 2023
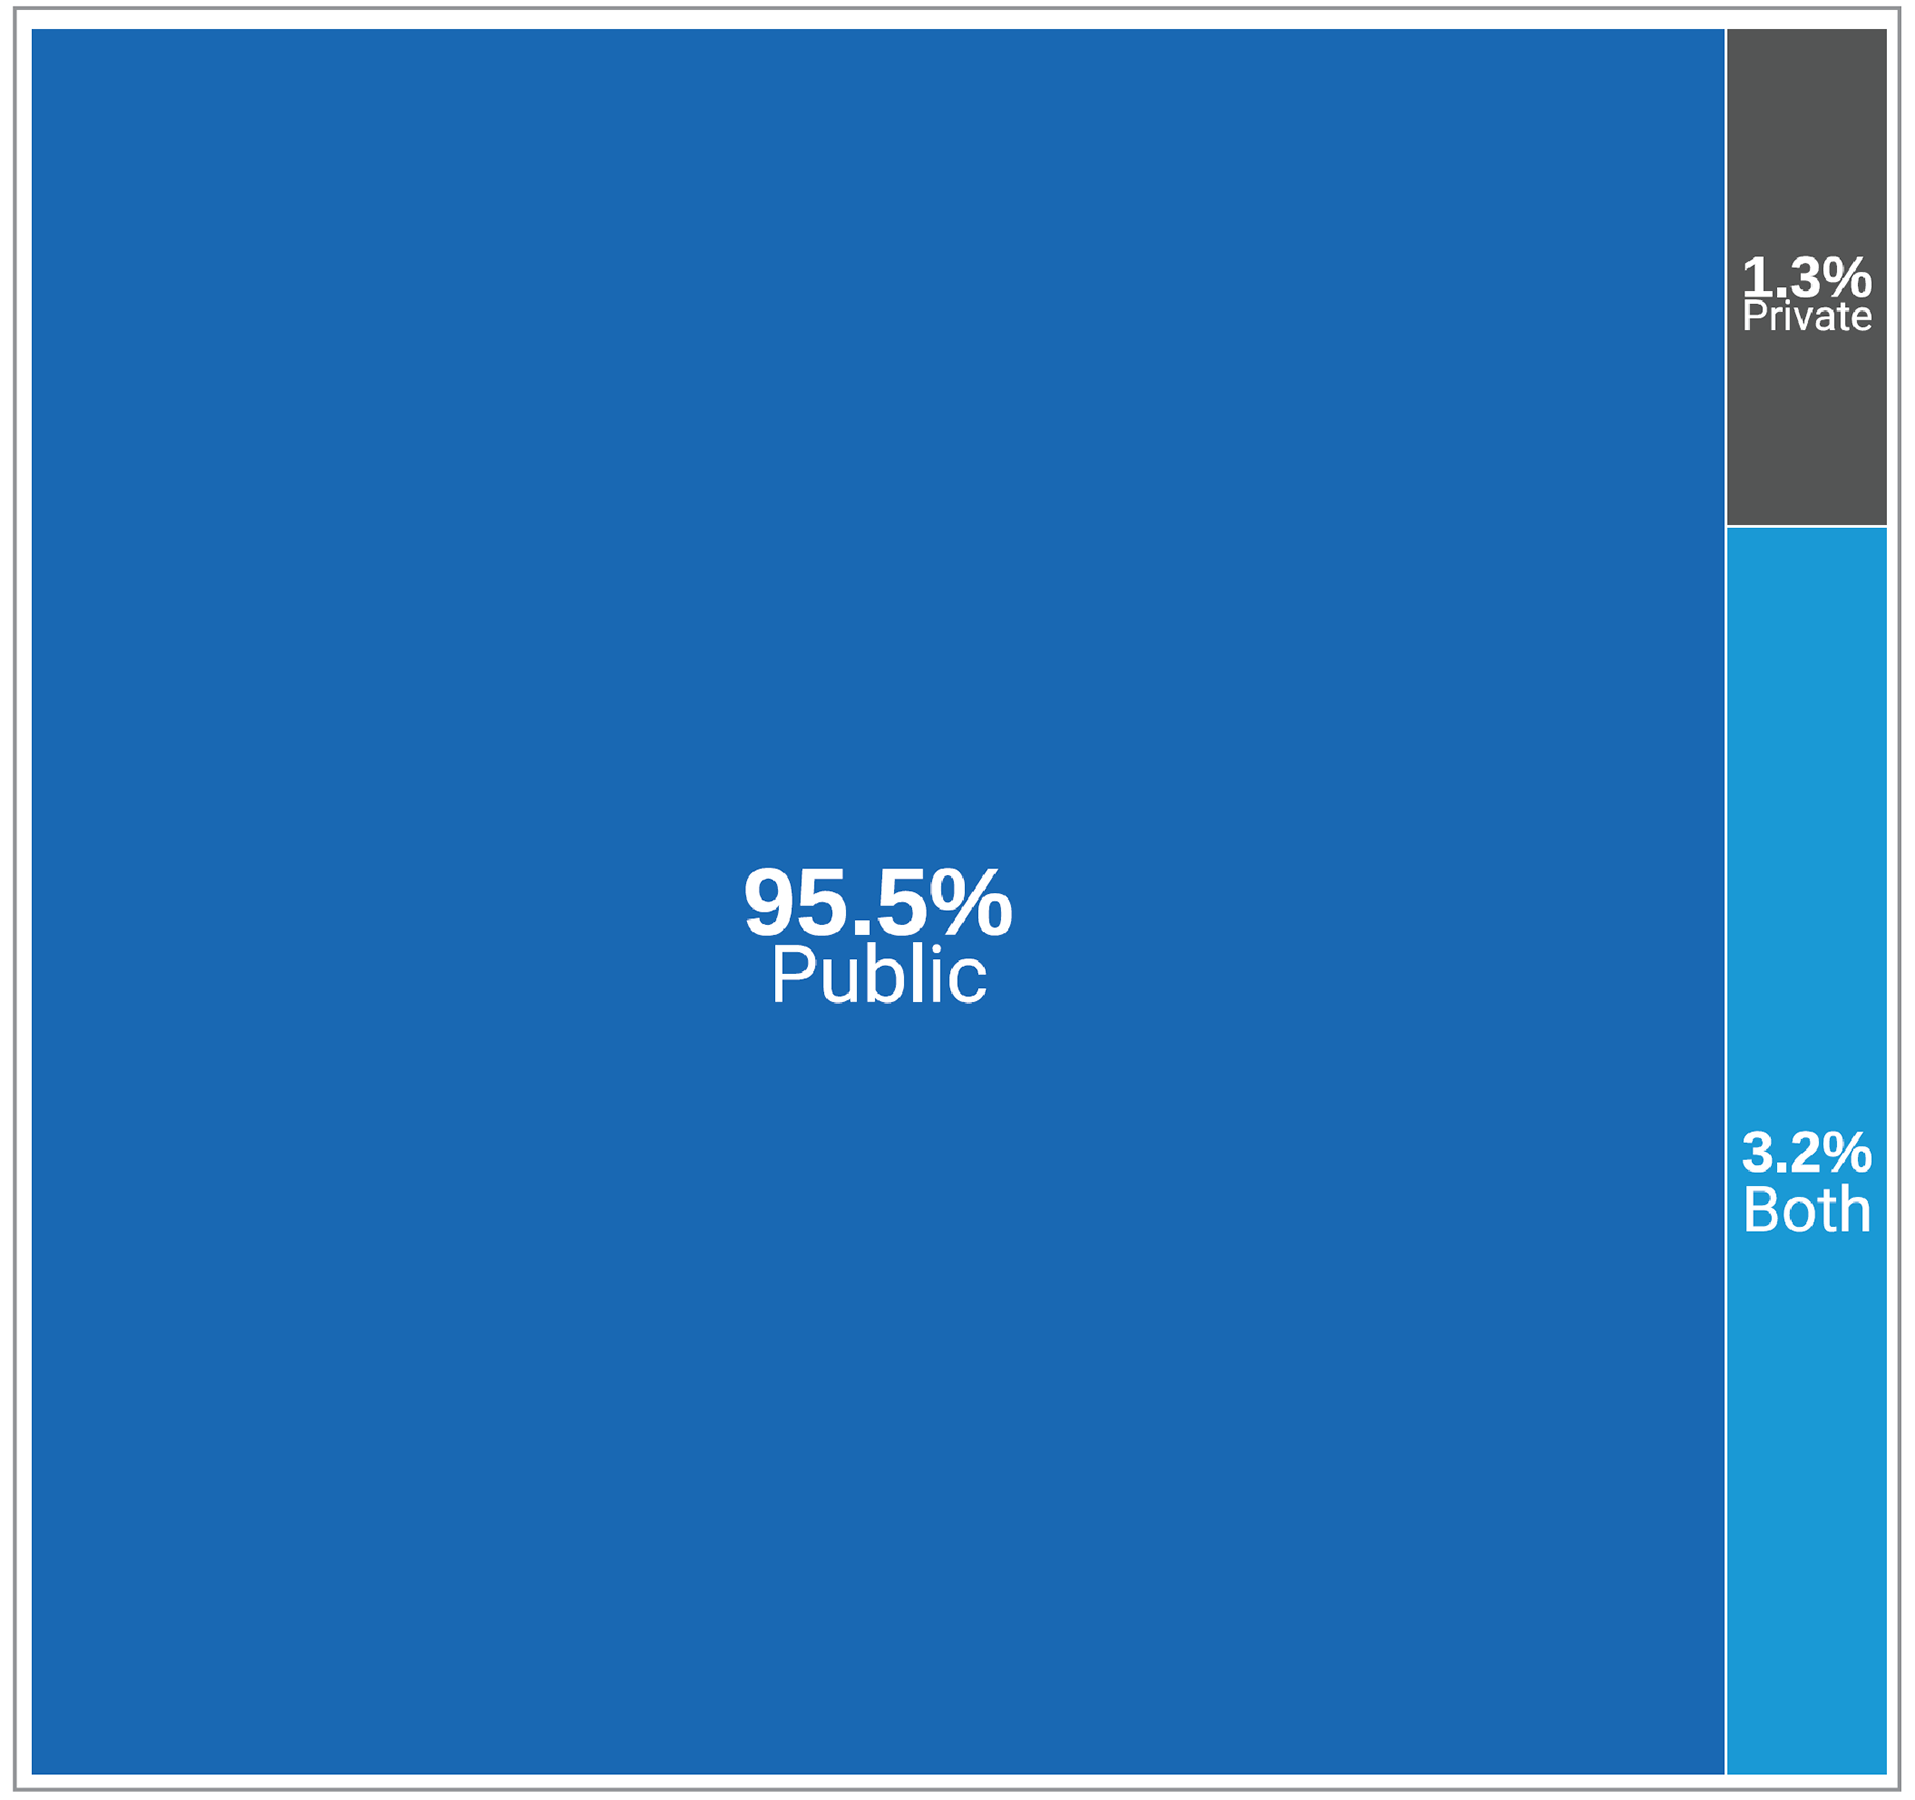
Notes: Survey response data were available for 154 out of 296 sites across all jurisdictions with MRI capacity.
Funding Source data were derived from the following survey question: “How is this facility funded?” The figure includes only those facilities that responded to the survey question. In some instances, validator data, CMII data, and data from other publicly available sources supplemented survey responses. Survey responses for funding source from private sites were limited due to a low response rate.
Figure 4 presents the number of sites as proportions according to the funding source of all reported sites.
Data summaries by province and territory are available in Appendix 3, Table 8.
Private Facilities
The CMII documented 78 MRI units located in 71 private sites across Canada.
Private sites were mainly identified as privately funded, operating in 7 provinces: Alberta, British Columbia, New Brunswick, Nova Scotia, Ontario, Quebec, and Saskatchewan. Most private sites did not provide data on the operational or technical characteristics of equipment.
Mobile and Portable MRI Equipment
A mobile imaging unit consists of a van or mobile trailer designed to accommodate imaging equipment and can be deployed to multiple sites. A portable imaging unit can be wheeled to the bedside, allowing the acquisition of clinically meaningful examinations in space-constrained settings.
Across Canada, 6 publicly funded mobile MRI scanners, serving at least 16 communities, were documented by the CMII. Two of these mobile MRI units are in British Columbia, and the following provinces each have 1 mobile MRI unit: New Brunswick, Ontario, and Quebec. Some sites in Alberta and Saskatchewan are jointly served by 1 mobile unit.
There are at least 4 publicly funded portable MRI scanners across Canada; 2 are in Ontario and 1 is in British Columbia. One mobile MRI unit is operating as a fixed unit in Nova Scotia while a new permanent MRI unit is being installed. Some of these portable MRI units are being investigated for use in brain imaging and emergent medicine through pilot programs.
Inventory of MRI Equipment
MRI Unit and Exams in 2022–2023
Total Number of MRI Units in 2022–2023
A total of 432 MRI units were reported for 2022 to 2023, increasing from 378 units reported for 2019 to 2020.2
The provinces that reported the highest number of MRI units are Ontario and Quebec, with 157 and 123 units, respectively (Table 1 and Figure 5).
Canada has 10.8 MRI units per million population. The jurisdictions with the greatest density of MRI units per million are Yukon (22.5), Quebec (13.9), and New Brunswick (13.2) (Figure 5). This does not reflect accessibility, particularly in provinces with large rural and remote areas where travel to urban centres is required.
Table 1: Inventory of MRI for Public and Private Facilities in Canada, 2022 to 2023
Province or territory | Number of sites (private sites)a,b | Total units (private)c | Units per million population (private) | Populationd |
|---|---|---|---|---|
Alberta | 28 (10) | 43 (13) | 9.1 (2.8) | 4,703,772 |
British Columbia | 44 (12) | 55 (12) | 10.1 (2.2) | 5,437,722 |
Manitoba | 8 (0) | 14 (0) | 9.7 (0) | 1,444,190 |
New Brunswick | 9 (1) | 11 (1) | 13.2 (1.2) | 831,618 |
Newfoundland and Labrador | 5 (0) | 5 (0) | 9.4 (0) | 533,710 |
Northwest Territories | — | — | — | 45,668 |
Nova Scotia | 10 (1) | 11 (1) | 10.5 (1.0) | 1,047,232 |
Nunavut | — | — | — | 40,715 |
Ontario | 89 (11) | 157 (15) | 10.1 (1.0) | 15,500,632 |
Prince Edward Island | 1 (0) | 1 (0) | 5.7 (0) | 176,113 |
Quebec | 92 (32) | 123 (32) | 13.9 (3.6) | 8,831,257 |
Saskatchewan | 9 (4) | 11 (4) | 9 (3.3) | 1,221,439 |
Yukon | 1 (0) | 1 (0) | 22.5 (0) | 44,412 |
Canada | 296 (71) | 432 (78) | 10.8 (2.0) | 39,858,480 |
Notes: For the 2022–2023 survey, complete unit count data were available for 296 sites with MRI capacity out of 467 participating sites with advanced imaging capacity (i.e., SPECT-CT, SPECT, CT, MRI, PET-CT, PET-MRI).
Data were derived from the following survey question: “Do you have the following fixed, mobile, or portable units at the site?” Options included: CT, MRI, PET-CT, PET-MRI, SPECT-CT, and SPECT.
aPer-jurisdiction site availability was according to the validator, if the validator provided lists of sites with MRI availability; when these were unavailable, the data came from the survey and from private sites.
bA private units is one located in a health care facility that operates privately but is either privately or publicly funded.
cPer-jurisdiction MRI unit counts were according to the validator, if the validator provided lists of units; when these were unavailable, the data came from the survey and responses from private sites.
dEstimated population as of the first quarter of 2023.12
Figure 5: Units and Units per Million Population for MRI, 2022 to 2023
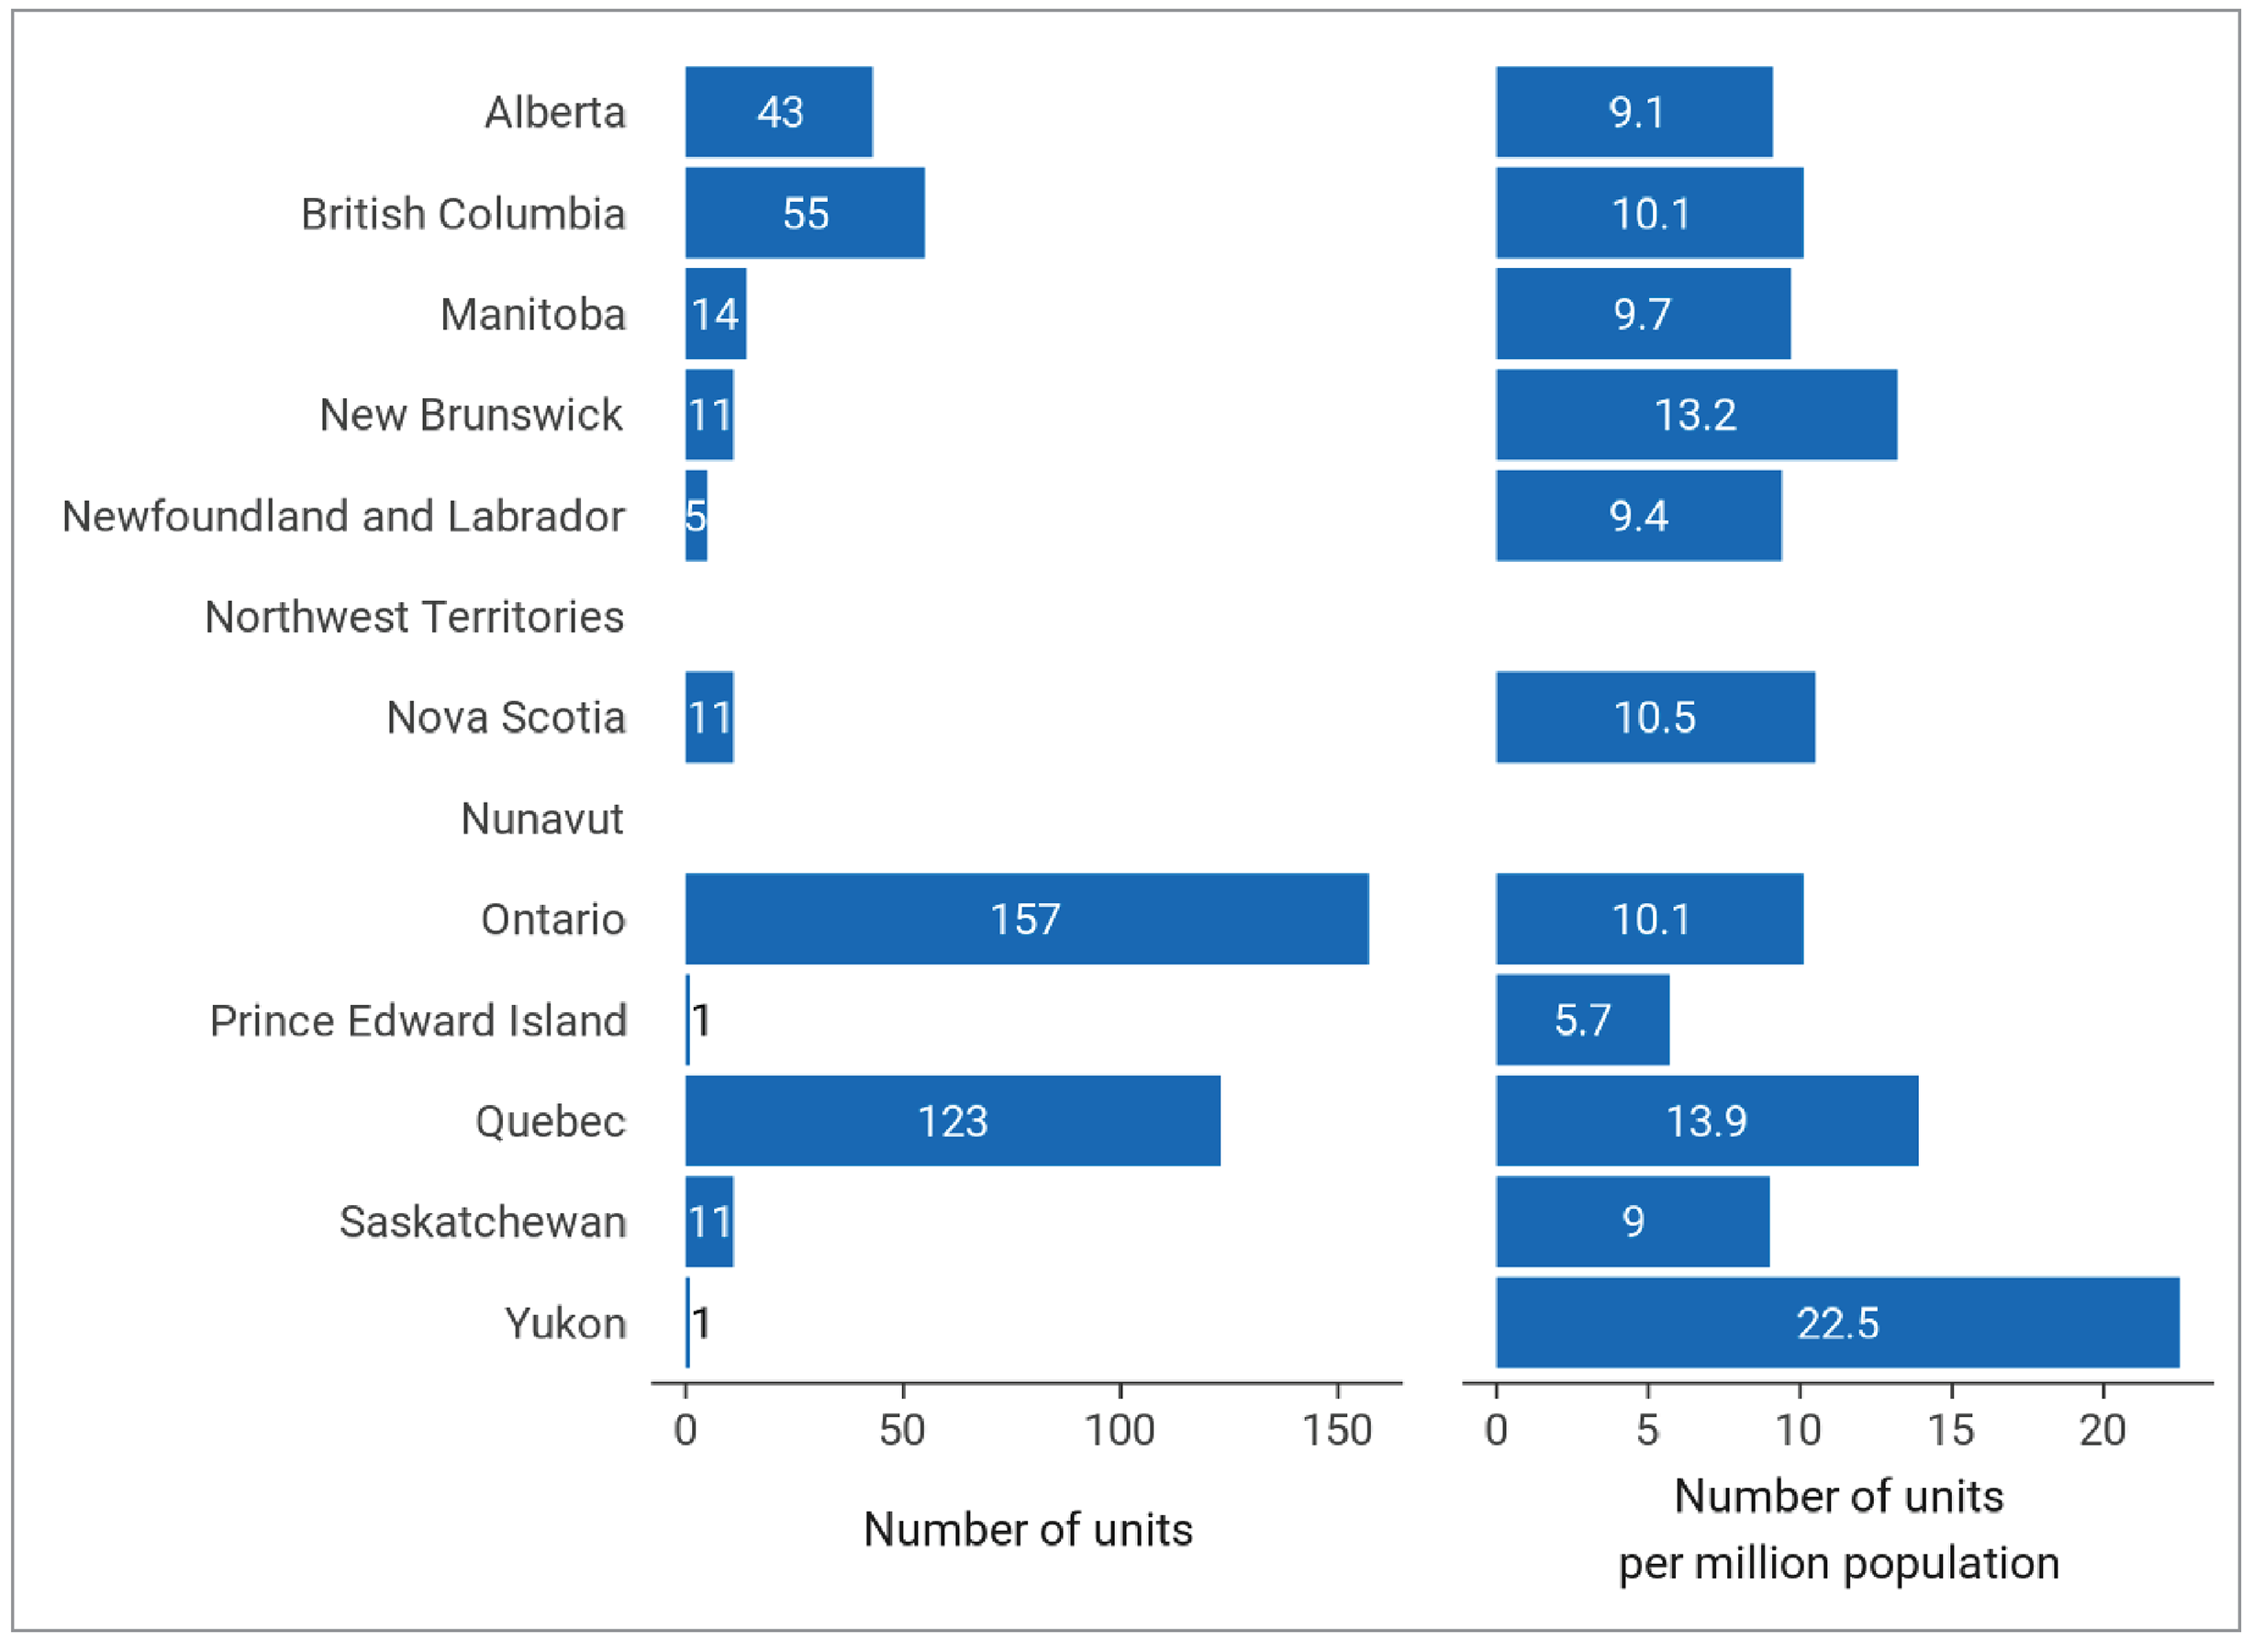
Notes: For the 2022 to 2023 survey, complete unit count data were available for 296 sites with MRI capacity out of 467 participating sites with advanced imaging capacity (i.e., SPECT-CT, SPECT, CT, MRI, PET-CT, PET-MRI).
Data were derived from the following survey question: “Do you have the following fixed, mobile, or portable units at the site?” Options included: CT, MRI, PET-CT, PET-MRI, SPECT-CT, and SPECT.
Total Volume of MRI Exams in Canada, 2022 to 2023
The total number of overall examinations and the total per capita (per 1,000 population) reported for MRI for the most recent fiscal (or calendar) year are presented in Table 2 and Figure 6.
A total of 2,214,157 MRI exams were performed, representing a national average of 55.6 exams per 1,000 population, ranging from 33 to 72 across all jurisdictions with capacity.
An average of 5,125 exams per MRI unit were conducted across Canada in 2022–2023.
Ontario, Quebec, and British Columbia had the highest volume of MRI exams of reporting jurisdictions with capacity in Canada, at 963,563; 450,947; and 299,061 exams, respectively.
Yukon, Manitoba, and Ontario had the highest density of MRI exams of reporting jurisdictions in Canada, at 72, 63.4, and 62.2 exams per 1,000 people, respectively.
The volume of exams conducted per unit is variable and may be impacted by several factors, such as number of MRI units per capita, geographic location of equipment, the facility type (i.e., specialized or tertiary care centres), and scope of clinical indications.
Table 2: Total Exams for the Latest Fiscal (Or Calendar) Year With Data Availability for MRI Across Canada for Public Facilities, 2022 to 2023
Province or territory | Populationa | Total examsb | Average exams per unit | Exams per 1,000 population |
|---|---|---|---|---|
Alberta | 4,703,772 | 231,033 | 5,372.9 | 49.1 |
British Columbia | 5,437,722 | 299,061 | 5,437.5 | 55.0 |
Manitoba | 1,444,190 | 91,497 | 6,535.5 | 63.4 |
New Brunswick | 831,618 | 49,376 | 4,488.7 | 59.4 |
Newfoundland and Labrador | 533,710 | 21,409 | 4,281.8 | 40.1 |
Northwest Territories | 45,668 | — | — | — |
Nova Scotia | 1,047,232 | 34,935 | 3,175.9 | 33.4 |
Nunavut | 40,715 | — | — | — |
Ontario | 15,500,632 | 963,563 | 6,137.3 | 62.2 |
Prince Edward Island | 176,113 | 5,803 | 5,803.0 | 33.0 |
Quebec | 8,831,257 | 450,947c | 3,666.2 | 51.1 |
Saskatchewan | 1,221,439 | 63,335 | 5,757.7 | 51.9 |
Yukon | 44,412 | 3,198 | 3,198.0 | 72.0 |
Canada | 39,858,480 | 2,214,157 | 5,125.4 | 55.6 |
Note: Complete exam volume data for public facilities was reported by validators for all jurisdictions with MRI capacity.
aEstimated population as of the first quarter of 2023.12
bData were derived from the number of units with reported exam data and from the following survey question: “For all units, how many examinations on average were conducted in the last fiscal/calendar year?”
cData from 2021 to 2022.
Figure 6: MRI Exams per Thousand Population for the Latest Fiscal (or Calendar) Year With Data Availability Across Canada in Public Facilities, 2022 to 2023
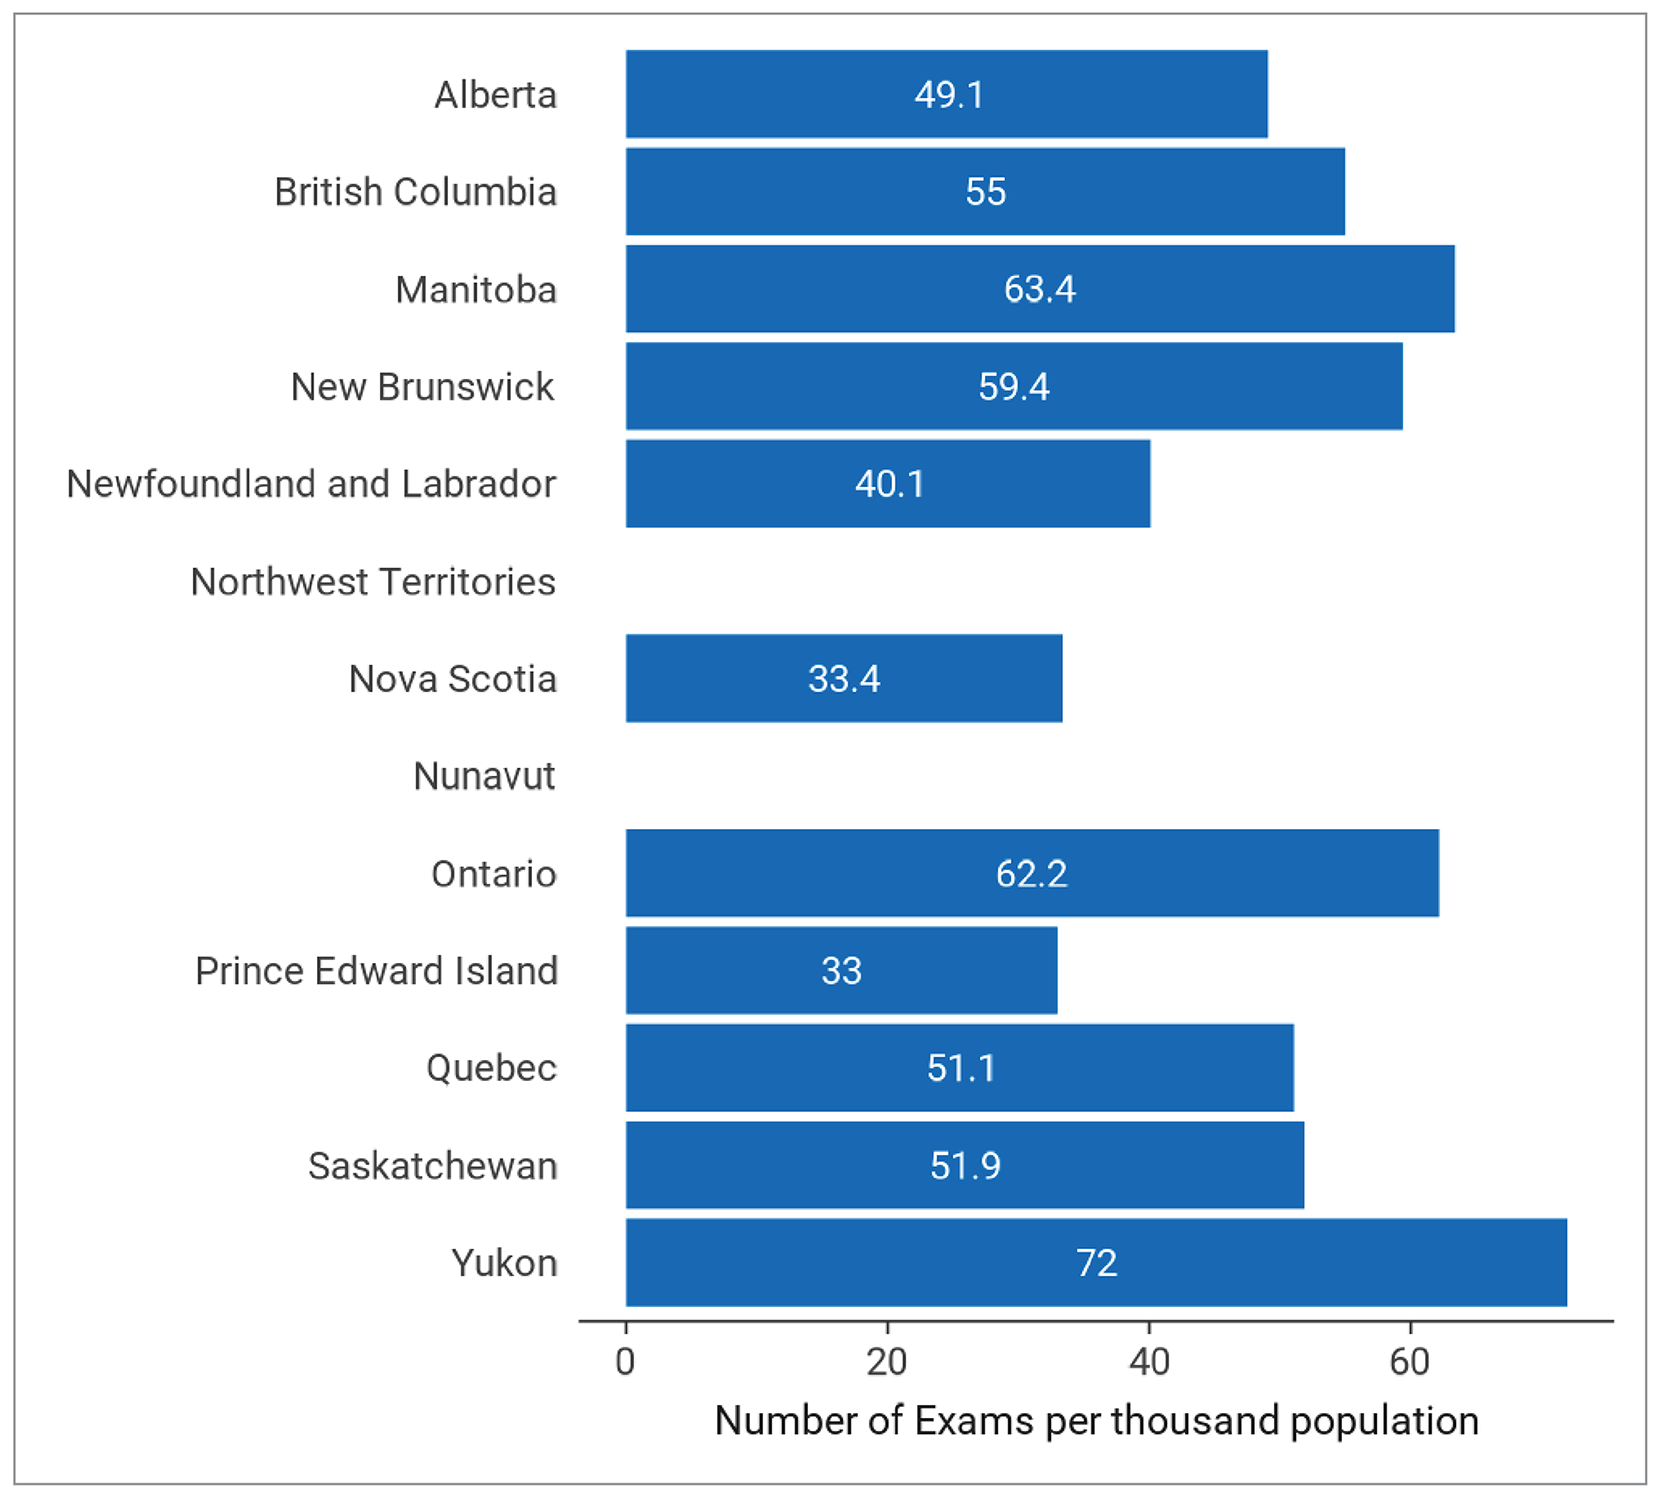
Notes: Complete exam volume data for public facilities were reported by validators for all jurisdictions with MRI capacity.
Data were derived from the following survey question: “For all units, how many examinations on average were conducted in the last fiscal/calendar year?”
Change in MRI Units and Exams Since 2015
Trends in Number of Units and Units per Million People, 2015 to 2022–2023
Information on the number of MRI units and units per million people between 2015 and 2022–2023 are presented in Appendix 3, Table 9.2,13,14
Since 2015, the number of MRI units in Canada has increased by 27.1%, from 340 to 432 units.
Between 2015 and 2022–2023, the number of units per million people has increased by 13.7%, from 9.5 to 10.8 units per million. During this time, Yukon, Quebec, and New Brunswick maintained some of the highest numbers of units per capita among jurisdictions with MRI capacity.
Since 2019–2020, Ontario and Quebec have experienced the greatest increases in number of units per million people out of all jurisdictions with MRI, increasing capacity by 18.8% and 15.8%, respectively.
Trends in Exam Volume and Exams per 1,000 People, 2015 to 2022–2023
Information on the number of MRI exams and exams per thousand people between 2015 and 2022–2023 are presented in Appendix 3, Table 10.2,13,14
Since 2015, the volume of MRI exams in Canada has increased by 13.4%, from 1,952,060 exams to 2,214,157 exams.
Between 2015 and 2022–2023, the number of exams per 1,0000 people has increased by 3%, from 54.0 to 55.6 exams per thousand. During this time, Ontario, Yukon, and Manitoba maintained some of the highest numbers of exams per capita among jurisdictions with MRI capacity. British Columbia experienced the highest growth per capita in this period, increasing by 67.2%, from 32.9 to 55.0.
Since 2019–2020, Yukon has experienced the highest increase in the volume of exams per capita among jurisdictions with MRI capacity, increasing by 25.7% from 57.3 to 72.0. British Columbia was the province with the greatest increase in the volume of exams per capita, increasing by 11.1% from 49.5 to 55.0.
Operation of MRI Equipment
Hours of Operation for MRI Equipment
Hours per Day and 24-Hour Use for MRI Units
MRI units operate an average of 15.3 hours per day in Canada, ranging from 2 to 24 hours across all jurisdictions with capacity (Appendix 3, Table 11). Information on hours of daily operation were available for 130 out of 296 sites. Table 27 (Appendix 4) presents the average daily hours operation reported for publicly funded sites with capacity only.
Ontario, British Columbia, Quebec, and Saskatchewan reported the highest average hours of use per day across all jurisdictions with capacity, at 18.1, 16.0, 15.8, and 15.8 hours, respectively (Appendix 3, Table 11).
About 80% of sites with MRI capacity in Canada reported use between 8 and 18 hours per day, 14.1% reported use more than 18 hours per day, and 5.2% reported use less than 8 hours per day (Figure 7). Data came from 135 sites that responded to this survey question.
Overall, 17.1% of sites reported MRI operation 24 hours a day (24 out of 140 sites, Figure 9 and Appendix 3, Table 12). Facilities with MRI equipment operating in emergency departments may report more use 24 hours a day, which may not be captured by the number of sites that responded to this survey question.
Figure 7: Percentage of Average Hours of Operation per 24-Hour Day of MRI Use by Category, 2022 to 2023
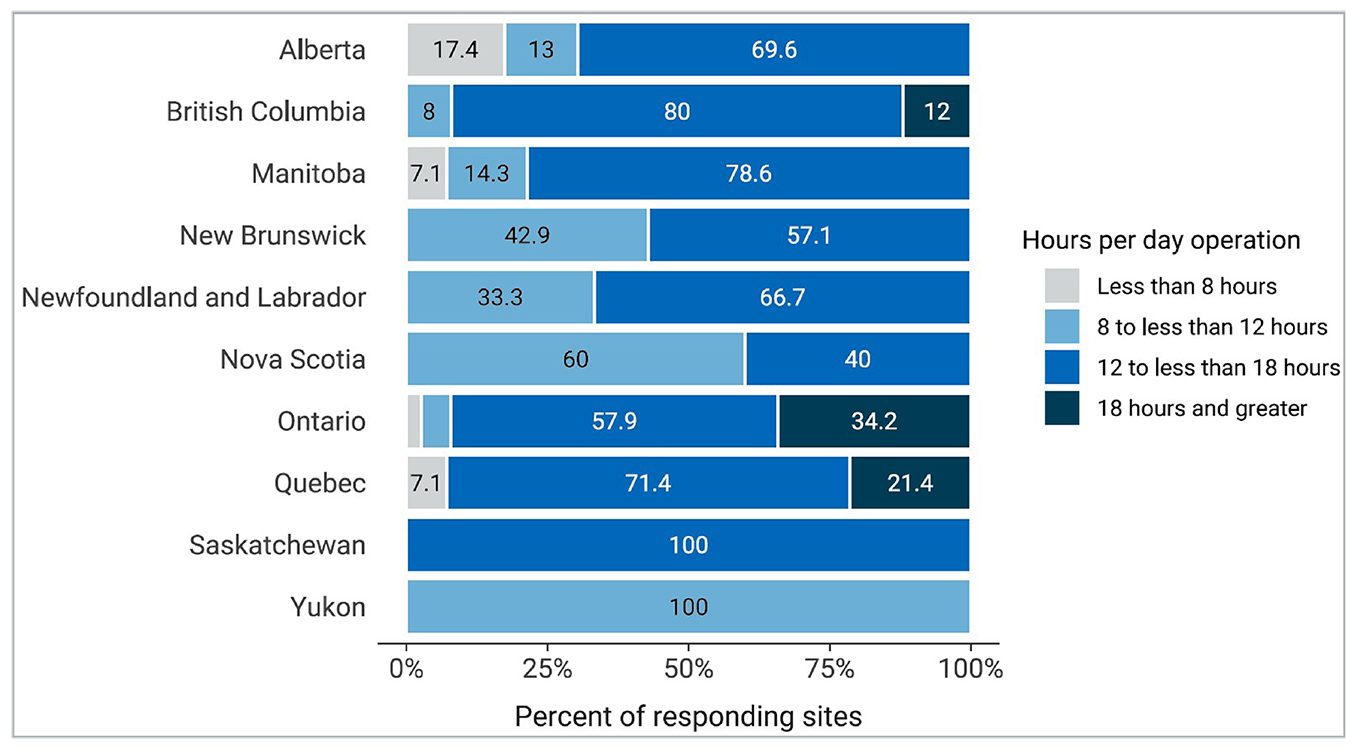
Notes: Survey response data were available for 135 out of 296 sites across 10 of the 11 jurisdictions with MRI capacity. No data were available for Prince Edward Island.
Data were derived from the following survey question: “In an average 24-hour day, how many hours are the units staffed through regular scheduled service capacity (do not include hours where staff are only on call)?”
Hours per Week and Weekend Use for MRI Units
MRI units are estimated to operate an average of 97.4 hours per week in Canada, ranging from 10 to 168 hours across jurisdictions with capacity (Appendix 3, Table 13). Information on hours of weekly operation were available for 129 out of 296 sites. Table 28 (Appendix 4) presents the average weekly hours of operation reported for only publicly funded sites with capacity.
Ontario, British Columbia, and Quebec reported the highest average hours of use per week of all jurisdictions with capacity, at 118.1, 108.0, and 99.6 hours, respectively (Appendix 3, Table 13).
About 74% of sites with MRI capacity in Canada reported use 80 hours or more per week, while 9.7% reported use between 60 and 80 hours per week, 10.4% reported 40 to 60 hours per week of use, and 6% reported less than 40 hours of use per week (Figure 8). Data were from 134 sites that responded to this survey question.
75.5% of responding sites reported the operation of MRI equipment on weekends (105 of 139 sites; Figure 9 and Appendix 3, Table 12).
Figure 8: Percentage of Average Hours of Operation per Week of MRI Use by Category, 2022 to 2023
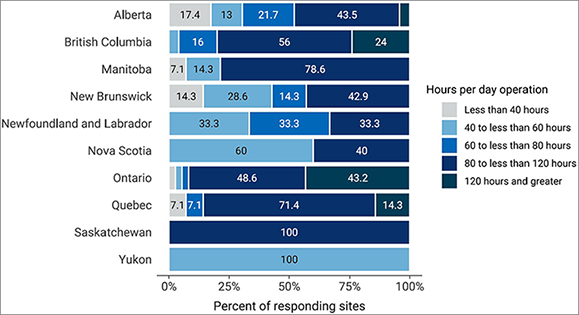
Notes: Survey response data were available for 134 out of 296 sites across 10 of the 11 jurisdictions with MRI capacity. No data were available for Prince Edward Island.
Data were derived from the following survey question: “In an average 168-hour week, how many hours are the [modality] units staffed through regular scheduled service capacity (do not include hours where staff are only on call)?”
Figure 9: Percentage of Sites That Operate 24-Hours per Day and Weekend MRI Use, 2022 to 2023
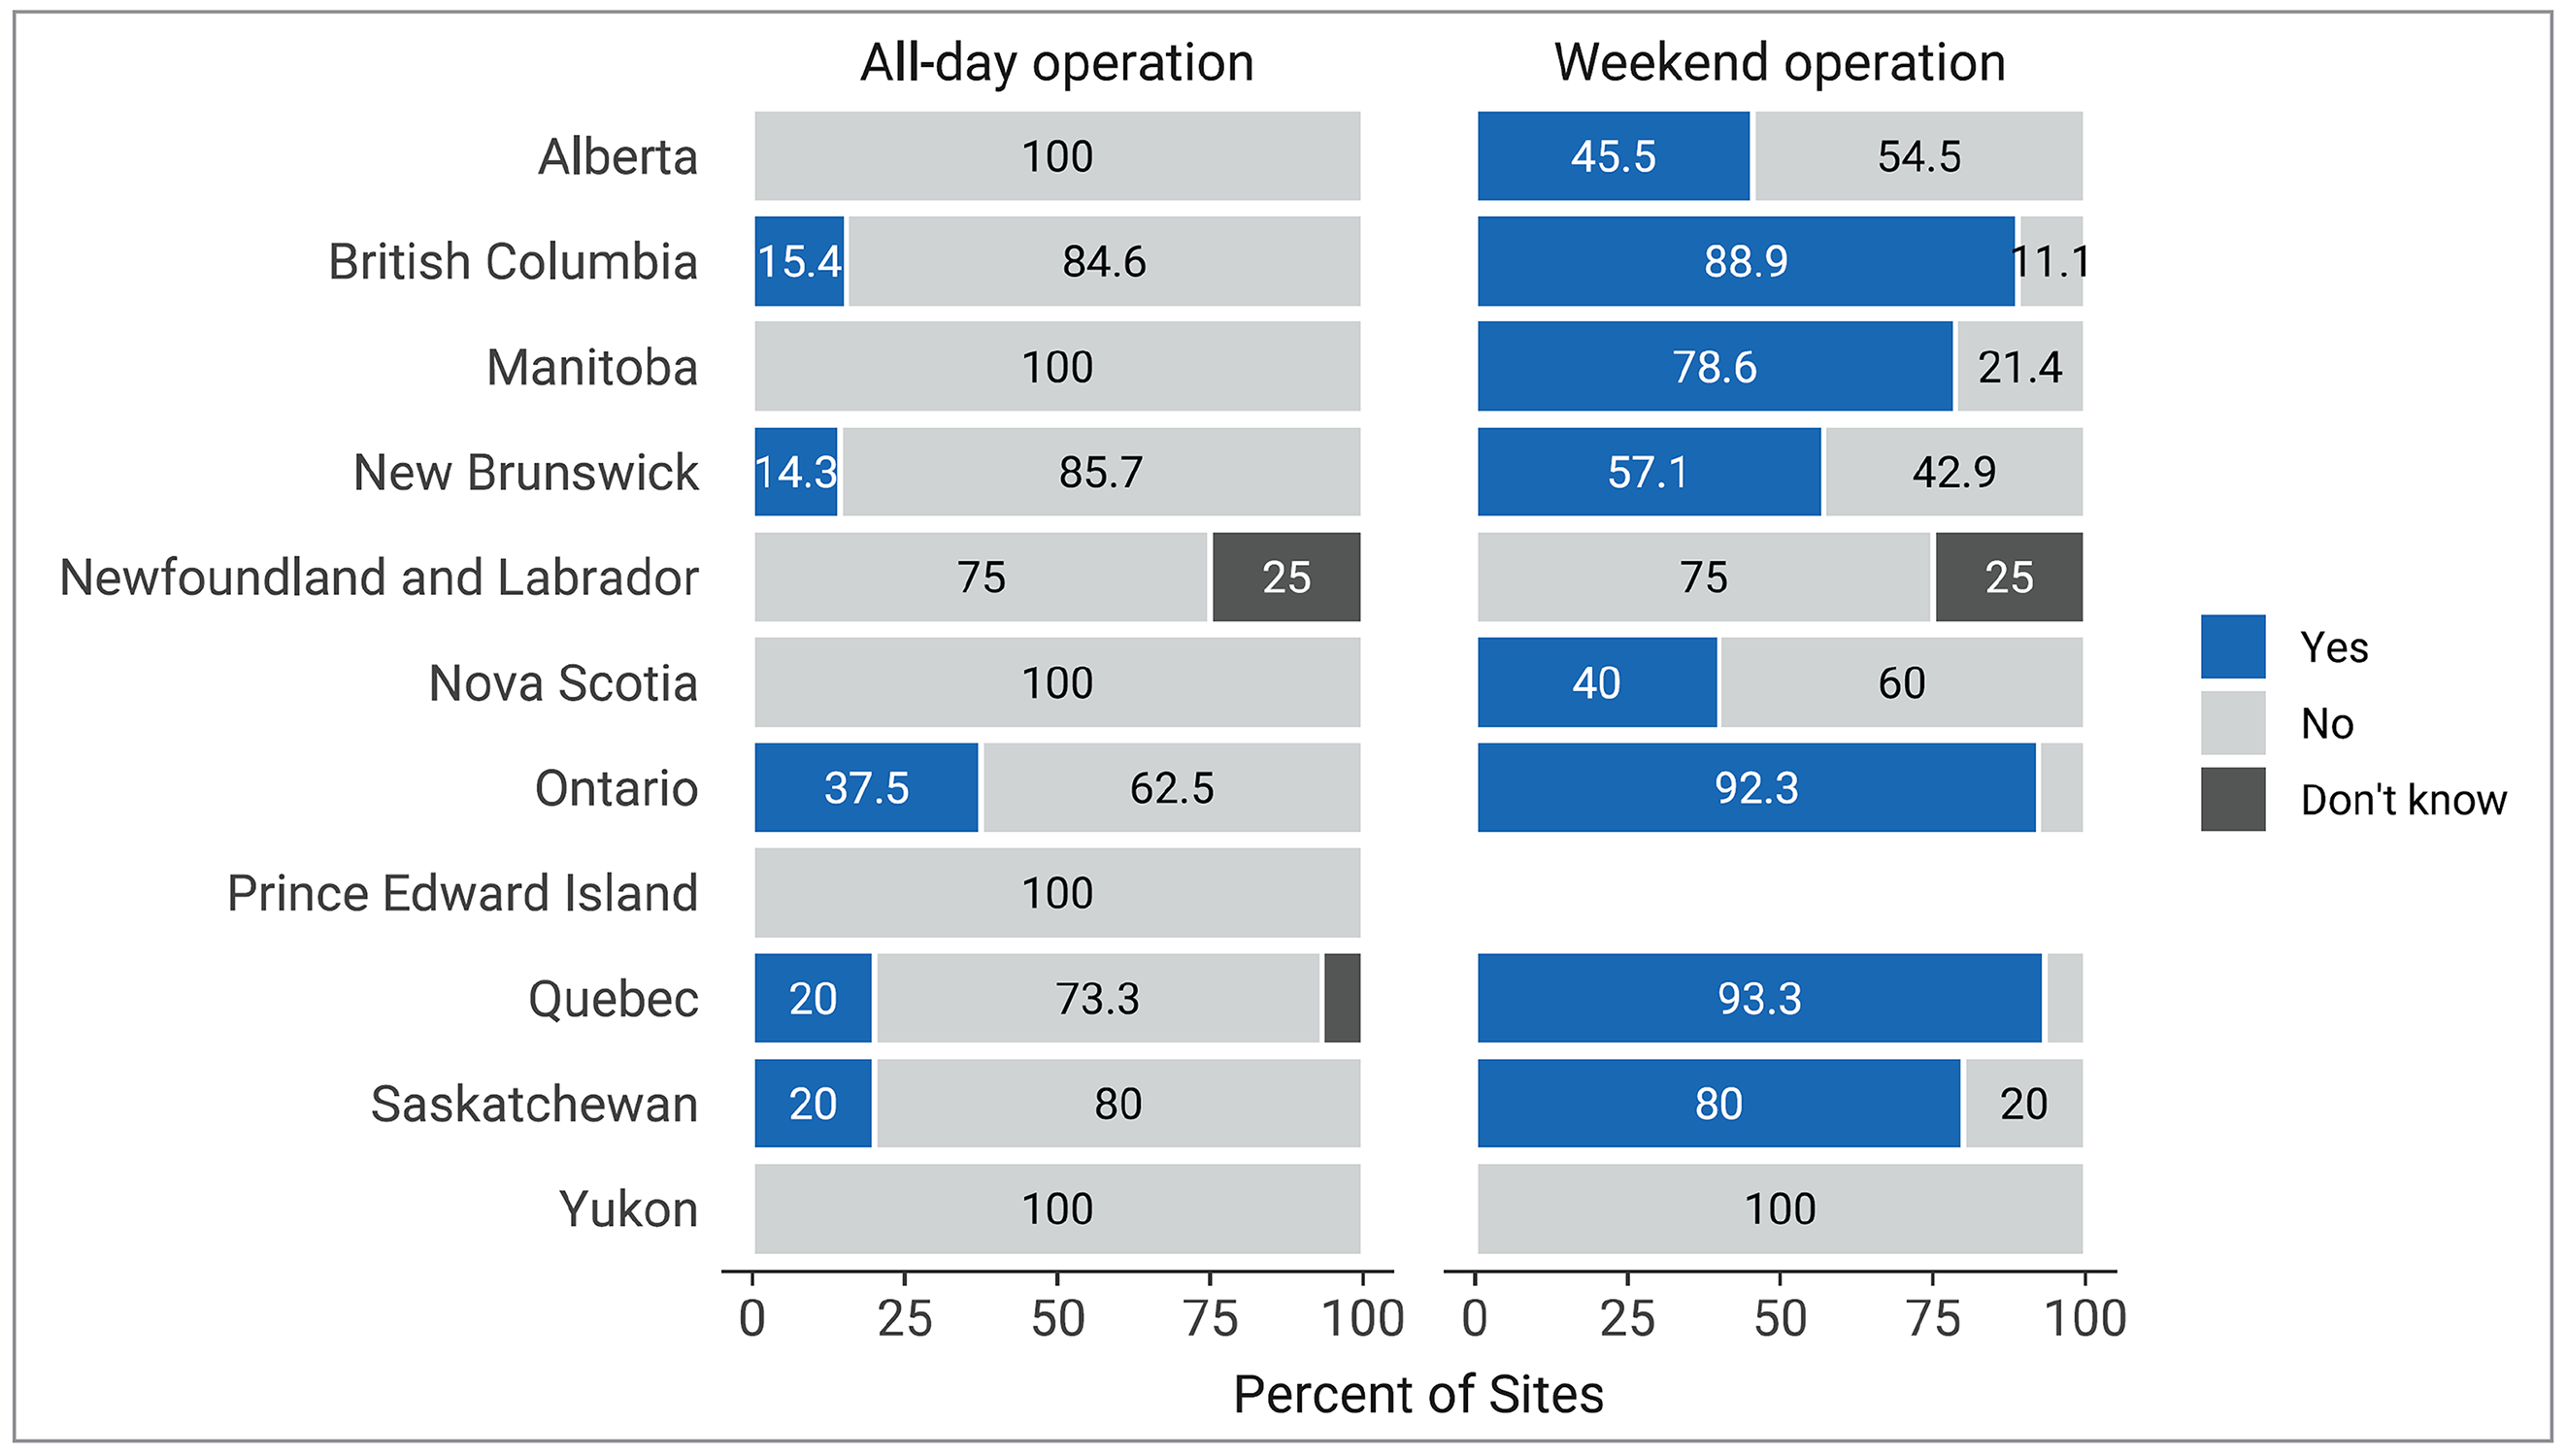
Notes: Survey response data for operation 24 hours a day were available for 140 out of 296 sites across all jurisdictions with MRI capacity. Survey response data for weekend operation were available for 139 out of 296 sites across 10 of the 11 jurisdictions with MRI capacity. No data were available for Prince Edward Island.
Data were derived from the following survey questions: “Do any units operate 24 hours a day?” and “Do any units operate on the weekend?”
Annual Planned and Unplanned Downtime for MRI Units
MRI Annual Downtime
The average planned downtime for MRI units is 28.9 hours per year, ranging from 4 to 120 hours across 115 sites with reported data (Figure 10 and Appendix 3, Table 14).
The average unplanned downtime is 102.5 hours per year, ranging from 1 to 1,500 hours across 103 sites with reported data. One site in British Columbia reported unplanned downtime exceeding 1,000 hours due to the unit operating beyond its expected life, requiring frequent repair along with insufficient staffing to operate the unit.
Some commonly reported reasons for unplanned downtime for MRI units include equipment and system failure, hardware and/or software issues, and issues with chillers.
Figure 10: Average Downtime at Sites With MRI Units by Reporting Jurisdictions With Capacity, 2022 to 2023
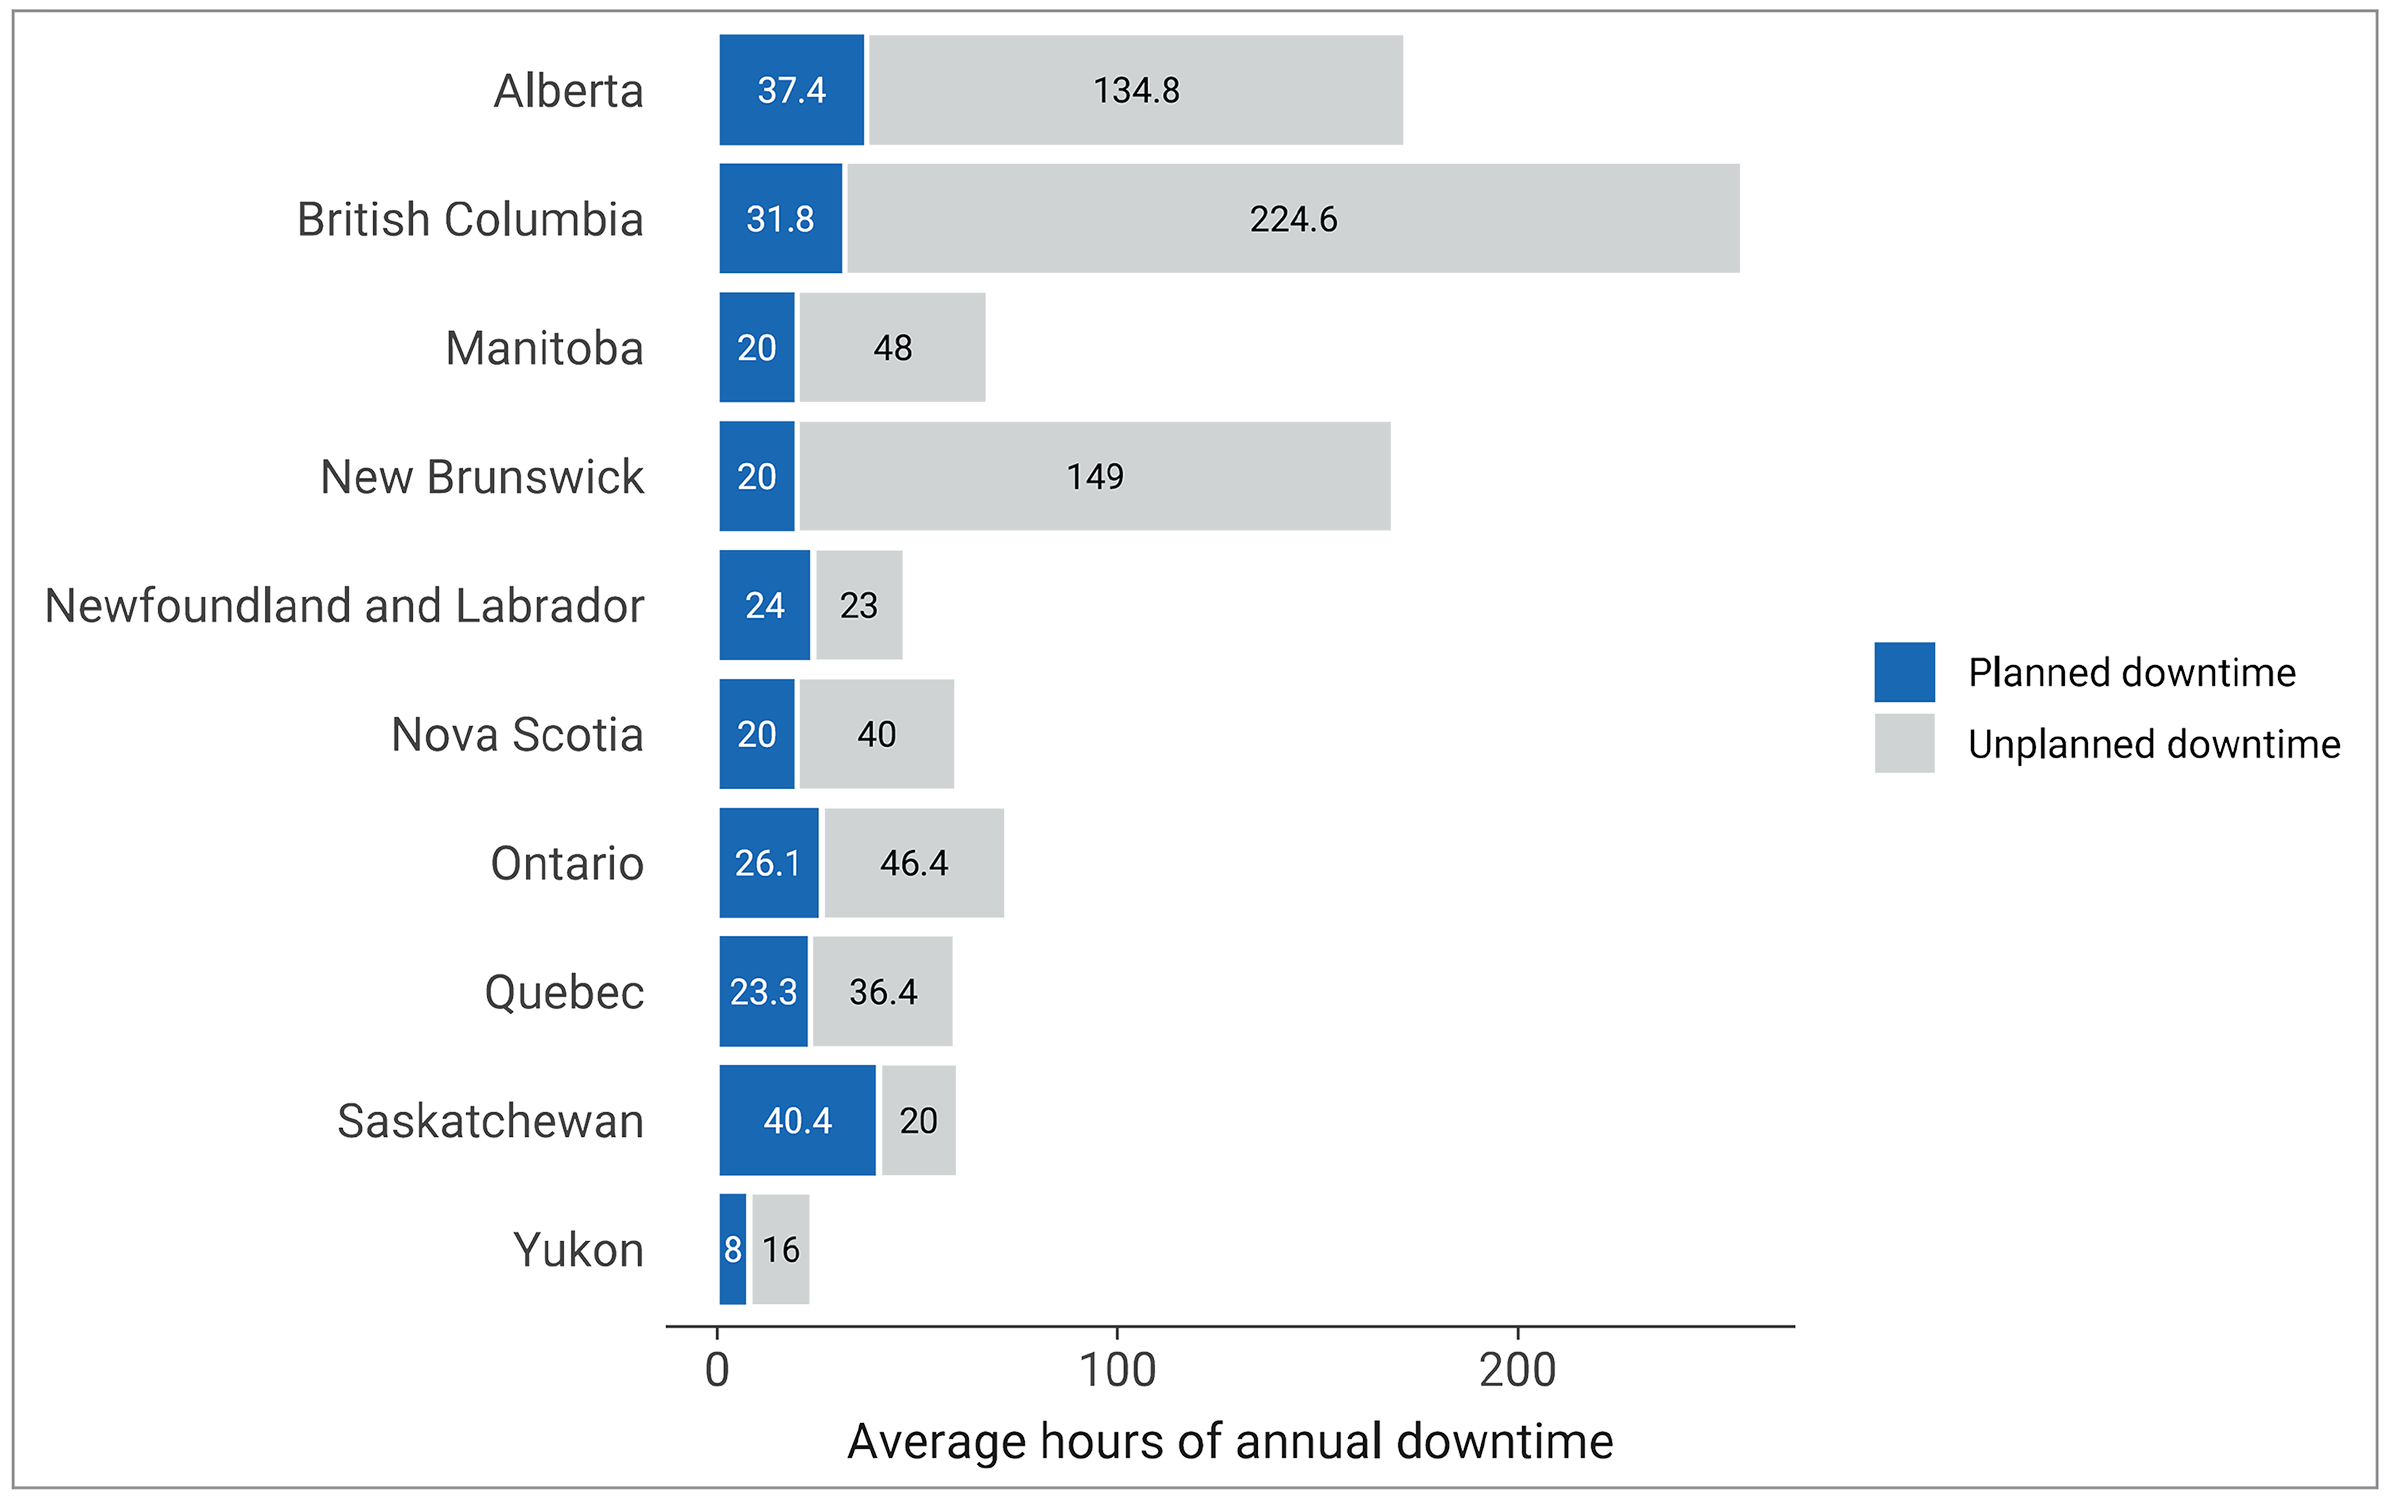
Notes: Survey response data for planned downtime were available for 115 out of 296 sites across 10 of the 11 jurisdictions with MRI capacity. No data were available for Prince Edward Island. Survey response data for unplanned downtime were available for 103 out of 296 sites across 10 of the 11 jurisdictions with MRI capacity. No data were available for Prince Edward Island.
Data were derived from the following survey questions: “How much planned downtime is anticipated for scheduled maintenance for all units in a given year? (expressed in hours)” and “How much unplanned downtime is experienced for all units in a given year? (expressed in hours)”.
Equipment Servicing at Sites With MRI Units
The routine maintenance, inspection, and calibration of imaging equipment is usually managed through different types of equipment service agreements. Equipment servicing is part of health technology management and is intended to optimize the use of imaging equipment across its life cycle. Survey participants were asked to report on methods of servicing imaging equipment. The servicing methods included à la carte, full vendor, insurance, managed service contracts, shared service, third party, under warranty, and others. Definitions for the types of servicing methods are available in Appendix 2.
These data were reported at the modality level rather than the unit level. We received feedback indicating that, at sites where there is more than 1 MRI unit, in some instances different servicing agreements may be used for different units.
For MRI, the most commonly reported equipment servicing method was full vendor support, with 69.5% of sites, followed by shared service (20.6%), other (5%), managed equipment service (3.5%), warranty (0.7%), and third party (0.7%) (Table 3).
Table 3: Imaging Equipment Servicing Methods at Sites With MRI Units by Reporting Jurisdictions With Capacity, 2022 to 2023
Province or territory | Full vendor service contract n (%) | Shared service (between vendor and in-house or a third party) n (%) | Managed equipment service n (%) | Under warranty n (%) | Third party n (%) | Other n (%) |
|---|---|---|---|---|---|---|
Alberta | 22 (100) | 0 (0) | 0 (0) | 0 (0) | 0 (0) | 0 (0) |
British Columbia | 16 (59.3) | 11 (40.7) | 0 (0) | 0 (0) | 0 (0) | 0 (0) |
Manitoba | 1 (7.1) | 7 (50) | 0 (0) | 0 (0) | 0 (0) | 6 (42.9) |
New Brunswick | 7 (100) | 0 (0) | 0 (0) | 0 (0) | 0 (0) | 0 (0) |
Newfoundland and Labrador | 3 (100) | 0 (0) | 0 (0) | 0 (0) | 0 (0) | 0 (0) |
Northwest Territories | — | — | — | — | — | — |
Nova Scotia | 8 (100) | 0 (0) | 0 (0) | 0 (0) | 0 (0) | 0 (0) |
Nunavut | — | — | — | — | — | — |
Ontario | 26 (66.7) | 5 (12.8) | 5 (12.8) | 1 (2.6) | 1 (2.6) | 1 (2.6) |
Prince Edward Island | 1 (100) | 0 (0) | 0 (0) | 0 (0) | 0 (0) | 0 (0) |
Quebec | 10 (71.4) | 4 (28.6) | 0 (0) | 0 (0) | 0 (0) | 0 (0) |
Saskatchewan | 3 (60) | 2 (40) | 0 (0) | 0 (0) | 0 (0) | 0 (0) |
Yukon | 1 (100) | 0 (0) | 0 (0) | 0 (0) | 0 (0) | 0 (0) |
Canada | 98 (69.5) | 29 (20.6) | 5 (3.5) | 1 (0.7) | 1 (0.7) | 7 (5.0) |
Notes: Survey response data were available for 141 out of 296 sites across all jurisdictions with MRI capacity.
Data were derived from the following survey question: “How is imaging equipment serviced?”
Full-time Equivalent Medical Radiation Technologists for MRI Units
Sites were asked to provide information on the number of full-time equivalent (FTE) medical radiation technologists (MRTs) assigned at the site level. An FTE position for an MRT was defined as an 8-hour workday, 5 days per week. The reported number of FTE MRTs may not reflect the total number of filled FTE MRTs in jurisdictions with MRI capacity, but rather the total number of budgeted positions.
For MRI, an average of 7 FTE MRTs are assigned per site, ranging between 2 to 23 (Table 4).
Table 4: Numbers of FTE MRTs for MRI, 2022 to 2023
Province or territory | Number of reporting sites | Total FTE MRTs | Average FTE MRTs per site (minimum to maximum) | FTE MRTs per million populationa | Total MRI unitsb |
|---|---|---|---|---|---|
Alberta | 19 | 142 | 7.5 (2 to 22) | 30.2 | 43 |
British Columbia | 27 | 211 | 7.8 (3 to 23) | 38.8 | 55 |
Manitoba | 9 | 79 | 5.8 (2 to 13) | 54.7 | 14 |
New Brunswick | 7 | 31 | 4.4 (2 to 8) | 37.3 | 11 |
Newfoundland and Labrador | 3 | 12 | 4 (4 to 4) | 22.5 | 5 |
Northwest Territories | — | — | — | — | — |
Nova Scotia | 5 | 20 | 4 (2 to 5) | 19.1 | 11 |
Nunavut | — | — | — | — | — |
Ontario | 36 | 261 | 7.2 (2 to 19) | 16.8 | 157 |
Prince Edward Island | 1 | 3 | 3 (3 to 3) | 17.0 | 1 |
Quebec | 13 | 80 | 6.2 (2 to 22) | 9.1 | 123 |
Saskatchewan | 5 | 45 | 9 (3 to 18) | 36.8 | 11 |
Yukon | 1 | 2 | 2 (2 to 2) | 45.0 | 1 |
Canada | 126 | 886 | 6.8 (2 to 23) | 22.2 | 432 |
FTE = full-time equivalent; MRT = medical radiation technologist.
Notes: Survey response data were available for 126 out of 296 sites across all jurisdictions with MRI capacity.
Data were derived from the following survey question: “How many full-time equivalent (FTE) technologists are assigned to all units (collective number of FTEs for all units)?”
aEstimated population as of the first quarter of 2023.12
bUnit counts included all sites that participated in the national survey that reported information for number of units.
Age of MRI Equipment
Average Age of MRI
The estimated average age of MRI equipment in Canada is 8.4 years, ranging between 0 and 23 years (Appendix 3, Table 15). Nearly two-thirds (62.8%) of MRI units were reported to be operational within the previous 10 years, and almost a quarter (23.3%) began operation between 11 to 15 years prior (Figure 11 and Appendix 3, Table 16). Table 29 (Appendix 4) presents the average age of MRI equipment for publicly funded sites.
In 2022–2023, 24 units were installed across Canada in 5 jurisdictions: Alberta, British Columbia, New Brunswick, Ontario, and Quebec.
Figure 11: Percentage of Average Years of MRI Operation by Province and Territory, 2022 to 2023
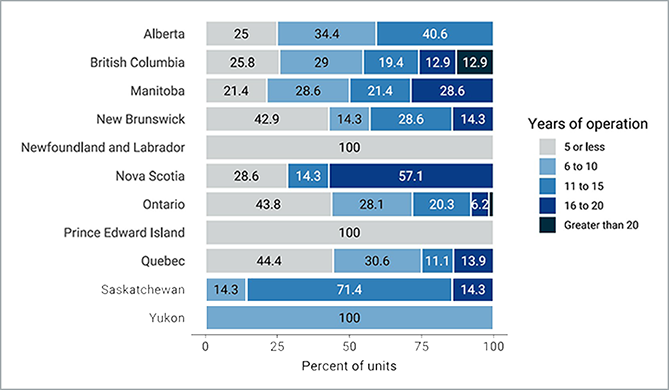
Notes: Survey response data were available for 202 of 432 MRI units across all jurisdictions with capacity.
Age for each unit was calculated from the following survey question: “What year did (or will) the [modality] unit become operational?” subtracted from 2023.
Patterns of Use of MRI Equipment
Purpose and Indication for MRI Units
Purpose of MRI Use
For all sites that provided exam use data, on average, MRI exams were most often indicated for neurologic exams, at 28.0% (use at individual sites ranged from 0% to 100%), followed by musculoskeletal exams at 23.2% (range, 0% to 78%) and oncology exams at 16.6% (range, 0% to 50%) (Figure 12 and Appendix 3, Table 17).
For all sites that provided use data, on average, MRI was most often used for diagnostic noncardiac purposes (90.6%), followed by diagnostic cardiac purposes (5.2%) and research purposes (2.0%) (Figure 13 and Appendix 3, Table 18).
Figure 12: MRI Use by Clinical Specialty, 2022 to 2023
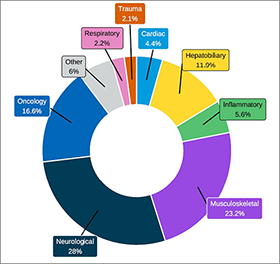
Notes: Survey response data on the average percentage of MRI use by discipline were available for 56 out of 296 sites across 9 of the 11 jurisdictions with MRI capacity. No data were available for Prince Edward Island or the Yukon.
Data were derived from the following survey question: “On average, what percentage of these exams fall into the following categories? The total percentage, expressed as a number, must add up to 100.” The following categories were offered: oncology, respiratory, hepatobiliary, musculoskeletal, inflammatory or infectious disease, neurologic, cardiac, trauma, and other.
Figure 13: Purpose of MRI Use by Category, 2022 to 2023
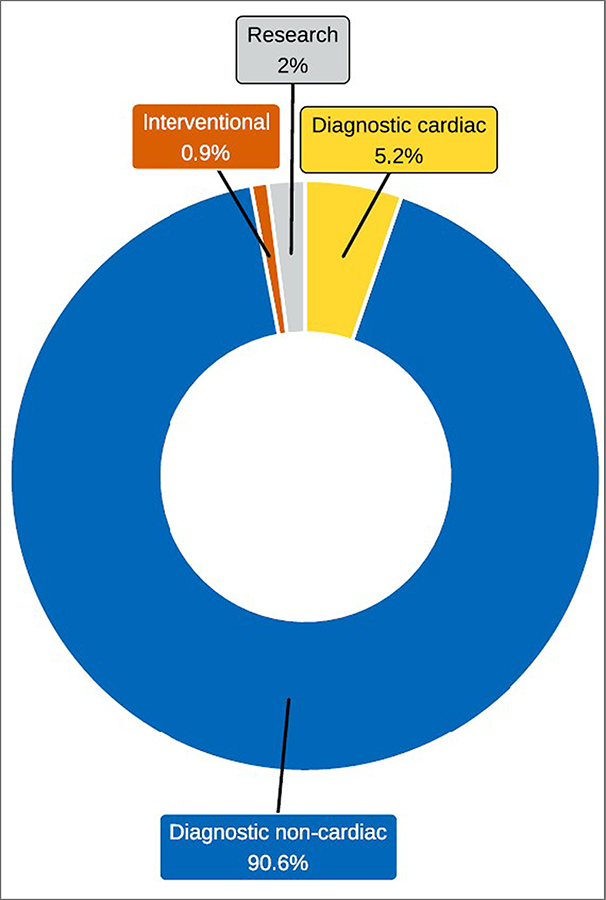
Notes: Survey response data on the average percentage of MRI use by discipline were available for 117 out of 296 sites across 10 of the 11 jurisdictions with MRI capacity. No data were available for Prince Edward Island.
Data were derived from the following survey question: “Based on your practice in the last fiscal year, what percentage of time are all units used for? The total percentage, expressed as a number, must add up to 100.” The following categories were offered: diagnostic purposes (cardiac only), diagnostic purposes (noncardiac), research, interventional, and other.
Integration of Use of AI in MRI
AI is a branch of computer science concerned with the development of systems that can perform problem-solving, reasoning, and recognition tasks.15,16 The current focus of AI in medical imaging departments in Canada includes, but is not limited to, assisting imaging professionals in, reading and interpreting images, image reconstruction, planning treatment, predicting outcomes, and carrying out administrative tasks.15,16
Survey participants were asked to report on the use of AI for MRI in the clinical and/or research setting. Most sites either did not respond to the questions on AI use or answered with “no,” indicating that it was not used.
Use of AI for MRI
Data available for sites with MRI capacity that answered this question are provided in Appendix 3, Table 19.
Overall, 29 sites (24.2%) located in 6 provinces reported the use of AI with MRI in the clinical setting for image reconstruction, and 8 sites (6.6%) in 4 provinces reported the use of AI for reading and interpreting images.
Two sites in Ontario used AI with MRI in the research setting for reading and interpreting images, and 1 of these sites reported the use of AI in image reconstruction, treatment planning, predicting outcomes, and administrative tasks as well.
Ordering and Receiving Exams
Exam-Ordering Privileges at Sites With MRI Units
Jurisdictional validators were asked to provide details on which regulated health professionals working in the public setting were authorized to order MRI exams in their jurisdictions. Responses are summarized in Appendix 3, Table 20. The results show that:
all clinical specialists in all jurisdictions that operate MRI units are authorized to order MRI exams
family doctors, general practitioners, and nurse practitioners can order MRI exams in all jurisdictions, although in some jurisdictions, there may be some restrictions, such as for specific indications or with approval from a radiologist or other specialist; no data were provided for New Brunswick
dentists, chiropractors, podiatrists, and podiatric surgeons can order MRI exams in Alberta and British Columbia; in Saskatchewan, chiropractors can order MRI exams if recommended by a radiologist or specialist; and in Alberta, physiotherapists with enhanced practice are also able to order MRI exams
in the Northwest Territories and Nunavut, referrals for MRI exams are made for out-of-territory units.
No data were received for Ontario. For New Brunswick, the responses came from 1 of the 2 regional health authorities, the Horizon Health Network.
How Exam Requests Are Received at Sites With MRI Units
Survey participants were asked to report their exam-ordering practices from the following options: requests by automated order entry, paper, fax, telephone, and centralized order entry for some, or all, exams.
For MRI exam requests, the most commonly reported ordering practices were fax (97%), paper (89.6%), and centralized order entry booking (66.9%), based on 138 sites with responses to this question (Figure 14 and Appendix 3, Table 21).
Figure 14: Summary of MRI Exam-Ordering Practices at Sites that Reported a Process, 2022 to 2023
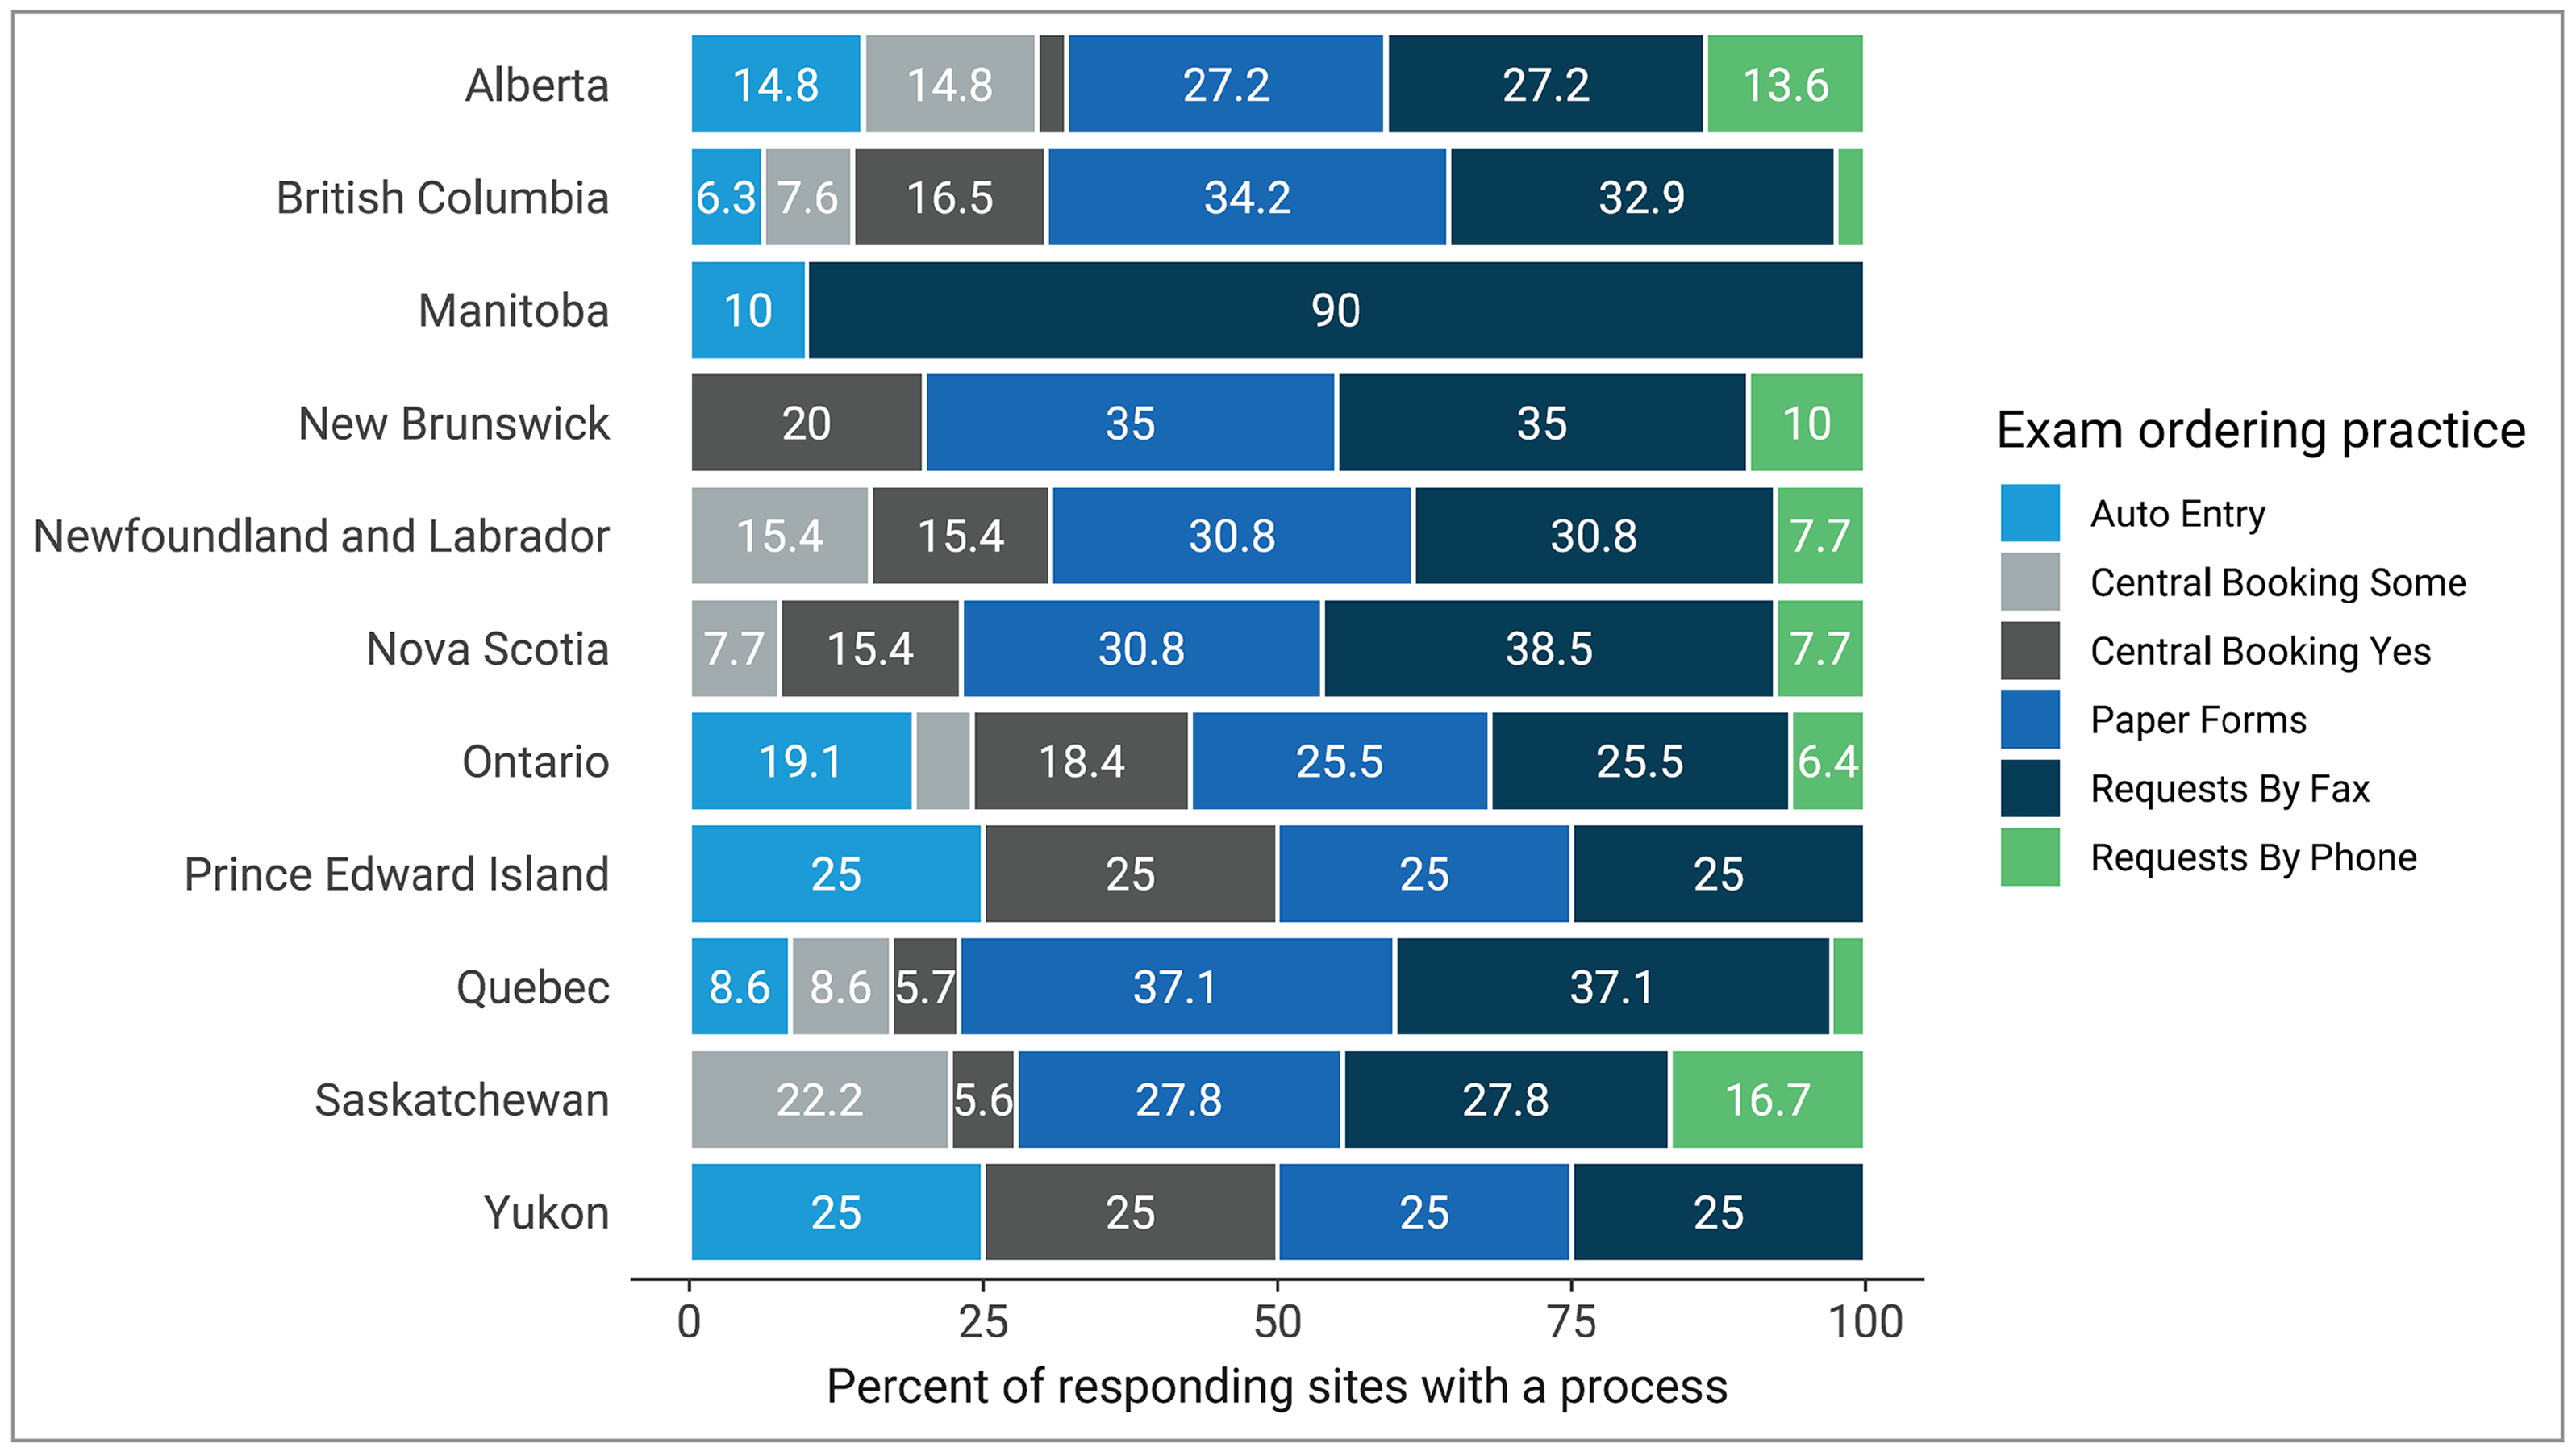
Notes: Survey response data were available for 138 out of 296 sites across all jurisdictions with MRI capacity.
Data were derived from the following survey questions: “Are automated order entry forms (exams request) used?”; “Are paper forms (exams requests) used?”; “Are requests received by fax?”; “Are requests received by phone?”; and “Is a centralized order entry (booking) system used? For all exams: Yes/no; For some exams: yes/no.”
Appropriateness and Quality Assurance Tools for MRI
As imaging exam volumes have continued to increase in Canada, so has the reported rate of low-value exam referrals, which can impact exam wait times.17 To help minimize low-value imaging, appropriateness processes, clinical decision support tools (CDSTs), and peer-review programs may be implemented.
Use of CDSTs in MRI
A CDST is a tool that provides real-time guidance to physicians on the appropriateness of diagnostic imaging tests for a given patient during the ordering process.2
Twenty-six out of 134 sites (19.4%) reported that referring physicians use CDSTs for ordering MRI exams (Table 5).
Use of Peer Learning in MRI
Peer learning is a tool that is widely used in diagnostic imaging. Radiologists undertake peer review as part of the peer-learning workflow, often anonymously, in clinical practice to provide ongoing feedback to improve performance, reduce discrepancy and error, maintain standards, provide credibility, support learning, and identify gaps in education.18
Eighty-nine out of 151 sites (58.9%) with MRI reported peer review of images for quality assurance (Table 5).
Table 5: Use of CDSTs and Peer Learning at Sites With MRI, 2022 to 2023
Province or territory | CDST | Peer review | ||
|---|---|---|---|---|
Number of sites reporting “yes” (% of sites) | Number of reporting sites | Number of sites reporting “yes” (% of sites) | Number of reporting sites | |
Alberta | 0 (0) | 22 | 7 (31.8) | 22 |
British Columbia | 7 (25) | 28 | 25 (86.2) | 29 |
Manitoba | 9 (100) | 9 | 2 (22.2) | 9 |
New Brunswick | 1 (14.3) | 7 | 3 (37.5) | 8 |
Newfoundland and Labrador | 0 (0) | 4 | 0 (0) | 5 |
Northwest Territories | — | — | — | — |
Nova Scotia | 0 (0) | 5 | 4 (57.1) | 7 |
Nunavut | — | — | — | — |
Ontario | 7 (18.9) | 37 | 38 (80.9) | 47 |
Prince Edward Island | 0 (0) | 1 | 0 (0) | 1 |
Quebec | 0 (0) | 15 | 8 (47.1) | 17 |
Saskatchewan | 2 (40) | 5 | 1 (20) | 5 |
Yukon | 0 (0) | 1 | 1 (100) | 1 |
Canada | 26 (19.4) | 134 | 89 (58.9) | 151 |
CDST = clinical decision support tool.
Notes: Survey response data about CDSTs were available for 134 out of 296 sites across all jurisdictions with MRI capacity. Survey response data about peer review were available for 151 out of 296 sites across all jurisdictions with MRI capacity.
CDST data were derived from the following survey question: “Is a clinical decision support tool used at the point of care by medical professionals referring patients to medical imaging? A clinical decision support tool provides real-time guidance to physicians on the appropriateness of diagnostic imaging tests for a given patient during the ordering process.” Options were: yes, no, and don’t know. Additional data were supplemented from the following survey question: “Do you have a process for determining the appropriateness of orders that are received? If yes, which process is used?”
Peer review data were derived from the following survey question: “Do radiologists at your facility participate in a peer review program for image reading and interpretation for the purpose of quality assurance?” Options were: yes, no, and don’t know.
Picture Archiving and Communication Systems
A picture archiving and communication system (PACS) is an electronic system used to digitally manage images, including transmission, filing, storage, distribution, and retrieval of medical images. A detailed definition is provided in Appendix 2.
Sites with MRI capacity were asked whether medical images were stored on a PACS and accessible throughout the jurisdiction in which the site operates. Data were available for 189 sites with PACS, showing that:
84.7% of responding sites with MRI capacity reported PACS access throughout the provincial health care system without the need of manual retrieval (155 of 183 sites)
23.2% of sites reported local access to PACS (36 of 155 sites)
33.5% of sites had regional access to PACS (52 of 155 sites)
43.2% of sites had intraprovincial access to PACS (67 of 155 sites)
97.3% of sites reported that PACS images were accessible to referring physicians located in areas of the hospital outside of diagnostic imaging (181 of 186 sites).
Technical Characteristics of MRI Equipment
MRI technology uses powerful magnetic and radiofrequency fields to produce detailed images of the body.1,19 The magnetic field strength of an MRI machine informs the quality of images produced, with imaging resolution increasing in proportion to an MRI’s field strength.
Magnetic field strengths less than 1.0 tesla (T) are considered lower strength and generate lower image resolution with increased scan time compared to higher strength magnetic fields of 1.0 T or greater. However, MRI scanners with lower field strengths are less expensive, do not require the use of helium, and offer improved patient comfort and visibility.
Lower-strength MRI units typically use an open-bore configuration, which is wider and has greater head room than a closed-bore configuration, alleviating discomfort, anxiety, or feelings of claustrophobia. However, the quality of images produced by an open-bore scanner is inferior to that produced by a closed-bore scanner.
Survey participants were asked to report on the technical specifications of MRI units, including magnetic field strength and scanner configuration.
Technical Specifications of MRI Units
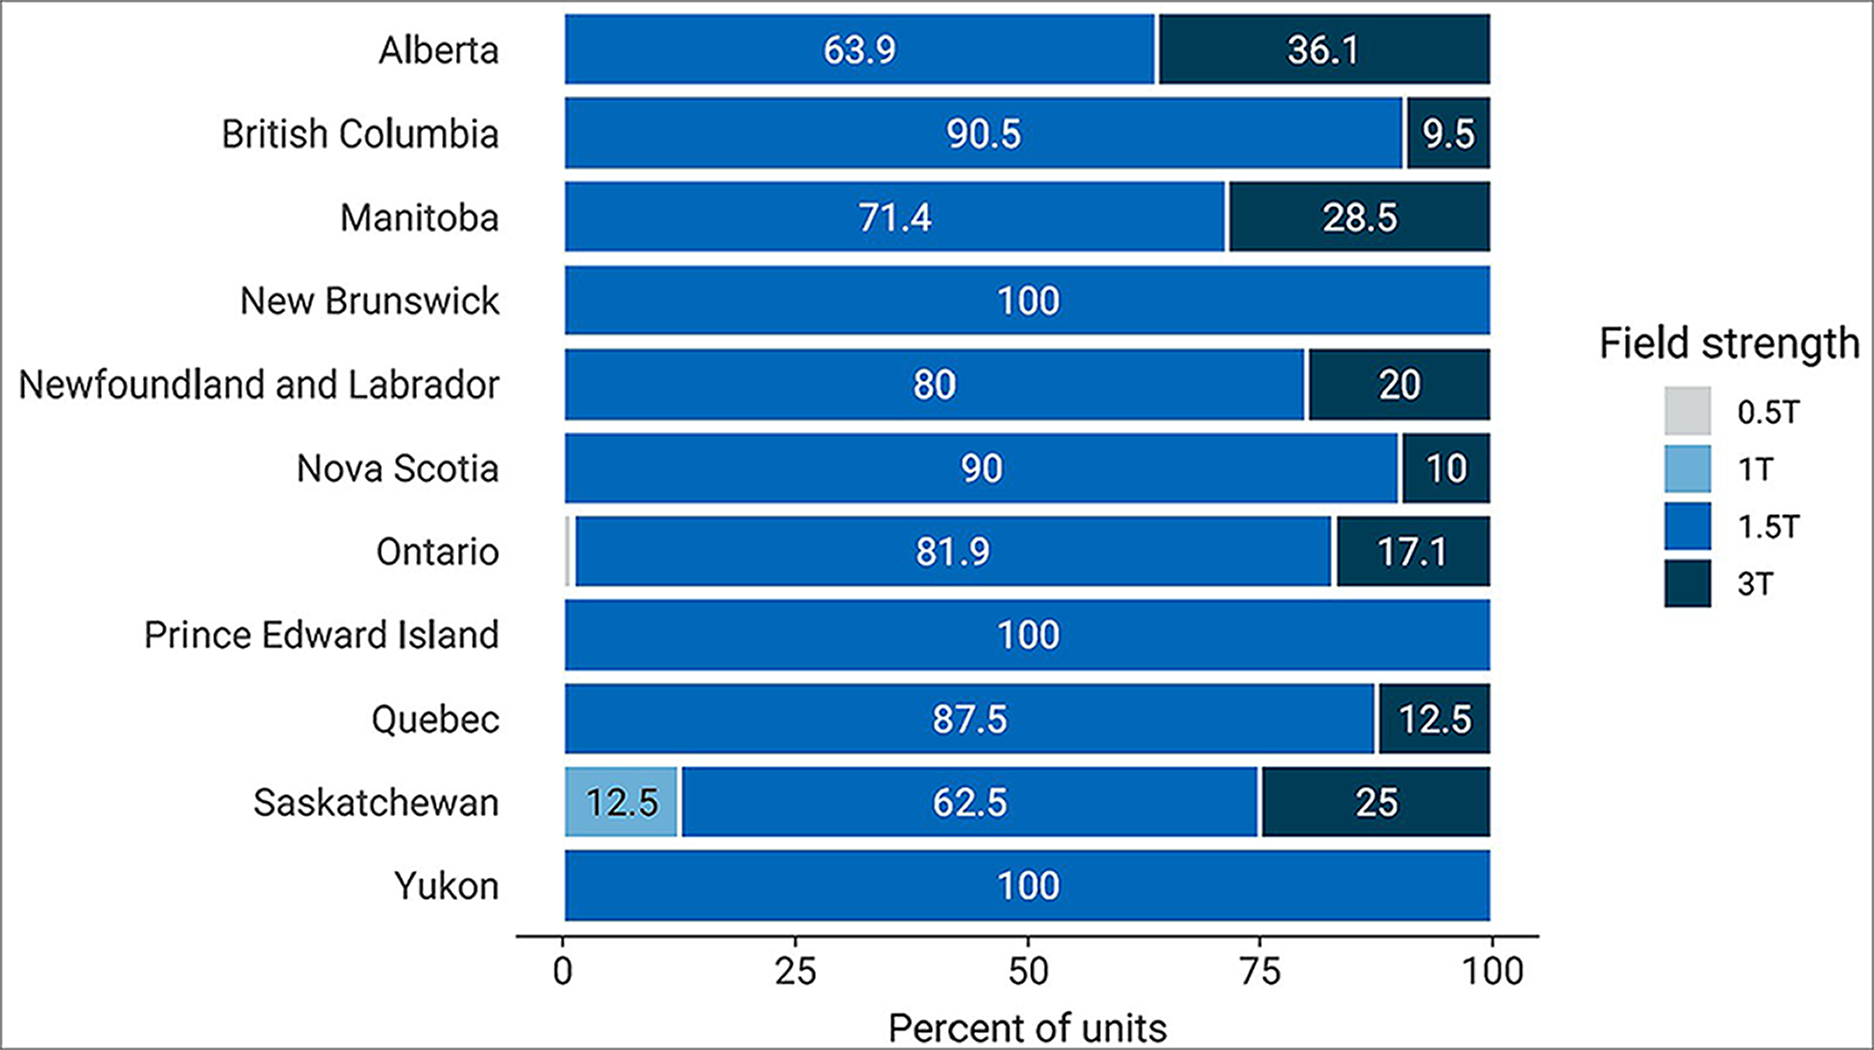
The most commonly reported field strength of an MRI unit was 1.5 T, in 229 units (81.8%), followed by 3.0 T in 49 units (17.5%). Two sites reported units with field strengths less than 1.5 T (0.7%). The field strength data were available for 280 MRI units at 197 sites (Figure 15 and Appendix 3, Table 22).
Closed-bore – wide was the most commonly reported configuration of an MRI unit in 95 units (55.9%), followed by closed-bore – normal in 68 units (40.0%) and open-bore in 7 units (4.1%). MRI configuration data were available for 170 units at 113 sites (Appendix 3, Table 23).
Figure 15: Reported Field Strengths for MRI by Province and Territory, 2022 to 2023
T = tesla.
Notes: Ontario and Saskatchewan each had one unit with field strength less than 1.5 T.
Survey response data were available for 280 out of 432 MRI units across all jurisdictions with capacity.
Data were derived from the following survey question: “What is the field strength (tesla) of the MRI unit?”
Trends in Technical Specifications of MRI
Trends Over Time in MRI Field Strength
In 2001, 1.5 T and 1.0 T were the most common field strengths used by MRI units, whereas in 2022–2023, 1.5 T and 3 T were most common.
Since 2001, the use of 1.5 T field strength has increased by 18%, from 69.2% of units in 2001 to 81.8% of units in 2022–2023, and the use of 1.0 T has decreased by 98%, from 20.9% in 2001 to 0.4% of units in 2022–2023 (Figure 16 and Appendix 3, Table 22).
Since 2001, the percentage of MRI units with a field strength of 3.0 T has markedly increased from 1.1% of units in 2001 to 17.5% of units in 2022–2023.
Since 2001, the percentage of MRI units with field strengths other than 1.5 T and 3.0 T has decreased by 98%, from 29.7% of units in 2001 to 0.7% of units in 2022–2023.
Figure 16: Trends in Common MRI Field Strengths, 2001 to 2022–2023
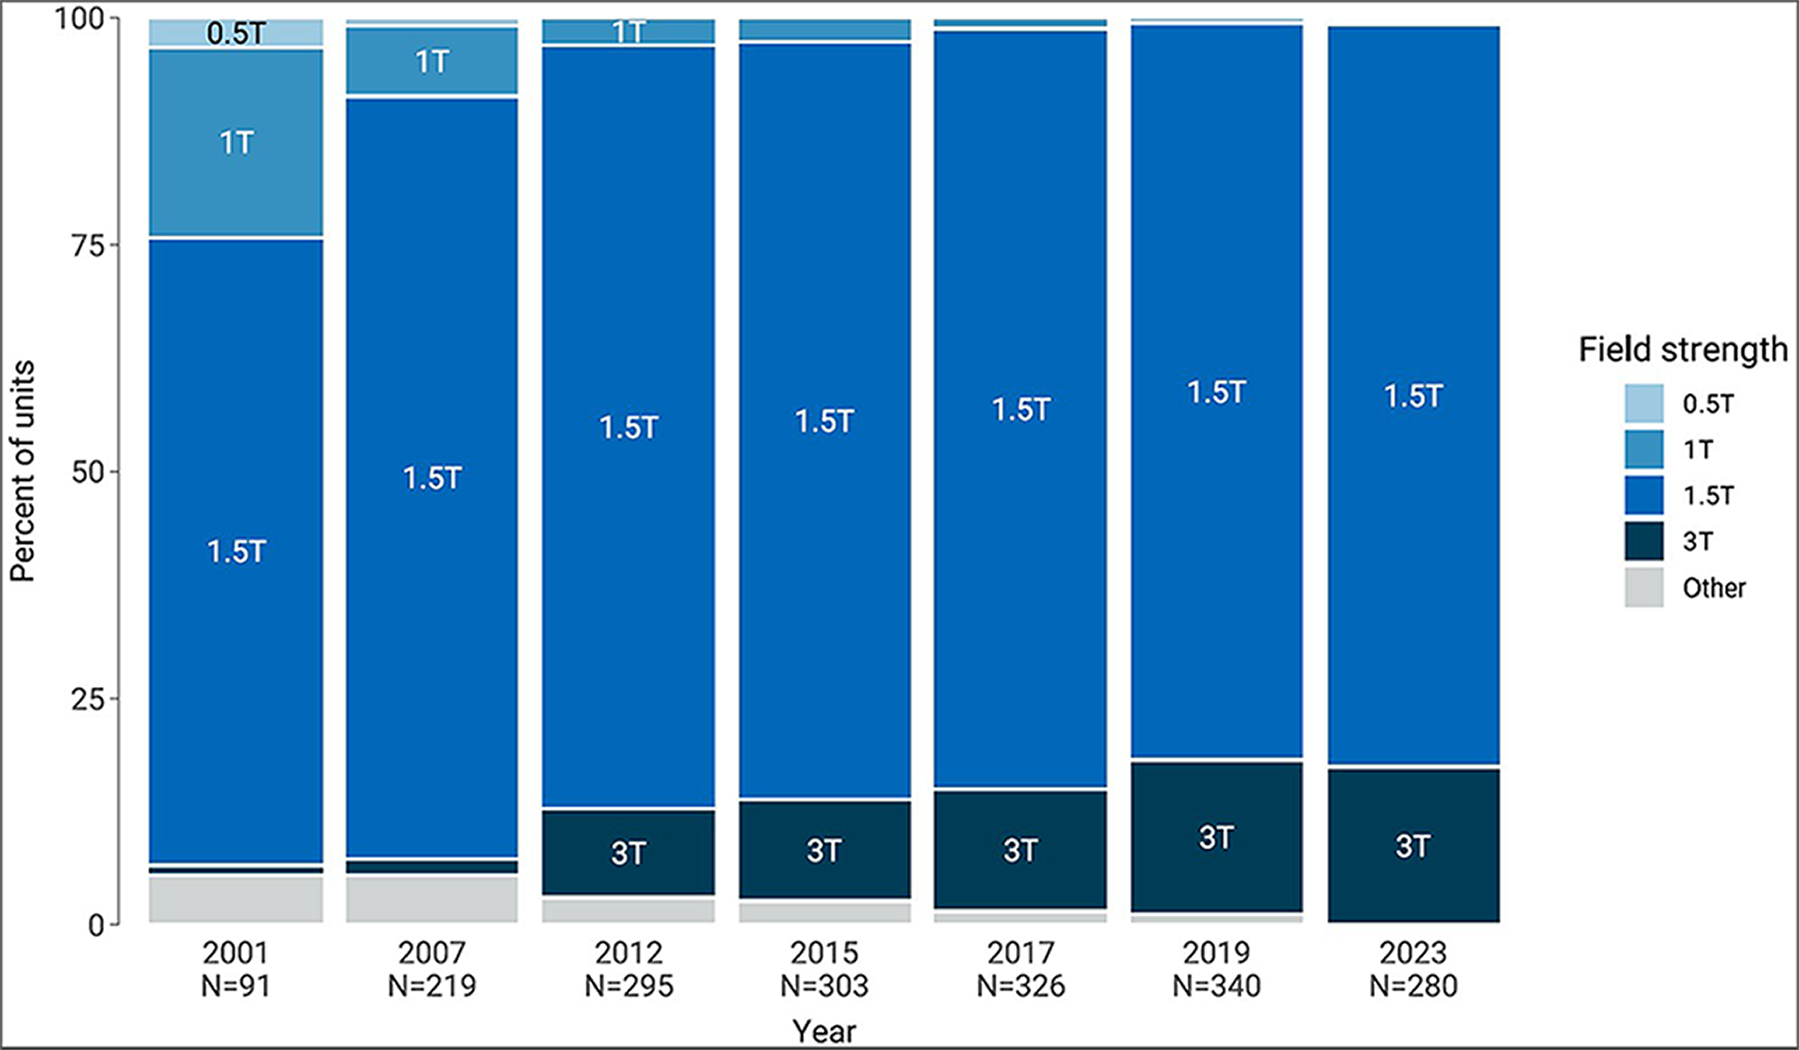
CIHI = Canadian Institute for Health Information; CMII = Canadian Medical Imaging Inventory; T = tesla.
Notes: Data were derived from the following survey question: “What is the field strength (tesla) of the MRI unit?”
Data sources: CIHI (2012),20 the CIHI QuickStats dataset,21 CMII (2015),13 CMII (2017),14 CMII (2019),2 and CMII (2022–2023). The 2015 data were subject to additional data-cleaning before being uploaded for the 2017 survey, and this cleaned dataset was used.
Trends Over Time in MRI Configuration
In 2012, closed-bore – normal and open-bore were the most common configurations in MRI units.
Since 2012, the percentage of MRI units with an open-bore configuration has decreased by 89.6%, from 39.4% of units in 2012 to 4.1% of units in 2022–2023 (Figure 17 and Appendix 3, Table 23).
Since 2012, the percentage of MRI units with a closed-bore – wide configuration has sharply increased, from 0% of units in 2012 to 55.9% of units in 2022–2023.
Since 2012, the percentage of MRI units with a closed-bore – normal configuration has decreased by 34%, from 60.6% of units in 2012 to 40.0% of units in 2022–2023.
Figure 17: Trends in MRI Configuration, 2012 to 2023
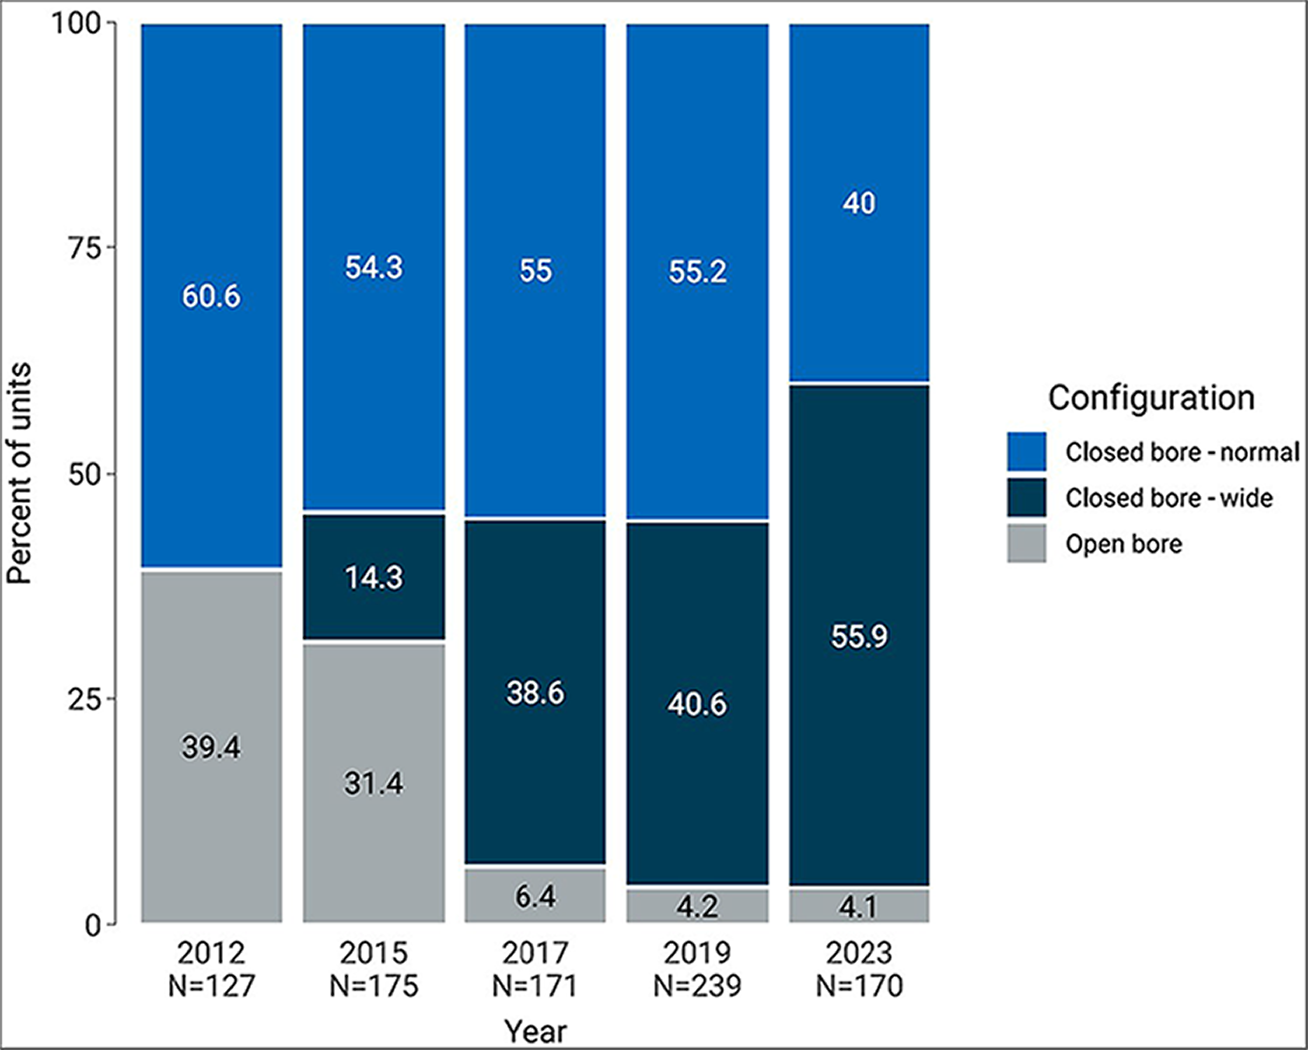
Notes: Data were derived from the following survey question: “What is the configuration of the MRI unit?”
Data sources: CIHI (2012),20 the CIHI QuickStats dataset,21 CMII (2015),13 CMII (2017),14 CMII (2019),2 and CMII (2022–2023). The 2015 data were subject to additional data-cleaning before being uploaded for the 2017 survey, and this cleaned dataset was used.
International Comparisons
Canadian Data Compared With International Data
We compared Canadian MRI unit counts and exam volume data with those of other OECD countries.22,23 The comparisons were made with data from the latest available year for each country.
Canada is below the OECD average of 19.4 units per million population at 10.8, positioned 28th among 33 countries (Figure 18).
Canada is below the OECD average of 83.6 exams per 1,000 population at 55.6, positioned 21st among 28 countries (Figure 19).
Figure 18: Comparison of Canadian and International Data for MRI Units per Million Population, 2022 to 2023
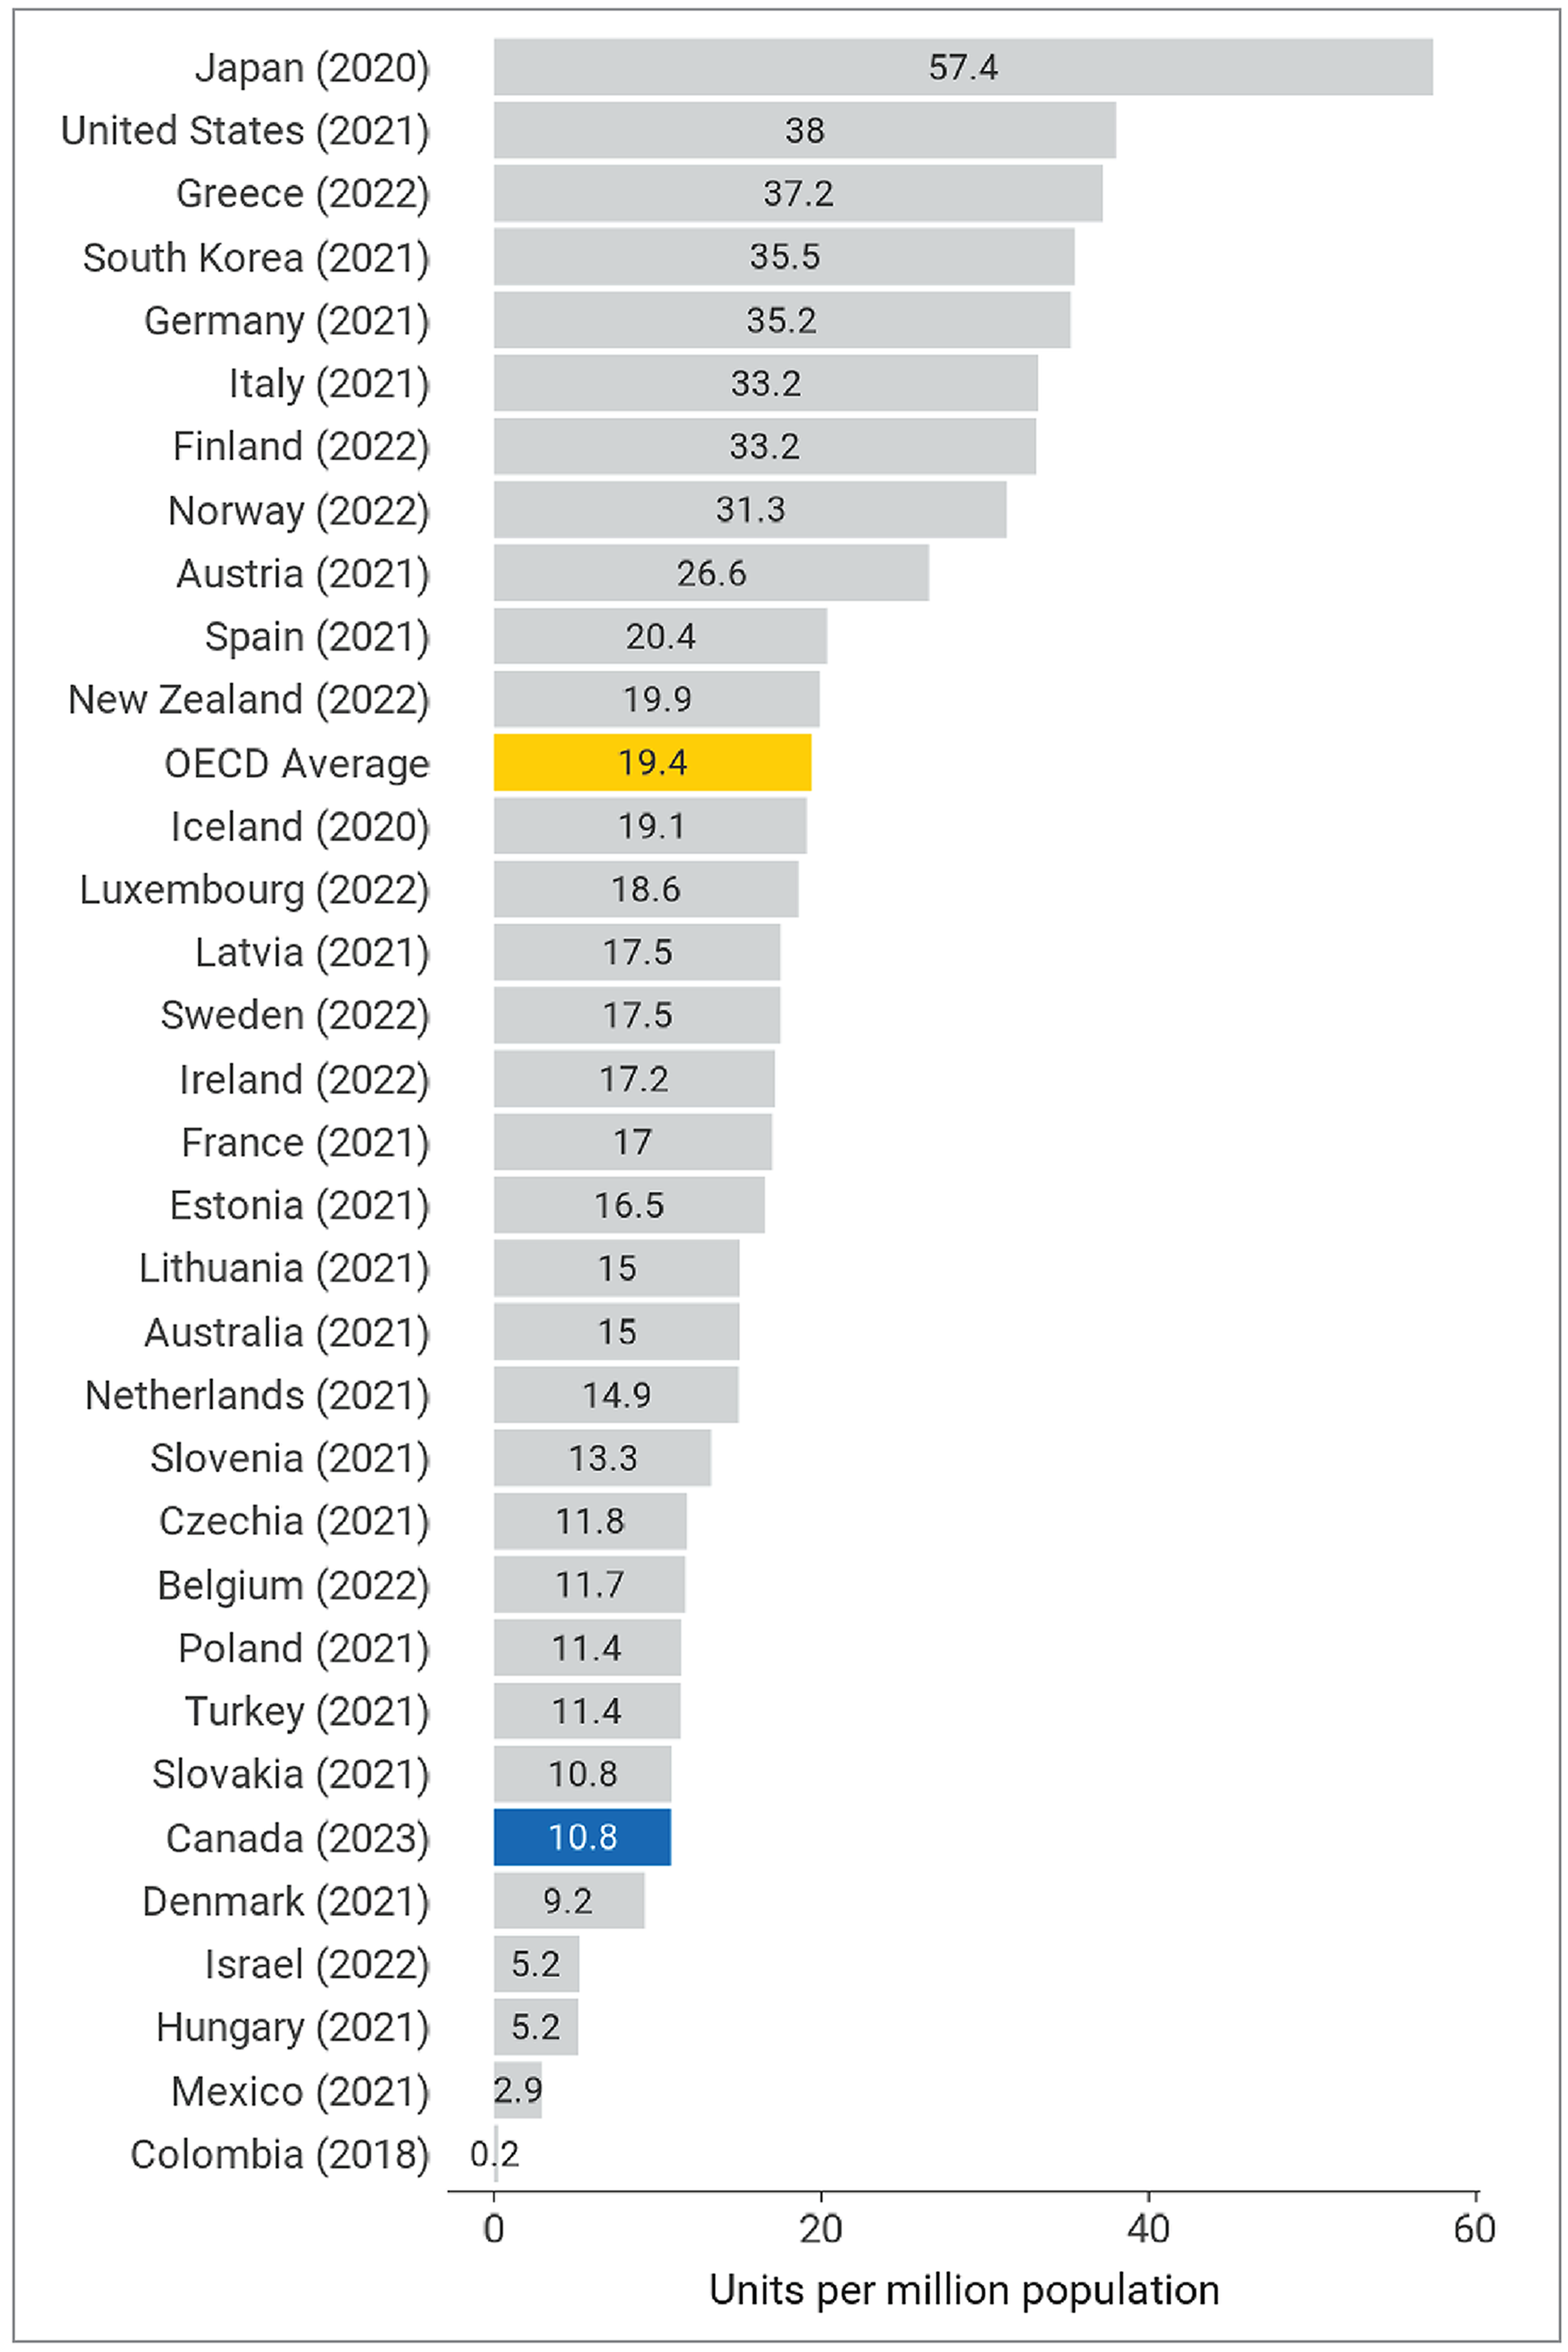
OECD = Organisation for Economic Co-operation and Development.
Note: The year is the last year with data available (refer to https://stats.oecd.org/ for details). OECD data were retrieved on October 30, 2023.
Figure 19: Comparison of Canadian and OECD Data for MRI Exams per 1,000 Population, 2022 to 2023
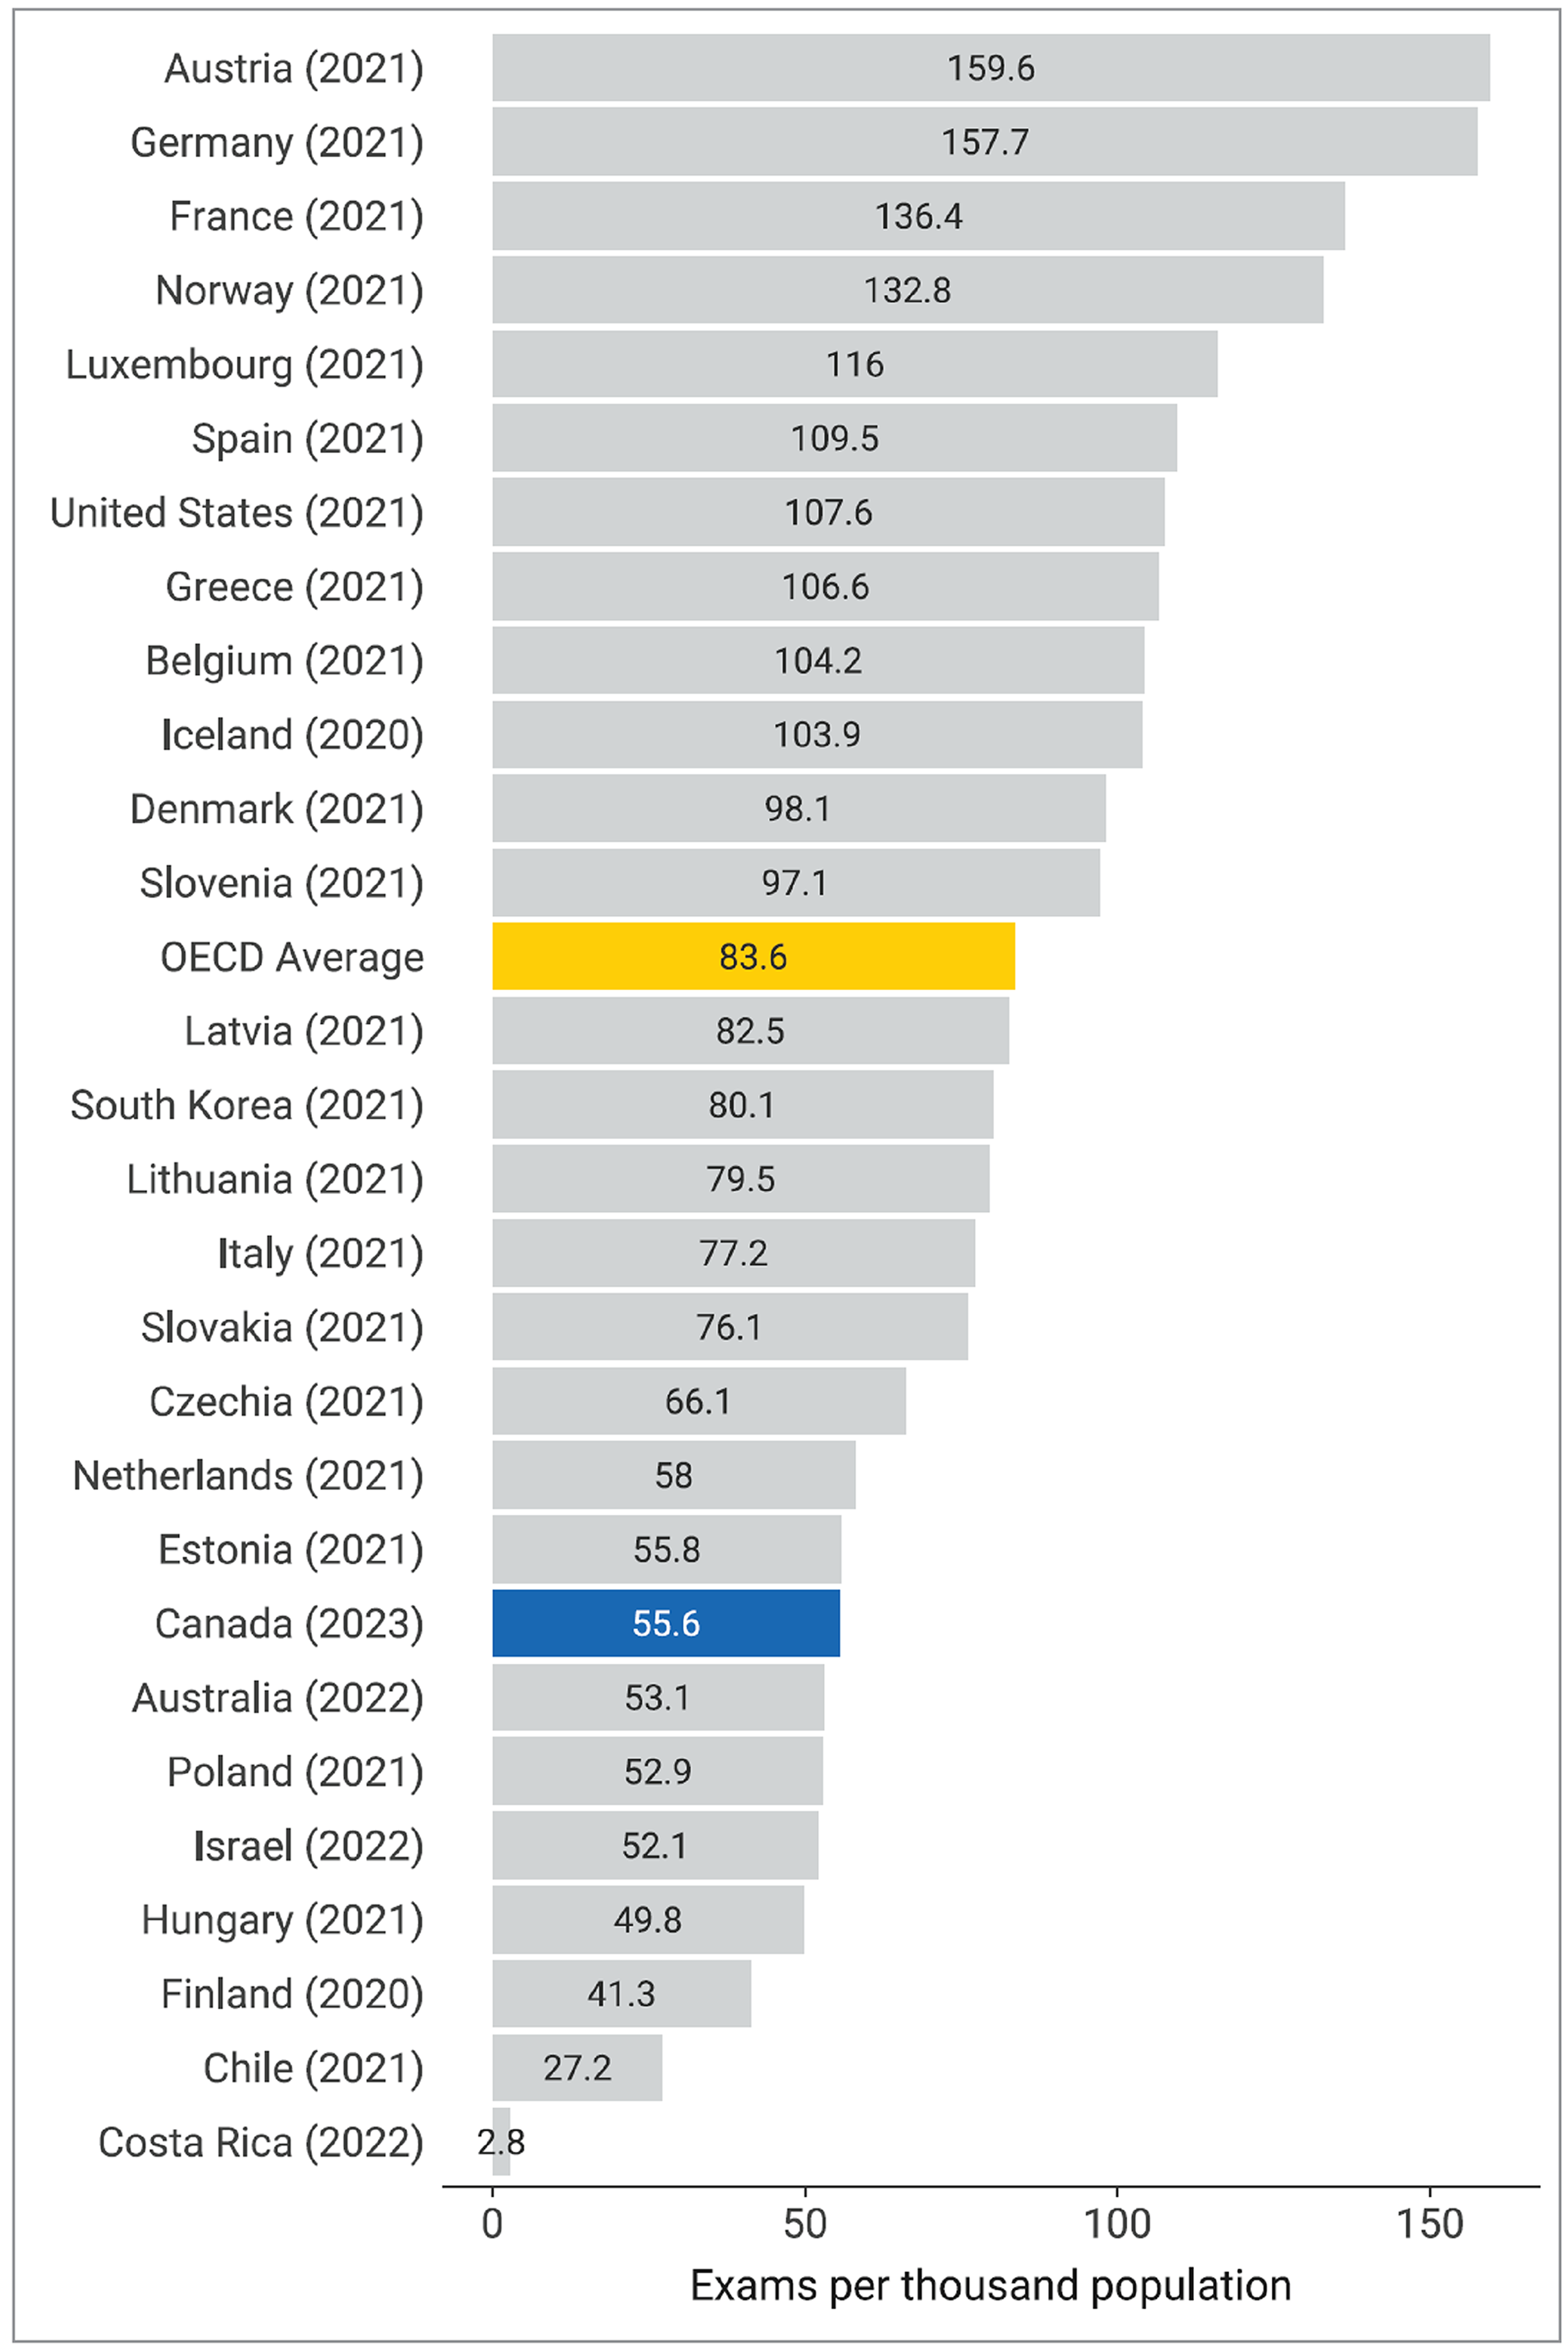
OECD = Organisation for Economic Co-operation and Development.
Note: The year is the last year with data available (refer to https://stats.oecd.org/ for details). OECD data were retrieved on October 30, 2023.
Projections of the Number of MRI Units and Exams
The CMII forecasts the number of MRI units and volume of exams needed to maintain current levels of service based on estimations of population growth in Canada for the following years: 2025, 2030, 2035, and 2040.
Our projections use a simple model based on 2022–2023 MRI units and exams findings, which were applied to estimated population projections from Statistics Canada. Three different population scenarios were envisioned for low, medium, and high projected growth (refer to Appendix 3, Table 24 for population projections). Projections use the current per capita number of units and exam volumes for 2022 to 2023, and assume that population change is the only driver of imaging growth over the forecasted period. Additional limitations of the data are summarized later in this section of this report.
Projected Number of MRI Units for 2025, 2030, 2035, and 2040
For each jurisdiction with existing MRI capacity, projections for the number of units needed to maintain current levels of service are shown in Figure 20 and Appendix 3, Table 25. Assuming medium population growth:
the number of MRI units in Canada overall is projected to increase by 18.5%, from 432 units in 2022–2023 to 512 units in 2040 (range, 467 to 553)
the number of MRI units is projected to increase or remain the same for all jurisdictions with existing capacity
3 provinces are projected to have the greatest increase in units by 2040: Ontario, from 157 to 190 units; Alberta, from 43 to 58 units; and British Columbia, from 55 to 66 units.
When low population growth is assumed, the number of MRI units is projected to increase in Alberta, British Columbia, Manitoba, Ontario, and Saskatchewan. New Brunswick, Nova Scotia, Prince Edward Island, Quebec, and Yukon were projected to remain unchanged from 2022–2023.
Newfoundland and Labrador is the only province that has a projected population decline across all growth scenarios.
The Northwest Territories and Nunavut do not currently have any MRI units, so growth projections could not be calculated.
Figure 20: Projected Number of MRI Units for 2025, 2030, 2035, and 2040
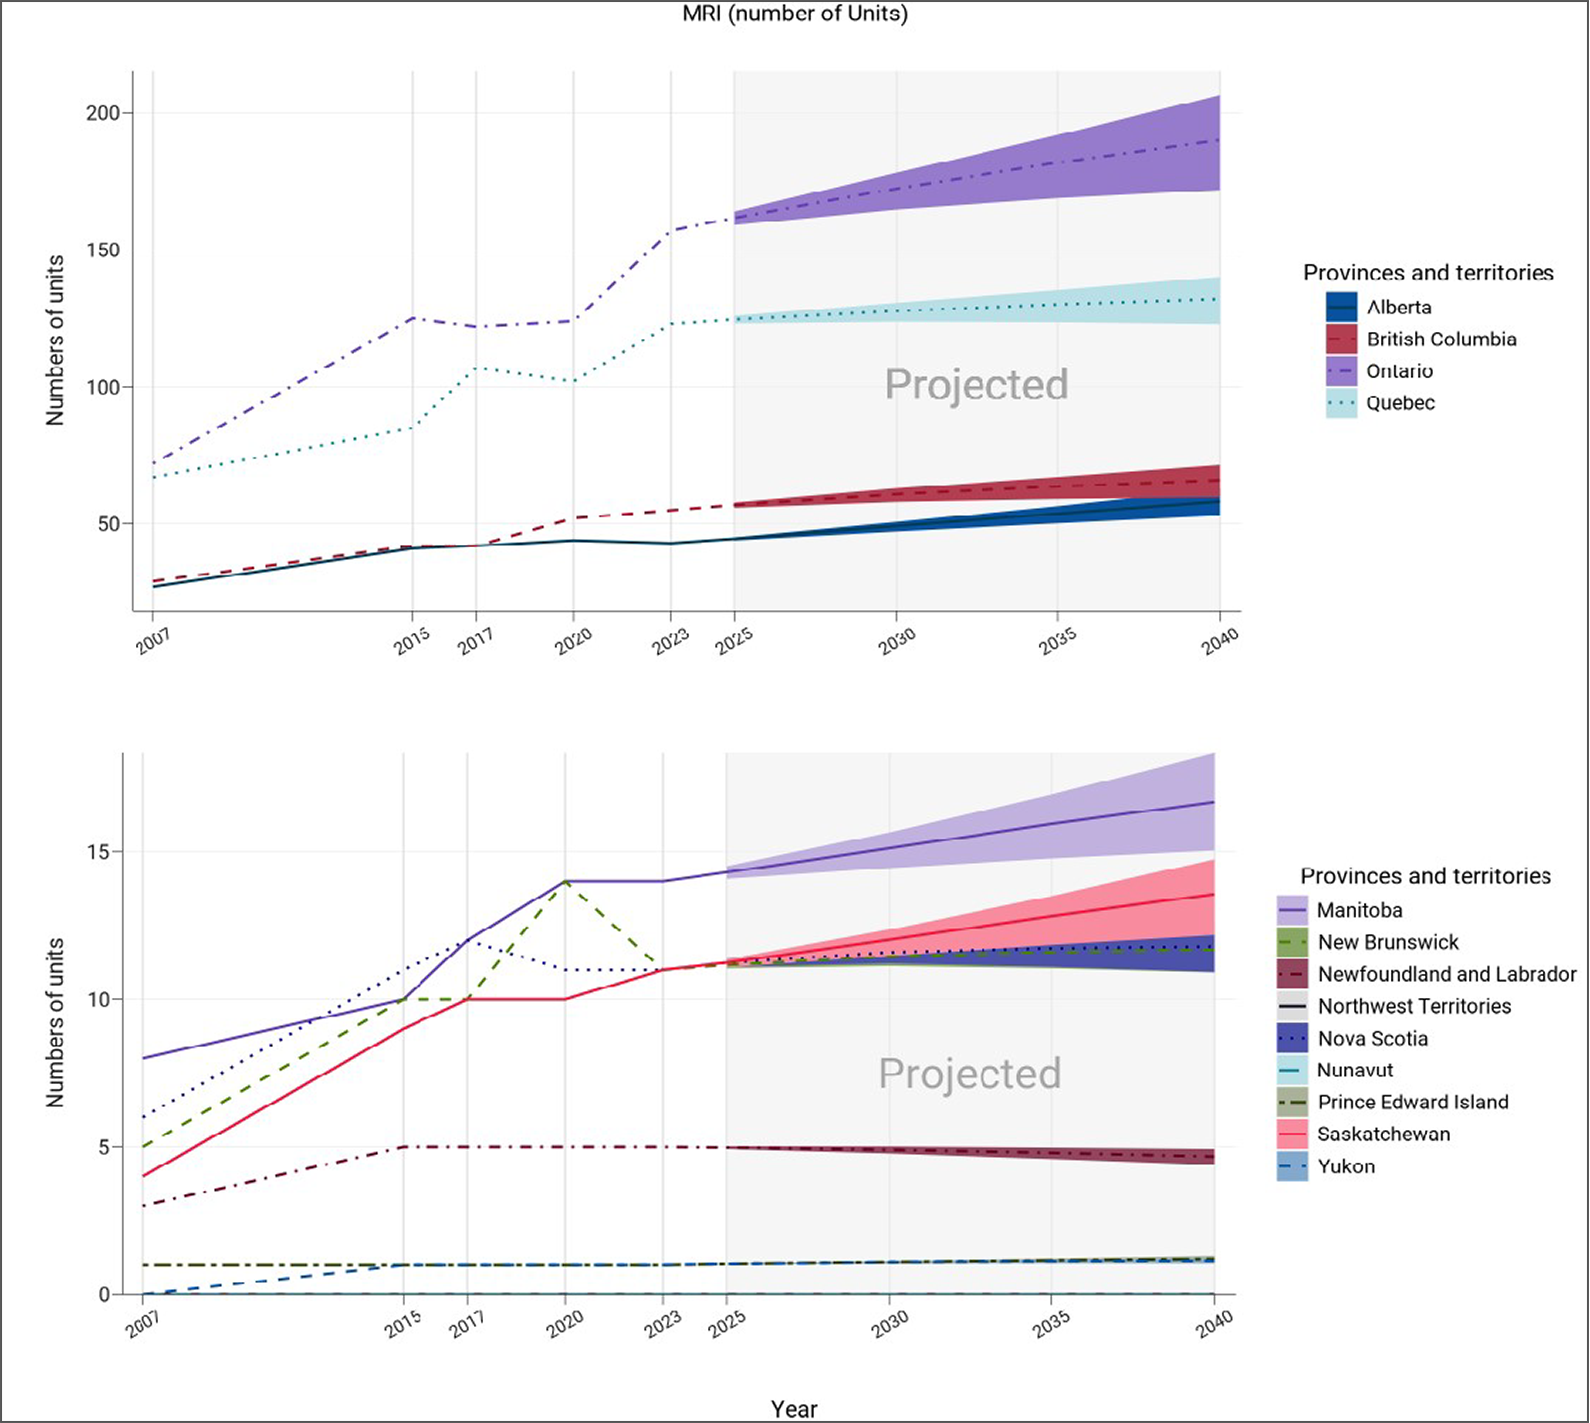
Notes: The projection was calculated from the products of the numbers of per capita units in 2022–2023 and the population projections in 2025, 2030, 2035, and 2040.
The numbers of imaging units or exams were provided by provincial or territorial validators in 2023.
The population projections were retrieved from the Statistics Canada website on January 18, 2024.24
The solid lines of projections were based on the population projection, assuming medium growth.
The upper and lower bounds were based on population projections, assuming high and low growth, respectively.
Projected Number of MRI Exams for 2025, 2030, 2035, and 2040
Projections for the number of exams for each jurisdiction with existing MRI capacity are shown in Figure 21 and Appendix 3, Table 26. Assuming medium population growth:
the number of MRI exams in Canada overall is projected to increase by 18.5%, from 2,214,157 exams in 2022–2023 to 2,624,023 exams by 2040 (range, 2,391,510 to 2,832,347)
the number of MRI exams is projected to increase for all jurisdictions with existing capacity, except for Newfoundland and Labrador
Alberta, Saskatchewan, Ontario are projected to have the largest increase in exams by 2040, at 35%, 23%, and 21%, respectively, as they are projected to have the largest increase in medium population growth from 2022–2023 to 2040.
When low population growth is assumed:
the number of MRI exams is projected to increase in Alberta, British Columbia, Manitoba, Ontario, Prince Edward Island, Saskatchewan, and Yukon, while the number of exams in New Brunswick and Quebec is projected to decline slightly from 2022–2023
The number of MRI exams is projected to decline in Newfoundland and Labrador, from 21,409 to 18,829 exams, and it is the only province that has a projected population decline across all growth scenarios.
Figure 21: Projected Number of MRI Examinations (Thousands) for 2025, 2030, 2035, and 2040
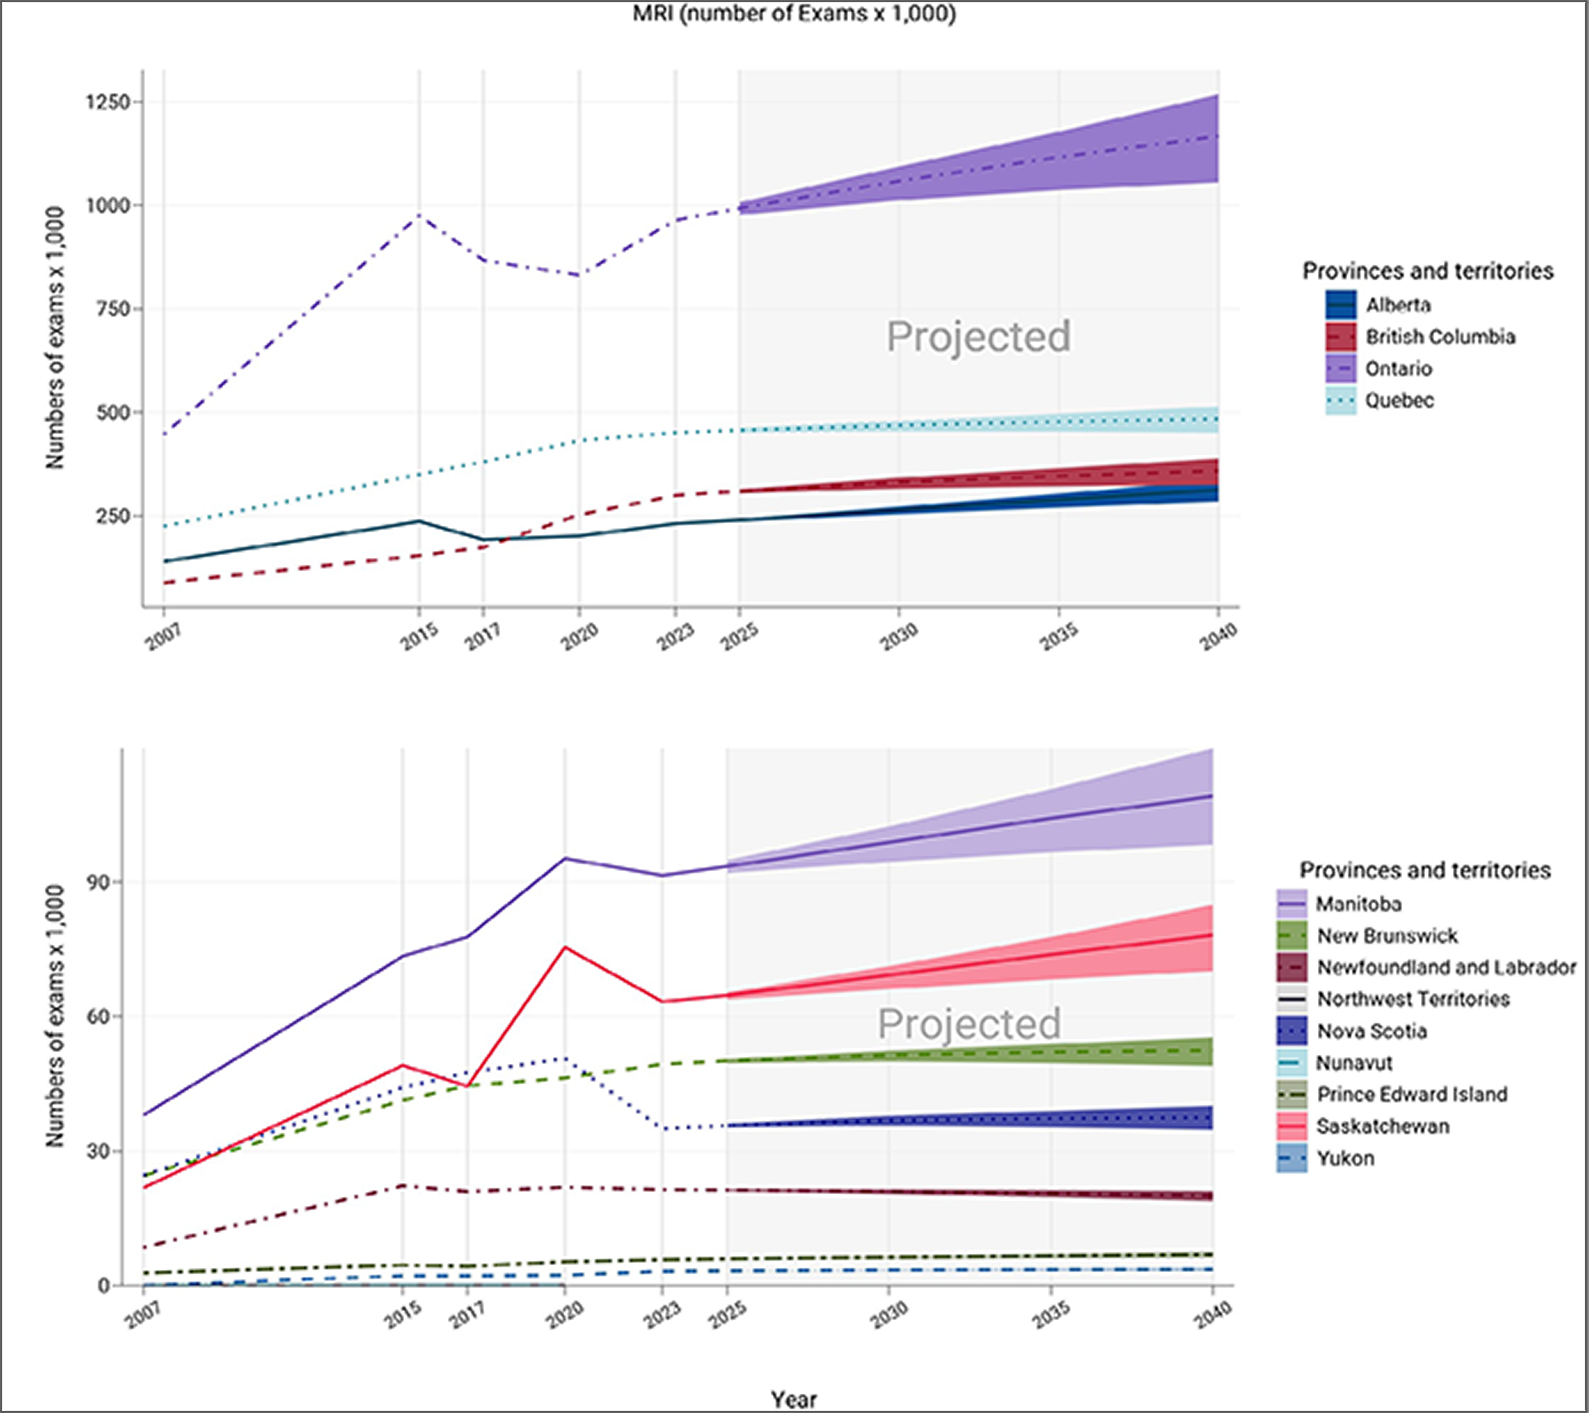
Notes: The projection was calculated from the products of the numbers of per capita exams in 2022–2023 and the population projections in 2025, 2030, 2035, and 2040.
The numbers of imaging units or exams were provided by provincial or territorial validators in 2023.
The population projections were retrieved from Statistics Canada website on January 18, 2024.24
The solid lines of projections were based on the population projection, assuming medium growth.
The upper and lower bounds were based on population projections, assuming high and low growth, respectively.
Projection Considerations and Limitations
Since 2015, the numbers of MRI units and exam volumes in Canada have increased by 27.1% and 13.4%, respectively. While the increase of MRI units is comparatively larger than the increase in demand for exams, wait times for MRI exams are still beyond recommended targets in many jurisdictions.1,8,9 Additionally, when considering the 2019–2020 CMII projections, the unit counts for 2030 and exam counts for 2025 have already been exceeded.2
To assist with policy development and planning around changing equipment and exam volumes, it may be helpful to consider factors beyond population growth. These factors may include:
changing health care priorities and policies
an aging population
increasing disease prevalence
the widening scope of clinical indications for which MRI can be used
funding (with a set level of funding, there may be a limited number of exams that can be performed).
Limitations of Findings
While complete data are available from provincial and territorial validators for units and exams in the public setting, there is no equivalent publicly available repository for the private imaging sector, and therefore data for unit and exam counts are not reflective of overall private imaging facility operations. Challenges in identifying private facilities and contacts within these facilities also contributed to the low number of survey responses for this category of imaging facility. Therefore, this may have led to underestimating the total number of units and exams, particularly in jurisdictions where privately run imaging facilities contribute to the overall use.
For some survey questions, a low number of responses were received by participating sites, warranting caution when interpreting the data. For instance, only 56 of 296 sites (18.9%) reported data on patterns of MRI exam use. The number of sites that responded to each question are included alongside the reported data, to enable readers to assess representativeness. Future work will be undertaken to identify patterns in missing data and how this may impact reporting bias.
To document the age of equipment, dates were variably reported as year of installation or first year of operation (depending on data availability). This frequently varied across datasets, leading to a 1-year or 2-year uncertainty in the age of individual units, and a corresponding uncertainty in the reported mean age of equipment.
For specific survey questions, the accuracy of the data in this report relied in part on the survey participants’ personal knowledge of their particular health care setting (e.g., hours of operation, hours of unplanned downtime). For these survey questions, recall bias could not be avoided, as we were unable to assess whether all information was visually verified and based on real-time observations, or whether questions were answered from memory. As a result, the accuracy and completeness of reporting may have been impacted.
Since 2015, the CMII national survey forms have been prepopulated with responses from sites that participated in previous CMII national survey iterations. Invited survey respondents were asked to update their data to reflect the status at the time of responding to the survey. If the survey was not updated for this iteration, it was assumed that no changes had been made from the previous CMII survey response. While this method improved survey respondent engagement and reduced fatigue, in some instances, not all data may have been up-to-date for some sites.
While we asked about replacement of units, we did not ask about technical upgrades that improved the operation of existing units, which directly impacts the age of equipment and need for replacement. The collection of this information will be considered in future survey iterations.
What Else Are We Doing?
This Canadian Medical Imaging Inventory 2022–2023: MRI report is part of a series of publications produced based on the CMII national survey.
The following additional publications, which can be found on the CMII webpage, are available to provide jurisdiction-level information on medical imaging modalities and resources:
Canadian Medical Imaging Inventory 2022–2023: Provincial and Territorial Overview
Canadian Medical Imaging Inventory 2022–2023: CT
Canadian Medical Imaging Inventory 2022–2023: PET-CT and PET-MRI
Canadian Medical Imaging Inventory 2022–2023: SPECT and SPECT-CT
Canadian Medical Imaging Inventory 2022–2023: The Medical Imaging Team
provincial and territorial summaries.
What Else Have We Done?
Other CMII-related reports released in 2023–2024 in response to specific decision-maker needs are listed here and have been published on the CMII website:
References
1.Sutherland G, Russell N, Gibbard R, Dobrescu A. The value of radiology, Part II. Ottawa: The Conference Board of Canada; 2019: https://car.ca/wp-content/uploads/2019/07/value-of-radiology-part-2-en.pdf. Accessed 2024 Apr 10.
2.Chao Y-S, Sinclair A, Morrison A, Hafizi D, Pyke L. The Canadian Medical Imaging Inventory 2019-2020. Ottawa: CADTH; 2021: https://www.cadth.ca/sites/default/files/ou-tr/op0546-cmii3-final-report.pdf. Accessed 2024 Jan 10.
3.Ghadimi M, Sapra A. Magnetic resonance imaging contraindications. Treasure Island (FL): StatPearls Publishing; 2023: https://www.ncbi.nlm.nih.gov/books/NBK551669/. Accessed 2024 Jan 10.
4.Kabasawa H. MR Imaging in the 21st Century: Technical Innovation over the First Two Decades. Magn Reson Med Sci. 2022;21(1):71-82. PubMed
5.Portable MRI for Use at the Bedside. Canadian Medical Imaging Inventory Service Report. Ottawa: CADTH; 2022: https://www.cadth.ca/sites/default/files/attachments/2022-07/portable_MRI_for_use_at_the_bedside_0.pdf. Accessed 2024 Apr 17.
6.Hudson D., Sahibbil JP. Remote scanning support in magnetic resonance imaging: Friend or foe? Radiography. 2022;28(3):739-745. PubMed
7.Shimron E., Perlman O. AI in MRI: Computational frameworks for a faster, optimized, and automated imaging workflow. Bioengineering. 2023;10(4):492. PubMed
8.Addressing the Medical Imaging Dilemma in Canada: Restoring Timely Access for Patients Post-Pandemic. Ottawa: Canadian Association of Radiologists; 2022: https://car.ca/wp-content/uploads/2021/07/CAR-PreBudgetSubmission-2022-e-web-FINAL.pdf. Accessed 2023 Nov 9.
9.Moir M, Barua B, Wannamaker H. Waiting your turn: Wait times for health care in Canada, 2023 Report. Vancouver (BC): Fraser Institute; 2023: https://www.fraserinstitute.org/sites/default/files/waiting-your-turn-2023.pdf. Accessed 2024 Jan 10.
10.Ismail Z BS, Camicioli R, Chertkow H, Herrmann N, Laforce Jr R, Montero-Odasso M, Rockwood K, Rosa-Neto P, Seitz D, Sivananthan S, Smith EE, Soucy J, Vedel I, Gauthier S. Recommendations of the 5th Canadian Consensus Conference on the diagnosis and treatment of dementia. Alzheimer's & Dementia. 2020;16(8):1182-1195. PubMed
11.The role of neuroimaging in drugs targeting Amyloid-Beta in Alzheimer disease: Part 1. Canadian Medical Imaging Inventory Service Report. Ottawa: CADTH; 2021: https://www.cadth.ca/sites/default/files/attachments/2021-11/role_neuroimaging_in_drugs_targeting_amyloid-beta_in_alzheimer_disease.pdf. Accessed 2024 Apr 17.
12.Statistics Canada. Canada's population estimates, first quarter 2023. The Daily. Ottawa (ON): Government of Canada; 2023: https://www150.statcan.gc.ca/n1/daily-quotidien/230628/dq230628c-eng.htm. Accessed 2024 Jan 5.
13.Sinclair A, Quay T, Pyke L, Morrison A. The Canadian Medical Imaging Inventory 2015. Ottawa: CADTH; 2016: https://www.cadth.ca/sites/default/files/pdf/canadian_medical_imaging_inventory_2015_e.pdf. Accessed 2024 Jan 10.
14.Sinclair A, Morrison A, Young C, Pyke L. Canadian Medical Imaging Inventory, 2017. Ottawa: CADTH; 2018: https://www.cadth.ca/sites/default/files/pdf/canadian_medical_imaging_inventory_2017.pdf. Accessed 2024 Jan 10.
15.An overview of clinical applications of Artificial Intelligence. CADTH issues in emerging health technologies Iss 174. Ottawa: CADTH; 2018: https://www.cadth.ca/sites/default/files/pdf/eh0070_overview_clinical_applications_of_AI.pdf. Accessed 2024 Mar 9.
16.Najjar R. Redefining Radiology: A Review of Artificial Intelligence Integration in Medical Imaging. Diagnostics. 2023;13(17):2760. PubMed
17.Health Council of Canada. Decisions, decisions: Family doctors as Gatekeepers to Prescription Drugs and Diagnostic Imaging in Canada. Ottawa: Government of Canada; 2010: https://publications.gc.ca/collections/collection_2011/ccs-hcc/H174-19-2010-eng.pdf. Accessed 2024 Mar 22.
18.Health Quality Ontario. Peer review: A diagnostic imaging quality initiative for Ontario. Toronto: Government of Ontario; 2016: https://www.hqontario.ca/Portals/0/documents/health-quality/di-expert-panel-report-en.pdf. Accessed 2024 Mar 9.
19.Canadian Coordinating Office for Health Technology Assessment (CCOHTA). Magnetic resonance imaging scanners in Canadian hospitals. Ottawa: CCOHTA; 2001.
20.Canadian Institute for Health Information (CIHI). Medical imaging in Canada 2012 (executive summary). Ottawa: CIHI; 2013.
21.Canadian Institute for Health Information (CIHI). QuickStats. Selected medical imaging equipment in Canada. 2012; https://www.cihi.ca/en/selected-medical-imaging-equipment-in-canada. Accessed 2020 Sep 30.
22.Organisation for Economic Co-Operation and Development. Magnetic resonance imaging (MRI) units. 2023; https://data.oecd.org/healtheqt/magnetic-resonance-imaging-mri-units.htm#indicator-chart. Accessed 2023 Nov 9.
23.Organisation for Economic Co-Operation and Development. Magnetic resonance imaging (MRI) exams. 2023; https://data.oecd.org/healthcare/magnetic-resonance-imaging-mri-exams.htm#indicator-chart. Accessed 2023 Nov 9.
24.Statistics Canada. Population projections for Canada (2021 to 2068), Provinces and Territories (2021 to 2043): Technical report on methodology and assumptions. Ottawa: Government of Canada; 2023: https://www150.statcan.gc.ca/n1/en/pub/91-620-x/91-620-x2022001-eng.pdf?st=My-XWuTK. Accessed 2024 Jan 29.
25.Mayfair Diagnostics. How private MRI fits into public health care. 2018; https://www.radiology.ca/article/how-private-mri-fits-public-health-care. Accessed 2024 Feb 29.
Appendix 1: Introduction to MRI
Note that this appendix has not been copy-edited.
About MRI
MRI uses powerful electromagnetic and radiofrequency fields and computation to produce cross-sectional images of the body, including the head, neck, cardiovascular system, breast, abdomen, pelvis, musculoskeletal system, and spine.1,19 Specialties that commonly employ MRI include neurology, gastroenterology, cardiology, oncology, internal medicine, orthopedics, and emergency services.1,19
MRI does not use ionizing radiation, and therefore may be preferred when CT and MRI would provide comparable information, for example, when imaging children.1,3,19 MRI provides high sensitivity and soft-tissue details, especially in the abdomen and pelvis, allowing for visualization of anatomy and pathologies. In oncology, this assists early diagnosis, staging and re-staging, identification of treatment response, and detection of recurrence in various cancers.1,19
A challenge of MRI is that exams can take up to an hour or more, and patients must remain motionless within a narrow enclosure. It may not be suitable for people with claustrophobia, those who cannot lie flat for prolonged periods, or those who are obese.3,19 The magnetic fields and radiofrequencies used in MRI are incompatible with many common implantable medical devices, such as deep brain stimulators, cochlear implants, and pacemakers.3,19 All people undergoing an MRI exam must be screened beforehand to identify any potentially contraindicated devices or metallic foreign bodies.3,19,25
Appendix 2: Definitions of Terms Used in This Report
Note that this appendix has not been copy-edited.
Type of Facility Operating Imaging Equipment
Hospital
An institution where patients are provided with continuing medical care and supporting diagnostic and therapeutic services. Hospitals are licensed or approved as hospitals by a provincial or territorial government or are operated by the Government of Canada. Included are those providing acute care.
Tertiary Care
A hospital that provides tertiary care, which is health care from specialists who investigate and treat patients in a large hospital after referral from primary care and secondary care facilities.
Private
A health care facility that operates privately but that is either privately or publicly funded, that ranges from specialized services by physicians, radiologists, dentists, chiropractors, or via mammography programs, to broad-based imaging centres offering a wide range of tests.
Community Hospital
A short-term (average length of stay with fewer than 30 days) hospital that provides acute care.
Picture Archiving and Communication Systems
A PACS is an electronic system used to digitally manage images, including transmission, filing, storage, distribution, and retrieval of medical images. It is networked and frequently web-based. Combined with other web-based telehealth technologies, a PACS allows timely access to medical images and specialists. PACSs have replaced film and film library systems.
Access to images outside medical imaging departments by referring and consulting physicians is important for efficient patient care, particularly so in a country like Canada, with its large geographic size and dispersed population.
Type of Equipment Servicing Method Reported by Sites
À La Carte
Services and parts that are paid by the imaging facility on an as-needed basis, with the service provider charging for parts, labour, and travel.
Full Vendor Service Contracts
Full vendor contracts provide a wide range of services, such as corrective maintenance, operational maintenance, planned maintenance, and extended warranty, along with insurance maintenance programs for a set period.
Insurance
Insurance policy service contracts may vary, but most equipment insurance companies specialize in risk management, cost avoidance, or service billing audit functions.
Managed Equipment Service
This service package entails ownership, acquisition, installation and commissioning, user training, asset management, maintenance, and ongoing replacement of medical technology and equipment.
Shared Service
Organizations that have in-house expertise and resources may service their own imaging equipment and may use external service contracts for certain types of equipment.
Third Party
Third-party agreements may often be used for hardware support and to provide services offered through a company separate from the original equipment manufacturer.
Under Warranty
Equipment maintenance according to warranty service agreement. At the end of the warranty period, health care systems must select their service contract type.
Appendix 3: Supplementary Summary Tables for MRI, 2022–2023 CMII
Note that this appendix has not been copy-edited.
Table 6: Summary of Type of MRI Facility Included in the CMII, 2022 to 2023
Province or territory | Hospital | Private | Community hospital | Tertiary care |
|---|---|---|---|---|
Number of sites (% in each jurisdiction) | ||||
Alberta | 13 (59.1) | 4 (18.2) | 3 (13.6) | 2 (9.1) |
British Columbia | 22 (66.7) | 3 (9.1) | 2 (6.1) | 6 (18.2) |
Manitoba | 6 (66.7) | 1 (11.1) | 0 (0) | 2 (22.2) |
New Brunswick | 8 (88.9) | 0 (0) | 0 (0) | 1 (11.1) |
Newfoundland and Labrador | 5 (100) | 0 (0) | 0 (0) | 0 (0) |
Northwest Territories | — | — | — | — |
Nova Scotia | 5 (50) | 1 (10) | 0 (0) | 4 (40) |
Nunavut | — | — | — | — |
Ontario | 51 (65.4) | 6 (7.7) | 12 (15.4) | 9 (11.5) |
Prince Edward Island | 1 (100) | 0 (0) | 0 (0) | 0 (0) |
Quebec | 27 (90) | 0 (0) | 0 (0) | 3 (10) |
Saskatchewan | 0 (0) | 1 (16.7) | 0 (0) | 5 (83.3) |
Yukon | 1 (100) | 0 (0) | 0 (0) | 0 (0) |
Canada | 139 (68.1) | 16 (7.8) | 17 (8.3) | 32 (15.7) |
CMII = Canadian Medical Imaging Inventory.
Notes: Survey response data were available for 204 out of 296 sites across all jurisdictions with MRI capacity.
Data were derived from the following survey question: “What type of facility is this?” The table includes only those facilities that responded to the survey question. In some instances, validator data, CMII data, and data from other publicly available sources supplemented survey responses. Definitions for the type of facility included in the survey are provided in Appendix 2.
Table 7: Summary of Location of MRI Facilities Included in the CMII, 2022 to 2023
Province or territory | Urban | Rural | Remote |
|---|---|---|---|
Number of sites (% in each jurisdiction) | |||
Alberta | 14 (63.6) | 8 (36.4) | 0 (0) |
British Columbia | 26 (78.8) | 7 (21.2) | 0 (0) |
Manitoba | 5 (55.6) | 4 (44.4) | 0 (0) |
New Brunswick | 6 (66.7) | 3 (33.3) | 0 (0) |
Newfoundland and Labrador | 4 (80) | 1 (20) | 0 (0) |
Northwest Territories | — | — | — |
Nova Scotia | 6 (60) | 4 (40) | 0 (0) |
Nunavut | — | — | — |
Ontario | 59 (85.5) | 9 (13) | 1 (1.4) |
Prince Edward Island | 1 (100) | 0 (0) | 0 (0) |
Quebec | 26 (3.7) | 1 (3.7) | 0 (0) |
Saskatchewan | 6 (100) | 0 (0) | 0 (0) |
Yukon | 0 (0) | 0 (0) | 1 (100) |
Canada | 153 (79.7) | 37 (19.3) | 2 (1) |
CMII = Canadian Medical Imaging Inventory.
Notes: Survey response data were available for 192 out of 296 sites across all jurisdictions with MRI capacity.
Data were derived from the following survey question: “In which of the following settings are you located?”
Table 8: Summary of Source of Funding for MRI Sites Included in the CMII, 2022 to 2023
Province or territory | Public | Private | Both |
|---|---|---|---|
Number of sites (% in each jurisdiction) | |||
Alberta | 21 (95.5) | 0 (0) | 1 (4.5) |
British Columbia | 30 (100) | 0 (0) | 0 (0) |
Manitoba | 9 (100) | 0 (0) | 0 (0) |
New Brunswick | 7 (87.5) | 0 (0) | 0 (0) |
Newfoundland and Labrador | 5 (100) | 0 (0) | 0 (0) |
Northwest Territories | — | — | — |
Nova Scotia | 7 (100) | 0 (0) | 0 (0) |
Nunavut | — | — | — |
Ontario | 42 (91.3) | 0 (0) | 4 (8.7) |
Prince Edward Island | 1 (100) | 0 (0) | 0 (0) |
Quebec | 19 (90.5) | 2 (9.5) | 0 (0) |
Saskatchewan | 5 (100) | 0 (0) | 0 (0) |
Yukon | 1 (100) | 0 (0) | 0 (0) |
Canada | 147 (95.5) | 2 (1.3) | 5 (3.2) |
CMII = Canadian Medical Imaging Inventory.
Notes: Survey response data were available for 154 out of 296 sites across all jurisdictions with MRI capacity.
Data were derived from the following survey question: “How is this facility funded?” The table includes only those facilities that responded to the survey question. In some instances, validator data, CMII data, and data from other publicly available sources supplemented survey responses.
Table 9: Number of MRI Units and Units per Capita, 2015 to 2022–2023
Province or territory | 2015 | 2017 | 2019 to 2020 | 2022 to 2023 | ||||
|---|---|---|---|---|---|---|---|---|
Units | Units per million population | Units | Units per million population | Units | Units per million population | Units | Units per million population | |
Alberta | 41 | 9.8 | 41 | 9.6 | 44 | 10.0 | 43 | 9.1 |
British Columbia | 42 | 9.0 | 46 | 9.6 | 52 | 10.2 | 55 | 10.1 |
Manitoba | 10 | 7.7 | 12 | 9.0 | 14 | 10.2 | 14 | 9.7 |
New Brunswick | 10 | 13.3 | 11 | 14.5 | 14 | 17.9 | 11 | 13.2 |
Newfoundland and Labrador | 5 | 9.5 | 5 | 9.5 | 5 | 9.6 | 5 | 9.4 |
Northwest Territories | — | — | — | — | — | — | — | — |
Nova Scotia | 11 | 11.7 | 12 | 12.6 | 11 | 11.3 | 11 | 10.5 |
Nunavut | — | — | — | — | — | — | — | — |
Ontario | 125 | 13.5 | 120 | 8.5 | 124 | 8.5 | 157 | 10.1 |
Prince Edward Island | 1 | 13.7 | 1 | 6.7 | 1 | 6.3 | 1 | 5.7 |
Quebec | 85 | 17.7 | 107 | 12.8 | 102 | 12.0 | 123 | 13.9 |
Saskatchewan | 9 | 7.9 | 10 | 8.6 | 10 | 8.5 | 11 | 9.0 |
Yukon | 1 | 27.0 | 1 | 26.5 | 1 | 24.4 | 1 | 22.5 |
Canada | 340 | 9.5 | 366 | 10.0 | 378 | 10.0 | 432 | 10.8 |
Notes: Complete unit count data were available for all public MRI units across all jurisdictions with capacity.
For the 2022–2023 survey, complete unit count data were available for 296 sites with MRI capacity out of 467 participating sites with advanced imaging capacity (i.e., SPECT-CT, SPECT, CT, MRI, PET-CT, PET-MRI). For 2019–2020, complete unit count data were available for 288 sites with MRI capacity out of 455 participating sites with advanced imaging capacity. For 2017, complete unit count data were available for 261 sites with MRI capacity out of 505 participating sites with advanced imaging capacity. For 2015, complete unit count data were available for 216 sites with MRI capacity out of 392 participating sites with advanced imaging capacity.
Data were derived from the following survey question: “Do you have the following fixed, mobile, or portable units at the site?” Options included: CT, MRI, PET-CT, PET-MRI, SPECT-CT, and SPECT.
Sources: CADTH (2015),13 CADTH (2017),14 CADTH (2020),2 CADTH (2024).
Table 10: Volume of MRI Exams and Exams per 1,000 People Across Canadian Public Facilities, 2015 to 2022–2023
Province or territory | 2015 | 2017 | 2019 to 2020 | 2022 to 2023 | ||||
|---|---|---|---|---|---|---|---|---|
Exams | Exams per 1,000 | Exams | Exams per 1,000 | Exams | Exams per 1,000 | Exams | Exams per 1,000 | |
Alberta | 236,406 | 56.3 | 192,375 | 44.8 | 201,208 | 45.8 | 231,033 | 49.1 |
British Columbia | 154,098 | 32.9 | 173,678 | 36.3 | 252,527 | 49.5 | 299,061 | 55.0 |
Manitoba | 73,460 | 56.8 | 77,735 | 58.3 | 95,250 | 69.3 | 91,497 | 63.4 |
New Brunswick | 41,310 | 54.8 | 44,592 | 58.9 | 46,309 | 59.4 | 49,376 | 59.4 |
Newfoundland and Labrador | 22,265 | 42.2 | 20,990 | 39.7 | 21,929 | 42.0 | 21,409 | 40.1 |
Northwest Territories | — | — | — | — | — | — | — | — |
Nova Scotia | 44,187 | 46.9 | 47,490 | 49.8 | 50,664 | 51.9 | 34,935 | 33.4 |
Nunavut | — | — | — | — | — | — | — | — |
Ontario | 974,500 | 70.7 | 866,953 | 61.3 | 831,038 | 56.7 | 963,563 | 62.2 |
Prince Edward Island | 4,567 | 31.2 | 4,279 | 28.6 | 5,348 | 33.9 | 5,803 | 33.0 |
Quebec | 349,945 | 42.3 | 380,357 | 45.4 | 431,655 | 50.6 | 450,947 | 51.1 |
Saskatchewan | 49,122 | 43.3 | 44,461 | 38.3 | 75,452 | 64.0 | 63,335 | 51.9 |
Yukon | 2,200 | 58.8 | 2,200 | 58.2 | 2,350 | 57.3 | 3,198 | 72.0 |
Canada | 1,952,060 | 54.0 | 1,855,110 | 51.0 | 2,013,730 | 53.3 | 2,214,157 | 55.6 |
Notes: The 2022–2023 exam volume data for public facilities were reported by validators for all jurisdictions with MRI capacity.
Data were derived from the following survey question: “For all units, how many examinations on average were conducted in the last fiscal/calendar year?”
Sources: CADTH (2015),13 CADTH (2017),14 CADTH (2020),2 CADTH (2024).
Table 11: Summary of Average Hours per Day of MRI Use by Province and Territory, 2022 to 2023
Province or territory | Number of reporting sites | Mean hours | Median hours (minimum to maximum) |
|---|---|---|---|
Alberta | 23 | 12.7 | 15 (2 to 18) |
British Columbia | 25 | 16.0 | 16 (10 to 24) |
Manitoba | 9 | 13.1 | 16 (4 to 17) |
New Brunswick | 7 | 12.6 | 15 (8 to 16) |
Newfoundland and Labrador | 3 | 13.7 | 15 (10 to 16) |
Northwest Territories | — | — | — |
Nova Scotia | 5 | 11.6 | 10 (9 to 15) |
Nunavut | — | — | — |
Ontario | 38 | 18.1 | 17 (7 to 24) |
Prince Edward Island | NR | NR | NR |
Quebec | 14 | 15.8 | 16 (2 to 24) |
Saskatchewan | 5 | 15.8 | 16 (14 to 17) |
Yukon | 1 | 10 | 10 (10 to 10) |
Canada | 130 | 15.3 | 16 (2 to 24) |
NR = not reported.
Notes: Survey response data were available for 130 out of 296 sites across 10 of the 11 jurisdictions with MRI capacity. No data were available for Prince Edward Island.
Data were derived from the following survey question: “In an average 24-hour day, how many hours are the units staffed through regular scheduled service capacity (do not include hours where staff are only on call)?”
Table 12: Summary of 24-Hours and Weekend Use of MRI by Province and Territory, 2022 to 2023
Province or territory | MRI operates 24 hours a day | MRI operates on the weekend |
|---|---|---|
Number of sites (percent of responding sites) | ||
Alberta | 0 (0% of 22) | 10 (45.5% of 22) |
British Columbia | 4 (15.4% of 26) | 24 (88.9% of 27) |
Manitoba | 0 (0% of 14) | 11 (78.6% of 14) |
New Brunswick | 1 (14.3% of 7) | 4 (57.1% of 7) |
Newfoundland and Labrador | 0 (0% of 4) | 0 (0% of 4) |
Northwest Territories | — | — |
Nova Scotia | 0 (0% of 5) | 2 (40.0% of 5) |
Nunavut | — | — |
Ontario | 15 (37.5% of 40) | 36 (92.3% of 39) |
Prince Edward Island | 0 (0% of 1) | NR |
Quebec | 3 (20% of 15) | 14 (93.3% of 15) |
Saskatchewan | 1 (20% of 5) | 4 (80.0% of 5) |
Yukon | 0 (0% of 1) | 0 (0% of 1) |
Canada | 24 (17.1% of 140) | 105 (75.5% of 139) |
NR = not reported.
Notes: Survey response data for operation 24 hours a day were available for 140 out of 296 sites across all jurisdictions with MRI capacity. Survey response data for weekend operation were available for 139 out of 296 sites across 10 of the 11 jurisdictions with MRI capacity. No data were available for Prince Edward Island.
Data were derived from the following survey questions: “Do any units operate 24 hours a day?” and “Do any units operate on the weekend?”
Table 13: Average Hours per Week of MRI Use by Province and Territory, 2022 to 2023
Province or territory | Number of reporting sites | Mean hours | Median hours (minimum to maximum) |
|---|---|---|---|
Alberta | 23 | 74.0 | 78 (10 to 122) |
British Columbia | 25 | 108.0 | 112 (57 to 168) |
Manitoba | 9 | 92.0 | 109 (28 to 115.5) |
New Brunswick | 7 | 69.7 | 75 (38 to 96) |
Newfoundland and Labrador | 3 | 79.0 | 75 (50 to 112) |
Northwest Territories | — | — | — |
Nova Scotia | 5 | 64.0 | 50 (46 to 90) |
Nunavut | — | — | — |
Ontario | 37 | 118.1 | 112 (38 to 168) |
Prince Edward Island | NR | NR | NR |
Quebec | 14 | 99.6 | 98 (10 to 168) |
Saskatchewan | 5 | 95.4 | 99 (80 to 101) |
Yukon | 1 | 50.0 | 50 (50 to 50) |
Canada | 129 | 97.4 | 99 (10 to 168) |
NR = not reported.
Notes: Survey response data were available for 129 out of 296 sites across 10 of the 11 jurisdictions with MRI capacity. No data were available for Prince Edward Island.
Data were derived from the following survey question: “In an average 168-hour week, how many hours are the [modality] units staffed through regular scheduled service capacity (do not include hours where staff are only on call)?”
Table 14: Planned and Unplanned Downtime at Sites With MRI Units, 2022 to 2023
Province or territory | Annual planned downtime | Annual unplanned downtime | ||
|---|---|---|---|---|
Number of reporting sites | Mean hours (minimum to maximum) | Number of reporting sites | Mean hours (minimum to maximum) | |
Alberta | 22 | 37.4 (4 to 120) | 22 | 134.8 (8 to 542) |
British Columbia | 25 | 31.8 (8 to 96) | 21 | 224.6 (16 to 1,500) |
Manitoba | 3 | 20 (12 to 44) | 9 | 48 (8 to 268) |
New Brunswick | 6 | 20.0 (4 to 32) | 4 | 149 (30 to 488) |
Newfoundland and Labrador | 2 | 24 (16 to 32) | 2 | 23 (16 to 30) |
Northwest Territories | — | — | — | — |
Nova Scotia | 4 | 20 (16 to 24) | 4 | 40 (20 to 72) |
Nunavut | — | — | — | — |
Ontario | 33 | 26.1 (8 to 62) | 25 | 46.4 (1 to 200) |
Prince Edward Island | NR | NR | NR | NR |
Quebec | 14 | 23.3 (12 to 56) | 10 | 36.4 (10 to 100) |
Saskatchewan | 5 | 40.4 (16 to 80) | 5 | 20 (8 to 32) |
Yukon | 1 | 8 (8 to 8) | 1 | 16 (16 to 16) |
Canada | 115 | 28.9 (4 to 120) | 103 | 102.5 (1 to 1,500) |
NR = not reported.
Notes: Survey response data for planned downtime were available for 115 out of 296 sites across 10 of the 11 jurisdictions with MRI capacity. No data were available for Prince Edward Island. Survey response data for unplanned downtime were available for 103 out of 296 sites across 10 of the 11 jurisdictions with MRI capacity. No data were available for Prince Edward Island.
Data were derived from the following survey questions: “How much planned downtime is anticipated for scheduled maintenance for all units in a given year? (expressed in hours)” and “How much unplanned downtime is experienced for all units in a given year? (expressed in hours).”
Table 15: Average Age of MRI Equipment, 2022 to 2023
Province or territory | Number of MRI units | Average age MRI (years, minimum to maximum) |
|---|---|---|
Alberta | 32 | 8.5 (1 to 14) |
British Columbia | 31 | 10.6 (0 to 23) |
Manitoba | 14 | 10.5 (5 to 19) |
New Brunswick | 7 | 8.4 (1 to 16) |
Newfoundland and Labrador | 2 | 4.5 (4 to 5) |
Northwest Territories | — | — |
Nova Scotia | 7 | 12.1 (4 to 17) |
Nunavut | — | — |
Ontario | 64 | 6.8 (0 to 22) |
Prince Edward Island | 1 | 4 (4 to 4) |
Quebec | 36 | 7.2 (0 to 19) |
Saskatchewan | 7 | 13 (7 to 17) |
Yukon | 1 | 9 (9 to 9) |
Canada | 202 | 8.4 (0 to 23) |
Notes: Survey response data were available for 202 of 432 MRI units across all jurisdictions with capacity.
Age for each unit was calculated from the following survey question: “What year did (or will) the [modality] unit become operational?” subtracted from 2023.
Table 16: Categories of Age of MRI Units in Years by Province and Territory, 2022 to 2023
Province or territory | Years | ||||
|---|---|---|---|---|---|
5 or less | 6 to 10 | 11 to 15 | 16 to 20 | Greater than 20 | |
Number of units (% of age categories) | |||||
Alberta | 8 (25.0) | 11 (34.4) | 13 (40.6) | 0 (0) | 0 (0) |
British Columbia | 8 (25.8) | 9 (29.0) | 6 (19.4) | 4 (12.9) | 4 (12.9) |
Manitoba | 3 (21.4) | 4 (28.6) | 3 (21.4) | 4 (28.6) | 0 (0) |
New Brunswick | 3 (42.9) | 1 (14.3) | 2 (28.6) | 1 (14.3) | 0 (0) |
Newfoundland and Labrador | 2 (100) | 0 (0) | 0 (0) | 0 (0) | 0 (0) |
Northwest Territories | — | — | — | — | — |
Nova Scotia | 2 (28.6) | 0 (0) | 1 (14.3) | 4 (57.1) | 0 (0) |
Nunavut | — | — | — | — | — |
Ontario | 28 (43.8) | 18 (28.1) | 13 (20.3) | 4 (6.2) | 1 (1.6) |
Prince Edward Island | 1 (100) | 0 (0) | 0 (0) | 0 (0) | 0 (0) |
Quebec | 16 (44.4) | 11 (30.6) | 4 (11.1) | 5 (13.9) | 0 (0) |
Saskatchewan | 0 (0) | 1 (14.3) | 5 (71.4) | 1 (14.3) | 0 (0) |
Yukon | 0 (0) | 1 (100) | 0 (0) | 0 (0) | 0 (0) |
Canada | 71 (35.1) | 56 (27.7) | 47 (23.3) | 23 (11.4) | 5 (2.5) |
Notes: Survey response data were available for 202 of 432 MRI units across all jurisdictions with capacity.
Age for each unit was calculated from the following survey question: “What year did (or will) the [modality] unit become operational?” subtracted from 2023.
Table 17: Summary of Type of Use by Clinical Specialty for MRI, 2022 to 2023
Use category | Average percent | Median percent (minimum to maximum) |
|---|---|---|
Neurologic | 28.0 | 25.0 (0 to 100) |
Musculoskeletal | 23.2 | 20.0 (0 to 78) |
Oncology | 16.6 | 15.5 (0 to 50) |
Hepatobiliary | 11.9 | 10.0 (0 to 30) |
Other | 6.0 | 0 (0 to 100) |
Inflammatory | 5.6 | 5 (0 to 25) |
Cardiac | 4.4 | 0 (0 to 90) |
Respiratory | 2.2 | 0 (0 to 20) |
Trauma | 2.1 | 1 (0 to 14) |
Notes: Survey response data on the average percentage of MRI use by discipline were available for 56 out of 296 sites across 9 out of 11 jurisdictions with MRI capacity. No data were available for Prince Edward Island and the Yukon.
Data were derived from the following survey question: “On average, what percentage of these exams fall into the following categories? The total percentage, expressed as a number, must add up to 100.” The following categories were provided: oncology, respiratory disease, hepatobiliary or gastrointestinal, musculoskeletal disorders, inflammatory or infectious diseases, neurologic, cardiac, trauma, and other use.
Table 18: Summary of Type of Use by Medical Category for MRI Units, 2022 to 2023
Use category | Average percent | Median percent (minimum to maximum) |
|---|---|---|
Diagnostic noncardiac | 90.6 | 99.5 (0 to 100) |
Diagnostic cardiac | 5.2 | 0 (0 to 100) |
Research | 2.0 | 0 (0 to 100) |
Interventional | 0.9 | 0 (0 to 10) |
Other | 0.0 | 0 (0 to 0) |
Notes: Survey response data on the average percentage of MRI use by discipline were available for 117 out of 296 sites across 10 out of 11 jurisdictions with MRI capacity. No data were available for Prince Edward Island.
Data were derived from the following survey question: “Based on your experience in the last fiscal year, what is the average percentage of overall time MRI units are used for?” The following categories were provided: cardiac, noncardiac, research, interventional, and other use.
Table 19: Summary of Use of AI in MRI, 2022 to 2023
Use of AI in MRI | Number of responses | Number of sites – yes (%) | Used for clinical purposes, research purposes, or botha | Jurisdictions (number of sites) |
|---|---|---|---|---|
Is AI used in lowering radiation dose? | 105 | 6 (5.7) | Clinical: 5, research: 0, both: 2 | BC (2), NB (1), ON (2), QC (1) |
Is AI used in reading and interpreting images? | 121 | 11 (9.1) | Clinical: 8, research: 2, both: 1 | BC (2), NB (1), ON (6), QC (2) |
Is AI used in image reconstruction? | 120 | 37 (30.8) | Clinical: 29, research: 1, both: 0 | BC (3), MB (9), NB (4), NS (1), ON (16), QC (4) |
Is AI used in treatment planning? | 112 | 3 (2.7) | Clinical: 2, research: 1, both: 0 | MB (1), ON (1), QC (1) |
Is AI used in predicting outcomes? | 113 | — | Clinical: 1, research: 1, both: 0 | — |
Is AI used for administrative tasks? | 114 | 5 (4.4) | Clinical: 2, research: 1, both: 0 | NB (1), ON (3), QC (1) |
AI = artificial intelligence; BC = British Columbia; MB = Manitoba; NB = New Brunswick; NS = Nova Scotia; ON = Ontario; QC = Quebec.
Notes: Number of sites out of 296 sites with MRI capacity that provided survey response data are indicated in the “Number of responses” column.
Data were derived from the following survey question: “Is artificial intelligence used to support: The reading/interpretation of images? Predicting outcomes? Lower radiation dose? Image resolution/reconstruction enhancement? Treatment planning? Administrative tasks?”
aThe “Used for clinical purposes, research purposes, or both” column includes sites that did not select “yes” for the use of AI, but provided responses for the setting of use (clinical or research).
Table 20: Types of Health Care Professionals That Have MRI Exam-Ordering Privileges, 2022 to 2023
Province or territory | Clinical specialists | Family physicians or general practitioners | Nurse practitioners |
|---|---|---|---|
Alberta | Yes, all | Yes | Yes |
Other: chiropractor, physiotherapist (with enhanced practice), podiatrist, dentist | |||
British Columbia | Yes, all | Yes | Yes |
Other: chiropractor, dentist, podiatric surgeon | |||
Manitoba | Yes, all | Yes | Yes |
New Brunswicka | Yes, all | NR | NR |
Newfoundland and Labrador | Yes, all | Only if indicated by a radiologist in a previous medical imaging report, or if needed to visit a specialist | |
Northwest Territories | MRI are referred to a southern facility. No MRI unit available in the Northwest Territories | Yes | Uncertain, may need physician co-signature |
Nova Scotia | Yes | Yes | Yes |
Nunavut | These are referrals out of territory and uncertain who has the capability to order. | ||
Ontario | NR | NR | NR |
Prince Edward Island | Yes, all | Yes | Yes |
For limited set of exams and only if specialist report indicates an MRI is required | |||
Quebec | Yes, all | Under certain conditions, not specified | Under certain conditions, not specified |
Saskatchewan | Yes, all | Yes | Yes |
Other: chiropractor Documentation or approval may be required such as: radiologist recommended MRI in previous imaging report, or other specialist recommendation | |||
Yukon | Yes, all | Yes | Yes |
NR = not reported.
Notes: Survey response data were available from 12 out of 13 jurisdictions. No data were available for Ontario.
Data were derived from the following question: “Which health care professionals can order imaging exams for MRI?”
aFor New Brunswick, the responses came from 1 of the 2 regional health authorities, the Horizon Health Network.
Table 21: Exam-Ordering Practice at Sites With MRI Units, 2022 to 2023
Province or territory | Automated entry | Paper forms | Requests by fax | Requests by telephone | Central booking | ||||||
|---|---|---|---|---|---|---|---|---|---|---|---|
Yes | No | Yes | No | Yes | No | Yes | No | All exams | Some exams | Not used | |
Number (%) of sites that use these exam-ordering practices | |||||||||||
Alberta | 12 (54.5) | 10 (45.5) | 22 (100) | 0 (0) | 22 (100) | 0 (0) | 11 (50) | 11 (50) | 2 (9.1) | 12 (54.5) | 8 (36.4) |
British Columbia | 5 (17.9) | 23 (82.1) | 27 (96.4) | 1 (3.6) | 26 (96.3) | 1 (3.7) | 2 (7.4) | 25 (92.6) | 13 (46.4) | 6 (21.4) | 9 (32.1) |
Manitoba | 1 (11.1) | 8 (88.9) | 0 (0) | 9 (100) | 9 (100) | 0 (0) | 0 (0) | 9 (100) | 0 (0) | 0 (0) | 9 (100) |
New Brunswick | 0 (0) | 6 (100) | 7 (100) | 0 (0) | 7 (100) | 0 (0) | 2 (28.6) | 5 (71.4) | 4 (57.1) | 0 (0) | 3 (42.9) |
Newfoundland and Labrador | 0 (0) | 4 (100) | 4 (100) | 0 (0) | 4 (100) | 0 (0) | 1 (25) | 3 (75) | 2 (50) | 2 (50) | 0 (0) |
Northwest Territories | — | — | — | — | — | — | — | — | — | — | — |
Nova Scotia | 0 (0) | 5 (100) | 4 (80) | 1 (20) | 5 (100) | 0 (0) | 1 (20) | 4 (80) | 2 (40) | 1 (20) | 2 (40) |
Nunavut | — | — | — | — | — | — | — | — | — | — | — |
Ontario | 27 (71.1) | 11 (28.9) | 36 (92.3) | 3 (7.7) | 36 (92.3) | 3 (7.7) | 9 (23.1) | 30 (76.9) | 26 (68.4) | 7 (18.4) | 5 (13.2) |
Prince Edward Island | 1 (100) | 0 (0) | 1 (100) | 0 (0) | 1 (100) | 0 (0) | 0 (0) | 1 (100) | 1 (100) | 0 (0) | 0 (0) |
Quebec | 3 (23.1) | 10 (76.9) | 13 (100) | 0 (0) | 13 (100) | 0 (0) | 1 (7.7) | 12 (92.3) | 2 (15.4) | 3 (23.1) | 8 (61.5) |
Saskatchewan | 0 (0) | 5 (100) | 5 (100) | 0 (0) | 5 (100) | 0 (0) | 3 (60) | 2 (40) | 1 (20) | 4 (80) | 0 (0) |
Yukon | 1 (100) | 0 (0) | 1 (100) | 0 (0) | 1 (100) | 0 (0) | 0 (0) | 1 (100) | 1 (100) | 0 (0) | 0 (0) |
Canada | 50 (37.9) | 82 (62.1) | 120 (89.6) | 14 (10.4) | 129 (97.0) | 4 (3.0) | 30 (22.6) | 103 (77.4) | 54 (40.6) | 35 (26.3) | 44 (33.1) |
Notes: Survey response data are available for 138 out of 296 sites across all jurisdictions with MRI capacity.
Data were derived from the following survey questions: “Are automated order entry forms (exams request) used?”; “Are paper forms (exams requests) used?”; “Are requests received by fax?”; “Are requests received by phone?”; and “Is a centralized order entry (booking) system used? For all exams: Yes/no; For some exams: yes/no.”
Table 22: Trends in Reported Field Strengths for MRI Units, 2001 to 2022–2023
Field strength | 2001 | 2007 | 2012 | 2015 | 2017 | 2019 to 2020 | 2022 to 2023 |
|---|---|---|---|---|---|---|---|
Number of units (% of total responses per survey year) | |||||||
0.2 | 1 (1.1) | 4 (1.8) | 3 (1.0) | 3 (1.0) | 0 | 0 | 0 |
0.23 | 1 (1.1) | 1 (0.5) | 0 | 0 | 0 | 0 | 0 |
0.3 | 1 (1.1) | 1 (0.5) | 1 (0.3) | 1 (0.3) | 1 (0.3) | 1 (0.3) | 0 |
0.35 | 0 | 1 (0.5) | 1 (0.3) | 1 (0.3) | 1 (0.3) | 0 | 0 |
0.4 | 0 | 1 (0.5) | 0 | 0 | 0 | 0 | 0 |
0.5 | 3 (3.3) | 2 (0.9) | 0 | 0 | 0 | 0 | 1 (0.4) |
0.6 | 0 | 0 | 1 (0.3) | 1 (0.3) | 0 | 0 | 0 |
1 | 19 (20.9) | 17 (7.8) | 9 (3.1) | 8 (2.6) | 4 (1.2) | 2 (0.6) | 1 (0.4) |
1.2 | 1 (1.1) | 0 | 0 | 0 | 0 | 0 | 0 |
1.3 | 0 | 1 (0.5) | 0 | 0 | 0 | 0 | 0 |
1.5 | 63 (69.2) | 184 (84.0) | 248 (84.1) | 253 (83.5) | 273 (83.7) | 276 (81.2) | 229 (81.8) |
3 | 1 (1.1) | 4 (1.8) | 29 (9.8) | 34 (11.2) | 44 (13.5) | 58 (17.1) | 49 (17.5) |
3.5 | 0 | 1 (0.5) | 0 | 0 | 0 | 0 | 0 |
4 | 1 (1.1) | 1 (0.5) | 1 (0.3) | 1 (0.3) | 1 (0.3) | 1 (0.3) | 0 |
5 | 0 | 0 | 0 | 0 | 1 (0.3) | 1 (0.3) | 0 |
9.4 | 0 | 1 (0.5) | 2 (0.7) | 1 (0.3) | 1 (0.3) | 1 (0.3) | 0 |
Notes: The 2022–2023 survey response data were available for 280 out of 432 MRI units across all jurisdictions with capacity.
Data were derived from the following survey question: “What is the field strength (tesla) of the MRI unit?”
Table 23: Trends in Reported MRI Unit Configurations, 2012 to 2022–2023
Configuration | 2012 | 2015 | 2017 | 2019 to 2020 | 2022 to 2023 |
|---|---|---|---|---|---|
Number of units (% of total responses per survey year) | |||||
Closed-bore – normal | 77 (60.6) | 95 (54.3) | 94 (55.0) | 132 (55.2) | 68 (40.0) |
Open-bore | 50 (39.4) | 55 (31.4) | 11 (6.4) | 10 (4.2) | 7 (4.1) |
Closed-bore – wide | 0 (0) | 25 (14.3) | 66 (38.6) | 97 (40.6) | 95 (55.9) |
Notes: The 2022–2023 survey response data were available for 170 out of 432 MRI units across all jurisdictions with capacity.
Data were derived from the following survey question: “What is the configuration of the MRI unit?”
Table 24: Population Estimates and Projections, 2007 to 2040
Province or territory | 2007 | 2015 | 2017 | 2020 | 2023 | 2025 (low- to high-growth projections) | 2030 (low- to high-growth projections) | 2035 (low- to high-growth projections) | 2040 (low- to high-growth projections) |
|---|---|---|---|---|---|---|---|---|---|
Alberta | 3,533,414 | 4,163,048 | 4,253,530 | 4,412,013 | 4,591,100 | 4,761,500 (4,696,600 to 4,816,400) | 5,254,600 (5,040,300 to 5,411,900) | 5,739,800 (5,356,300 to 6,033,800) | 6,212,900 (5,654,900 to 6,714,200) |
British Columbia | 4,312,048 | 4,795,547 | 4,962,706 | 5,173,896 | 5,451,700 | 5,642,800 (5,541,600 to 5,729,700) | 6,027,500 (5,752,300 to 6,238,900) | 6,306,700 (5,855,000 to 6,653,900) | 6,541,200 (5,917,400 to 7,085,800) |
Manitoba | 1,191,684 | 1,298,120 | 1,340,426 | 1,381,809 | 1,414,400 | 1,445,300 (1,422,700 to 1,467,000) | 1,527,900 (1,460,300 to 1,582,600) | 1,611,300 (1,493,300 to 1,711,800) | 1,686,700 (1,520,100 to 1,852,900) |
New Brunswick | 746,136 | 759,971 | 768,029 | 783,814 | 804,300 | 816,400 (808,200 to 822,800) | 837,700 (813,900 to 853,700) | 848,700 (808,100 to 877,500) | 854,700 (798,100 to 902,100) |
Newfoundland and Labrador | 510,256 | 528,843 | 530,153 | 526,046 | 519,500 | 517,500 (512,500 to 522,000) | 510,100 (496,900 to 521,200) | 499,300 (477,700 to 517,200) | 486,300 (456,900 to 512,600) |
Northwest Territories | 43,286 | 44,443 | 44,825 | 44,395 | 46,300 | 47,100 (46,500 to 47,600) | 48,600 (46,900 to 49,900) | 49,500 (46,600 to 51,800) | 50,100 (46,100 to 54,000) |
Nova Scotia | 935,433 | 938,914 | 956,074 | 989,154 | 1,023,500 | 1,046,100 (1,032,900 to 1,058,600) | 1,079,200 (1,043,800 to 1,109,400) | 1,091,800 (1,033,100 to 1,142,000) | 1,097,600 (1,016,900 to 1,175,100) |
Nunavut | 31,560 | 36,602 | 37,829 | 39,581 | 40,200 | 41,000 (40,700 to 41,300) | 43,000 (42,100 to 43,700) | 45,300 (43,600 to 46,500) | 47,700 (45,200 to 49,700) |
Ontario | 12,807,497 | 13,759,762 | 14,610,084 | 14,757,582 | 15,372,100 | 15,837,800 (15,573,200 to 16,067,500) | 16,883,800 (16,134,300 to 17,446,900) | 17,807,200 (16,534,000 to 18,795,500) | 18,615,400 (16,830,000 to 20,232,300) |
Prince Edward Island | 138,020 | 144,949 | 150,595 | 159,179 | 171,800 | 177,400 (174,300 to 179,900) | 187,700 (179,200 to 193,600) | 196,600 (182,200 to 207,200) | 204,400 (184,400 to 222,000) |
Quebec | 7,712,616 | 8,190,074 | 8,326,075 | 8,551,865 | 8,746,600 | 8,859,200 (8,757,800 to 8,953,600) | 9,080,500 (8,802,700 to 9,298,900) | 9,256,500 (8,788,300 to 9,621,900) | 9,396,500 (8,739,100 to 9,970,200) |
Saskatchewan | 1,007,305 | 1,125,588 | 1,151,044 | 1,165,963 | 1,199,500 | 1,226,100 (1,208,100 to 1,239,500) | 1,311,100 (1,251,800 to 1,349,100) | 1,398,300 (1,292,400 to 1,472,700) | 1,479,800 (1,327,800 to 1,608,600) |
Yukon | 32,663 | 37,730 | 39,705 | 42,109 | 45,000 | 46,500 (45,900 to 47,000) | 48,900 (47,600 to 50,200) | 50,100 (47,500 to 52,300) | 50,900 (47,200 to 54,300) |
Canada | 33,001,918 | 35,823,491 | 36,722,075 | 38,027,406 | 39,426,000 | 40,647,000 (39,861,100 to 40,992,800) | 42,840,800 (41,111,900 to 44,150,000) | 44,901,100 (41,958,100 to 47,184,200) | 46,724,200 (42,584,000 to 50,433,700) |
Note: Data retrieved from the Statistics Canada website.24
Table 25: Reported and Projected Numbers of MRI Units by Province and Territory, 2007 to 2040
Province or territory | 2007 | 2015 | 2017 | 2020 | 2023 | 2025 (low- to high-growth projections) | 2030 (low- to high-growth projections) | 2035 (low- to high-growth projections) | 2040 (low- to high-growth projections) |
|---|---|---|---|---|---|---|---|---|---|
Alberta | 27.0 | 41.0 | 42.0 | 44.0 | 43.0 | 44.6 (44.0 to 45.1) | 49.2 (47.2 to 50.7) | 53.8 (50.2 to 56.5) | 58.2 (53.0 to 62.9) |
British Columbia | 29.0 | 42.0 | 42.0 | 52.0 | 55.0 | 56.9 (55.9 to 57.8) | 60.8 (58.0 to 62.9) | 63.6 (59.1 to 67.1) | 66.0 (59.7 to 71.5) |
Manitoba | 8.0 | 10.0 | 12.0 | 14.0 | 14.0 | 14.3 (14.1 to 14.5) | 15.1 (14.5 to 15.7) | 15.9 (14.8 to 16.9) | 16.7 (15.0 to 18.3) |
New Brunswick | 5.0 | 10.0 | 10.0 | 14.0 | 11.0 | 11.2 (11.1 to 11.3) | 11.5 (11.1 to 11.7) | 11.6 (11.1 to 12.0) | 11.7 (10.9 to 12.3) |
Newfoundland and Labrador | 3.0 | 5.0 | 5.0 | 5.0 | 5.0 | 5.0 (4.9 to 5.0) | 4.9 (4.8 to 5.0) | 4.8 (4.6 to 5.0) | 4.7 (4.4 to 4.9) |
Northwest Territories | 0.0 | 0.0 | 0.0 | 0.0 | 0.0 | 0.0 (0.0 to 0.0) | 0.0 (0.0 to 0.0) | 0.0 (0.0 to 0.0) | 0.0 (0.0 to 0.0) |
Nova Scotia | 6.0 | 11.0 | 12.0 | 11.0 | 11.0 | 11.2a (11.1 to 11.4) | 11.6a (11.2 to 11.9) | 11.7 (11.1 to 12.3) | 11.8 (10.9 to 12.6) |
Nunavut | 0.0 | 0.0 | 0.0 | 0.0 | 0.0 | 0.0 (0.0 to 0.0) | 0.0 (0.0 to 0.0) | 0.0 (0.0 to 0.0) | 0.0 (0.0 to 0.0) |
Ontario | 72.0 | 125.0 | 122.0 | 124.0 | 157.0 | 161.8 (159.1 to 164.1) | 172.4 (164.8 to 178.2) | 181.9 (168.9 to 192.0) | 190.1 (171.9 to 206.6) |
Prince Edward Island | 1.0 | 1.0 | 1.0 | 1.0 | 1.0 | 1.0 (1.0 to 1.0) | 1.1 (1.0 to 1.1) | 1.1 (1.1 to 1.2) | 1.2 (1.1 to 1.3) |
Quebec | 67.0 | 85.0 | 107.0 | 102.0 | 123.0 | 124.6 (123.2 to 125.9) | 127.7 (123.8 to 130.8) | 130.2 (123.6 to 135.3) | 132.1 (122.9 to 140.2) |
Saskatchewan | 4.0 | 9.0 | 10.0 | 10.0 | 11.0 | 11.2 (11.1 to 11.4) | 12.0 (11.5 to 12.4) | 12.8 (11.9 to 13.5) | 13.6 (12.2 to 14.8) |
Yukon | 0.0 | 1.0 | 1.0 | 1.0 | 1.0 | 1.0 (1.0 to 1.0) | 1.1 (1.1 to 1.1) | 1.1 (1.1 to 1.2) | 1.1 (1.0 to 1.2) |
Canada | 222.0 | 340.0 | 364.0 | 378.0 | 432.0 | 433.4 (436.8 to 449.2) | 469.4 (450.5 to 483.8) | 492.0 (459.7 to 517.0) | 512.0 (466.6 to 552.6) |
Note: The projection was calculated as the product of the numbers of per capita units in 2022 to 2023 and the population projections in 2025, 2030, 2035, and 2040. The numbers of imaging units were provided by provincial or territorial validators in 2023. The population projections were retrieved from Statistics Canada website on January 18, 2024.24 The population projection assumed medium, low, and high growth.
aProjected unit count does not include anticipated new installation of CT units between 2026 and 2030.
Table 26: Reported and Projected Numbers of MRI Exams by Province and Territory, 2007 to 2040
Province or territory | 2007 | 2015 | 2017 | 2020 | 2023 | 2025 (low- to high-growth projections) | 2030 (low- to high-growth projections) | 2035 (low- to high-growth projections) | 2040 (low- to high-growth projections) |
|---|---|---|---|---|---|---|---|---|---|
Alberta | 139,516 | 236,406 | 192,375 | 201,208 | 231,033 | 239,607.9 (236,342.0 to 242,370.5) | 264,421.6 (253,637.6 to 272,337.2) | 288,837.8 (269,539.3 to 303,632.4) | 312,645.1 (284,565.5 to 337,871.5) |
British Columbia | 88,170 | 154,098 | 173,678 | 252,527 | 299,061 | 309,544.1 (303,992.6 to 314,311.1) | 330,647.4 (315,550.9 to 342,244.0) | 345,963.3 (321,184.6 to 365,009.4) | 358,827.1 (324,607.7 to 388,702.0) |
Manitoba | 38,028 | 73,460 | 77,735 | 95,250 | 91,497 | 93,495.9 (92,033.9 to 94,899.7) | 98,839.3 (94,466.3 to 102,377.8) | 104,234.4 (96,601.0 to 110,735.7) | 109,112.0 (98,334.7 to 119,863.4) |
New Brunswick | 24,496 | 41,310 | 44,592 | 46,309 | 49,376 | 50,118.8 (49,615.4 to 50,511.7) | 51,426.4 (49,965.3 to 52,408.7) | 52,101.7 (49,609.3 to 53,869.8) | 52,470.1 (48,995.4 to 55,379.9) |
Newfoundland and Labrador | 8,544 | 22,265 | 20,990 | 21,929 | 21,409 | 21,326.6 (21,120.5 to 21,512.0) | 21,021.6 (20,477.6 to 21,479.1) | 20,576.5 (19,686.4 to 21,314.2) | 20,567.5 (18,829.2 to 21,124.7) |
Northwest Territories | 0 | 0 | 0 | 0 | 0 | 0.0 (0.0 to 0.0) | 0.0 (0.0 to 0.0) | 0.0 (0.0 to 0.0) | 0.0 (0.0 to 0.0) |
Nova Scotia | 24,584 | 44,187 | 47,490 | 50,664 | 34,935 | 35,706.4 (35,255.9 to 36,133.1) | 36,836.2 (35,627.9 to 37,867.0) | 37,266.3 (35,262.7 to 38,979.8) | 37,464.3 (34,709.7 to 40,109.5) |
Nunavut | 0 | 0 | 0 | 0 | 0 | 0.0 (0.0 to 0.0) | 0.0 (0.0 to 0.0) | 0.0 (0.0 to 0.0) | 0.0 (0.0 to 0.0) |
Ontario | 446,681 | 974,500 | 866,953 | 831,038 | 963,563 | 992,754.3 (976,168.5 to 1,007,152.5) | 1,058,320.3 (1,011,339.7 to 1,093,616.8) | 1,116,201.4 (1,036,393.9 to 1,178,150.6) | 1,166,861.4 (1,054,947.9 to 1,268,212.9) |
Prince Edward Island | 2,839 | 4,567 | 4,279 | 5,348 | 5,803 | 5,992.2 (5,887.4 to 6,076.6) | 6,340.1 (6,053.0 to 6,539.4) | 6,640.7 (6,154.3 to 6,998.7) | 6,904.2 (6,228.6 to 7,498.6) |
Quebec | 224,890 | 349,945 | 380,357 | 431,655 | 450,947 | 456,752.3 (451,524.4 to 461,619.3) | 468,161.8 (453,839.3 to 479,421.8) | 477,235.8 (453,096.9 to 496,074.7) | 484,453.8 (450,560.3 to 514,031.9) |
Saskatchewan | 21,814 | 49,122 | 44,461 | 75,452 | 63,335 | 64,739.5 (63,789.1 to 65,447.0) | 69,227.6 (66,096.5 to 71,234.1) | 73,831.9 (68,240.2 to 77,760.3) | 78,135.2 (70,109.4 to 84,936.0) |
Yukon | 0 | 2,200 | 2,200 | 2,350 | 3,198 | 3,304.6 (3,262.0 to 3,340.1) | 3,475.2 (3,361.5 to 3,567.5) | 3,560.4 (3,375.7 to 3,716.8) | 3,617.3 (3,354.3 to 3,858.9) |
Canada | 1,019,562 | 1,952,060 | 1,855,110 | 2,013,730 | 2,214,157 | 2,272,490.2 (2,238,592.1 to 2,302,148.2) | 2,405,931.5 (2,308,836.8 to 2,479,456.0) | 2,521,637.6 (2,356,359.3 to 2,649,856.1) | 2,624,022.6 (2,391,509.7 to 2,832,347.4) |
Note: The projection was calculated as the product of the numbers of per capita exams in 2022 to 2023 and the population projections in 2025, 2030, 2035, and 2040. The numbers of imaging exams were provided by provincial or territorial validators in 2023. The population projections were retrieved from Statistics Canada website on January 18, 2024.24 The population projection assumed medium, low, and high growth.
Appendix 4: Supplementary Summary Tables for Publicly Funded Sites with MRI Units, 2022-2023
Note that this appendix has not been copy-edited.
Table 27: Average Hours per Day of MRI Use at Publicly Funded Sites by Province and Territory, 2022 to 2023
Province or territory | Number of reporting sites | Mean hours | Median hours (minimum to maximum) |
|---|---|---|---|
Alberta | 22 | 12.6 | 15.5 (2 to 18) |
British Columbia | 25 | 16 | 16 (10 to 24) |
Manitoba | 9 | 13.1 | 16 (4 to 17) |
New Brunswick | 7 | 12.6 | 15 (8 to 16) |
Newfoundland and Labrador | 3 | 13.7 | 15 (10 to 16) |
Northwest Territories | — | — | — |
Nova Scotia | 5 | 11.6 | 10 (9 to 15) |
Nunavut | — | — | — |
Ontario | 36 | 18.2 | 17 (7 to 24) |
Prince Edward Island | NR | NR | NR |
Quebec | 14 | 15.8 | 16 (2 to 24) |
Saskatchewan | 5 | 15.8 | 16 (14 to 17) |
Yukon | 1 | 10 | 10 (10 to 10) |
Canada | 127 | 15.3 | 16 (2 to 24) |
NR = not reported.
Notes: Overall, 127 out of 130 sites that reported information for MRI weekly operation identified as public facilities.
Data were derived from the following survey question: “In an average 24-hour day, how many hours are the units staffed through regular scheduled service capacity (do not include hours where staff are only on call)”.
Table 28: Average Hours per Week of MRI Use at Publicly Funded Sites by Province and Territory, 2022 to 2023
Province or territory | Number of reporting sites | Mean hours | Median hours (minimum to maximum) |
|---|---|---|---|
Alberta | 22 | 73.8 | 80.5 (10 to 122) |
British Columbia | 25 | 108.0 | 112 (58 to 168) |
Manitoba | 9 | 92.0 | 109 (28 to 115.5) |
New Brunswick | 7 | 69.7 | 75 (38 to 96) |
Newfoundland and Labrador | 3 | 79.0 | 75 (50 to 112) |
Northwest Territories | — | — | — |
Nova Scotia | 5 | 64.0 | 50 (46 to 90) |
Nunavut | — | — | — |
Ontario | 35 | 118.8 | 112 (38 to 168) |
Prince Edward Island | NR | NR | NR |
Quebec | 14 | 99.6 | 98 (10 to 168) |
Saskatchewan | 5 | 95.4 | 99 (80 to 101) |
Yukon | 1 | 50.0 | 50 (50 to 50) |
Canada | 126 | 97.4 | 99 (10 to 168) |
NR = not reported.
Notes: Overall, 126 out of 129 sites that reported information for MRI weekly operation identified as public facilities.
Data derived from survey question: “In an average 168-hour week, how many hours are the [modality] units staffed through regular scheduled service capacity (do not include hours where staff are only on call)?”
Table 29: Average Age of Publicly Funded MRI Equipment, 2022 to 2023
Province or territory | Number of MRI units | Average age MRI (years, minimum to maximum) |
|---|---|---|
Alberta | 30 | 8.7 (1 to 14) |
British Columbia | 31 | 10.6 (0 to 23) |
Manitoba | 14 | 10.5 (5 to 19) |
New Brunswick | 7 | 8.4 (1 to 16) |
Newfoundland and Labrador | 2 | 4.5 (4 to 5) |
Northwest Territories | — | — |
Nova Scotia | 7 | 12.1 (4 to 17) |
Nunavut | — | — |
Ontario | 63 | 6.9 (0 to 22) |
Prince Edward Island | 1 | 4 (4 to 4) |
Quebec | 36 | 7.2 (0 to 19) |
Saskatchewan | 7 | 13 (7 to 17) |
Yukon | 1 | 9 (9 to 9) |
Canada | 199 | 8.4 (0 to 23) |
Notes: Overall, 199 out of 202 MRI units with information reported for operational age were located at public facilities.
Age for each unit was calculated from the following survey question: “What year did (or will) the [modality] unit become operational?” subtracted from 2023.
ISSN: 2563-6596
Disclaimer: The information in this document is intended to help Canadian health care decision-makers, health care professionals, health systems leaders, and policy-makers make well-informed decisions and thereby improve the quality of health care services. While patients and others may access this document, the document is made available for informational purposes only and no representations or warranties are made with respect to its fitness for any particular purpose. The information in this document should not be used as a substitute for professional medical advice or as a substitute for the application of clinical judgment in respect of the care of a particular patient or other professional judgment in any decision-making process. The Canadian Agency for Drugs and Technologies in Health (CADTH) does not endorse any information, drugs, therapies, treatments, products, processes, or services.
While care has been taken to ensure that the information prepared by CADTH in this document is accurate, complete, and up-to-date as at the applicable date the material was first published by CADTH, CADTH does not make any guarantees to that effect. CADTH does not guarantee and is not responsible for the quality, currency, propriety, accuracy, or reasonableness of any statements, information, or conclusions contained in any third-party materials used in preparing this document. The views and opinions of third parties published in this document do not necessarily state or reflect those of CADTH.
CADTH is not responsible for any errors, omissions, injury, loss, or damage arising from or relating to the use (or misuse) of any information, statements, or conclusions contained in or implied by the contents of this document or any of the source materials.
This document may contain links to third-party websites. CADTH does not have control over the content of such sites. Use of third-party sites is governed by the third-party website owners’ own terms and conditions set out for such sites. CADTH does not make any guarantee with respect to any information contained on such third-party sites and CADTH is not responsible for any injury, loss, or damage suffered as a result of using such third-party sites. CADTH has no responsibility for the collection, use, and disclosure of personal information by third-party sites.
Subject to the aforementioned limitations, the views expressed herein are those of CADTH and do not necessarily represent the views of Canada’s federal, provincial, or territorial governments, or any third-party supplier of information.
This document is prepared and intended for use in the context of the Canadian health care system. The use of this document outside of Canada is done so at the user’s own risk.
This disclaimer and any questions or matters of any nature arising from or relating to the content or use (or misuse) of this document will be governed by and interpreted in accordance with the laws of the Province of Ontario and the laws of Canada applicable therein, and all proceedings shall be subject to the exclusive jurisdiction of the courts of the Province of Ontario, Canada.
The copyright and other intellectual property rights in this document are owned by CADTH and its licensors. These rights are protected by the Canadian Copyright Act and other national and international laws and agreements. Users are permitted to make copies of this document for noncommercial purposes only, provided it is not modified when reproduced and appropriate credit is given to CADTH and its licensors.
About CADTH: CADTH is an independent, not-for-profit organization responsible for providing Canada’s health care decision-makers with objective evidence to help make informed decisions about the optimal use of drugs, medical devices, diagnostics, and procedures in our health care system.
Funding: CADTH receives funding from Canada’s federal, provincial, and territorial governments, with the exception of Quebec.
Questions or requests for information about this report can be directed to Requests@CADTH.ca