CADTH Health Technology Review
Canadian Medical Imaging Inventory 2022–2023: CT
CMII Report
Abbreviations
AI
artificial intelligence
CDST
clinical decision support tool
CIHI
Canadian Institute for Health Information
CMII
Canadian Medical Imaging Inventory
FTE
full-time equivalent
MRT
medical radiation technologist
OECD
Organisation for Economic Co-operation and Development
PACS
picture archiving and communication system
Key Messages
CT is an imaging technique that uses X-rays, sensitive radiation detectors, and computer analysis to produce cross-sectional images to detect abnormalities in areas of the body.
CT was reported to have the largest demand in oncology (24%), followed by neurology (16.5%) and hepatobiliary (14%) use. Applications for CT continue to expand to new clinical indications and therapeutic areas.
Five hundred and sixty CT units were identified by the CMII in its 2022–2023 national survey, with all provinces and territories reporting CT capacity. Most sites are publicly funded hospitals located in urban settings.
Canada has an average of 14 CT units per million people. The greatest density of units per million people is in Newfoundland and Labrador, New Brunswick, Yukon, Northwest Territories and Nunavut.
Canada is positioned in the bottom 15% of OECD countries in units per million population and the top 45% of OECD countries for average volume of publicly funded CT exams per1,000 population.
Approximately 6.4 million publicly funded CT examinations were performed in the 2022–2023 fiscal year. This represents a national average of 160.2 exams per 1,000 people, an increase of 9% since 2015.
The average age of CT equipment in Canada is 8.2 years; 29.8% of CT units are 5 years old or newer, 36.7% are 6 to 10 years old, and 33.4% are more than 10 years old.
The adoption and use of radiation safety strategies are increasing in Canada. An increasing number of CT units are now equipped with dose-management controls and patient dose recording features. Approximately 30% of CT units are reported to have dual-target imaging.
CT units operate an average of 14 hours per day. Approximately 80% of sites reported CT operation on weekends and 40% of sites reported CT operation 24 hours a day.
What Is the Context?
CT is a versatile and widely applied imaging technique that uses X-rays, sensitive radiation detectors, and computer analysis to produce cross-sectional images to detect abnormalities in areas of the body (Appendix 1).1-3 It plays an integral role in the clinical management of patients in Canada, and is used to detect cancers, injury, or disease, in areas of the body such as the head, spine, cardiovascular system, and heart.1,4
The main advantages of CT compared to other imaging modalities are its speed, which enables rapid imaging and diagnosis in urgent situations, and its ability to visualize fine details in bone, lungs, and other organs.2
Continuous technical advancements in CT imaging — such as portable and point-of-care technologies, photon-counting detectors, remote access capabilities and artificial intelligence (AI) tools — are intended to support system efficiencies, and improve access and diagnostic accuracy. In addition, improvements in image resolution and patient safety features have further expanded the clinical applications of CT.3,5,6
While the number of CT units exceeds that of any other advanced imaging modality, in 2023, wait times for medically necessary elective (non-urgent and scheduled) CT exams exceeded the recommended 30-day maximum target,7 with a national average wait time of 46 days.8 When considering other factors that contribute to CT use, such as an aging population and the growing incidence of cancer and other diseases, some authors have expressed concerns about whether Canada’s inventory of CT units can accommodate current and future demand and the potential impact on wait times.3,9-11
As CT imaging technology advances, decision-makers and clinicians face complex procurement and implementation decisions within the context of a finite health care budget and limited availability of clinical and technical expertise.
To better understand the medical imaging landscape in Canada, the CMII was created in 2015 to track, compare, and map trends over time related to the availability, distribution, technical specifications, and use of advanced imaging equipment (i.e., CT, MRI, PET-CT, PET-MRI, SPECT, and SPECT-CT) in Canada. This is the fourth iteration of the CMII since CADTH resumed the collection of this data in 2015. Previously, the Canadian Institute for Health Information (CIHI) collected data on medical imaging technologies in Canada from 2003 to 2012.
The CMII collects data through a survey conducted approximately once every 2 years and details the use of strategies for improving appropriate imaging, enhancing system efficiencies, reducing wait lists, and addressing other systemic challenges. Through this work, the CMII provides health care decision-makers with information on the imaging landscape in Canada, which may be used to identify and address service and medical equipment gaps and inform strategic planning.
This report summarizes the CT-related findings from the 2022–2023 national CMII survey.
What Did We Do?
The purpose of this Canadian Medical Imaging Inventory (CMII) report is to document current practices and developments in the supply, distribution, technical operations, and general clinical use of CT across Canada. This report is 1 component of a series of publications produced as part of the CMII national survey that also includes MRI, PET-CT, PET-MRI, SPECT, and SPECT-CT.
Why Did We Do This?
The CMII provides information on the medical imaging landscape across Canada to help support health care decision-making. Robust data are required to ensure health systems can deliver the imaging required to provide timely, safe, patient-centred care; improve health outcomes; and deliver health care efficiencies. Further details on the purpose of the CMII are provided in the CMII 2022–2023 Provincial and Territorial Overview report, located on the CMII webpage.
Methods Overview
Data were primarily collected for 6 imaging modalities, including CT, using a web-based self-report survey (refer to the Canadian Medical Imaging Inventory 2022–2023: Methods document located on the CMII webpage). Data were supplemented with information from provincial and territorial validators who are senior medical imaging–related health care decision-makers. In addition, data from peer reviewers, literature searches, and CIHI, as well as previous iterations of CMII data, were incorporated into the report. Both English and French versions of the survey were provided.
The CMII survey collected the following data:
number and location of imaging equipment
volume of exams
hours of equipment operation
age of imaging equipment
technical specifications of machines
adoption of new and emerging supportive tools and technologies
imaging storing and communication services.
The survey opened on May 5, 2023, and primary data collection and validator responses were collected until October 31, 2023. The full data collection and analysis strategy, including survey development, respondent identification, sources of data used, and data validation procedures can be found in the Canadian Medical Imaging Inventory 2022–2023: Methods document on the CMII webpage.
The CMII also presents data from both the survey and other sources relating to human resources, funding structures, ordering and referral practices, and the adoption of tools that may support appropriate imaging, system efficiencies, and wait-list reductions.
Comparisons between Canadian data and data from other OECD countries are reported, as are trends and projections on imaging capacity.
Response Rate for the 2022–2023 National Survey
A total of 504 sites were invited to participate in the survey. Data on modalities and unit counts were available for 467 sites (92.7%).
A 100% participation rate was received from publicly funded facilities (i.e., hospitals) in 7 provinces and all territories. The participation rate for the remaining provinces ranged from 51% to 93% for publicly funded facilities.
A complete response rate was received for unit counts and exam volumes by provincial and territorial validators, while the response rate varied for other survey questions. A total of 308 sites provided updated or new information (72%), reflecting an increased response rate of 34% since the CMII 2019–2020 survey.
While the overall survey participation rate was high, in some instances, not all survey questions were answered. This may lead to a nonresponse bias, which may result in the overgeneralization of some findings. To enable readers to assess representativeness of each data point, the number of sites that responded to each question are included alongside the reported data in this report.
Provincial and territorial validators provided high-level information for nonresponding publicly funded health facilities. Data obtained from the previous survey iteration, and from other sources (e.g., personal communications, websites of health care facilities), were used to inform the status of the remaining sites. Data from free-standing sites with private imaging capacity supplemented data for public capacity; detailed information for private imaging facilities is limited due to the low number of survey responses.
The survey questions and full data collection and analysis strategy — including survey development, respondent identification, sources of data used, and data validation procedures — can be found in the Canadian Medical Imaging Inventory 2022–2023: Methods document on the CMII webpage. Definitions of the types of facilities included in the survey are provided in Appendix 2.
CT Imaging Facility Overview
Characteristics of Facilities With CT Equipment
A summary of the type, location, and funding source for facilities in Canada with CT equipment that responded to the 2022–2023 survey is provided subsequently.
Overall, 560 CT units are distributed across 394 sites in all provinces and territories in Canada (Figure 1).
Figure 1: Geographic Distribution of CT Units in Canada, 2022–2023
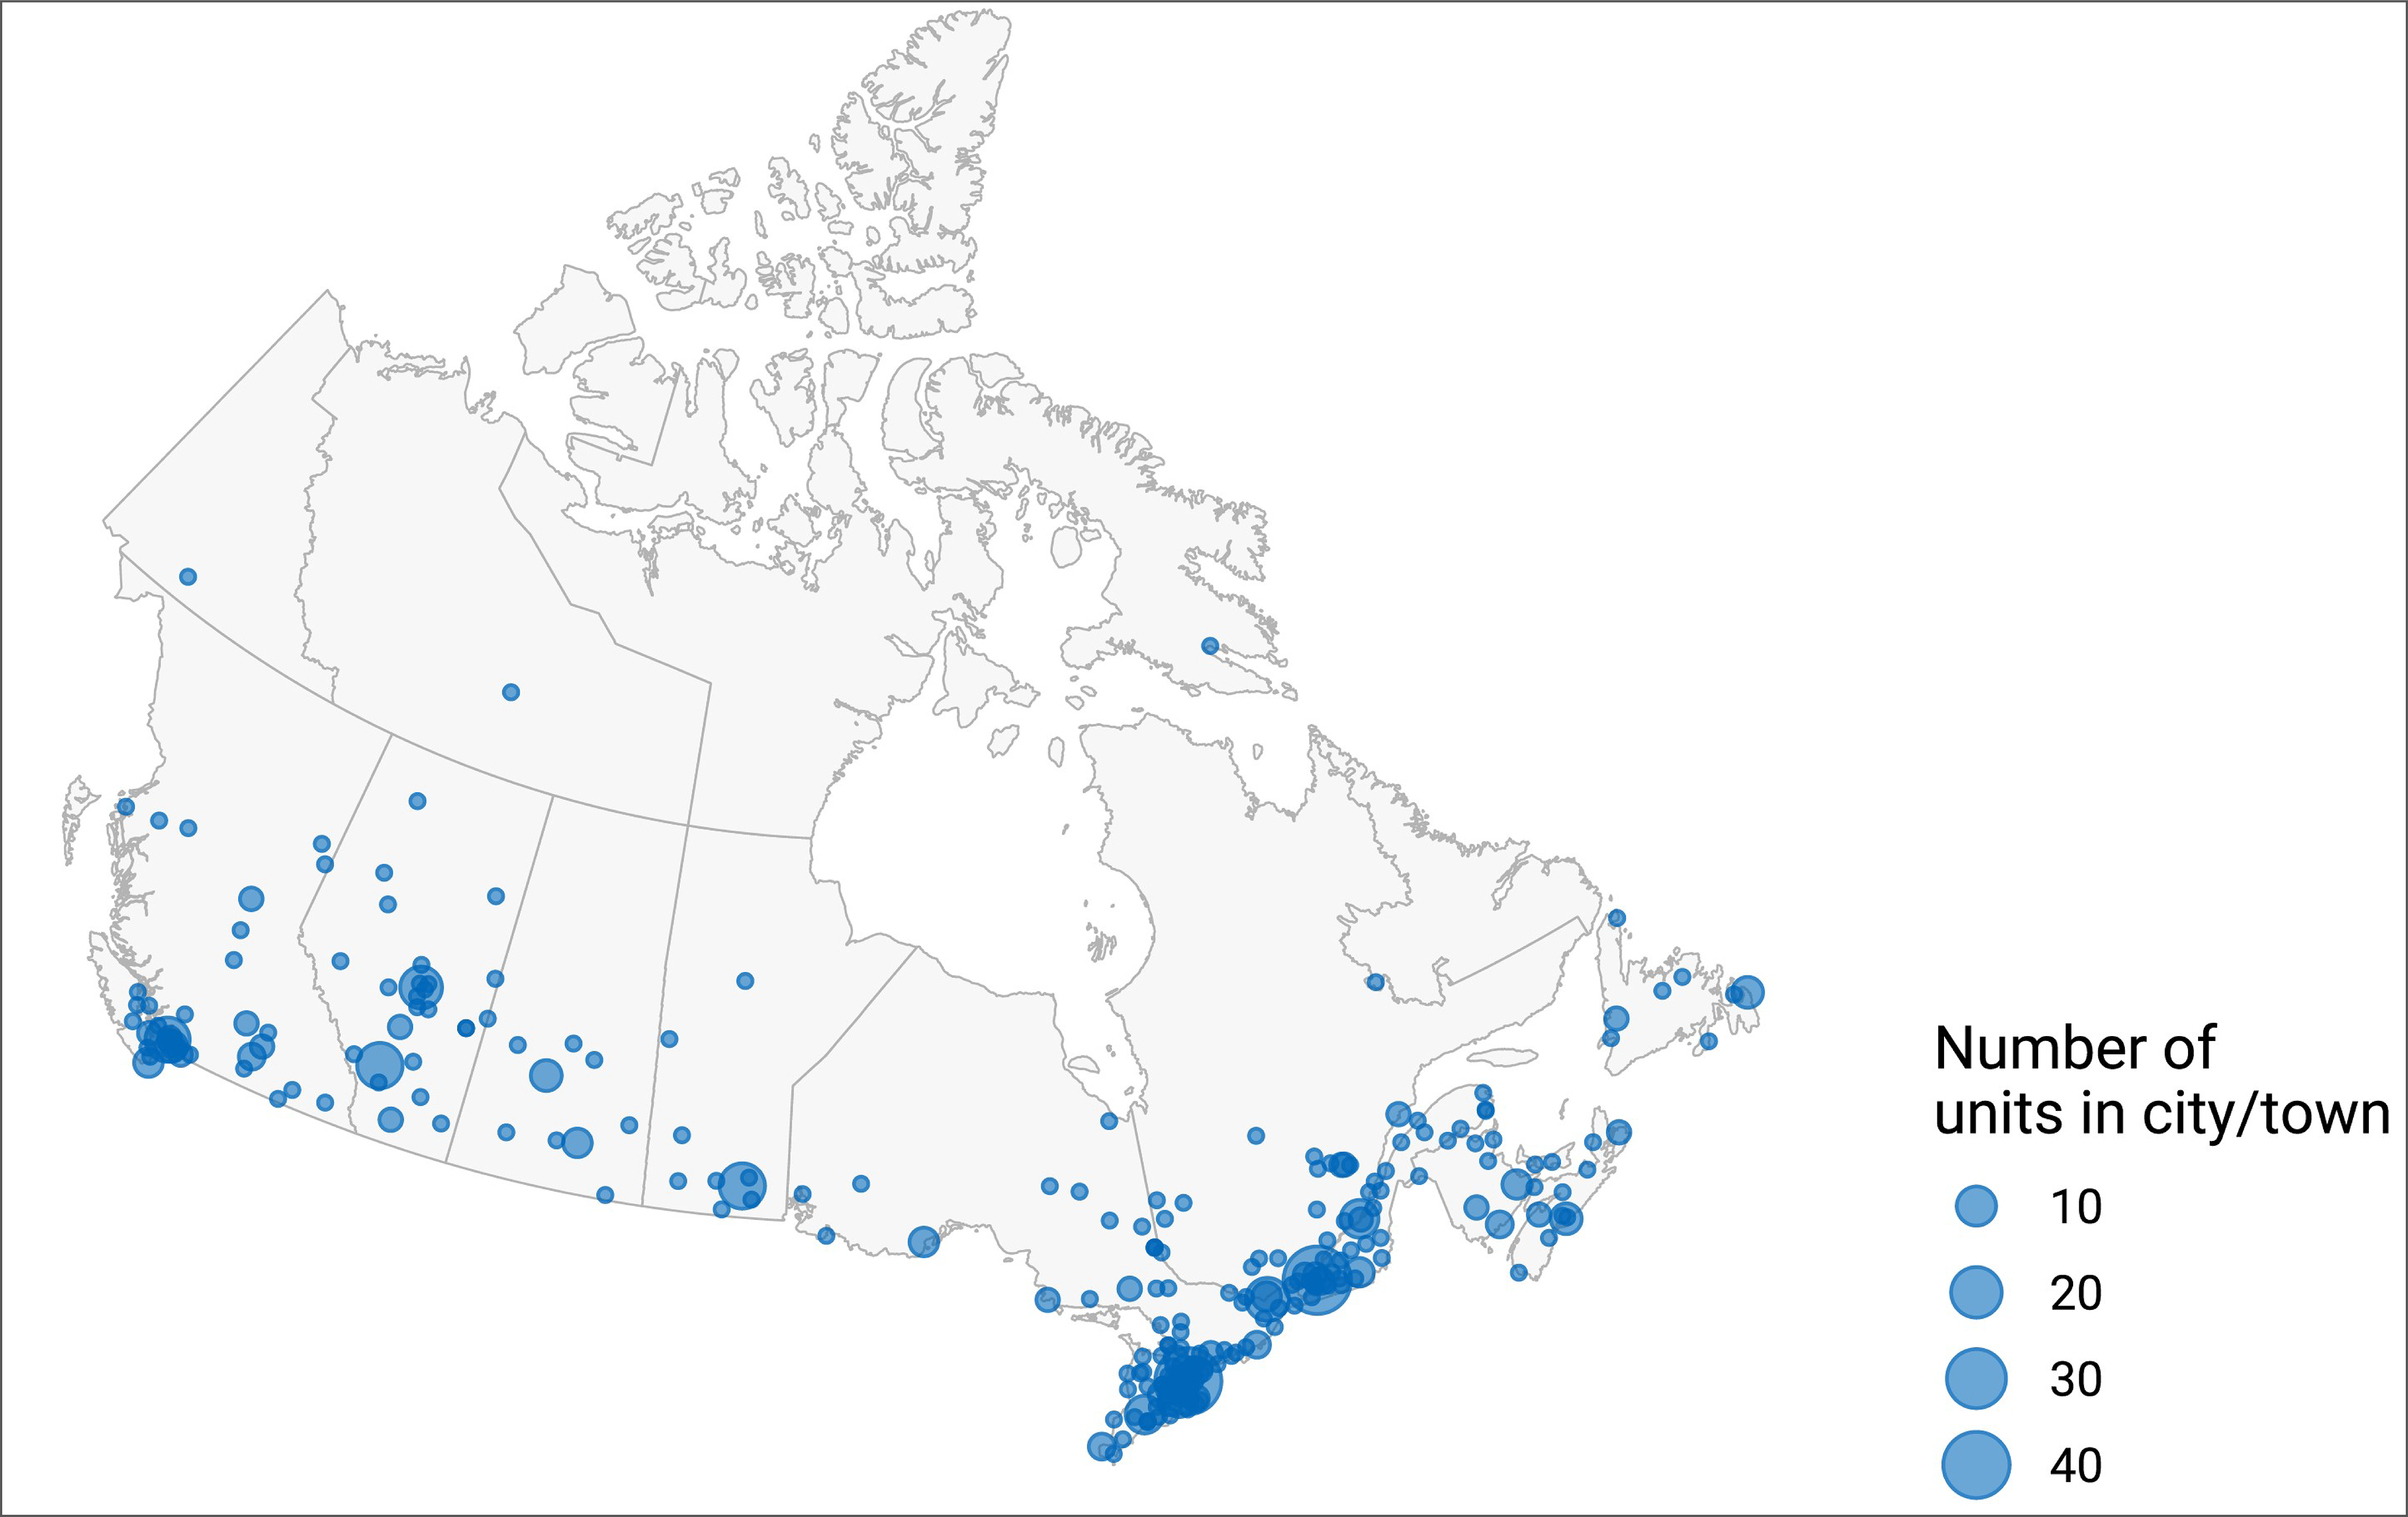
Notes: Location information is available for all units across all jurisdictions with CT capacity.
Location was derived from the survey and validator data.
Location and Facility Characteristics of CT Units
In total, 70.9% of sites with CT units reported that they are hospitals, 11.7% reported that they are community hospitals, 9.1% identified as tertiary care centres, and 8.3% of sites identified as private facilities (Figure 2 and Appendix 3, Table 6). Data came from 375 sites with responses to this survey question. Definitions for the type of facility included in the survey are provided in Appendix 2.
Overall, 61.2% of sites reported operation in an urban setting, 36.0% reported rural operation, and 2.8% of sites reported remote operation (Figure 3 and Appendix 3, Table 7). Data came from 289 sites with response to this survey question.
Regarding funding sources, 94.3% of sites reported being publicly funded, 4.1% reported private funding, and 1.6% reported receiving funds from both public and private sources (Figure 4 and Appendix 3, Table 8). Data came from 317 sites that responded to this survey question.
Figure 2: Types of CT Imaging Facilities in Canada, 2022–2023
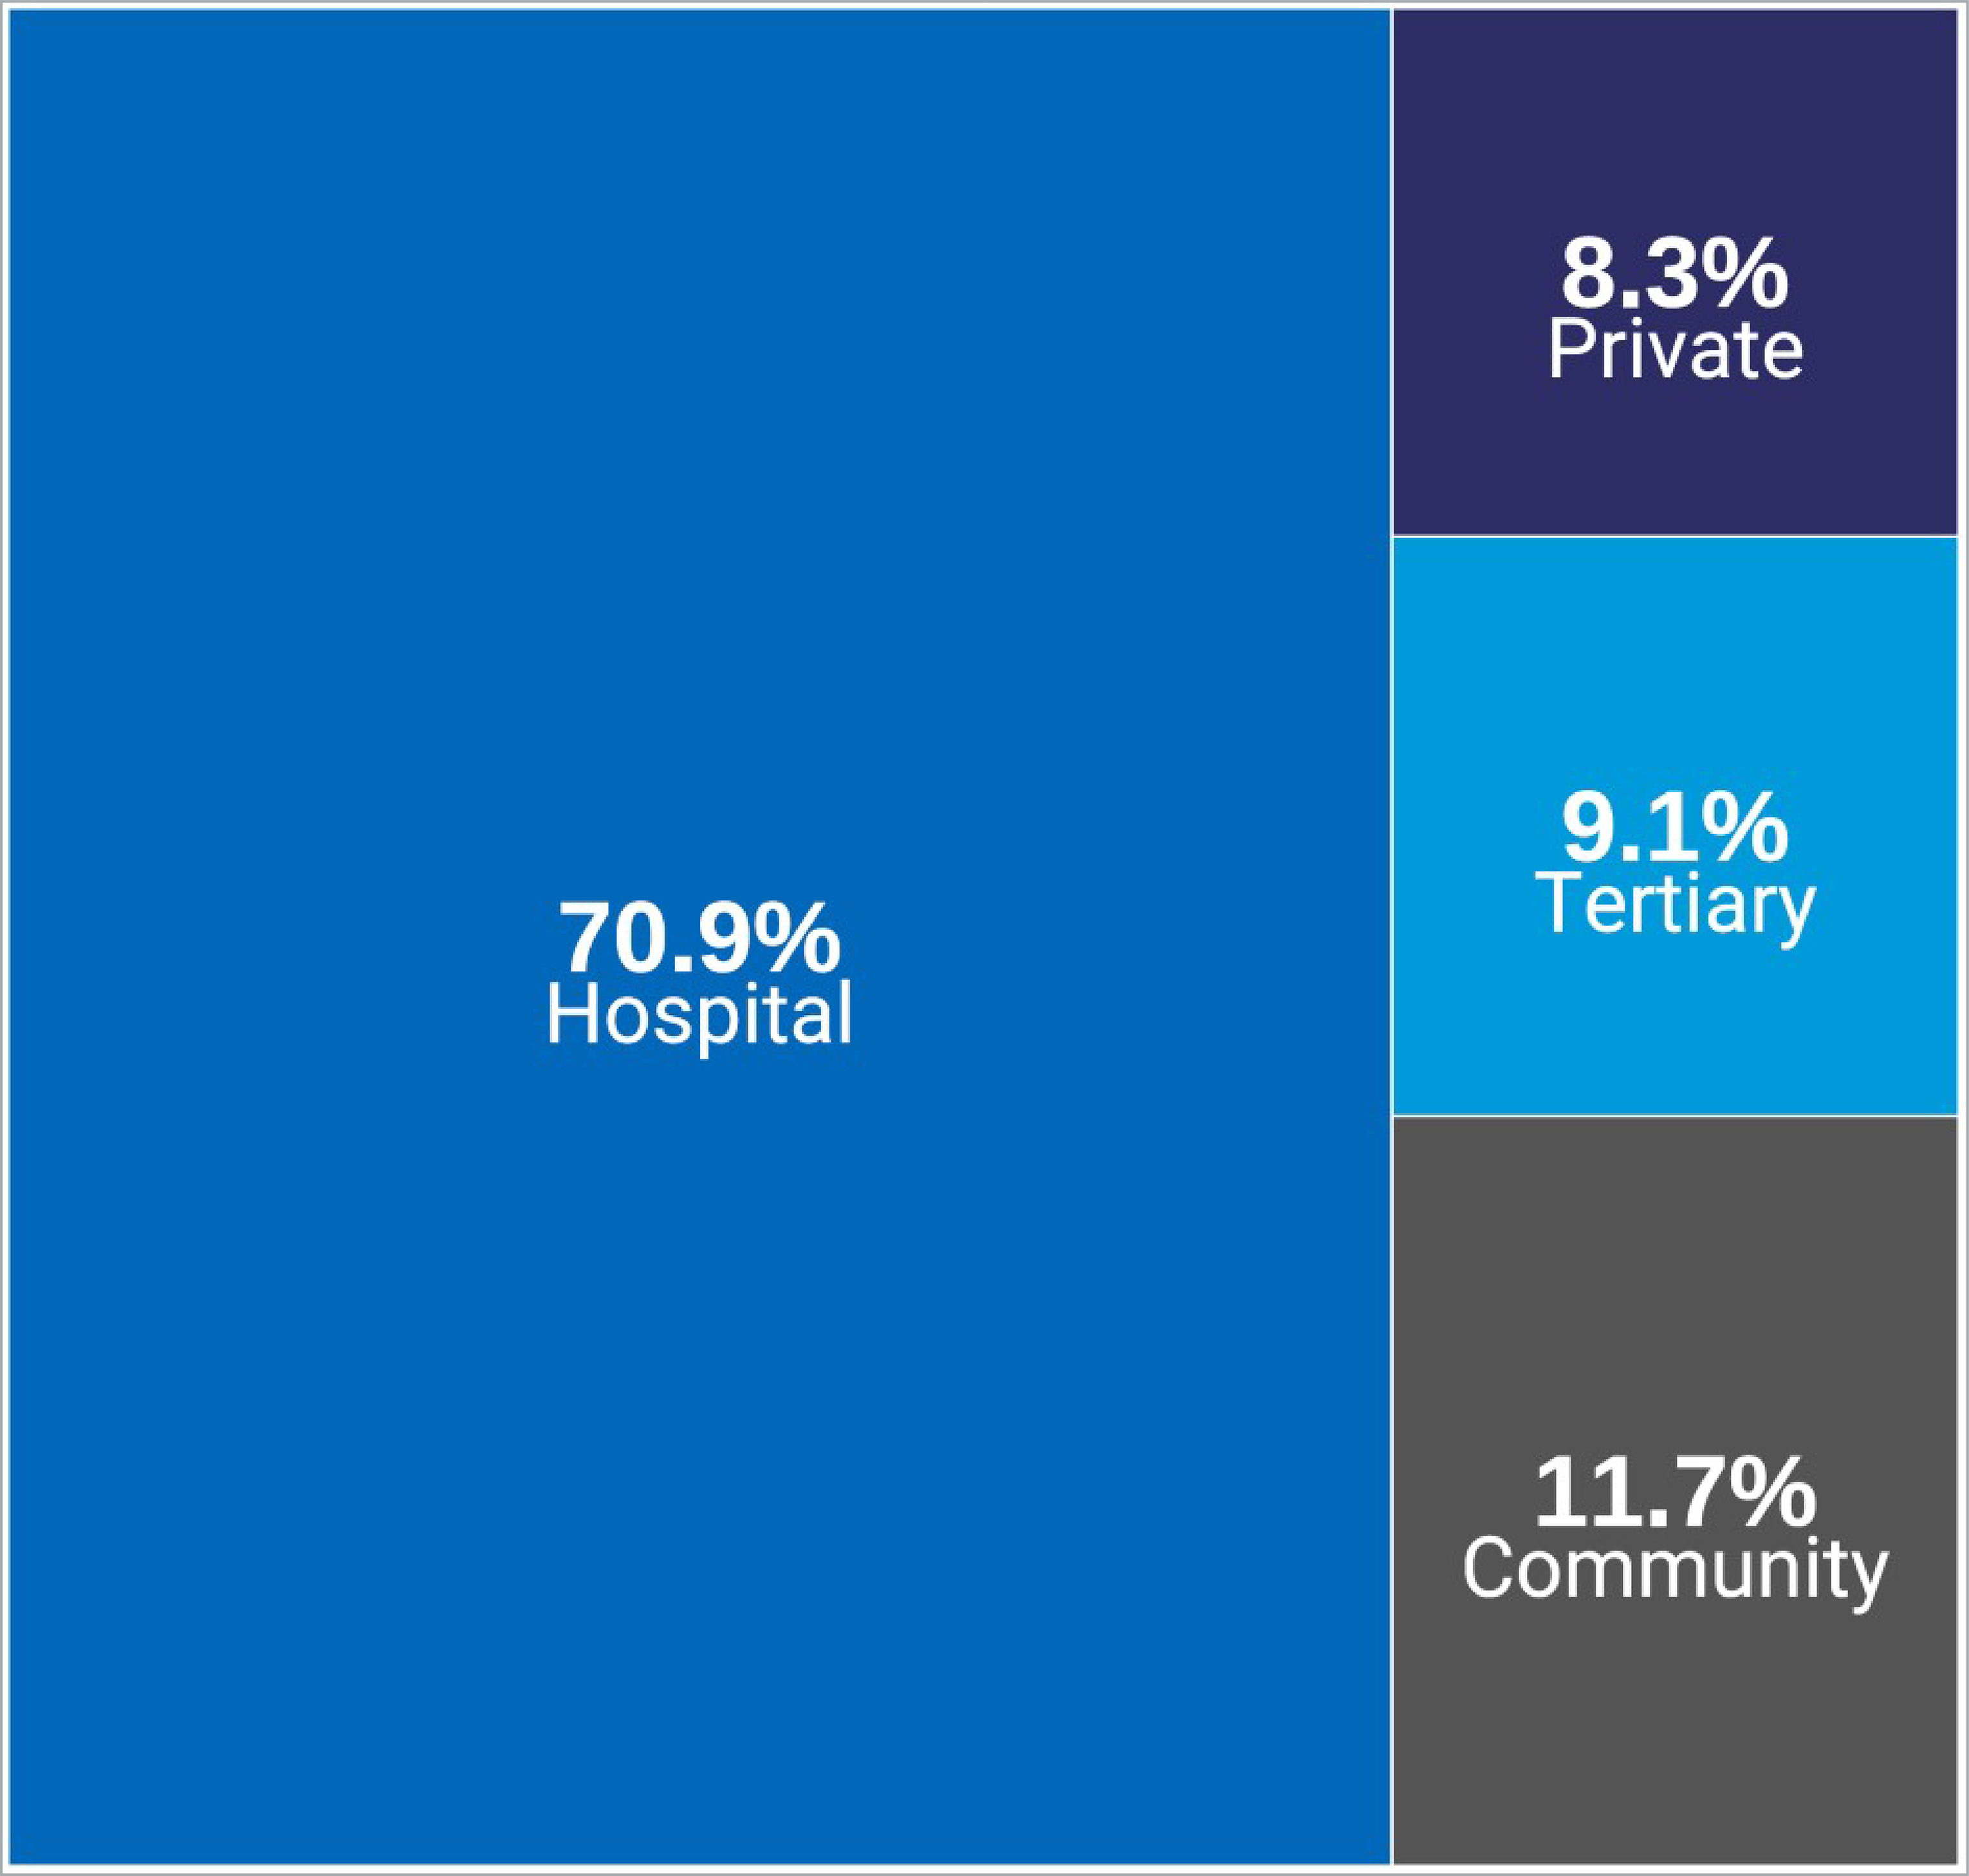
Notes: Survey response data were available for 375 out of 394 sites across all jurisdictions with CT capacity.
Data were derived from the following survey question: “What type of facility is this?”
Figure 2 presents the number of sites as proportions according to facility type of all reported sites. Survey responses for facility type from private sites were limited due to a low response rate.
Data summaries by province and territory are available in Appendix 3, Table 6.
Definitions for type of facility are in Appendix 2.
Figure 3: Geographic Setting of CT Imaging Facilities in Canada, 2022–2023
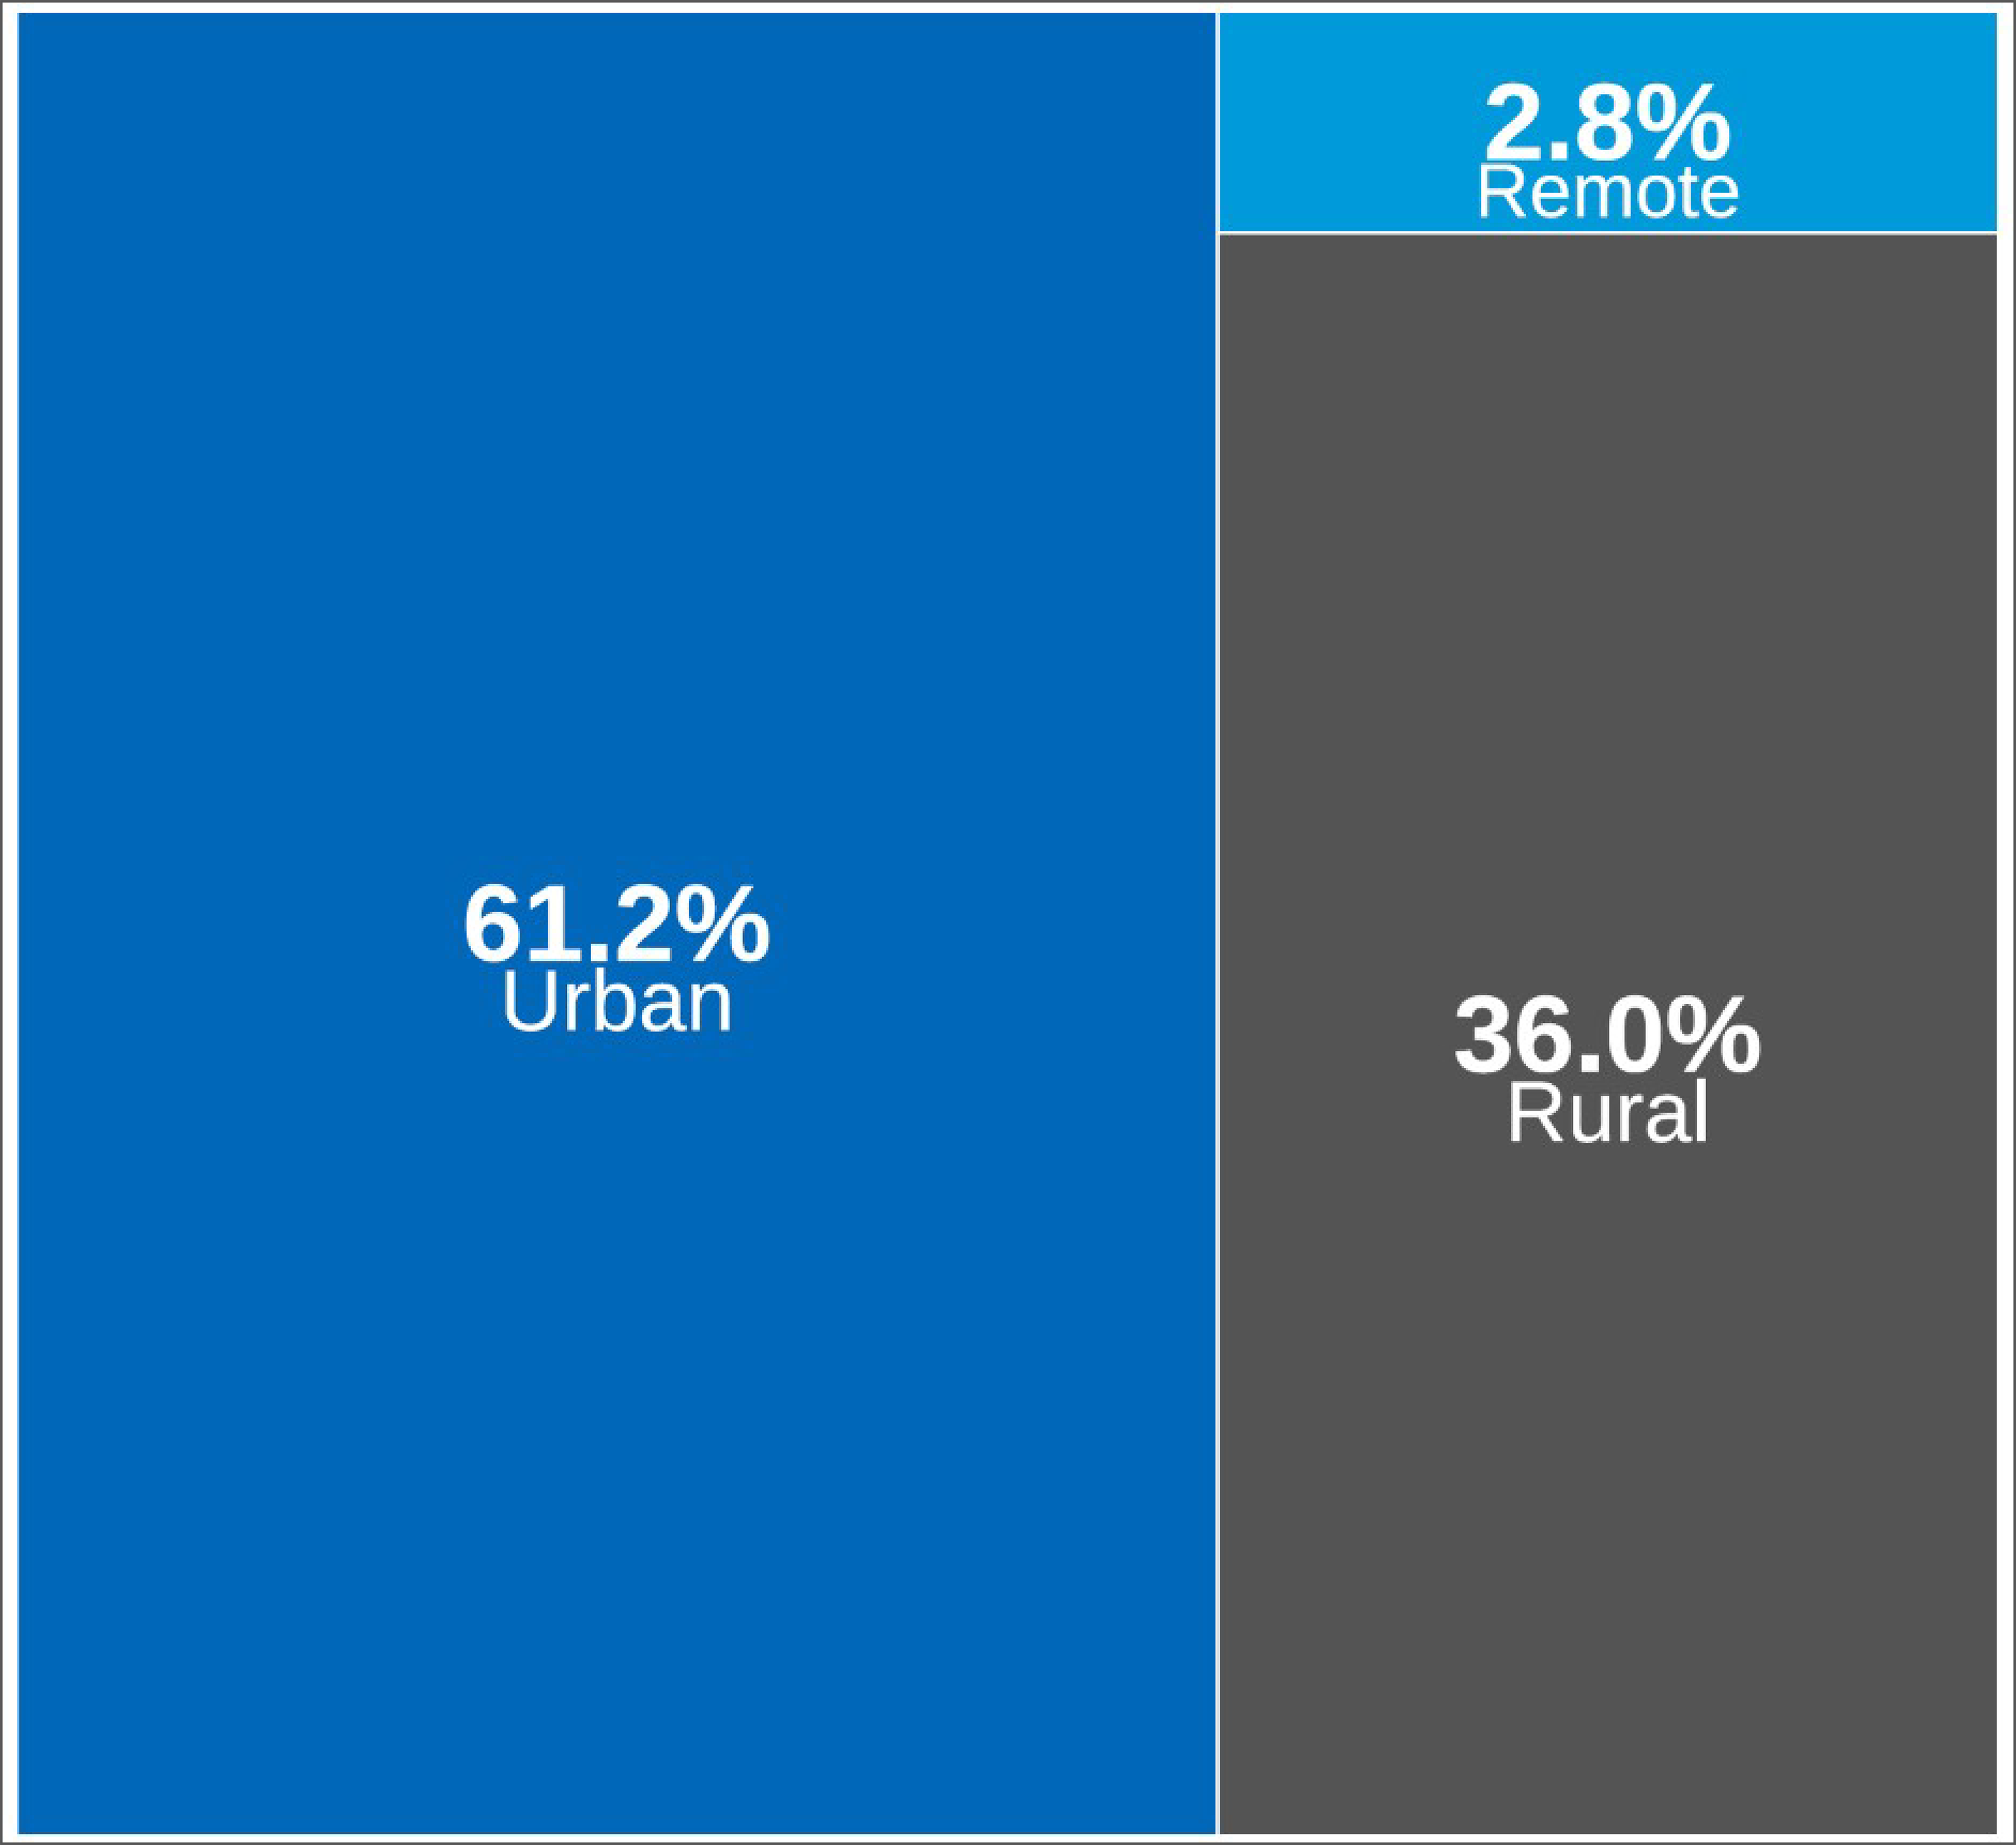
Notes: Survey response data were available for 289 out of 394 sites across all jurisdictions with CT capacity.
Data were derived from the following survey question: “In which of the following settings are you located?”
Survey responses for graphic setting from private sites were limited due to a low response rate.
Figure 3 presents the number of sites as proportions according to facility location of all reported sites.
Data summaries by province and territory are available in Appendix 3, Table 7.
Figure 4: Sources of Funding for CT Imaging Facilities, 2022–2023
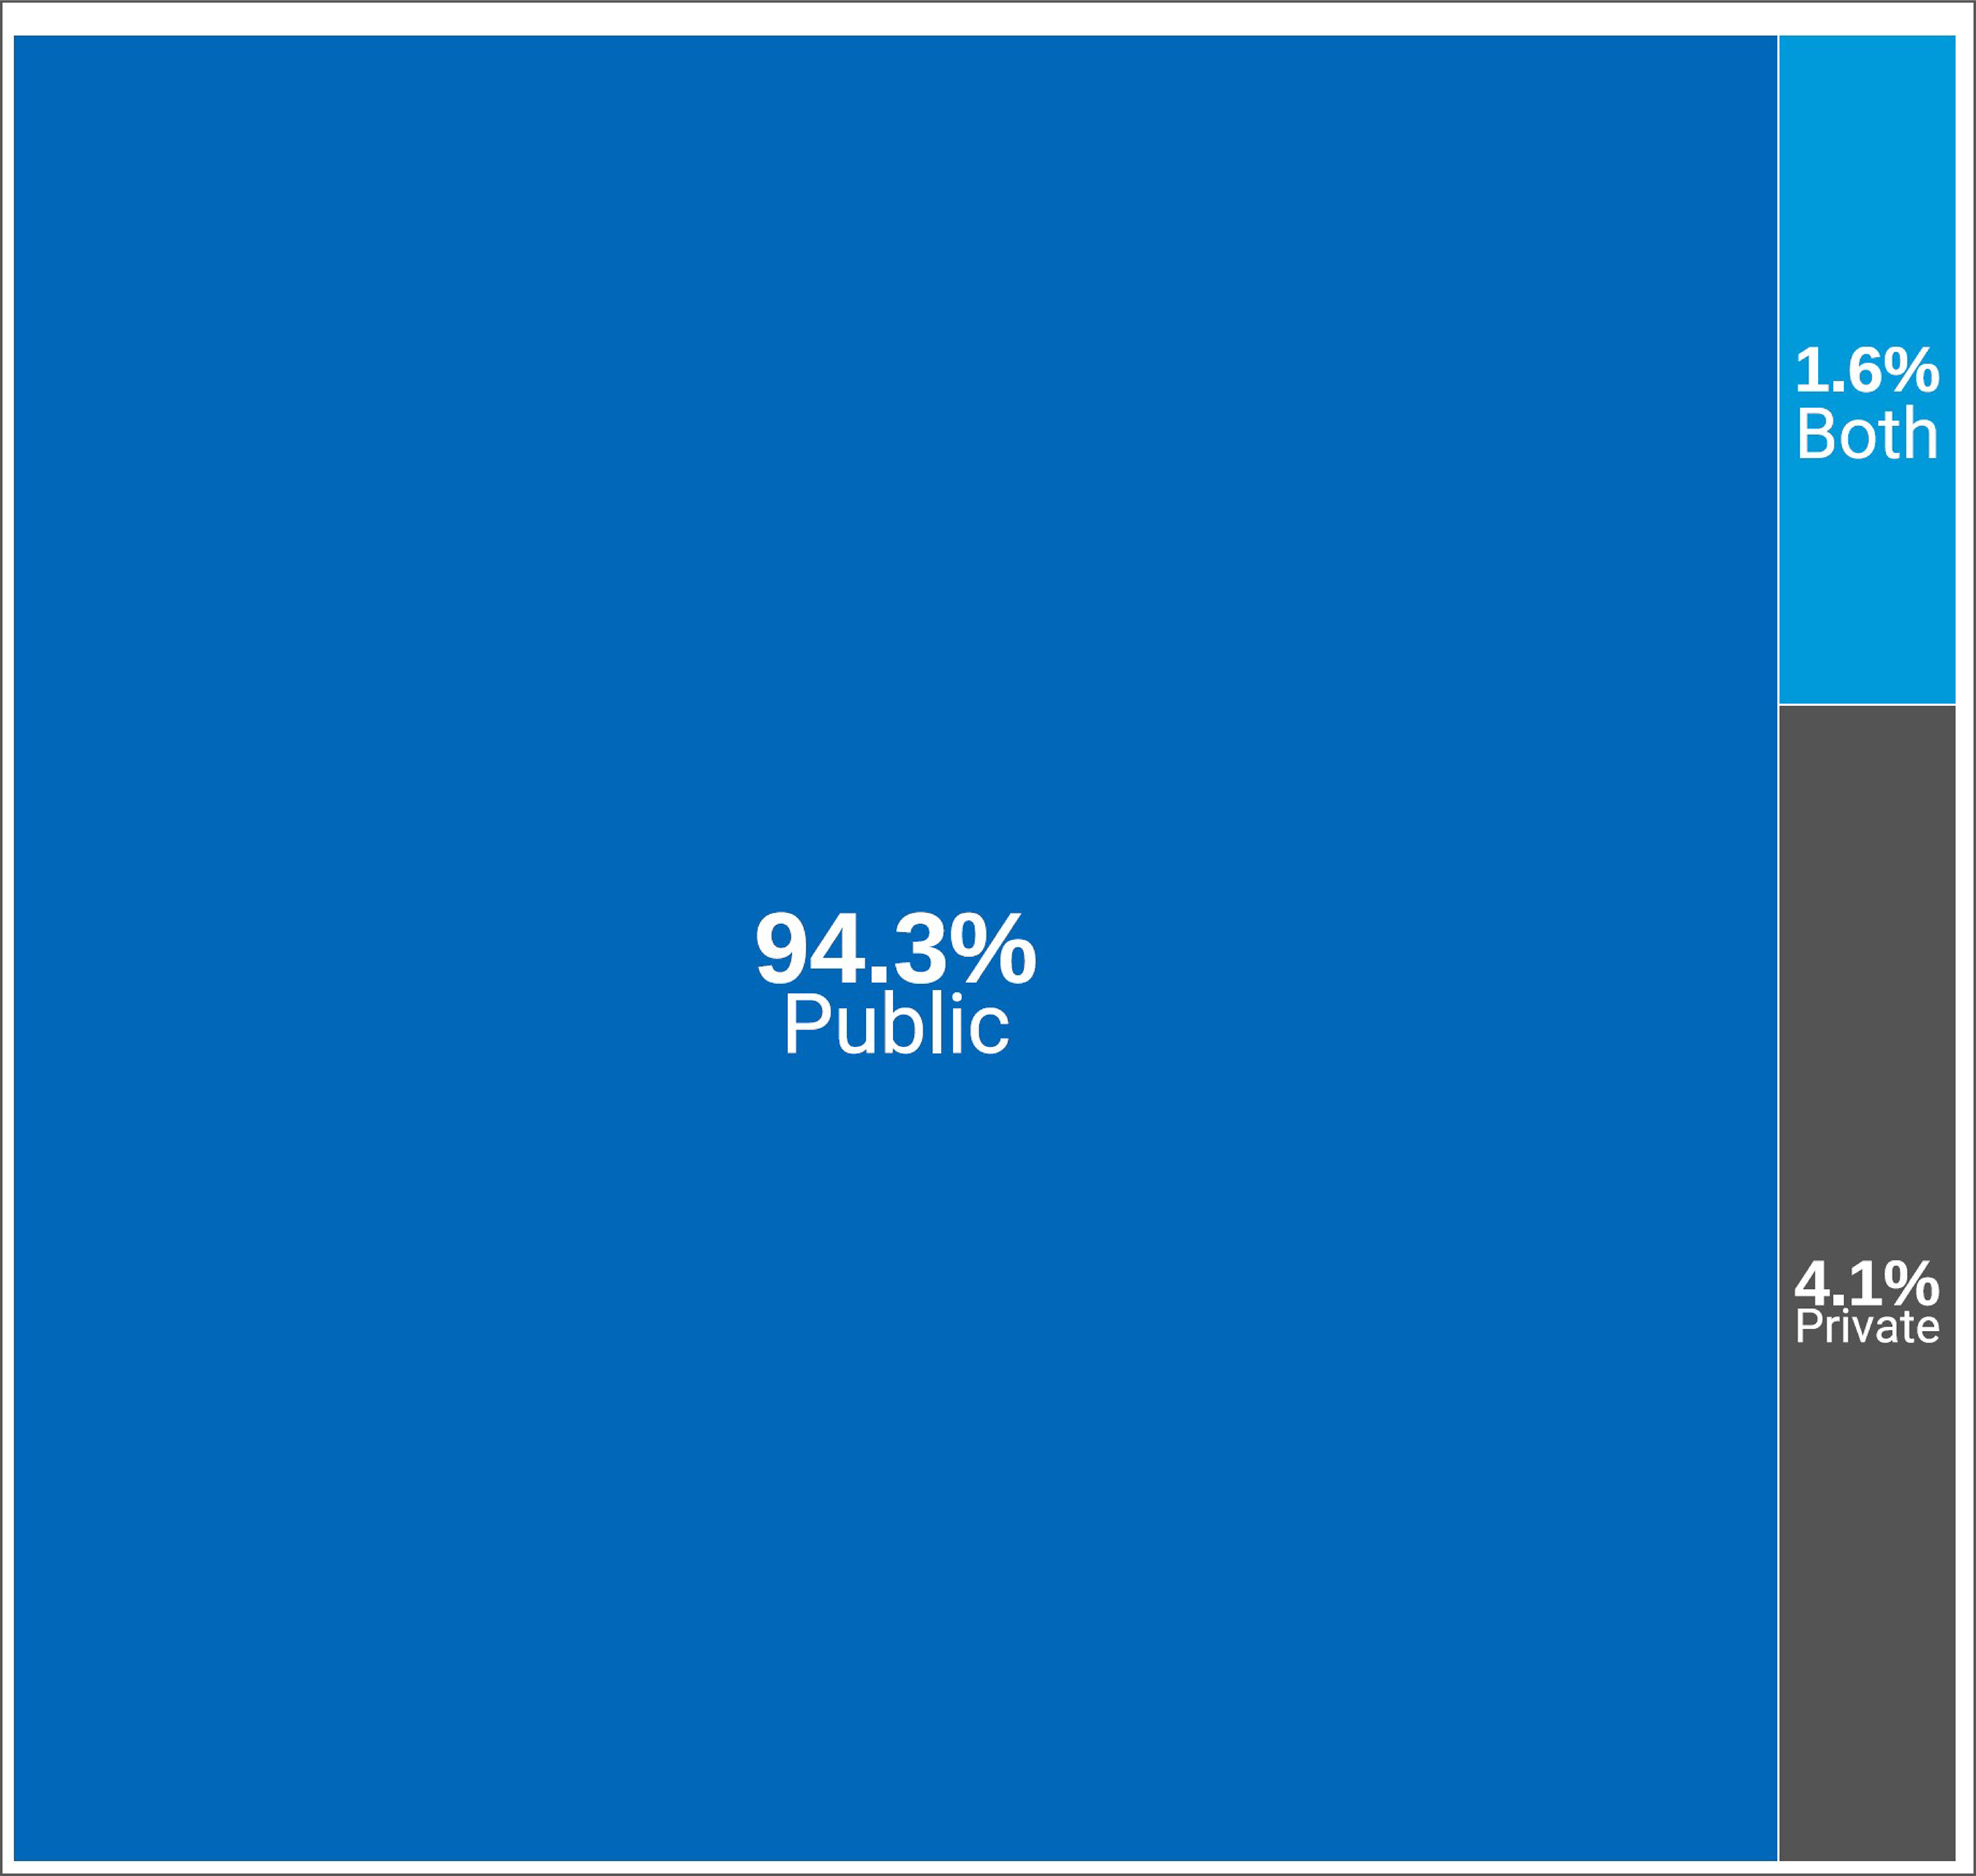
Notes: Survey response data were available for 317 out of 394 sites across all jurisdictions with CT capacity.
Data were derived from the following survey question: “How is this facility funded?”
Survey responses for facility funding source from private sites were limited due to a low response rate.
Figure 4 presents the number of sites as proportions according to the funding source of all reported sites.
Data summaries by province and territory are available in Appendix 3, Table 8.
Private Facilities
In total, 32 units located at 31 private sites across Canada have been documented by the CMII.
Private sites are mainly identified as privately funded and operate in 5 provinces: Alberta, British Columbia, Ontario, Quebec, and Saskatchewan. Most private sites did not provide data on the operational or technical characteristics of equipment.
Mobile and Portable CT Equipment
A mobile imaging unit consists of a van or mobile trailer designed to accommodate imaging equipment and can be deployed to multiple sites. A portable imaging unit can be wheeled to the bedside, allowing the acquisition of clinically meaningful examinations in space-constrained settings.
There are 3 publicly funded mobile CT scanners across Canada documented by the CMII, which serve at least 20 municipalities and First Nations. Two of these mobile CT units are in British Columbia, and 1 is in Quebec.
There are 3 publicly funded portable CT scanners across Canada, 1 each in Alberta, Ontario, and Quebec.
Inventory of CT Imaging Equipment
CT Units and Exams in 2022–2023
Total Number of CT Units in 2022–2023
A total of 560 CT units were reported for 2022–2023, increasing from 549 units reported in 2019–2020.2
The provinces with the highest number of CT units are Ontario and Quebec, with 192 and 144 units, respectively (Table 1 and Figure 5).
Canada has 14 CT units per million population. The jurisdictions with the greatest density of CT units per million population were Newfoundland and Labrador (30), Yukon, Northwest Territories and Nunavut,(range, 21.9 to 24.6), and New Brunswick (18) (Figure 5). This does not reflect accessibility, particularly in jurisdictions with large rural and remote areas, where travel to urban centres is required.
Table 1: Inventory of CT for Public and Private Facilities in Canada, 2022–2023
Province or territory | Number of sites (private)a,b | Total units (private)c | Units per million population (private) | Populationd |
|---|---|---|---|---|
Alberta | 39 (3) | 53 (3) | 11.3 (0.6) | 4,703,772 |
British Columbia | 50 (4) | 75e (5) | 13.8 (0.9) | 5,437,722 |
Manitoba | 17 (0) | 24f (0) | 16.6 (0) | 1,444,190 |
New Brunswick | 11 (0) | 15 (0) | 18 (0) | 831,618 |
Newfoundland and Labrador | 14 (0) | 16 (0) | 30 (0) | 533,710 |
Northwest Territories | 1 (0) | 1 (0) | 21.9 (0) | 45,668 |
Nova Scotia | 14 (0) | 18 (0) | 17.2 (0) | 1,047,232 |
Nunavut | 1 (0) | 1 (0) | 24.6 (0) | 40,715 |
Ontario | 124 (9) | 192 (9) | 12.4 (0.6) | 15,500,632 |
Prince Edward Island | 2 (0) | 2 (0) | 11.4 (0) | 176,113 |
Quebec | 105 (13) | 144 (13) | 16.3 (1.5) | 8,831,257 |
Saskatchewan | 15 (2) | 18 (2) | 14.7 (1.6) | 1,221,439 |
Yukon | 1 (0) | 1 (0) | 22.5 (0) | 44,412 |
Canada | 394 (31) | 560 (32) | 14.0 (0.8) | 39,858,480 |
Notes: For the 2022–2023 survey, complete unit count data were available for 394 sites with CT capacity out of 467 participating sites with advanced imaging capacity (i.e., SPECT-CT, SPECT, CT, MRI, PET-CT, PET-MRI).
Data were derived from the following survey question: “Do you have the following fixed, mobile, or portable units at the site?” Options included: CT, MRI, PET-CT, PET-MRI, SPECT, and SPECT-CT.
aPer-jurisdiction unit availability according to the validator, if the validator provided lists of sites with availability; where these were unavailable, the data came from the survey and from private sites.
bA private unit is a unit located in a health care facility that operates privately but is either privately or publicly funded.
cPer-jurisdiction unit counts according to the validator, if the validator provided lists of units; where these were unavailable, the data came from the survey and responses from private sites.
dThe population (estimated) as of the first quarter of 2023.12
eIncludes 2 units in British Columbia that became operational in December 2023.
fIncludes 3 units in Manitoba that are used for radiation planning purposes.
Figure 5: Units and Units per Million Population for CT, 2022–2023
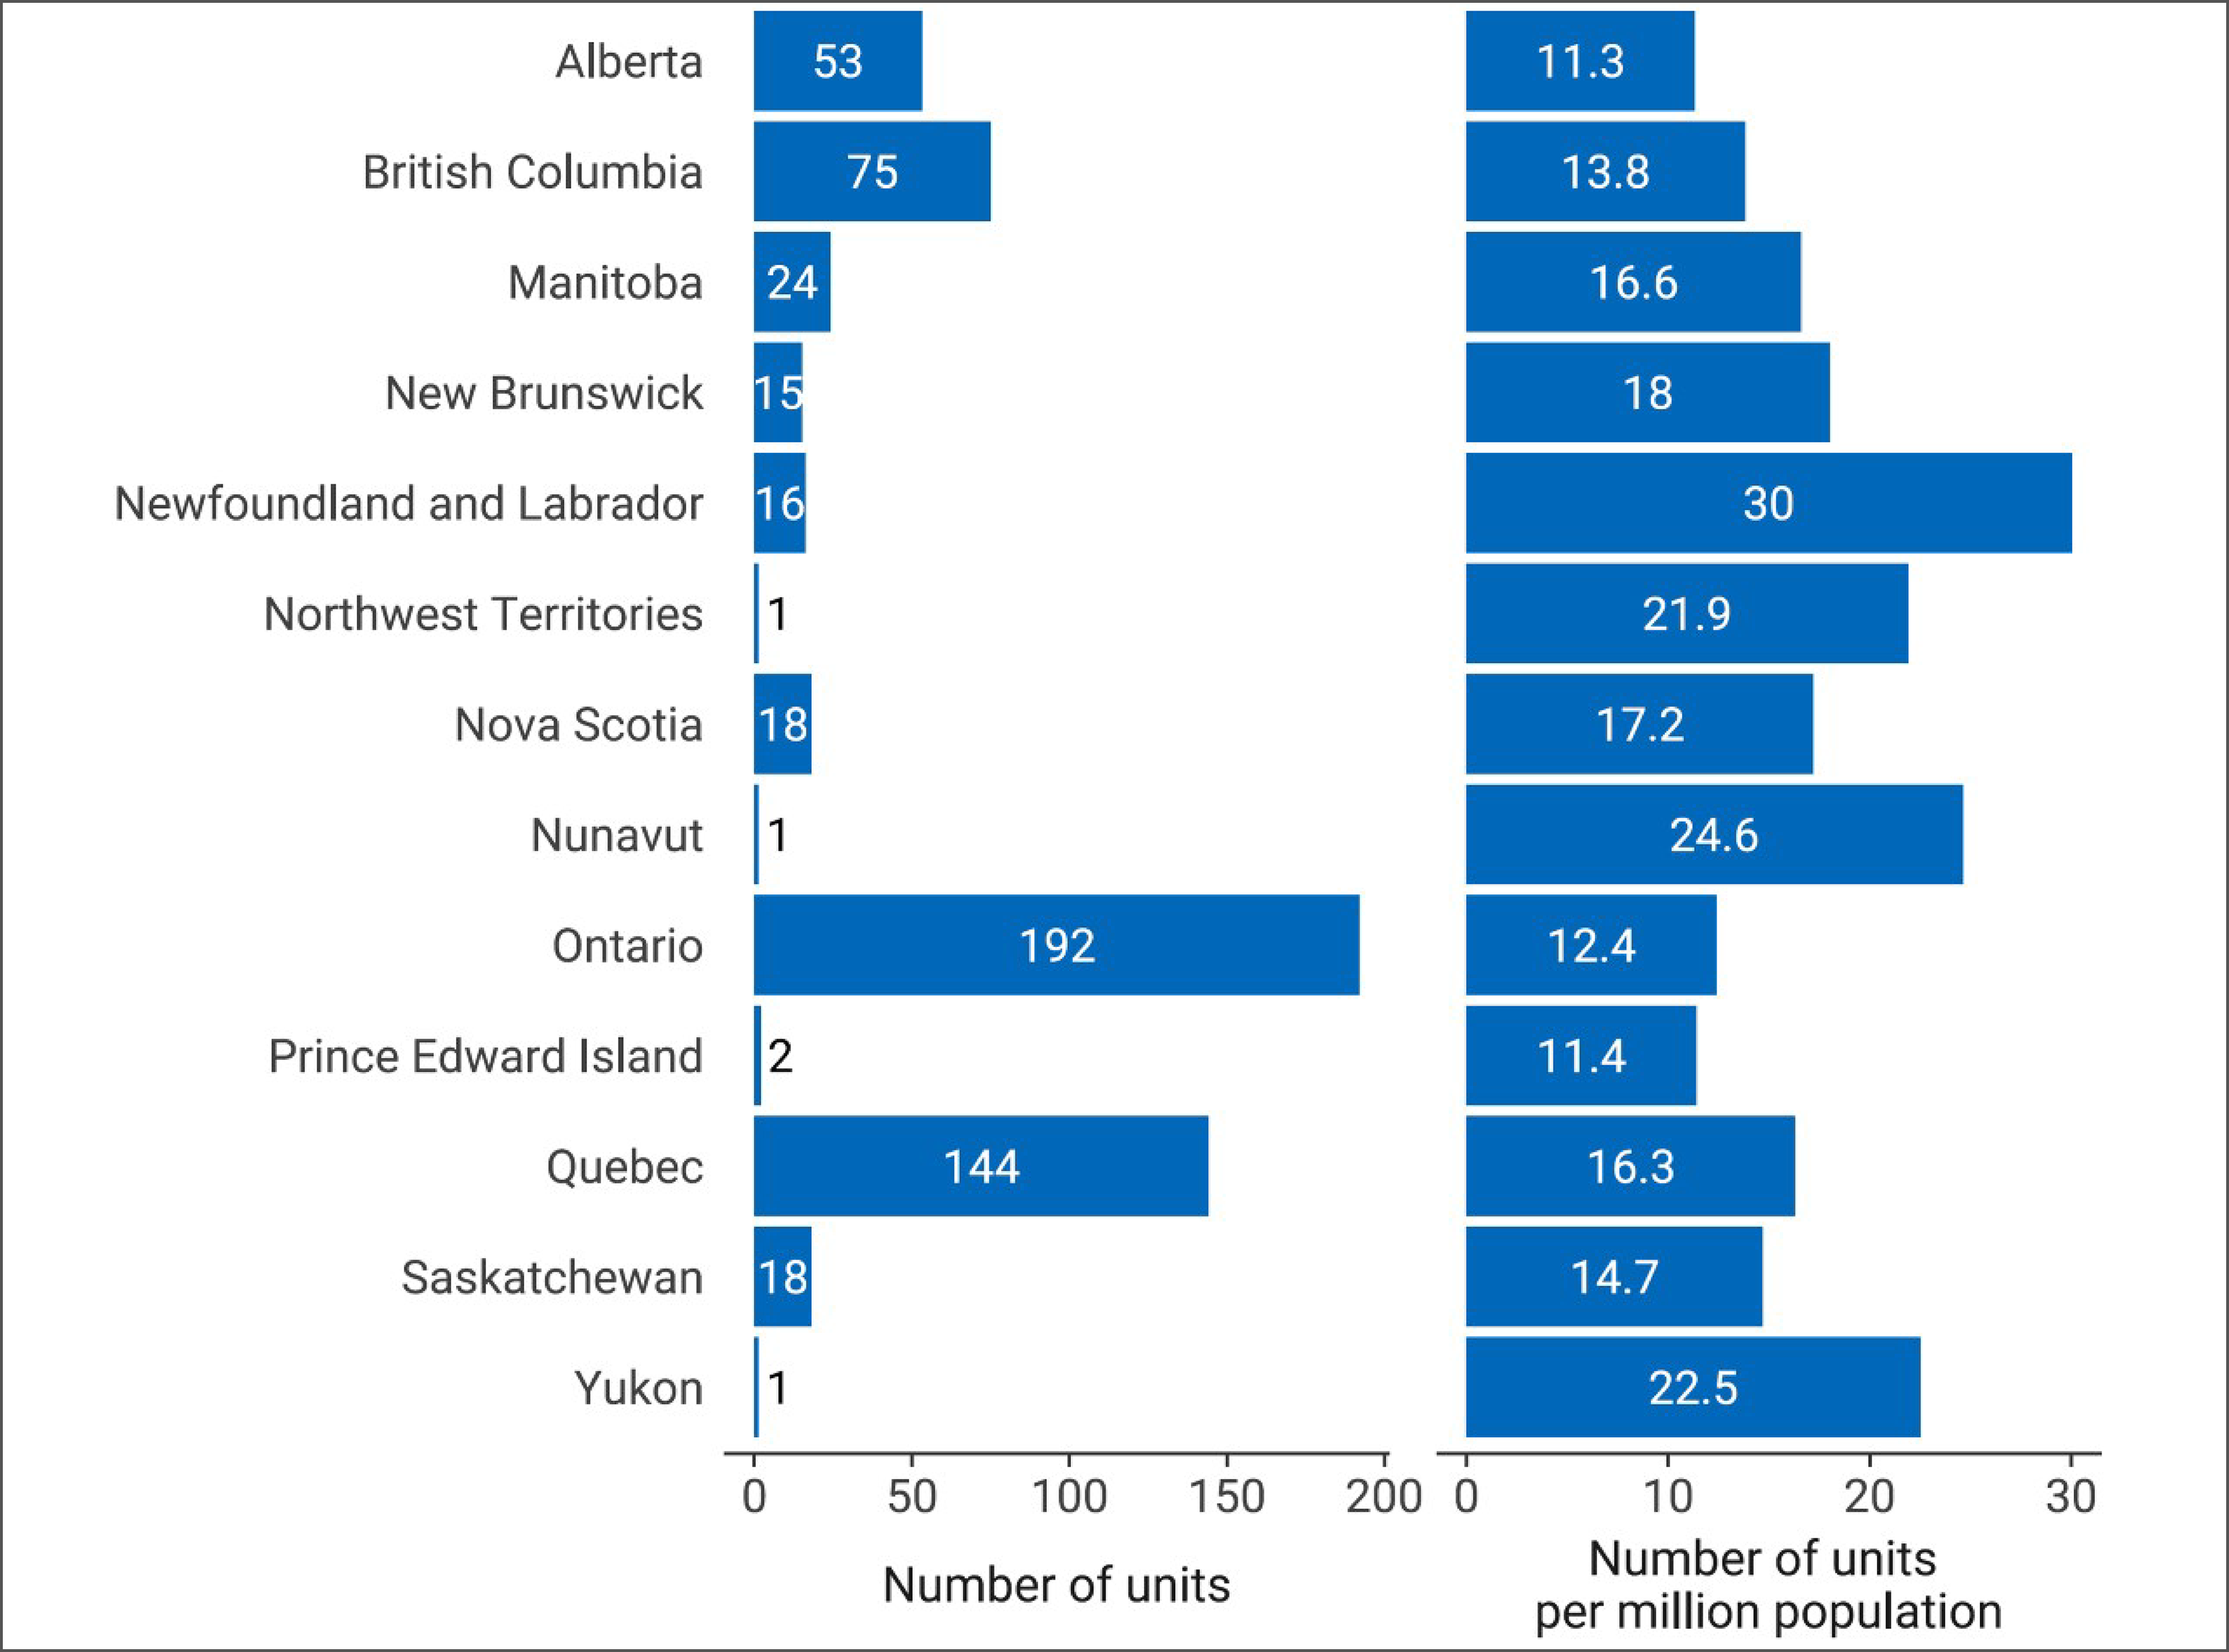
Notes: For the 2022–2023 survey, complete unit count data were available for 394 sites with CT capacity out of 467 participating sites with advanced imaging capacity (i.e., SPECT-CT, SPECT, CT, MRI, PET-CT, PET-MRI).
Data were derived from the following survey question: “Do you have the following fixed, mobile, or portable units at the site?” Options included: CT, MRI, PET-CT, PET-MRI, SPECT-CT, and SPECT. Bars are labelled with the number of units and the number of units per million population.
Total Volume of CT Exams in Canada, 2022–2023
The total number of overall examinations and the total per capita (per 1,000 population) reported for CT for the most recent fiscal (or calendar) year are presented in Table 2 and Figure 6.
Overall, 6,385,665 CT exams were performed, representing a national average of 160.2 exams per 1,000 population, ranging from 106.5 to 213.4 across all jurisdictions.
An average of 11,403 exams per CT unit were conducted across Canada in 2022–2023.
Ontario, Quebec, and British Columbia had the highest volume of CT exams of reporting jurisdictions with capacity in Canada, at 2,383,569; 1,658,575; and 923,990 exams, respectively.
New Brunswick, Newfoundland and Labrador, and Quebec had the highest density of CT exams of reporting jurisdictions in Canada, at 213.4, 197.6, and 187.8 exams per 1,000 people, respectively.
The volume of exams conducted per unit is variable and may be impacted by several factors, such as number of CT units per capita, geographic location of equipment, facility type (i.e., specialized or tertiary care centres), and scope of clinical indications.
Table 2: Total Exams for the Latest Fiscal (Or Calendar) Year With Data Availability for CT Across Canada for Public Facilities, 2022–2023
Province or territory | Populationa | Total examsb | Average exams per unit | Exams per 1,000 population |
|---|---|---|---|---|
Alberta | 4,703,772 | 520,507 | 9,820.8 | 110.7 |
British Columbia | 5,437,722 | 923,990 | 12,319.9 | 169.9 |
Manitoba | 1,444,190 | 260,661 | 10,860.9 | 180.5 |
New Brunswick | 831,618 | 177,477 | 11,831.8 | 213.4 |
Newfoundland and Labrador | 533,710 | 105,441 | 6,590.1 | 197.6 |
Northwest Territories | 45,668 | 8,115 | 8,115 | 177.7 |
Nova Scotia | 1,047,232 | 166,268 | 9,237.1 | 158.8 |
Nunavut | 40,715 | 4,336 | 4,336 | 106.5 |
Ontario | 15,500,632 | 2,383,569 | 12,414.4 | 153.8 |
Prince Edward Island | 176,113 | 25,368 | 12,684 | 144 |
Quebec | 8,831,257 | 1,658,575 | 11,517.8 | 187.8 |
Saskatchewan | 1,221,439 | 144,903 | 8,050.1 | 118.6 |
Yukon | 44,412 | 6,455 | 6,455 | 145.3 |
Canada | 39,858,480 | 6,385,665 | 11,403 | 160.2 |
Note: Complete exam volume data for public facilities was reported by validators for all jurisdictions with CT capacity.
aThe population (estimated) as of the first quarter of 2023.12
bData were derived from the number of units with reported exam data and from the following survey question: “For all units, how many examinations on average were conducted in the last fiscal year?”
Figure 6: CT Exams per 1,000 Population for the Latest Fiscal (or Calendar) Year With Data Availability Across Canada in Public Facilities, 2022–2023
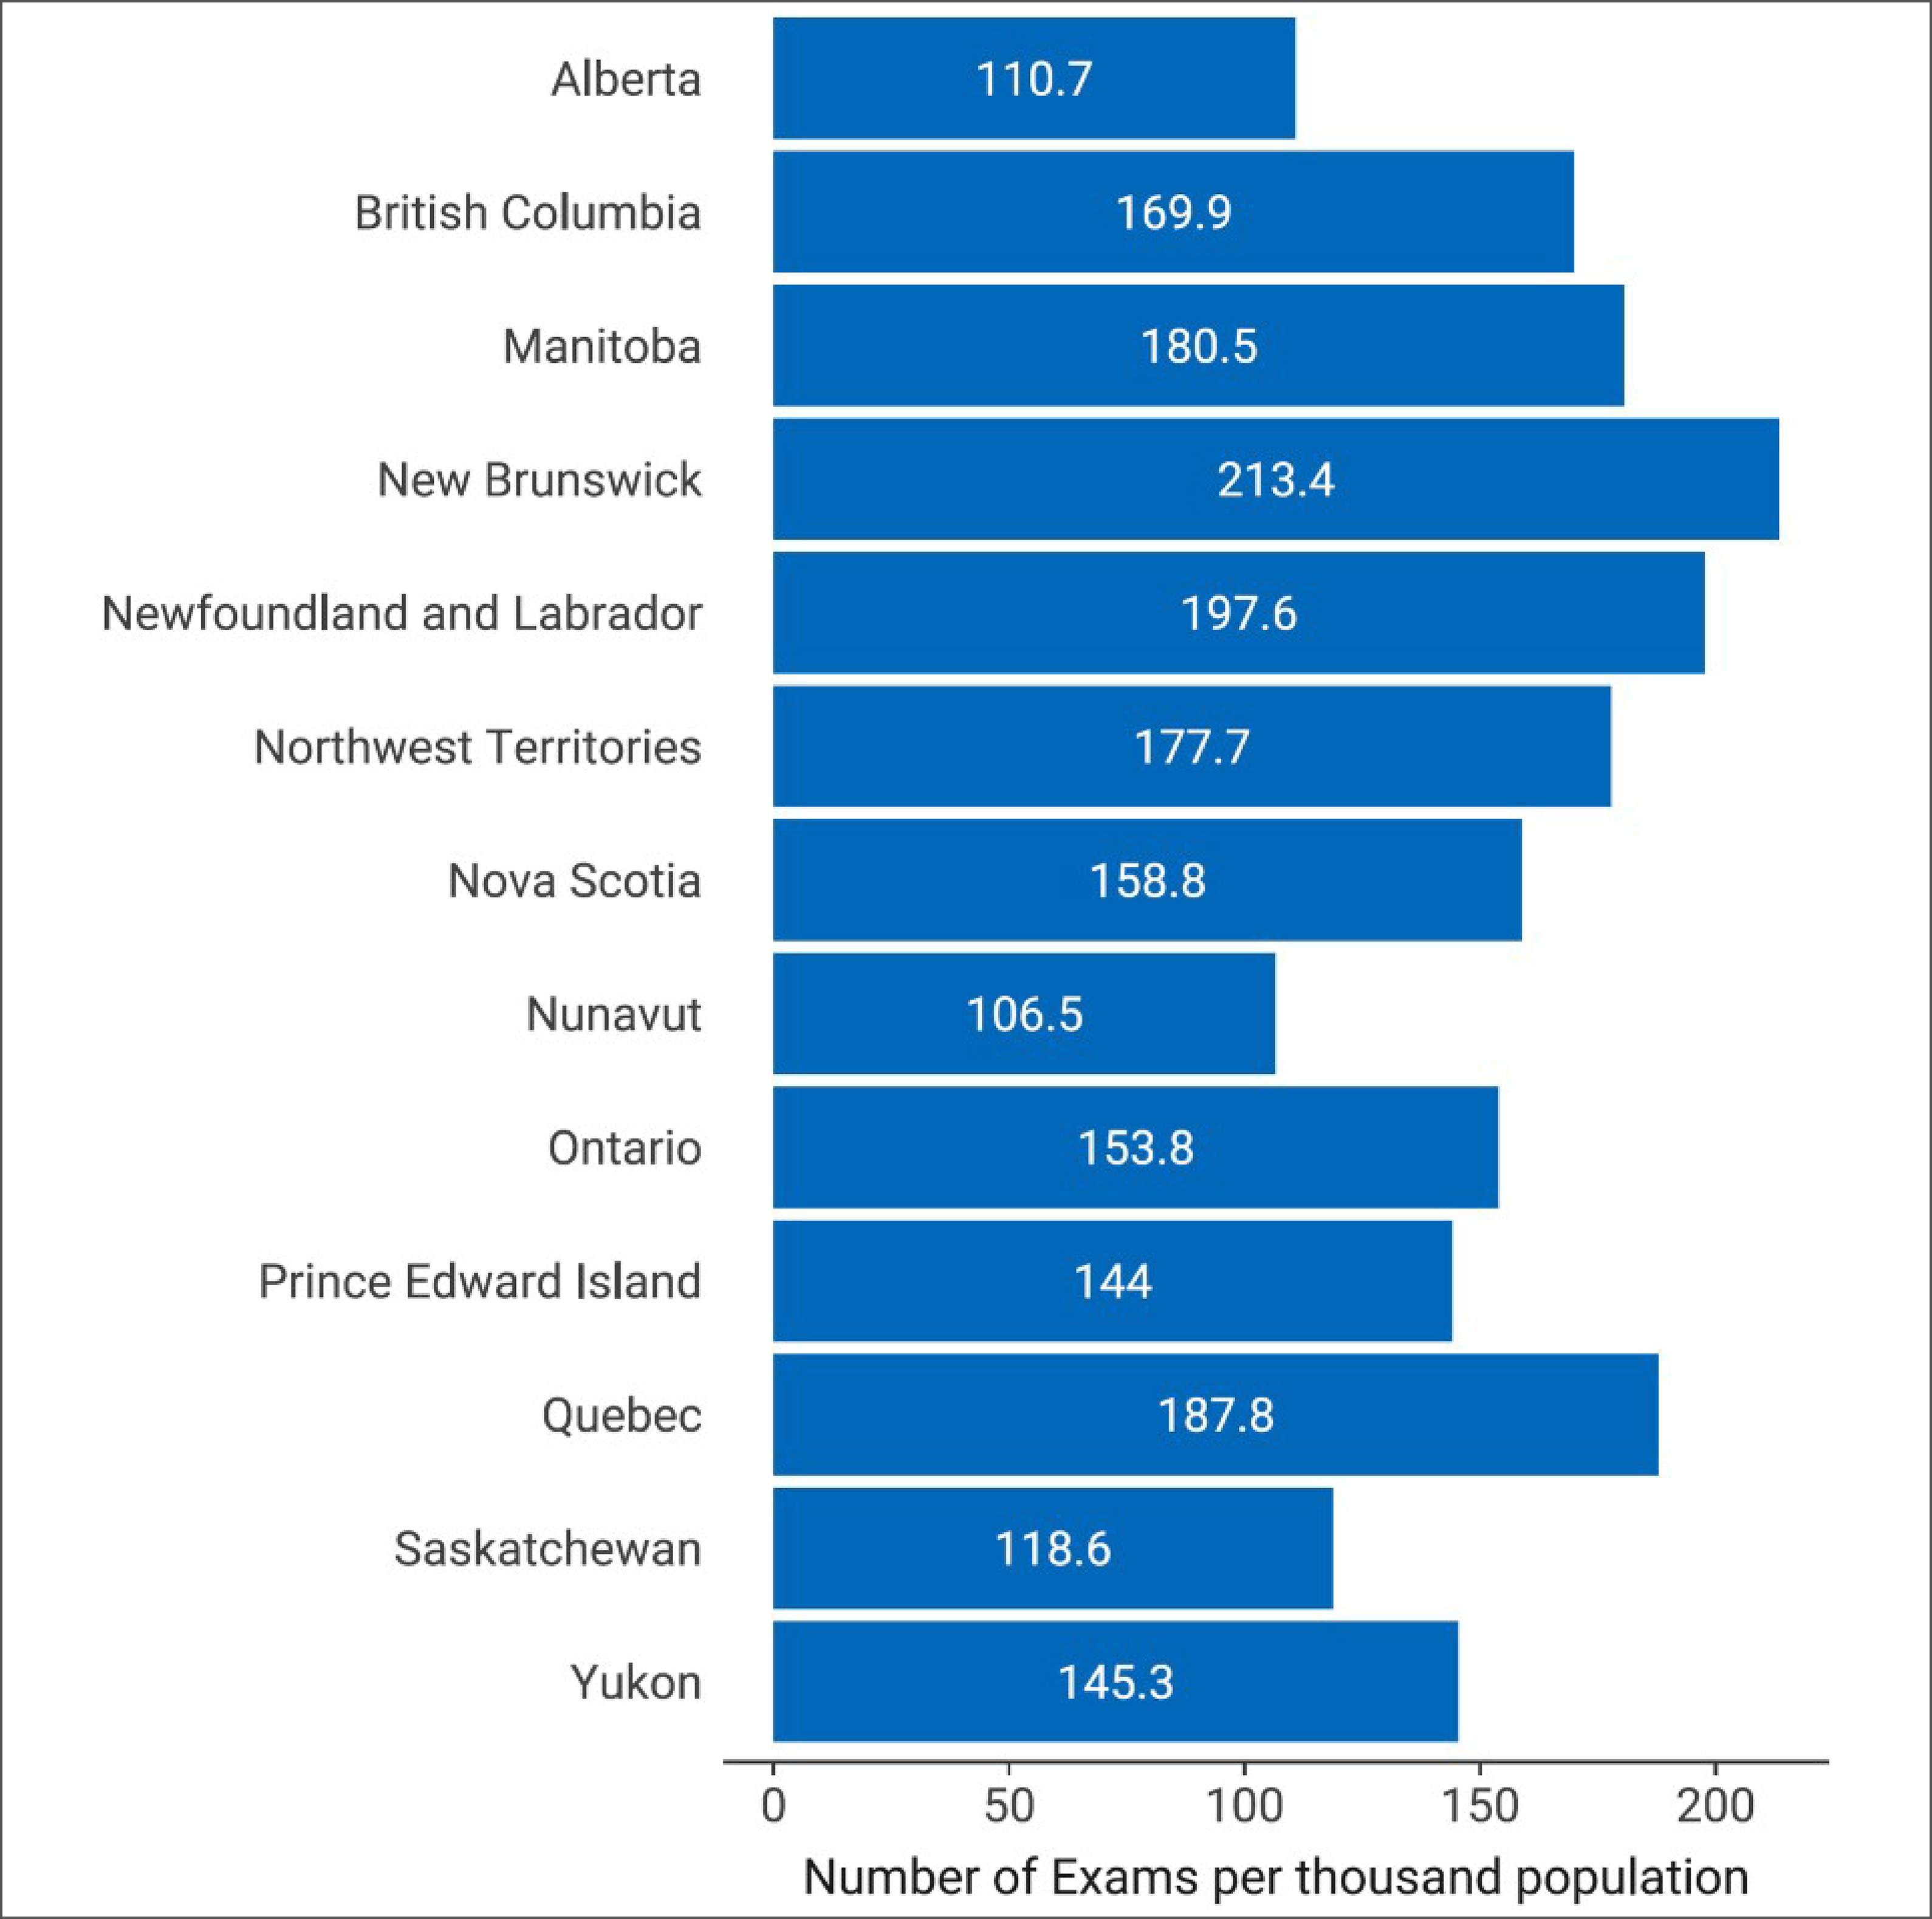
Notes: Complete exam volume data for public facilities were reported by validators for all jurisdictions with CT capacity.
Data were derived from the following survey question: ““For all units, how many examinations on average were conducted in the last fiscal/calendar year?”
Change in CT Units and Exams Since 2015
Trends in Number of Units and Units per Million People, 2015 to 2022–2023
Information on the number of CT units and units per million people between 2015 and 2022–2023 are presented in Appendix 3, Table 9:2,13,14
Since 2015, the number of CT units in Canada has increased by 4.1%, from 538 to 560 units.
Between 2015 and 2022–2023, the number of units per million people has decreased by 6.7%, from 15.0 to 14.0. Since 2015, Manitoba and Saskatchewan are the only provinces with CT capacity to report an increase in the number of units per capita, increasing by 12.9% and 4.3%, respectively.
Since 2019–2020, Saskatchewan, Ontario, and Newfoundland and Labrador experienced the highest increase in number of units per million people out of all jurisdictions, increasing by 8.1%, 7.8%, and 4.5%, respectively.
Trends in Exam Volume and Exams per 1,000 People, 2015 to 2022–2023
Information on the number of CT exams and exams per 1,000 people between 2015 and 2022–2023 are presented in Appendix 3, Table 10:2,13,14
Since 2015, the volume of CT exams in Canada increased by 21%, from 5,278,341 to 6,385,665 exams.
Between 2015 and 2022–2023, the number of exams per 1,000 people increased by 9%, from 147.0 to 160.2. Since 2015, Ontario maintained the highest volume of exams, while Prince Edward Island and the Yukon experienced the highest growth per capita, both increasing by 55%.
Since 2019 to 2020, the Northwest Territories experienced the highest increase in the volume of exams per capita, increasing by 49.6%, from 118.8 to 177.7.
Operation of CT Imaging Equipment
Hours of Operation for CT Imaging Equipment
Hours Per Day and 24-Hour Use for CT Units
CT units operate an average of 14.2 hours per day in Canada, ranging from 6 to 24 hours across all jurisdictions with capacity (Appendix 3, Table 11). Information on hours of daily operation was available for 204 out of 394 sites. Table 27 (Appendix 4) presents the average daily hours of operation reported for publicly funded sites with capacity.
Ontario, British Columbia, and Nova Scotia reported the highest average hours of use per day across all jurisdictions, at 16.8, 15.6, and 14.6 hours, respectively.
Approximately 73% of sites with CT capacity in Canada reported use between 8 and 18 hours per day, 23% of sites reported use for more than 18 hours, and 4% of sites reported use for less than 8 hours per day (Figure 7). Data came from 196 sites that responded to this survey question.
A total of 40.3% of sites reported CT operation 24 hours a day (89 of 221 sites, Figure 9 and Appendix 3, Table 12). Facilities with CT equipment operating in emergency departments may more commonly report CT operation 24 hours a day, which may not be captured by the number of sites that responded to this survey question.
Figure 7: Percentage of Average Hours of Operation per 24-Hour Day of CT Use by Category, 2022–2023
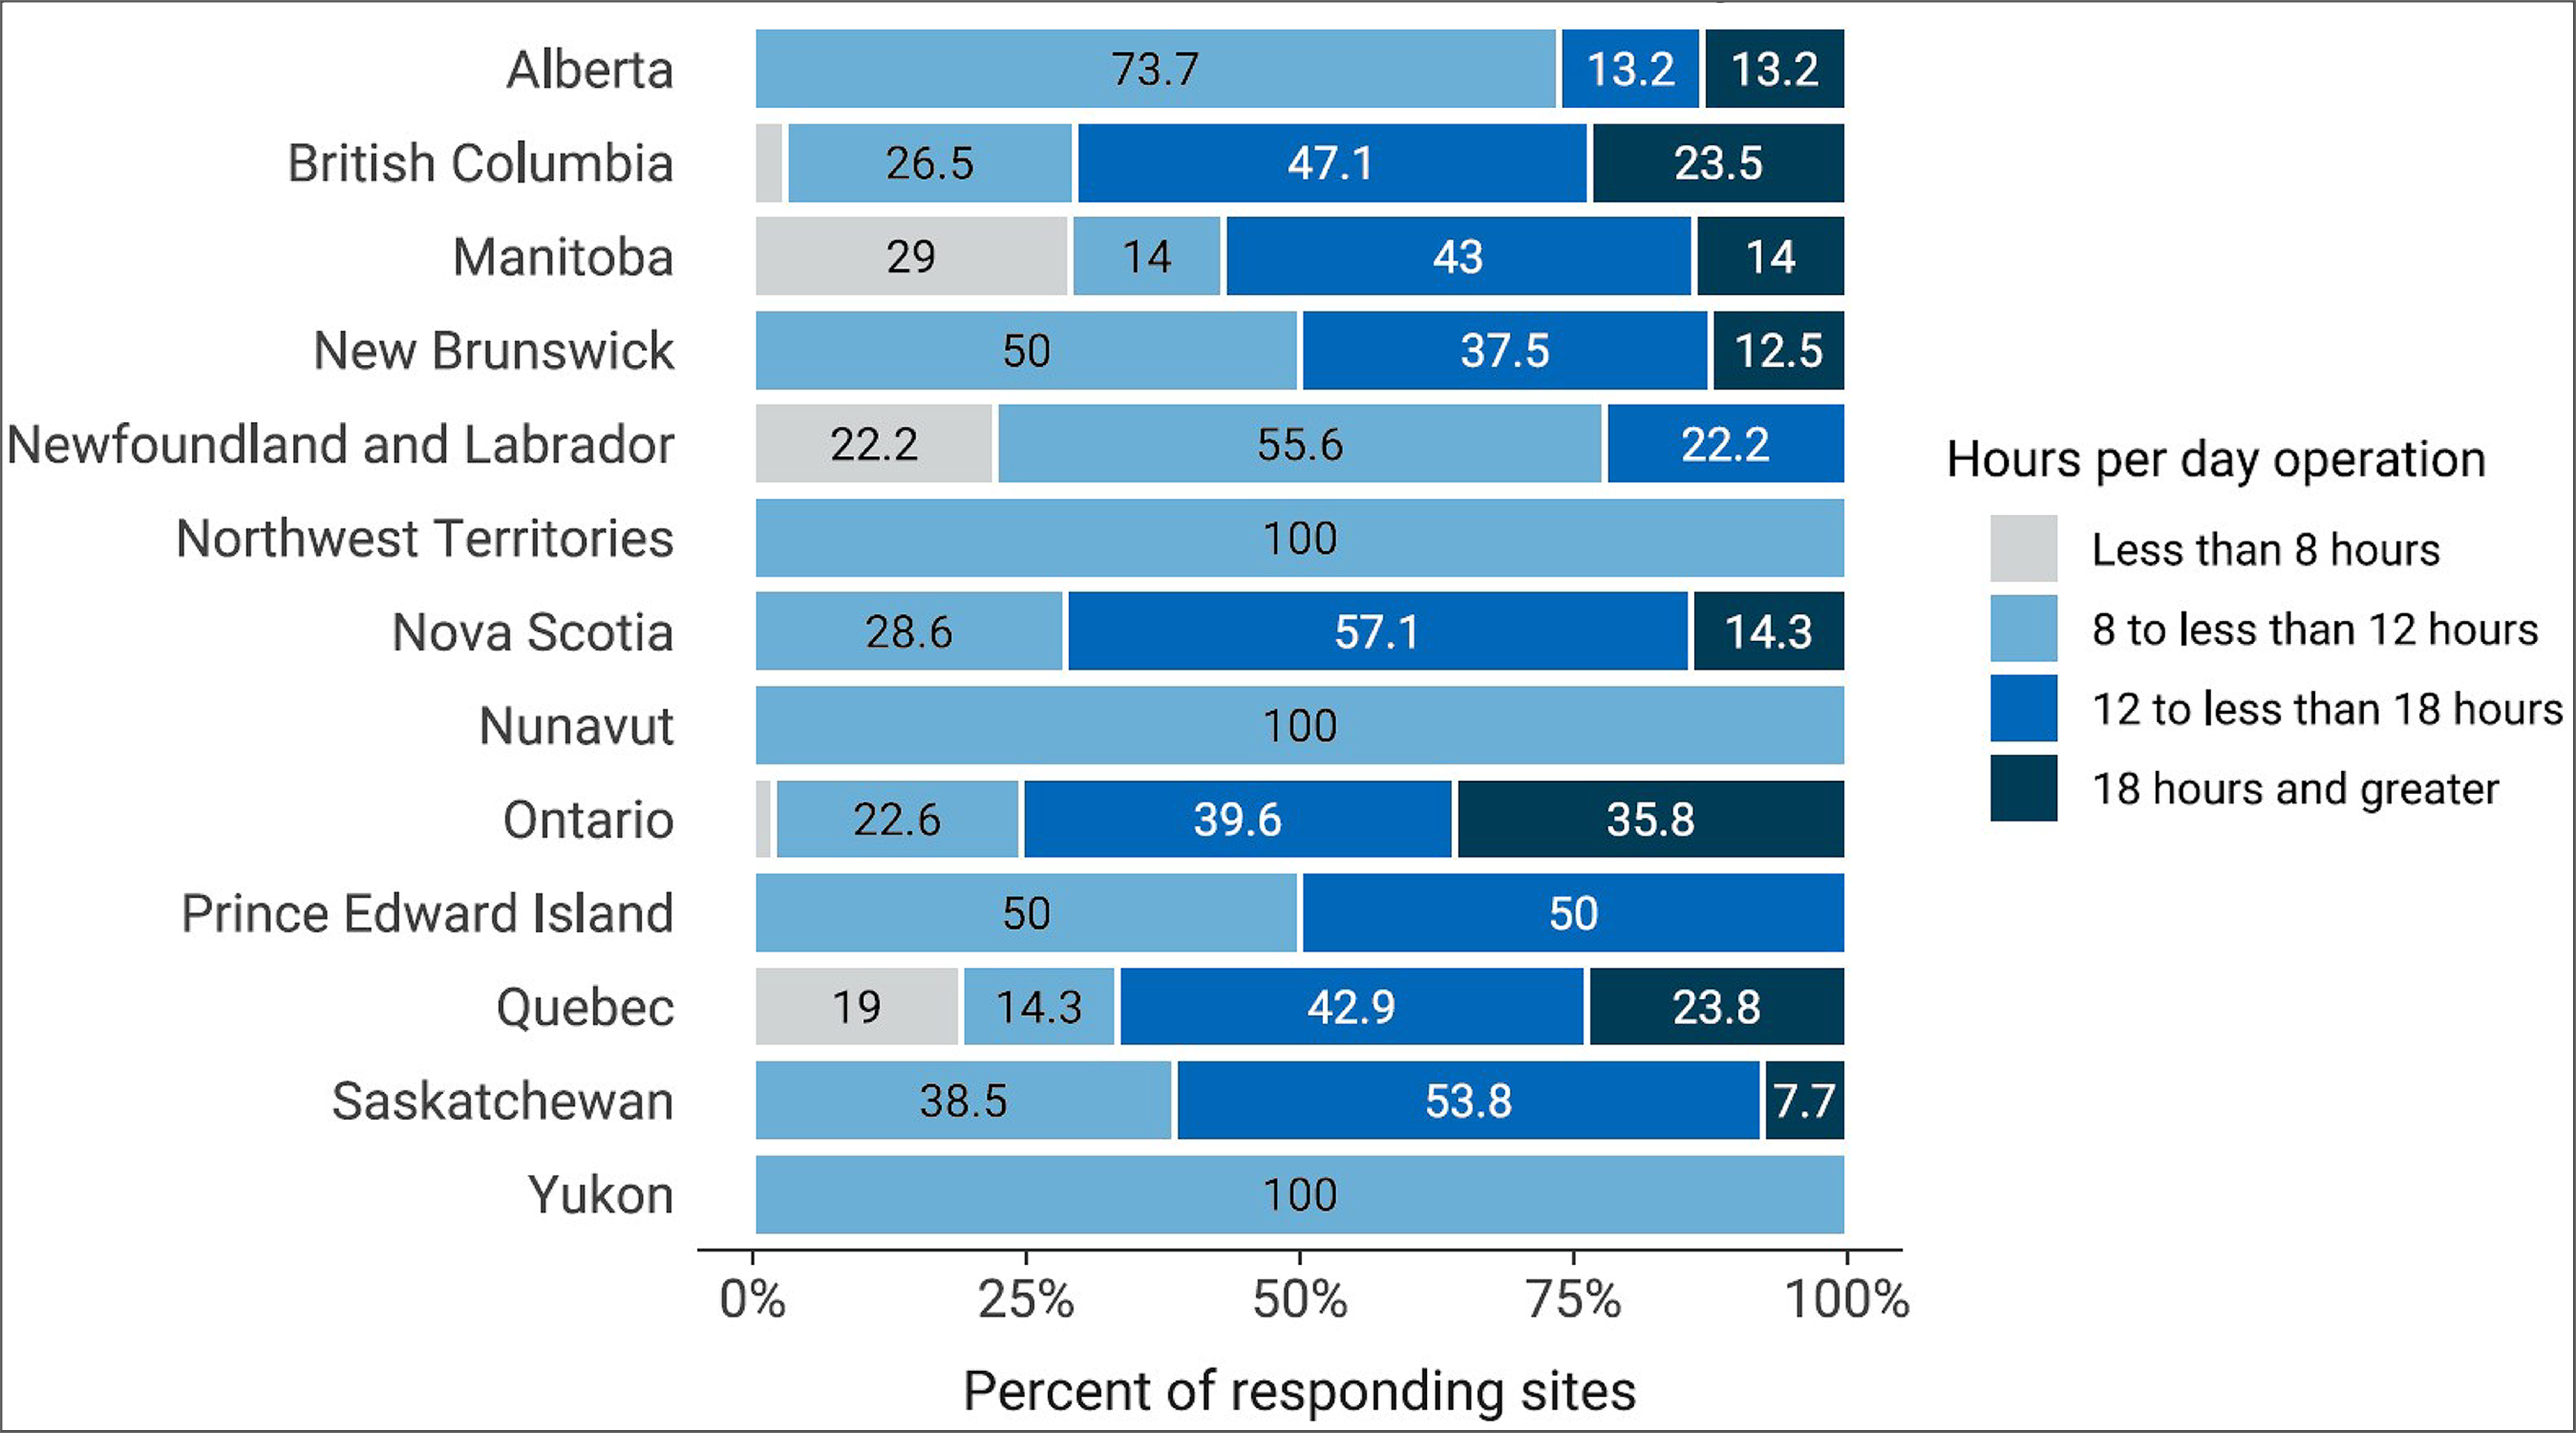
Notes: Survey response data were available for 204 out of 394 sites across all jurisdictions with CT capacity.
Data were derived from the following survey question: “In an average 24-hour day, how many hours are the units staffed through regular scheduled service capacity (do not include hours where staff are only on call)?” Bars are labelled with the percent of sites in each category.
Hours Per Week and Weekend Use for CT Units
CT units operate an average of 91.1 hours per week in Canada, ranging from 4 to 168 hours across all jurisdictions (Appendix 3, Table 13). Information on hours of weekly operation were available for 205 out of 394 sites. Table 28 (Appendix 4) presents the average weekly hours of operation reported for publicly funded sites with capacity.
Ontario, British Columbia, and Nova Scotia reported the highest average hours of use per week of all reporting jurisdictions, at 107, 104, and 101 hours, respectively.
About 55% of sites with CT capacity in Canada reported use of 80 hours or more per week, while 8.1% reported use between 60 to 80 hours per week, 26.3% reported 40 to 60 hours, and 10.6% reported use less than 40 hours per week (Figure 8).
In total, 75.7% of responding sites reported the operation of CT equipment on weekends (168 of 222 sites, Figure 9 and Appendix 3, Table 12).
Figure 8: Percentage of Average Hours of Operation per Week of CT Use by Category, 2022–2023
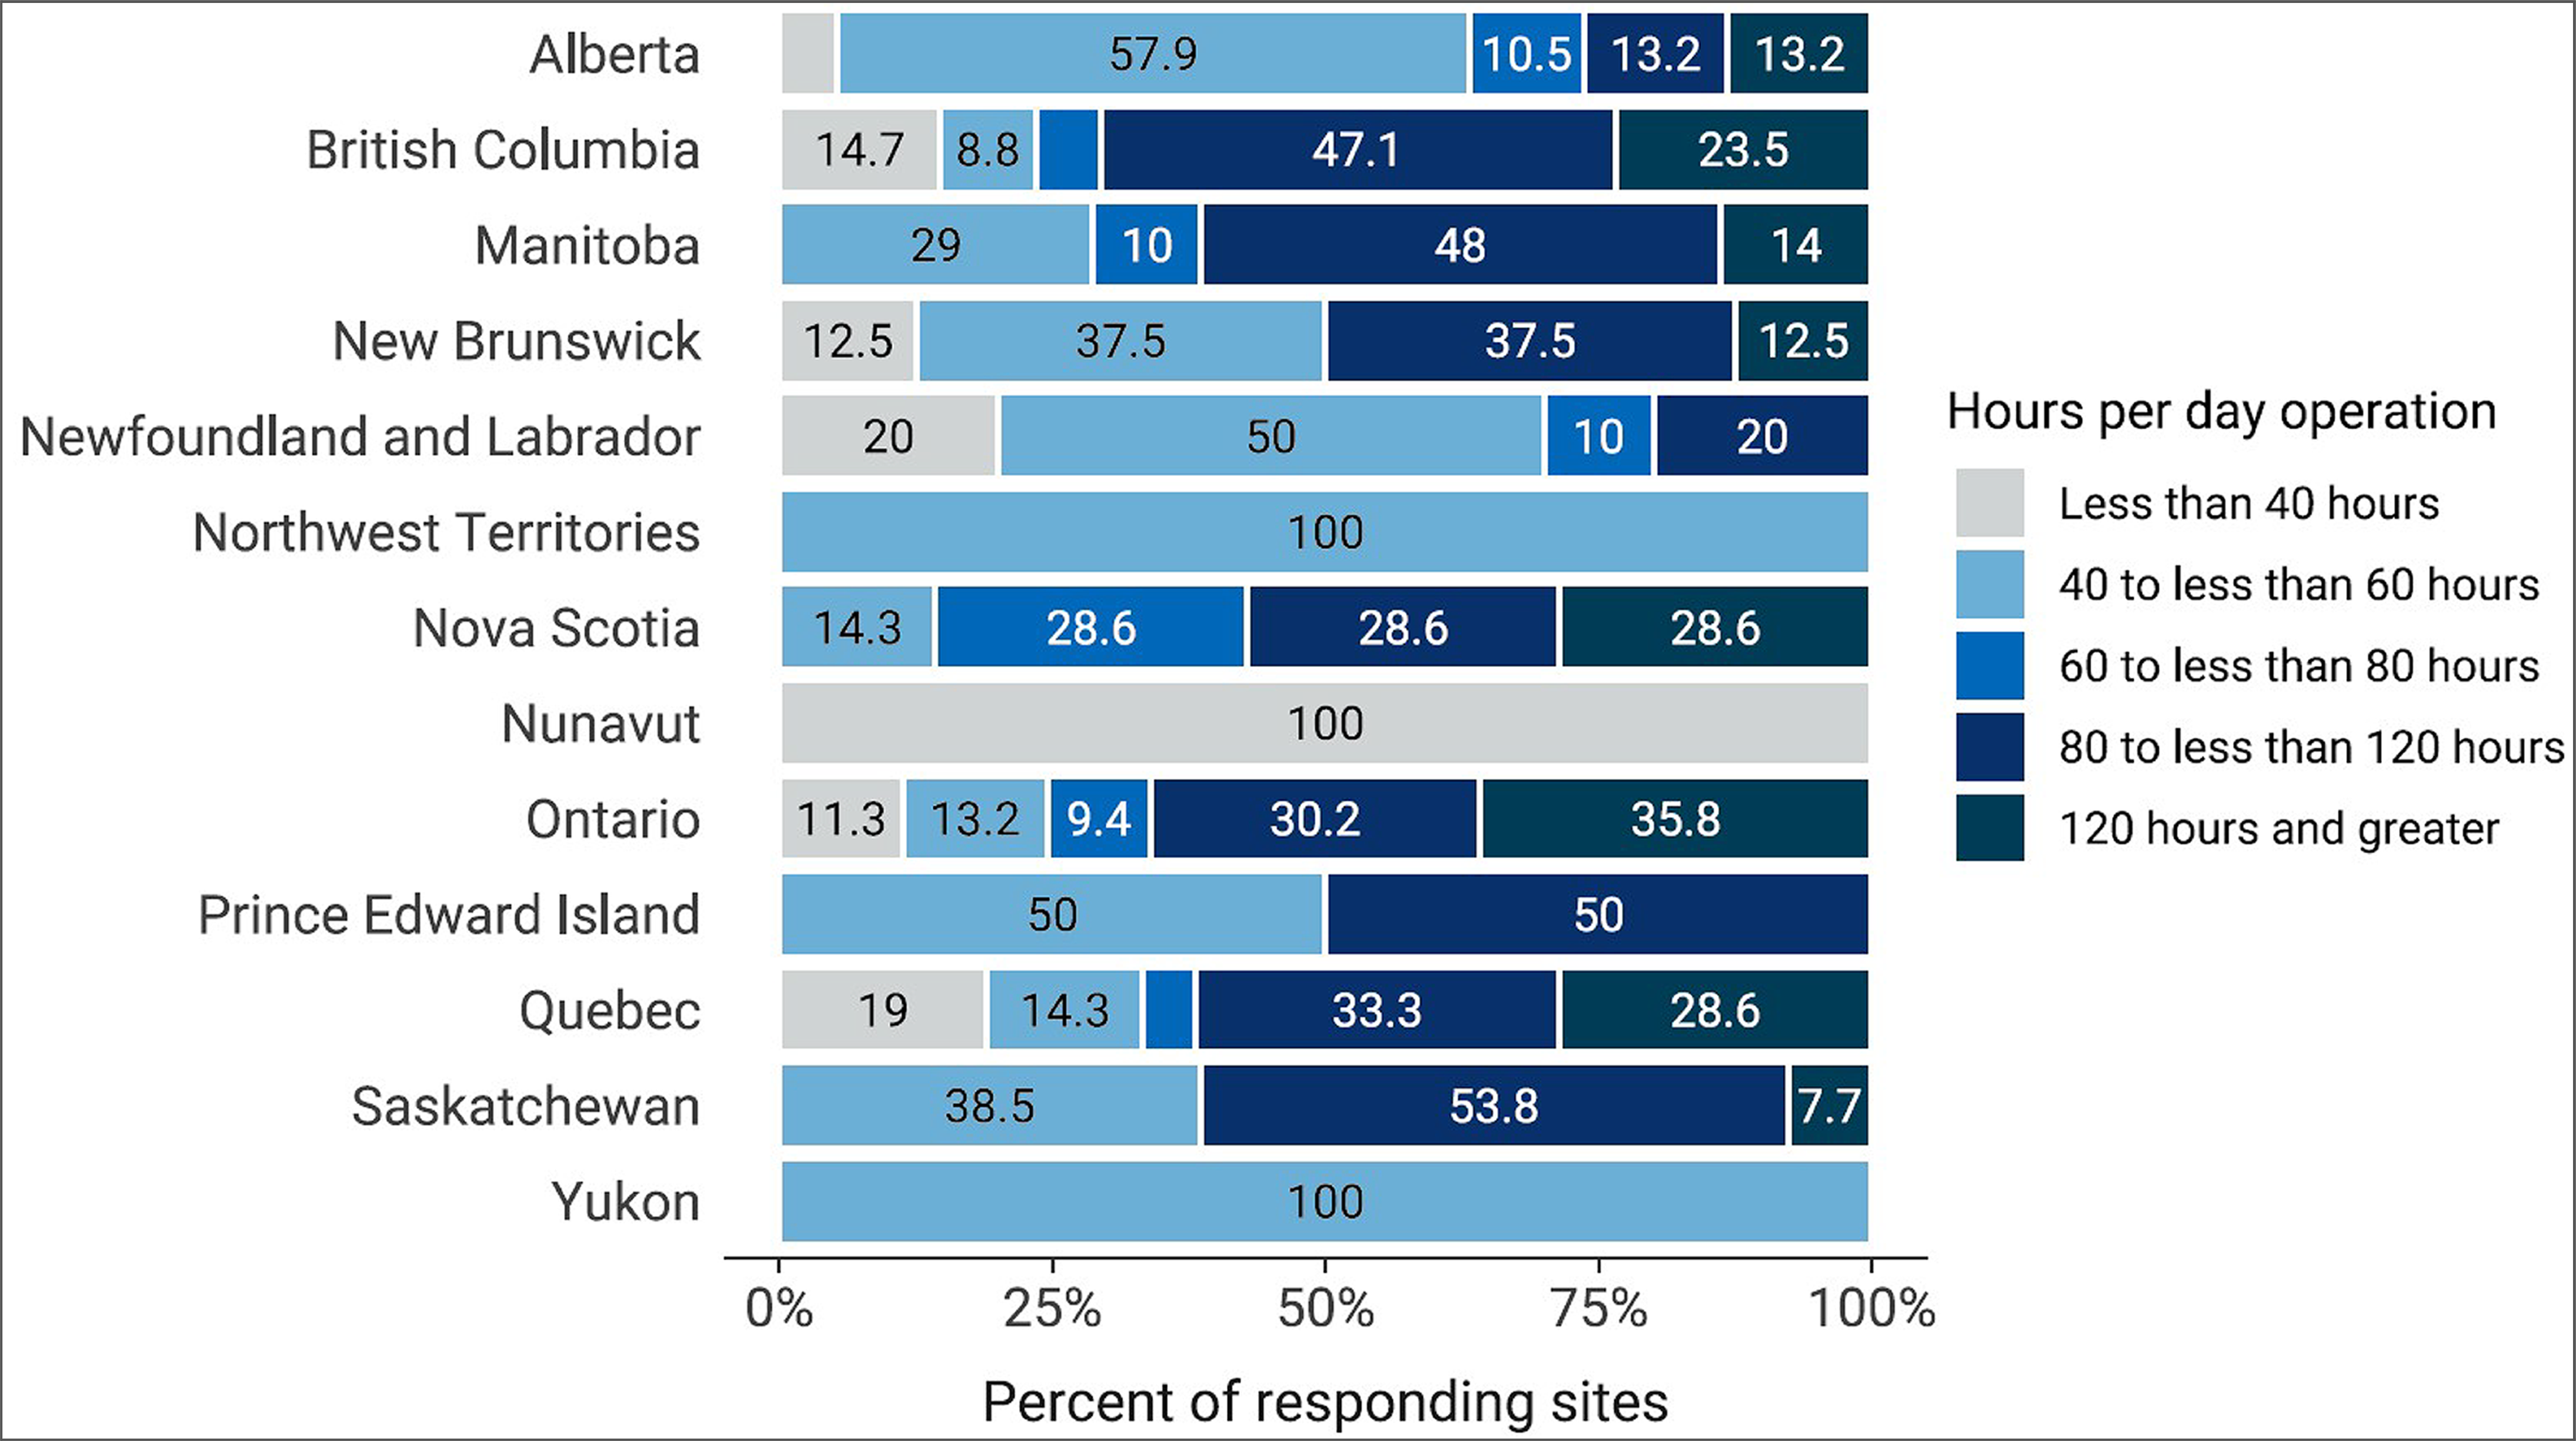
Notes: Survey response data were available for 205 out of 394 sites across all jurisdictions with CT capacity.
Data were derived from the following survey question: “In an average 168-hour week, how many hours are the [modality] units staffed through regular scheduled service capacity (do not include hours where staff are only on call)?” Bars are labelled with the percent of sites in each category.
Figure 9: Percentage of Sites That Operate 24 Hours and Weekend CT Use, 2022–2023
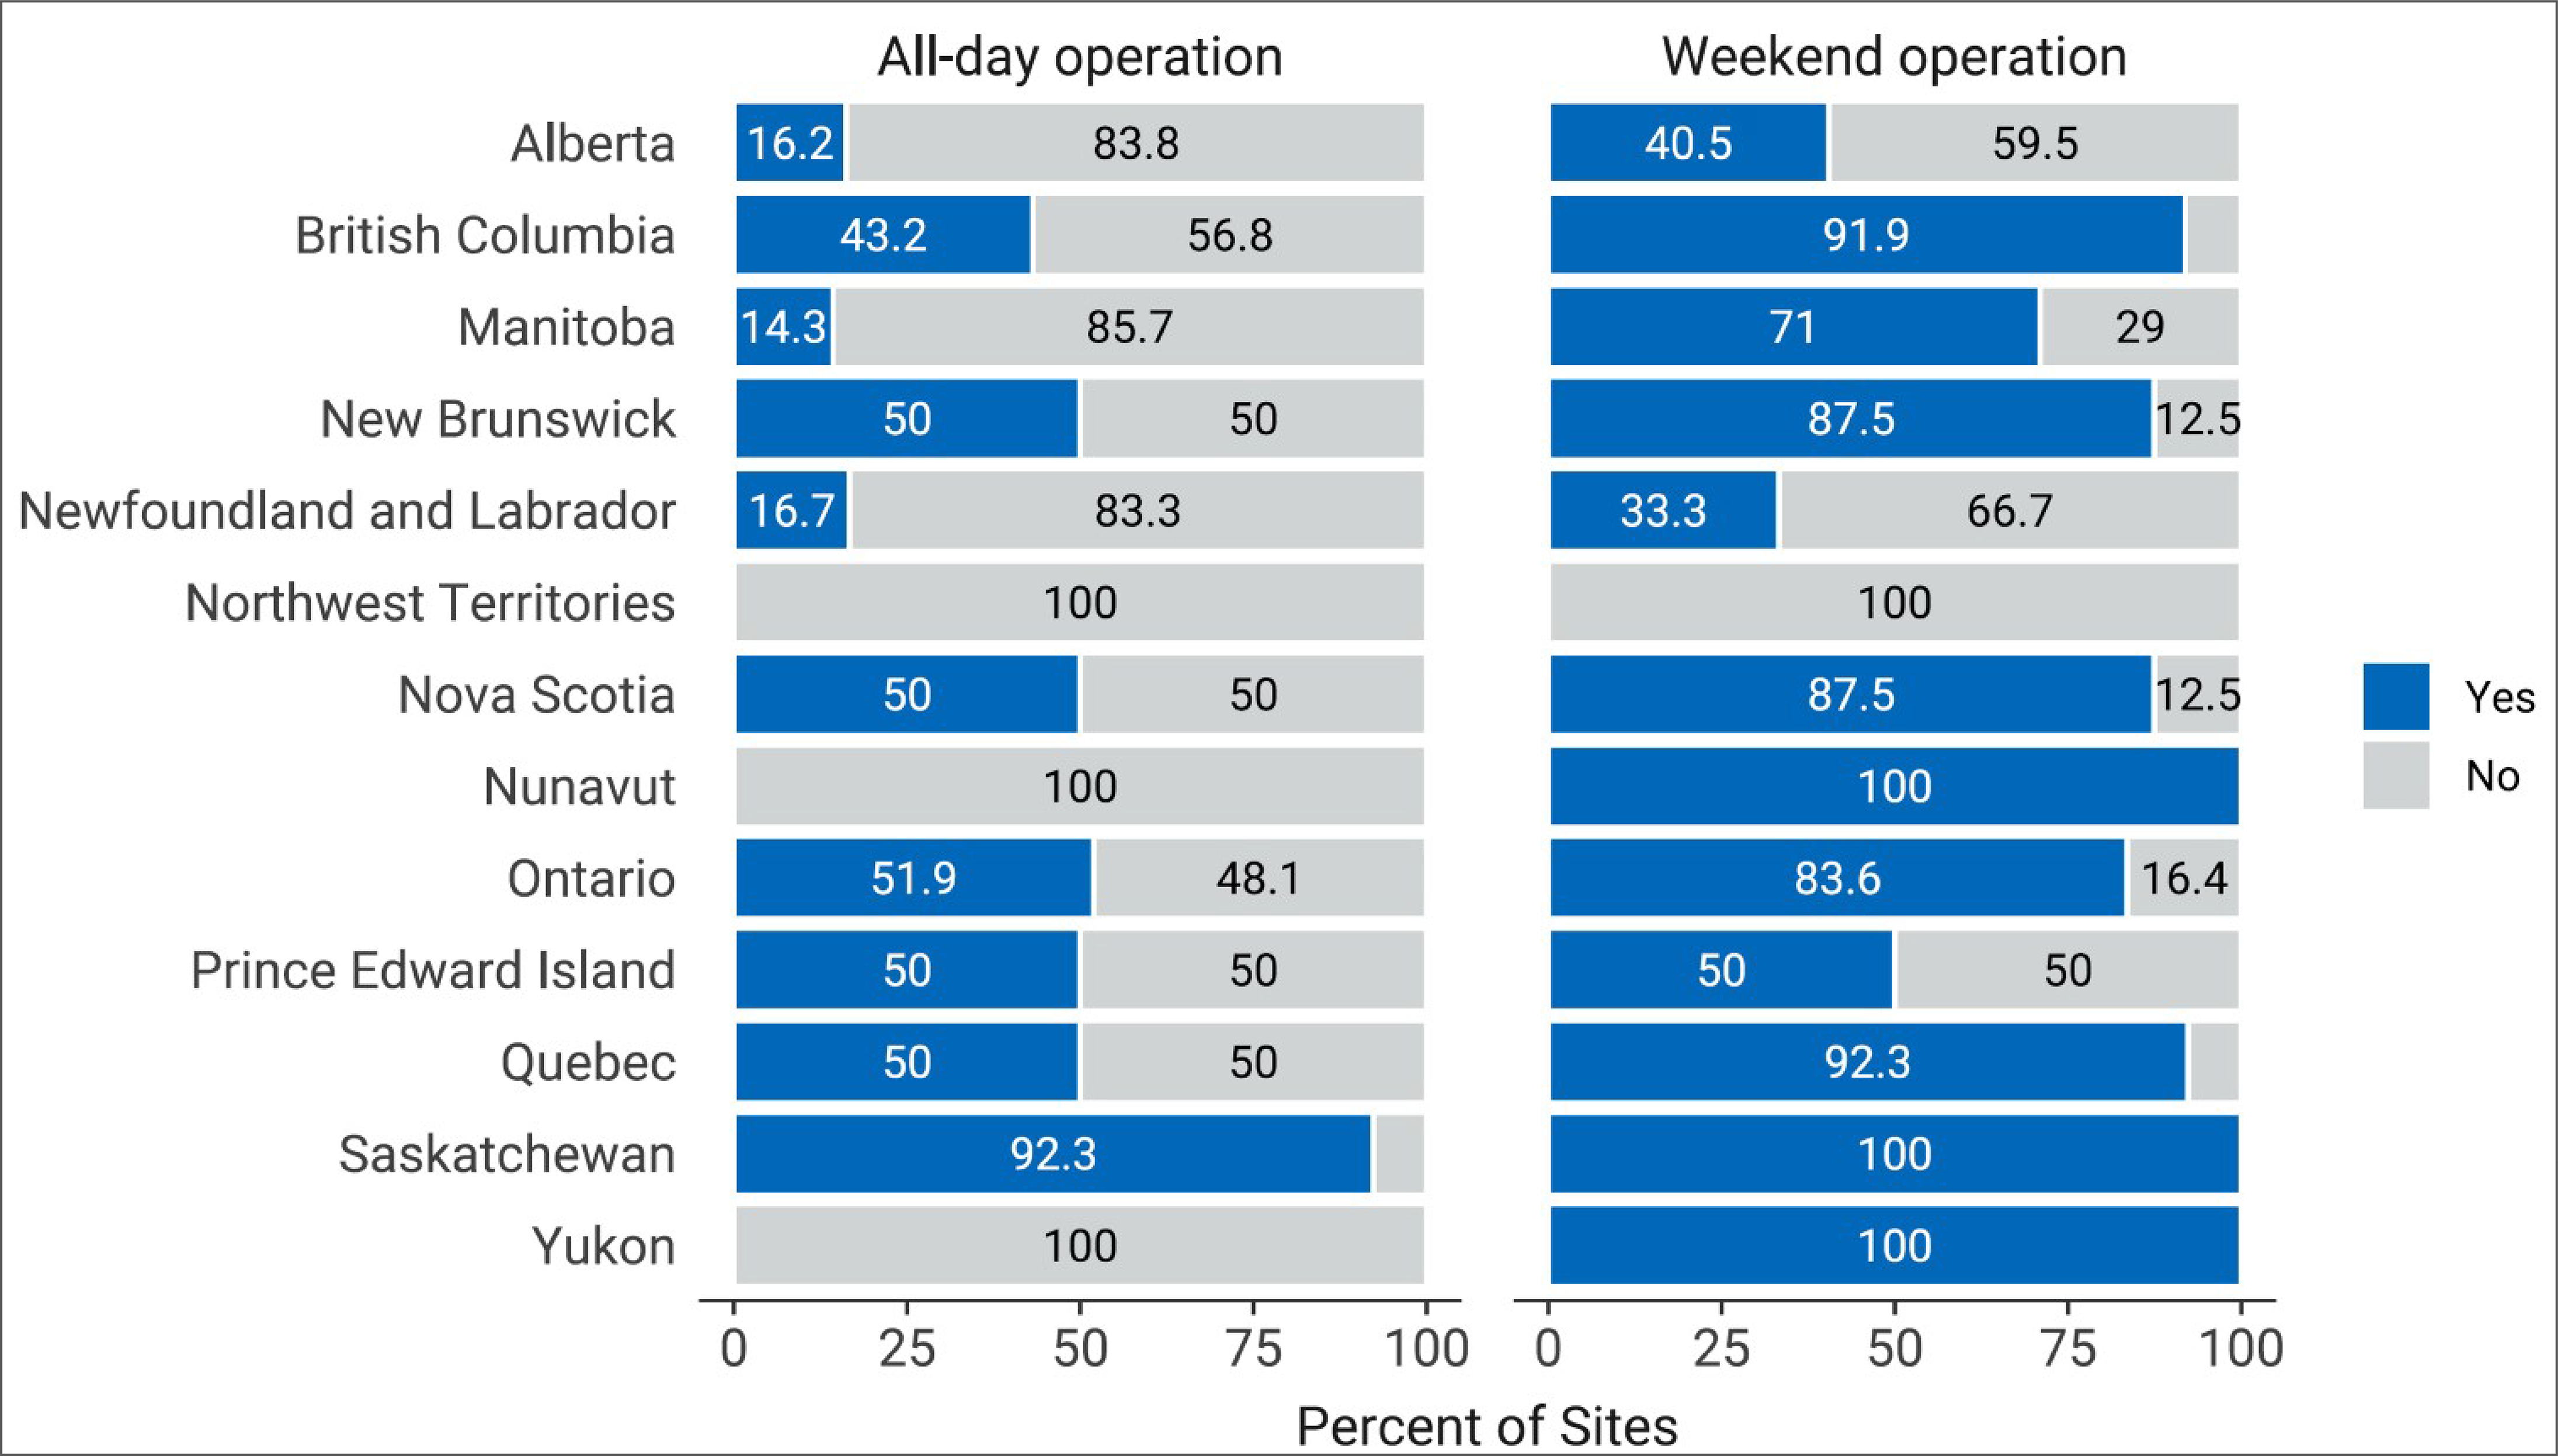
Notes: Survey response data for operation 24 hours a day were available for 221 out of 394 sites across all jurisdictions with CT capacity. Survey response data for weekend operation were available for 222 out of 394 sites across all jurisdictions with CT capacity.
Data were derived from the following survey question: “”Do any units operate 24 hours a day?” and “Do any units operate on the weekend?” Bars are labelled with the percent of sites in each category.
Annual Planned and Unplanned Downtime for CT Units
CT Annual Downtime
The average planned downtime for CT units was 27.7 hours per year, ranging from 2 to 206.5 hours across 196 sites with reported data (Figure 10 and Appendix 3, Table 14).
The average unplanned downtime was 87.5 hours per year, ranging from 4 to 2,000 hours across 166 sites with reported data. One site in British Columbia reported unplanned downtime that exceeded 1,000 hours due to a delay in parts delivery after equipment was damaged due to flooding.
Some commonly reported reasons for unplanned downtime for CT units include the age of equipment, system failure, hardware or software issues, and power failure.
Figure 10: Average Downtime at Sites With CT Units by Reporting Jurisdictions With Capacity, 2022–2023
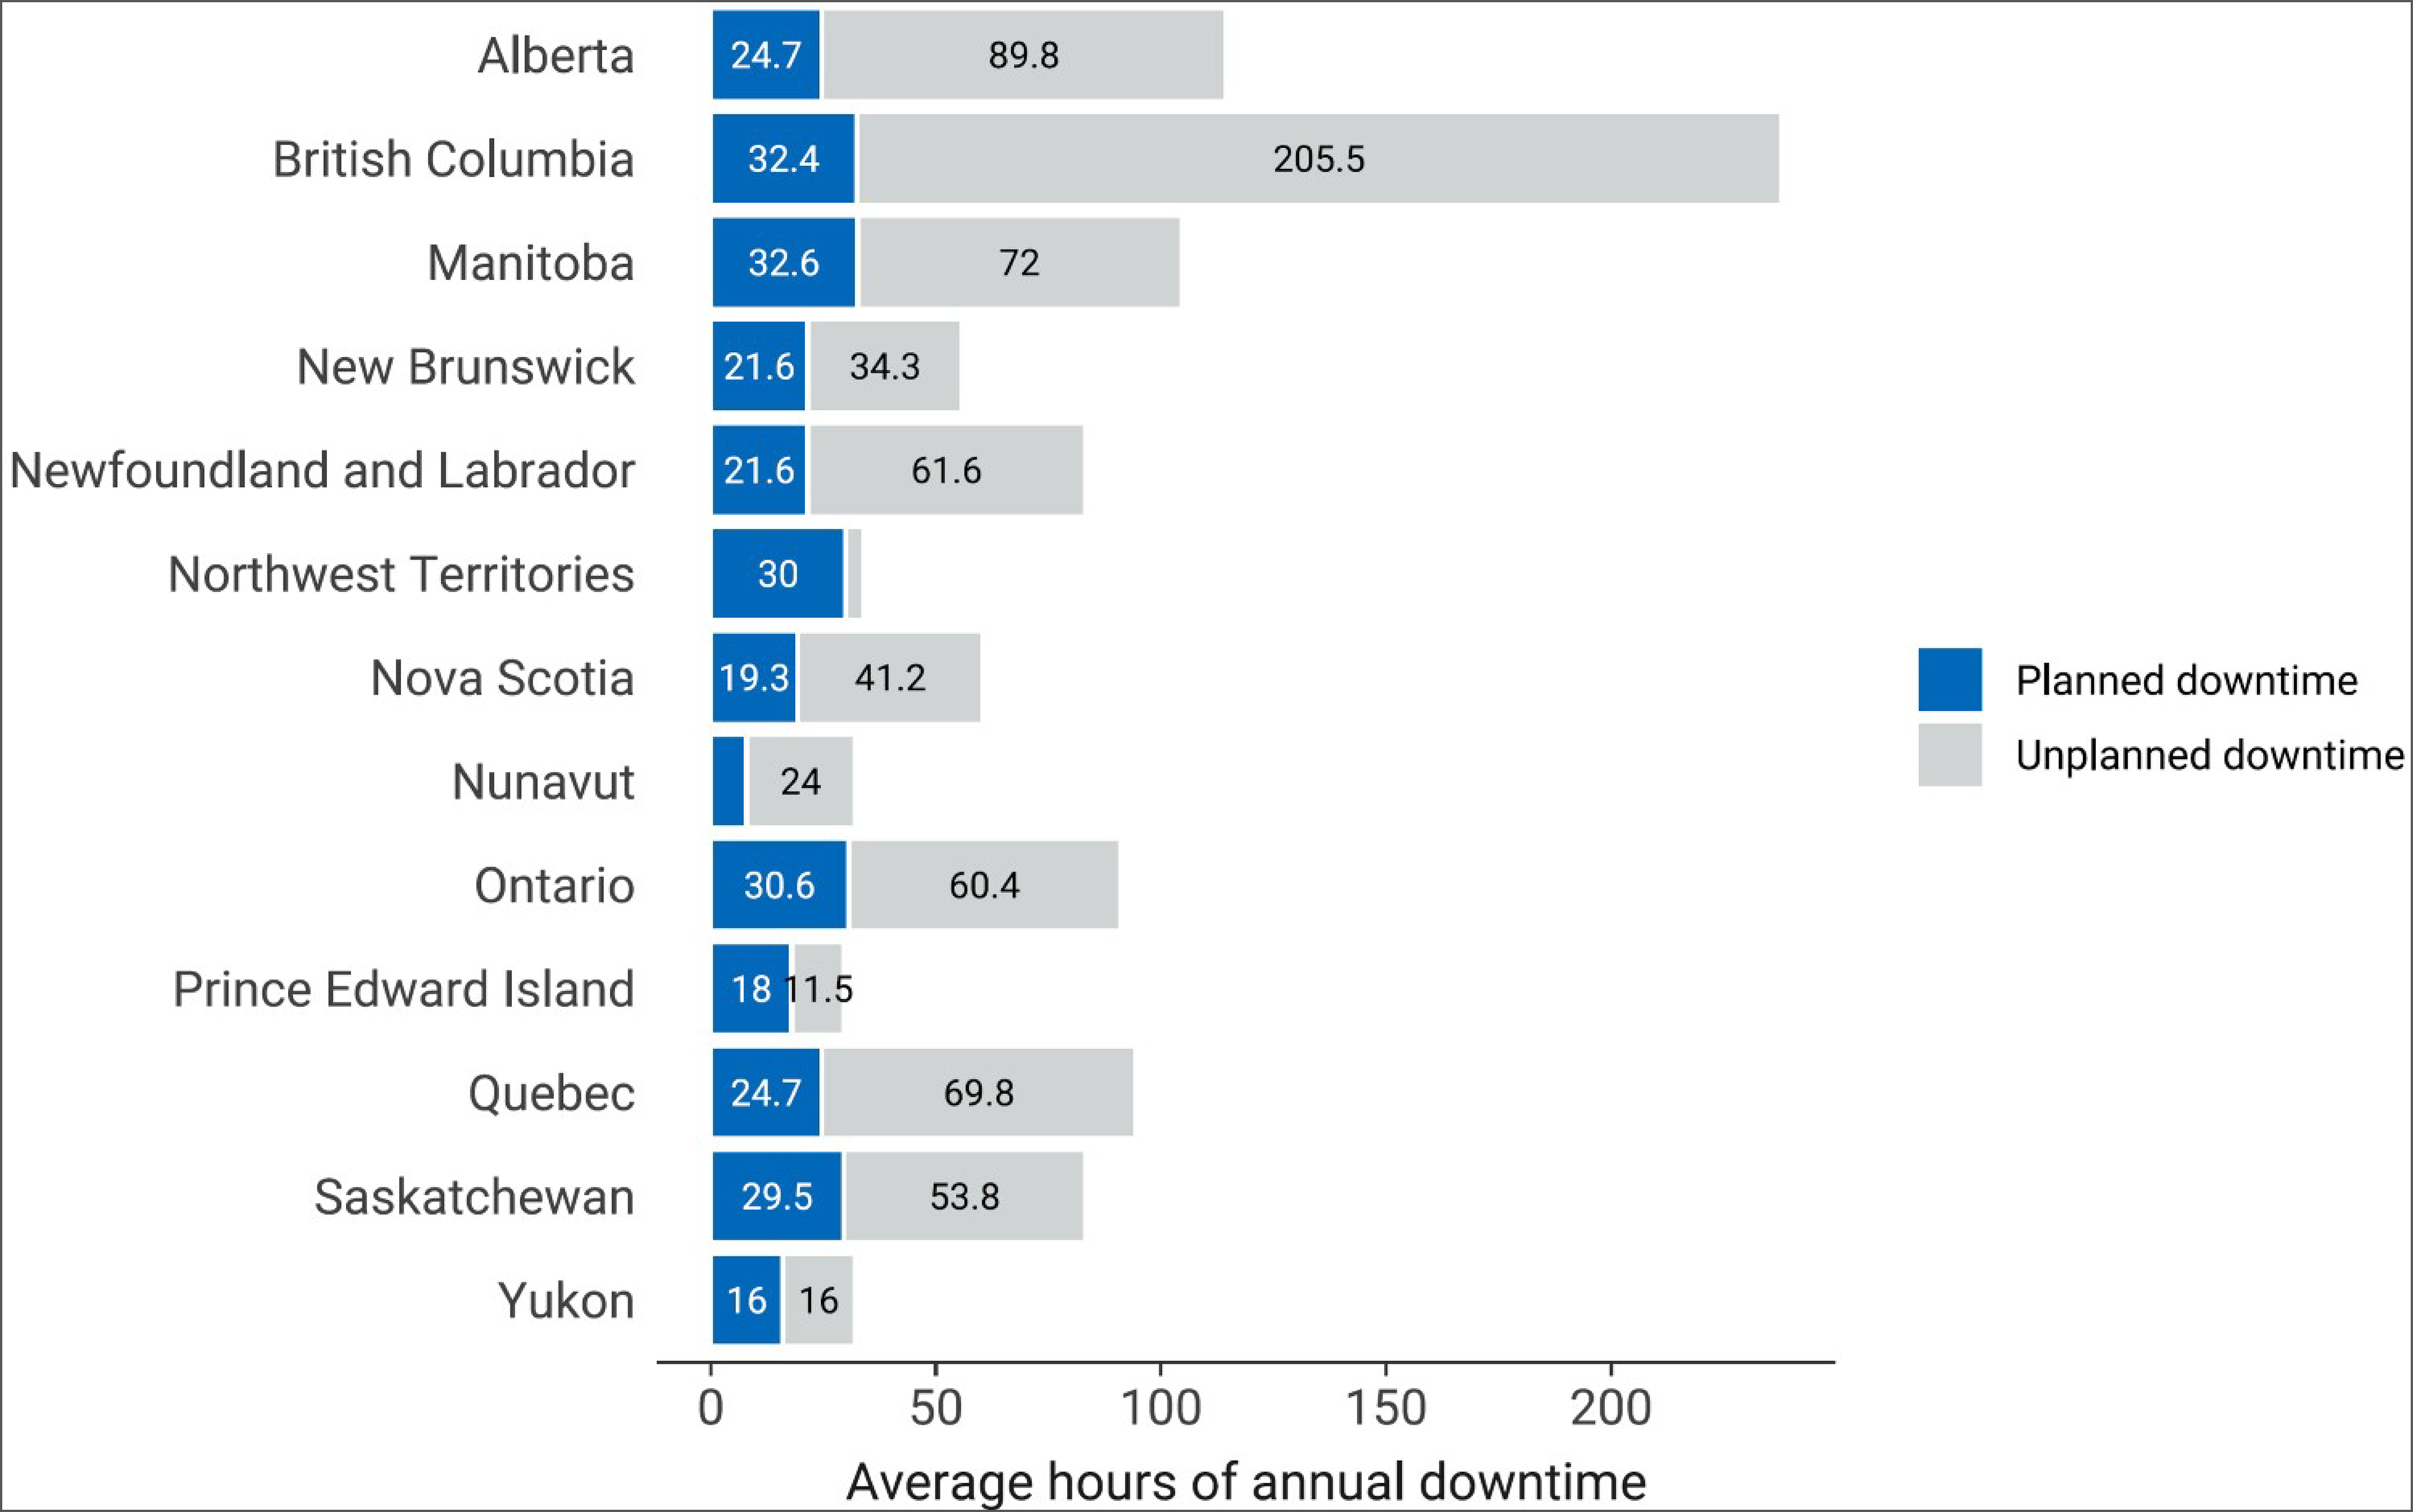
Notes: Survey response data for planned downtime were available for 196 out of 394 sites across all jurisdictions with CT capacity. Survey response data for unplanned downtime were available for 166 out of 394 sites across all jurisdictions with CT capacity.
Data were derived from the following survey question: “How much planned downtime is anticipated for scheduled maintenance for all units in a given year? (expressed in hours)” and “How much unplanned downtime is experienced for all units in a given year? (expressed in hours).” Bars are labelled with the number of hours in each category.
Equipment Servicing at Sites With CT Imaging
The routine maintenance, inspection, and calibration of imaging equipment is usually managed through different types of equipment service agreements. Equipment servicing is part of health technology management and is intended to optimize the use of imaging equipment across its life cycle. Survey participants were asked to report on methods of servicing imaging equipment. The servicing methods included à la carte, full vendor, insurance, managed service contracts, shared service, third party, under warranty, and others. Definitions for types of servicing methods are available in Appendix 2.
Survey participants were asked to report these data at the modality level rather than the unit level. We received feedback indicating that, at sites with more than 1 CT unit, in some instances different servicing agreements may be used for different units.
For CT, the most commonly used equipment servicing method is full vendor service, with 70.1% of sites, followed by shared service (23.2%), warranty (2.7%), and managed service contracts (1.8%) (Table 3).
Table 3: Imaging Equipment Servicing Methods at Sites With CT Units by Province and Territory, 2022–2023
Province or territory | Full vendor service contract n (%) | Shared service (between vendor and in-house or a third party) n (%) | Under warranty n (%) | Third party n (%) | Managed equipment service n (%) | À la carte (time and parts by external service provider) n (%) | Other n (%) |
|---|---|---|---|---|---|---|---|
Alberta | 37 (100) | 0 (0) | 0 (0) | 0 (0) | 0 (0) | 0 (0) | 0 (0) |
British Columbia | 12 (33.3) | 23 (63.9) | 0 (0) | 0 (0) | 0 (0) | 1 (2.8) | 0 (0) |
Manitoba | 15 (71.4) | 6 (28.6) | 0 (0) | 0 (0) | 0 (0) | 0 (0) | 0 (0) |
New Brunswick | 4 (50) | 4 (50) | 0 (0) | 0 (0) | 0 (0) | 0 (0) | 0 (0) |
Newfoundland and Labrador | 9 (75) | 2 (16.7) | 1 (8.3) | 0 (0) | 0 (0) | 0 (0) | 0 (0) |
Northwest Territories | 1 (100) | 0 (0) | 0 (0) | 0 (0) | 0 (0) | 0 (0) | 0 (0) |
Nova Scotia | 11 (91.7) | 0 (0) | 1 (8.3) | 0 (0) | 0 (0) | 0 (0) | 0 (0) |
Nunavut | 1 (100) | 0 (0) | 0 (0) | 0 (0) | 0 (0) | 0 (0) | 0 (0) |
Ontario | 38 (69.1) | 6 (10.9) | 3 (5.5) | 3 (5.5) | 4 (7.3) | 0 (0) | 1 (1.8) |
Prince Edward Island | 2 (100) | 0 (0) | 0 (0) | 0 (0) | 0 (0) | 0 (0) | 0 (0) |
Quebec | 17 (68) | 8 (32) | 0 (0) | 0 (0) | 0 (0) | 0 (0) | 0 (0) |
Saskatchewan | 10 (76.9) | 3 (23.1) | 0 (0) | 0 (0) | 0 (0) | 0 (0) | 0 (0) |
Yukon | 0 (0) | 0 (0) | 1 (100) | 0 (0) | 0 (0) | 0 (0) | 0 (0) |
Canada | 157 (70.1) | 52 (23.2) | 6 (2.7) | 3 (1.3) | 4 (1.8) | 1 (0.4) | 1 (0.4) |
Notes: Survey response data were available for 224 out of 394 sites across all jurisdictions with CT capacity.
Data were derived from the following survey question: “How is imaging equipment serviced?”
Full-Time Equivalent Medical Radiation Technologists for CT Units
Sites were asked to provide information on the number of full-time equivalent (FTE) medical radiation technologists (MRTs) assigned at the site level. An FTE position for an MRT was defined as an 8-hour workday, 5 days per week. The reported number of FTE trained MRTs may not reflect the total number of filled FTE trained MRTs with CT, but rather the total number of open positions.
For CT, an average of 6 FTE trained MRTs were assigned per site, ranging between 1 and 28 (Table 4).
Table 4: Numbers of FTE Trained MRTs for CT, 2022–2023
Province or territory | Number of reporting sites | Total FTE MRTs | Average FTE trained MRTs per site (min to max) | FTE trained MRTs per million populationa | Total CT unitsb |
|---|---|---|---|---|---|
Alberta | 37 | 187 | 5.1 (1 to 19) | 39.8 | 53 |
British Columbia | 35 | 246 | 7 (1 to 26) | 45.2 | 75 |
Manitoba | 16 | 85.2 | 6.2 (3 to 20.6) | 59.0 | 24 |
New Brunswick | 8 | 47 | 5.9 (3 to 12) | 56.5 | 15 |
Newfoundland and Labrador | 11 | 35 | 3.2 (1 to 7) | 65.6 | 16 |
Northwest Territories | 1 | 2 | 2 (2 to 2) | 43.8 | 1 |
Nova Scotia | 8 | 51 | 6.4 (3 to 16) | 48.7 | 18 |
Nunavut | 1 | 3 | 3 (3 to 3) | 73.7 | 1 |
Ontario | 54 | 357 | 6.6 (1 to 18) | 23 | 192 |
Prince Edward Island | 2 | 8 | 4 (3 to 5) | 45.4 | 2 |
Quebec | 21 | 140 | 6.7 (1 to 28) | 15.9 | 144 |
Saskatchewan | 13 | 70 | 5.4 (2 to 12) | 57.3 | 18 |
Yukon | 1 | 5 | 5 (5 to 5) | 112.6 | 1 |
Canada | 208 | 1,236.2 | 6 (1 to 28) | 31 | 560 |
FTE = full-time equivalent; MRT = medical radiation technologist.
Notes: Survey response data were available for 208 out of 394 sites across all jurisdictions with CT capacity.
Data were derived from the following survey question: “How many full-time equivalent (FTE) technologists are assigned to all units (collective number of FTEs for all units)?”
aCalculation based on the population (estimated) as of the first quarter of 2023.12
bUnit counts included all sites that participated in the national survey that reported information for number of units.
Age of CT Imaging Equipment
Average Age of CT Units
The average age of CT equipment in Canada is 8.2 years, ranging between 0 and 23 years (Appendix 3, Table 15). Two-thirds (66.5%) of CT units were operational within the previous 10 years, and a quarter (25.6%) began operation between 11 and 15 years previously (Figure 11 and Appendix 3, Table 16). Table 29 (Appendix 4) presents the average age of CT equipment for publicly funded sites.
In 2022–2023, 31 units were installed in Canada across 8 jurisdictions: Alberta, British Columbia, Newfoundland and Labrador, Nova Scotia, Ontario, Quebec, Saskatchewan, and Yukon.
Figure 11: Percentage of Average Years of CT Operation by Province and Territory, 2022–2023
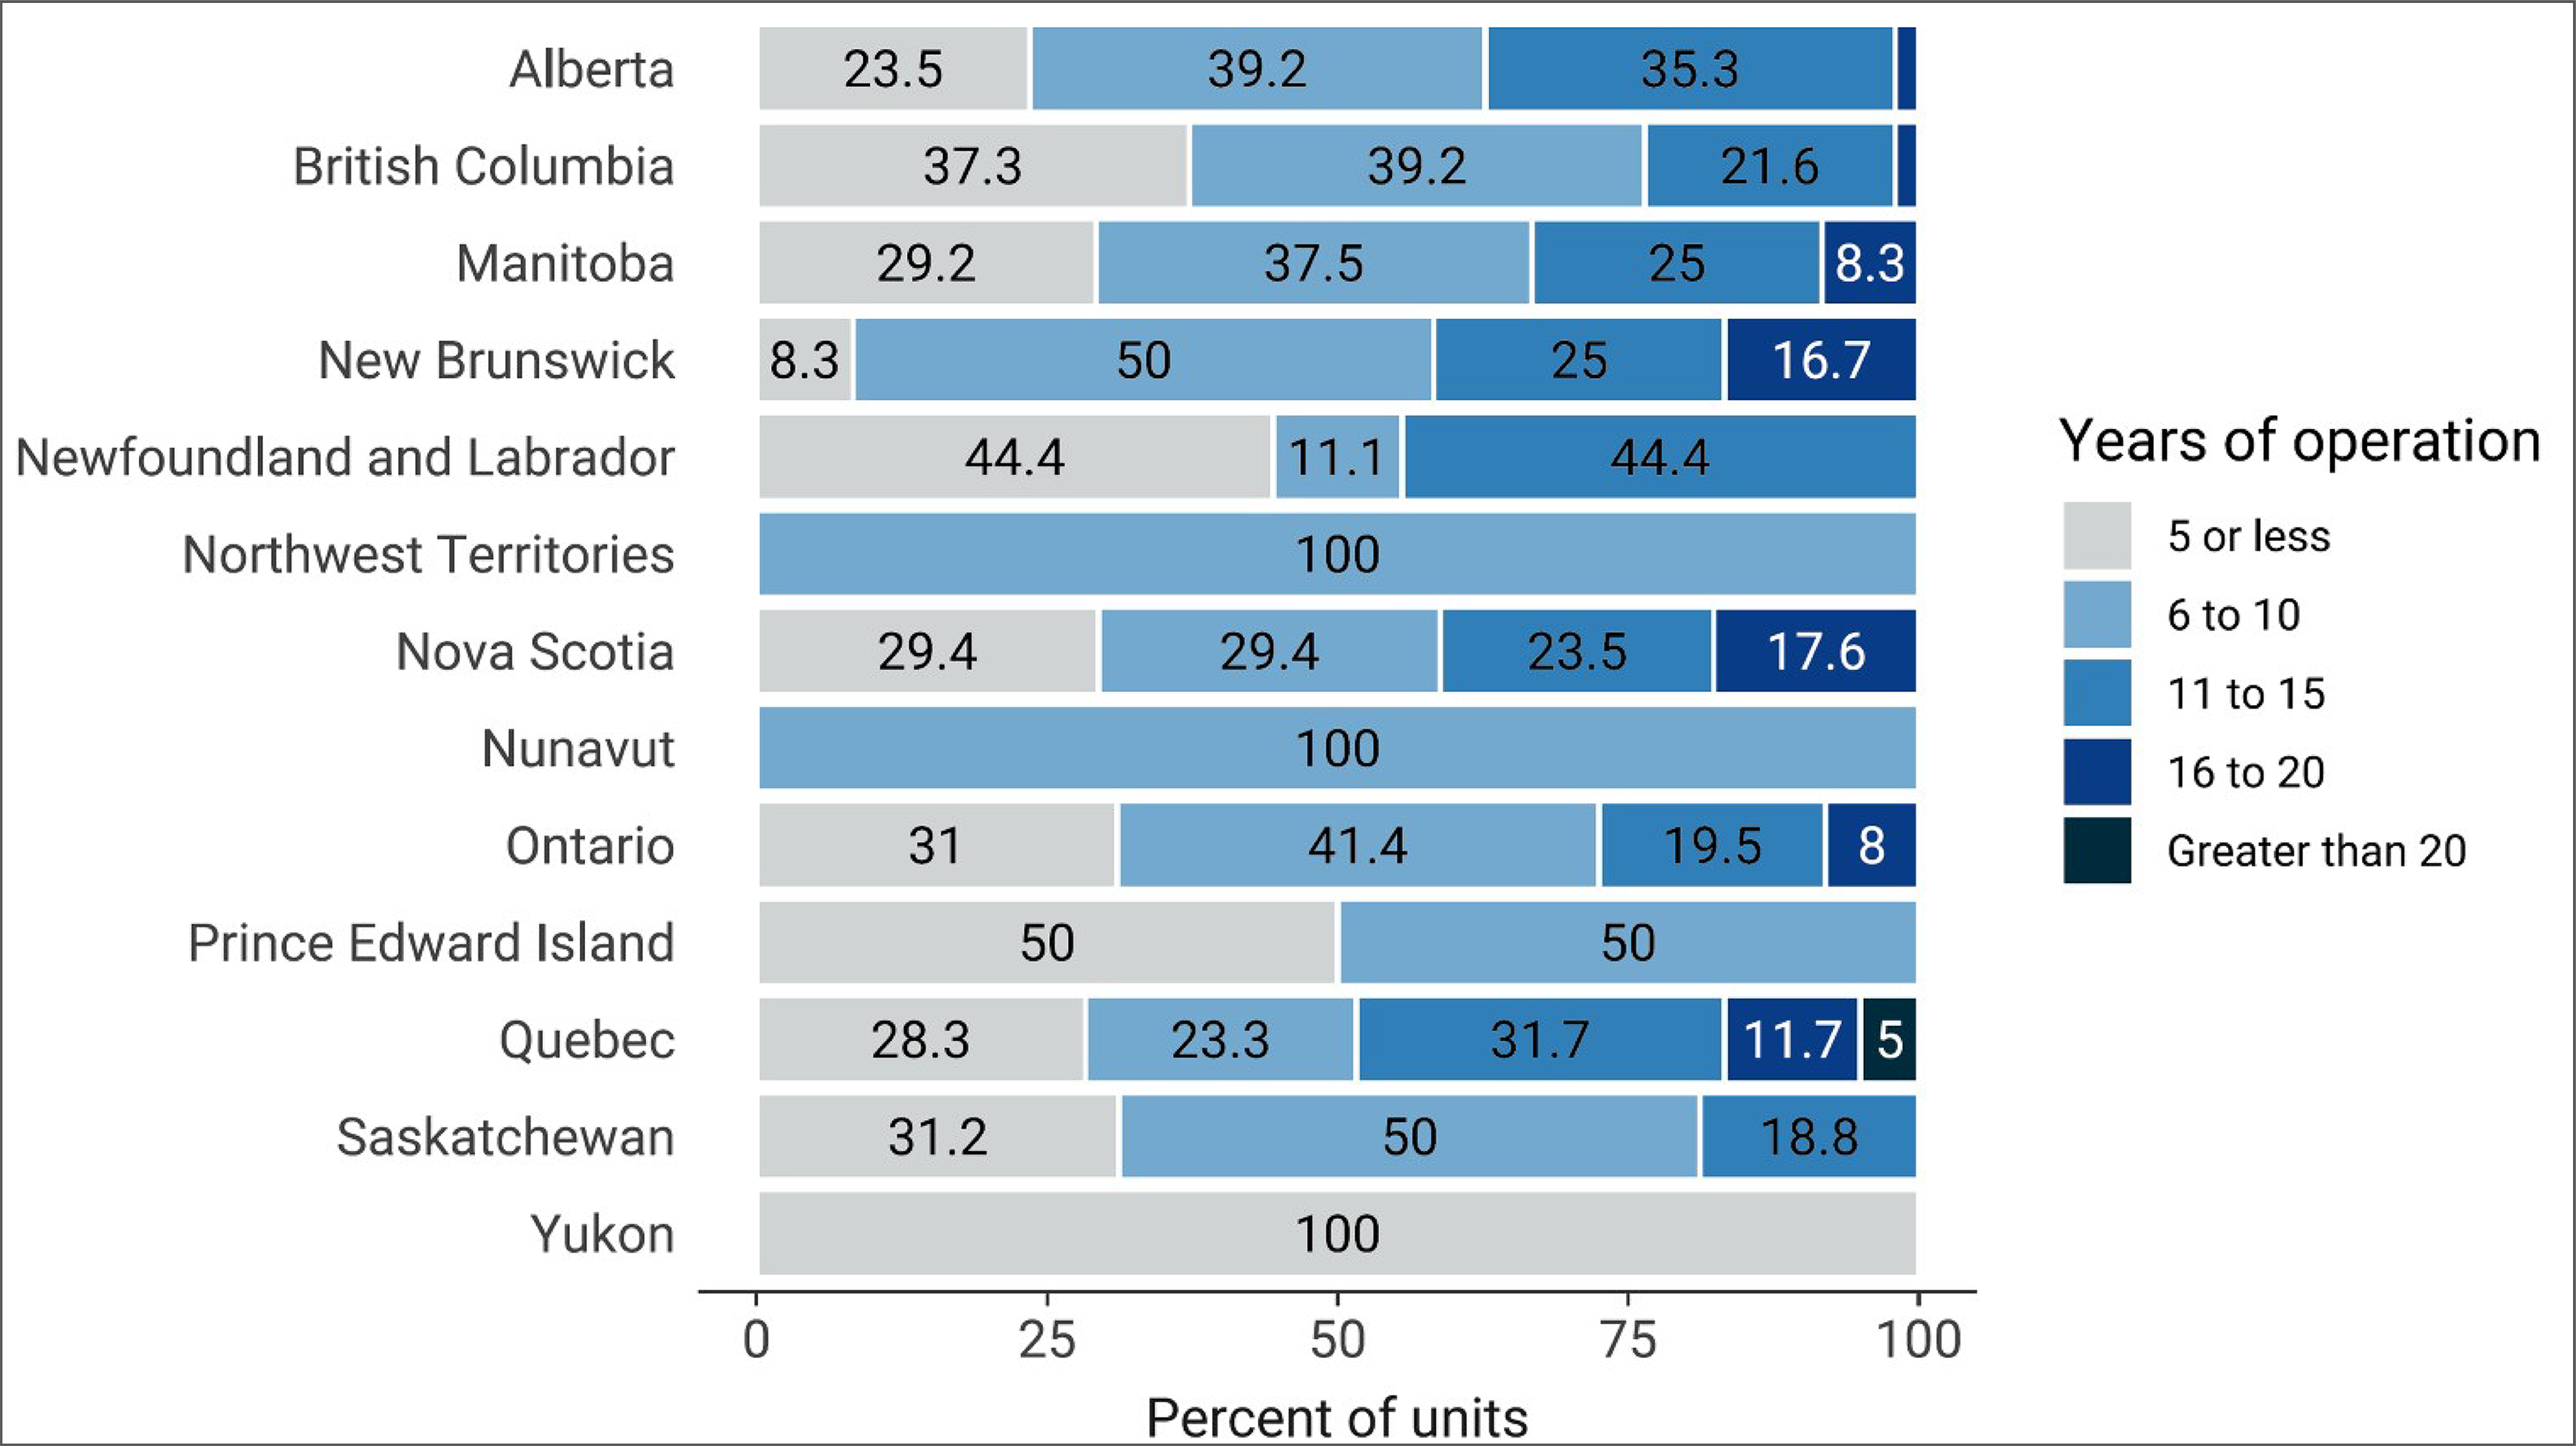
Notes: Survey response data were available for 332 of 560 CT units across all jurisdictions with capacity.
Age for each unit was calculated from the following survey question: “What year did (or will) the [modality] unit become operational?” subtracted from 2023. Bars are labelled with the percent of sites in each category.
Patterns of Use of CT Imaging Equipment
Purpose and Indication for CT Units
Purpose of CT Use
For all sites that provided use data, on average, CT exams are most often indicated for oncology exams, at 24.1% (use at individual sites ranged from 0% to 70%), followed by neurology exams at 16.5% (range, 0% to 40%), and hepatobiliary exams at 14% (range 0% to 50%). (Figure 12 and Appendix 3, Table 17). Applications for CT continue to expand to other clinical and therapeutic areas.
For all sites that provided use data, on average, CT is most often used for diagnostic noncardiac purposes (89.2%), followed by diagnostic cardiac purposes (5%), interventional purposes (4.2%), and research purposes at 1%. (Figure 13 and Appendix 3, Table 18).
Figure 12: CT Use by Clinical Specialty, 2022–2023
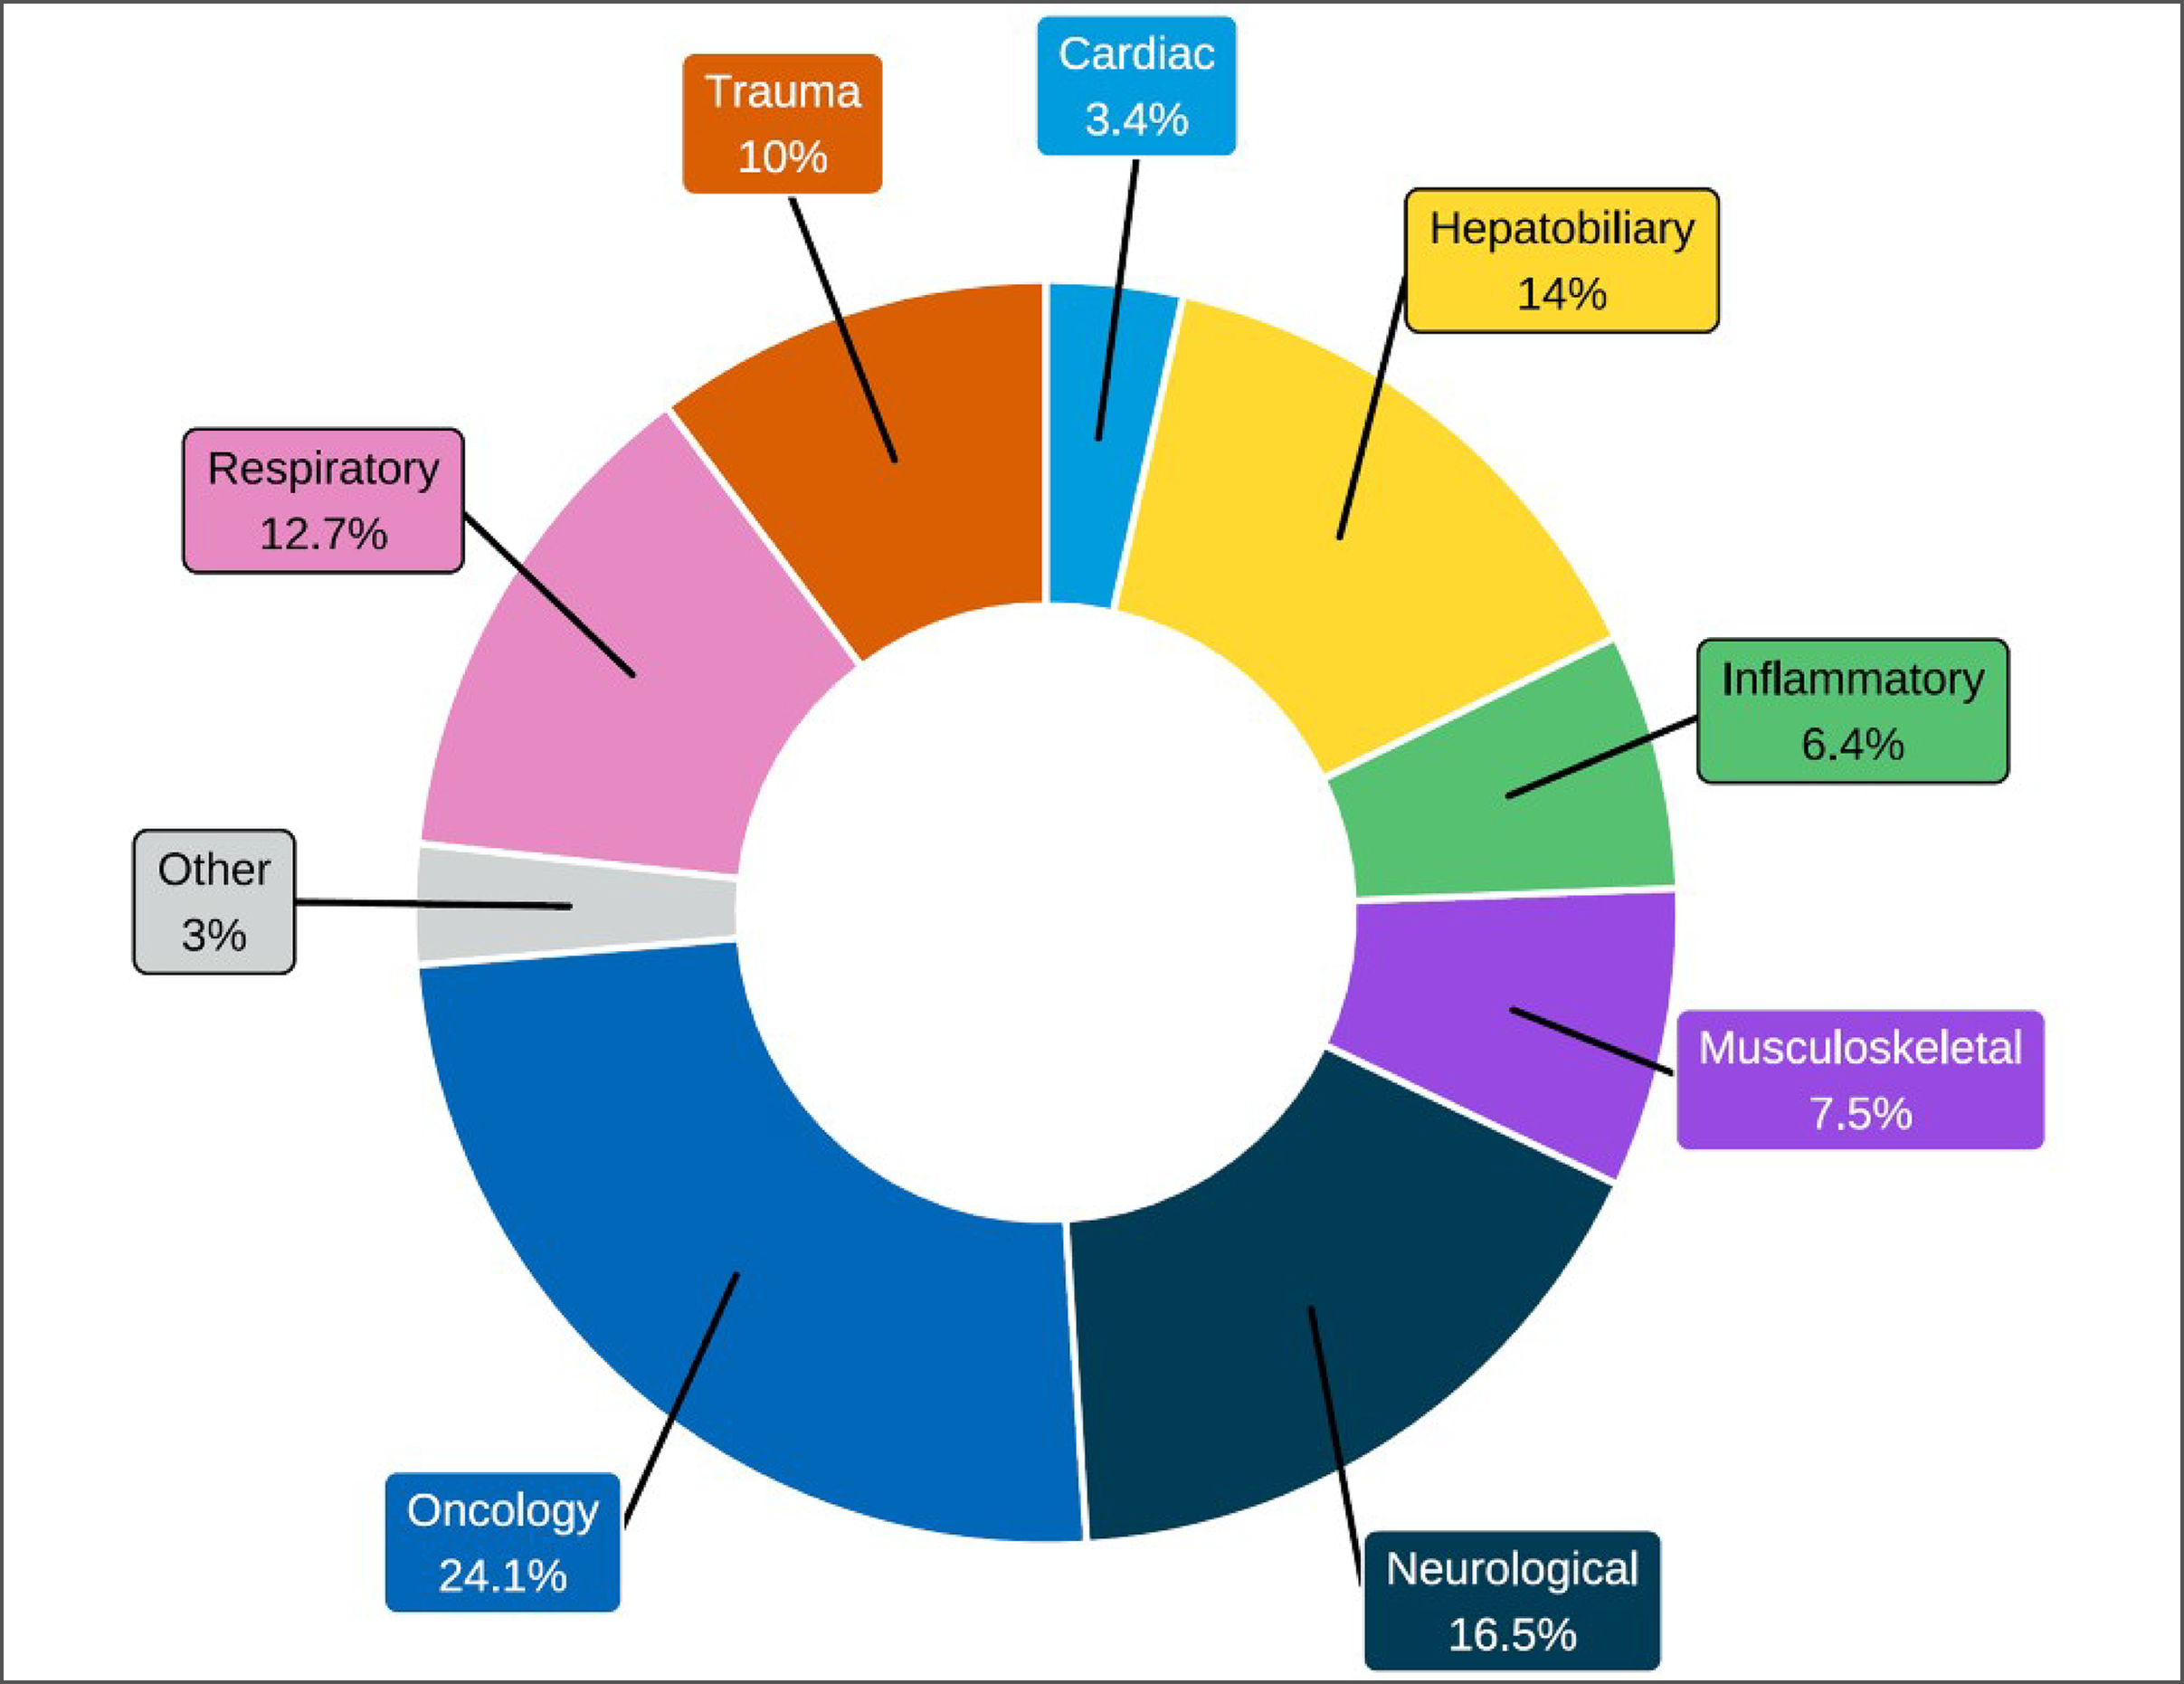
Notes: Survey response data on the average percentage of CT use by discipline were available for 106 out of 394 sites across 11 of the 13 jurisdictions with capacity. No data were available for Nunavut and Yukon.
Data were derived from the following survey question: “On average, what percentage of these exams fall into the following categories? The total percentage, expressed as a number, must add up to 100.” The following categories were offered: oncology, respiratory, hepatobiliary, musculoskeletal, inflammatory or infectious disease, neurological, cardiac, trauma, and other.
Figure 13: Purpose of CT Use by Medical Category, 2022–2023
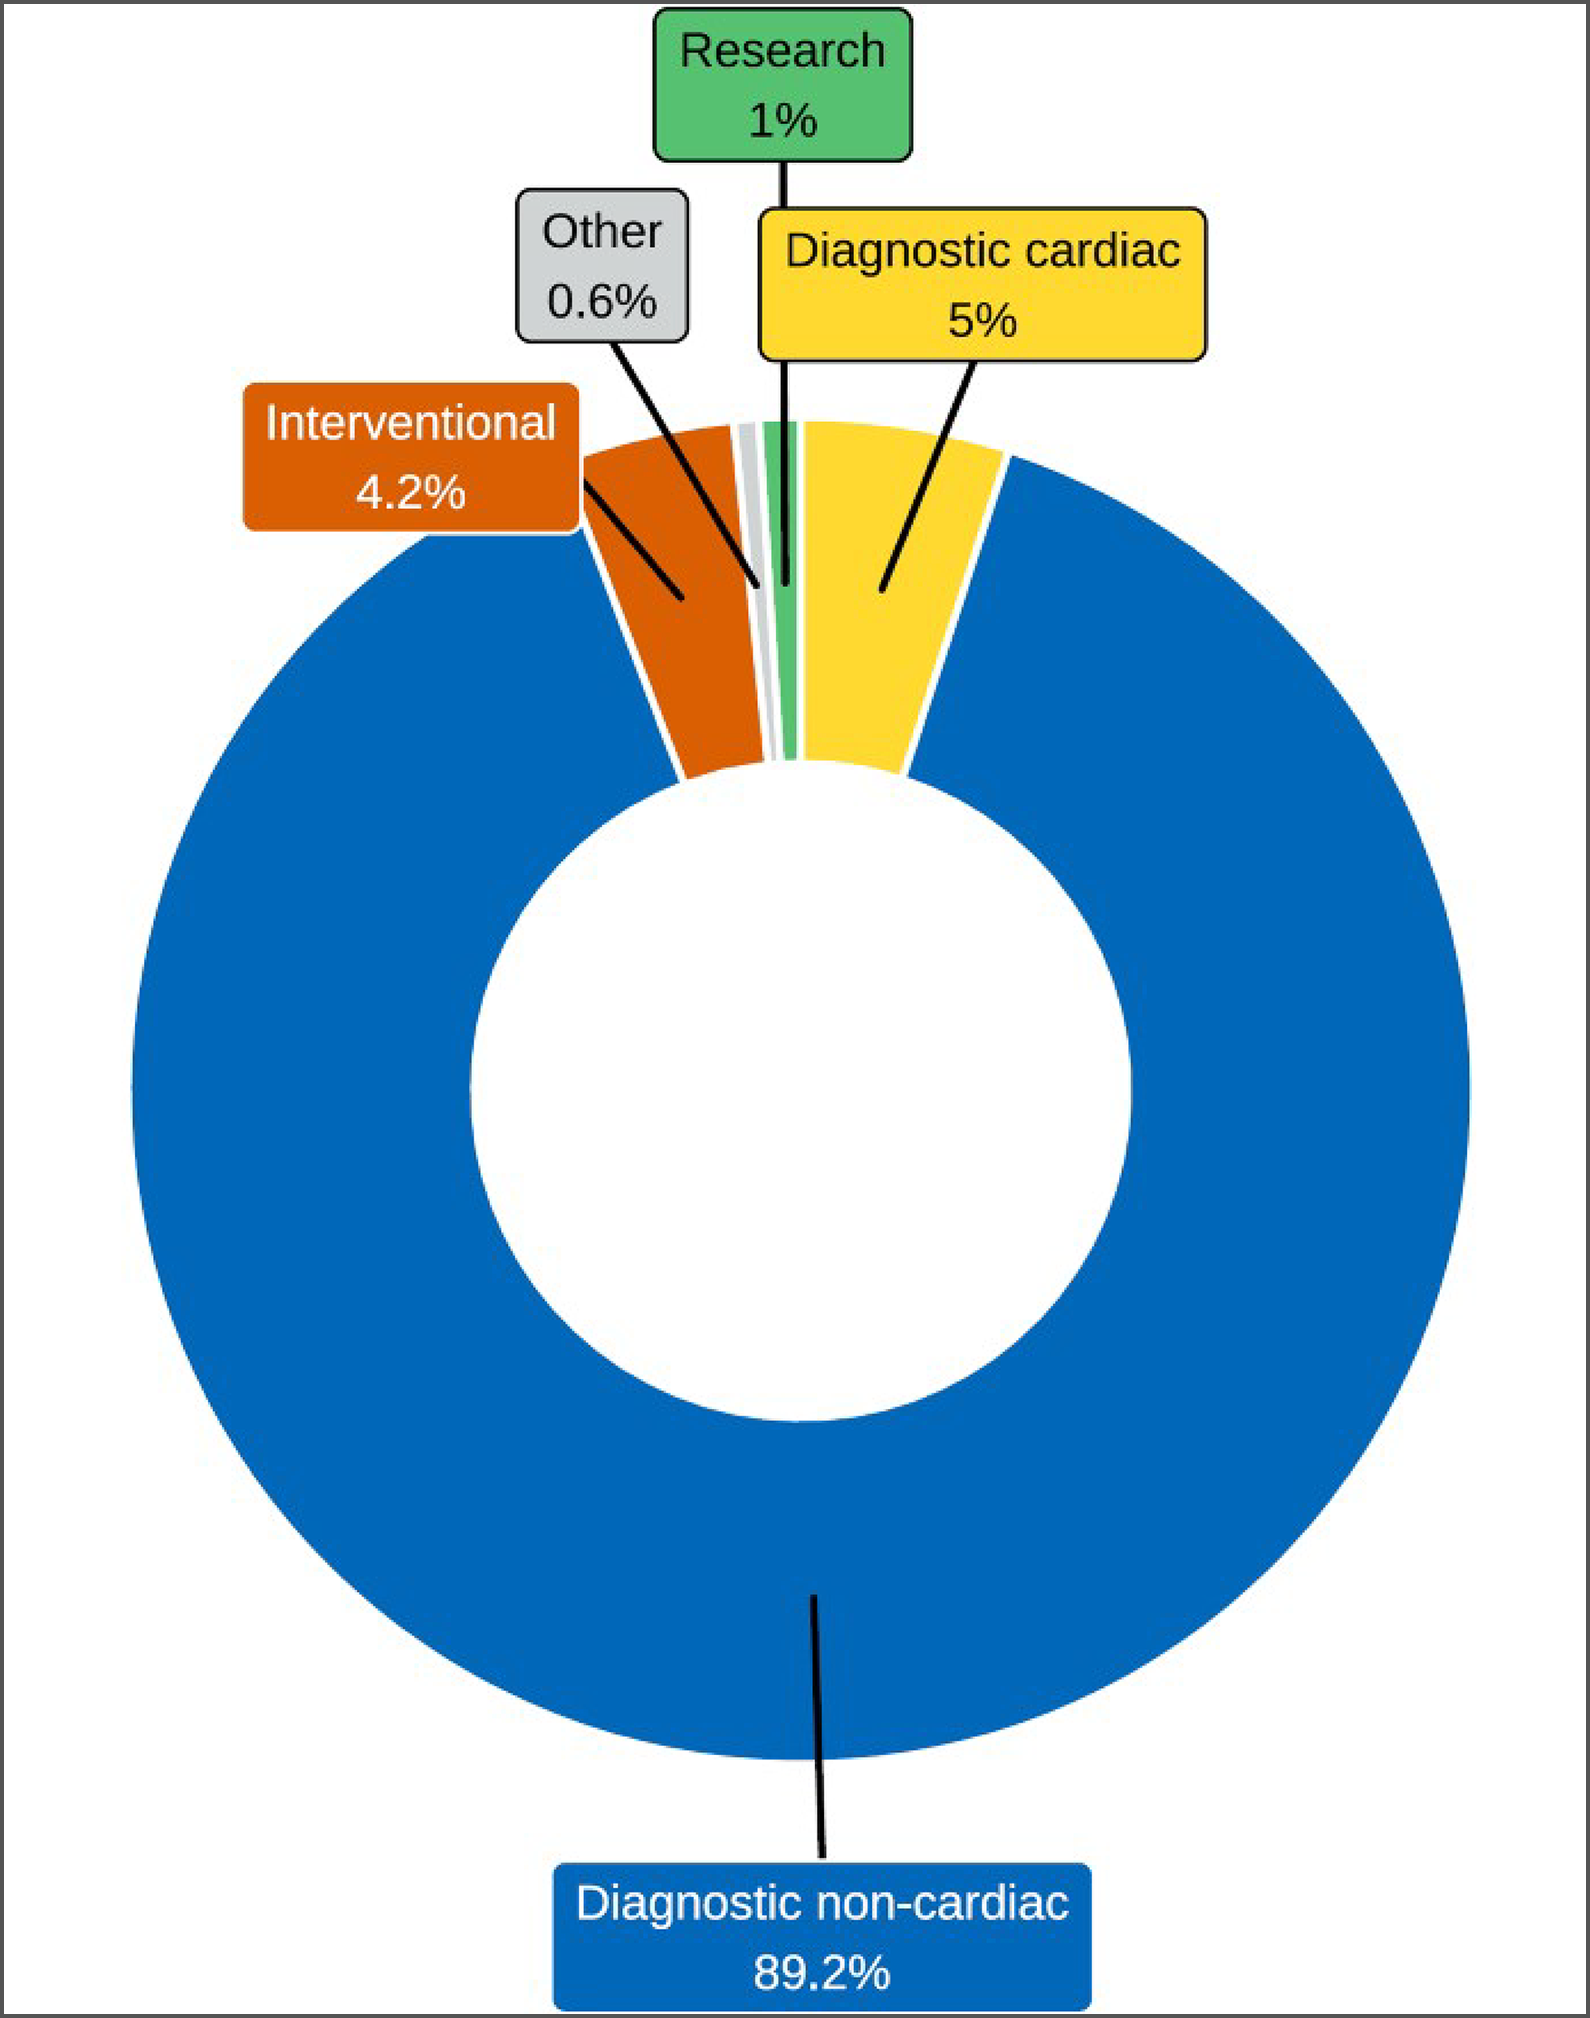
Notes: Survey response data on the average percentage of CT use by discipline were available for 190 out of 394 sites across all jurisdictions with capacity.
Data were derived from the following survey question: “Based on your practice in the last fiscal year, what percentage of time are all units used for? The total percentage, expressed as a number, must add up to 100.” The following categories were offered: diagnostic purposes (cardiac only), diagnostic purposes (noncardiac), research, interventional, and other.
Integration of Use of Artificial Intelligence in CT Imaging
Artificial intelligence (AI) is a branch of computer science concerned with the development of systems that can perform problem-solving, reasoning, and recognition tasks.15,16 The current focus of AI in medical imaging departments in Canada includes, but is not limited to, assisting imaging professionals in lowering radiation dose, reading and interpreting images, image reconstruction, planning treatment, predicting outcomes, and carrying out administrative tasks.15,16
Survey participants were asked to report on the use of AI for CT in the clinical or research setting. Most sites either did not respond to the questions on AI use or answered with “no,” indicating that it was not used.
Use of AI for CT
Data available for sites with CT capacity that answered this question are shown in Appendix 3, Table 19.
A total of 39 sites (21.5%) located in 10 provinces and territories reported the use of AI with CT in the clinical setting for image reconstruction, and 32 sites (17.7%) in 8 provinces and territories reported the use of AI for lowering radiation dose.
Two sites in Ontario used AI with CT in the research setting for lowering radiation dose and for reading and interpreting images. One of these 2 sites also reported using AI in the research setting for image reconstruction.
Ordering and Receiving Exams
Exam-Ordering Privileges at Sites With CT Units
We asked jurisdictional validators to provide details on the exam-ordering privileges of different types of health care professionals working in the public setting. Responses are summarized in Appendix 3, Table 20. The results show that:
clinical specialists are authorized to order CT exams in all jurisdictions that operate CT units, except for the Northwest Territories.
family doctors, general practitioners, and nurse practitioners can order CT scans in 10 provinces and territories, and under certain conditions (not specified) in Quebec.
chiropractors, podiatrists, and dentists can order exams in Alberta and British Columbia. In Saskatchewan, chiropractors can order exams if a prior recommendation by a radiologist is made.
No data were available for Ontario. For New Brunswick, the responses came from 1 of the 2 regional health authorities, the Horizon Health Network.
How Exam Requests Are Received at Sites With CT Imaging
Survey participants were asked to report their use of various exam-ordering practices from the following options: requests by automated order entry, paper, fax, telephone, and centralized order entry for some, or all, exams.
For CT exam requests, the most commonly reported ordering practices were fax (98.1%), paper form (91.5%), and centralized order entry booking (56.5%), based on sites that provided responses to this question (Figure 14 and Appendix 3, Table 21).
Figure 14: Summary of CT Exam-Ordering Practices at Sites That Reported a Process, 2022–2023
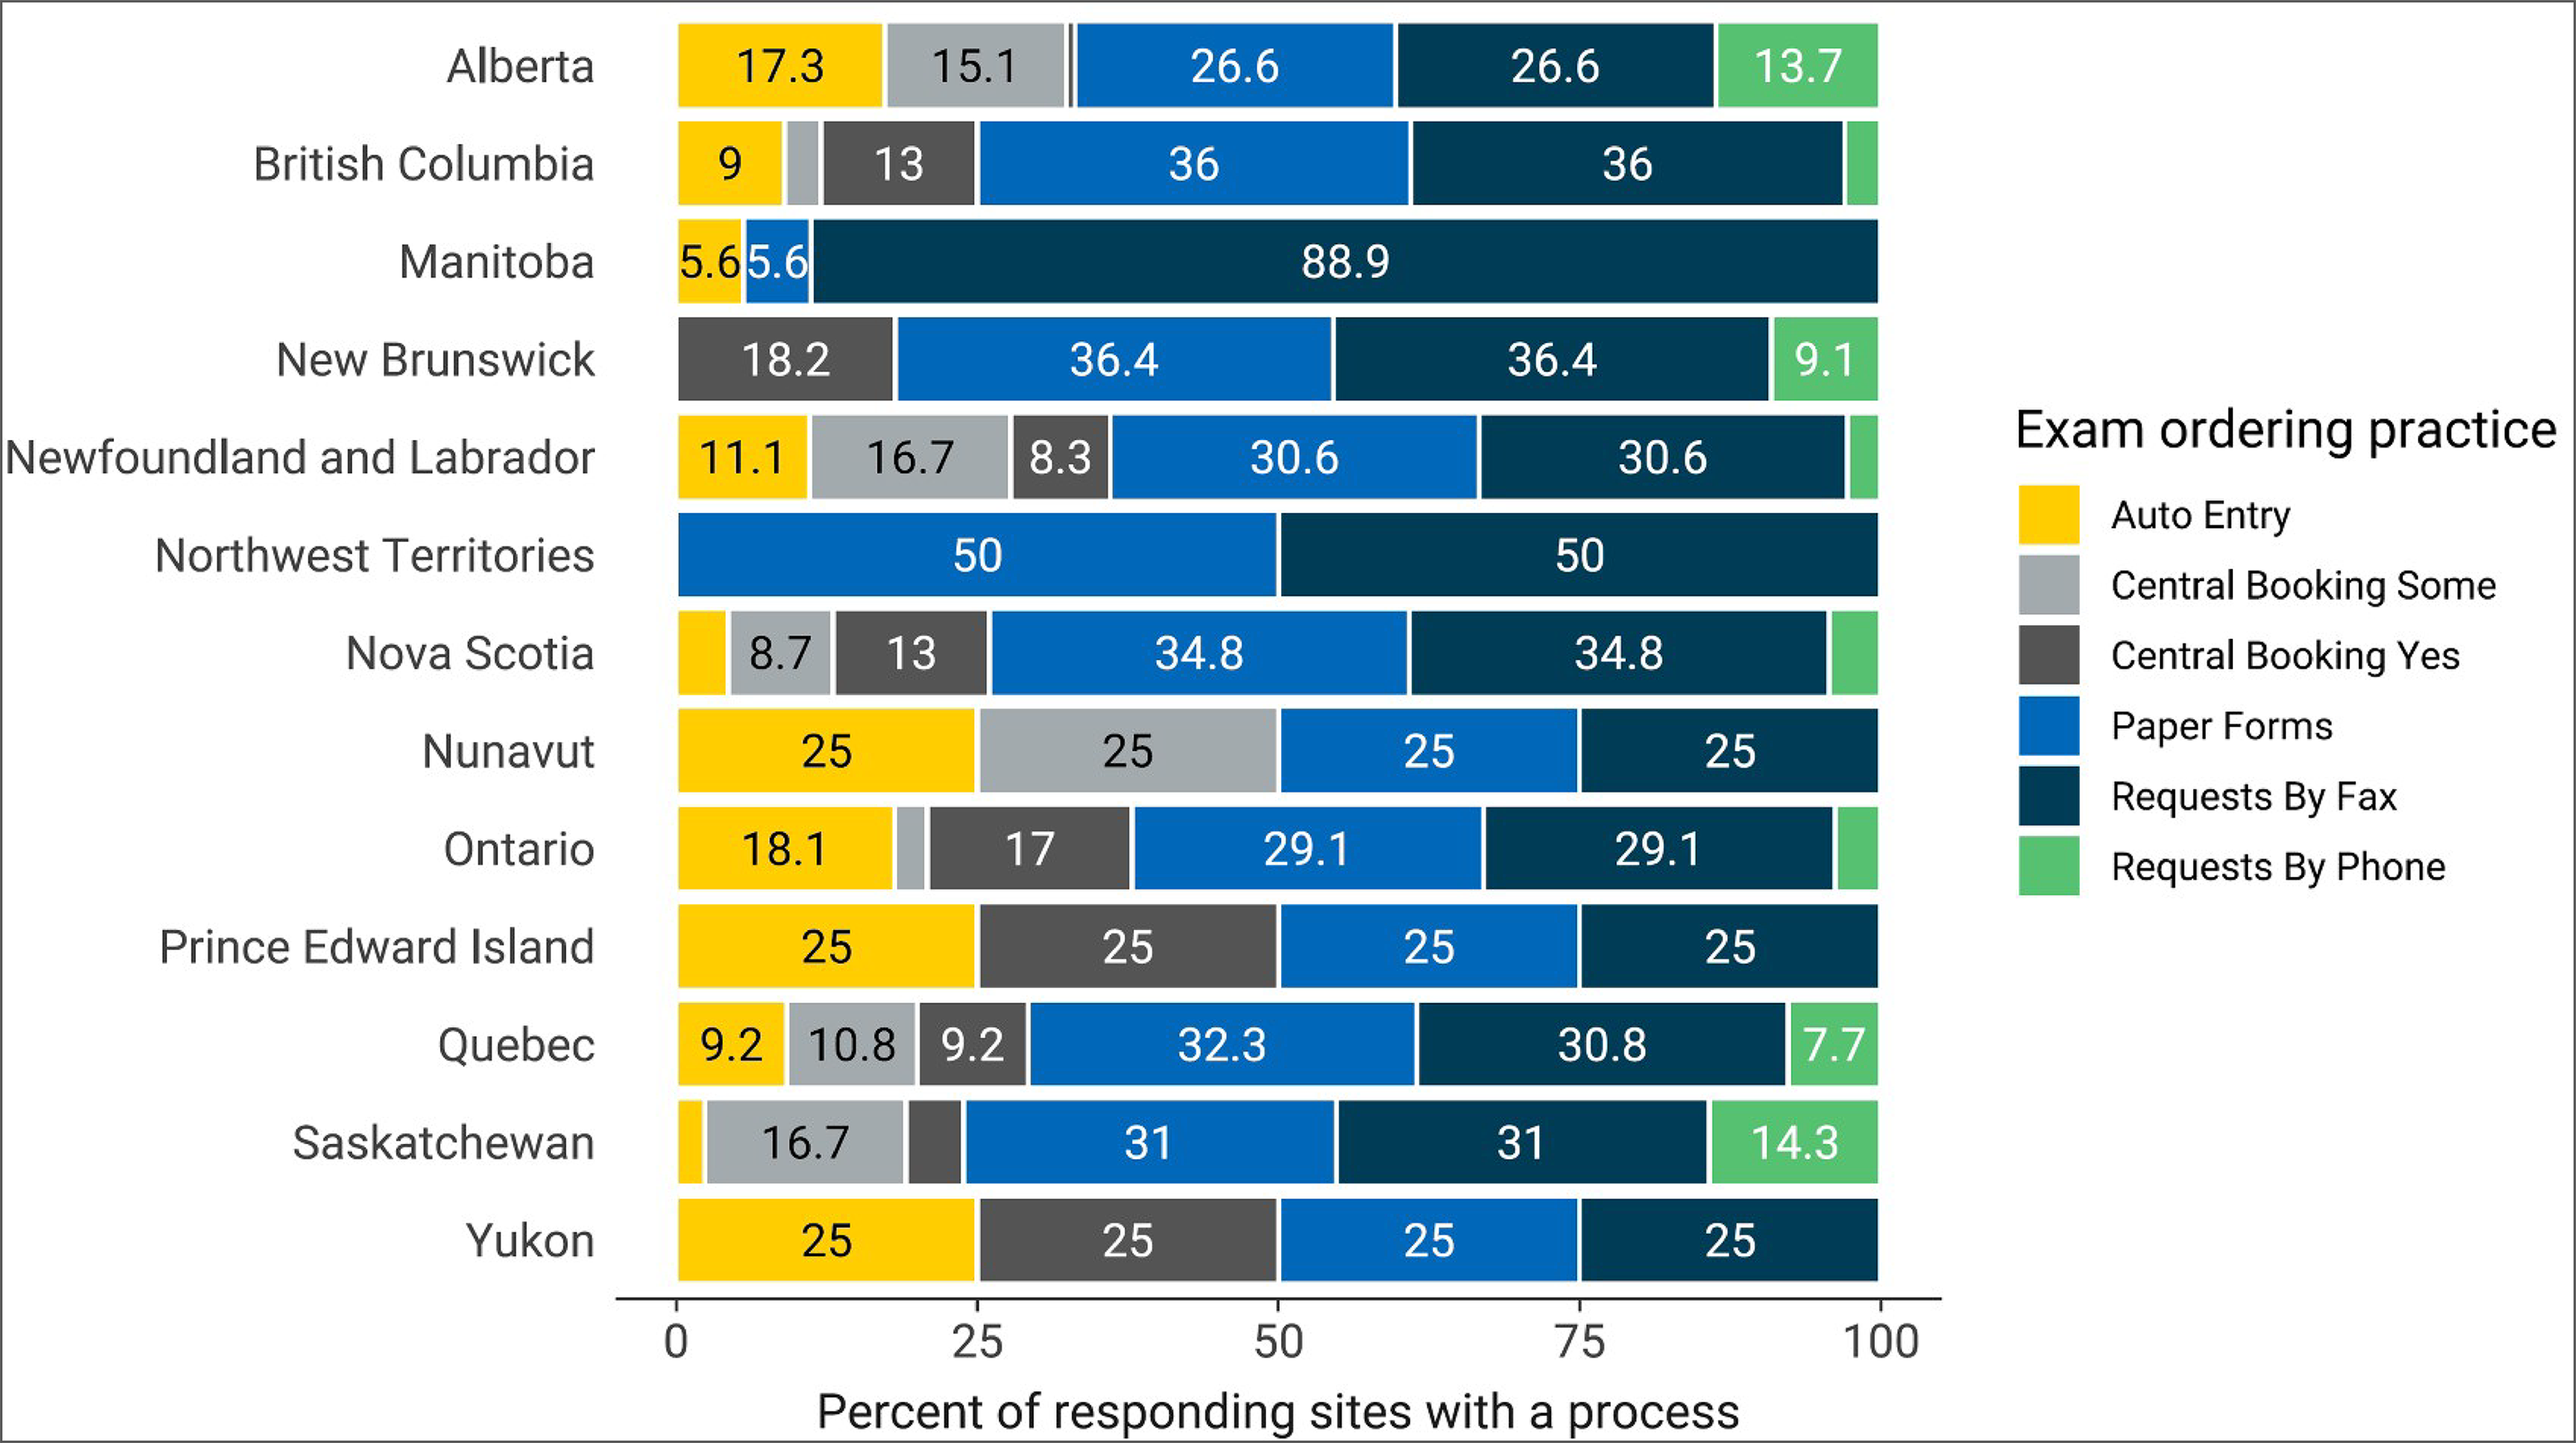
Notes: Survey response data were available for 211 out of 394 sites across all jurisdictions with CT capacity.
Data were derived from the following survey questions: “Are automated order entry forms (exams request) used?”; “Are paper forms (exams requests) used?”; “Are requests received by fax?”; “Are requests received by phone?”; and “Is a centralized order entry (booking) system used? For all exams: Yes/no; For some exams: yes/no.”
Appropriateness and Quality Assurance Tools for CT Imaging
As imaging exam volumes continue to increase in Canada, so does the rate of low-value exam referrals, which can impact exam wait times.17 To help minimize low-value imaging, appropriateness processes, clinical decision support tools (CDSTs), and peer-learning programs may be implemented.
Use of CDSTs in CT
A CDST is a tool that provides real-time guidance to physicians on the appropriateness of diagnostic imaging tests for a given patient during the ordering process.2
Overall, 24 sites (11.4%) reported that referring physicians used CDSTs for ordering CT exams (Table 5).
Use of Peer Learning in CT
Peer learning is a tool that is widely used in diagnostic imaging. Radiologists undertake peer review as part of the peer-learning workflow, often anonymously, in clinical practice to provide ongoing feedback to improve performance, reduce discrepancy and error, maintain standards, provide credibility, support learning, and identify gaps in education.18
In total, 132 sites (56.7%) reported peer review of images for quality assurance (Table 5).
Table 5: Use of CDSTs and Peer Learning at Sites With CT, 2022–2023
Province or territory | CDST | Peer review | ||
|---|---|---|---|---|
Number of sites reporting “yes” (% of sites) | Number of reporting sites | Number of sites reporting “yes” (% of sites) | Number of reporting sites | |
Alberta | 0 (0) | 37 | 12 (32.4) | 37 |
British Columbia | 11 (30.6) | 36 | 34 (87.2) | 39 |
Manitoba | 0 (0) | 16 | 5 (31.3) | 16 |
New Brunswick | 1 (12.5) | 8 | 3 (33.3) | 9 |
Newfoundland and Labrador | 1 (9.1) | 11 | 3 (25) | 12 |
Northwest Territories | 0 (0) | 1 | 0 | 1 |
Nova Scotia | 0 (0) | 7 | 8 (80) | 10 |
Nunavut | 0 (0) | 1 | 0 | 1 |
Ontario | 8 (15.1) | 53 | 50 (76.9) | 65 |
Prince Edward Island | 0 (0) | 2 | 0 | 2 |
Quebec | 2 (8) | 25 | 11 (39.3) | 28 |
Saskatchewan | 1 (7.7) | 13 | 5 (41.7) | 12 |
Yukon | 0 (0) | 1 | 1 (100) | 1 |
Canada | 24 (11.4) | 211 | 132 (56.7) | 233 |
CDST = clinical decision support tool.
Notes: Survey response data about CDST were available for 211 out of 394 sites across all jurisdictions with CT capacity. Survey response data about peer review were available for 233 out of 394 sites across all jurisdictions with CT capacity.
CDST data were derived from the following survey question: “Is a clinical decision support tool used at the point of care by medical professionals referring patients to medical imaging? A clinical decision support tool provides real-time guidance to physicians on the appropriateness of diagnostic imaging tests for a given patient during the ordering process.” Options were: “Yes,” “No,” and “Don’t know.”
Peer review data were derived from the following survey question: “Do radiologists at your facility participate in a peer review program for image reading and interpretation for the purpose of quality assurance?” Options were: “Yes,” “No,” and “Don’t know.”
Picture Archiving and Communication Systems
A Picture Archiving and Communication System (PACS) is an electronic system used to digitally manage images, including transmission, filing, storage, distribution, and retrieval of medical images. A detailed definition is provided in Appendix 2.
Sites with CT capacity were asked whether medical images are stored on a PACS and accessible throughout the jurisdiction in which the site operates. Data were available for 277 sites with a PACS, noting that:
83.6% of responding sites with CT capacity reported PACS access throughout the provincial health care system without the need of manual retrieval (224 of 268 sites)
16.7% of sites reported local access to a PACS (39 of 234 sites)
35.5% of sites had regional access to a PACS (83 of 234 sites)
47.9% of sites had intraprovincial access to a PACS (112 of 234 sites)
98.5% of sites reported that PACS images were accessible to referring physicians located in areas of the hospital outside of diagnostic imaging (268 of 272 sites).
Technical Characteristics of CT Equipment
Technical Specifications of CT Units
Overall, 64-slice scanning was the most common, reported for 158 units (38.1%), followed by 128-slice scanning in 129 units (31.1%), and 256-slice scanning in 32 units (7.7%), out of a total 415 units at 295 sites with reported data (Appendix 3, Table 22).The number of common multidetector slices available for CT units is presented in Figure 15.
Dual-target imaging allows for the simultaneous acquisition of images at 2 different energies, as a means of enhancing images and reducing radiation exposure. Dual-target imaging was available for 243 units at 177 sites.
In total, 29.2% of units located across 8 provinces were equipped with dual-target imaging, representing an increase of 15.8% in 2019–2020.
Figure 15: Reported Proportion of Slices in CT Units by Province and Territory, 2022–2023
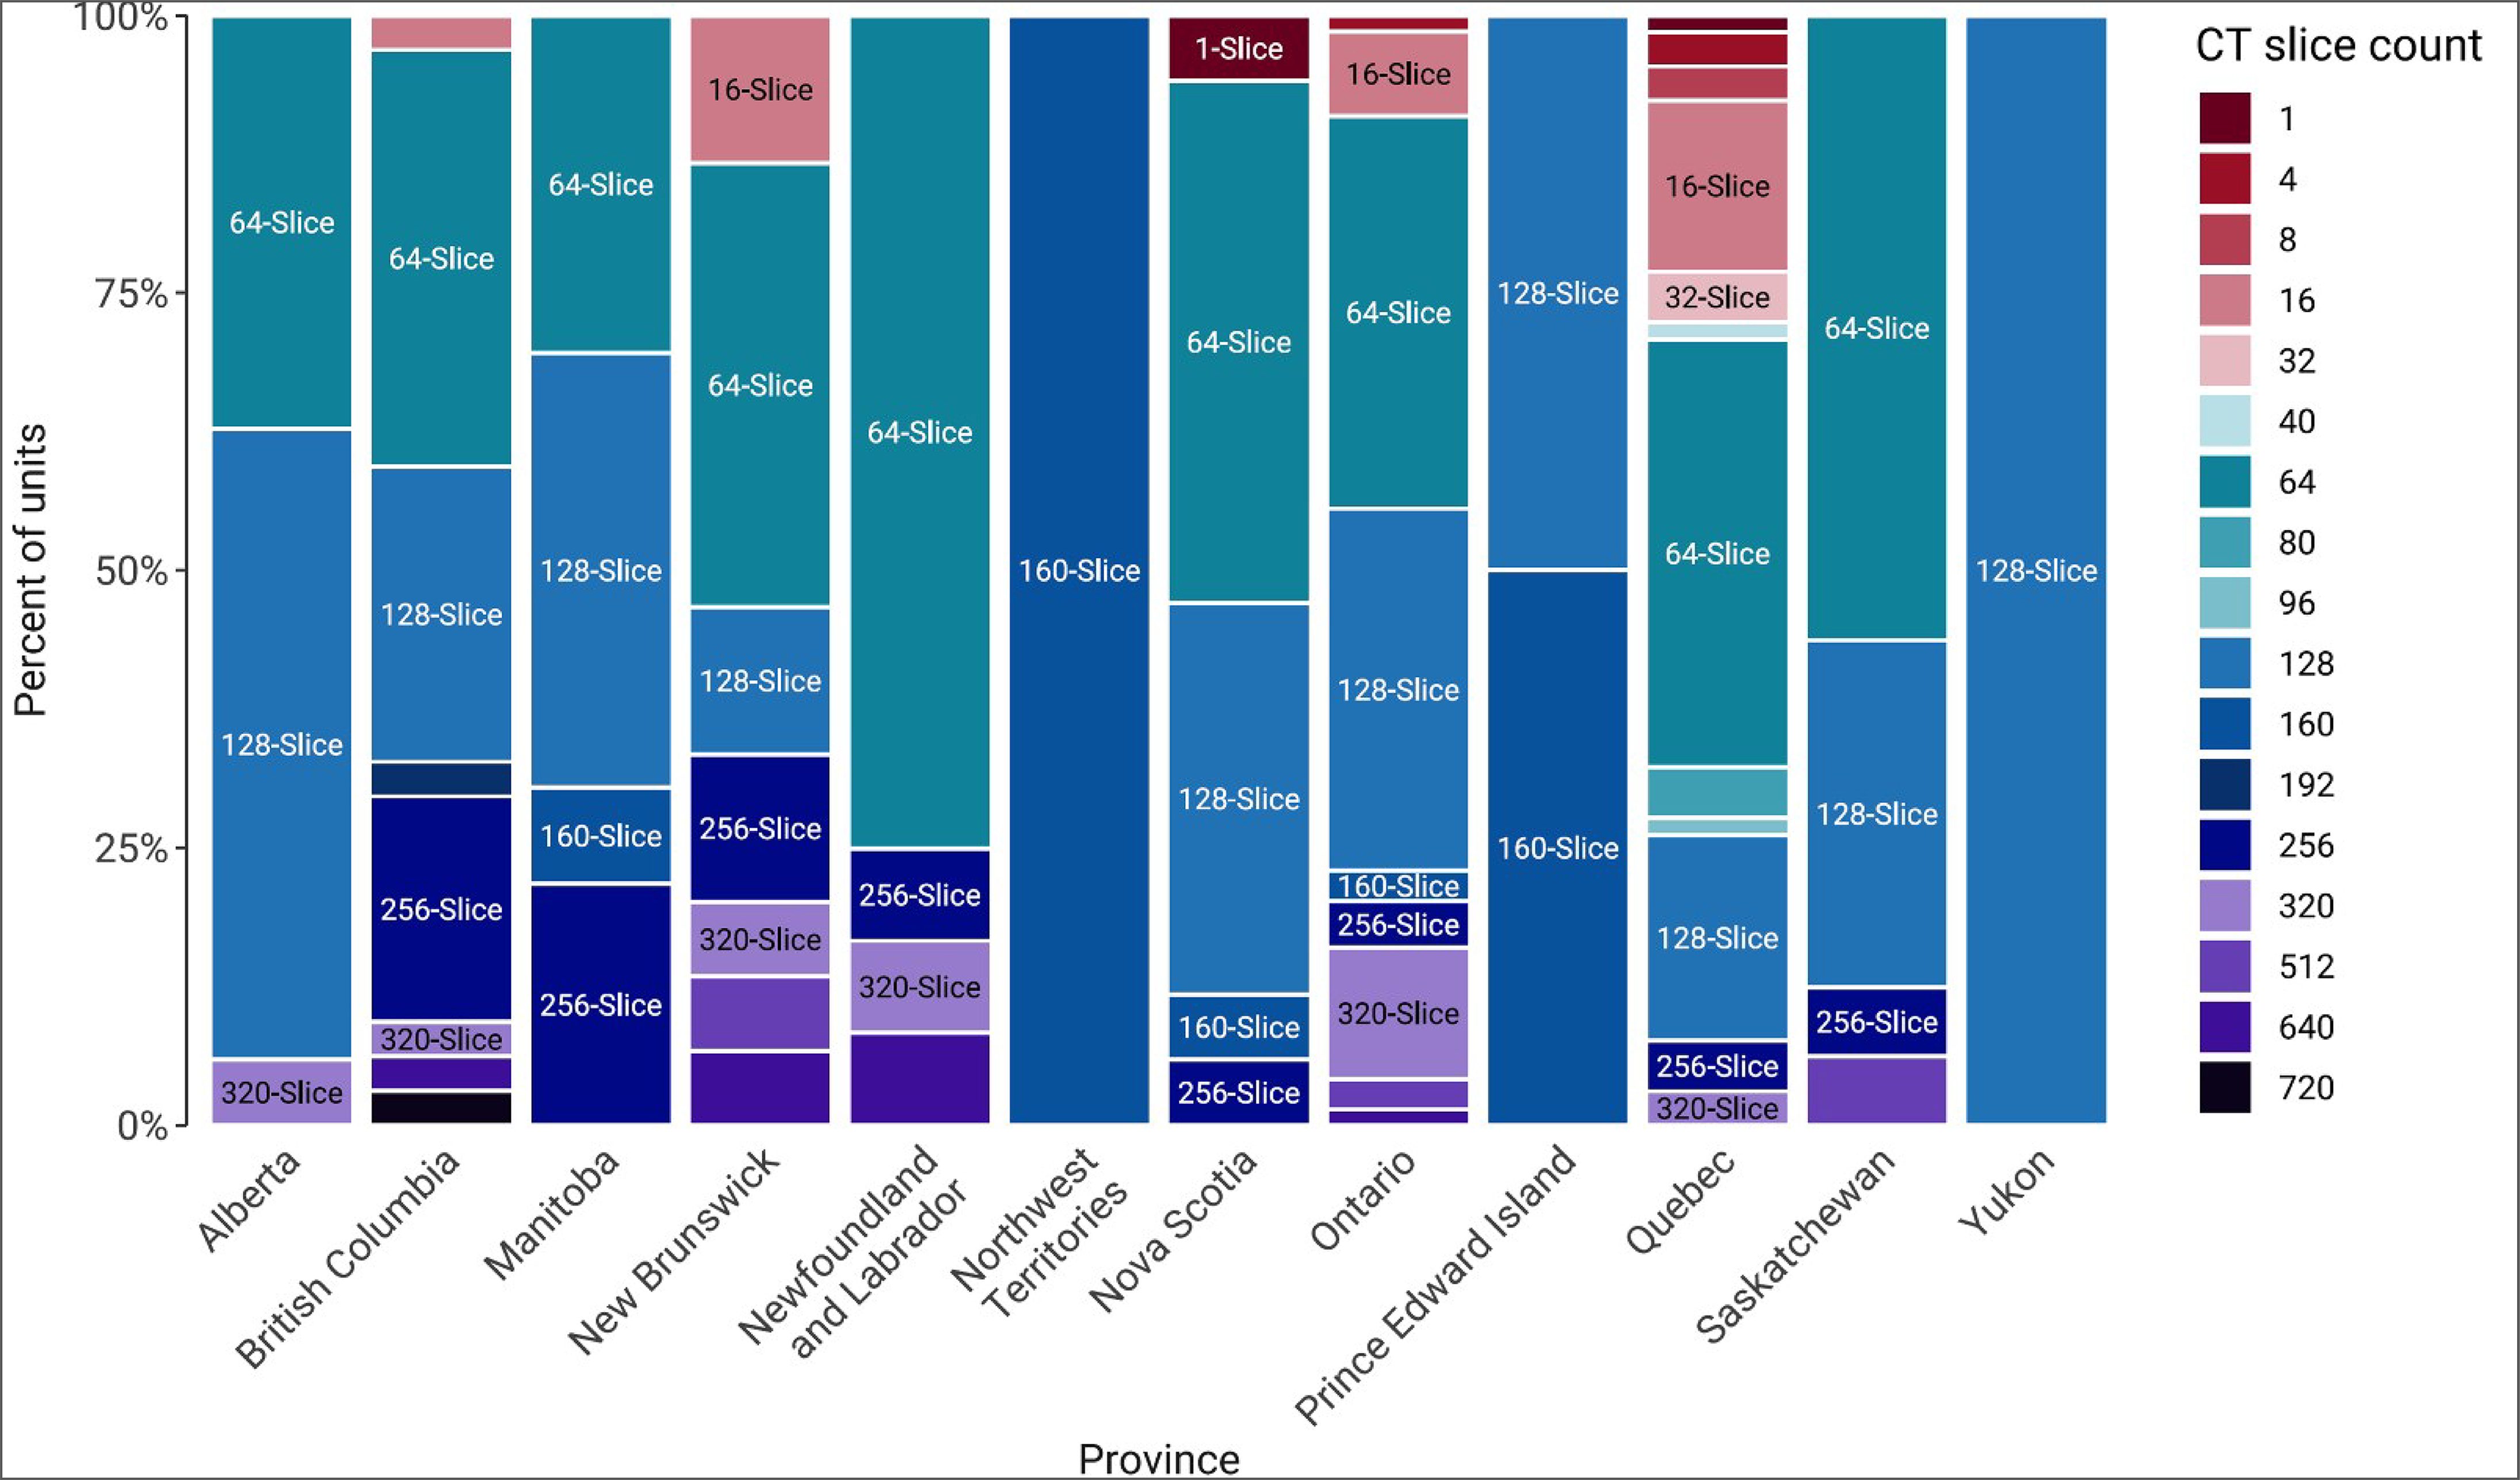
Notes: Survey response data were available for 411 out of 560 units with a reported slice count in 12 of the 13 jurisdictions with CT capacity. No data were available from Nunavut.
Data were derived from the following survey question: “How many multi-detectors does the CT unit have (how many slices)?”
Radiation Safety for CT Units
There is ongoing concern about potential health hazards associated with imaging exams that use radiation.29 CT contributes significantly to the radiation dose in individual patients, strategies to monitor cumulative radiation dose are recommended by international radiology organizations and researchers.19-21
The survey asked about features intended to manage radiation safety (Appendix 3, Table 23). Of the sites that responded to the survey questions relating to radiation safety:
93.3% of CT units recorded patient radiation dose per exam (224 of 240 units with information)
92.4% of CT units had dose-management controls (220 of 238 units with information)
15.1% of units captured patient cumulative radiation (36 of 238 units with information), and 38.1% of units without current tracking controls planned to capture patient cumulative radiation tracking in the future (72 of 189 units with information).
Trends in Technical Specifications of CT
Trends Over Time in Number of Slices in CT Units
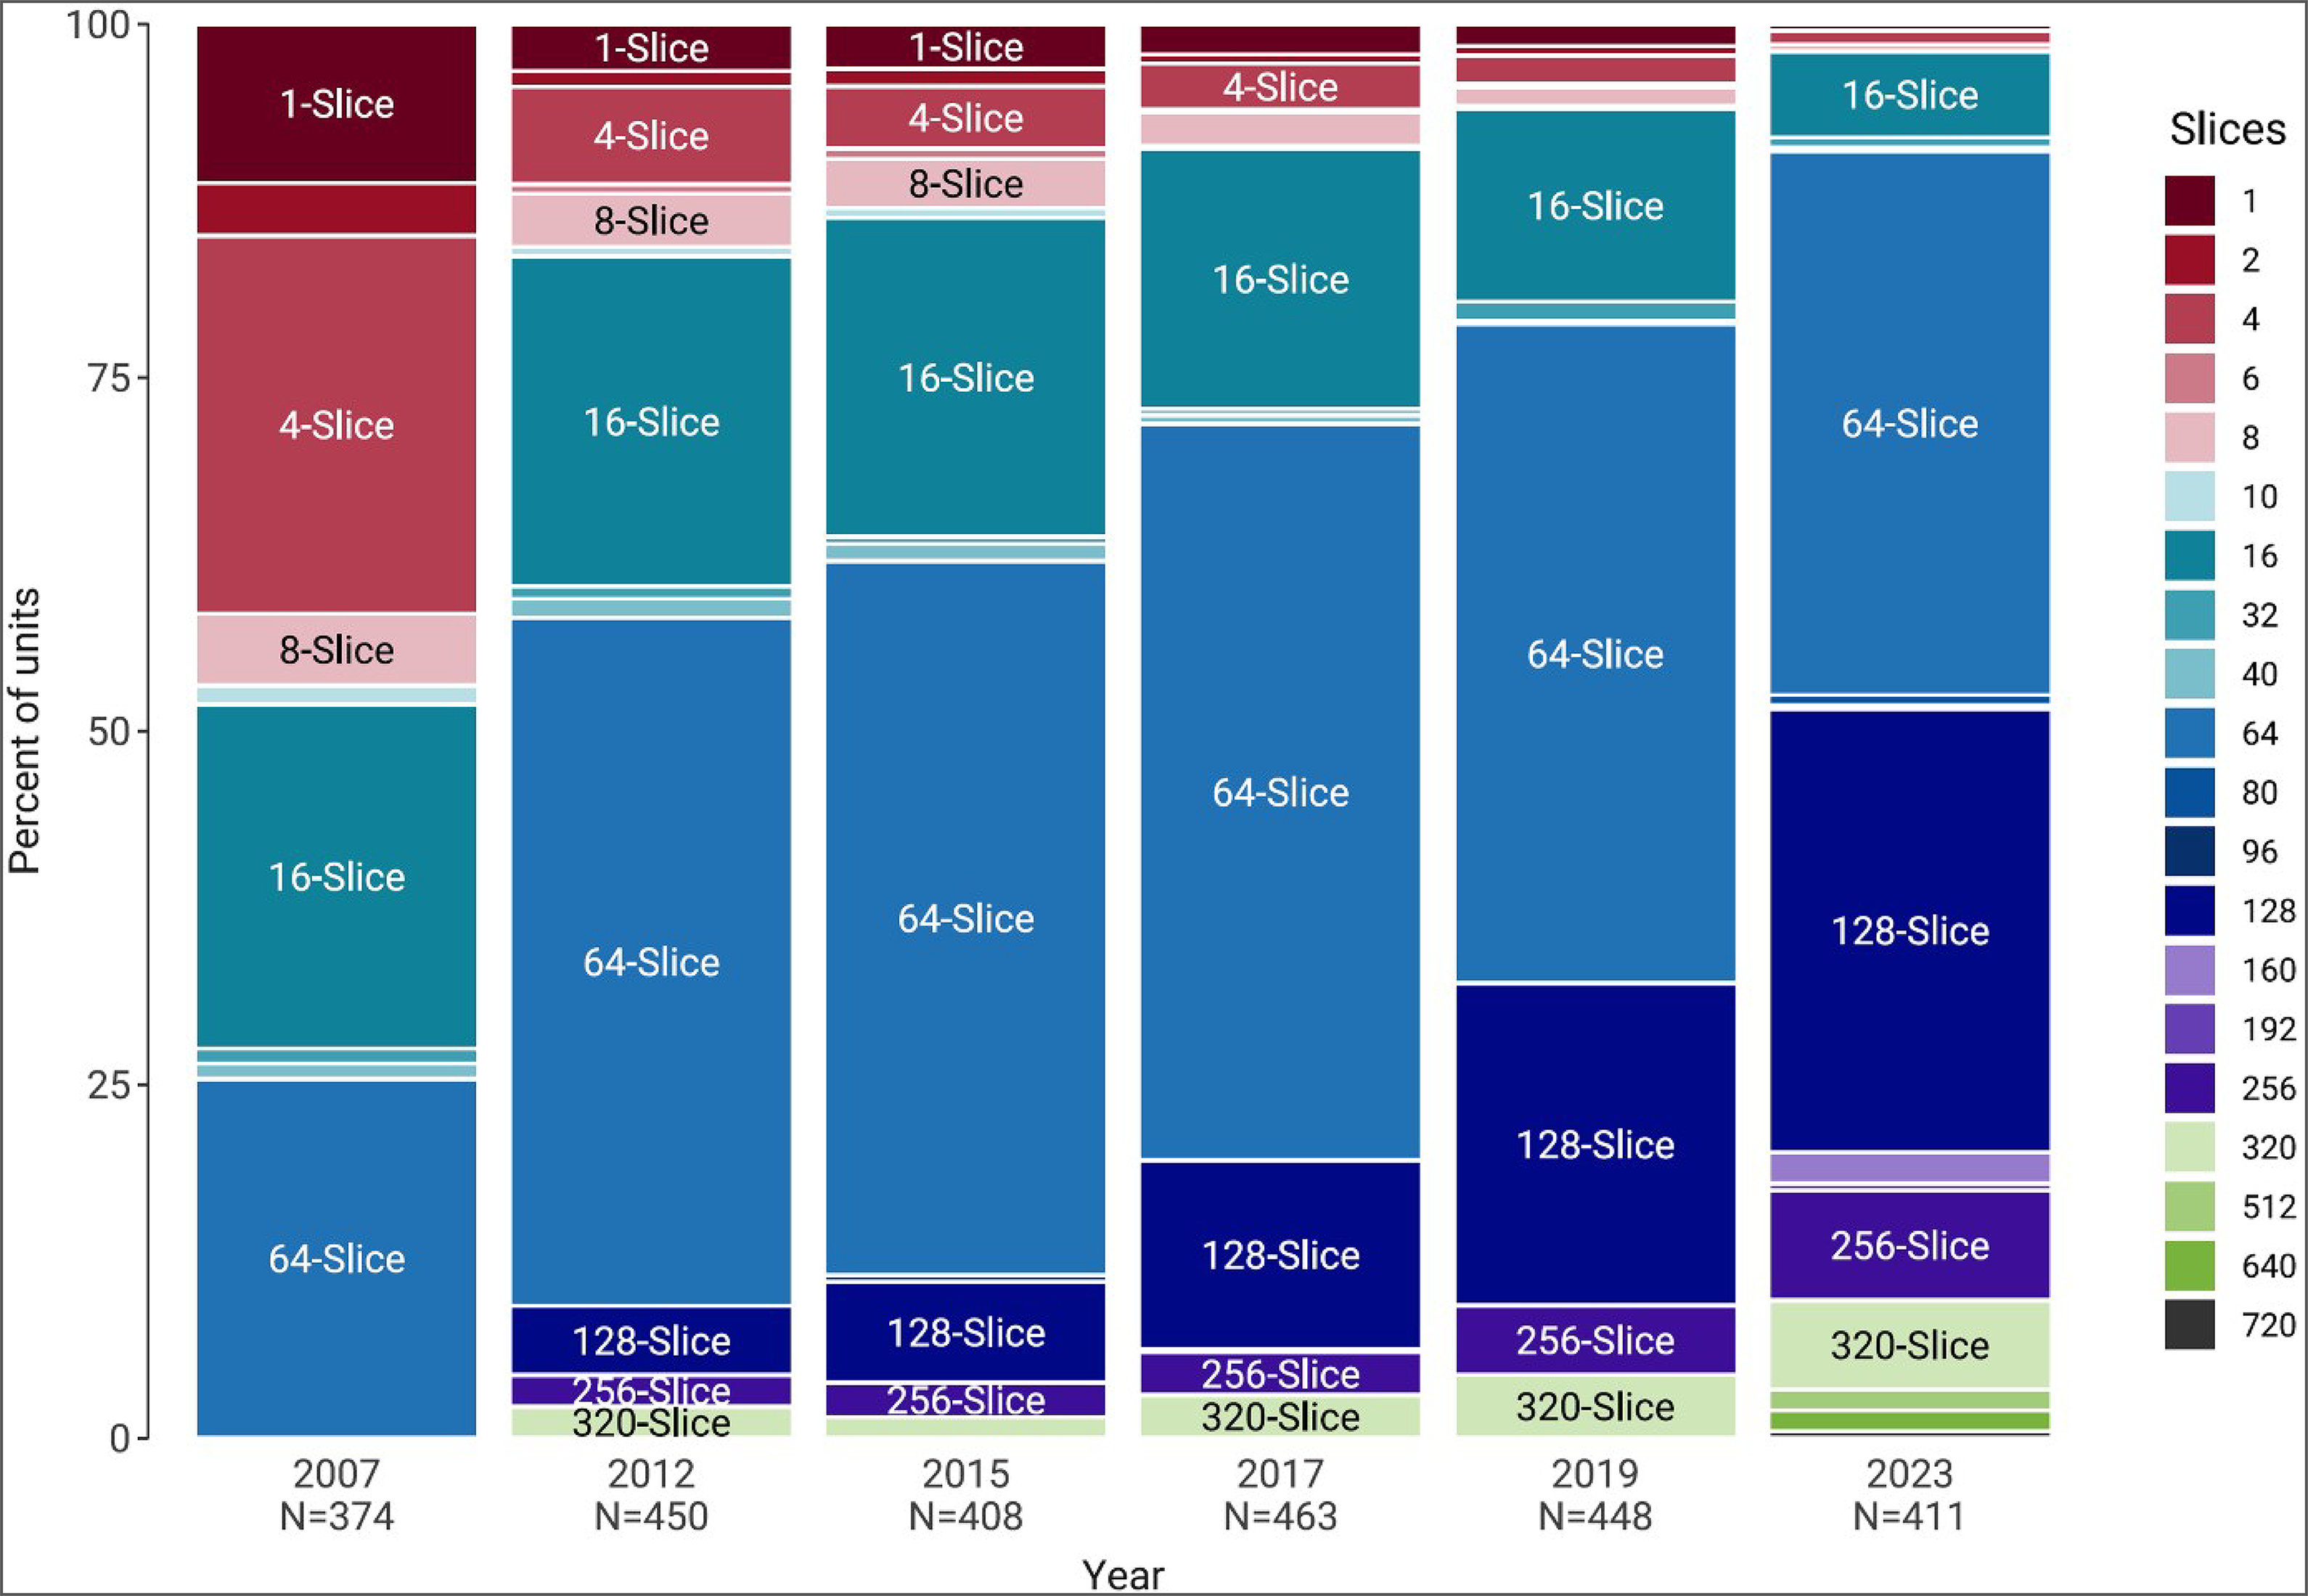
In 2007, 4-slice, 64-slice, and 16-slice were the most common scanning options used by CT units, at 26.7%, 25.4%, and 24.3%, respectively.
Since 2007, 4-slice and 16-slice scanning have decreased by 96% and 72.5%, respectively (Figure 16 and Appendix 3, Table 22).
Since 2007, the percentage of CT units with 64-slice scanning has increased by 66.3%, from 25.4% of units in 2007 to 38.1% of units in 2022–2023.
Since 2007, 128-slice scanning has emerged as the second most common option, used by 31.1% of CT machines.
Figure 16: Trends in Number of Slices in CT Units
CIHI = Canadian Institute for Health Information; CMII = Canadian Medical Imaging Inventory.
Notes: The number of units with data available for each year is indicated with the year.
In 2022–2023, 4 units were reported to use a slice count not commonly used.
The 2023 data were derived from the following survey question: “How many multi-detectors does the CT unit have (how many slices)?”
Source: CIHI (2012) report,22 the CIHI QuickStats dataset,23 CMII (2015) report,13 CMII (2017) report,14 CMII (2019 to 2020) report,2 and this current cycle of the CMII. The 2015 data were subject to additional data-cleaning before being uploaded for the 2017 survey, and this cleaned dataset was used.
Availability and Use of Technologies for Control of Radiation Dose, 2015 to 2022–2023
Table 23 (Appendix 3) shows availability and use of technologies for control of radiation dose in CT units from CMII surveys conducted between 2015 and 2022–2023, for units with available information.
Since 2015, the number of CT units reported to have dose-management controls increased from 8.1% in 2015 to 39.3% in 2022–2023.
Since 2017, the number of CT units reported to record patient radiation dose by exam increased from 31.5% to 40% in 2022–2023.
International Comparisons
Canadian Data Compared With International Data
We compared Canadian CT unit counts and exam volume data with those of other Organisation for Economic Co-operation and Development (OECD) countries.24,25 The comparison was made with data from the latest available year for each country.
Canada is below the OECD average of 29.9 units per million population at 14.0, positioned 30th among 34 countries (Figure 17).
Canada ranks below the OECD average of 161.7 exams per 1,000 population at 160.2, positioned 12th among 28 countries (Figure 18).
CT Units
Figure 17: Comparison of Canadian and International Data for CT Units, Per Million Population, 2022–2023
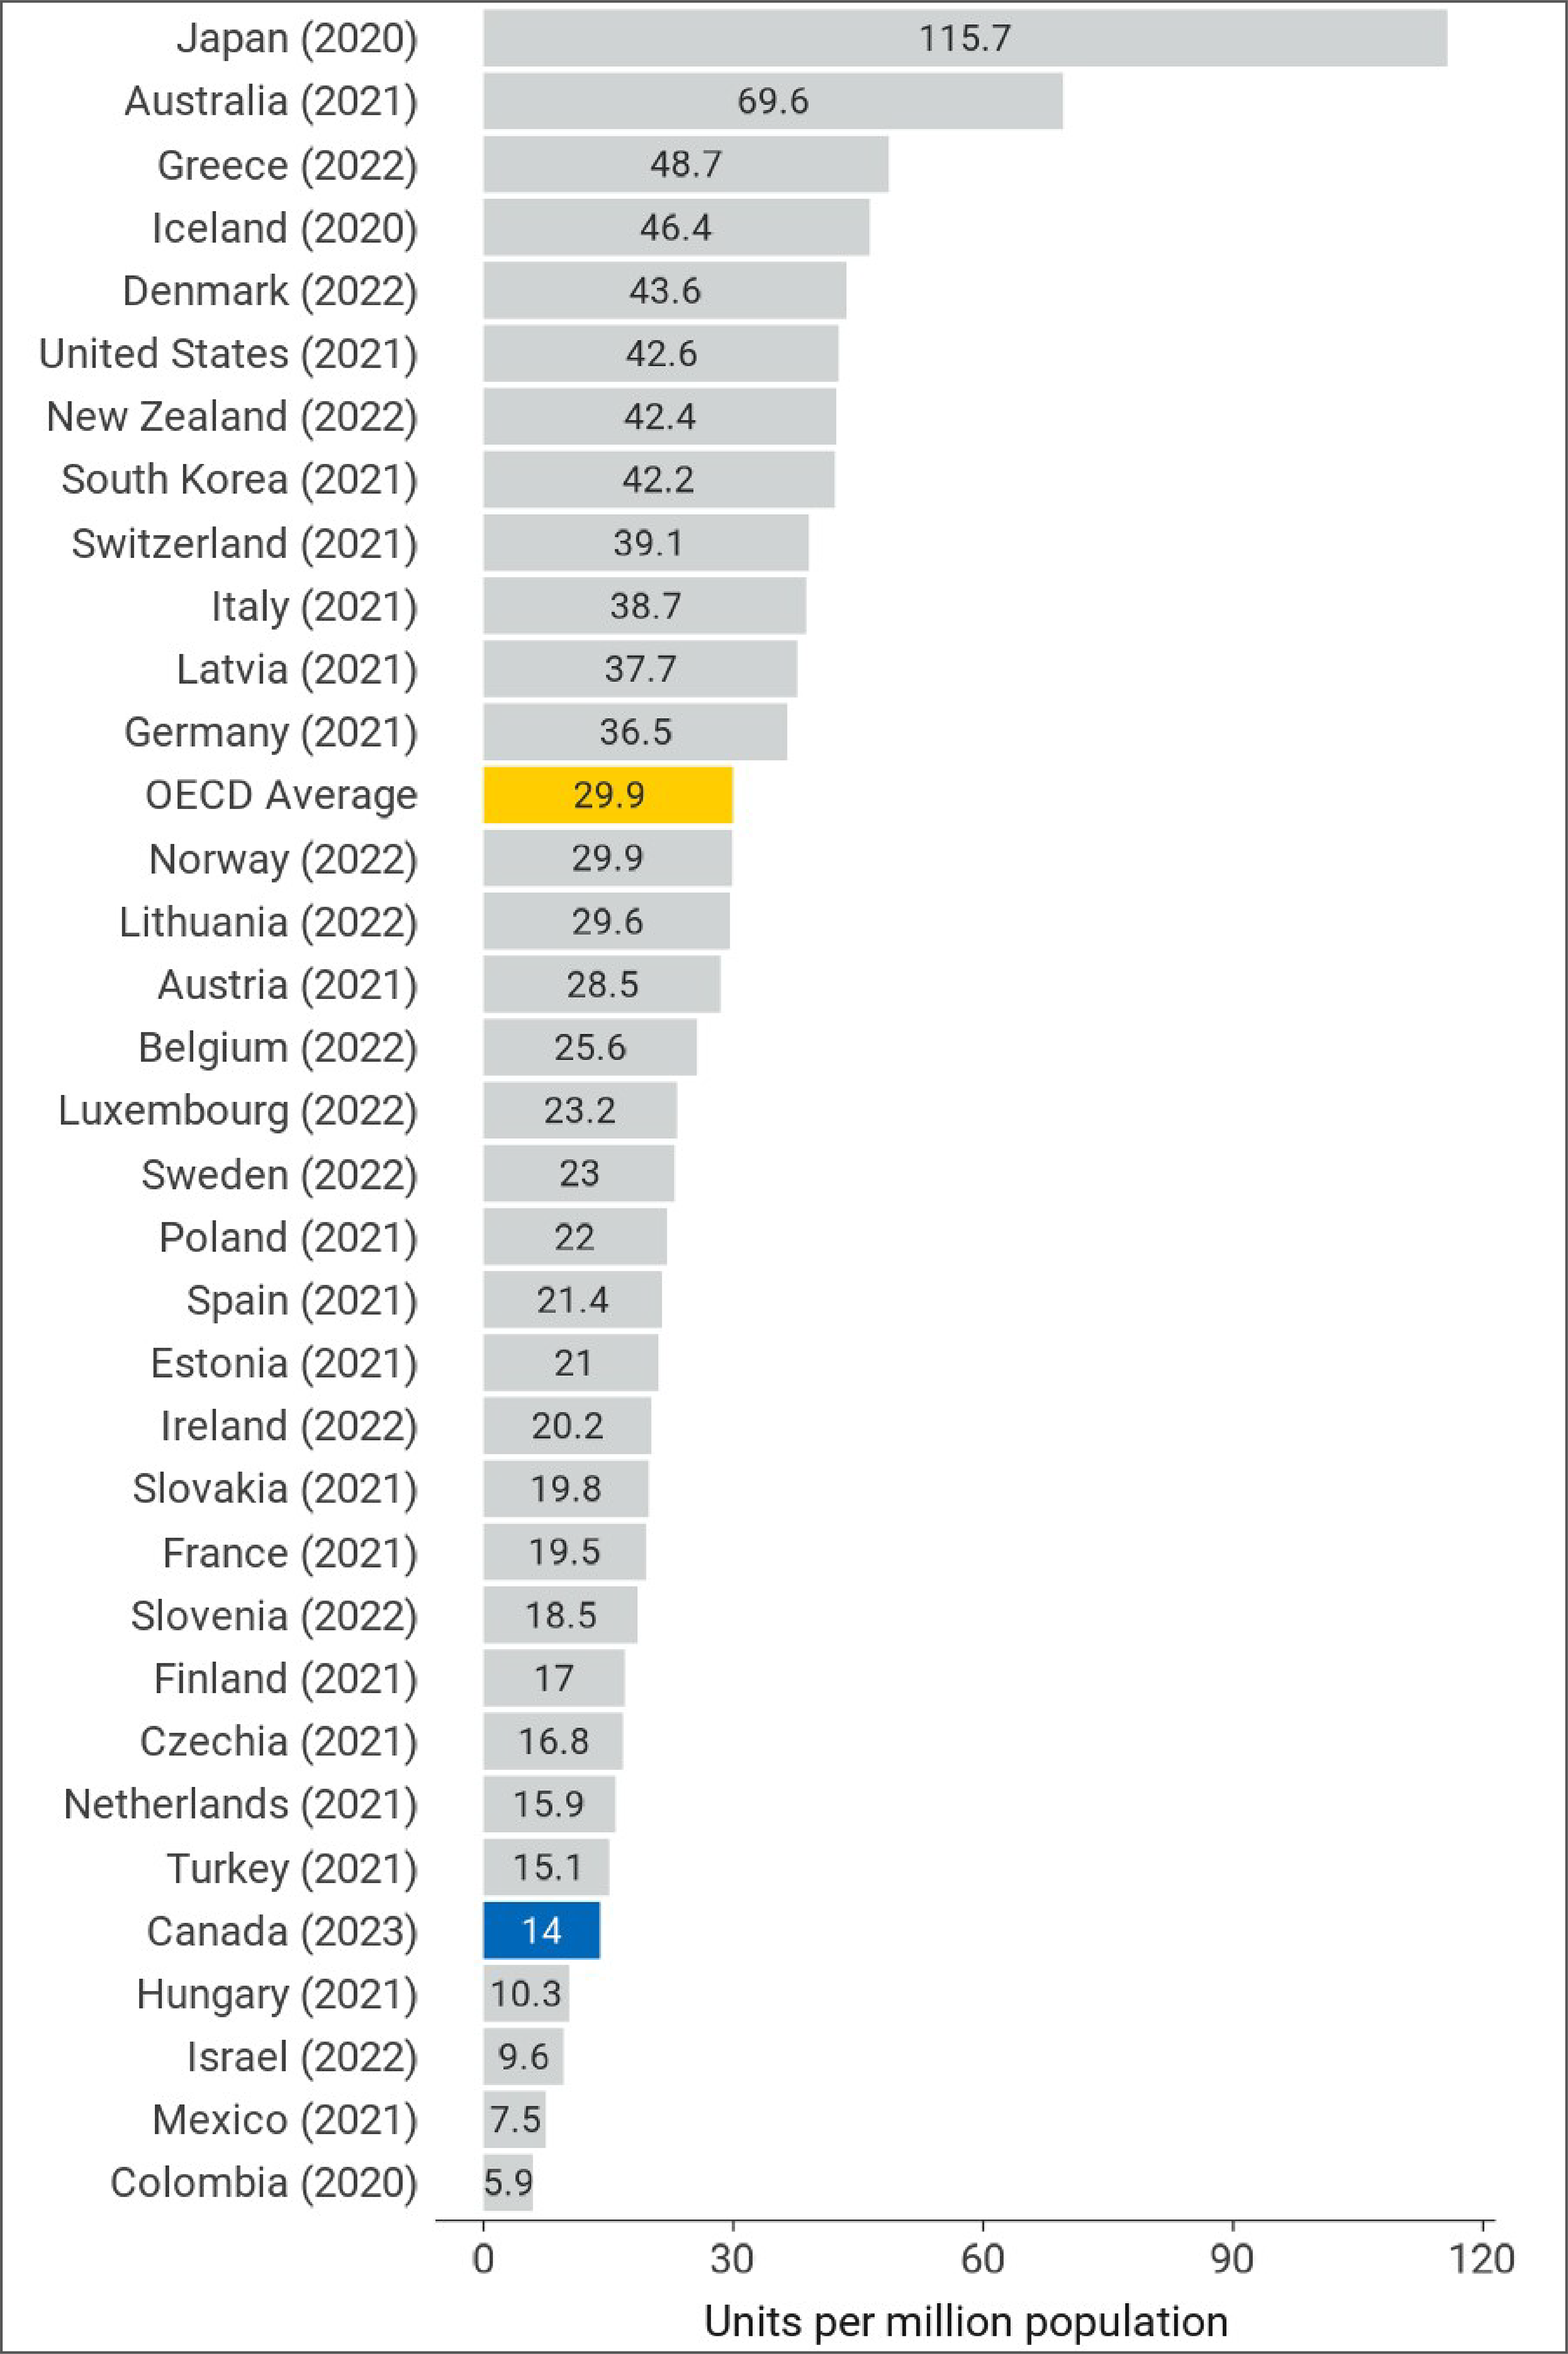
OECD = Organisation for Economic Co-operation and Development.
Note: The year is the last year with data available (refer to https://stats.oecd.org/ for details). OECD data retrieved on October 30, 2023.
CT Exams
Figure 18: Comparison of Canadian and OECD Data for CT Exams, Per 1,000 Population, 2022–2023
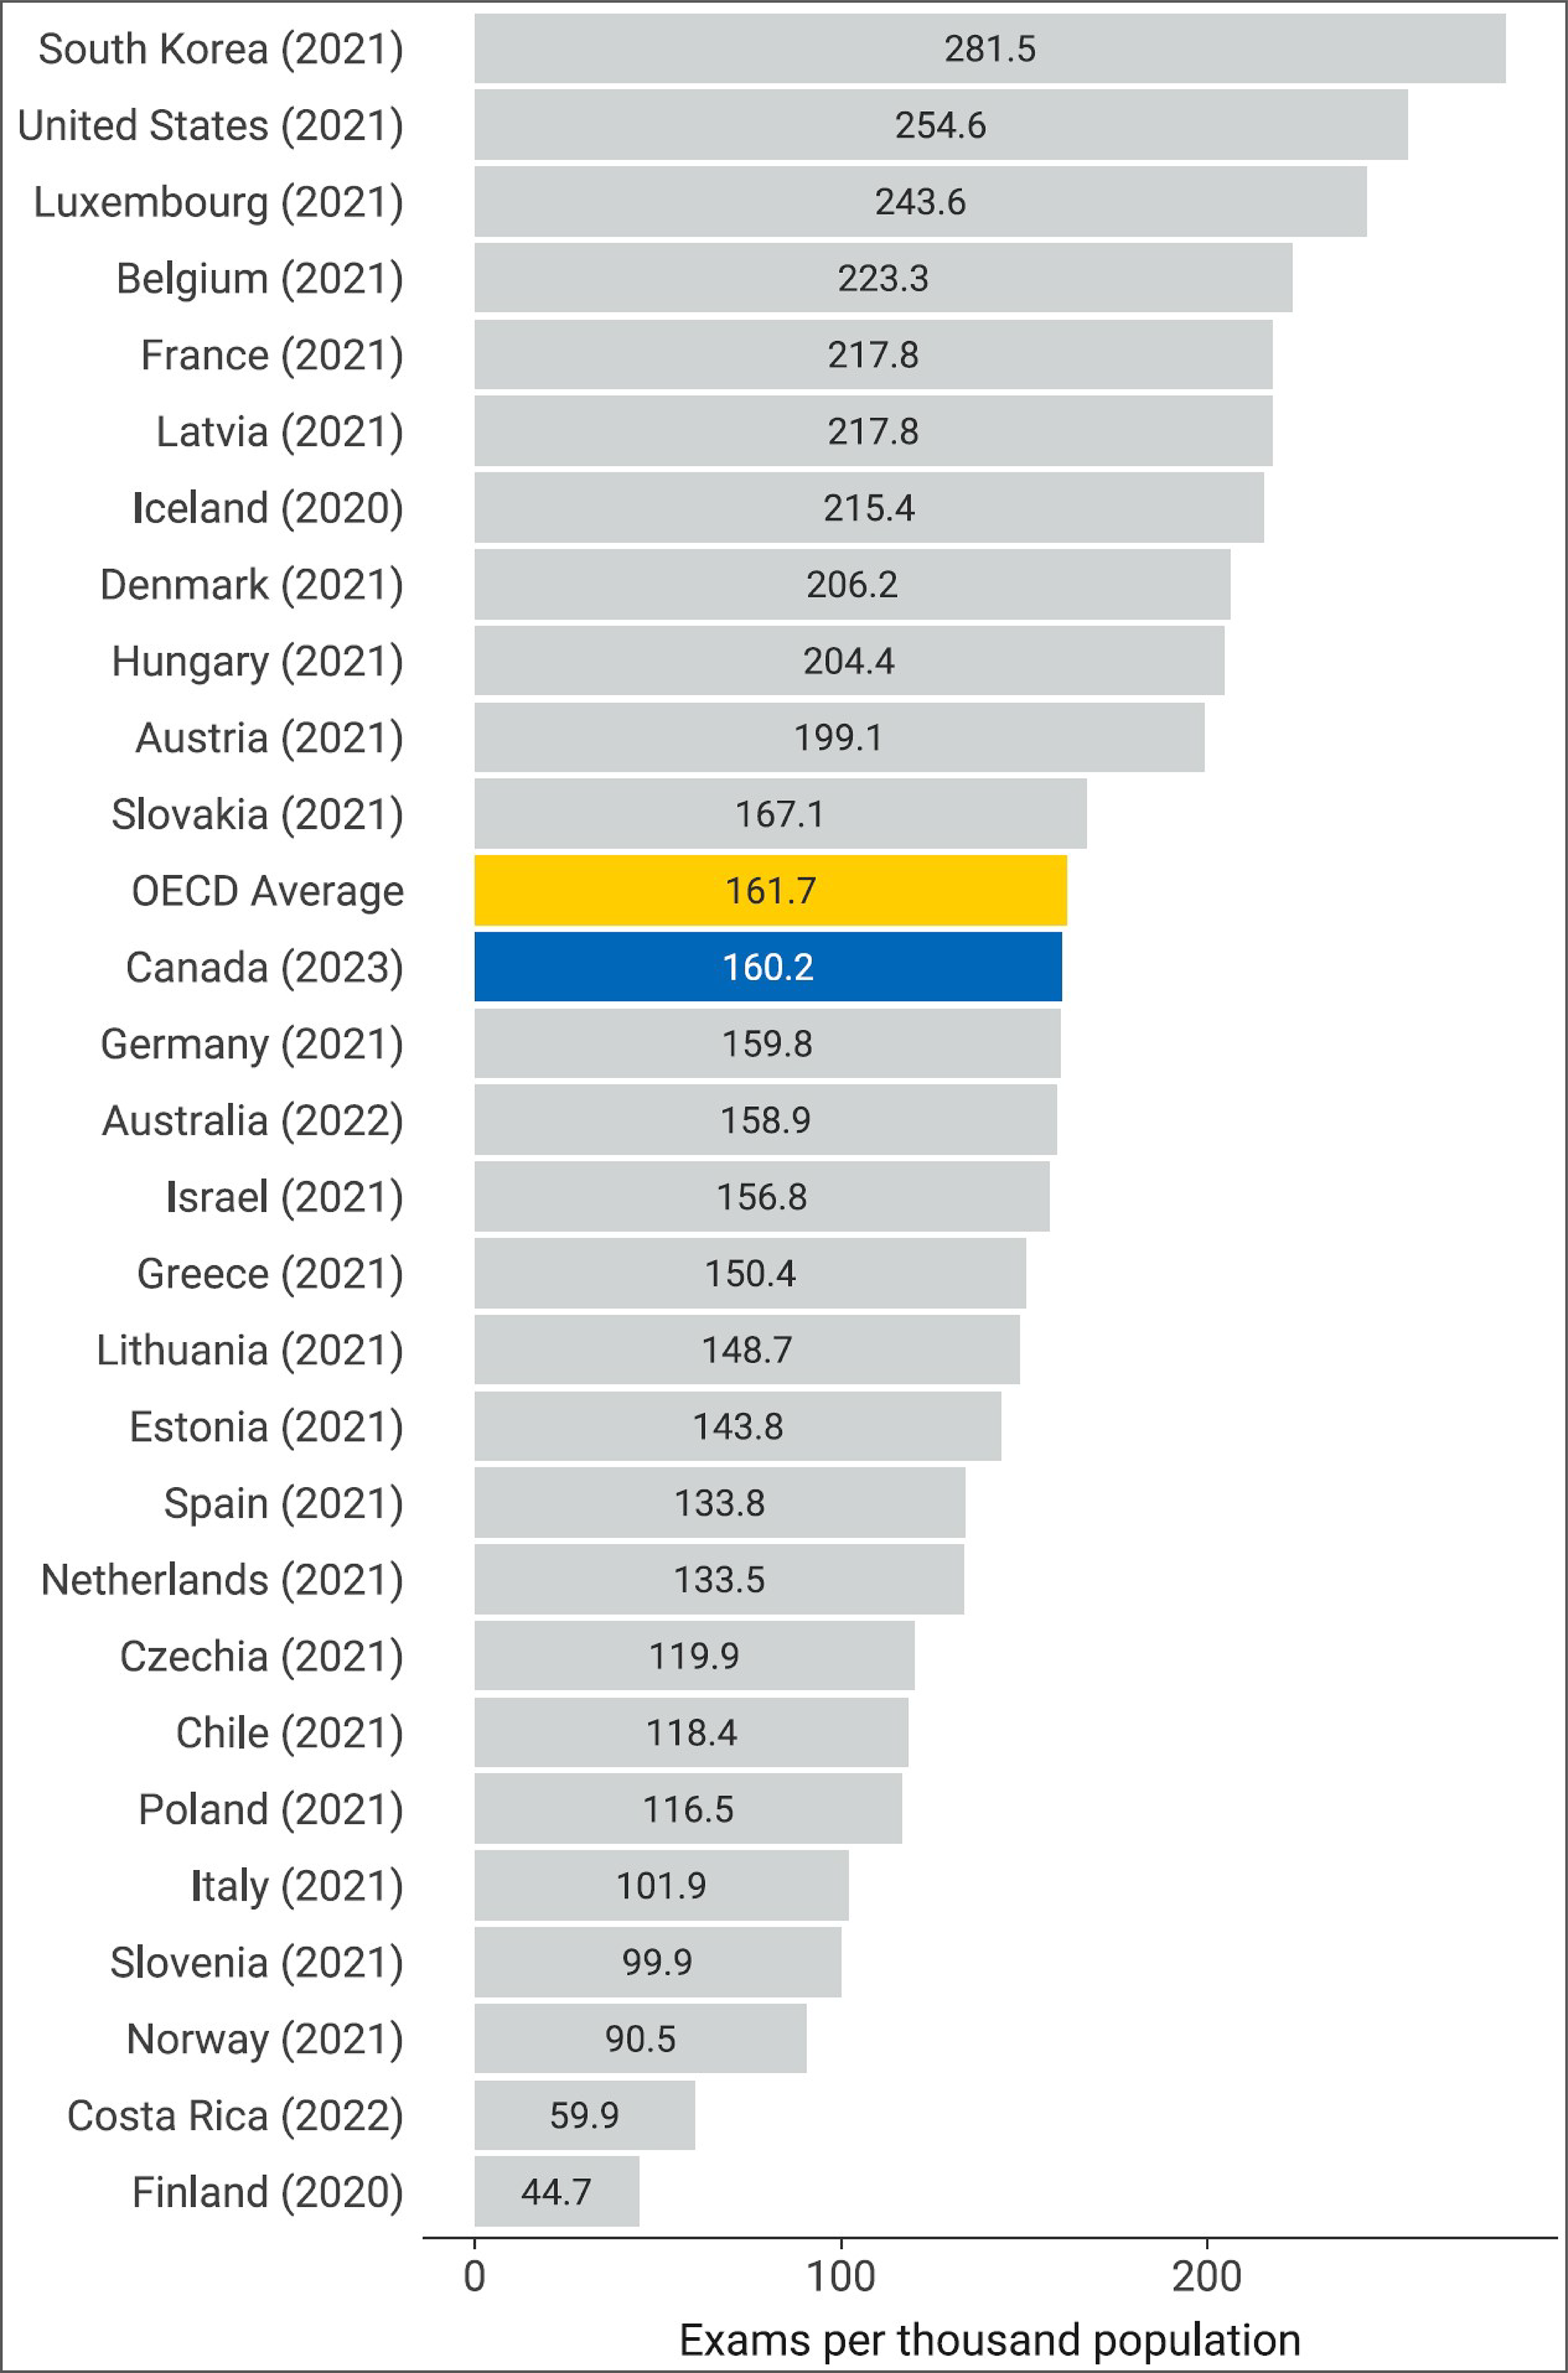
OECD = Organisation for Economic Co-operation and Development.
Note: The year is the last year with data available (refer to https://stats.oecd.org/ for details). OECD data retrieved on October 30, 2023.
Projections of the Number of CT Units and Exams
The CMII forecasts the number of CT units and the volume of exams needed to maintain current levels of service based on estimations of population growth in Canada for the following years: 2025, 2030, 2035, and 2040.
Our projections use a simple model based on 2022–2023 CT imaging units and exam findings, which were applied to estimated population projections from Statistics Canada. Three different population scenarios were envisioned for low, medium, and high projected growth and are presented in 5-year increments to 2040 growth (refer to Appendix 3, Table 24 for population projections). Projections use the current per capita number of units and exam volumes for 2022–2023 and are based on the assumption that population change is the only driver of growth over the forecasted period.
Projected Number of CT Units for 2025, 2030, 2035, and 2040
Projections for the number of units for each jurisdiction with existing CT capacity are shown in Figure 19 and Appendix 3, Table 25. Assuming medium population growth:
in Canada, the number of CT units is projected to increase by 18.6%, from 560 units in 2022–2023 to 664 units in 2040 (range, 605 to 716)
the number of CT units is projected to increase or remain the same for all jurisdictions with existing capacity, except for Newfoundland and Labrador
3 provinces are projected to have the largest increase in units by 2040: Ontario, from 192 to 233 units; Alberta, from 53 to 72 units; and British Columbia, from 75 to 90 units.
When low population growth is assumed, the number of CT units is projected to increase in Ontario, Alberta, British Columbia, Manitoba, and Saskatchewan. Prince Edward Island, Nova Scotia, New Brunswick, Quebec, Yukon, Northwest Territories, and Nunavut were projected to remain unchanged from 2022–2023.
Newfoundland and Labrador is the only province that has a projected population decline across all growth scenarios.
Figure 19: Projected Number of CT Units for 2025, 2030, 2035, and 2040
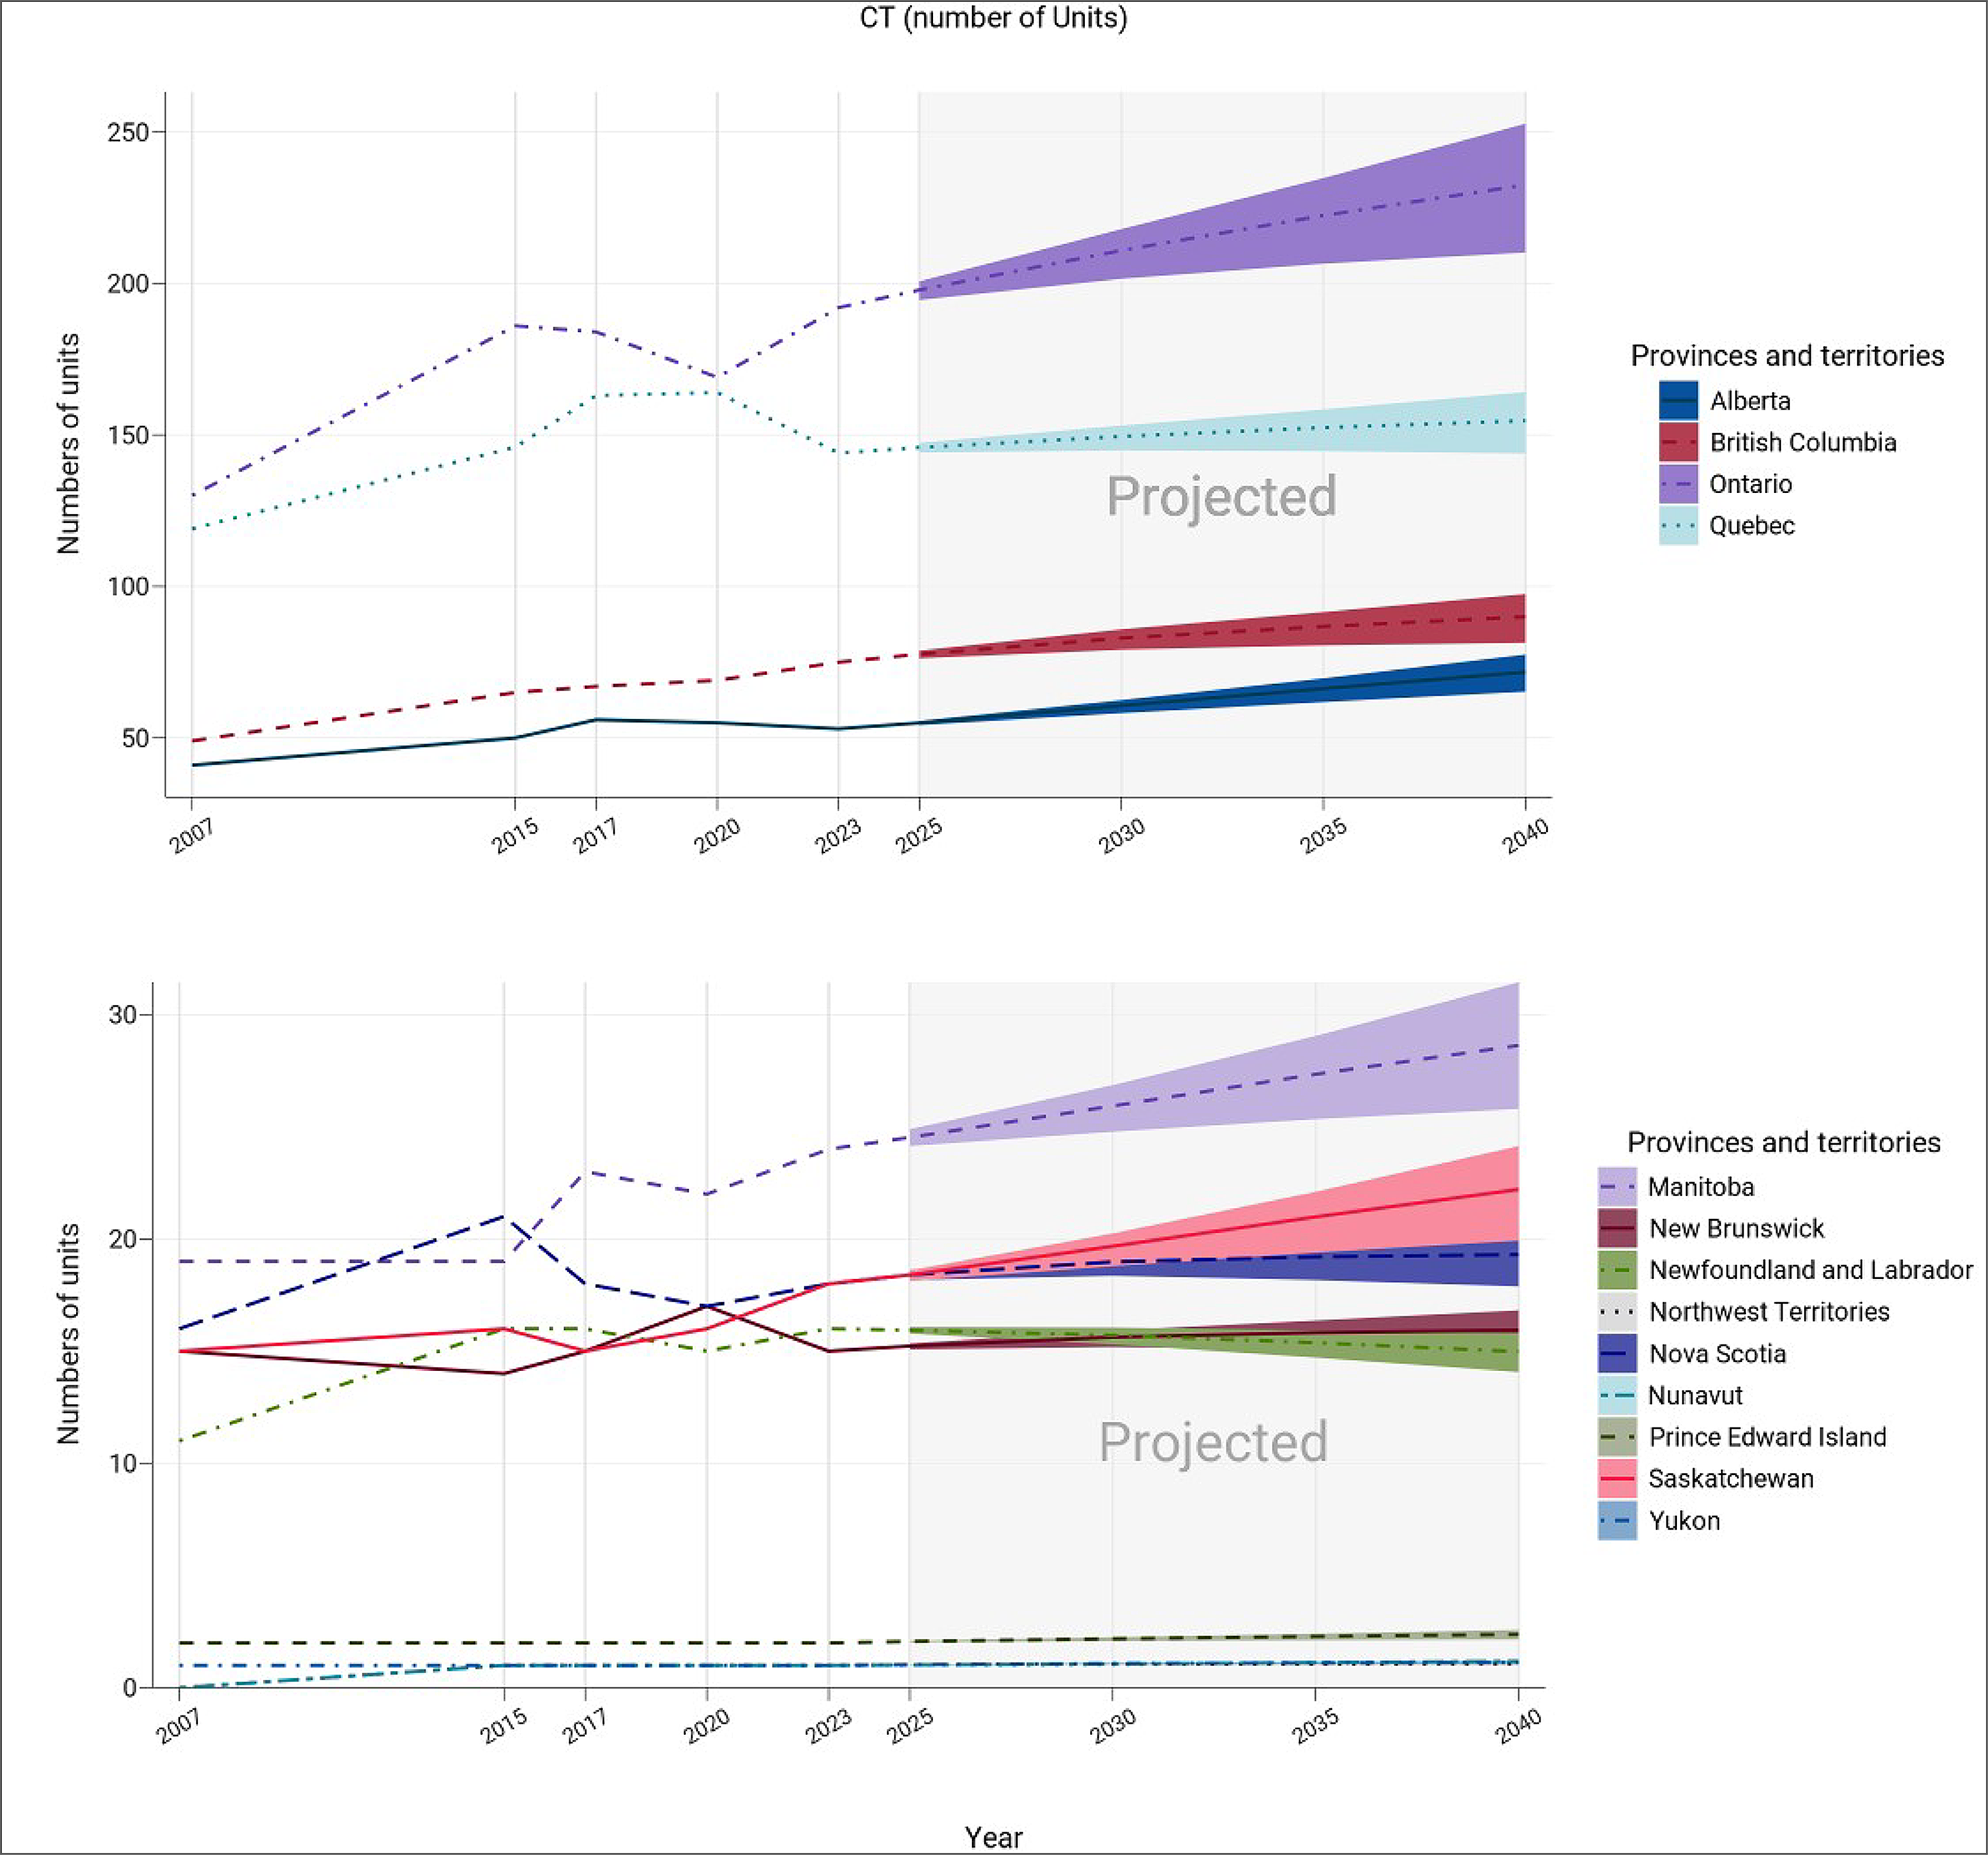
Notes: The projection was calculated from the products of the numbers of per capita units in 2022–2023 and the population projections in 2025, 2030, 2035, and 2040.
The numbers of imaging units or exams were provided by provincial or territorial validators in 2023.
The population projections were retrieved from the Statistics Canada website on January 18, 2024.26
The solid lines of projections were based on the population projection, assuming medium growth.
The upper and lower bounds were based on population projections, assuming high and low growth, respectively.
The data displayed in this figure are presented in greater detail in Appendix 3, Table 25.
Projected Number of CT Exams for 2025, 2030, 2035, and 2040
Projections for the number of exams for each province with existing CT capacity are shown in Figure 20 and Appendix 3, Table 26. Assuming medium population growth:
in Canada, the number of CT exams is projected to increase by 18.5%, from 6,385,665 to 7,567,724, by 2040 (range, 6,897,153 to 8,168,536)
the number of CT exams is projected to increase for all provinces with existing capacity, except for Newfoundland and Labrador
Alberta, Saskatchewan, and Ontario are projected to have the largest increase in exams by 2040, at 35%, 23%, and 21%, respectively, as they are projected to have the largest increase in medium population growth from 2022–2023 to 2040.
When low population growth is assumed:
the number of CT exams is projected to increase in Alberta, British Columbia, Manitoba, Ontario, Prince Edward Island, Saskatchewan, Yukon, and Nunavut; New Brunswick, Northwest Territories, Nova Scotia, and Quebec exam volumes are projected to decline slightly from 2022–2023
Newfoundland and Labrador is projected to decline from 105,441 to 92,735 exams, and is the only province that has a projected population decline across all growth scenarios.
Figure 20: Projected Number of CT Examinations (Times 1,000) for 2025, 2030, 2035, and 2040
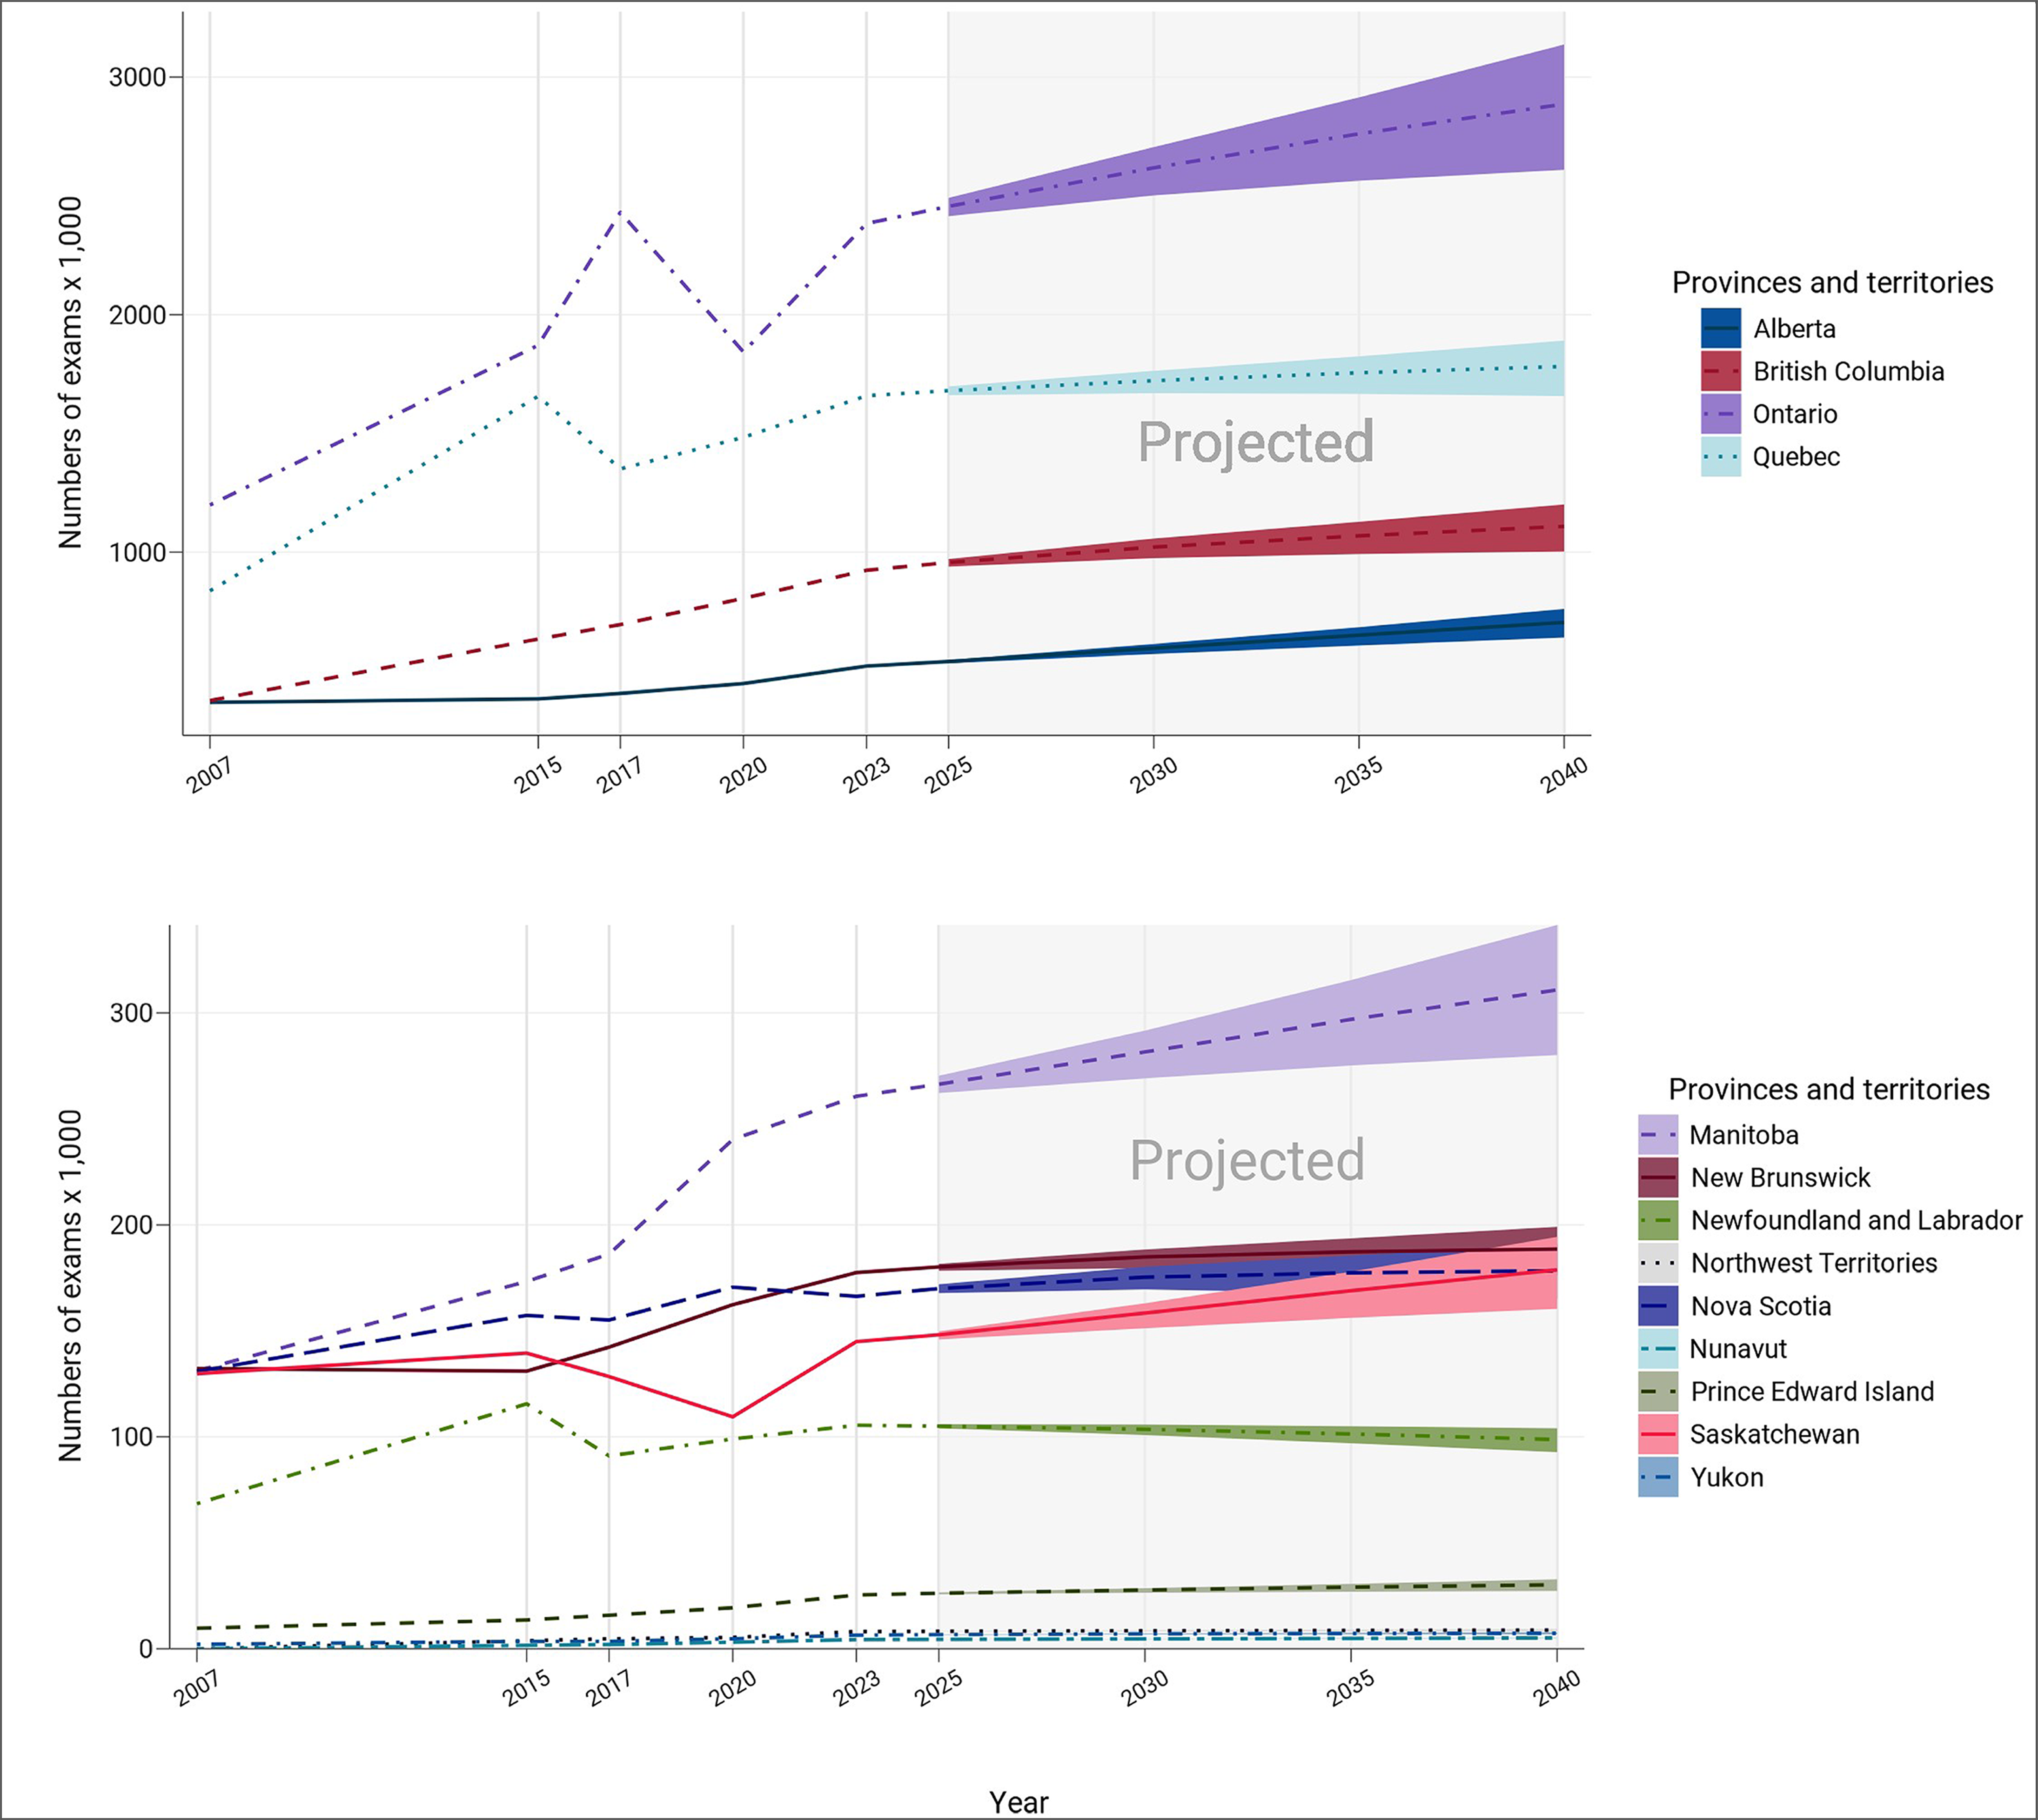
Notes: The projection was calculated from the products of the numbers of per capita exams in 2022–2023 and the population projections in 2025, 2030, 2035, and 2040.
The numbers of imaging units or exams were provided by provincial or territorial validators in 2023.
The population projections were retrieved from the Statistics Canada website on January 18, 2024.26
The solid lines of projections were based on the population projection, assuming medium growth.
The upper and lower bounds were based on population projections, assuming high and low growth, respectively.
The data displayed in this figure are presented in greater detail in Appendix 3, Table 26.
Projection Considerations and Limitations
Since 2015, the number of CT units and exam volumes in Canada have increased by 4.1% and 21%, respectively. The rapid increase in exam volumes over time, compared with the smaller increase in CT units, suggests that demand for exams is outpacing the installation of units. Additionally, when considering the 2019–2020 CMII projections for Canada, the exam counts for 2035 have already been exceeded, while the unit count remains below 2025 projections.2
To assist with policy development and planning around changing equipment and exam volumes, it may be helpful to consider factors beyond population growth. These variables may include changing health care priorities and policies, an aging population, increasing disease prevalence, and the widening scope of clinical indications for which CT can be used (e.g., as a screening tool). In addition, funding can influence CT projects (with a set level of funding, there may be a limited number of exams that can be performed).
Limitations of Findings
While complete data are available from provincial and territorial validators for units and exams in the public setting, there is no equivalent in the private imaging sector, and therefore data for unit and exam counts are not reflective of overall private imaging facility operations. Challenges in identifying private facilities and contacts within these facilities also contributed to the low number of survey responses for this category of imaging facility. Therefore, this may lead to underestimating the total number of units and exams, particularly in jurisdictions where privately run imaging facilities contribute to overall use.
For some survey questions, a low number of responses were received by participating sites, warranting caution when interpreting the data. For instance, 106 of 394 sites reported data on patterns of exam use. The number of sites that responded to each question have been included alongside the reported data to enable readers to assess representativeness. Future work will be undertaken to identify patterns in missing data and how these impact reporting bias.
To document the age of equipment, dates were variably reported as year of installation or first year of operation (depending on data availability) and frequently varied across datasets, leading to a 1-year or 2-year uncertainty in the age of individual units, and a corresponding uncertainty in the reported mean age of equipment.
For specific survey questions, the accuracy of the data in this report relied in part on the survey participants’ personal knowledge of their particular health care setting (e.g., hours of operation, hours of unplanned downtime). For these survey questions, recall bias could not be avoided, as we were unable to assess whether all information was visually verified and based on real-time observations, or whether questions were answered from memory. As a result, the accuracy and completeness of reporting may be impacted.
Since 2015, the CMII national survey forms have been prepopulated with responses from sites that participated in previous CMII national survey iterations. Invited survey respondents were asked to update their data to reflect the status at the time of responding to the survey. If the survey was not updated for this iteration, it was assumed that no changes had been made from the previous CMII survey response. While this method improved survey respondent engagement and reduced fatigue, in some instances not all data may be up-to-date for some sites.
While we asked about replacement of units, we did not ask about technical upgrades that improve the operation of existing units, which directly impact the age of equipment and need for replacement. The collection of this information will be considered in future survey iterations.
This report focused on the use of standard CT scanners in Canada, although some CT applications have transitions to other types of scanners (e.g., cone beam CT scanners).
What Else Are We Doing?
This Canadian Medical Imaging Inventory 2022–2023: CT report is part of a series of publications produced based on the CMII national survey.
The following additional publications, which can be found on the CMII webpage, are available to provide jurisdiction-level information on medical imaging modalities and resources:
Canadian Medical Imaging Inventory 2022–2023: Provincial and Territorial Overview
Canadian Medical Imaging Inventory 2022–2023: PET-CT and PET-MRI
Canadian Medical Imaging Inventory 2022–2023: MRI
Canadian Medical Imaging Inventory 2022–2023: SPECT and SPECT-CT
Canadian Medical Imaging Inventory 2022–2023: The Medical Imaging Team
provincial and territorial summaries.
What Else Have We Done?
Other CMII-related reports released in 2023–2024 in response to specific decision-maker needs and questions are listed here and have been published on the CMII website:
References
1.National Institute of Biomedical Imaging and Bioengineering. Computed Tomography (CT). 2023; https://www.nibib.nih.gov/science-education/science-topics/computed-tomography-ct. Accessed 2024 Apr 06.
2.Chao Y-S, Sinclair A, Morrison A, Hafizi D, Pyke L. The Canadian Medical Imaging Inventory 2019-2020. Ottawa (ON): CADTH; 2021: https://www.cadth.ca/sites/default/files/ou-tr/op0546-cmii3-final-report.pdf. Accessed 2024 Jan 10.
3.Neurologica. Recent Advances in CT Scan Technology. 2021; https://www.neurologica.com/blog/advances-ct-scan-technology. Accessed 2024 Apr 06.
4.Wait list strategies for CT and MRI exams. Can J Health Technol. 2023;3(1). https://www.cadth.ca/sites/default/files/attachments/2023-01/CM0002-HC0052-Wait-List%20Strategies-for-CT-and-MRI-Scans.pdf. Accessed 2024 Jan 10.
5.Imaging Technology News. Advancements in Computed Tomography Technology. 2023; https://www.itnonline.com/article/advancements-computed-tomography-technology. Accessed 2024 Apr 06.
6.Wiley P. Two monumental milestones achieved in CT imaging. Bethesda (MD): National Institute of Biochemical Imaging and Bioengineering; 2022: https://www.nibib.nih.gov/news-events/newsroom/two-monumental-milestones-achieved-ct-imaging. Accessed 2024 Apr 06.
7.Addressing the medical imaging dilemma in Canada: Restoring timely access for patients post-pandemic. Ottawa (ON): Canadian Association of Radiologists; 2022: https://car.ca/wp-content/uploads/2021/07/CAR-PreBudgetSubmission-2022-e-web-FINAL.pdf. Accessed 2023 Nov 9.
8.Moir M, Barua B, Wannamaker H. Waiting your turn: Wait times for health care in Canada, 2023 Report. Vancouver (BC): Fraser Institute; 2023: https://www.fraserinstitute.org/sites/default/files/waiting-your-turn-2023.pdf. Accessed 2024 Jan 10.
9.Canadian Institute for Health Information (CIHI). Unnecessary Care in Canada. 2019.
10.Koeppel DR, Boehm IB. Shortage of iodinated contrast media: Status and possible chances - A systematic review. Eur J Radiol. 2023;164:110853. PubMed
11.Sutherland G, Russell N, Gibbard R, Dobrescu A. The value of radiology, part II. Ottawa (ON): The Conference Board of Canada; 2019: https://car.ca/wp-content/uploads/2019/07/value-of-radiology-part-2-en.pdf. Accessed 2024 Apr 06.
12.Statistics Canada. Canada's population estimates, first quarter 2023. The Daily. Ottawa (ON): Government of Canada; 2023: https://www150.statcan.gc.ca/n1/daily-quotidien/230628/dq230628c-eng.htm. Accessed 2024 Jan 5.
13.Sinclair A, Quay T, Pyke L, Morrison A. The Canadian Medical Imaging Inventory 2015. Ottawa (ON): CADTH; 2016: https://www.cadth.ca/sites/default/files/pdf/canadian_medical_imaging_inventory_2015_e.pdf. Accessed 2024 Jan 10.
14.Sinclair A, Morrison A, Young C, Pyke L. Canadian Medical Imaging Inventory, 2017. Ottawa (ON): CADTH; 2018: https://www.cadth.ca/sites/default/files/pdf/canadian_medical_imaging_inventory_2017.pdf. Accessed 2024 Jan 10.
15.An overview of clinical applications of Artificial Intelligence. CADTH issues in emerging health technologies. 2018: https://www.cadth.ca/sites/default/files/pdf/eh0070_overview_clinical_applications_of_AI.pdf. Accessed 2024 Mar 9.
16.Najjar R. Redefining Radiology: A Review of Artificial Intelligence Integration in Medical Imaging. Diagnostics. 2023;13(17):2760. PubMed
17.Health Council of Canada. Decisions, decisions: Family doctors as gatekeepers to prescription Drugs and Diagnostic Imaging in Canada. Ottawa (ON): Government of Canada; 2010: https://publications.gc.ca/collections/collection_2011/ccs-hcc/H174-19-2010-eng.pdf. Accessed 2024 Mar 22.
18.Health Quality Ontario. Peer review: A diagnostic imaging quality initiative for Ontario. Toronto (ON): Government of Ontario; 2016: https://www.hqontario.ca/Portals/0/documents/health-quality/di-expert-panel-report-en.pdf. Accessed 2024 Mar 9.
19.Rühm W, Harrison RM. High CT doses return to the agenda. Radiation and Environmental Biophysics. 2020;59(1):3-7. PubMed
20.Remedios D. Cumulative radiation dose from multiple CT examinations: stronger justification, fewer repeats, or dose reduction technology needed? European Radiology. 2020;30(4):1837-1838. PubMed
21.Verfaillie G, Franck C, De Crop A, Beels L, D'Asseler Y, Bacher K. A systematic review and meta-analysis on the radiation dose of computed tomography in hybrid nuclear medicine imaging. EJNMMI Phys. 2023;10(1):32. PubMed
22.Medical imaging in Canada 2012 (executive summary). Ottawa (ON): Canadian Institute for Health Information (CIHI); 2013.
23.Canadian Institute for Health Information (CIHI). QuickStats. Selected medical imaging equipment in Canada. 2012; https://www.cihi.ca/en/selected-medical-imaging-equipment-in-canada. Accessed 2020 Sep 30.
24.Organisation for Economic Co-operation and Development. Computed tomography (CT) scanners. 2020; https://data.oecd.org/healtheqt/computed-tomography-ct-scanners.htm. Accessed 2020 Sep 30.
25.Organisation for Economic Co-Operation and Development. Computed tomography (CT) exams. 2023; https://data.oecd.org/healthcare/computed-tomography-ct-exams.htm. Accessed 2023 Nov 9.
26.Statistics Canada. Population Projections for Canada (2021 to 2068), Provinces and Territories (2021 to 2043): Technical Report on Methodology and Assumptions. Ottawa (ON): Government of Canada; 2023: https://www150.statcan.gc.ca/n1/en/pub/91-620-x/91-620-x2022001-eng.pdf?st=My-XWuTK. Accessed 2024 Jan 31.
27.Canadian Coordinating Office for Health Technology Assessment (CCOHTA). Computed tomography scanners in Canadian hospitals. Ottawa (ON): CCOHTA; 2000.
28.Organisation for Economic Co-Operation and Development. Computed tomography (CT) scanners. 2020; https://data.oecd.org/healtheqt/computed-tomography-ct-scanners.htm. Accessed 2024 Feb 29.
29.Radiation protection and safety: Awareness and implementation of the Bonn Call for Action priorities in Canada. (CADTH Environmental Scan). Ottawa (ON); 2018. https://www.cadth.ca/sites/default/files/pdf/es0312_BonnES.pdf. Accessed 2024 Feb 29.
Appendix 1: Introduction to CT Imaging
Note that this appendix has not been copy-edited.
About CT
CT employs X-rays as a source of ionizing radiation, sensitive radiation detectors, and computer analysis to create cross-sectional images of the body, including the head, heart, lungs, cardiovascular system, musculoskeletal system, abdomen, pelvis, and spine.27 Specialties that routinely employ CT include neurology, cardiology, oncology, internal medicine, orthopedics, and emergency trauma care.
The main advantages of CT are its speed, which enables rapid imaging and diagnosis in urgent situations, and its ability to visualize fine details in bone, lungs, and other organs.27,28 CT involves exposure to ionizing radiation, which means that the risks and benefits of its use in pregnancy, in young children, and of repeated use must be assessed.27
Appendix 2: Definitions of Terms Used in This Report
Note that this appendix has not been copy-edited.
Type of Facility Operating Imaging Equipment
Hospital
An institution where patients are provided with continuing medical care and supporting diagnostic and therapeutic services. Hospitals are licensed or approved as hospitals by a provincial or territorial government or are operated by the Government of Canada. Included are those providing acute care.
Tertiary Care
A hospital that provides tertiary care, which is health care from specialists who investigate and treat patients in a large hospital after referral from primary care and secondary care facilities.
Private
A health care facility that operates privately but that is either privately or publicly funded, that ranges from specialized services by physicians, radiologists, dentists, chiropractors, or via mammography programs, to broad-based imaging centres offering a wide range of tests.
Community Hospital
A short-term (average length of stay with fewer than 30 days) hospital that provides acute care.
Picture Archiving and Communication Systems
PACS refers to an electronic system used to digitally manage images, including transmission, filing, storage, distribution, and retrieval of medical images. It is networked and frequently web-based. Combined with other web-based telehealth technologies, a PACS allows timely access to medical images and specialists. PACSs have replaced film and film library systems.
Access to images outside medical imaging departments by referring and consulting physicians is important for efficient patient care, particularly so in a country like Canada, with its large geographic size and dispersed population.
Type of Equipment Servicing Method Reported by Sites
À La Carte
This refers to services and parts that are paid by the imaging facility on an as-needed basis, with the service provider charging for parts, labour, and travel.
Full Vendor Service Contracts
Full vendor contracts provide a wide range of services, such as corrective maintenance, operational maintenance, planned maintenance, and extended warranty, along with insurance maintenance programs for a set period.
Insurance
Insurance policy service contracts may vary, but most equipment insurance companies specialize in risk management, cost avoidance, or service billing audit functions.
Managed Equipment Service
This service package entails ownership, acquisition, installation and commissioning, user training, asset management, maintenance, and ongoing replacement of medical technology and equipment.
Shared Service
Organizations that have in-house expertise and resources may service their own imaging equipment and may use external service contracts for certain types of equipment.
Third Party
Third-party agreements may often be used for hardware support and to provide services offered through a company separate from the original equipment manufacturer.
Under Warranty
This refers to equipment maintenance performed according to warranty service agreement. At the end of the warranty period, health care systems must select their service contract type.
Appendix 3: Supplementary Summary Tables for CT, the 2022–2023 CMII
Note that this appendix has not been copy-edited.
Table 6: Summary of Type of CT Facility Included in the CMII, 2022–2023
Province or territory | Hospital | Private | Community hospital | Tertiary care |
|---|---|---|---|---|
Number of sites (% in each jurisdiction) | ||||
Alberta | 18 (50) | 3 (5.6) | 13 (36.1) | 2 (5.6) |
British Columbia | 33 (67.3) | 4 (8.2) | 6 (12.2) | 6 (12.2) |
Manitoba | 13 (76.5) | 0 (0) | 1 (5.9) | 3 (17.6) |
New Brunswick | 10 (90.9) | 0 (0) | 0 (0) | 1 (9.1) |
Newfoundland and Labrador | 14 (100) | 0 (0) | 0 (0) | 0 (0) |
Northwest Territories | 1 (100) | 0 (0) | 0 (0) | 0 (0) |
Nova Scotia | 8 (57.1) | 0 (0) | 2 (14.3) | 4 (28.6) |
Nunavut | 1 (100) | 0 (0) | 0 (0) | 0 (0) |
Ontario | 73 (64.0) | 9 (7.9) | 22 (19.3) | 10 (8.8) |
Prince Edward Island | 2 (100) | 0 (0) | 0 (0) | 0 (0) |
Quebec | 84 (84) | 13 (13) | 0 (0) | 3 (3) |
Saskatchewan | 8 (53.3) | 2 (13.3) | 0 (0) | 5 (33.3) |
Yukon | 1 (100) | 0 (0) | 0 (0) | 0 (0) |
Canada | 266 (70.9) | 31 (8.3) | 44 (11.7) | 34 (9.1) |
CMII = Canadian Medical Imaging Inventory.
Notes: Survey response data were available for 375 out of 394 sites across all jurisdictions with CT capacity.
Data were derived from the following survey question: “What type of facility is this?” The table includes only those facilities that responded to the survey question. In some instances, validator data, CMII data, and data from other publicly available sources supplemented survey responses. Definitions for the type of facility included in the survey are provided in Appendix 2.
Table 7: Summary of Location of CT Facilities Included in the CMII, 2022–2023
Province or territory | Urban | Rural | Remote |
|---|---|---|---|
Number of sites (% in each jurisdiction) | |||
Alberta | 14 (37.8) | 23 (62.2) | 0 (0) |
British Columbia | 28 (60.9) | 17 (37) | 1 (2.2) |
Manitoba | 9 (52.9) | 8 (47.1) | 0 (0) |
New Brunswick | 8 (72.7) | 3 (27.3) | 0 (0) |
Newfoundland and Labrador | 5 (38.5) | 8 (61.5) | 0 (0) |
Northwest Territories | 0 (0) | 0 (0) | 1 (100) |
Nova Scotia | 7 (53.8) | 6 (46.2) | 0 (0) |
Nunavut | 0 (0) | 0 (0) | 1 (100) |
Ontario | 63 (65.6) | 30 (31.2) | 3 (3.1) |
Prince Edward Island | 2 (100) | 0 (0) | 0 (0) |
Quebec | 33 (89.2) | 3 (8.1) | 1 (2.7) |
Saskatchewan | 8 (57.1) | 6 (42.9) | 0 (0) |
Yukon | 0 (0) | 0 (0) | 1 (100) |
Canada | 177 (61.2) | 104 (36.0) | 8 (2.8) |
CMII = Canadian Medical Imaging Inventory.
Notes: Survey response data were available for 289 out of 394 sites across all jurisdictions with CT capacity.
Data were derived from the following survey question: “In which of the following settings are you located?” The table includes only those facilities that responded to the survey question. In some instances, validator data, CMII data, and data from other publicly available sources supplemented survey response.
Table 8: Summary of Source of Funding for CT Sites Included in the CMII, 2022–2023
Province or territory | Public | Privatea | Both |
|---|---|---|---|
Number of sites (% in each jurisdiction) | |||
Alberta | 36 (97.3) | 0 (0) | 1 (2.7) |
British Columbia | 42 (100) | 0 (0) | 0 (0) |
Manitoba | 17 (100) | 0 (0) | 0 (0) |
New Brunswick | 8 (88.9) | 0 (0) | 1 (11.1) |
Newfoundland and Labrador | 12(100) | 0 (0) | 0 (0) |
Northwest Territories | 1 (100) | 0 (0) | 0 (0) |
Nova Scotia | 9 (100) | 0 (0) | 0 (0) |
Nunavut | 1 (100) | 0 (0) | 0 (0) |
Ontario | 73 (96.1) | 0 (0) | 3 (3.9) |
Prince Edward Island | 2 (100) | 0 (0) | 0 (0) |
Quebec | 84 (86.6) | 13 (13.4) | 0 (0) |
Saskatchewan | 13 (100) | 0 (0) | 0 (0) |
Yukon | 1 (100) | 0 (0) | 0 (0) |
Canada | 299 (94.3) | 13 (4.1) | 5 (1.6) |
CMII = Canadian Medical Imaging Inventory.
Notes: Survey response data were available for 317 out of 394 sites across all jurisdictions with CT capacity.
Data were derived from the following survey question: “How is this facility funded?” The table includes only those facilities that responded to the survey question. In some instances, validator data, CMII data, and data from other publicly available sources supplemented survey response.
aHealth care facilities that receive no government funding for CT imaging–related services.
Table 9: Number of CT Units and Units per Capita, 2015 to 2022–2023
Province or territory | 2015 | 2017 | 2019 to 2020 | 2022 to 2023 | ||||
|---|---|---|---|---|---|---|---|---|
Units | Units per million population | Units | Units per million population | Units | Units per million population | Units | Units per million population | |
Alberta | 50 | 11.9 | 56 | 13.1 | 55 | 12.5 | 53 | 11.3 |
British Columbia | 65 | 13.9 | 66 | 13.8 | 69 | 13.5 | 75 | 13.8 |
Manitoba | 19 | 14.7 | 23 | 17.3 | 22 | 16 | 24 | 16.6 |
New Brunswick | 14 | 18.6 | 15 | 19.8 | 17 | 21.8 | 15 | 18 |
Newfoundland and Labrador | 16 | 30.3 | 16 | 30.3 | 15 | 28.7 | 16 | 30 |
Northwest Territories | 1 | 22.7 | 1 | 22.5 | 1 | 22.3 | 1 | 21.9 |
Nova Scotia | 21 | 22.3 | 18 | 18.9 | 17 | 17.4 | 18 | 17.2 |
Nunavut | 1 | 27.0 | 1 | 26.7 | 1 | 25.7 | 1 | 24.6 |
Ontario | 186 | 13.5 | 184 | 13.0 | 169 | 11.5 | 192 | 12.4 |
Prince Edward Island | 2 | 13.7 | 2 | 13.4 | 2 | 12.7 | 2 | 11.4 |
Quebec | 146 | 17.7 | 163 | 19.5 | 164 | 19.2 | 144 | 16.3 |
Saskatchewan | 16 | 14.1 | 15 | 12.9 | 16 | 13.6 | 18 | 14.7 |
Yukon | 1 | 27.0 | 1 | 26.5 | 1 | 24.4 | 1 | 22.5 |
Canada | 538 | 15.0 | 561 | 15.3 | 549 | 14.5 | 560 | 14.0 |
Notes: Complete unit count data were available for all public CT units across all jurisdictions with capacity.
For the 2022 to 2023 survey, complete unit count data were available for 394 sites with CT capacity out of 467 participating sites with advanced imaging capacity (i.e., SPECT-CT, SPECT, CT, MRI, PET-CT, PET-MRI). For 2019 to 2020, complete unit count data were available for 369 sites with CT capacity out of 455 participating sites with advanced imaging capacity. For 2017, complete unit count data were available for 363 sites with CT capacity out of 505 participating sites with advanced imaging capacity. For 2015, complete unit count data were available for 305 sites with CT capacity out of 392 participating sites with advanced imaging capacity.
Data were derived from the following survey question: “Do you have the following fixed, mobile, or portable units at the site?” Options included CT, MRI, PET-CT, PET-MRI, SPECT-CT, and SPECT.
Source: CADTH (2015),13 CADTH (2017),14 CADTH (2020),2 CADTH (2024).
Table 10: Volume of CT Exams and Exams per 1,000 People Across Canadian Public Facilities, 2015 to 2022–2023
Province or territory | 2015 | 2017 | 2019 to 2020 | 2022 to 2023 | ||||
|---|---|---|---|---|---|---|---|---|
Exams | Exams per thousand | Exams | Exams per thousand | Exams | Exams per thousand | Exams | Exams per thousand | |
Alberta | 382,300 | 91.1 | 405,332 | 94.4 | 447,069 | 101.7 | 520,507 | 110.7 |
British Columbia | 634,530 | 135.5 | 695,248 | 145.2 | 805,584 | 157.8 | 923,990 | 169.9 |
Manitoba | 173,299 | 134 | 186,197 | 139.7 | 240,269 | 174.9 | 260,661 | 180.5 |
New Brunswick | 130,984 | 173.7 | 142,294 | 187.8 | 162,322 | 208.1 | 177,477 | 213.4 |
Newfoundland and Labrador | 115,552 | 218.9 | 90,985 | 172.1 | 98,967 | 189.6 | 105,441 | 197.6 |
Northwest Territories | — | — | 4,695 | 105.8 | 5,335 | 118.8 | 8,115 | 177.7 |
Nova Scotia | 157,290 | 166.8 | 155,099 | 162.7 | 170,603 | 174.7 | 166,268 | 158.8 |
Nunavut | — | — | 2,000 | 53.4 | 3,081 | 79.3 | 4,336 | 106.5 |
Ontario | 1,871,160 | 135.7 | 2,430,739 | 172 | 1,842,982 | 125.7 | 2,383,569 | 153.8 |
Prince Edward Island | 13,576 | 92.7 | 15,811 | 105.6 | 19,349 | 122.5 | 25,368 | 144 |
Quebec | 1,656,662 | 200.5 | 1,350,792 | 161.4 | 1,483,373 | 174 | 1,658,575 | 187.8 |
Saskatchewan | 139,488 | 123 | 128,415 | 110.6 | 109,418 | 92.8 | 144,903 | 118.6 |
Yukon | 3,500 | 93.6 | 3,500 | 92.6 | 4,700 | 114.6 | 6,455 | 145.3 |
Canada | 5,278,341 | 147 | 5,611,107 | 153 | 5,393,052 | 142.7 | 6,385,665 | 160.2 |
Notes: 2022 to 2023 exam volume data for public facilities were reported by validators for all jurisdictions with CT capacity.
Data were derived from the following survey question: “For all units, how many examinations on average were conducted in the last fiscal/calendar year?”
Source: CADTH (2015),13 CADTH (2017),14 CADTH (2020),2 CADTH (2024).
Table 11: Summary of Average Hours per Day of CT Use by Province and Territory, 2022–2023
Province or territory | Number of reporting sites | Mean hours | Median hours (minimum to maximum) |
|---|---|---|---|
Alberta | 38 | 11.66 | 9 (8 to 24) |
British Columbia | 34 | 15.62 | 16 (7 to 24) |
Manitoba | 16 | 13.0 | 14 (6 to 24) |
New Brunswick | 8 | 13.38 | 12.5 (8 to 24) |
Newfoundland and Labrador | 9 | 10.22 | 10 (7 to 16) |
Northwest Territories | 1 | 10 | 10 (10 to 10) |
Nova Scotia | 7 | 14.57 | 13 (9 to 24) |
Nunavut | 1 | 8.0 | 8 (8 to 8) |
Ontario | 53 | 16.77 | 16 (7 to 24) |
Prince Edward Island | 2 | 13.5 | 13.5 (10 to 17) |
Quebec | 21 | 14.29 | 14 (7 to 24) |
Saskatchewan | 13 | 13.62 | 16 (8 to 24) |
Yukon | 1 | 10.0 | 10 (10 to 10) |
Canada | 204 | 14.2 | 15 (6 to 24) |
Notes: Survey response data were available for 204 out of 394 sites across all jurisdictions with CT capacity.
Data were derived from the following survey question: “In an average 24-hour day, how many hours are the units staffed through regular scheduled service capacity (do not include hours where staff are only on call)?”
Table 12: Summary of 24-Hour and Weekend Use of CT by Province and Territory, 2022–2023
Province or territory | Operates 24 hours a day | Operates on the weekend |
|---|---|---|
Number of sites (percent of responding sites) | ||
Alberta | 6 (16.2% of 37) | 15 (40.5% of 37) |
British Columbia | 16 (43.2% of 37) | 34 (91.9% of 37) |
Manitoba | 3 (14.3% of 21) | 15 (71% of 21) |
New Brunswick | 4 (50% of 8) | 7 (87.5% of 8) |
Newfoundland and Labrador | 2 (16.7% of 12) | 4 (33.3% of 12) |
Northwest Territories | 0 (0% of 1) | 0 (0% of 1) |
Nova Scotia | 4 (50% of 8) | 7 (87.5% of 8) |
Nunavut | 0 (0% of 1) | 1 (100% of 1) |
Ontario | 28 (51.9% of 54) | 46 (83.6% of 55) |
Prince Edward Island | 1 (50% of 2) | 1 (50% of 2) |
Quebec | 13 (50% of 26) | 24 (92.3% of 26) |
Saskatchewan | 12 (92.3% of 13) | 13 (100% of 13) |
Yukon | 0 (0% of 1) | 1 (100% of 1) |
Canada | 89 (40.3% of 221) | 168 (75.7% of 222) |
Notes: Survey response data for operation 24 hours a day were available for 221 out of 394 sites across all jurisdictions with CT capacity. Survey response data for weekend operation were available for 222 out of 394 sites across all jurisdictions with CT capacity.
Data were derived from the following survey questions: “Do any units operate 24 hours a day?” and “Do any units operate on the weekend?”
Table 13: Average Hours per Week of CT Use by Province and Territory, 2022–2023
Province or territory | Number of reporting sites | Mean hours | Median hours (minimum to maximum) |
|---|---|---|---|
Alberta | 38 | 69.32 | 46.5 (32 to 168) |
British Columbia | 34 | 103.71 | 111 (33 to 168) |
Manitoba | 16 | 91 | 96 (40 to 168) |
New Brunswick | 8 | 84.88 | 80.5 (38 to 168) |
Newfoundland and Labrador | 10 | 57.6 | 53 (35 to 112) |
Northwest Territories | 1 | 48 | 48 (48 to 48) |
Nova Scotia | 7 | 101.43 | 95 (45 to 168) |
Nunavut | 1 | 38 | 38 (38 to 38) |
Ontario | 53 | 106.58 | 105 (4 to 168) |
Prince Edward Island | 2 | 75.5 | 75.5 (50 to 101) |
Quebec | 21 | 96.43 | 98 (35 to 168) |
Saskatchewan | 13 | 86.38 | 96 (40 to 168) |
Yukon | 1 | 50 | 50 (50 to 50) |
Canada | 205 | 91.1 | 96 (4 to 168) |
Notes: Survey response data were available for 205 out of 394 sites across all jurisdictions with CT capacity.
Data were derived from the following survey question: “In an average 168-hour week, how many hours are the [modality] units staffed through regular scheduled service capacity (do not include hours where staff are only on call)?”
Table 14: Planned and Unplanned Downtime at Sites With CT Units, 2022–2023
Province or territory | Annual planned downtime | Annual unplanned downtime | ||
|---|---|---|---|---|
Number of reporting sites | Mean hours (min to max) | Number of reporting sites | Mean hours (min to max) | |
Alberta | 37 | 24.7 (8 to 78) | 37 | 89.8 (5 to 821) |
British Columbia | 31 | 32.4 (10 to 90) | 25 | 205.5 (16 to 2000) |
Manitoba | 16 | 32.6 (24 to 44) | 16 | 72 (20 to 200) |
New Brunswick | 7 | 21.6 (4 to 32) | 6 | 34.3 (8 to 80) |
Newfoundland and Labrador | 10 | 21.6 (12 to 32) | 7 | 61.6 (10 to 150) |
Northwest Territories | 1 | 30 (30 to 30) | 1 | 4 (4 to 4) |
Nova Scotia | 7 | 19.3 (12 to 30) | 4 | 41.2 (5 to 96) |
Nunavut | 1 | 8 (8 to 8) | 1 | 24 (24 to 24) |
Ontario | 49 | 30.6 (2 to 206.5) | 37 | 60.4 (4 to 400) |
Prince Edward Island | 2 | 18 (12 to 24) | 2 | 11.5 (8 to 15) |
Quebec | 21 | 24.7 (4 to 120) | 16 | 69.8 (4 to 200) |
Saskatchewan | 13 | 29.5 (16 to 96) | 13 | 53.8 (8 to 180) |
Yukon | 1 | 16 (16 to 16) | 1 | 16 (16 to 16) |
Canada | 196 | 27.7 (2 to 206.5) | 166 | 87.5 (4 to 2000) |
Notes: Survey response data for planned downtime were available for 196 out of 394 sites across all jurisdictions with CT capacity. Survey response data for unplanned downtime were available for 166 out of 394 sites across all jurisdictions with CT capacity.
Data were derived from the following survey question: “How much planned downtime is anticipated for scheduled maintenance for all units in a given year? (expressed in hours)” and “How much unplanned downtime is experienced for all units in a given year? (expressed in hours).”
Table 15: Average Age of CT Imaging Equipment, 2022–2023
Province or territory | Number of CT units | Average age CT (years, minimum to maximum) |
|---|---|---|
Alberta | 51 | 8.7 (0 to 17) |
British Columbia | 51 | 7 (0 to 18) |
Manitoba | 24 | 8 (2 to 16) |
New Brunswick | 12 | 9.8 (2 to 18) |
Newfoundland and Labrador | 9 | 7.7 (0 to 14) |
Northwest Territories | 1 | 7 (7 to 7) |
Nova Scotia | 17 | 9 (1 to 16) |
Nunavut | 1 | 9 (9 to 9) |
Ontario | 87 | 7.4 (0 to 18) |
Prince Edward Island | 2 | 5 (3 to 7) |
Quebec | 60 | 10.2 (1 to 23) |
Saskatchewan | 16 | 7.4 (1 to 15) |
Yukon | 1 | 0 (0 to 0) |
Canada | 332 | 8.2 (0 to 23) |
Notes: Survey response data were available for 332 of 560 CT units across all jurisdictions with capacity.
Age for each unit was calculated from the following survey question: “What year did (or will) the [modality] unit become operational?” subtracted from 2023.
Table 16: Age of CT Units in Years, 2022–2023
Modality | Years | ||||
|---|---|---|---|---|---|
5 or less | 6 to 10 | 11 to 15 | 16 to 20 | Greater than 20 | |
Number of units (% of age categories) | |||||
Alberta | 12 (23.5) | 20 (39.2) | 18 (35.3) | 1 (2) | — |
British Columbia | 19 (37.3) | 20 (39.2) | 11 (21.6) | 1 (2) | — |
Manitoba | 7 (29.2) | 9 (37.5) | 6 (25.0) | 2 (8.3) | — |
New Brunswick | 1 (8.3) | 6 (50) | 3 (25) | 2 (16.7) | — |
Newfoundland and Labrador | 4 (44.4) | 1 (11.1) | 4 (44.4) | — | — |
Northwest Territories | — | 1 (100) | — | — | — |
Nova Scotia | 5 (29.4) | 5 (29.4) | 4 (23.5) | 3 (17.6) | — |
Nunavut | — | 1 (100) | — | — | — |
Ontario | 27 (31) | 36 (41.4) | 17 (19.5) | 7 (8) | — |
Prince Edward Island | 1 (50) | 1 (50) | — | — | — |
Quebec | 17 (28.3) | 14 (23.3) | 19 (31.7) | 7 (11.7) | 3 (5) |
Saskatchewan | 5 (31.2) | 8 (50) | 3 (18.8) | — | — |
Yukon | 1 (100) | — | — | — | — |
Canada | 99 (29.8) | 122 (36.7) | 85 (25.6) | 23 (6.9) | 3 (0.9) |
Notes: Survey response data were available for 332 of 560 CT units across all jurisdictions with capacity.
Age for each unit was calculated from the following survey question: “What year did (or will) the [modality] unit become operational?” subtracted from 2023.
Table 17: Summary of Type of Use by Clinical Specialty for CT, 2022–2023
Use category | Average percent | Median percent (minimum to maximum) |
|---|---|---|
Oncology | 24.1 | 20 (0 to 70) |
Neurologic | 16.5 | 15 (0 to 40) |
Hepatobiliary | 14 | 15 (0 to 50) |
Respiratory | 12.7 | 10 (0 to 70) |
Trauma | 10 | 10 (0 to 73.86) |
Musculoskeletal | 7.5 | 5 (0 to 65) |
Inflammatory | 6.4 | 5 (0 to 20) |
Cardiac | 3.4 | 0 (0 to 90) |
Other | 3 | 0 (0 to 100) |
Notes: Survey response data on the average percentage of CT use by discipline were available for 106 out of 394 sites across 11 of the 13 jurisdictions with capacity. No data were available for Nunavut and Yukon.
Data were derived from the following survey question: “On average, what percentage of these exams fall into the following categories? The total percentage, expressed as a number, must add up to 100.” The following categories were asked: oncology, respiratory disease, hepatobiliary or gastrointestinal, musculoskeletal disorders, inflammatory or infectious diseases, neurological, cardiac, trauma, and other use.
Table 18: Summary of Type of Use by Medical Category for CT Units, 2022–2023
Use category | Average percent | Median percent (minimum to maximum) |
|---|---|---|
Diagnostic noncardiac | 89.2 | 97.2 (0 to 100) |
Diagnostic cardiac | 5 | 0 (0 to 100) |
Interventional | 4.2 | 0.2 (0 to 100) |
Research | 1 | 0 (0 to 100) |
Other | 0.6 | 0 (0 to 100) |
Notes: Survey response data on the average percentage of CT use by discipline were available for 190 out of 394 sites across all jurisdictions with capacity.
Data were derived from the following survey question: “Based on your experience in the last fiscal year, what is the average percentage of overall time CT units are used for?” The following categories were asked: cardiac, noncardiac, research, interventional, and other use.
Table 19: Summary of Use of AI in CT, 2022–2023
Use of AI in CT | Number of responses | Number of sites (%) | Used for clinical, research, or both purposesa | Jurisdictions (number of sites) |
|---|---|---|---|---|
Lowering radiation dose | 181 | 48 (26.5) | Clinical: 32, research: 1, both: 2 | BC (14), MB (4), NB (3), NS (1), NT (1), NU (1), ON (17), QC (7) |
Reading and interpreting images | 199 | 19 (9.5) | Clinical: 14, research: 1, both: 2 | BC (3), NL (1), ON (13), QC (2) |
Image reconstruction | 181 | 50 (27.6) | Clinical: 39, research:1 | BC (7), MB (2), NB (3), NL (1), NS (2), NT (1), NU (1), ON (26), QC (6), YT (1) |
Treatment planning | 180 | 3 (1.7) | Clinical:3 | MB (1), ON (1), QC (1) |
Predicting outcomes | 182 | 4 (1.1) | Clinical: 4 | ON (4) |
Administrative tasks | 181 | 3 (1.7) | Clinical: 3 | NB (1), ON (1), QC (1) |
AI = artificial intelligence; BC = British Columbia; MB = Manitoba; NB = New Brunswick; NL = Newfoundland and Labrador; NS = Nova Scotia; NT = Northwest Territories; NU = Nunavut; ON = Ontario; QC = Quebec; YT = Yukon.
Notes: Number of sites out of 394 sites with CT capacity that provided survey response data are indicated in the “Number of responses” column.
Data were derived from the following survey questions: “Is artificial intelligence used to support: The reading/interpretation of images? Predicting outcomes? Lower radiation dose? Image resolution/reconstruction enhancement? Treatment planning? Administrative tasks?”
aThis column includes sites that did not select “yes” for the use of AI, but provided responses for the setting of use (clinical, research, or both).
Table 20: Types of Health Care Professionals That Have CT Exam-Ordering Privileges, 2022–2023
Province or territory | Clinical specialists | Family physicians or general practitioners | Nurse practitioners | Other |
|---|---|---|---|---|
Alberta | Yes, all | Yes | Yes | Chiropractor, podiatrist, dentist |
British Columbia | Yes, all | Yes | Yes | Chiropractor,a dentist, podiatric surgeon |
Manitoba | Yes | Yes | Yes | No |
New Brunswickb | Yes, all | NR | NR | No |
Newfoundland and Labrador | Yes, all | Yes | Yes | No |
Northwest Territories | None at this time; CT colonography in the future, if funding request approved | Yes | Yes | No |
Nova Scotia | Yes, all | Yes | Yes | No |
Nunavut | NR | Yes | Yes | No |
Ontario | NR | NR | NR | No |
Prince Edward Island | Yes, all | Yes | Yes | No |
Quebec | Yes, all | Under certainc conditions | Under certainc conditions | No |
Saskatchewan | Yes, all | Yes | Yes | Chiropractor, if radiologist recommended exams in previous imaging report |
Yukon | Yes, all | Yes | Yes | No |
NR = not reported.
Notes: Survey response data were available from 12 out of 13 jurisdictions. No data were available for Ontario.
Data were derived from the following question: “Which health care professionals can order imaging exams for CT?”
aCollege of Chiropractors of British Columbia Professional Conduct Handbook (June 2023, page 50): “When chiropractors issue an authorization or instruction for X-rays for the purpose of computerized axial tomography, and electromagnetism for the purpose of magnetic resonance imaging, they cannot interpret the results and must receive a written report from a qualified health professional documenting the interpretation of the imaging.”
bFor New Brunswick, the responses came from 1 of the 2 regional health authorities, the Horizon Health Network.
cConditions were not specified.
Table 21: Exam-Ordering Practice at Sites With CT Units, 2022–2023
Province or territory | Automated entry | Paper forms | Requests by fax | Requests by telephone | Central booking | ||||||
|---|---|---|---|---|---|---|---|---|---|---|---|
Yes | No | Yes | No | Yes | No | Yes | No | All exams | Some exams | Not used | |
Number (%) of sites that use these exam-ordering practices | |||||||||||
Alberta | 24 (64.9) | 13 (35.1) | 37 (100) | 0 | 37 (100) | 0 | 19 (51.4) | 18 (48.6) | 1 (2.7) | 21 (56.8) | 15 (40.5) |
British Columbia | 9 (24.3) | 28 (75.7) | 36 (97.3) | 1 (2.7) | 36 (97.3) | 1 (2.7) | 3 (8.3) | 33 (91.7) | 13 (35.1) | 3 (8.1) | 21 (56.8) |
Manitoba | 1 (6.3) | 15 (93.8) | 1 (6.3) | 15 (93.8 | 16 (100) | 0 | 0 | 16 (100) | 0 | 0 | 16 (100) |
New Brunswick | 0 | 7 (100) | 8 (100) | 0 | 8 (100) | 0 | 2 (25) | 6 (75) | 4 (50) | 0 | 4 (50) |
Newfoundland and Labrador | 4 (36.4) | 7 (63.6) | 11 (100) | 0 | 11 (100) | 0 | 1 (9.1) | 10 (90.9) | 3 (27.3) | 6 (54.5) | 2 (18.2) |
Northwest Territories | 0 | 1 (100) | 1 (100) | 0 | 1 (100) | 0 | 0 | 1 (100) | 0 | 0 | 1 (100) |
Nova Scotia | 1 (14.3) | 6 (85.7) | 8 (100) | 0 | 8 (100) | 0 | 1 (12.5) | 7 (87.5) | 3 (42.9) | 2 (28.6) | 2 (28.6) |
Nunavut | 1 (100) | 0 | 1 (100) | 0 | 1 (100) | 0 | 0 | 1 (100) | 0 | 1 (100) | 0 |
Ontario | 33 (61.1) | 21 (38.9) | 53 (96.4) | 2 (3.6) | 53 (96.4) | 2 (3.6) | 7 (12.7) | 48 (87.3) | 31 (57.4) | 5 (9.3) | 18 (33.3) |
Prince Edward Island | 2 (100) | 0 | 2 (100) | 0 | 2 (100) | 0 | 0 | 2 (100) | 2 (100) | 0 | 0 |
Quebec | 6 (28.6) | 15 (71.4) | 21 (100) | 0 | 20 (95.2) | 1 (4.8) | 5 (23.8) | 16 (76.2) | 6 (28.6) | 7 (33.3) | 8 (38.1) |
Saskatchewan | 1 (7.7) | 12 (92.3) | 13 (100) | 0 | 13 (100) | 0 | 6 (46.2) | 7 (53.8) | 2 (15.4) | 7 (53.8) | 4 (30.8) |
Yukon | 1 (100) | – | 1 (100) | 0 | 1 (100) | 0 | 0 | 1 (100) | 1 (100) | 0 | 0 |
Canada | 83 (39.3) | 125 (60.1) | 193 (91.5) | 18 (8.5) | 207 (98.1) | 4 (1.9) | 44 (21) | 166 (79) | 66 (31.6) | 52 (24.9) | 91 (43.5) |
Notes: Survey response data were available for 211 out of 394 sites across all jurisdictions with CT capacity.
Data were derived from the following survey question: “Are automated order entry forms (exams request) used?”; “Are paper forms (exams requests) used?”; “Are requests received by fax?”; “Are requests received by phone?”; and “Is a centralized order entry (booking) system used? For all exams: Yes/no; For some exams: yes/no.”
Table 22: Trends in Reported Slices for CT Units, 2007 to 2022–2023
Slices | 2007 | 2012 | 2015 | 2017 | 2019 to 2020 | 2022 to 2023a |
|---|---|---|---|---|---|---|
Number of units (% of total responses per survey year) | ||||||
1 | 42 (11.2) | 15 (3.3) | 13 (3.2) | 10 (2.2) | 7 (1.6) | 2 (0.5) |
2 | 14 (3.7) | 5 (1.1) | 5 (1.2) | 3 (0.6) | 3 (0.7) | 0 |
4 | 100 (26.7) | 31 (6.9) | 18 (4.4) | 15 (3.2) | 9 (2) | 4 (1) |
6 | 0 | 3 (0.7) | 3 (0.7) | 1 (0.2) | 1 (0.2) | 0 |
8 | 19 (5.1) | 17 (3.8) | 14 (3.4) | 11 (2.4) | 6 (1.3) | 2 (0.5) |
10 | 5 (1.3) | 3 (0.7) | 3 (0.7) | 1 (0.2) | 1 (0.2) | 0 |
16 | 91 (24.3) | 105 (23.3) | 92 (22.5) | 85 (18.4) | 61 (13.6) | 25 (6.0) |
32 | 4 (1.1) | 4 (0.9) | 2 (0.5) | 2 (0.4) | 6 (1.3) | 3 (0.7) |
40 | 4 (1.1) | 6 (1.3) | 5 (1.2) | 3 (0.6) | 1 (0.2) | 1 (0.2) |
64 | 95 (25.4) | 219 (48.7) | 206 (50.5) | 241 (52.1) | 209 (46.7) | 158 (38.1) |
80 | 0 | 0 | 0 | 0 | 0 | 3 (0.7) |
96 | 0 | 0 | 2 (0.5) | 0 | 0 | 1 (0.2) |
128 | 0 | 22 (4.9) | 29 (7.1) | 62 (13.4) | 102 (22.8) | 129 (31.1) |
160 | 0 | 0 | 0 | 0 | 0 | 9 (2.2) |
192 | 0 | 0 | 0 | 1 (0.2) | 0 | 2 (0.5) |
256 | 0 | 10 (2.2) | 10 (2.5) | 14 (3) | 22 (4.9) | 32 (7.7) |
320 | 0 | 10 (2.2) | 6 (1.5) | 14 (3) | 20 (4.5) | 26 (6.3) |
512 | 0 | 0 | 0 | 0 | 0 | 6 (1.4) |
640 | 0 | 0 | 0 | 0 | 0 | 6 (1.4) |
720 | 0 | 0 | 0 | 0 | 0 | 2 (0.5) |
Notes: 2022–2023 survey response data were available for 415 out of 560 units in 12 of the 13 jurisdictions with CT capacity. No data were available from Nunavut.
Data were derived from the following survey question: “How many multi-detectors does the CT unit have (how many slices)?”
aIncludes 4 units reported in 2022–2023 to use a slice configuration not otherwise specified.
Table 23: Availability and Use of Technologies for Control of Radiation Exposure for CT, 2015 to 2022–2023
Response | 2015 n (%) | 2017 n (%) | 2019 to 2020 n (%) | 2022 to 2023 n (%) |
|---|---|---|---|---|
Does the CT unit have dose-management controls? | ||||
Yes | 36 (8.1) | 199 (33.8) | 294 (52.8) | 220 (39.3) |
No | 1 (0.2) | 45 (7.7) | 38 (6.8) | 6 (1.1) |
Don't know | 0 | 9 (1.5) | 19 (3.4) | 12 (2.1) |
Missing | 405 (91.6) | 335 (57) | 206 (37) | 322 (57.5) |
If yes, are the dose-management controls used? | ||||
Yes | NA | 157 (78.9) | 241 (82) | NA |
No | NA | 11 (5.5) | 22 (7.5) | NA |
Don't know | NA | 2 (1) | 12 (4.1) | NA |
Missing | NA | 29 (14.6) | 19 (6.5) | NA |
Does the CT unit incorporate image reconstruction techniques for dose reduction? | ||||
Yes | 34 (7.7) | 184 (31.3) | 280 (50.3) | NA |
No | 3 (0.7) | 54 (9.2) | 45 (8.1) | NA |
Don't know | 0 | 15 (2.6) | 25 (4.5) | NA |
Missing | 405 (91.6) | 335 (57) | 207 (37.2) | NA |
Does the CT unit record patient radiation dose by exam (e.g., as a save screen on a PACS)? | ||||
Yes | NA | 185 (31.5) | 292 (52.4) | 224 (40.0) |
No | NA | 17 (2.9) | 17 (3.1) | 5 (0.9) |
Don't know | NA | 27 (4.6) | 29 (5.2) | 11 (2.0) |
Missing | NA | 359 (61.1) | 219 (39.3) | 320 (57.1) |
NA = not applicable; PACS = picture archiving and communication system.
Notes: 2022–2023 survey response data were available for 560 CT units across all jurisdictions with CT capacity.
Data were derived from the following survey questions: “Does the CT unit have dose management controls?”; “Does the modality make regularly use of dose management controls?”; “Does the CT unit incorporate image reconstruction techniques for dose reduction?”; “Does the CT unit record patient CT radiation dose (e.g., as a save screen on PACS)?”; “Do you capture patient cumulative radiation dose tracking?”; and “If no, do you plan to capture patient cumulative radiation tracking in the future?” A definition for PACS is provided in Appendix 2.
Table 24: Population Estimates and Projections for Canada by Province and Territory, 2007–2040
Province or territory | 2007 | 2015 | 2017 | 2020 | 2023 | 2025 (low- to high-growth projections) | 2030 (low- to high-growth projections) | 2035 (low- to high-growth projections) | 2040 (low- to high-growth projections) |
|---|---|---|---|---|---|---|---|---|---|
Number of people | |||||||||
Alberta | 3,533,414 | 4,163,048 | 4,253,530 | 4,412,013 | 4,591,100 | 4,761,500 (4,696,600 to 4,816,400) | 5,254,600 (5,040,300 to 5,411,900) | 5,739,800 (5,356,300 to 6,033,800) | 6,212,900 (5,654,900 to 6,714,200) |
British Columbia | 4,312,048 | 4,795,547 | 4,962,706 | 5,173,896 | 5,451,700 | 5,642,800 (5,541,600 to 5,729,700) | 6,027,500 (5,752,300 to 6,238,900) | 6,306,700 (5,855,000 to 6,653,900) | 6,541,200 (5,917,400 to 7,085,800) |
Manitoba | 1,191,684 | 1,298,120 | 1,340,426 | 1,381,809 | 1,414,400 | 1,445,300 (1,422,700 to 1,467,000) | 1,527,900 (1,460,300 to 1,582,600) | 1,611,300 (1,493,300 to 1,711,800) | 1,686,700 (1,520,100 to 1,852,900) |
New Brunswick | 746,136 | 759,971 | 768,029 | 783,814 | 804,300 | 816,400 (808,200 to 822,800) | 837,700 (813,900 to 853,700) | 848,700 (808,100 to 877,500) | 854,700 (798,100 to 902,100) |
Newfoundland and Labrador | 510,256 | 528,843 | 530,153 | 526,046 | 519,500 | 517,500 (512,500 to 522,000) | 510,100 (496,900 to 521,200) | 499,300 (477,700 to 517,200) | 486,300 (456,900 to 512,600) |
Northwest Territories | 43,286 | 44,443 | 44,825 | 44,395 | 46,300 | 47,100 (46,500 to 47,600) | 48,600 (46,900 to 49,900) | 49,500 (46,600 to 51,800) | 50,100 (46,100 to 54,000) |
Nova Scotia | 935,433 | 938,914 | 956,074 | 989,154 | 1,023,500 | 1,046,100 (1,032,900 to 1,058,600) | 1,079,200 (1,043,800 to 1,109,400) | 1,091,800 (1,033,100 to 1,142,000) | 1,097,600 (1,016,900 to 1,175,100) |
Nunavut | 31,560 | 36,602 | 37,829 | 39,581 | 40,200 | 41,000 (40,700 to 41,300) | 43,000 (42,100 to 43,700) | 45,300 (43,600 to 46,500) | 47,700 (45,200 to 49,700) |
Ontario | 12,807,497 | 13,759,762 | 14,610,084 | 14,757,582 | 15,372,100 | 15,837,800 (15,573,200 to 16,067,500) | 16,883,800 (16,134,300 to 17,446,900) | 17,807,200 (16,534,000 to 18,795,500) | 18,615,400 (16,830,000 to 20,232,300) |
Prince Edward Island | 138,020 | 144,949 | 150,595 | 159,179 | 171,800 | 177,400 (174,300 to 179,900) | 187,700 (179,200 to 193,600) | 196,600 (182,200 to 207,200) | 204,400 (184,400 to 222,000) |
Quebec | 7,712,616 | 8,190,074 | 8,326,075 | 8,551,865 | 8,746,600 | 8,859,200 (8,757,800 to 8,953,600) | 9,080,500 (8,802,700 to 9,298,900) | 9,256,500 (8,788,300 to 9,621,900) | 9,396,500 (8,739,100 to 9,970,200) |
Saskatchewan | 1,007,305 | 1,125,588 | 1,151,044 | 1,165,963 | 1,199,500 | 1,226,100 (1,208,100 to 1,239,500) | 1,311,100 (1,251,800 to 1,349,100) | 1,398,300 (1,292,400 to 1,472,700) | 1,479,800 (1,327,800 to 1,608,600) |
Yukon | 32,663 | 37,730 | 39,705 | 42,109 | 45,000 | 46,500 (45,900 to 47,000) | 48,900 (47,600 to 50,200) | 50,100 (47,500 to 52,300) | 50,900 (47,200 to 54,300) |
Canada | 33,001,918 | 35,823,491 | 36,722,075 | 38,027,406 | 39,426,000 | 40,647,000 (39,861,100 to 40,992,800) | 42,840,800 (41,111,900 to 44,150,000) | 44,901,100 (41,958,100 to 47,184,200) | 46,724,200 (42,584,000 to 50,433,700) |
Note: Data were retrieved from the Statistics Canada website.26
Table 25: Reported and Projected Numbers of CT Units by Province and Territory, 2007–2040
Province or territory | 2007 | 2015 | 2017 | 2020 | 2023 | 2025 (low- to high-growth projections) | 2030 (low- to high-growth projections) | 2035 (low- to high-growth projections) | 2040 (low- to high-growth projections) |
|---|---|---|---|---|---|---|---|---|---|
Alberta | 41.0 | 50.0 | 56.0 | 55.0 | 53.0 | 55.0 (54.2 to 55.6) | 60.7 (58.2 to 62.5) | 66.3 (61.8 to 69.7) | 71.7 (65.3 to 77.5) |
British Columbia | 49.0 | 65.0 | 67.0 | 69.0 | 75.0 | 77.6 (76.2 to 78.8) | 82.9 (79.1 to 85.8) | 86.8 (80.5 to 91.5) | 90.0 (81.4 to 97.5) |
Manitoba | 19.0 | 19.0 | 23.0 | 22.0 | 24.0 | 24.5a (24.1 to 24.9) | 25.9a (24.8 to 26.9) | 27.3 (25.3 to 29.0) | 28.6 (25.8 to 31.4) |
New Brunswick | 15.0 | 14.0 | 15.0 | 17.0 | 15.0 | 15.2 (15.1 to 15.3) | 15.6 (15.2 to 15.9) | 15.8 (15.1 to 16.4) | 15.9 (14.9 to 16.8) |
Newfoundland and Labrador | 11.0 | 16.0 | 16.0 | 15.0 | 16.0 | 15.9 (15.8 to 16.1) | 15.7 (15.3 to 16.1) | 15.4 (14.7 to 15.9) | 15.0 (14.1 to 15.8) |
Northwest Territories | 0.0 | 1.0 | 1.0 | 1.0 | 1.0 | 1.0 (1.0 to 1.0) | 1.0 (1.0 to 1.1) | 1.1 (1.0 to 1.1) | 1.1 (1.0 to 1.2) |
Nova Scotia | 16.0 | 21.0 | 18.0 | 17.0 | 18.0 | 18.4 (18.2 to 18.6) | 19.0 (18.4 to 19.5) | 19.2 (18.2 to 20.1) | 19.3 (17.9 to 20.7) |
Nunavut | 0.0 | 1.0 | 1.0 | 1.0 | 1.0 | 1.0 (1.0 to 1.0) | 1.1 (1.0 to 1.1) | 1.1 (1.1 to 1.2) | 1.2 (1.1 to 1.2) |
Ontario | 130.0 | 186.0 | 184.0 | 169.0 | 192.0 | 197.8 (194.5 to 200.7) | 210.9 (201.5 to 217.9) | 222.4 (206.5 to 234.8) | 232.5 (210.2 to 252.7) |
Prince Edward Island | 2.0 | 2.0 | 2.0 | 2.0 | 2.0 | 2.1 (2.0 to 2.1) | 2.2 (2.1 to 2.3) | 2.3 (2.1 to 2.4) | 2.4 (2.1 to 2.6) |
Quebec | 119.0 | 146.0 | 163.0 | 164.0 | 144.0 | 145.9 (144.2 to 147.4) | 149.5 (144.9 to 153.1) | 152.4 (144.7 to 158.4) | 154.7 (143.9 to 164.1) |
Saskatchewan | 15.0 | 16.0 | 15.0 | 16.0 | 18.0 | 18.4 (18.1 to 18.6) | 19.7 (18.8 to 20.2) | 21.0 (19.4 to 22.1) | 22.2 (19.9 to 24.1) |
Yukon | 1.0 | 1.0 | 1.0 | 1.0 | 1.0 | 1.0 (1.0 to 1.0) | 1.1 (1.1 to 1.1) | 1.1 (1.1 to 1.2) | 1.1 (1.0 to 1.2) |
Canada | 418.0 | 538.0 | 562.0 | 549.0 | 560.0 | 574.8 (566.2 to 582.3) | 608.5 (583.9 to 627.1) | 637.8 (596.0 to 670.2) | 663.7 (604.9 to 716.4) |
Note: The projection was calculated as the product of the numbers of per capita units in 2022 to 2023 and the population projections in 2025, 2030, 2035, and 2040. The numbers of imaging units were provided by provincial or territorial validators in 2023. The population projections were retrieved from the Statistics Canada website on January 18, 2024.26 The population projection assumed medium, low, and high growth.
aProjected unit count does not include anticipated new installation of CT units by 2030.
Table 26: Reported and Projected Numbers of CT Exams by Province and Territory, 2007–2040
Province or territory | 2007 | 2015 | 2017 | 2020 | 2023 | 2025 (low- to high-growth projections) | 2030 (low- to high-growth projections) | 2035 (low- to high-growth projections) | 2040 (low- to high-growth projections) |
|---|---|---|---|---|---|---|---|---|---|
Alberta | 367,557 | 382,300 | 405,332 | 447,069 | 520,507 | 539,825.8 (532,467.9 to 546,049.9) | 595,730.0 (571,434.2 to 613,563.6) | 650,738.6 (607,260.1 to 684,070.3) | 704,375.4 (641,113.2 to 761,209.3) |
British Columbia | 375,238 | 634,530 | 695,248 | 805,584 | 923,990 | 956,377.9 (939,225.8 to 971,106.2) | 1,021,579.3 (974,936.6 to 1,057,409.7) | 1,068,900.9 (992,342.9 to 1,127,745.5) | 1,108,644.4 (1,002,919.8 to 1,200,946.7) |
Manitoba | 131,090 | 173,299 | 186,197 | 240,269 | 260,661 | 266,355.6 (262,190.6 to 270,354.7) | 281,578.0 (269,120.0 to 291,658.7) | 296,947.9 (275,201.5 to 315,469.1) | 310,843.4 (280,140.5 to 341,472.5) |
New Brunswick | 132,199 | 130,984 | 142,294 | 162,322 | 177,477 | 180,147.0 (178,337.6 to 181,559.2) | 184,847.1 (179,595.3 to 188,377.6) | 187,274.3 (178,315.5 to 193,629.3) | 188,598.3 (176,108.9 to 199,057.6) |
Newfoundland and Labrador | 68,434 | 115,552 | 90,985 | 98,967 | 105,441 | 105,035.1 (104,020.2 to 105,948.4) | 103,533.1 (100,854.0 to 105,786.0) | 101,341.1 (96,957.0 to 104,974.2) | 98,702.5 (92,735.3 to 104,040.5) |
Northwest Territories | 0 | NA | 4,695 | 5,335 | 8,115 | 8,255.2 (8,150.1 to 8,342.9) | 8,518.1 (8,220.2 to 8,746.0) | 8,675.9 (8,167.6 to 9,079.0) | 8,781.0 (8,079.9 to 9,464.6) |
Nova Scotia | 130,818 | 157,290 | 155,099 | 170,603 | 166,268 | 169,939.4 (167,795.0 to 171,970.0) | 175,316.5 (169,565.7 to 180,222.5) | 177,363.4 (167,827.5 to 185,518.4) | 178,305.6 (165,195.8 to 190,895.5) |
Nunavut | 0 | NA | 2,000 | 3,081 | 4,336 | 4,422.3 (4,389.9 to 4,454.6) | 4,638.0 (4,540.9 to 4,713.5) | 4,886.1 (4,702.7 to 5,015.5) | 5,145.0 (4,875.3 to 5,360.7) |
Ontario | 1,198,705 | 1,871,160 | 2,430,739 | 1,842,982 | 2,383,569 | 2,455,780.6 (2,414,751.2 to 2,491,396.4) | 2,617,970.4 (2,501,574.3 to 2,705,283.6) | 2,761,151.0 (2,563,731.0 to 2,914,395.0) | 2,886,469.0 (2,609,628.2 to 3,137,182.5) |
Prince Edward Island | 9,655 | 13,576 | 15,811 | 19,349 | 25,368 | 26,194.9 (25,737.2 to 26,564.1) | 27,715.8 (26,460.7 to 28,587.0) | 29,030.0 (26,903.7 to 30,595.2) | 30,181.7 (27,228.5 to 32,780.5) |
Quebec | 837,246 | 1,656,662 | 1,350,792 | 1,483,373 | 1,658,575 | 1,679,927.8 (1,660,699.8 to 1,697,827.4) | 1,721,891.8 (1,669,213.0 to 1,763,305.9) | 1,755,265.8 (1,666,482.4 to 1,824,553.9) | 1,781,812.4 (1,657,153.8 to 1,890,600.3) |
Saskatchewan | 129,777 | 139,488 | 128,415 | 109,418 | 144,903 | 148,116.4 (145,941.9 to 149,735.1) | 158,384.6 (151,221.0 to 162,975.1) | 168,918.6 (156,125.6 to 177,906.3) | 178,764.0 (160,402.0 to 194,323.4) |
Yukon | 2,099 | 3,500 | 3,500 | 4,700 | 6,455 | 6,670.2 (6,584.1 to 6,741.9) | 7,014.4 (6,784.9 to 7,200.9) | 7,186.6 (6,813.6 to 7,502.1) | 7,301.3 (6,770.6 to 7,789.0) |
Canada | 3,382,818 | 5,278,341 | 5,611,107 | 5,393,052 | 6,385,665 | 6,553,898.91 (6,456,136.3 to 6,639,433.1) | 6,938,745.9 (6,658,723.2 to 7,150,791.6) | 7,272,444.1 (6,795,778.7 to 7,642,228.3) | 7,567,724.1 (6,897,153.1 to 8,168,536.3) |
NA = not available.
Note: The projection was calculated as the product of the numbers of per capita exams in 2022 to 2023 and the population projections in 2025, 2030, 2035, and 2040. The numbers of imaging exams were provided by provincial or territorial validators in 2023. The population projections were retrieved from the Statistics Canada website on January 18, 2024.26 The population projection assumed medium, low, and high growth.
Appendix 4: Supplementary Summary Tables for Publicly Funded Sites With CT Units, 2022–2023
Note that this appendix has not been copy-edited.
Table 27: Average Hours per Day of CT Use at Publicly Funded Sites by Province and Territory, 2022–2023
Province or territory | Number of reporting sites | Mean hours | Median hours (minimum to maximum) |
|---|---|---|---|
Alberta | 37 | 11.8 | 9 (8 to 24) |
British Columbia | 34 | 15.62 | 16 (7 to 24) |
Manitoba | 16 | 13.0 | 14 (6 to 24) |
New Brunswick | 8 | 13.38 | 12.5 (8 to 24) |
Newfoundland and Labrador | 9 | 10.22 | 10 (7 to 16) |
Northwest Territories | 1 | 10 | 10 (10 to 10) |
Nova Scotia | 7 | 14.57 | 13 (9 to 24) |
Nunavut | 1 | 8.0 | 8 (8 to 8) |
Ontario | 53 | 16.77 | 16 (7 to 24) |
Prince Edward Island | 2 | 13.5 | 13.5 (10 to 17) |
Quebec | 21 | 14.29 | 14 (7 to 24) |
Saskatchewan | 13 | 13.62 | 16 (8 to 24) |
Yukon | 1 | 10.0 | 10 (10 to 10) |
Canada | 203 | 14.6 | 15 (6 to 24) |
Notes: 203 out of 204 sites that reported information for CT daily operation identified as public facilities.
Data were derived from the following survey question: “In an average 24-hour day, how many hours are the units staffed through regular scheduled service capacity (do not include hours where staff are only on call)?”
Table 28: Average Hours per Week of CT Use at Publicly Funded Sites by Province and Territory, 2022–2023
Province or territory | Number of reporting sites | Mean hours | Median hours (minimum to maximum) |
|---|---|---|---|
Alberta | 37 | 70.3 | 47 (38 to 168) |
British Columbia | 34 | 103.71 | 111 (33 to 168) |
Manitoba | 16 | 91 | 96 (40 to 168) |
New Brunswick | 8 | 84.88 | 80.5 (38 to 168) |
Newfoundland and Labrador | 10 | 57.6 | 53 (35 to 112) |
Northwest Territories | 1 | 48 | 48 (48 to 48) |
Nova Scotia | 7 | 101.43 | 95 (45 to 168) |
Nunavut | 1 | 38 | 38 (38 to 38) |
Ontario | 53 | 106.58 | 105 (4 to 168) |
Prince Edward Island | 2 | 75.5 | 75.5 (50 to 101) |
Quebec | 21 | 96.43 | 98 (35 to 168) |
Saskatchewan | 13 | 86.38 | 96 (40 to 168) |
Yukon | 1 | 50 | 50 (50 to 50) |
Canada | 204 | 91.3 | 96 (4 to 168) |
Notes: Overall, 204 out of 205 sites that reported information for CT weekly operation identified as public facilities.
Data were derived from the following survey question: “In an average 168-hour week, how many hours are the [modality] units staffed through regular scheduled service capacity (do not include hours where staff are only on call)?”
Table 29: Average Age of Publicly Funded CT Imaging Equipment, 2022–2023
Province or territory | Number of CT units | Average age CT (years, minimum to maximum) |
|---|---|---|
Alberta | 50 | 8.7 (0 to 17) |
British Columbia | 51 | 7 (0 to 18) |
Manitoba | 24 | 8 (2 to 16) |
New Brunswick | 12 | 9.8 (2 to 18) |
Newfoundland and Labrador | 9 | 7.7 (0 to 14) |
Northwest Territories | 1 | 7 (7 to 7) |
Nova Scotia | 17 | 9 (1 to 16) |
Nunavut | 1 | 9 (9 to 9) |
Ontario | 87 | 7.4 (0 to 18) |
Prince Edward Island | 2 | 5 (3 to 7) |
Quebec | 60 | 10.2 (1 to 23) |
Saskatchewan | 16 | 7.4 (1 to 15) |
Yukon | 1 | 0 (0 to 0) |
Canada | 331 | 8.2 (0 to 23) |
Notes: 331 out of 332 CT units with information reported for operational age were located at public facilities.
Age for each unit was calculated from the following survey question: “What year did (or will) the [modality] unit become operational?” subtracted from 2023.
ISSN: 2563-6596
Disclaimer: The information in this document is intended to help Canadian health care decision-makers, health care professionals, health systems leaders, and policy-makers make well-informed decisions and thereby improve the quality of health care services. While patients and others may access this document, the document is made available for informational purposes only and no representations or warranties are made with respect to its fitness for any particular purpose. The information in this document should not be used as a substitute for professional medical advice or as a substitute for the application of clinical judgment in respect of the care of a particular patient or other professional judgment in any decision-making process. The Canadian Agency for Drugs and Technologies in Health (CADTH) does not endorse any information, drugs, therapies, treatments, products, processes, or services.
While care has been taken to ensure that the information prepared by CADTH in this document is accurate, complete, and up-to-date as at the applicable date the material was first published by CADTH, CADTH does not make any guarantees to that effect. CADTH does not guarantee and is not responsible for the quality, currency, propriety, accuracy, or reasonableness of any statements, information, or conclusions contained in any third-party materials used in preparing this document. The views and opinions of third parties published in this document do not necessarily state or reflect those of CADTH.
CADTH is not responsible for any errors, omissions, injury, loss, or damage arising from or relating to the use (or misuse) of any information, statements, or conclusions contained in or implied by the contents of this document or any of the source materials.
This document may contain links to third-party websites. CADTH does not have control over the content of such sites. Use of third-party sites is governed by the third-party website owners’ own terms and conditions set out for such sites. CADTH does not make any guarantee with respect to any information contained on such third-party sites and CADTH is not responsible for any injury, loss, or damage suffered as a result of using such third-party sites. CADTH has no responsibility for the collection, use, and disclosure of personal information by third-party sites.
Subject to the aforementioned limitations, the views expressed herein are those of CADTH and do not necessarily represent the views of Canada’s federal, provincial, or territorial governments, or any third-party supplier of information.
This document is prepared and intended for use in the context of the Canadian health care system. The use of this document outside of Canada is done so at the user’s own risk.
This disclaimer and any questions or matters of any nature arising from or relating to the content or use (or misuse) of this document will be governed by and interpreted in accordance with the laws of the Province of Ontario and the laws of Canada applicable therein, and all proceedings shall be subject to the exclusive jurisdiction of the courts of the Province of Ontario, Canada.
The copyright and other intellectual property rights in this document are owned by CADTH and its licensors. These rights are protected by the Canadian Copyright Act and other national and international laws and agreements. Users are permitted to make copies of this document for noncommercial purposes only, provided it is not modified when reproduced and appropriate credit is given to CADTH and its licensors.
About CADTH: CADTH is an independent, not-for-profit organization responsible for providing Canada’s health care decision-makers with objective evidence to help make informed decisions about the optimal use of drugs, medical devices, diagnostics, and procedures in our health care system.
Funding: CADTH receives funding from Canada’s federal, provincial, and territorial governments, with the exception of Quebec.
Questions or requests for information about this report can be directed to Requests@CADTH.ca.