CADTH Health Technology Review
Canadian Medical Imaging Inventory 2022–2023: PET-CT and PET-MRI
CMII Report
Abbreviations
AI
artificial intelligence
CDST
clinical decision support tool
CIHI
Canadian Institute for Health Information
CMII
Canadian Medical Imaging Inventory
FTE
full-time equivalent
MRT
medical radiation technologist
OECD
Organisation for Economic Co-operation and Development
PACS
picture archiving and communication system
PSMA
prostate-specific membrane antigen
Key Messages
PET-CT Imaging
PET-CT is an advanced imaging technique that combines PET with CT to measure metabolic or biochemical activity in the human body.
Sixty PET-CT units in 9 provinces were identified by the Canadian Medical Imaging Inventory (CMII) in its 2022–2023 national survey. All units are located in urban centres.
Canada has 1.5 PET-CT units per million people. The greatest density of units per million people is in Quebec, New Brunswick, and Newfoundland and Labrador.
Approximately 156,320 publicly funded PET-CT examinations were performed in the 2022–2023 fiscal year. This represents a national average of 3.9 exams per 1,000 people, an increase of 18.2% since 2019–2020.
PET-CT was reported to have the largest demand in oncology (66.1%), followed by cardiology (13.2%) and neurology (10.1%). Applications for PET-CT continue to expand to new clinical indications and therapeutic areas.
The upfront capital and ongoing operational costs of PET-CT units, as well as the costs of radiopharmaceutical products and equipment, may act as barriers to the rapid adoption of this technology.
Canada is positioned in the bottom 25% of Organisation for Economic Co-operation and Development (OECD) countries in units per million population and the bottom 50% of OECD countries for average volume of publicly funded PET-CT exams per 1,000 population.
The average age of PET-CT equipment in Canada is 7.2 years; 51.5% of PET-CT units are 5 years old or newer, 21.2% are 6 to 10 years old, and 27.3% are more than 10 years old.
Radiotracers are essential in PET imaging.1 The most commonly used PET-CT radiotracers are for oncology: 91% of sites reported using fluorodeoxyglucose F18 and 31.8% of sites reported using gallium-68 DOTA-TATE.
The production of most radiotracers requires the use of a cyclotron.1 Overall, 21.7% of PET-CT sites reported local proximity to a cyclotron, reflecting a disparity in the access to and growing demand for radiotracer supply.
PET-MRI Imaging
PET-MRI is a technique that combines PET with MRI to produce highly detailed imaging of soft tissues in the human body.
PET-MRI is almost exclusively used for research purposes in Canada; therefore, data are limited for this modality.
Six PET-MRI units were identified in Canada across 3 provinces, representing a national average of 0.2 units per million people.
The average age of PET-MRI equipment in Canada is 6.7 years; 2 units are 6 to 10 years old, and 1 unit is 5 years old.
What Is the Context?
PET is the most specific and sensitive technique for imaging metabolic or biochemical activity in the human body.2 PET scans combine the use of radiopharmaceuticals with sensitive imaging cameras to detect areas of atypical activity within a particular organ or tissue (Appendix 1).3,4 PET is recognized as a unique imaging modality with proven value in the field of oncology to detect, stage, and monitor cancers, and is also used in other fields, such as neurology and cardiology.2,5,6
Single-modality PET has largely been superseded in clinical practice by the hybrid modality of PET-CT.4 PET-CT combines the imaging capabilities of PET and CT into a single piece of equipment, allowing for high-resolution 3D imaging that supports more accurate diagnosis and treatment.7 More recently, a hybrid of PET and MRI has been developed, which exposes patients to less iodizing radiation than PET-CT. Combining the strengths of both imaging modalities enables PET-MRI to provide finer visualization of certain soft tissues and reduces radiation exposure.8,9 PET-MRI is still largely used for research purposes in Canada.
Evidence shows that PET-CT can more accurately inform the staging of cancers and influence treatment and management strategies compared to other imaging modalities, possibly leading to improved quality of care for patients and better utilization of medical resources.1
While it is known that PET-CT can lead to cost-savings by avoiding unnecessary imaging tests, biopsies, and treatments,1 the adoption and ongoing use of PET-CT remains challenged by the upfront capital and ongoing operation costs of equipment.16 With increased wait times for PET-CT services, there are concerns about whether Canada’s inventory of PET-CT units can accommodate current demand. As demand increases, there are also concerns about future capacity, due to factors such as an aging population, growing incidence of cancer and other diseases, and technological advancements that expand the uses of PET-CT.1,10
Human resource capacity, geography, and availability of and access to radiopharmaceutical products further challenge the adoption of PET services. Radiopharmaceuticals have a short half-life and therefore production and reliable transportation are expensive, and access is limited by proximity to urban settings.10-12
As PET-CT and PET-MRI imaging modalities advance, decision-makers and clinicians face complex procurement and implementation decisions within the context of a finite health care budget and limited availability of clinical and technical expertise.
To better understand the medical imaging landscape in Canada, the CMII was created in 2015 to track, compare, and map trends over time related to the availability, distribution, technical specifications, and use of advanced imaging equipment (i.e., CT, MRI, PET-CT, PET-MRI, SPECT, and SPECT-CT) in Canada. The CMII collects data through a survey conducted approximately once every 2 years and details the use of strategies for improving appropriate imaging, enhancing system efficiencies, reducing wait lists, and addressing other systemic challenges. Through this work, the CMII provides health care decision-makers with information on the imaging landscape in Canada that may be used to identify and address service and medical equipment gaps and inform strategic planning.
This report summarizes the PET-CT and PET-MRI related findings of the 2022–2023 national CMII survey.
What Did We Do?
The purpose of this CMII report is to document current practices and developments in the supply, distribution, technical operations, and general clinical use of PET-CT and PET-MRI across jurisdictions. This report is 1 component of a series of publications produced as part of the CMII national survey that also includes CT, MRI, SPECT, and SPECT-CT.
This is the fourth iteration of the CMII since CADTH resumed the collection of these data in 2015.13-15 Previously, the Canadian Institute for Health Information (CIHI) collected data on medical imaging technologies in Canada, from 2003 to 2012.16-19
Why Did We Do This?
We maintain the CMII to provide information on the medical imaging landscape across Canada to help support health care decision-making. Robust data are required to ensure health systems can deliver the imaging required to provide timely, safe, patient-centred care; improve health outcomes; and deliver health care efficiencies. Further details on the purpose of the CMII are provided in the Canadian Medical Imaging Inventory 2022–2023: Provincial and Territorial Overview report, located on the CMII webpage.
Methods Overview
Data were primarily collected on 6 imaging modalities, including PET-CT and PET-MRI, using a web-based self-report survey (refer to the Canadian Medical Imaging Inventory 2022–2023: Methods document). Data were supplemented with information from provincial and territorial validators who are senior medical imaging–related health care decision-makers. In addition, data from peer reviewers, literature searches, and CIHI, as well as previous iterations of CMII data, were incorporated into the report. Both English and French versions of the survey were provided.
The CMII survey collected the following data:
number and location of imaging equipment
volume of exams
hours of equipment operation
age of imaging equipment
technical specifications of machines
adoption of new and emerging supportive tools and technologies
imaging storing and communication services.
The survey opened on May 5, 2023, and primary data collection and validator responses were collected until October 31, 2023. The full data collection and analysis strategy, including survey development, respondent identification, sources of data used, and data validation procedures can be found in the Canadian Medical Imaging Inventory 2022–2023: Methods document on the CMII webpage.
The CMII also presents data from both the survey and other sources relating to human resources, funding structures, ordering and referral practices, and the adoption of tools that may support appropriate imaging, system efficiencies, and wait-list reductions.
Comparisons between Canadian data and data from other OECD countries are reported, as are trends and projections on imaging capacity.
Response Rate for the 2022–2023 National Survey
A total of 504 sites were invited to participate in the survey. A 100% participation rate was received from publicly funded facilities (i.e., hospitals) in 9 provinces and territories. The participation rate for the remaining provinces ranged from 51% to 93% for publicly funded facilities.
A complete response rate was received for unit counts and exam volumes by provincial and territorial validators for 467 sites (92.7%), while the response rate varied for other survey questions. A total of 308 sites provided updated or new information (72%), reflecting an increased response rate of 34% since the CMII 2019–2020 survey.
While the overall survey participation rate was high, in some instances, not all survey questions were answered. This may lead to a nonresponse bias, which may result in the overgeneralization of some findings. To enable readers to assess the representativeness of each data point, the number of sites that responded to each question are included alongside the reported data in this report.
Provincial and territorial validators provided high-level information for nonresponding publicly funded health facilities. Data obtained from the previous survey iteration and from other sources (e.g., personal communications, websites of health care facilities) were used to inform the status of the remaining sites. Data from free-standing sites with private imaging capacity supplemented data for public capacity; detailed information for private imaging facilities is limited due to the low number of survey responses.
The survey questions and full data collection and analysis strategy, including survey development, respondent identification, sources of data used, and data validation procedures can be found in the Canadian Medical Imaging Inventory 2022–2023: Methods document. Definitions of the types of facilities included in the survey are provided in Appendix 2.
PET-CT and PET-MRI Imaging Facility Overview
Characteristics of Facilities With PET-CT or PET-MRI Equipment
A summary of the geographic distribution, type, location, and funding source of facilities in Canada with PET-CT or PET-MRI equipment that responded to the 2022–2023 survey is as follows.
Sixty PET-CT units were distributed across 52 sites in 9 provinces (Figure 1).
Six PET-MRI units were distributed across 6 sites in 3 provinces (Figure 1).
Figure 1: Geographic Distribution of PET-CT and PET-MRI Units in Canada, 2022 to 2023
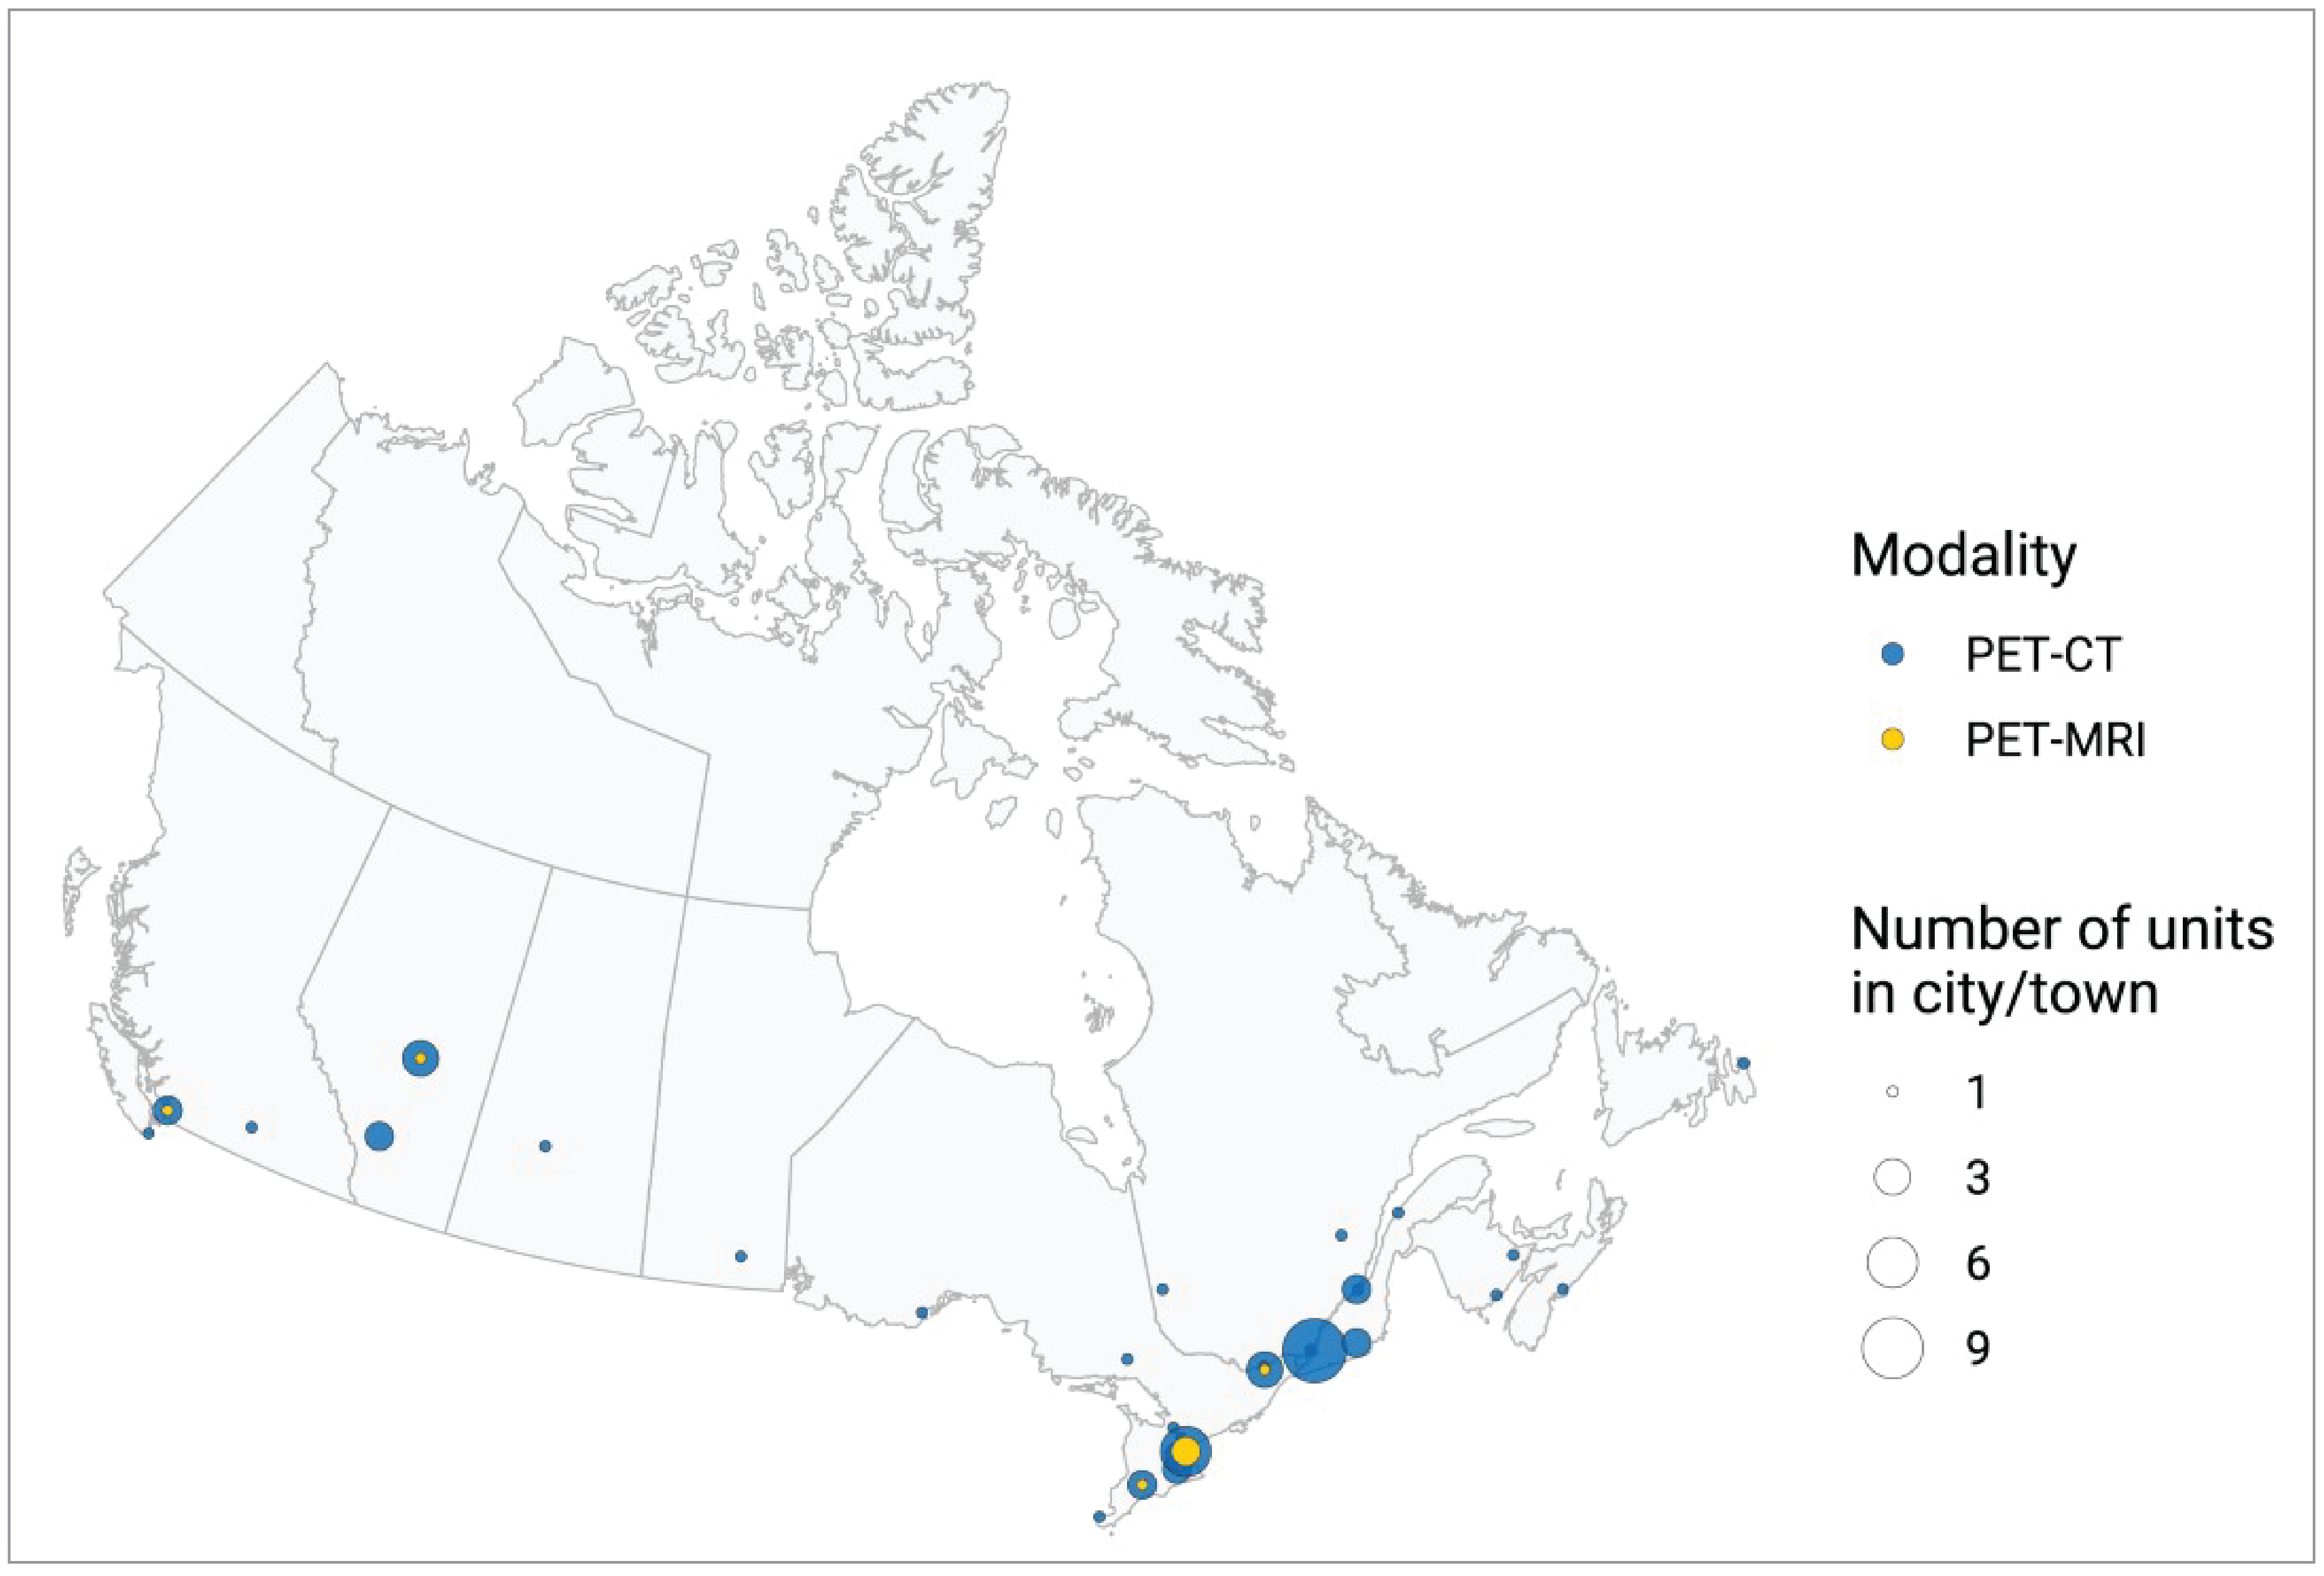
Notes: Location information was available for all units across all jurisdictions with PET-CT and PET-MRI capacity. Location was derived from the survey and validator data. Mobile units appear as 1 unit at each of the sites served.
Location and Facility Characteristics of PET-CT Units
All PET-CT units were in urban areas across 9 provinces (Appendix 3, Table 8). Prince Edward Island, the Northwest Territories, Nunavut, and Yukon all reported that they did not operate PET-CT equipment.
Overall, 62.7% of sites with PET-CT units reported that they were hospitals, 23.5% reported that they were tertiary care centres, and 13.7% identified as private facilities (Figure 2 and Appendix 3, Table 9). Data came from 51 sites with responses to this survey question. Definitions for the type of facility included in the survey are provided in Appendix 2.
In total, 84% of sites reported being publicly funded, 10% reported private funding, and 6% reported receiving funds from both public and private sources (Figure 3 and Appendix 3, Table 10). Data came from 50 sites that responded to this survey question.
Figure 2: Types of PET-CT Imaging Facilities in Canada, 2022 to 2023
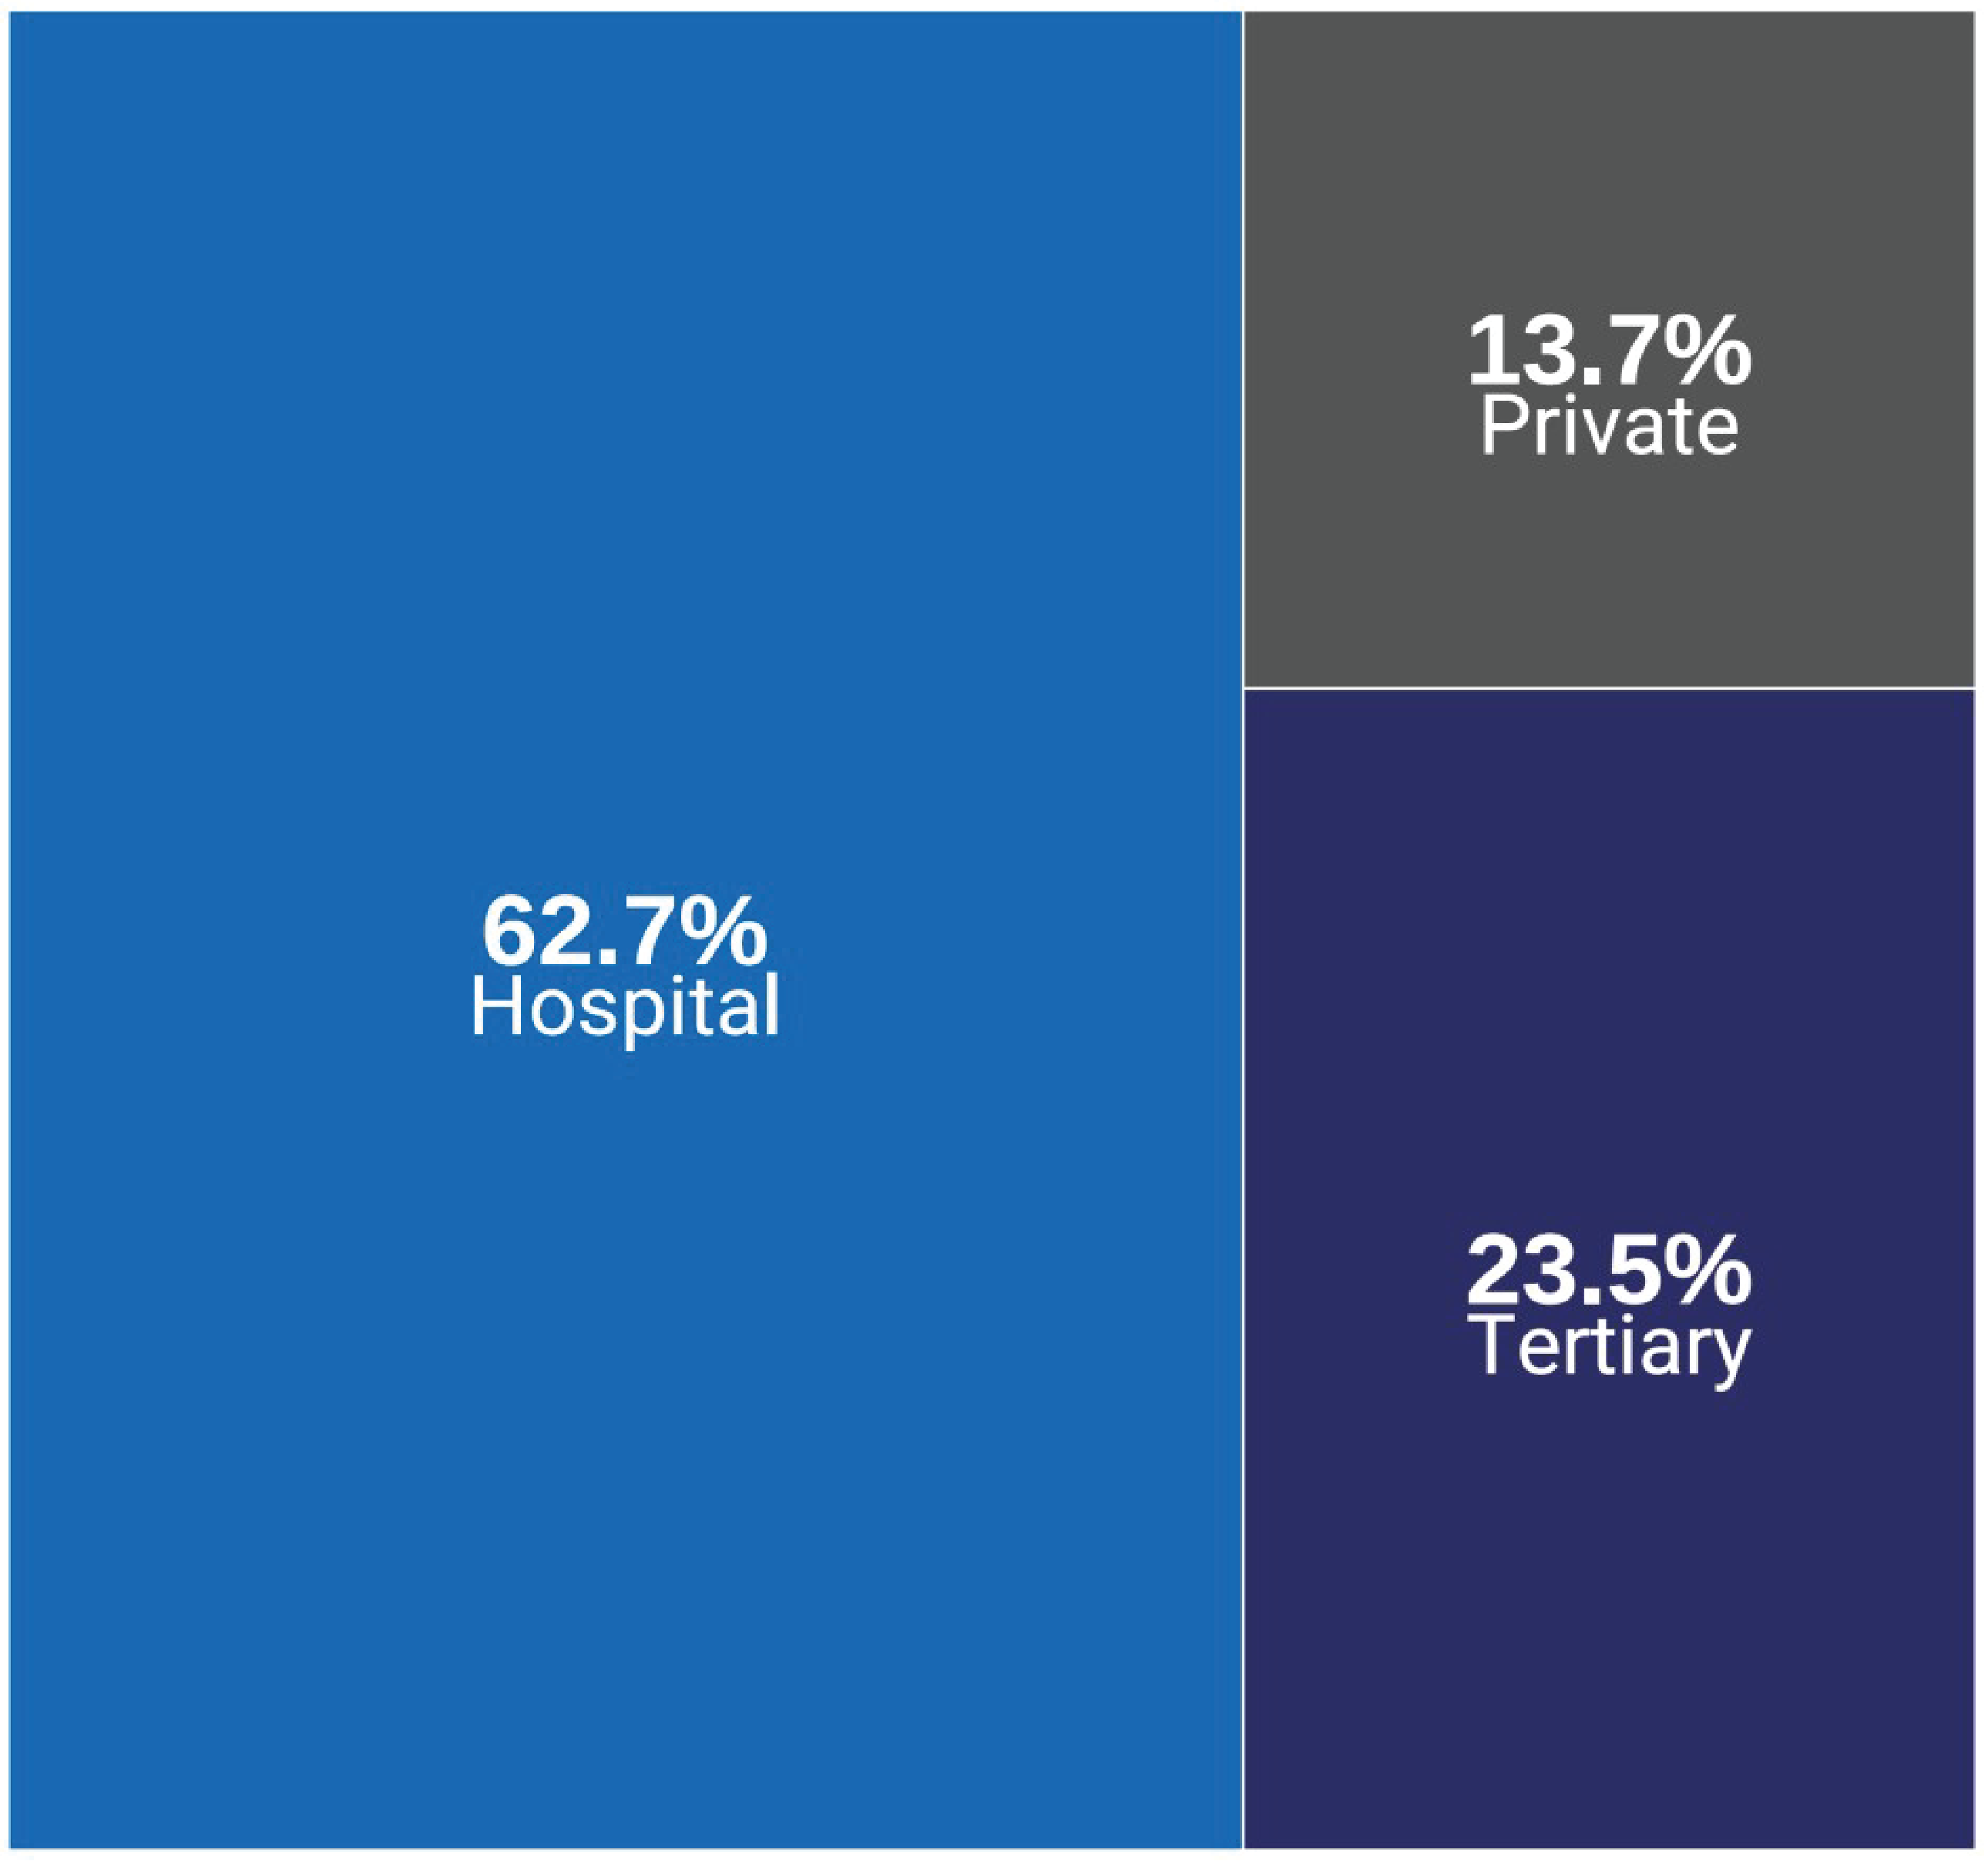
Notes: Survey response data were available for 51 out of 52 sites across all jurisdictions with PET-CT capacity.
Data were derived from the following survey question: “What type of facility is this?”
Survey responses for facility type from private sites were limited due to a low response rate.
Data summaries by province and territory are available in Appendix 3, Table 9.
Figure 2 presents the number of sites as proportions according to facility type of all reported sites.
Definitions for each type of facility are provided in Appendix 2.
Location and Facility Characteristics of PET-MRI Units
All PET-MRI units operate in urban areas across 3 provinces: Alberta, British Columbia, and Ontario.
Overall, 66.7% of sites with PET-MRI units reported that they were hospitals, and 33.3% reported that they were tertiary care centres. Data came from 4 sites that responded to this survey question.
Among the 3 sites in Alberta, British Columbia, and Ontario that reported the sources of funding, all sites reported receiving public funding.
Figure 3: Sources of Funding for PET-CT Imaging Facilities, 2022 to 2023
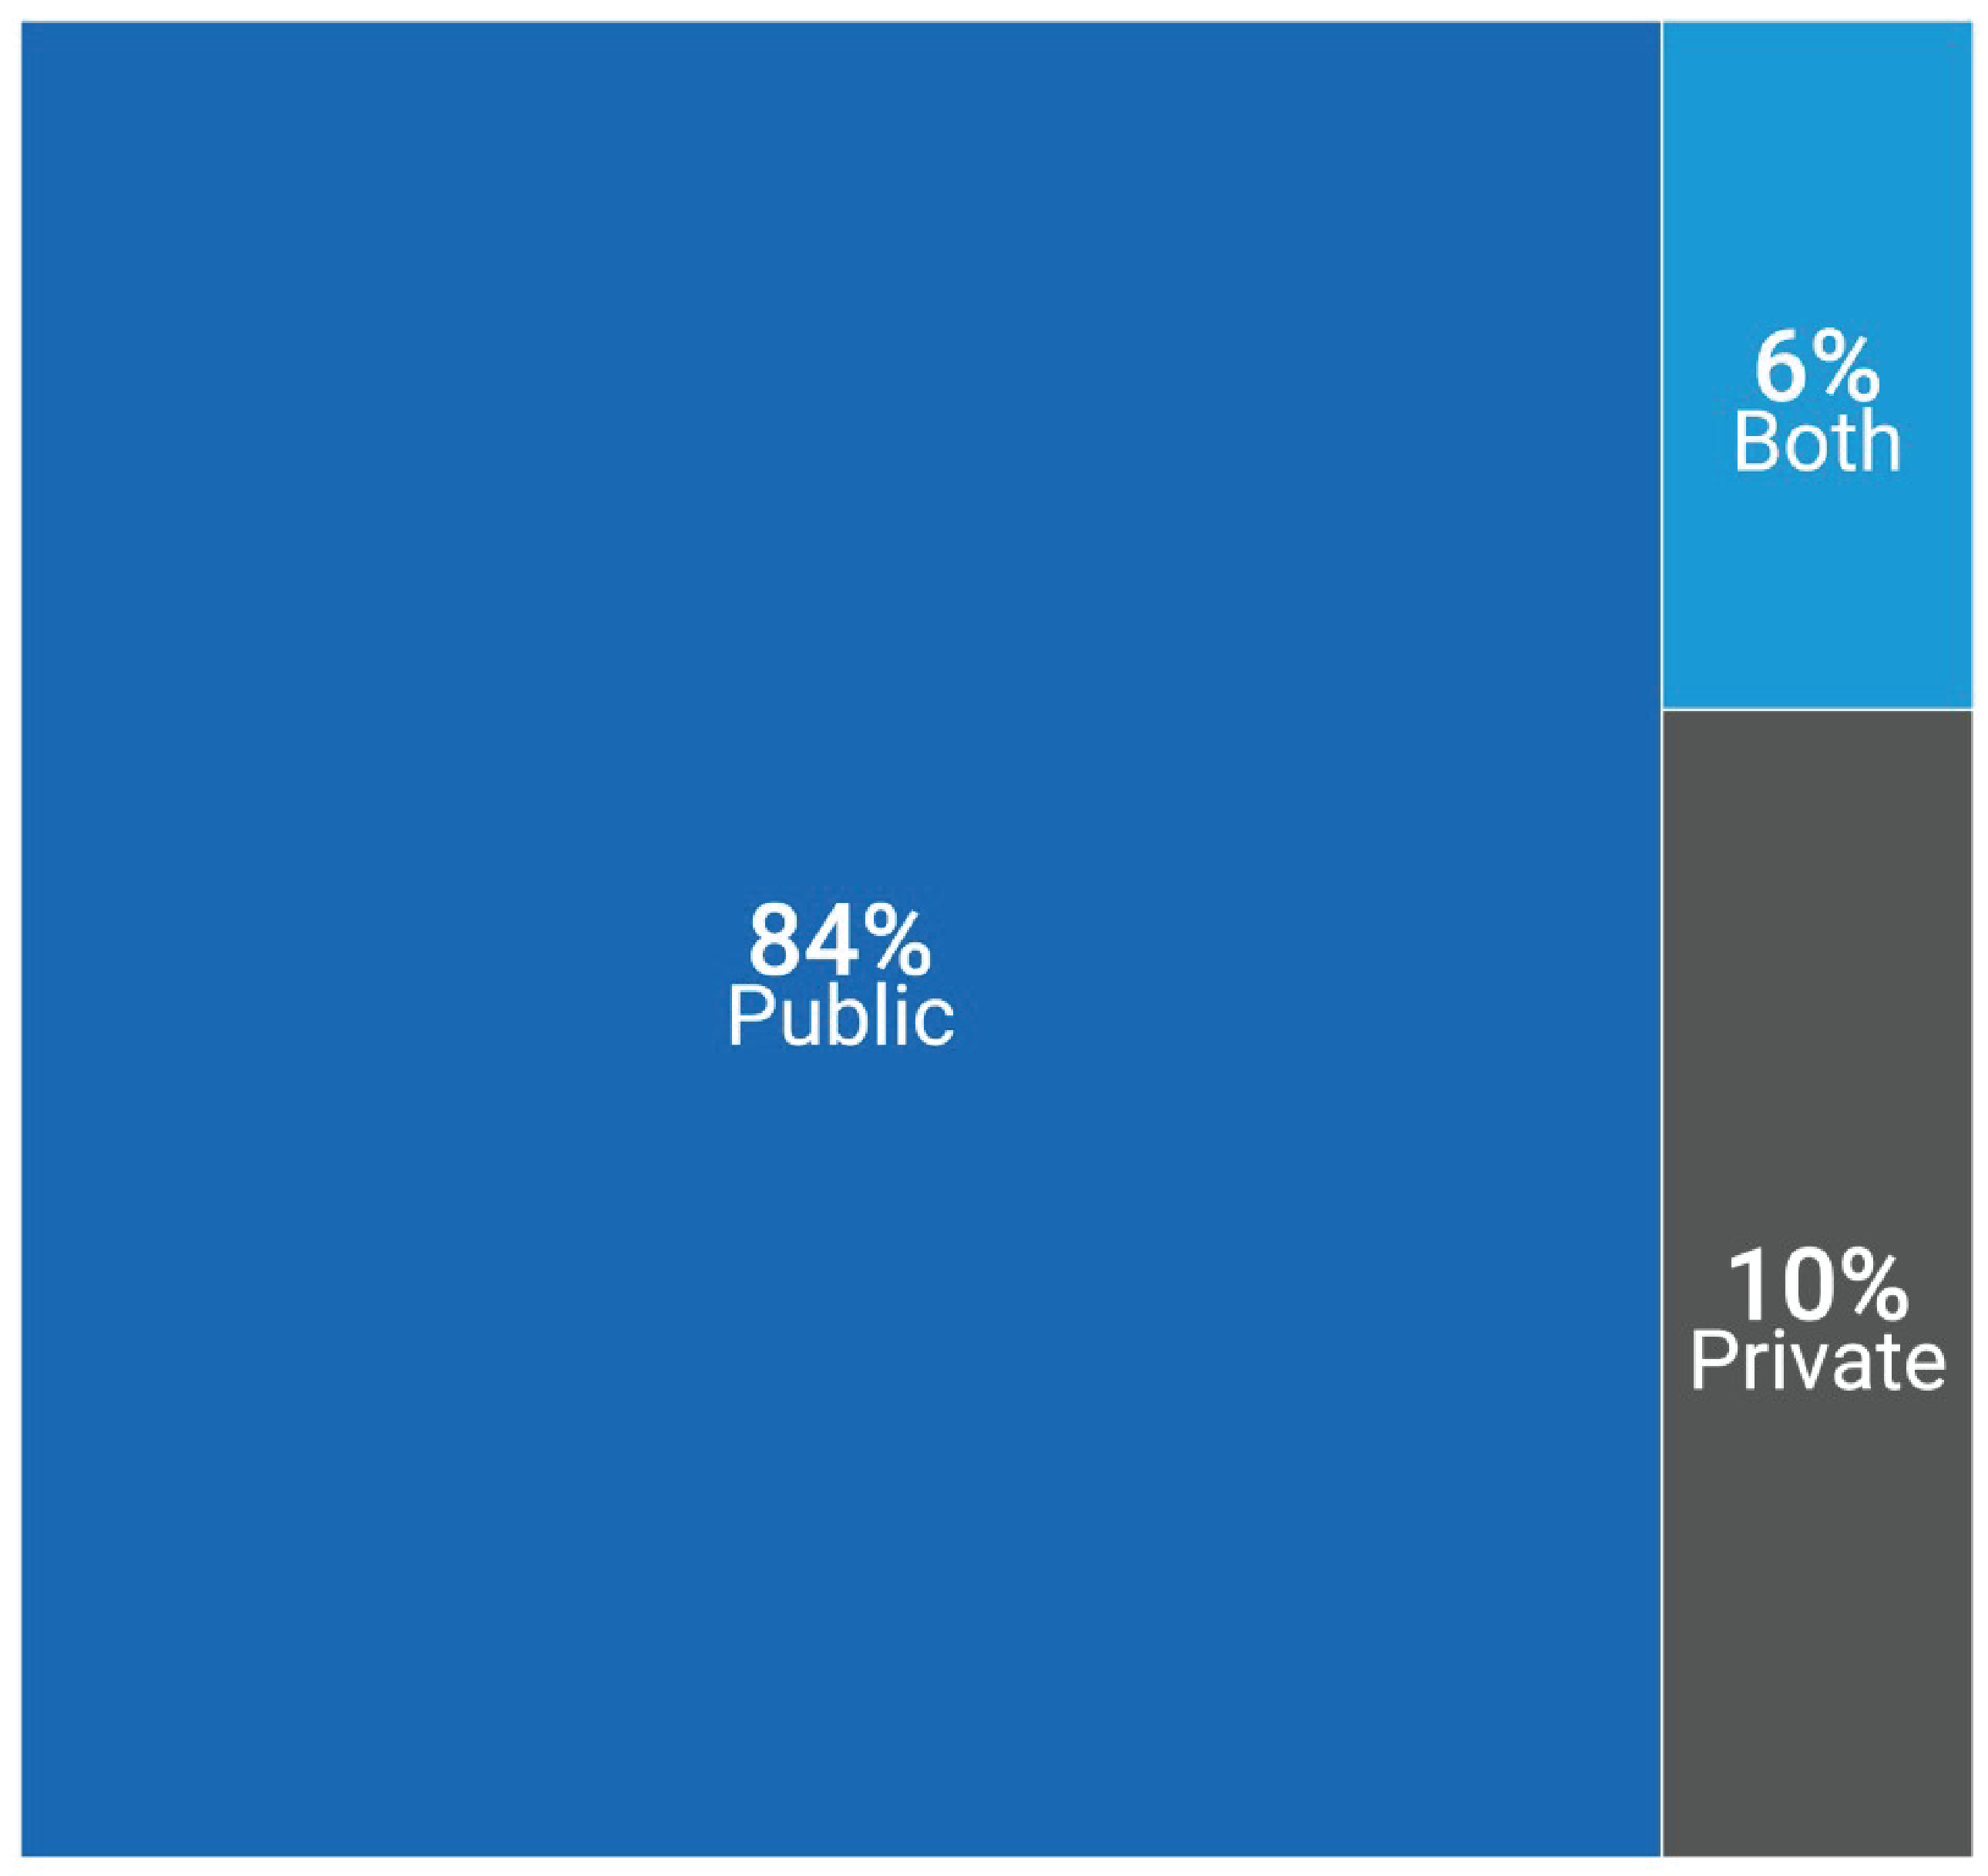
Notes: Survey response data were available for 50 out of 52 sites across 8 of the 9 jurisdictions with PET-CT capacity. No data were available for Nova Scotia.
Data were derived from the following survey question: “How is this facility funded?”
Survey responses for facility funding source for private sites were limited due to a low response rate.
Data summaries by province and territory are available in Appendix 3, Table 10.
Figure 3 presents the number of sites as proportions according to the funding source of all reported sites.
Inventory of PET-CT and PET-MRI Imaging Equipment
PET-CT Units and Exams in 2022–2023
Total Number of PET-CT Units in 2022–2023
A total of 60 PET-CT units were reported for 2022–2023, increasing from 57 units reported in 2019–2020.14
The provinces with the highest number of PET-CT units are Quebec and Ontario, with 24 and 20 units, respectively. No PET-CT units operate in Prince Edward Island or the territories (Table 1 and Figure 4).
Canada has 1.5 PET-CT units per million population. The jurisdictions with the greatest density of PET-CT units per million are Quebec (2.7), New Brunswick (2.4), and Newfoundland and Labrador (1.9) (Figure 4). This does not reflect accessibility, particularly in provinces with large rural and remote areas, where travel to urban centres is required.
Two sites in Ontario, 1 public and 1 private, reported the operation of mobile PET-CT units that are used as fixed units.
Six PET-CT units operate in 6 private sites in Ontario, Quebec, and British Columbia.
Table 1: Inventory of PET-CT for Public and Private Facilities in Canada, 2022 to 2023
Province or territory | Number of sites (private sites)a,b | Total units (private)c | Units per million population (private) | Populationd |
|---|---|---|---|---|
Alberta | 4 (0) | 5 (0) | 1.1 (0) | 4,703,772 |
British Columbia | 4 (1) | 5 (1) | 0.9 (0.2) | 5,437,722 |
Manitoba | 1 (0) | 1 (0) | 0.7 (0) | 1,444,190 |
New Brunswick | 2 (0) | 2 (0) | 2.4 (0) | 831,618 |
Newfoundland and Labrador | 1 (0) | 1 (0) | 1.9 (0) | 533,710 |
Northwest Territories | — | — | — | 45,668 |
Nova Scotia | 1 (0) | 1 (0) | 1 (0) | 1,047,232 |
Nunavut | — | — | — | 40,715 |
Ontario | 18 (2) | 20e,f (2)g | 1.3 (0.1) | 15,500,632 |
Prince Edward Island | — | — | — | 176,113 |
Quebec | 20 (3) | 24 (3) | 2.7 (0.3) | 8,831,257 |
Saskatchewan | 1 (0) | 1 (0) | 0.8 (0) | 1,221,439 |
Yukon | — | — | — | 44,412 |
Canada | 52 (6) | 60 (6) | 1.5 (0.2) | 39,858,480 |
Notes: For the 2022–2023 survey, complete unit count data were available for 52 sites with PET-CT capacity out of 467 participating sites with advanced imaging capacity (i.e., SPECT-CT, SPECT, CT, MRI, PET-CT, or PET-MRI).
Data were derived from the following survey question: “Do you have the following fixed, mobile, or portable units at the site?” Options included: CT, MRI, PET-CT, PET-MRI, SPECT-CT, and SPECT.
British Columbia has 1 PET unit without CT or MRI capabilities, which is used exclusively for research purposes and is not included in this report.
aPer-jurisdiction unit availability according to the validator if the validator provided lists of sites with availability; where these were unavailable, the data were from the survey and from private sites.
bA private site is a unit located in a health care facility that operates privately but is either privately or publicly funded.
cPer-jurisdiction unit counts according to the validator if the validator provided lists of units; where these were unavailable, the data were from the survey and responses from private sites.
dEstimated population as of the first quarter of 2023.20
eIncludes 1 PET unit that was not hybrid (i.e., without CT or MRI capabilities).
fIncudes 2 PET-CT units used for research purposes at a publicly funded facility (i.e., not patient-pay or private-pay).
gIncludes 1 or more mobile PET-CT unit.
Figure 4: Units and Units per Million Population for PET-CT, 2022 to 2023
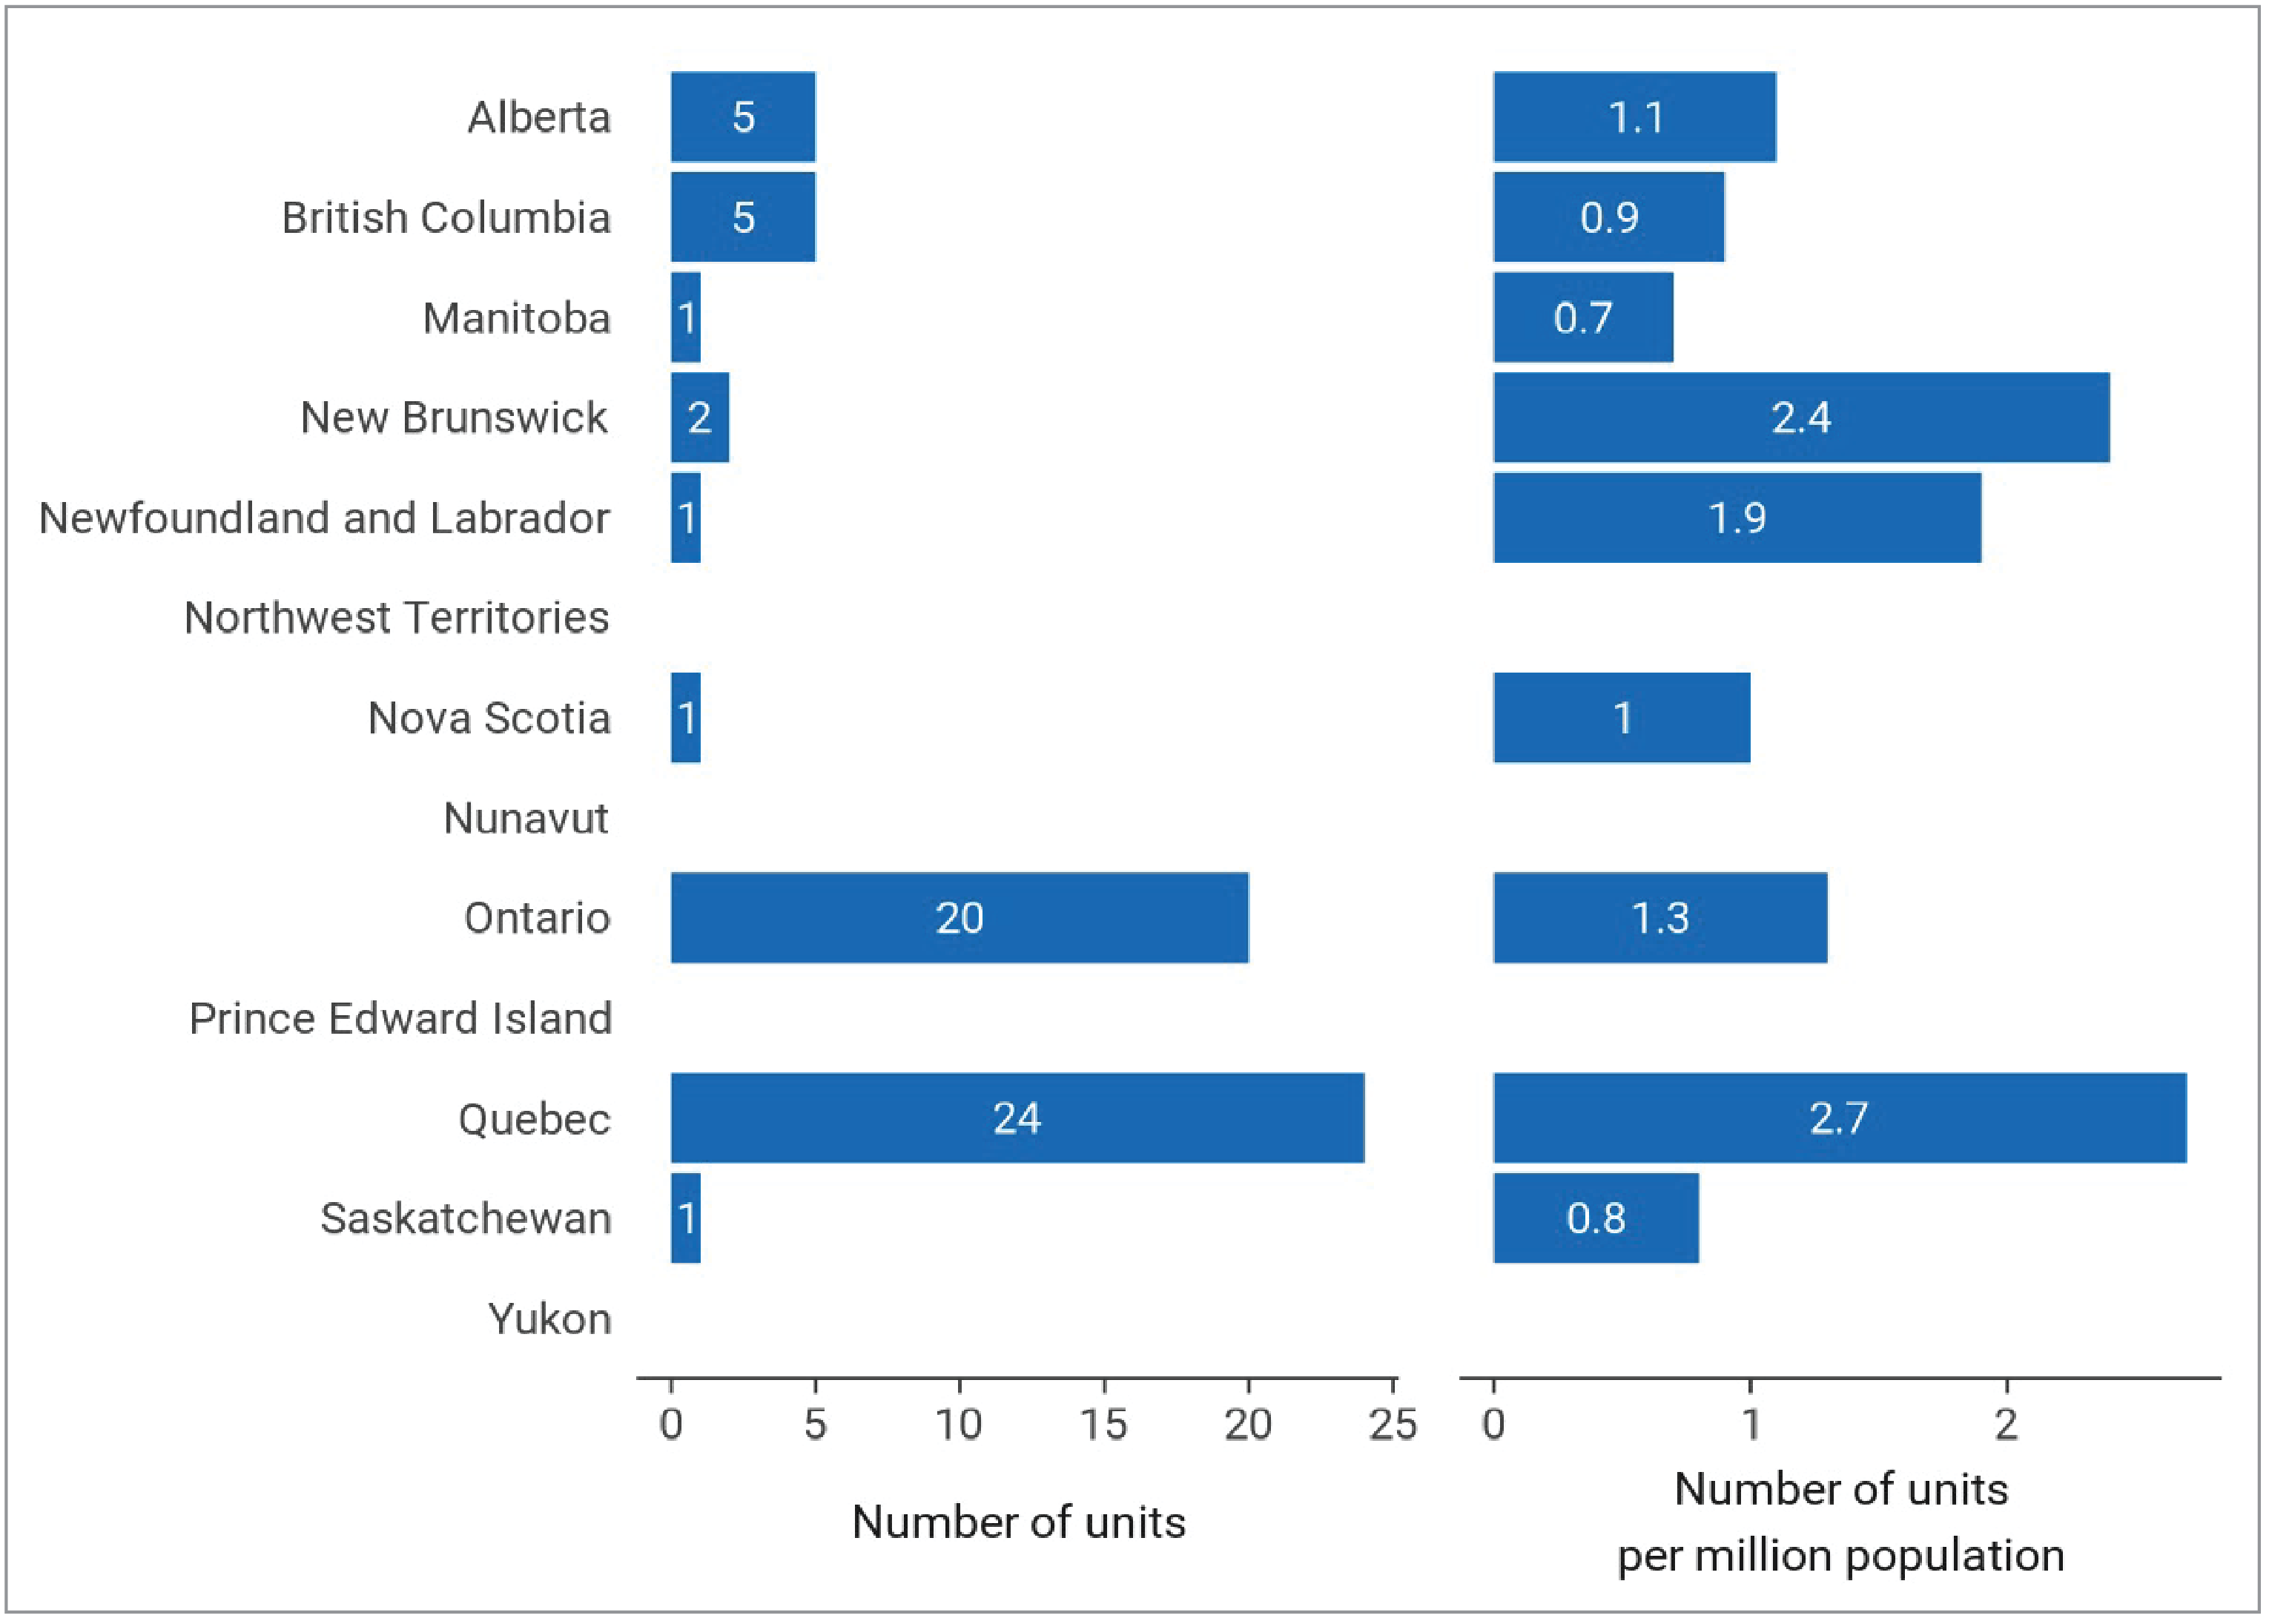
Notes: For the 2022–2023 survey, complete unit count data were available for 52 sites with PET-CT capacity out of 467 participating sites with advanced imaging capacity (i.e., SPECT-CT, SPECT, CT, MRI, PET-CT, PET-MRI).
Data were derived from the following survey question: “Do you have the following fixed, mobile, or portable units at the site?” Options included: CT, MRI, PET-CT, PET-MRI, SPECT-CT, and SPECT.
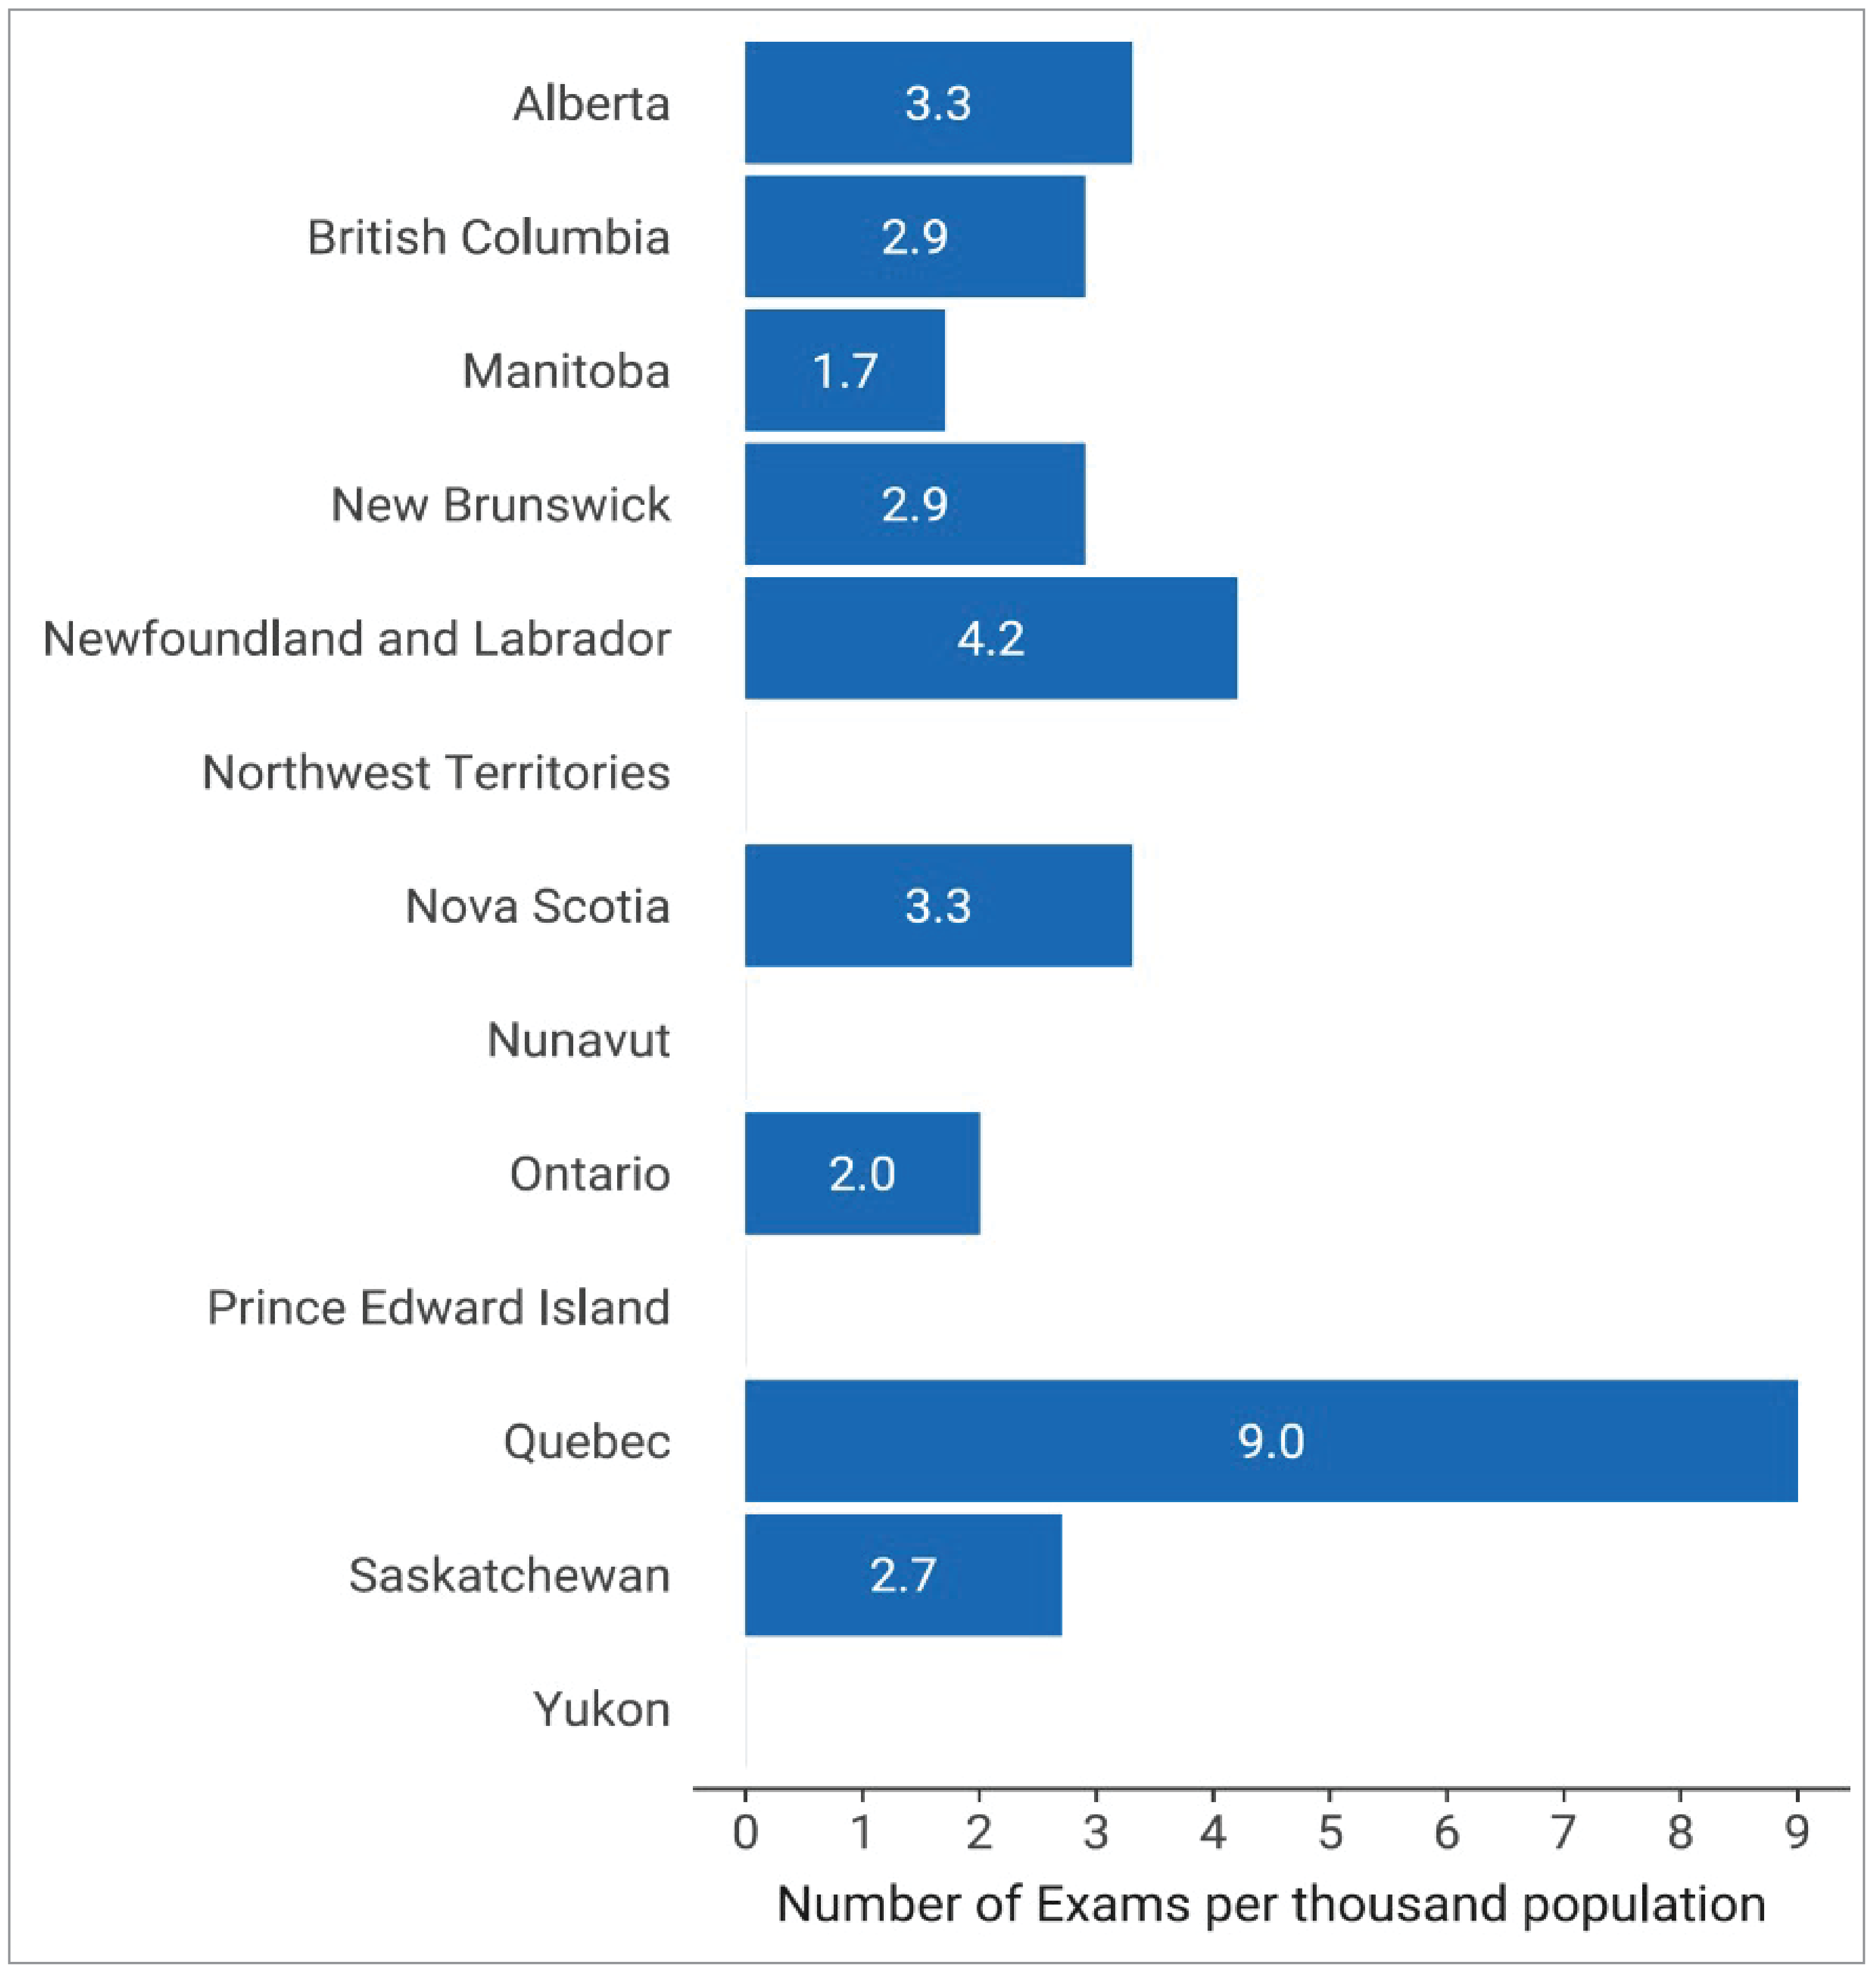
Total Volume of PET-CT Exams in Canada, 2022 to 2023
The total number of overall examinations and the total per capita (per 1,000 population) are reported for PET-CT for the most recent fiscal (or calendar) year and are presented in Table 2 and Figure 5.
A total of 156,320 PET-CT exams were performed, representing a national average of 3.9 exams per 1,000 population, ranging from 1.7 to 9 across all jurisdictions with capacity.
An average of 2,605 exams per PET-CT unit were conducted across Canada in 2022–2023.
Quebec, Ontario, and British Columbia had the highest volume of PET-CT exams of reporting jurisdictions with capacity in Canada, at 79,299 exams, 31,626 exams, and 15,898 exams, respectively.
Quebec, Newfoundland and Labrador, Alberta, and Nova Scotia had the highest density of PET-CT exams of reporting jurisdictions in Canada, at 9.0 exams, 4.2 exams, 3.3. exams, and 3.3 exams per 1,000 people, respectively.
The volume of exams conducted per unit is variable and may be impacted by several factors, such as the number of PET-CT units per capita, geographic location of equipment, facility type (i.e., specialized or tertiary care centres), and scope of clinical indications.
Figure 5: PET-CT Exams per 1,000 Population for the Latest Fiscal (or Calendar) Year With Data Availability Across Canada in Public Facilities, 2022 to 2023
Notes: Complete exam volume data for public facilities were reported by validators for all jurisdictions with PET-CT capacity.
Data were derived from the following survey question: “For all units, how many examinations on average were conducted in the last fiscal/calendar year?”
Table 2: Total Exams for the Latest Fiscal (Or Calendar) Year With Data Availability for PET-CT Across Canada for Public Facilities, 2022 to 2023
Province or territory | Populationa | Total exams | Average exams per unit | Exams per 1,000 population |
|---|---|---|---|---|
Alberta | 4,703,772 | 15,695 | 3,139 | 3.3 |
British Columbia | 5,437,722 | 15,898 | 3,179.6 | 2.9 |
Manitoba | 1,444,190 | 2,443 | 2,443 | 1.7 |
New Brunswick | 831,618 | 2,392 | 1,196 | 2.9 |
Newfoundland and Labrador | 533,710 | 2,262 | 2,262 | 4.2 |
Northwest Territories | 45,668 | — | — | — |
Nova Scotia | 1,047,232 | 3,465 | 3,465 | 3.3 |
Nunavut | 40,715 | — | — | — |
Ontario | 15,500,632 | 31,626b | 1,581.3 | 2 |
Prince Edward Island | 176,113 | — | — | — |
Quebec | 8,831,257 | 79,299 | 3,304.12 | 9.0 |
Saskatchewan | 1,221,439 | 3,240 | 3,240 | 2.7 |
Yukon | 44,412 | — | — | — |
Canada | 39,858,480 | 156,320 | 2,605.33 | 3.9 |
Notes: Complete exam volume data for public facilities were reported by validators for all jurisdictions with PET-CT capacity.
Data were derived from the number of units with reported exam data and from the following survey question: “For all units, how many examinations on average were conducted in the last fiscal/calendar year?”
aEstimated population as of the first quarter of 2023.20
bFunding through PET centres.
PET-MRI Units and Exams in 2022–2023
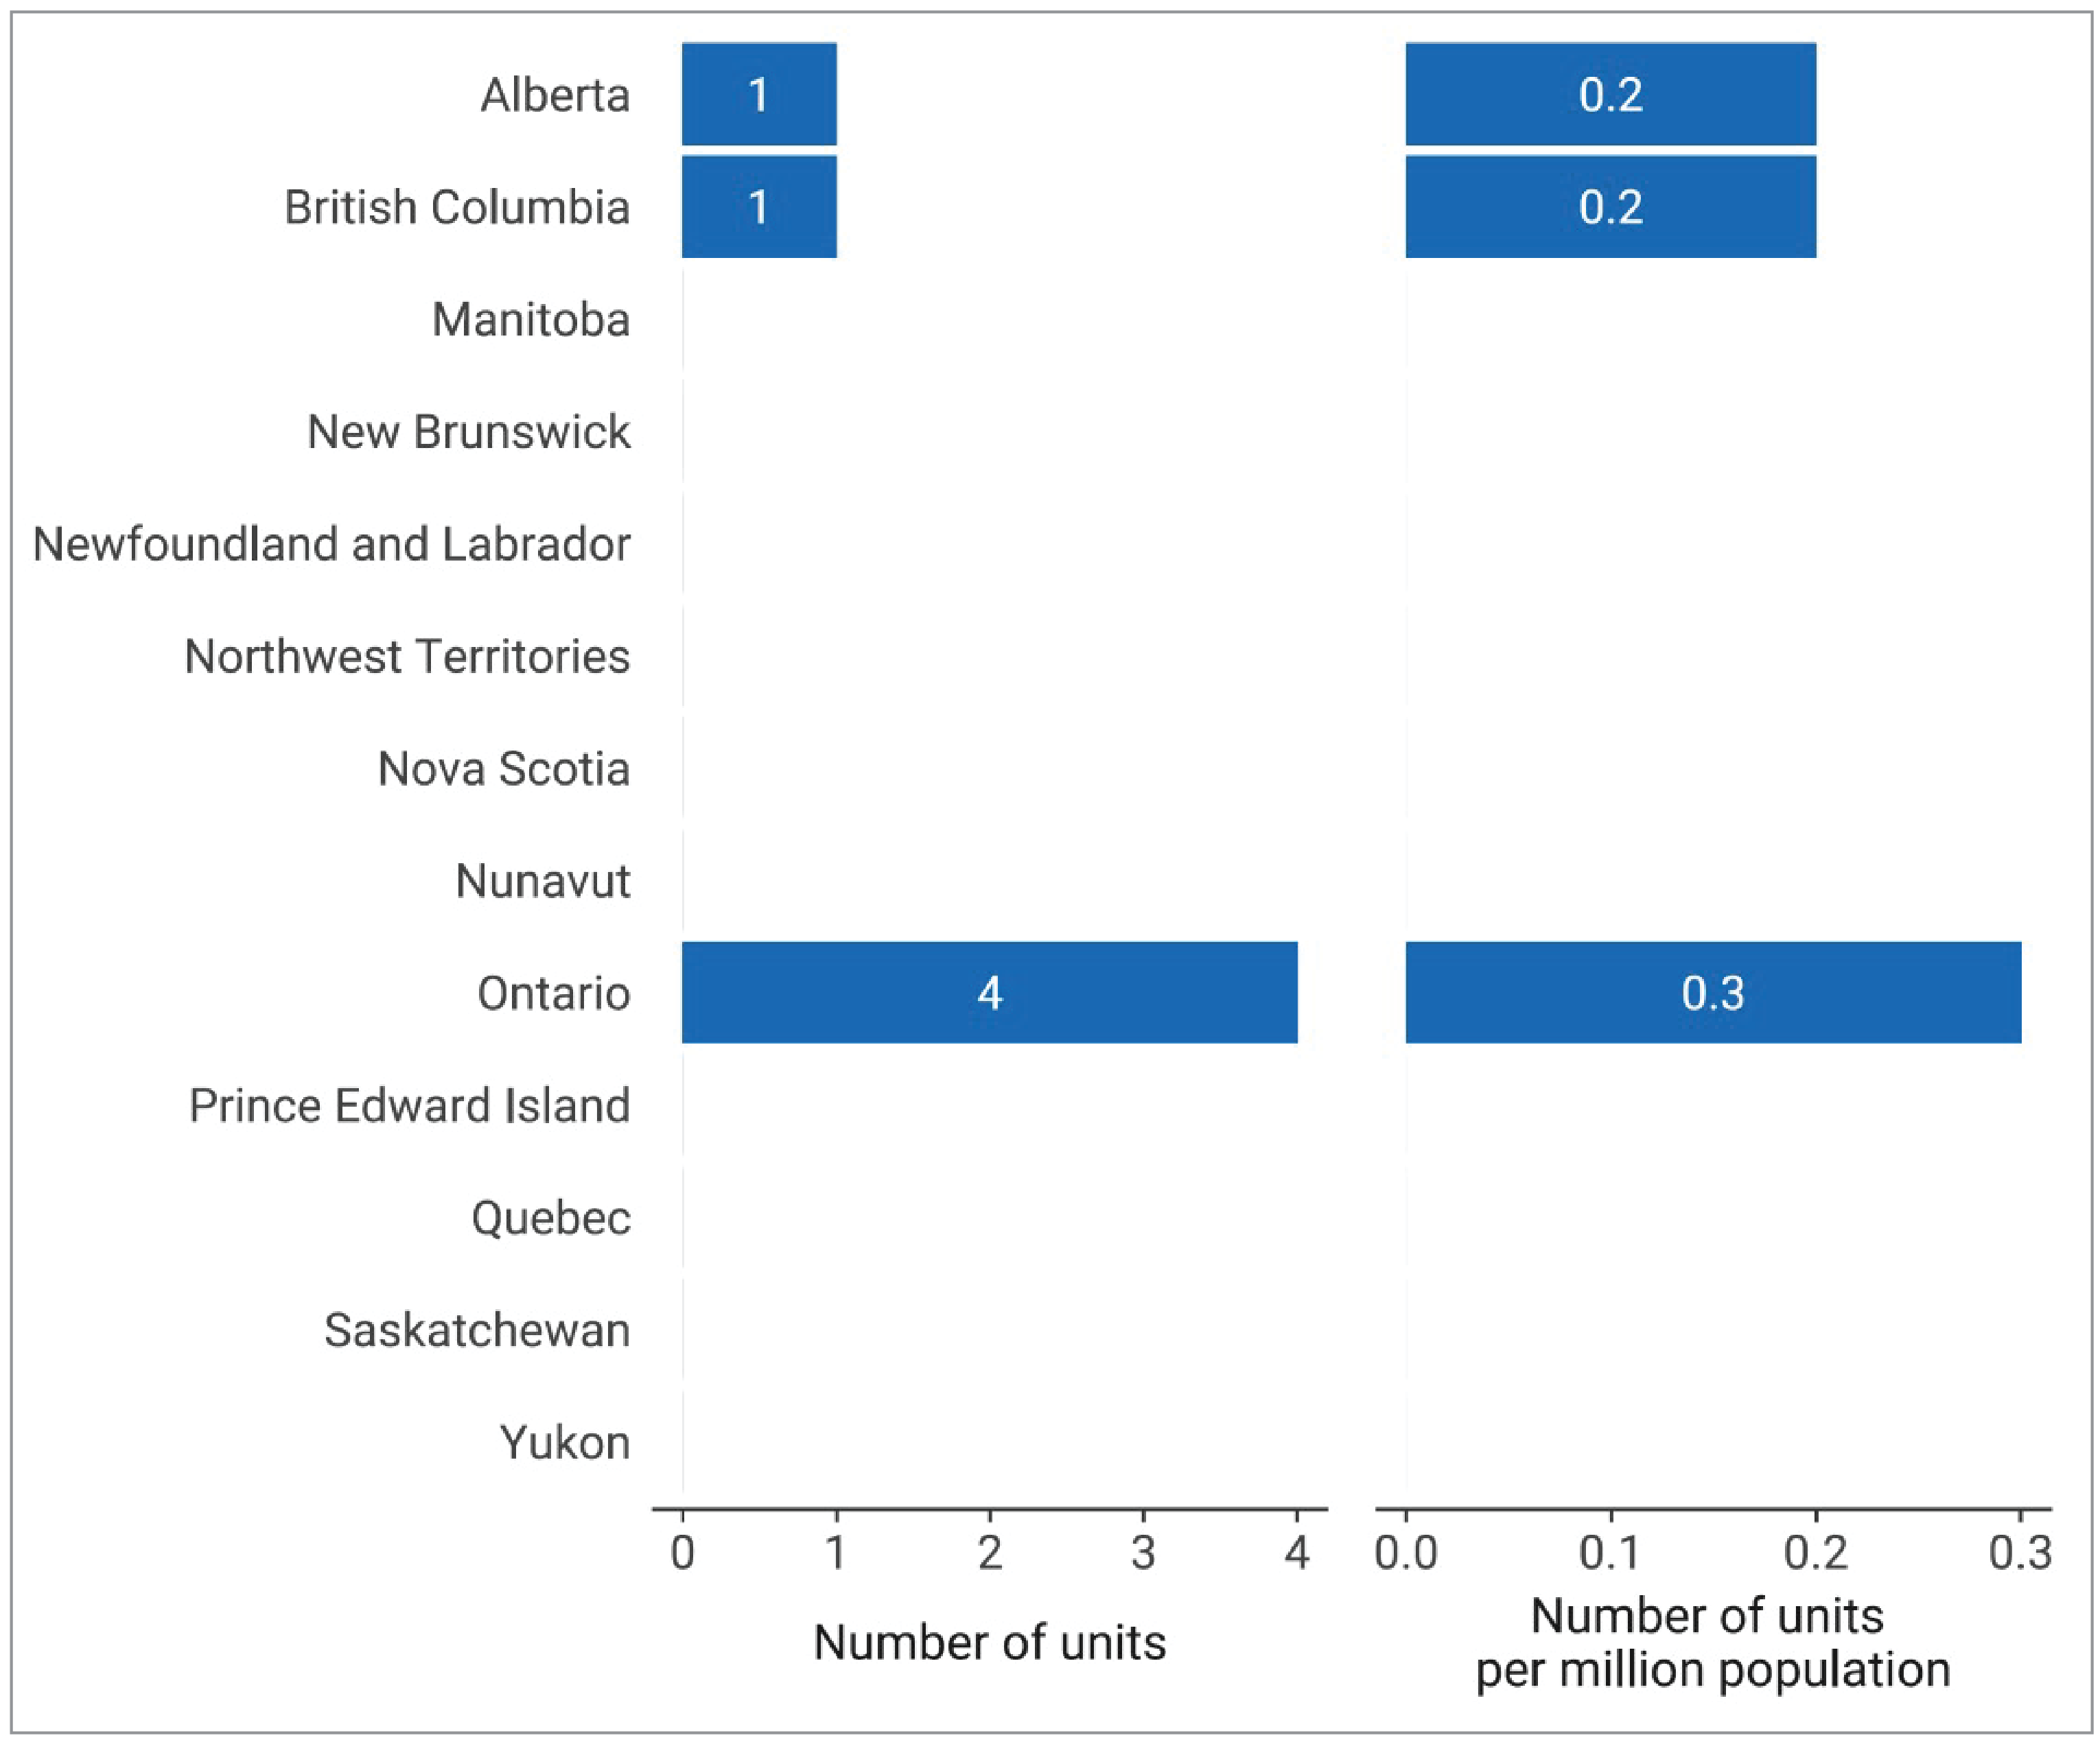
Six PET-MRI units were reported for 2022–2023, distributed across 3 provinces, up from 5 in 2019–202014 (Table 3 and Figure 6).
The province with the highest number of PET-MRI units was Ontario, with 4 units. One site in Alberta and 1 site in British Columbia had 1 PET-MRI unit each.
Canada has 0.2 units per million population. This does not reflect overall accessibility, particularly in provinces with large rural and remote areas where travel to urban centres is required.
Approximately 1,200 exams were performed among sites with available data, representing a national average of 0.03 exams per 1,000 population.
Currently, PET-MRI is almost exclusively used for research purposes in Canada.
Table 3: Inventory of PET-MRI in Canada, 2022 to 2023
Province or territory | Number of sitesa | Total unitsb (private) | Units per million population | Total exams | Exams per 1,000 population | Populationc |
|---|---|---|---|---|---|---|
Alberta | 1 | 1 (0) | 0.2 | 0 | 0 | 4,703,772 |
British Columbia | 1 | 1 (0) | 0.2 | 0 | 0 | 5,437,722 |
Manitoba | — | — | — | — | — | 1,444,190 |
New Brunswick | — | — | — | — | — | 831,618 |
Newfoundland and Labrador | — | — | — | — | — | 533,710 |
Northwest Territories | — | — | — | — | — | 45,668 |
Nova Scotia | — | — | — | — | — | 1,047,232 |
Nunavut | — | — | — | — | — | 40,715 |
Ontario | 4 | 4 (0) | 0.3 | 1,200d | 0.1 | 15,500,632 |
Prince Edward Island | — | — | — | — | — | 176,113 |
Quebec | — | — | — | — | — | 8,831,257 |
Saskatchewan | — | — | — | — | — | 1,221,439 |
Yukon | — | — | — | — | — | 44,412 |
Canada | 6 | 6 (0) | 0.2 | 1,200 | 0.03 | 39,858,480 |
Notes: For the 2022–2023 survey, complete unit count data were available for 6 sites with PET-MRI capacity out of 467 participating sites with advanced imaging capacity (i.e., SPECT-CT, SPECT, CT, MRI, PET-CT, PET-MRI).
Data were derived from the following survey question: “Do you have the following fixed, mobile, or portable units at the site?” Options included: CT, MRI, PET-CT, PET-MRI, SPECT-CT, and SPECT.
aPer-jurisdiction unit availability according to the validator if the validator provided lists of sites with availability; where these were unavailable, the data were from the survey.
bPer-jurisdiction unit counts according to the validator and responses from private sites.
cEstimated population as of the first quarter of 2023.20
dData from 2019–2020.14
Figure 6: Units and Units per Million Population for PET-MRI, 2022 to 2023
Notes: For the 2022–2023 survey, complete unit count data were available for 6 sites with PET-MRI capacity out of 467 participating sites with advanced imaging capacity (i.e., SPECT-CT, SPECT, CT, MRI, PET-CT, PET-MRI).
Data were derived from the following survey question: “Do you have the following fixed, mobile, or portable units at the site?” Options included: CT, MRI, PET-CT, PET-MRI, SPECT-CT, and SPECT.
Change in PET-CT Units and Exams Since 2015
Trends in Number of Units and Units per Million People, 2015 to 2022–2023
Information on the number of PET-CT units and units per million people between 2015 and 2022–2023 are presented in Appendix 3, Table 11.13-15
Since 2015, the number of PET-CT units in Canada has increased by 27.7%, from 47 to 60 units.
Between 2015 and 2022–2023, the number of units per million people increased by 15.4%, from 1.3 to 1.5 units per million population. During this time, Quebec, New Brunswick, and Newfoundland and Labrador maintained the highest number of units per capita among jurisdictions with PET-CT capacity.
Since 2019–2020, Alberta has experienced the highest increase in number of units per million people of all jurisdictions with PET-CT capacity, with an increase from 0.9 to 1.1 units per million population.
Trends in Exam Volume and Exams per 1,000 People, 2015 to 2022–2023
Information on the number of PET-CT exams and exams per 1,000 people between 2015 and 2022–2023 is presented in Appendix 3, Table 12:13-15
Since 2015, the volume of PET-CT exams in Canada has increased by 103.5%, from 76,824 to 156,320 exams.
Between 2015 and 2022–2023, the number of exams per 1,000 people increased by 95%, from 2.0 to 3.9 exams per 1,000 population. During this time, Quebec maintained the highest number of exams per capita among jurisdictions with PET-CT capacity.
Since 2019–2020, Saskatchewan has experienced the highest increase in the volume of exams per capita among jurisdictions with PET-CT capacity, increasing by 58.8%, from 1.7 to 2.7.
Operation of PET-CT and PET-MRI Imaging Equipment
Hours of Operation for PET-CT Equipment
Hours per Day and 24-Hour Use for PET-CT Units
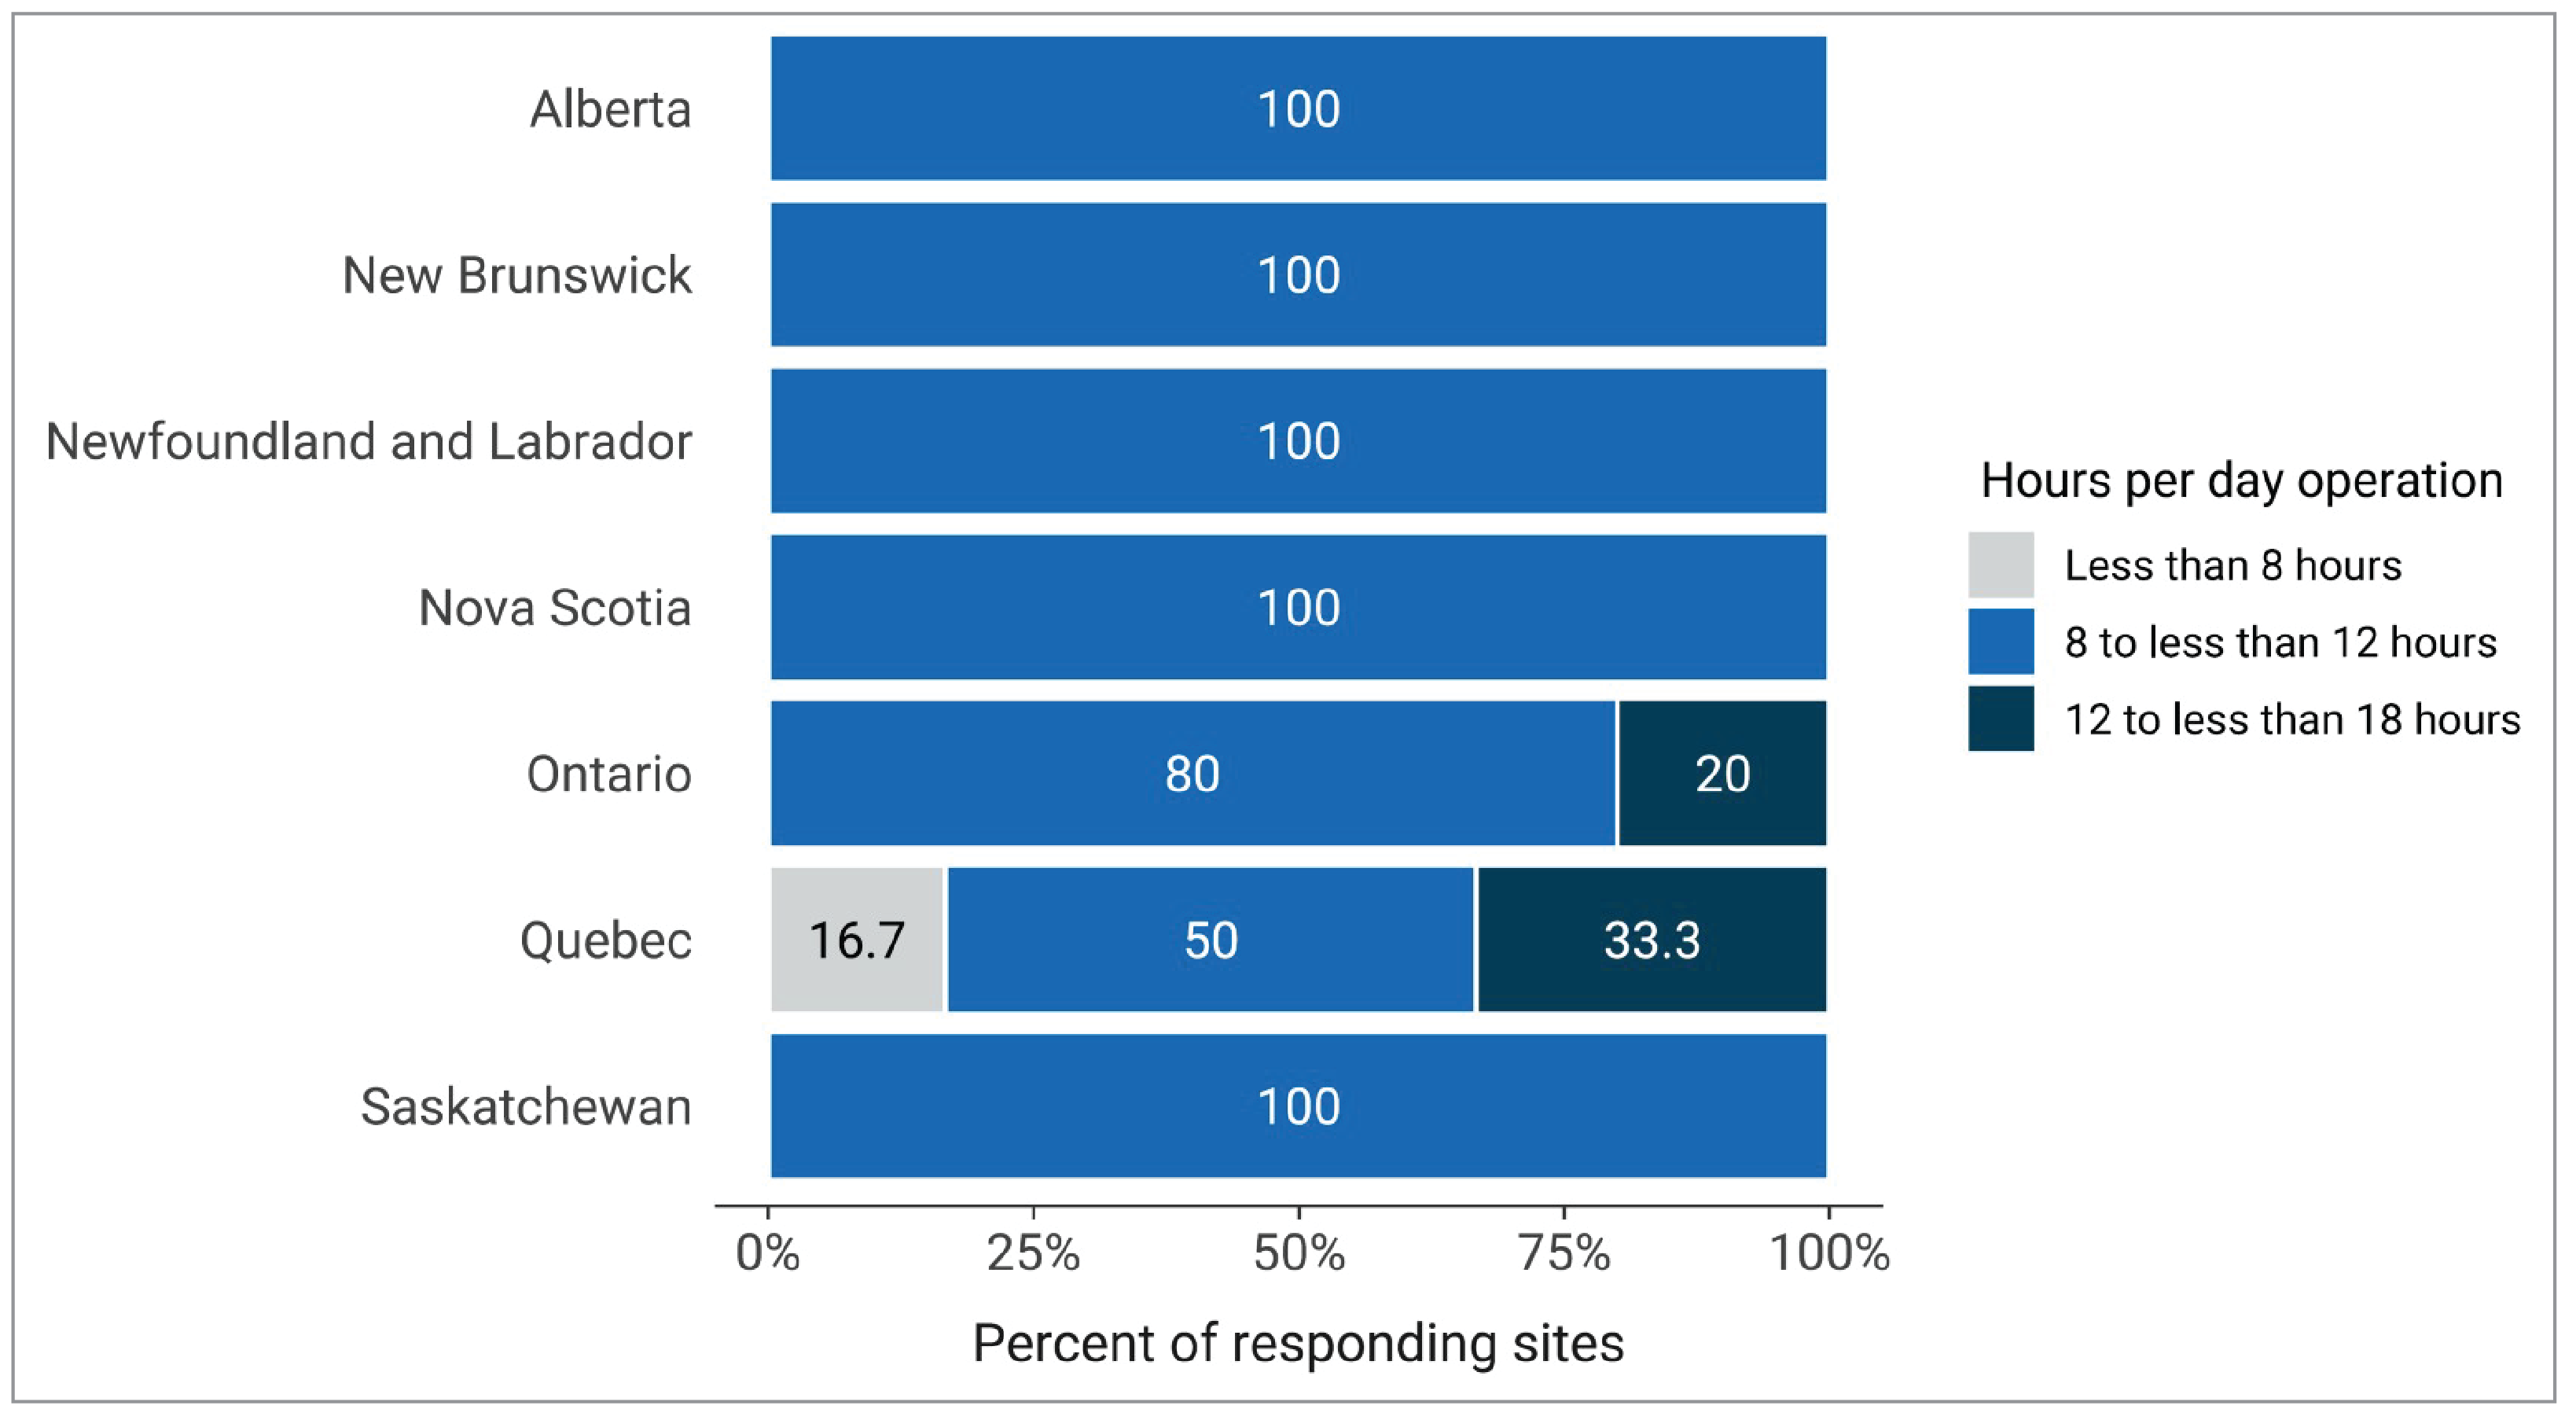
PET-CT units operate an average of 9.4 hours per day in Canada, ranging from 7 to 14 hours across all jurisdictions with capacity (Appendix 3, Table 13). Table 28 (Appendix 4) presents the average daily hours of operation reported for only publicly funded sites with capacity.
New Brunswick and Nova Scotia reported the highest average hours of use per day across all jurisdictions with capacity, at 10 hours.
76% of sites with PET-CT capacity in Canada reported use between 8 and 12 hours per day, 16% reported use for more than 12 hours per day, and 8% reported use for less than 8 hours per day (Figure 7). Data came from 25 sites that responded to this survey question.
No sites with capacity reported PET-CT operation 24 hours per day. Operating times of PET-CT units are closely tied to radiopharmaceutical supply, whether onsite or offsite.
Figure 7: Percentage of Average Hours of Operation per 24-Hour Day of PET-CT Use by Category, 2022 to 2023
Notes: Survey response data were available for 25 out of 52 sites in 8 of the 9 jurisdictions with PET-CT capacity. No data were available for British Columbia.
Data were derived from the following survey question: “In an average 24-hour day, how many hours are the units staffed through regular scheduled service capacity (do not include hours where staff are only on call).”
Hours Per Week and Weekend Use for PET-CT Units
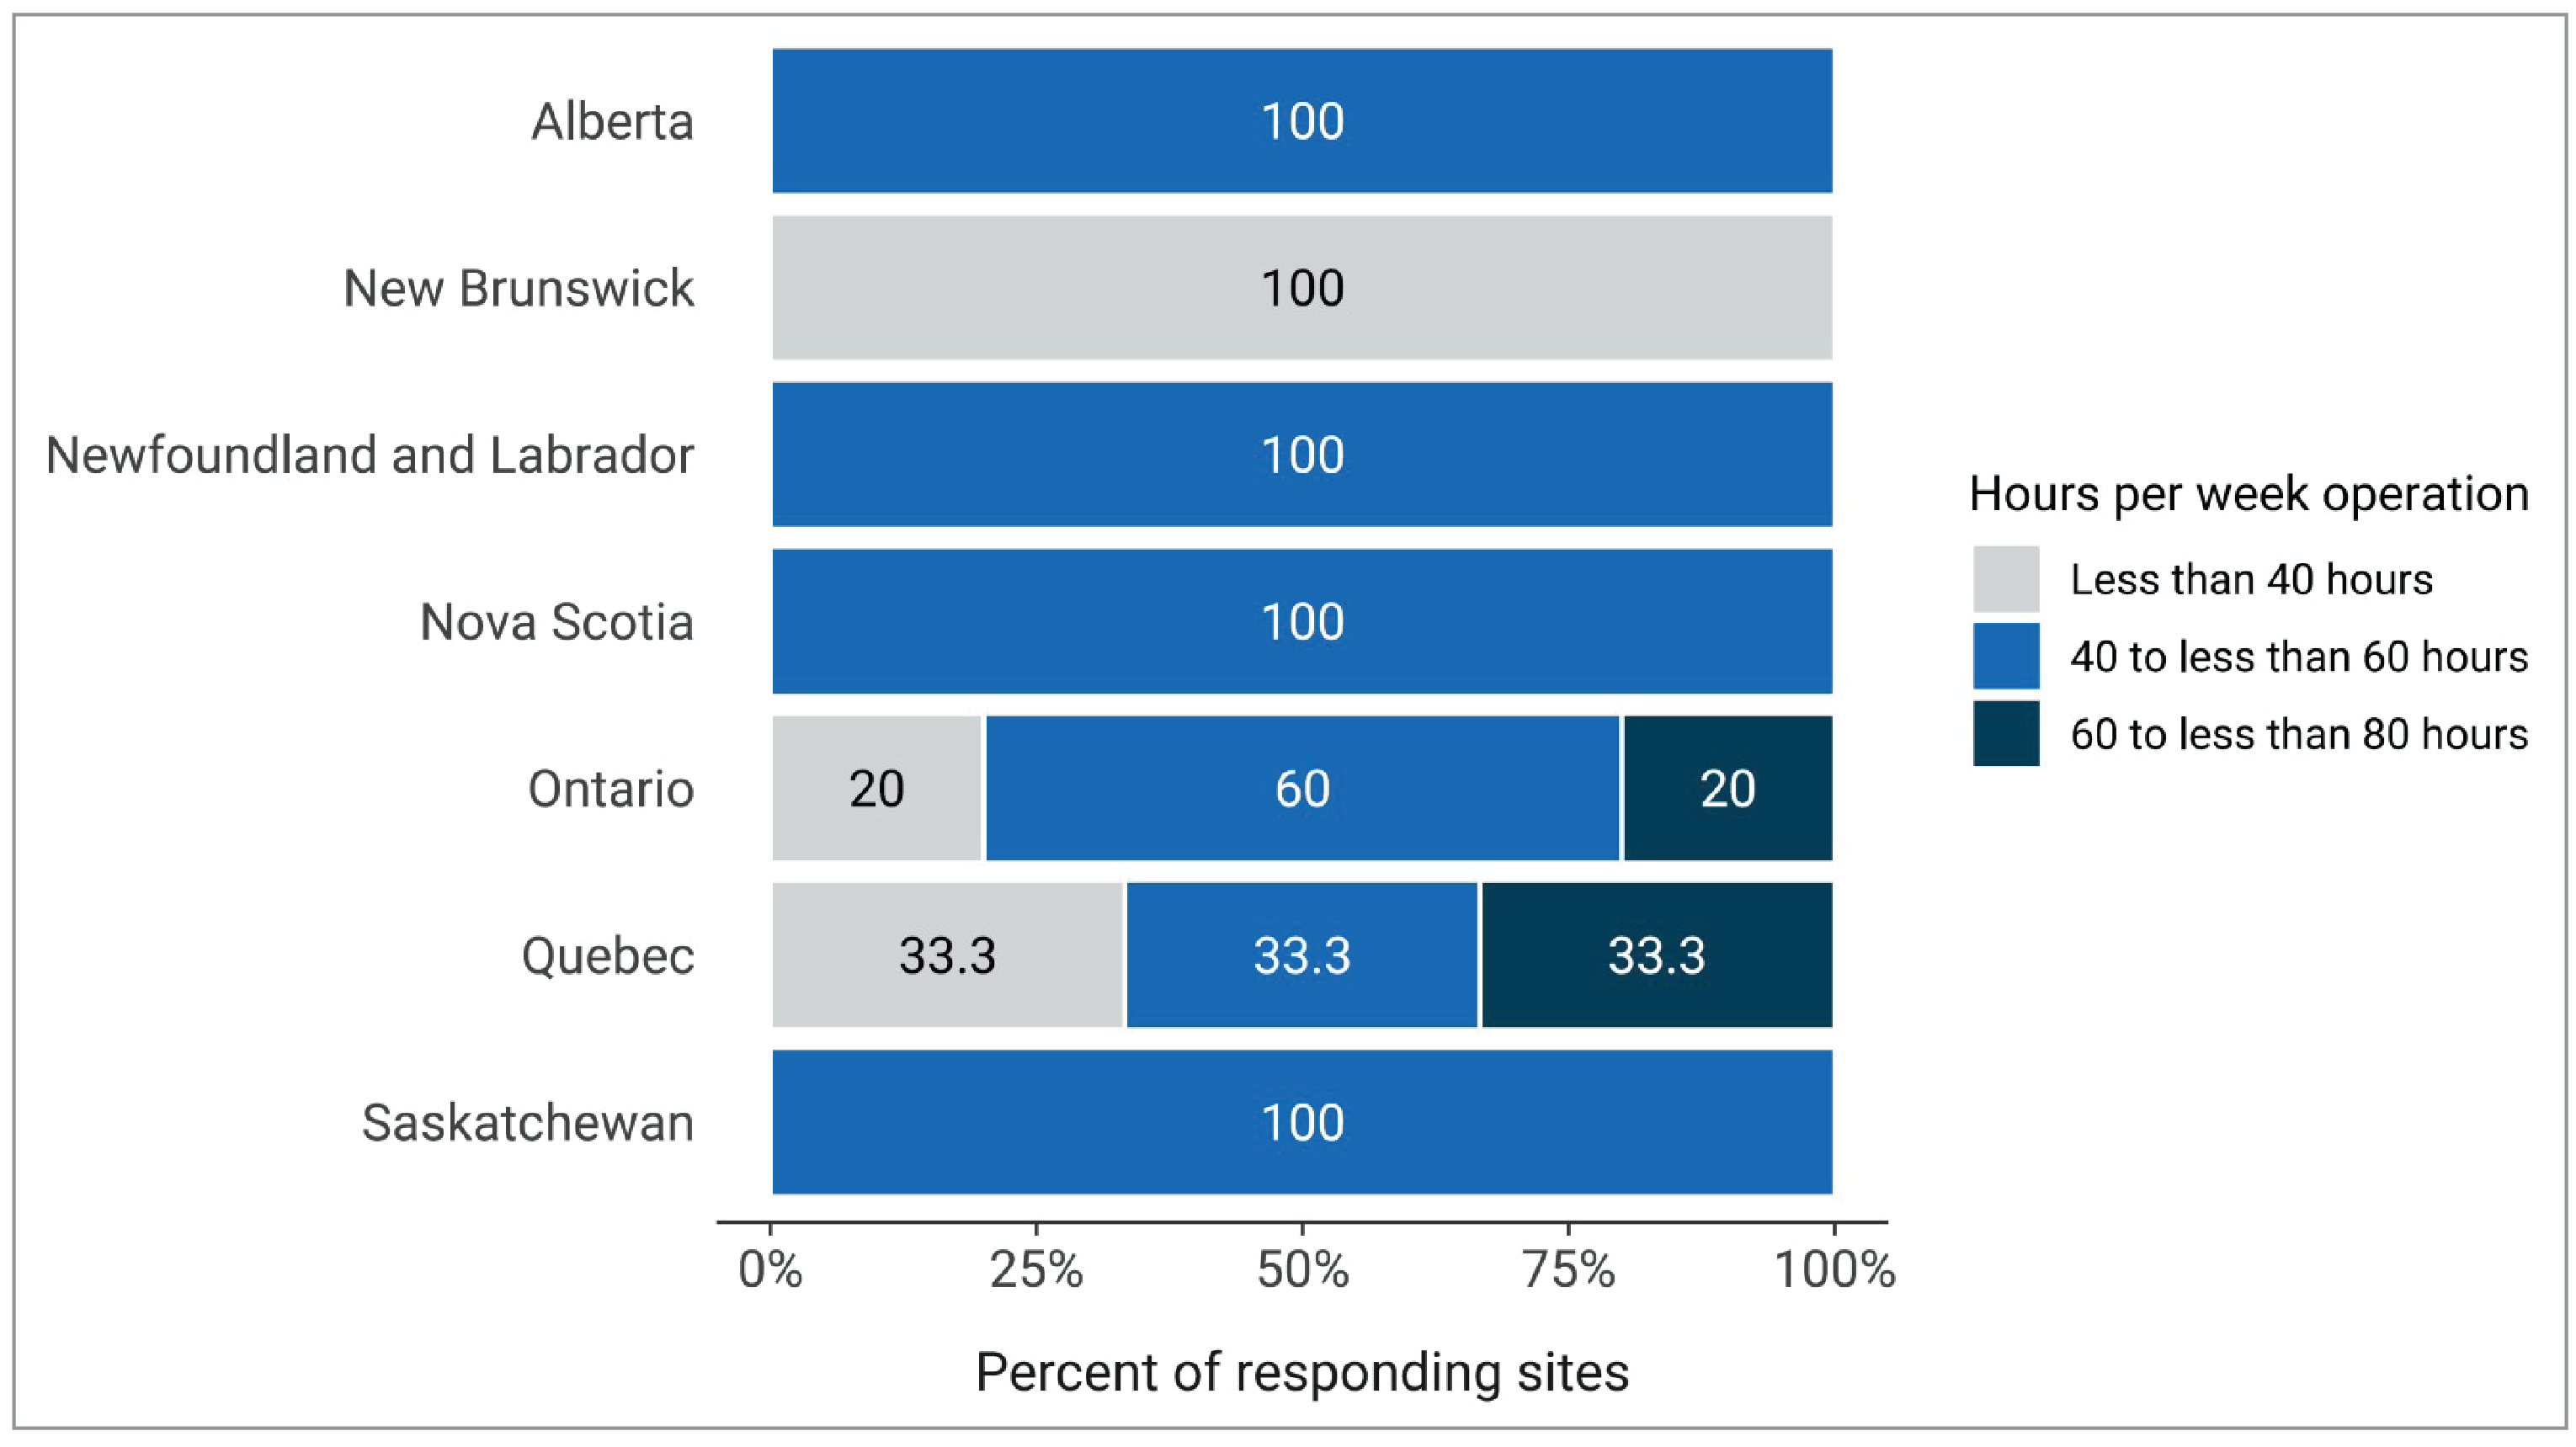
PET-CT units operate an average of 44.2 hours per week in Canada, ranging from 10 to 78 hours across jurisdictions with capacity (Appendix 3, Table 14). Table 29 (Appendix 4) presents the average weekly hours of operation reported for only publicly funded sites with capacity.
Newfoundland and Labrador and Nova Scotia reported the highest average hours of use per week of all jurisdictions with capacity, at 56 and 50 hours, respectively.
About 20% of PET-CT units in Canada were used less than 40 hours per week, 64% were used between 40 and 60 hours, and 16% exceeded 60 hours of use per week (Figure 8).
Two sites in Ontario (7% of 26 sites in Canada) reported the operation of 1 PET-CT unit on weekends. We received anecdotal information that an additional 4 PET-CT units in Ontario are used on weekends.
Hours of operation at the site level may change rapidly depending on demand and other factors.
Figure 8: Percentage of Average Hours of Operation per Week of PET-CT Use by Category, 2022 to 2023
Notes: Survey response data were available for 25 out of 52 sites in 8 of the 9 jurisdictions with PET-CT capacity. No data were available for British Columbia.
Data were derived from the following survey question: “In an average 168-hour week, how many hours are the [modality] units staffed through regular scheduled service capacity (do not include hours where staff are only on call)?”
Hours of Operation for PET-MRI Equipment
Hours Per Day and 24-Hour Use for PET-MRI Units
One site provided data for the average number of hours per day of use. The PET-MRI unit was used for an average of 8 hours per day.
No sites reported the use of a PET-MRI unit 24 hours per day.
Hours Per Week and Weekend Use for PET-MRI Units
One site in Ontario provided data for the average number of hours per week of use. The PET-MRI unit was used for an average of 40 hours per week.
The same site reported the use of a PET-MRI unit on weekends.
Annual Planned and Unplanned Downtime for PET-CT and PET-MRI Units
PET-CT Annual Downtime
The average planned downtime for PET-CT units was 37.8 hours per year, ranging from 2 to 240 hours (Figure 9 and Appendix 3, Table 15).
The average unplanned downtime was 61.9 hours per year, ranging from 0 hours to 480 hours.
Some commonly reported reasons for unplanned downtime for PET-CT units include equipment and system failure, cyclotron breakdown, and lack of radiotracer supply.
PET-MRI Annual Downtime
One site with PET-MRI capacity reported downtime information. This site reported 90 hours of planned downtime and 75 hours of unplanned downtime for their PET-MRI unit.
Figure 9: Average Downtime at Sites With PET-CT Units by Reporting Jurisdictions With Capacity, 2022 to 2023
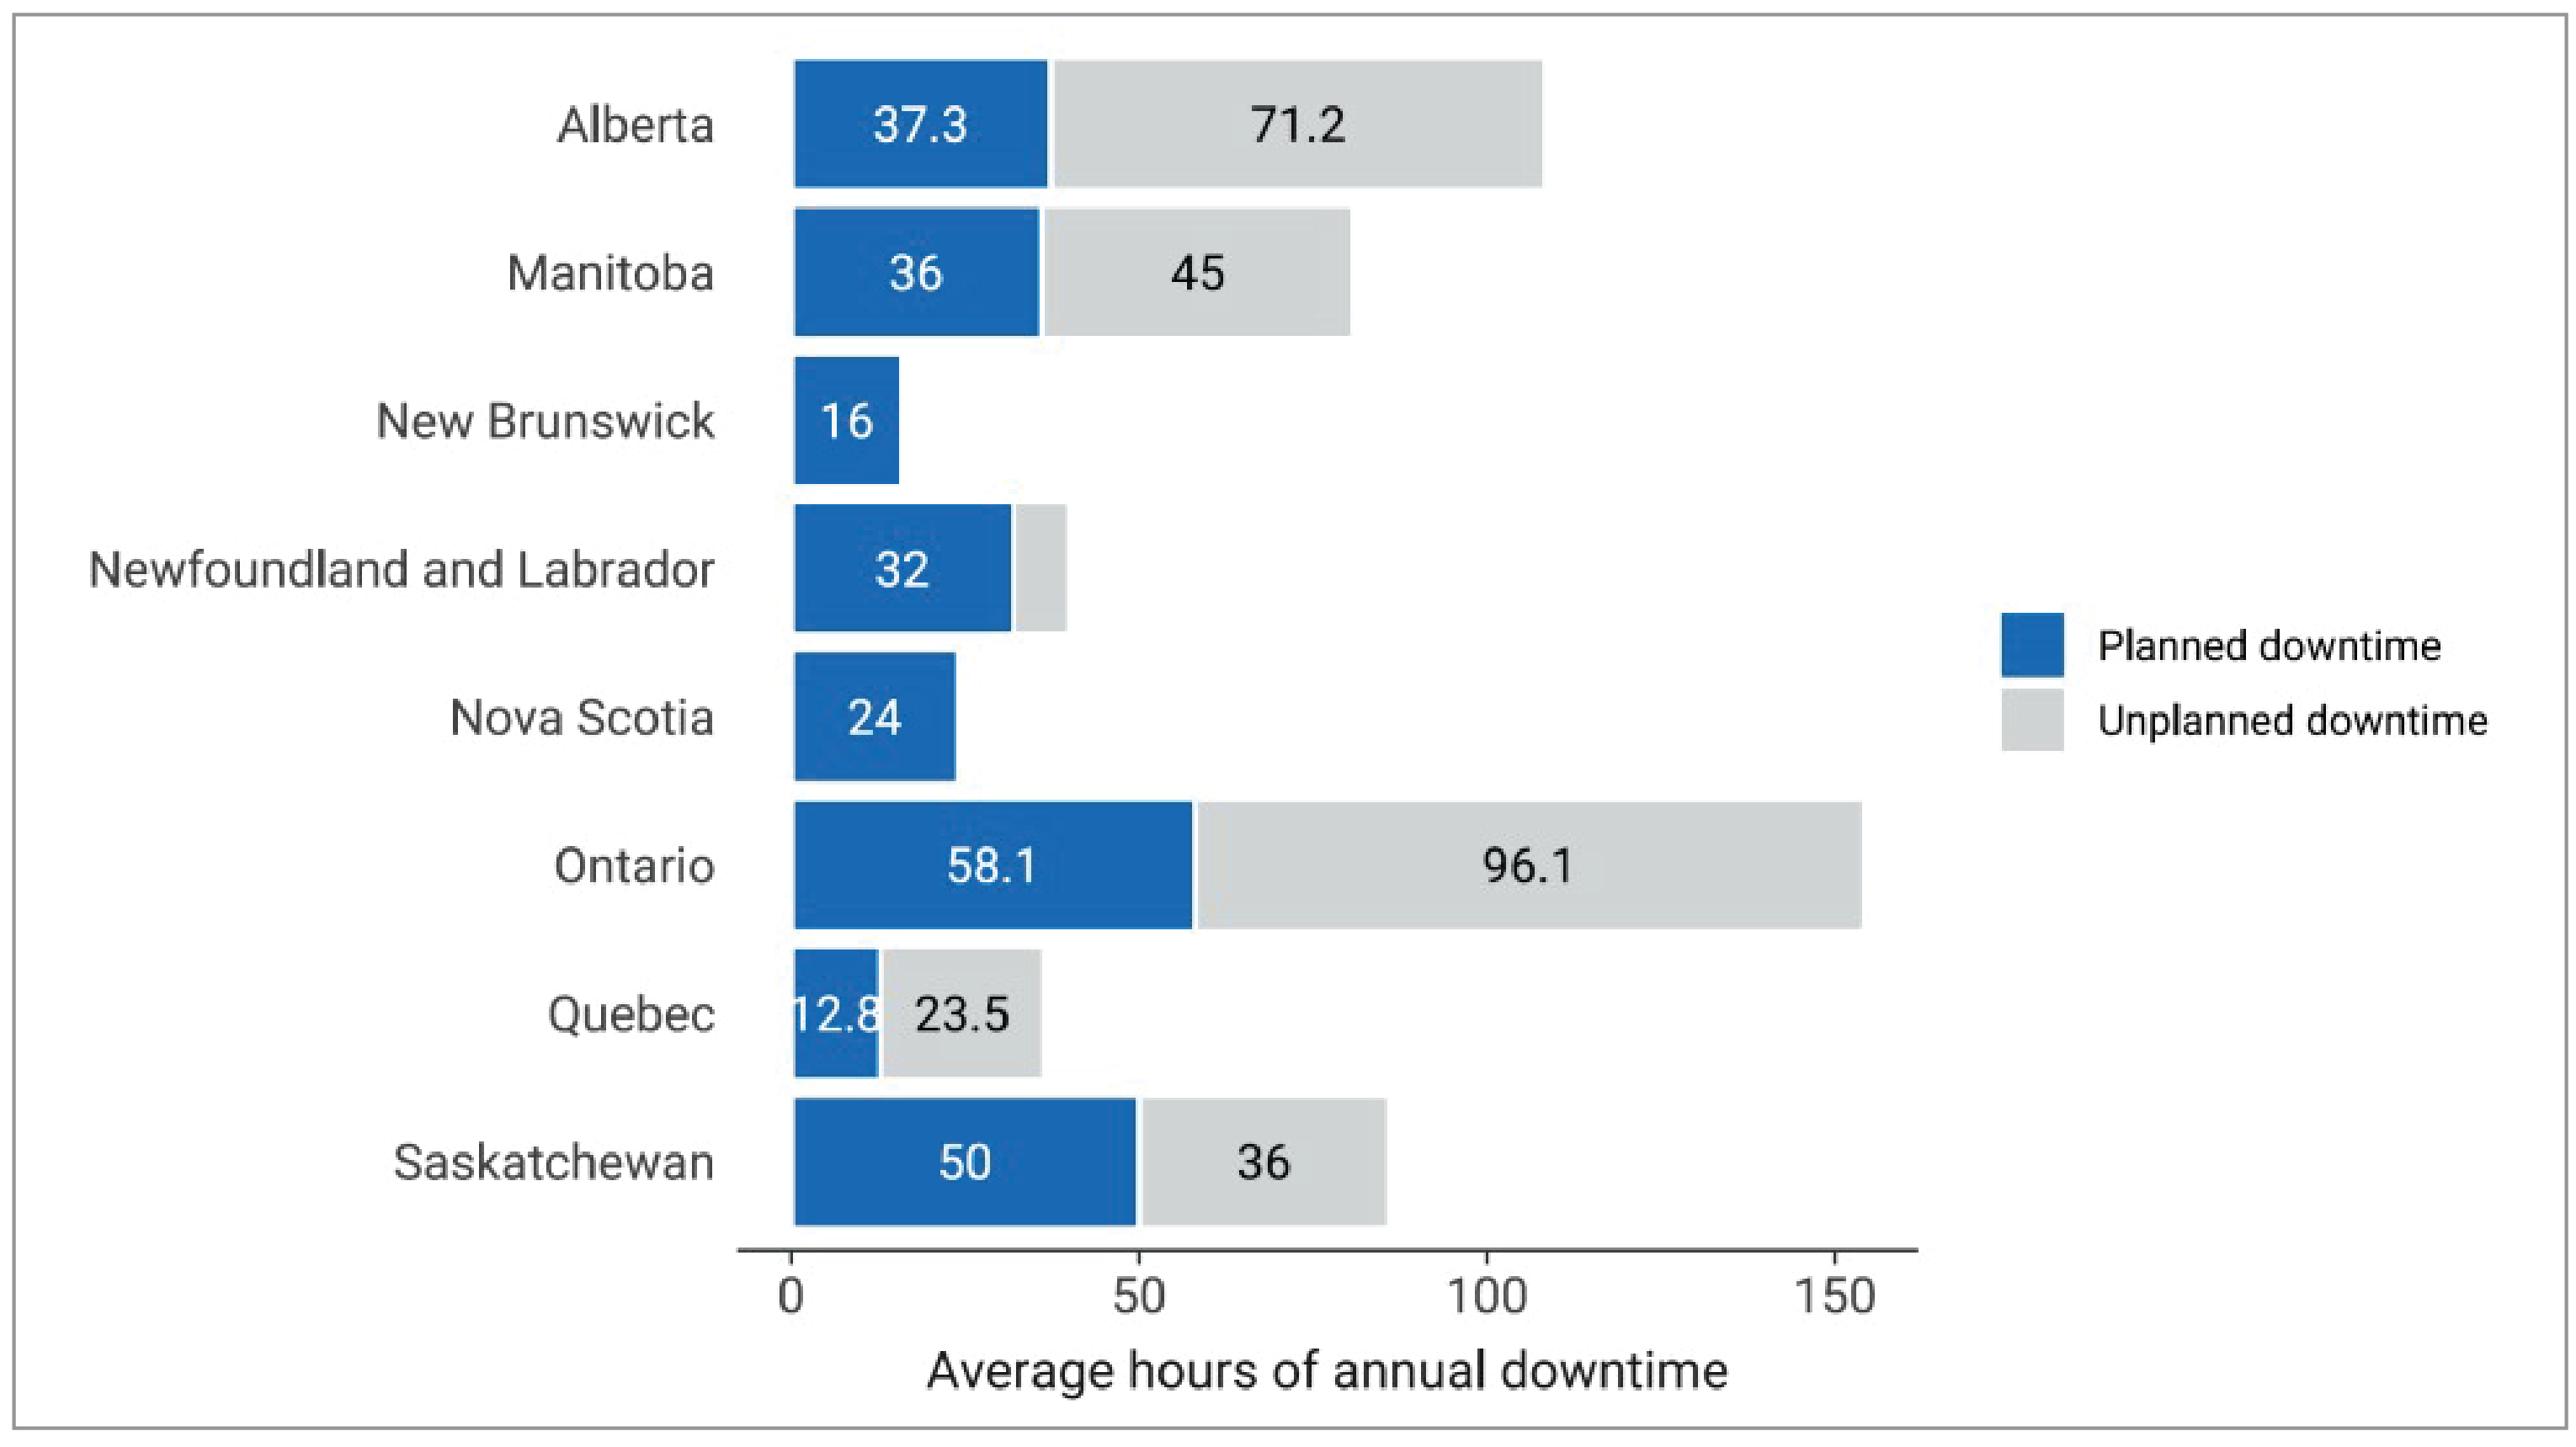
Notes: Survey response data for planned downtime were available for 23 out of 52 sites across 8 of the 9 jurisdictions with PET-CT capacity. No data were available for British Columbia. Survey response data for unplanned downtime were available for 20 out of 52 sites across 8 of the 9 jurisdictions with PET-CT capacity. No data were available for British Columbia and New Brunswick.
Data were derived from the following survey questions: “How much planned downtime is anticipated for scheduled maintenance for all units in a given year? (expressed in hours)” and “How much unplanned downtime is experienced for all units in a given year? (expressed in hours)”.
Equipment Servicing at Sites With PET-CT and PET-MRI Imaging
The routine maintenance, inspection, and calibration of imaging equipment is usually managed though different types of equipment service agreements. Equipment servicing is part of health technology management and is intended to optimize the use of imaging equipment across its life cycle. Survey participants were asked to report on methods of servicing imaging equipment. The servicing methods included à la carte, full vendor, insurance, managed service contracts, shared service, third party, under warranty, and others. Definitions for types of servicing methods are available in Appendix 2.
Survey participants were asked to report these data at the modality level rather than the unit level. We received feedback indicating that, at sites where there was more than 1 PET-CT unit, in some instances, different servicing agreements may be used for different units.
For PET-CT, the most commonly used equipment servicing method was full vendor service, with 64% of sites, followed by shared service (36%) (Table 4).
Table 4: Imaging Equipment Servicing Methods at Sites With PET-CT Units by Reporting Jurisdictions With Capacity, 2022 to 2023
Province or territory | Full vendor | Managed service contracts | Shared service |
|---|---|---|---|
Number of sites (%) | |||
Alberta | 4 (100) | — | — |
British Columbia | NR | NR | NR |
Manitoba | 1 (50)a | — | 1 (50)a |
New Brunswick | 1 (100) | — | — |
Newfoundland and Labrador | 1 (100) | — | — |
Northwest Territories | — | — | — |
Nova Scotia | 1 (100) | — | — |
Nunavut | — | — | — |
Ontario | 5 (50) | 1 (10) | 4 (40) |
Prince Edward Island | — | — | — |
Quebec | 2 (33.3) | — | 4 (66.7) |
Saskatchewan | 1 (100) | — | — |
Yukon | — | — | — |
Canada | 16 (64.0) | 1 (4.2) | 9 (36.0) |
NR = not reported.
Notes: Survey response data were available for 25 out of 52 sites across 8 of the 9 jurisdictions with PET-CT capacity. No data were available for British Columbia.
Data were derived from the following survey question: “How is imaging equipment serviced?”
aSite reported the use of 2 different servicing methods.
Imaging Equipment Servicing at Sites With PET-MRI Units
One site with PET-MRI capacity reported information about equipment servicing. This PET-MRI unit in Ontario uses a full vendor service agreement.
Full-Time Equivalent Medical Radiation Technologists for PET-CT and PET-MRI Units
Sites were asked to provide information on the number of full-time equivalent (FTE) trained medical radiation technologists (MRTs) assigned at the site level. An FTE position for an MRT was defined as an 8-hour workday, 5 days per week. The reported number of FTE trained MRTs may not reflect the total number of filled FTE trained MRTs in jurisdictions with PET-CT capacity, but rather the total number of budgeted positions.
For PET-CT, an average of 4 FTE trained MRTs were assigned per site, ranging between 1 to 9 (Table 5).
For PET-MRI, 2 FTE trained MRTs were assigned to the 1 site that reported FTE information.
Table 5: Numbers of FTE Trained MRTs for PET-CT, 2022 to 2023
Province or territory | Number of reporting sites | Total FTE trained MRTs | Average FTE trained MRTs per site (minimum to maximum) | FTE trained MRTs per million populationa | Total PET-CT unitsb |
|---|---|---|---|---|---|
Alberta | 4 | 16 | 4 (3 to 5) | 3.4 | 5 |
British Columbia | NR | NR | NR | NR | 5 |
Manitoba | 1 | 3 | 3 (3 to 3) | 2.1 | 1 |
New Brunswick | 1 | 2 | 2 (2 to 2) | 2.4 | 2 |
Newfoundland and Labrador | 1 | 3 | 3 (3 to 3) | 5.6 | 1 |
Northwest Territories | — | — | — | — | — |
Nova Scotia | 1 | 4 | 4 (4 to 4) | 3.8 | 1 |
Nunavut | — | — | — | — | — |
Ontario | 10 | 36 | 3.6 (1 to 7) | 2.3 | 20c |
Prince Edward Island | — | — | — | — | — |
Quebec | 6 | 22 | 3.7 (2 to 9) | 2.5 | 24 |
Saskatchewan | 1 | 8 | 8 (8 to 8) | 6.5 | 1 |
Yukon | — | — | — | — | — |
Canada | 25 | 94 | 3.8 (1 to 9) | 2.4 | 60 |
FTE = full-time equivalent; MRT = medical radiation technologist; NR = not reported.
Notes: Survey response data were available for 25 out of 52 sites across 8 of the 9 jurisdictions with PET-CT capacity. No data were available for British Columbia.
Data were derived from the following survey question: “How many full-time equivalent (FTE) technologists are assigned to all units (collective number of FTEs for all units)?”
aEstimated population as of the first quarter of 2023.20
bUnit counts included all sites that participated in the national survey that reported information for number of units.
cIncludes 1 PET unit that was not hybrid (i.e., without CT or MRI capabilities).
Age of PET-CT and PET-MRI Imaging Equipment
Average Age of PET-CT
The average age of PET-CT equipment in Canada is 7.2 years, ranging between 0 and 30 years (Appendix 3, Table 16). In total, 73% of PET-CT units were operational within the past 10 years, and about half (52%) began operation within the past 5 years (Figure 10 and Appendix 3, Table 17). Table 30 (Appendix 4) presents the average age of equipment for publicly funded sites with capacity.
Ontario installed 2 new PET-CT units in 2022–2023. Alberta and Quebec each installed a new PET-CT in 2022–2023.
Figure 10: Percentage of Average Years of PET-CT Operation by Province and Territory, 2022 to 2023
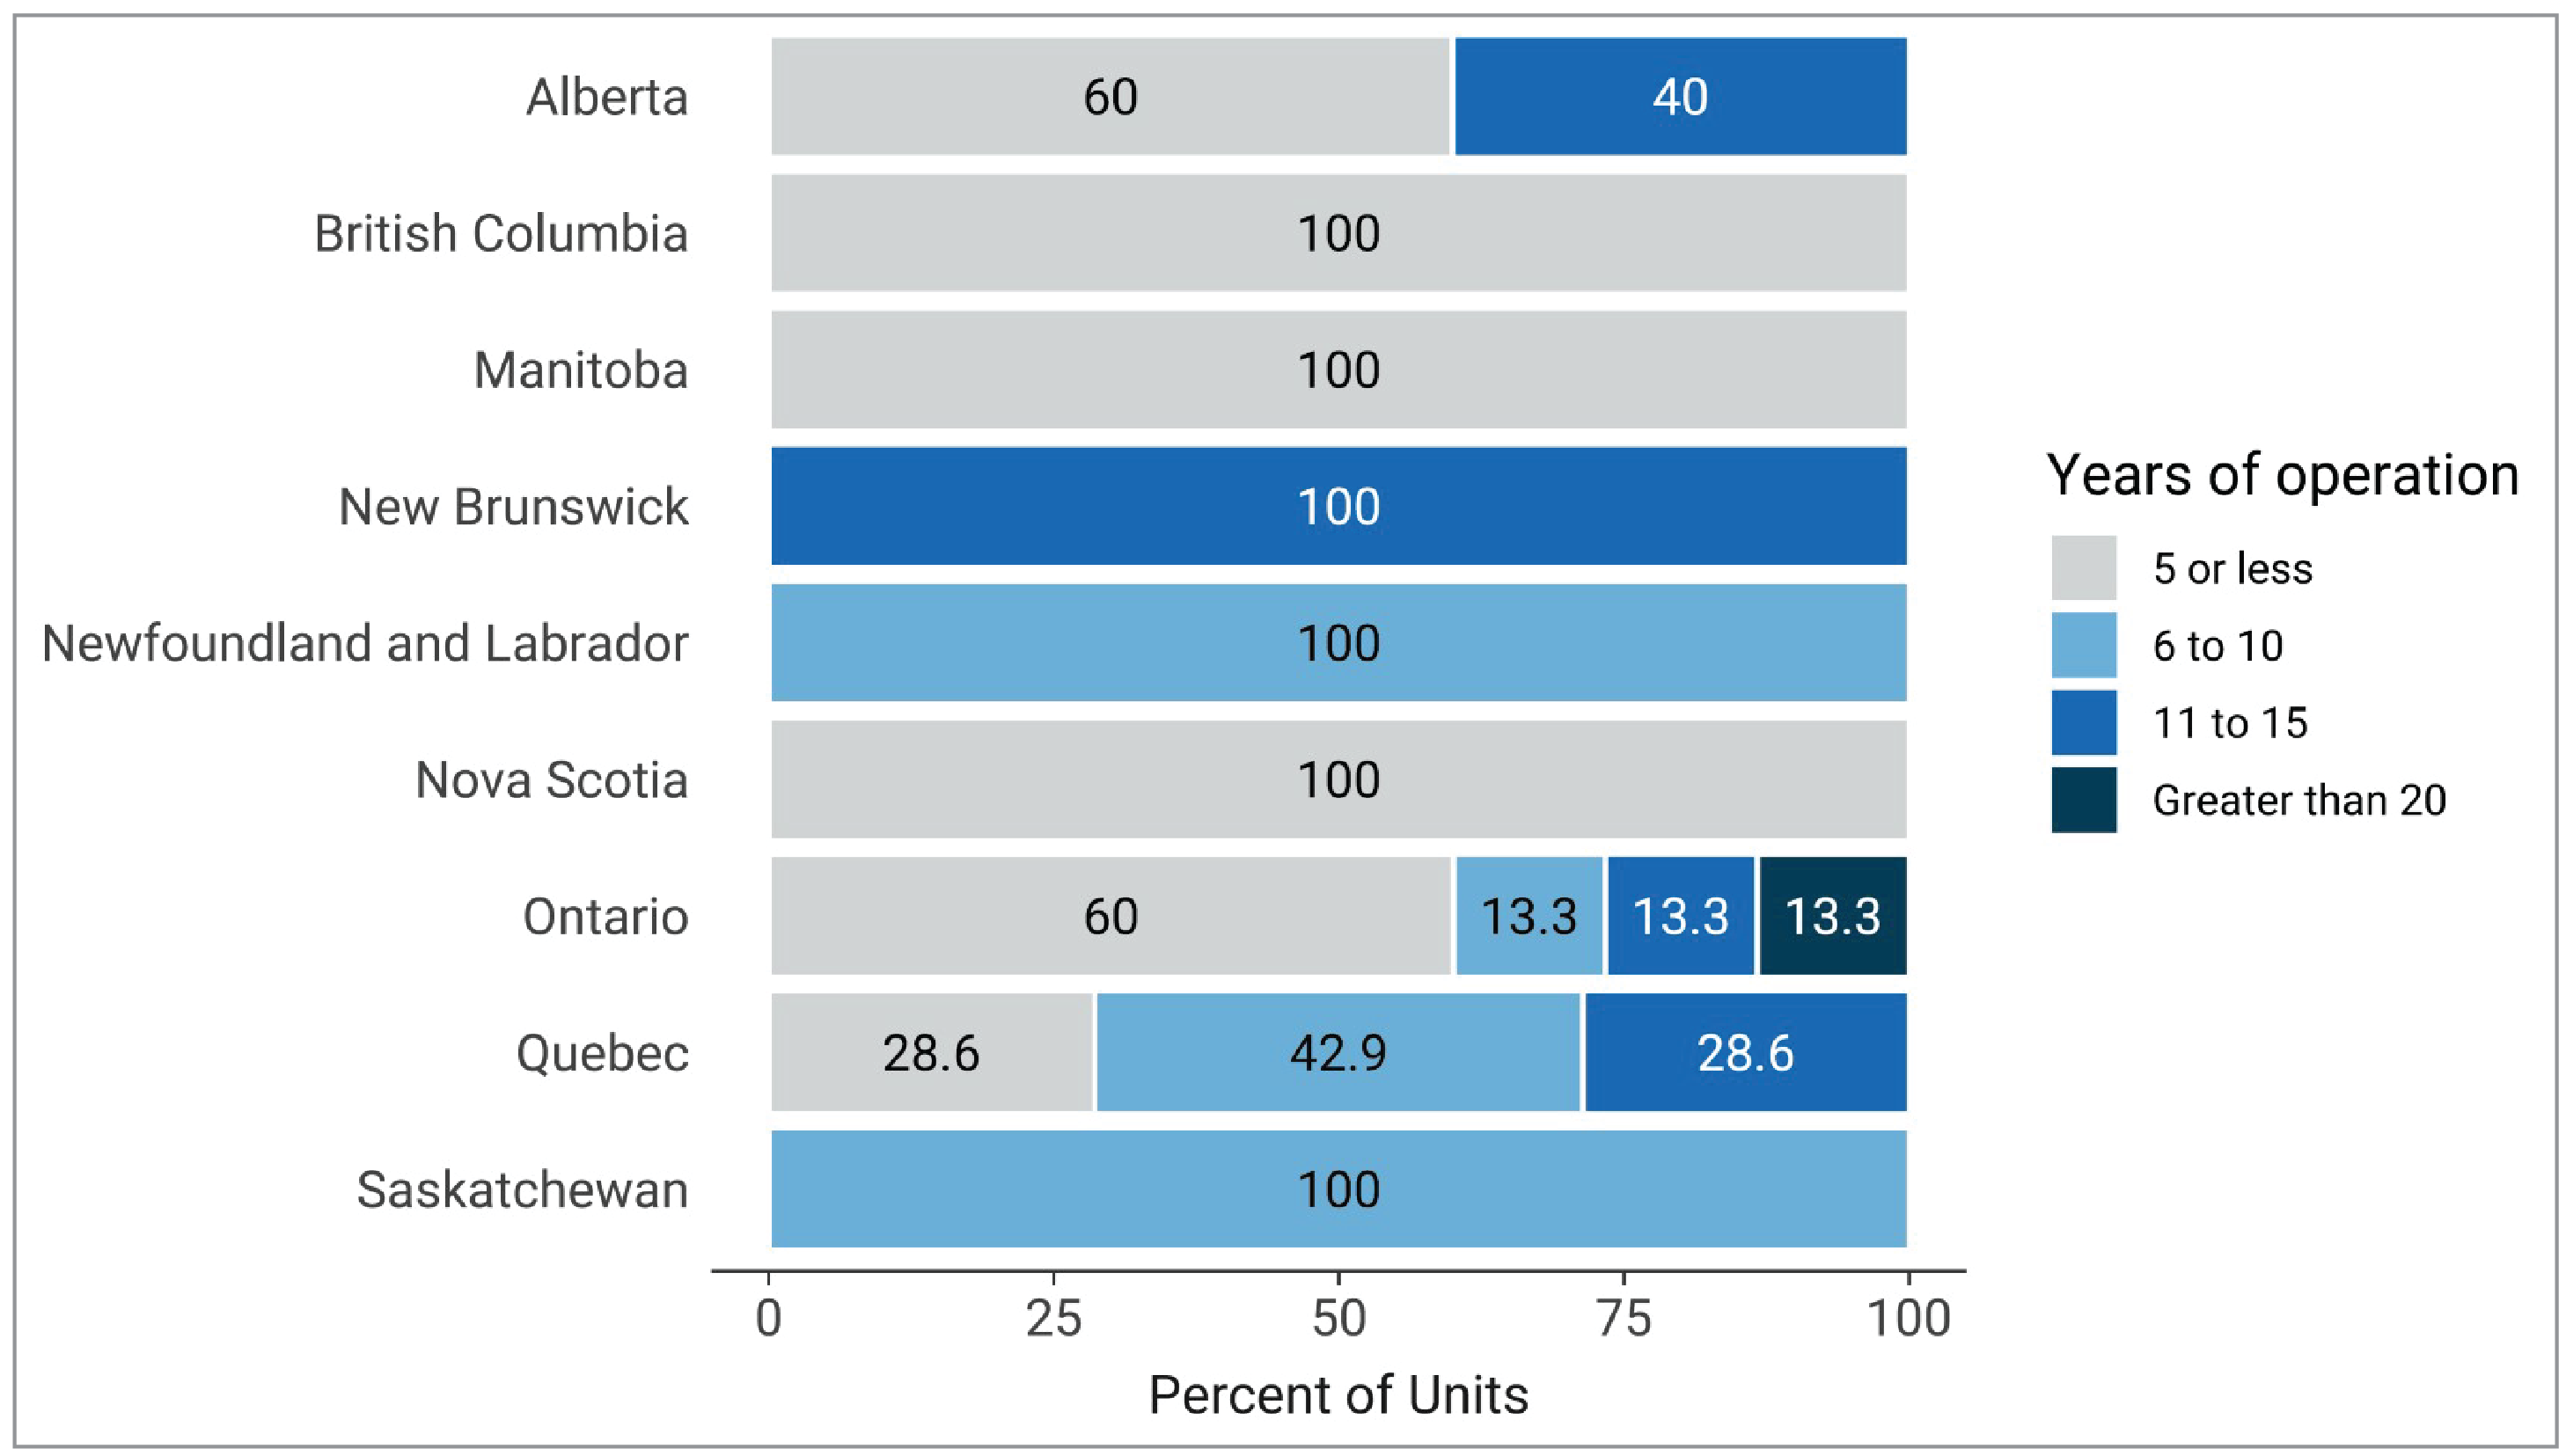
Notes: Survey response data were available for 33 of 60 PET-CT units across all jurisdictions with capacity.
Age for each unit was calculated from the following survey question: “What year did (or will) the [modality] unit become operational?” subtracted from 2023.
Average Age of PET-MRI
The average age of PET-MRI equipment in Canada is 6.7 years, ranging between 5 and 8 years for 2 units operational in Ontario and 1 in Alberta. Dates for first year of operation for the other PET-MRI units were not available.
Among the 3 sites with available data, the most recently installed PET-MRI unit was installed in 2018 and is located in Alberta.
Patterns of Use of PET-CT and PET-MRI Imaging Equipment
Purpose and Indication for PET-CT and PET-MRI Units
Purpose of PET-CT Use
For all sites that provided exam use data, on average, PET-CT exams were most often indicated for oncology, at 66.1% (use at individual sites ranged from 10% to 100%), followed by cardiology at 13.2% (range, 1% to 100%), and neurology at 10.1% (range, 2% to 100%) (Figure 11 and Appendix 3, Table 18).
For all sites that provided use data, on average, PET-CT was most often used for diagnostic noncardiac purposes (80.4%), followed by diagnostic cardiac purposes (12.2%), and research purposes (4.5%) (Figure 12 and Appendix 3, Table 19).
Purpose of PET-MRI Use
One PET-MRI unit in Ontario reported 97% use for neurologic indications, 2% musculoskeletal, and 1% cardiac; 98% of all use was for research purposes.
Figure 11: PET-CT Use by Clinical Specialty, 2022 to 2023
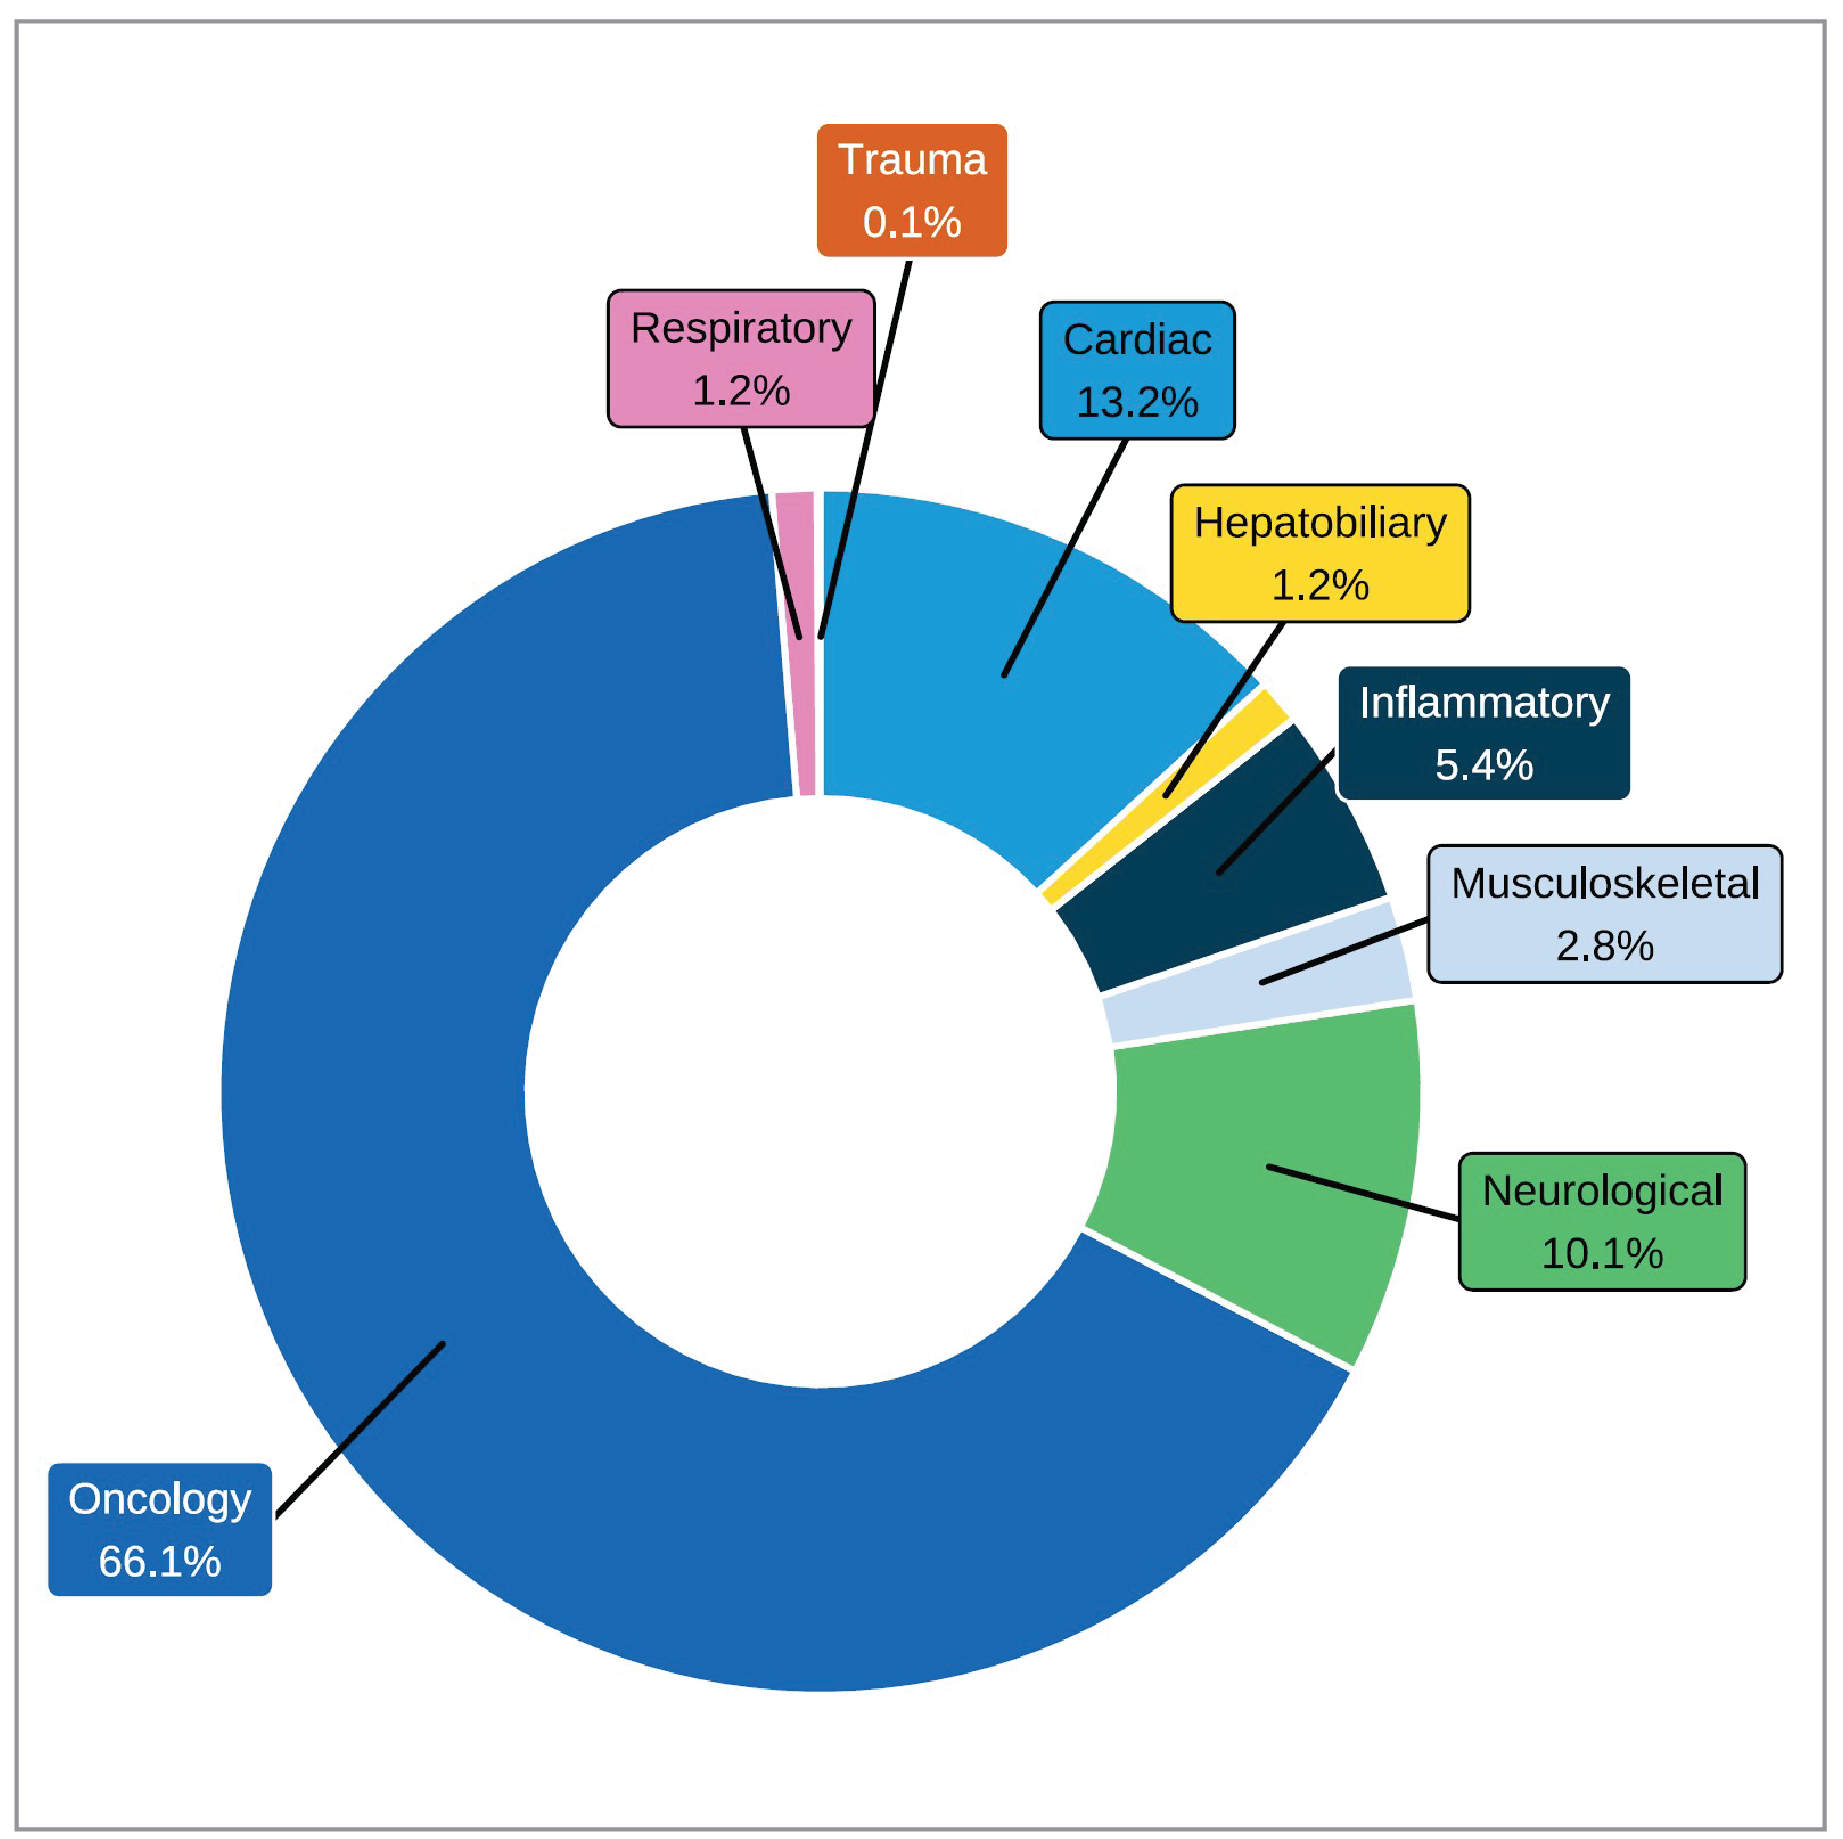
Notes: Survey response data on the average percentage of PET-CT use by discipline were available for 16 out of 52 sites across 4 of the 9 jurisdictions with PET-CT capacity.
Data were derived from the following survey question: “On average, what percentage of these exams fall into the following categories? The total percentage, expressed as a number, must add up to 100.” The following categories were offered: oncology, respiratory, hepatobiliary, musculoskeletal, inflammatory or infectious disease, neurological, cardiac, trauma, and other.
Integration of Use of Artificial Intelligence in PET-CT and PET-MRI Imaging
Artificial intelligence (AI) is a branch of computer science concerned with the development of systems that can perform problem-solving, reasoning, and recognition tasks.21,22
The current focus of AI in medical imaging departments in Canada includes, but is not limited to, assisting imaging professionals in lowering radiation dose, reading and interpreting images, image reconstruction, planning treatment, predicting outcomes, and carrying out administrative tasks.21,22
Survey participants were asked to report on the use of AI for PET-CT and PET-MRI in the clinical and/or research setting. Most sites either did not respond to the questions on AI use, or answered with “no,” indicating that it was not used.
Figure 12: Purpose of PET-CT Use (by Category), 2022 to 2023
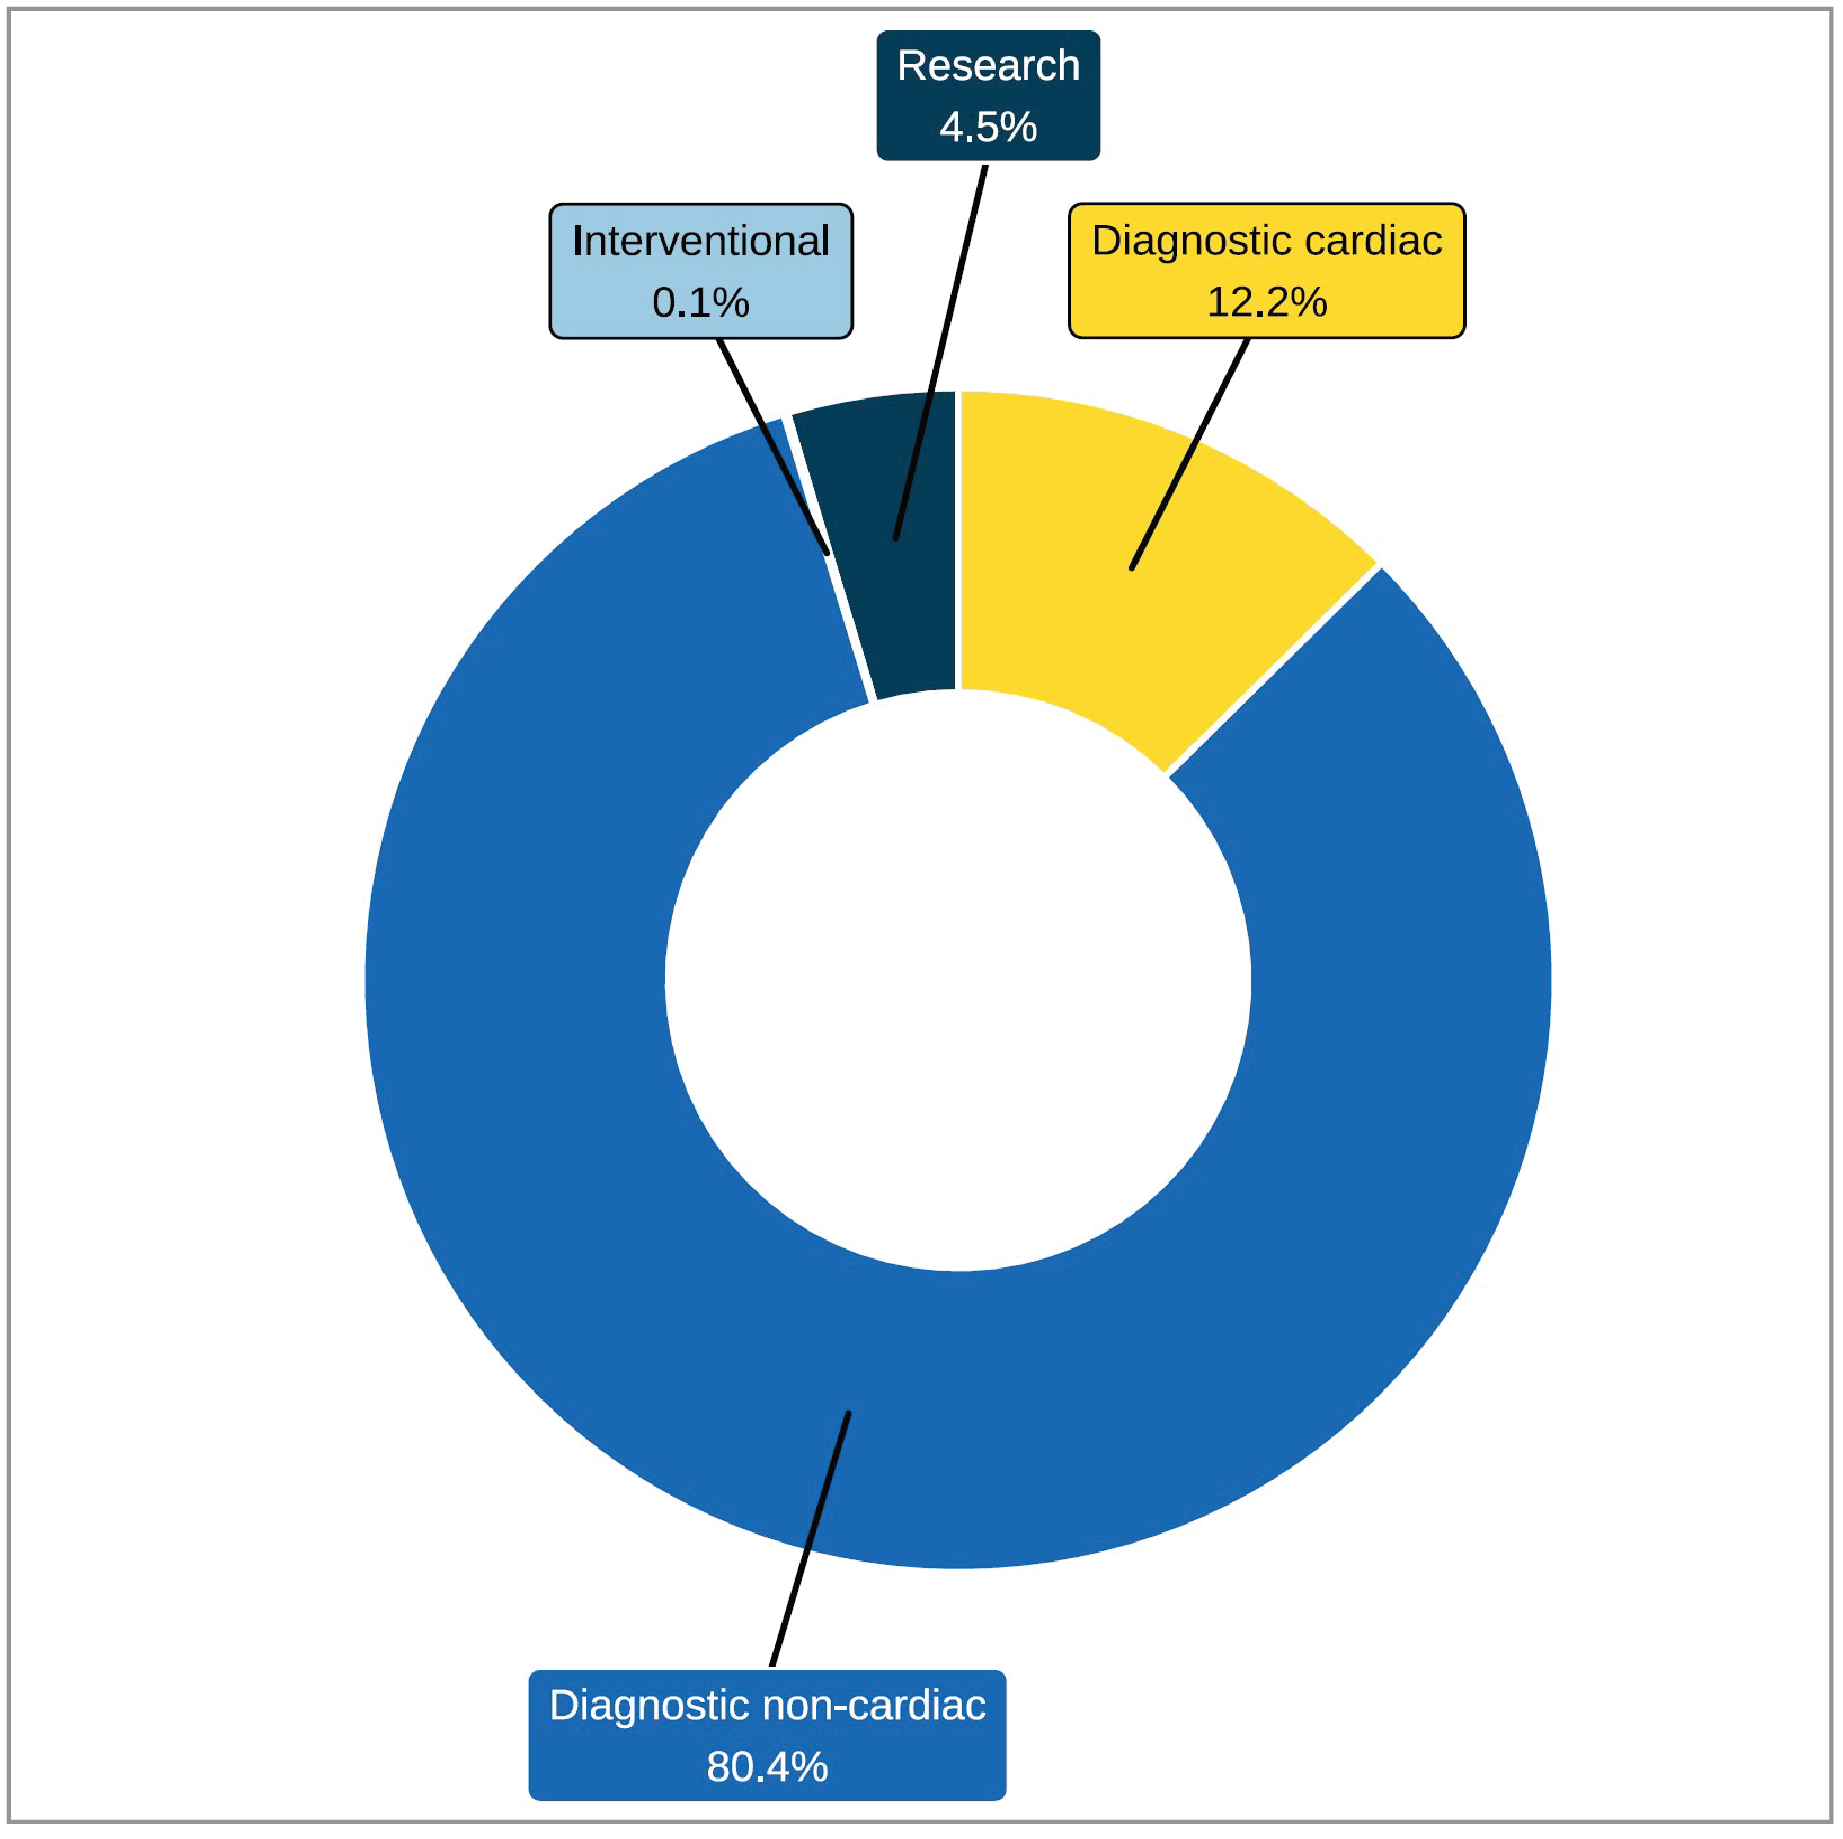
Notes: Survey response data on the average percentage of PET-CT use by discipline were available for 22 out of 52 sites across 5 of the 9 jurisdictions with PET-CT capacity.
Data were derived from the following survey question: “Based on your practice in the last fiscal year, what percentage of time are all units used for? The total percentage, expressed as a number, must add up to 100.” The following categories were offered: diagnostic purposes (cardiac only), diagnostic purposes (noncardiac), research, interventional, and other. Sections are labelled with the average percent of use in each category.
Use of AI for PET-CT
Data were available for 23 sites with PET-CT capacity; results are shown in Appendix 3, Table 20.
Three sites located in New Brunswick, Ontario, and Quebec reported the use of AI with PET-CT in the clinical setting for lowering radiation dose and image reconstruction.
One site in Ontario used AI with PET-CT in the research setting for lowering radiation dose, image reconstruction, and carrying out administrative tasks.
Use of AI for PET-MRI
One site in Ontario reported the use of AI with PET-MRI in the research setting for all the tasks of interest: lowering radiation dose, reading and interpreting images, image reconstruction, planning treatment, predicting outcomes, and carrying out administrative tasks.
Ordering and Receiving Exams
Exam-Ordering Privileges at Sites With PET-CT Units
Jurisdictional validators were asked to provide details on the exam-ordering privileges of different types of health care professionals working in the public setting. Responses are summarized in Appendix 3, Table 21. The results showed the following:
In all provinces that operate PET-CT units, clinical specialists are authorized to order PET-CT exams, although in British Columbia, PET-CT scans are primarily used for oncology indications with limited use for cardiology indications.
Family doctors and general practitioners can order PET-CT scans in Alberta and Saskatchewan. While the Northwest Territories does not operate a PET-CT unit, clinical specialists, family physicians, and general practitioners can provide PET-CT exam referrals out of territory.
Nurse practitioners in Saskatchewan have PET-CT ordering privileges.
In Manitoba, Newfoundland and Labrador, and Ontario, all requests are reviewed for clinical appropriateness before being accepted. PET-CT orders will be accepted from family doctors after a nuclear medicine physician reviews the request to determine clinical appropriateness. In Newfoundland and Labrador, PET-CT orders are also accepted from nurse practitioners, following review by a nuclear medicine physician.
In Quebec, there are specific conditions (not specified) under which family doctors and nurse practitioners can order PET-CT scans.
In Nunavut, referrals for PET-CT scans are made for out of territory.
For New Brunswick, the responses came from 1 of the 2 regional health authorities, the Horizon Health Network.
How Exam Requests Are Received at Sites With PET-CT and PET-MRI Imaging
Survey participants were asked to report their exam-ordering practices from the following options: requests by automated order entry, paper, fax, telephone, and centralized order entry for some, or all, exams.
For PET-CT exam requests, the most common reported means were paper form (92%), fax (89%), and centralized order entry booking (68%), based on 27 sites with responses (Figure 13 and Appendix 3, Table 22).
For PET-MRI, 1 site in Ontario reported centralized order entry for all exams.
Appropriateness and Quality Assurance Tools for PET-CT and PET-MRI Imaging
As imaging exam volumes continue to increase in Canada, so does the rate of low-value exam referrals that can impact exam wait times.23 To help minimize low-value imaging, appropriateness processes, decision support tools, and peer-review programs may be implemented.
Use of Clinical Decision Support Tools in PET-CT and PET-MRI
A clinical decision support tool (CDST) is a tool that provides real-time guidance to physicians on the appropriateness of diagnostic imaging tests for a given patient during the ordering process.14
One site (3.8%) reported that referring physicians use CDSTs for ordering PET-CT exams (Table 6).
Data were available from 1 site in Ontario with a PET-MRI unit, which reported that CDSTs were not used to guide appropriateness.
Figure 13: Summary of PET-CT Exam-Ordering Practices at Sites That Reported a Process, 2022 to 2023
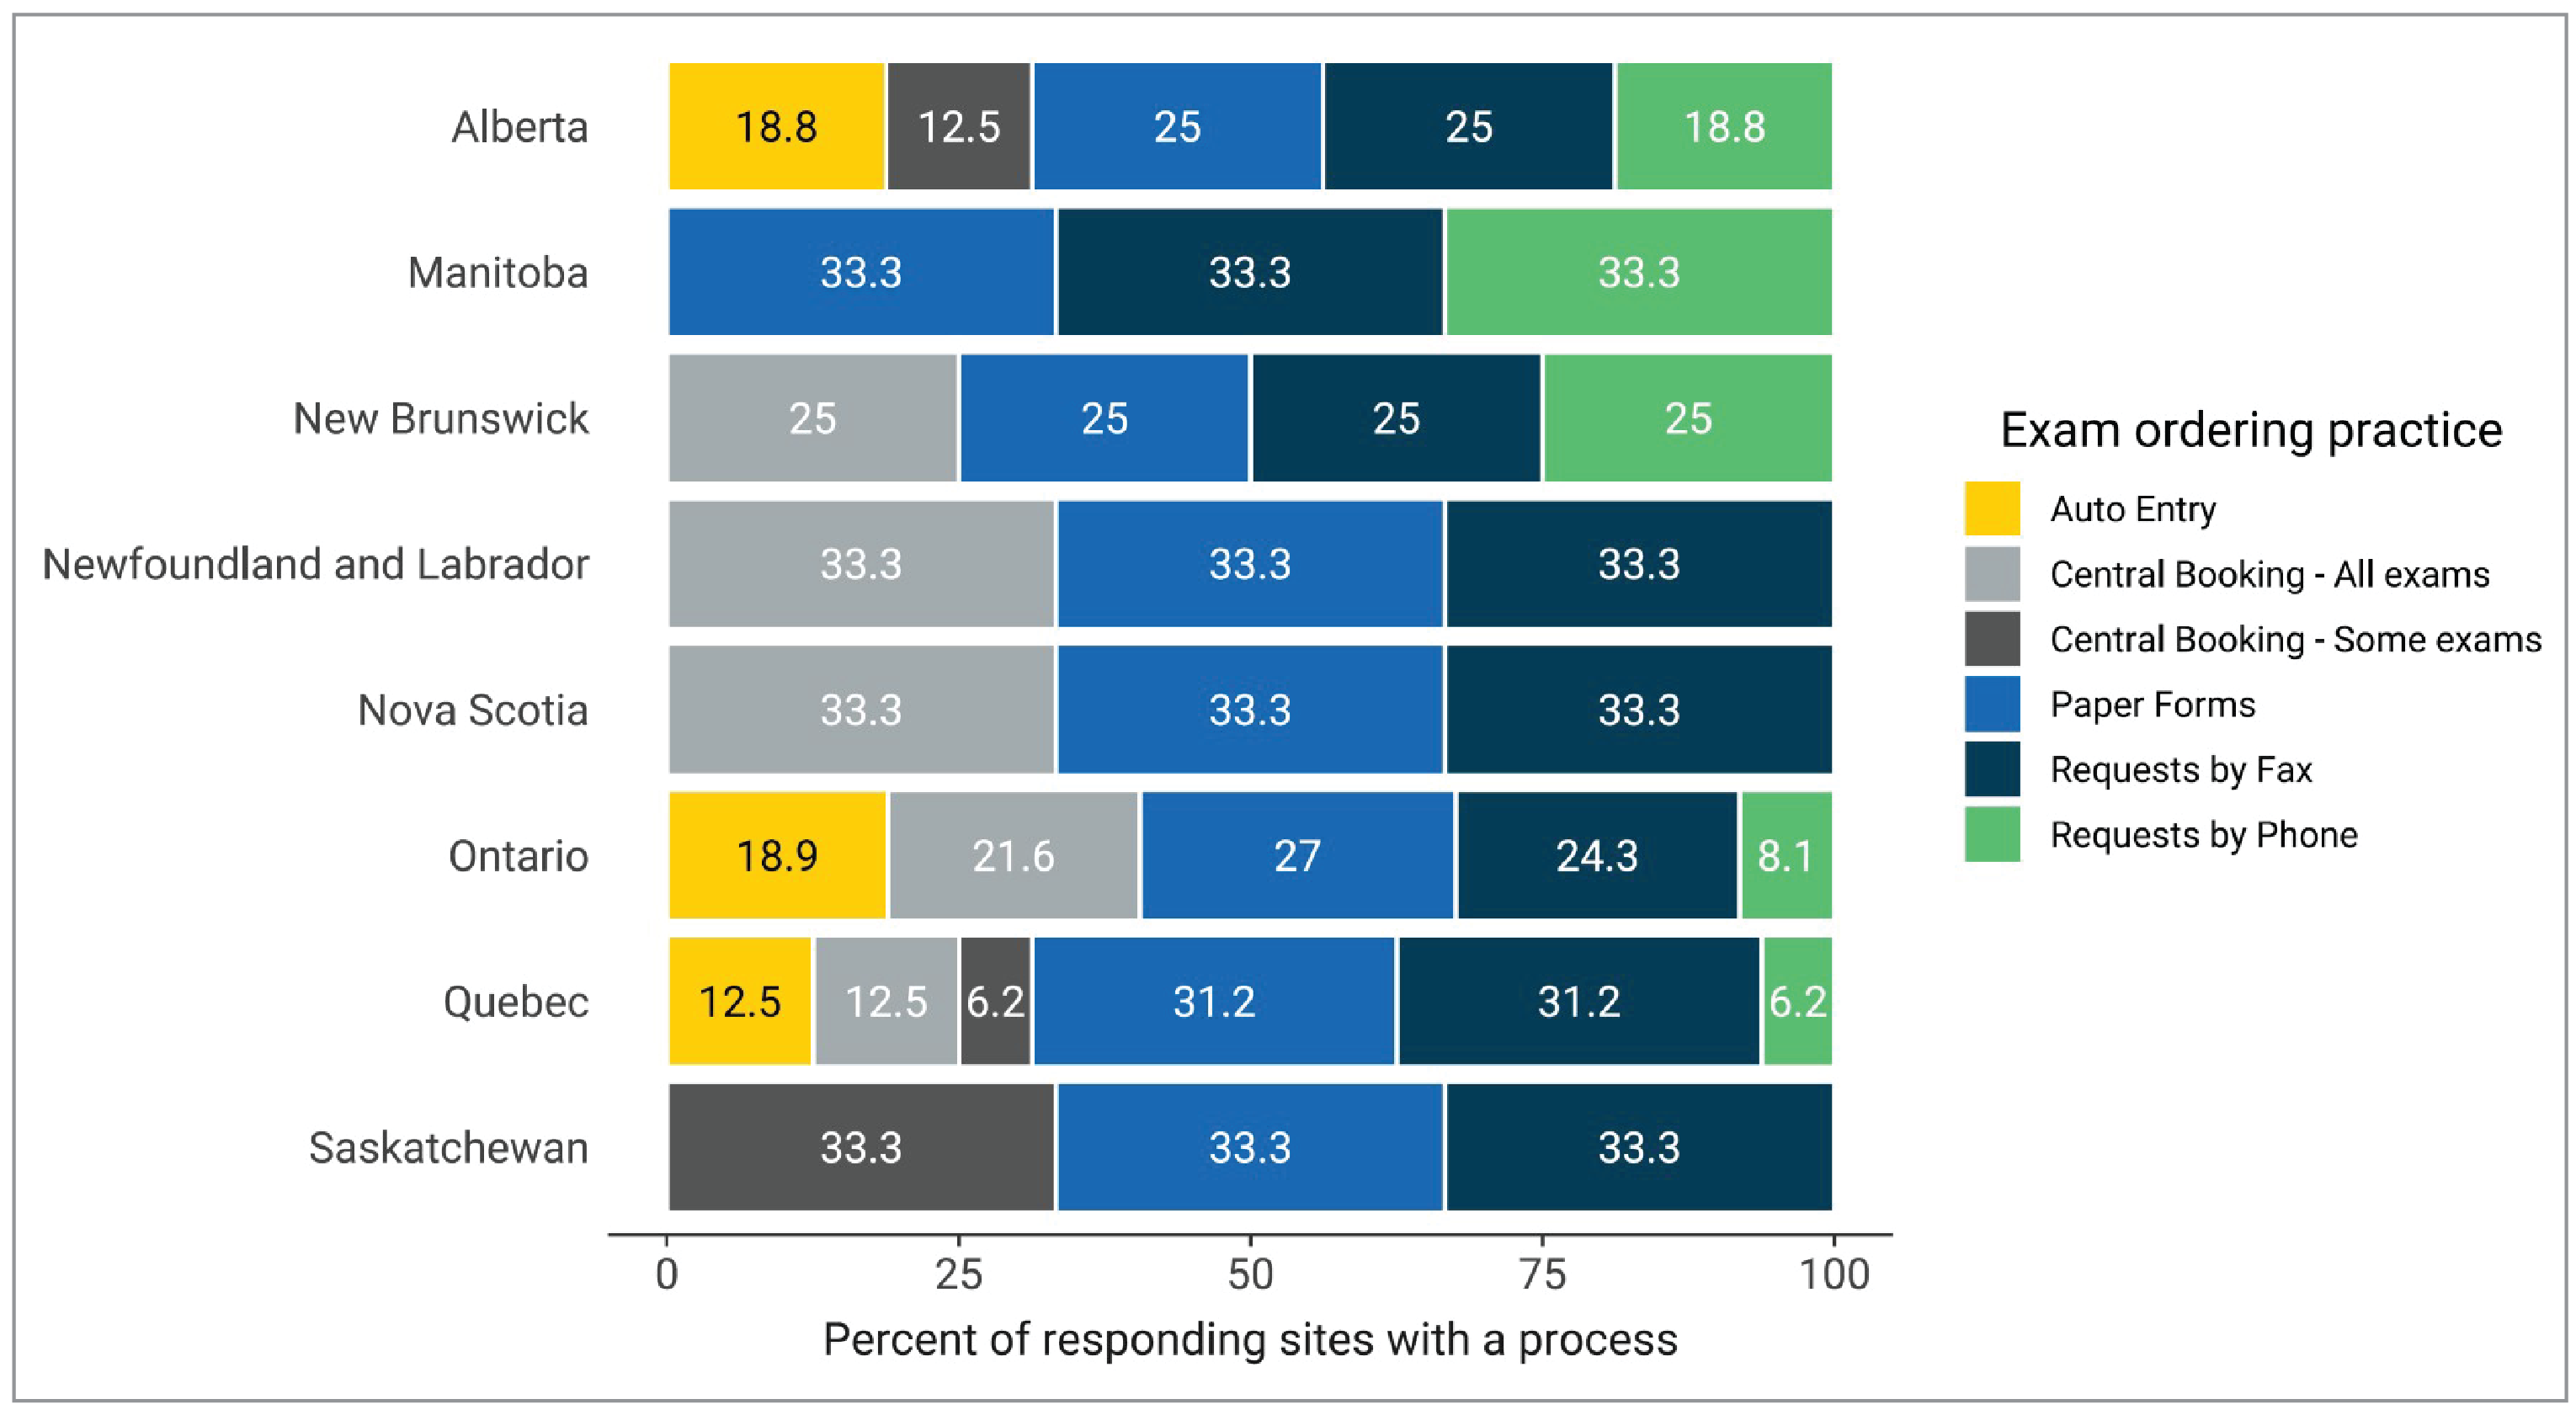
Notes: Survey response data were available for 27 out of 52 sites across 8 of the 9 jurisdictions with PET-CT capacity. No data were available from British Columbia.
Data were derived from the following survey questions: “Are automated order entry forms (exams request) used?”; “Are paper forms (exams requests) used?”; “Are requests received by fax?”; “Are requests received by phone?”; and “Is a centralized order entry (booking) system used? For all exams: Yes/no; For some exams: yes/no.”
Use of Peer Learning in PET-CT and PET-MRI
Peer learning is a tool that is widely used in diagnostic imaging. Radiologists undertake peer review as part of the peer-learning workflow, often anonymously, in clinical practice to provide ongoing feedback to improve performance, reduce discrepancy and error, maintain standards, provide credibility, support learning, and identify gaps in education.24
Eighteen sites (54.5%) with PET-CT used peer review of images for quality assurance (Table 6).
Data were available from 1 site in Ontario with a PET-MRI unit, which reported that peer-review programs are not used to assist in quality assurance.
Table 6: Use of CDSTs and Peer Learning at Sites With PET-CT, 2022 to 2023
Province or territory | CDST | Peer review | ||
|---|---|---|---|---|
Number of sites reporting “yes” (% of sites) | Number of reporting sites | Number of sites reporting “yes” (% of sites) | Number of reporting sites | |
Alberta | 0 (0) | 4 | 0 (0) | 4 |
British Columbia | NR | NR | 2 (100) | 2 |
Manitoba | 0 (0) | 1 | 0 (0) | 1 |
New Brunswick | 0 (0) | 1 | 1 (50) | 2 |
Newfoundland and Labrador | 0 (0) | 1 | 0 (0) | 1 |
Northwest Territories | — | — | — | — |
Nova Scotia | 0 (0) | 1 | 1 (100) | 1 |
Nunavut | — | — | — | — |
Ontario | 1 (9.1) | 11 | 9 (75) | 12 |
Prince Edward Island | — | — | — | — |
Quebec | 0 (0) | 6 | 5 (55.6) | 9 |
Saskatchewan | 0 (0) | 1 | 0 (0) | 1 |
Yukon | — | — | — | — |
Canada | 1 (3.8) | 26 | 18 (54.5) | 33 |
CDST = clinical decision support tool; NR = not reported.
Notes: Survey response data about CDSTs were available for 26 out of 52 sites across 8 of the 9 jurisdictions with PET-CT capacity. No data were available from British Columbia. Survey response data about peer review were available for 33 out of 52 sites across all jurisdictions with PET-CT capacity.
CDST data were derived from the following survey question: “Is a clinical decision support tool used at the point of care by medical professionals referring patients to medical imaging? A clinical decision support tool provides real-time guidance to physicians on the appropriateness of diagnostic imaging tests for a given patient during the ordering process.” Options were: “Yes,” “No,” and “Don’t know.” Additional data were supplemented from the following survey question: “Do you have a process for determining the appropriateness of orders that are received? If yes, which process is used?”
Peer-review data were derived from the following survey question: “Do radiologists at your facility participate in a peer-review program for image reading and interpretation for the purpose of quality assurance?” Options were: “Yes,” “No,” and “Don’t know.”
Picture Archiving and Communication Systems
A picture archiving and communications system (PACS) is an electronic system used to digitally manage images, including transmission, filing, storage, distribution, and retrieval of medical images. A detailed definition is provided in Appendix 2.
PET-CT and PACS
Sites with PET-CT capacity were asked whether medical images were stored on a PACS and accessible throughout the jurisdiction in which the site operates. Data were available for 22 sites with a PACS, noting that:
90.9% of responding sites with PET-CT capacity reported PACS access throughout the provincial health care system without the need for manual retrieval (20 sites)
40.9% of sites reported local access to a PACS (9 sites)
27.3% of sites had regional access to a PACS (6 sites)
31.8% of sites had intraprovincial access to a PACS (7 sites)
95.5% of sites reported that PACS images were accessible to referring physicians located in areas of the hospital outside of diagnostic imaging (21 sites).
PET-MRI and PACS
All 6 sites with PET-MRI capacity in Canada reported the use of a PACS.
A total of 80% of responding sites with PET-MRI capacity reported PACS access throughout the provincial health care system without need for manual retrieval (4 of 5 sites). One site indicated that their PACS was not connected to regional or provincial health care systems.
Two sites reported regional access to a PACS, and 2 sites reported local and provincial access to PACS (4 of 6 sites).
Overall, 83.3% of responding sites reported that PACS images were accessible to referring physicians located in areas of the hospital outside of diagnostic imaging (5 of 6 sites).
Technical Characteristics of PET-CT Equipment
We collected data on the number of detector row slices, the imaging scope, and whether CT functionality was used independently to increase site CT capacity.
Technical Specifications of PET-CT Units
The number of multidetector slices was reported for 27 PET-CT units (Figure 14 and Appendix 3, Table 23).
Overall, 64-slice scanning was the most common, reported for 14 units (51.9%), followed by 128-slice scanning for 4 units (14.8%), and 16-slice and 40-slice scanning, which were both available in 3 units (11.1%).
All PET-CT units with information on imaging scope were near-whole body or full body. One PET unit without CT capacity was used for head-only scans.
The CT component was used independently to provide extra CT capacity in 16.7% of units located in 4 provinces (4 of 24 units reported): 1 unit each in Alberta and New Brunswick, and 2 units in Ontario.
In recent years, the field of PET-CT has advanced with the introduction of digital PET-CT scanners. Compared to analogue PET-CT units, digital PET-CT scanners provide higher quality imaging, shorter scan times, and reduce patient radiation exposure.25
A total of 69% of PET-CT units were reported to be digital PET-CT scanners, located across 6 provinces: Alberta, British Columbia, Newfoundland and Labrador, Ontario, Quebec, and Saskatchewan (20 of 29 units reported).
Figure 14: Reported Proportion of Slices in PET-CT Units for Jurisdictions With Capacity, 2022 to 2023
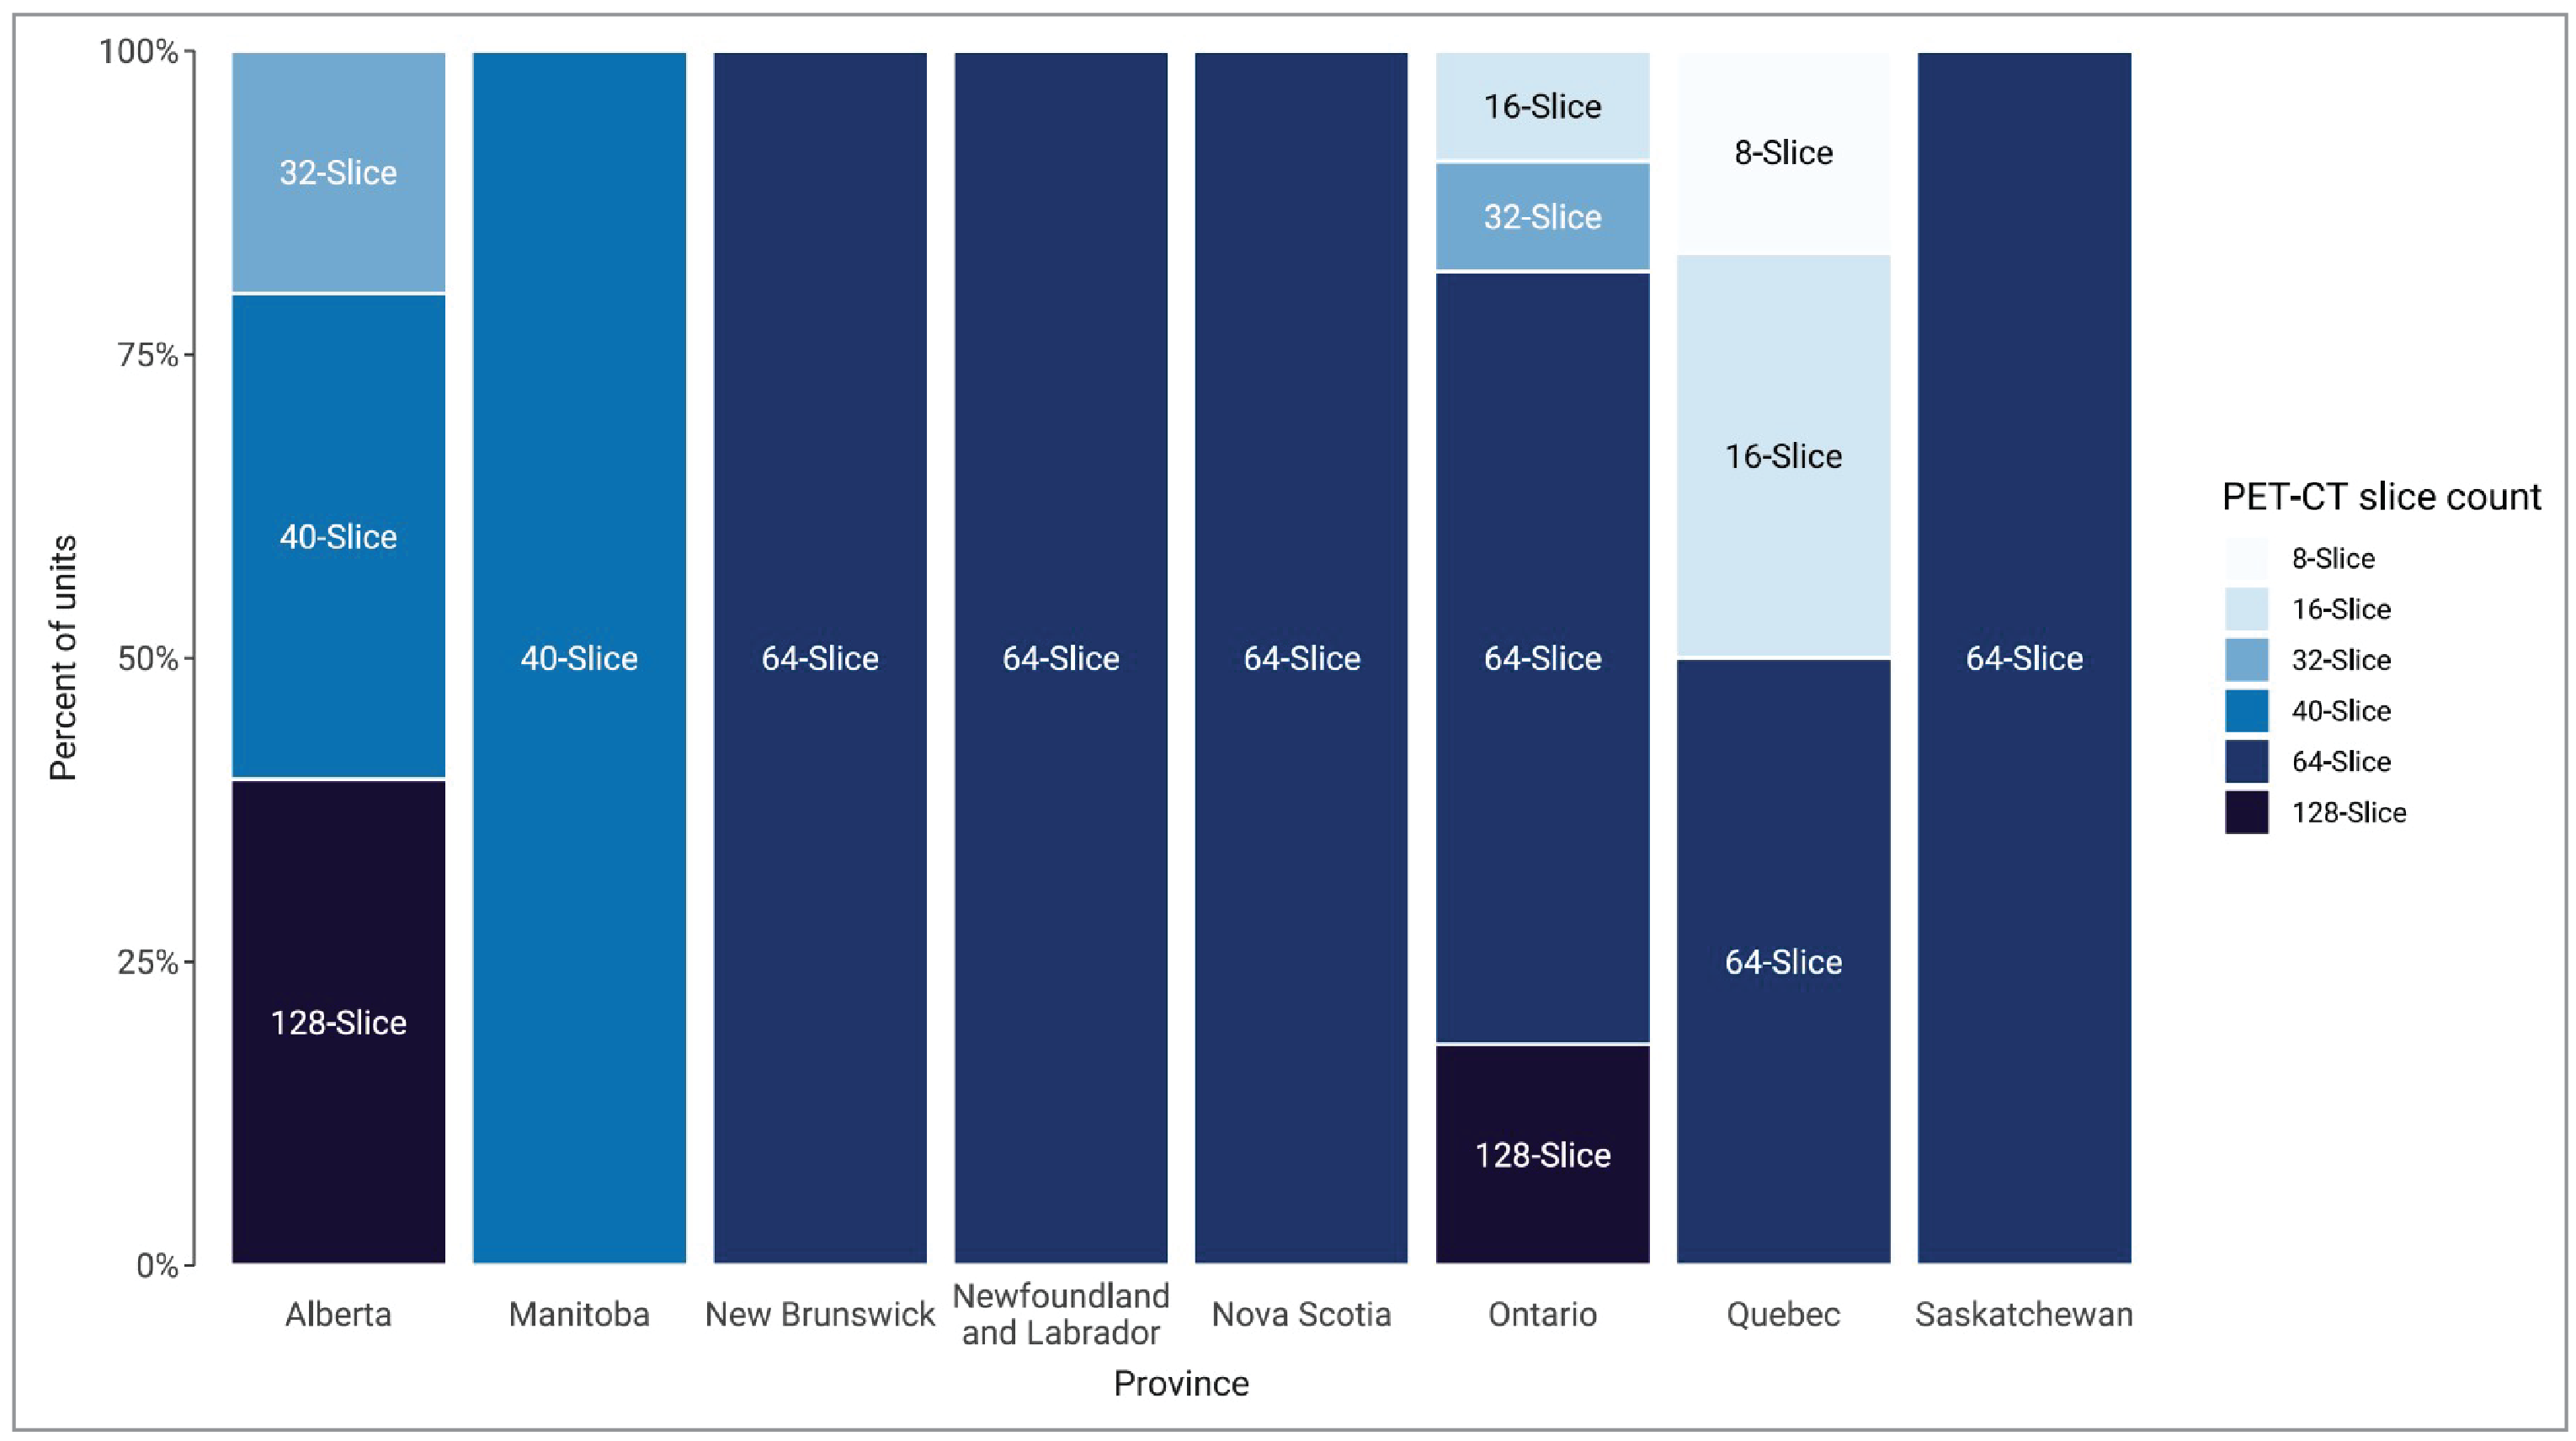
Notes: Survey response data were available for 27 out of 60 PET-CT units across 8 of the 9 jurisdictions with capacity. No data were available for British Columbia.
Data were derived from the following survey question: “How many multi-detectors does the CT unit have (how many slices)?”
Radiotracer Supply and Radiation Safety for PET-CT Units
Radiotracer Supply for PET-CT Units
A medical isotope emits radiation that is used to diagnose, stage, or treat disease.26 Isotopes are processed in a cyclotron, generator, or reactor to create radiotracers that are required to produce PET-CT images. Radiotracers can be produced locally if a site has a cyclotron; otherwise, shipment from another centre is required. Sites that rely on receiving radiotracers from larger centres are limited by geographic proximity to the producing site and often order twice the amount of radiotracers required to account for the in-transit decay because of the short half-life, thereby intensifying the demand for radiotracers.12 In some instances, radiotracers can be produced in generators that are delivered to sites.
The Canadian Nuclear Safety Commission website identified a total of 15 isotope producers and 23 research facilities in Canada.26,27
Overall, 21.7% of responding sites reported local access to a cyclotron (5 of 23 sites). Sites that reported access were located in Alberta, Ontario, and Quebec. The remaining sites that responded to the survey question indicated that radiotracers were sourced elsewhere.
There may be concerns about the capacity to supply the growing demand for radiotracers, given the significant increase in the volume of PET-CT exams since 2015 and the installation of new PET-CT units, particularly at sites that do not have access to a local cyclotron.
Radiotracer Use for PET-CT Units
Sites were asked to report on the different types of radiotracers used for oncology, cardiology, neurology, and other purposes, and to differentiate between clinical and research use (Figure 15 and Table 7). A total of 24 out of 52 sites with PET-CT capacity reported the use of radiotracers in 29 PET-CT units.
Oncology was the most reported indication for PET-CT use. The most common radiotracers used for oncology were fluorodeoxyglucose F18 and gallium-68 DOTA-TATE.
The use of certain radiotracers may be underrepresented due to the low response rate to these questions. For example, it is known that some jurisdictions support standardized provincial access via multisite Health Canada Clinical Trial Applications, which is not reflected in our survey results.
Figure 15: Average Percentage of PET-CT Radiotracer Use by Setting, 2022 to 2023
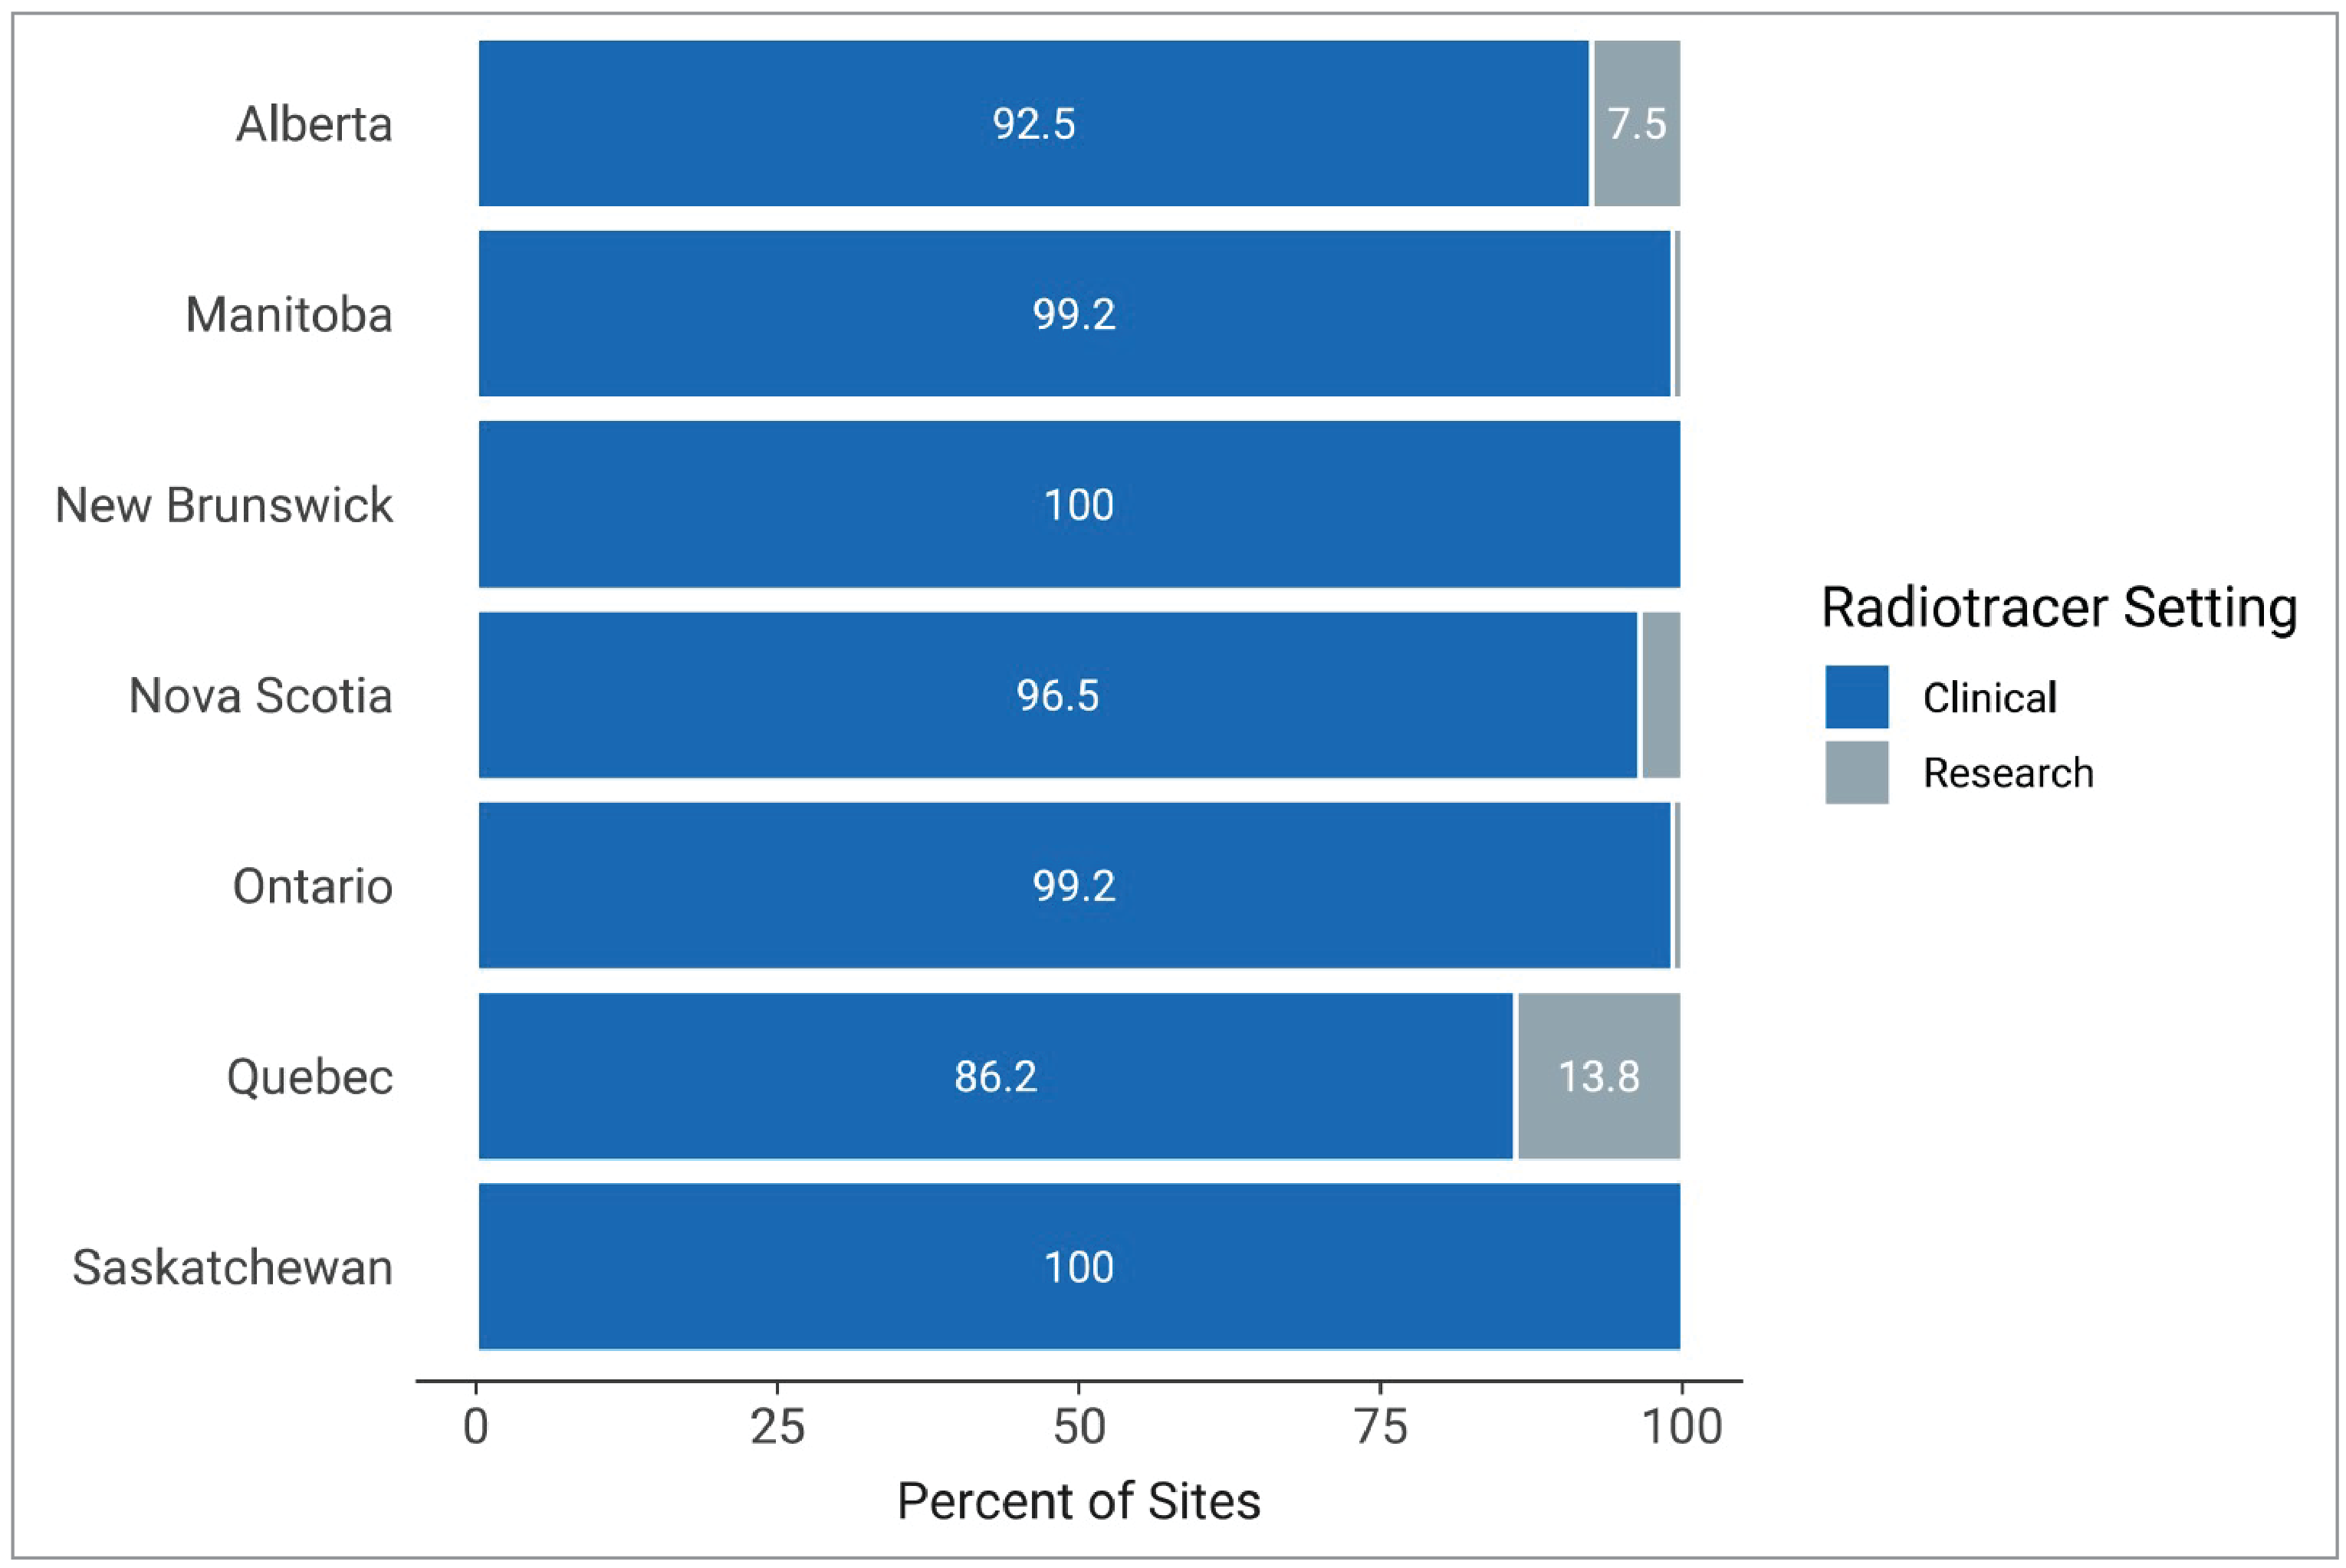
Notes: Survey response data for use by setting were available for 24 out of 52 sites across 7 of the 9 jurisdictions with PET-CT capacity. No data were available from British Columbia and Newfoundland and Labrador.
Data were derived from the following survey question: “What is your percentage of clinical use for each radiotracer you use? The total percentage, expressed as a number, must add up to 100.”
Radiation Considerations for PET-CT
There is ongoing concern about potential health hazards associated with imaging exams that use radiation.28 Hybrid imaging modalities that use CT contribute significantly to the radiation dose in individual patients, and strategies to monitor cumulative radiation dose are recommended.29,30 31
The survey asked about features intended to manage radiation safety (Appendix 3, Table 24). Of the sites that responded to the survey questions relating to radiation safety:
88% of PET-CT units recorded patient radiation dose per exam (22 of 25 units with information)
77% of PET-CT units had dose-management controls (20 of 26 units with information)
3 sites planned to capture patient cumulative radiation tracking in the future.
Table 7: Radiotracers for Clinical and Research Use in PET-CT, 2022 to 2023
Radiotracers | Clinical use | Research use |
|---|---|---|
Number of sites (% of responding sites) | ||
Oncology | ||
18F-FDG | 20 (90.9) | 7 (31.8) |
18F-Choline | 0 | 1 (4.5) |
68Ga-DOTA-TATE | 7 (31.8) | 3 (13.6) |
68Ga-DOTA-NOC | 0 | 1 (4.5) |
18F-PSMA-1007a | 1 (4.5) | 5 (22.7) |
18F-DCFPyL (BCCA, CPDC)a | 0 | 2 (9.1) |
68Ga-PSMA-HBED-CCb | 1 (4.5) | 2 (9.1) |
Cardiology | ||
13N-ammonia | 1 (4.5) | 2 (9.1) |
82Rb-chloride | 1 (4.5) | 0 |
Neurology | ||
18F-DOPA | 0 | 1 (4.5) |
18F-Florbetaben | 2 (9.1) | 1 (4.5) |
18F-Flutemetamol | 1 (4.5) | 1 (4.5) |
18F-Pittsburgh compound B | 0 | 1 (4.5) |
18F-AV-45 (Florbetapir) | 1 (4.5) | 1 (4.5) |
Infection and inflammation | ||
18F-Fluorodeoxysorbitol | 1 (4.5) | 0 |
18F-AV-45 = Florbetapir; 18F-Choline = fluorine-18–choline;18F-DCFPyL = fluorine F-18 piflufolastat; 18F-DOPA = fluorine-18–fluoro-dihydroxyphenylalanine; 18F-FDG = fluorine-18–fluorodeoxyglucose; 18F-Florbetaben = fluorine-18–florbetaben; 18F-Flutemetamol = fluorine-18–flutemetamol; 18F-PSMA-1007a = fluorine-18–prostate-specific membrane antigen-1007; 68Ga-DOTA-NOC = gallium-68–1,4,7,10-tetraazacyclododecane-1,4,7,10-tetraacetic acid-1-NaI3-octreotide; 68Ga-DOTA-TATE = gallium-68–1,4,7,10-tetraazacyclododecane-1,4,7,10-tetraacetic acid-tyrosine-3-octreotate; 68Ga-PSMA-HBED-CC = simultaneous gallium-68–prostate-specific membrane antigen; 13N-ammonia = nitrogen-13–ammonia; 82Rb-chloride = rubidium-82–chloride.
Notes: Survey response data were available for 22 out of 52 sites across 5 of the 9 jurisdictions with PET-CT capacity.
Data were derived from the following survey question: “Which radiotracers do you use for PET imaging? Divide answer into research and clinical purposes, plan to use in next 12 months.”
aThere is not currently a commercially available product for these agents; all access is via the Health Canada Clinical Trials Application.
bThis number is likely underrepresented, given the timing of the availability of commercial product compared to the data collection window for the national survey.
Trends in Technical Specifications of PET-CT
Trends Over Time in Number of Slices in PET-CT Units
In 2012, 16-slice was the most common scanning option used by PET-CT units. Since 2012, the percentage of PET-CT units with 16-slice scanning has decreased, from 75% of units in 2012 to 11.1% of units in 2022–2023 (Figure 16 and Appendix 3, Table 23).
Since 2012, the percentage of PET-CT units with 64-slice scanning has steadily increased, from 9.4% of units in 2012 to 51.9% of units in 2022–2023.
In 2022–2023, 14.8% of PET-CT units used 128-slice scanning, in Alberta and Ontario (4 of 27 reported units).
Figure 16: Trends in Number of Slices in PET-CT Units, 2012 to 2022–2023
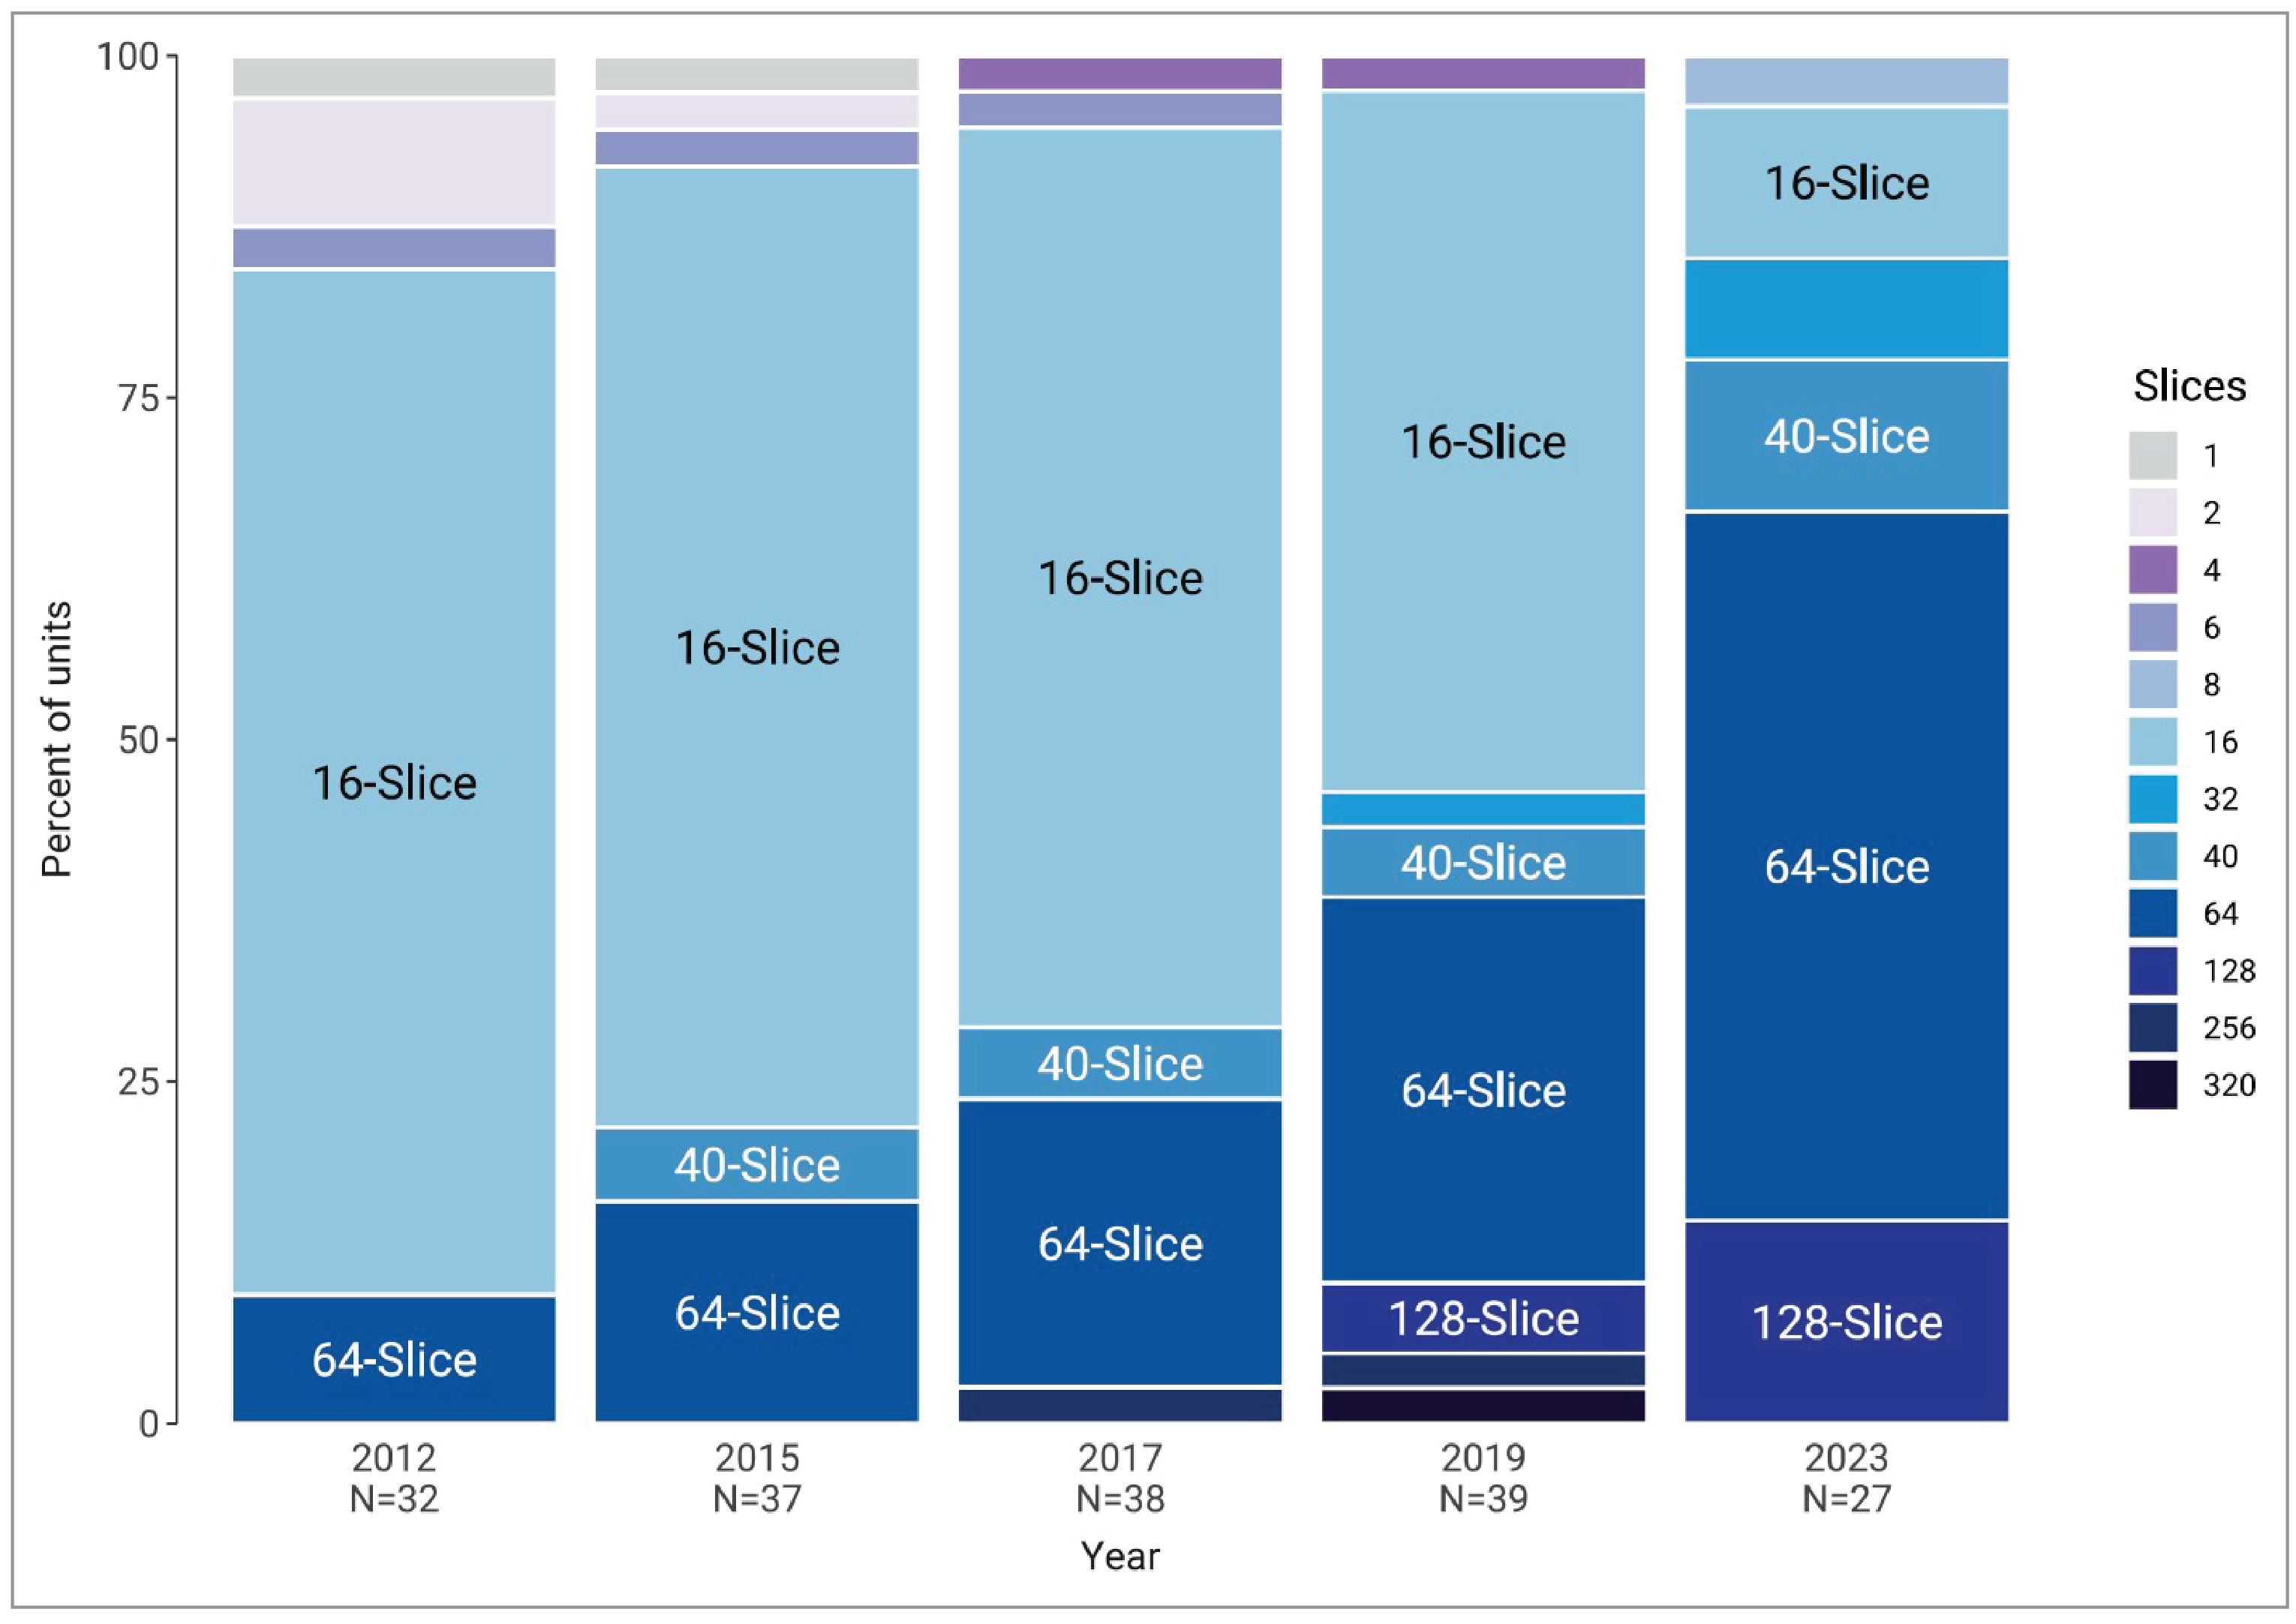
CIHI = Canadian Institute for Health Information; CMII = Canadian Medical Imaging Inventory.
Notes: Number of units with data available for each year is indicated with the year.
The 2023 data were derived from the following survey question: “How many multi-detectors does the CT unit have (how many slices)?”
Source: CIHI (2012)17, the CIHI QuickStats dataset,16 CMII (2015),13 CMII (2017),15 CMII (2020),14 and CMII (2022–2023). The 2015 data were subject to additional data-cleaning before being uploaded for the 2017 survey, and this cleaned dataset was used.
Scope of PET-CT Units, 2015 to 2022–2023
Data on the scope of imaging were collected for CMII surveys conducted between 2015 and 2022–2023. From 2015 to 2019–2020, all PET-CT units that reported data on scope were identified as near-full body or full body. In 2022–2023, all PET-CT units that reported data on scope were identified as near-full body or full body.
Availability and Use of Technologies for Control of Radiation Exposure, 2015 to 2022–2023
Since 2015, Alberta, Ontario, Quebec, and Saskatchewan have reported the use of dose-management controls and dose recording in PET-CT. Table 24 (Appendix 3) shows the availability and use of technologies for control of radiation exposure in PET-CT units from CMII surveys conducted between 2015 and 2022–2023, for units with available information.
The number of PET-CT units reported to have dose-management controls increased from 18.6% in 2015 to 33.3% in 2022–2023.
International Comparisons
Canadian Data Compared With International Data
We compared Canadian PET-CT and PET unit counts and exam volume data with those of other Organisation for Economic Co-operation and Development (OECD) countries.32 The comparison was made with the latest available year that data were available for each OECD country.
Canada is below the OECD average of 2.6 units per million population at 1.5, positioned 24th among 32 countries (Figure 17).
Canada ranks below the OECD average of 5.0 exams per 1,000 population at 3.9, positioned 15th among 26 countries (Figure 18).
Figure 17: Comparison of Canadian and International Data for PET or PET-CT Scanners per Million Population, 2022 to 2023
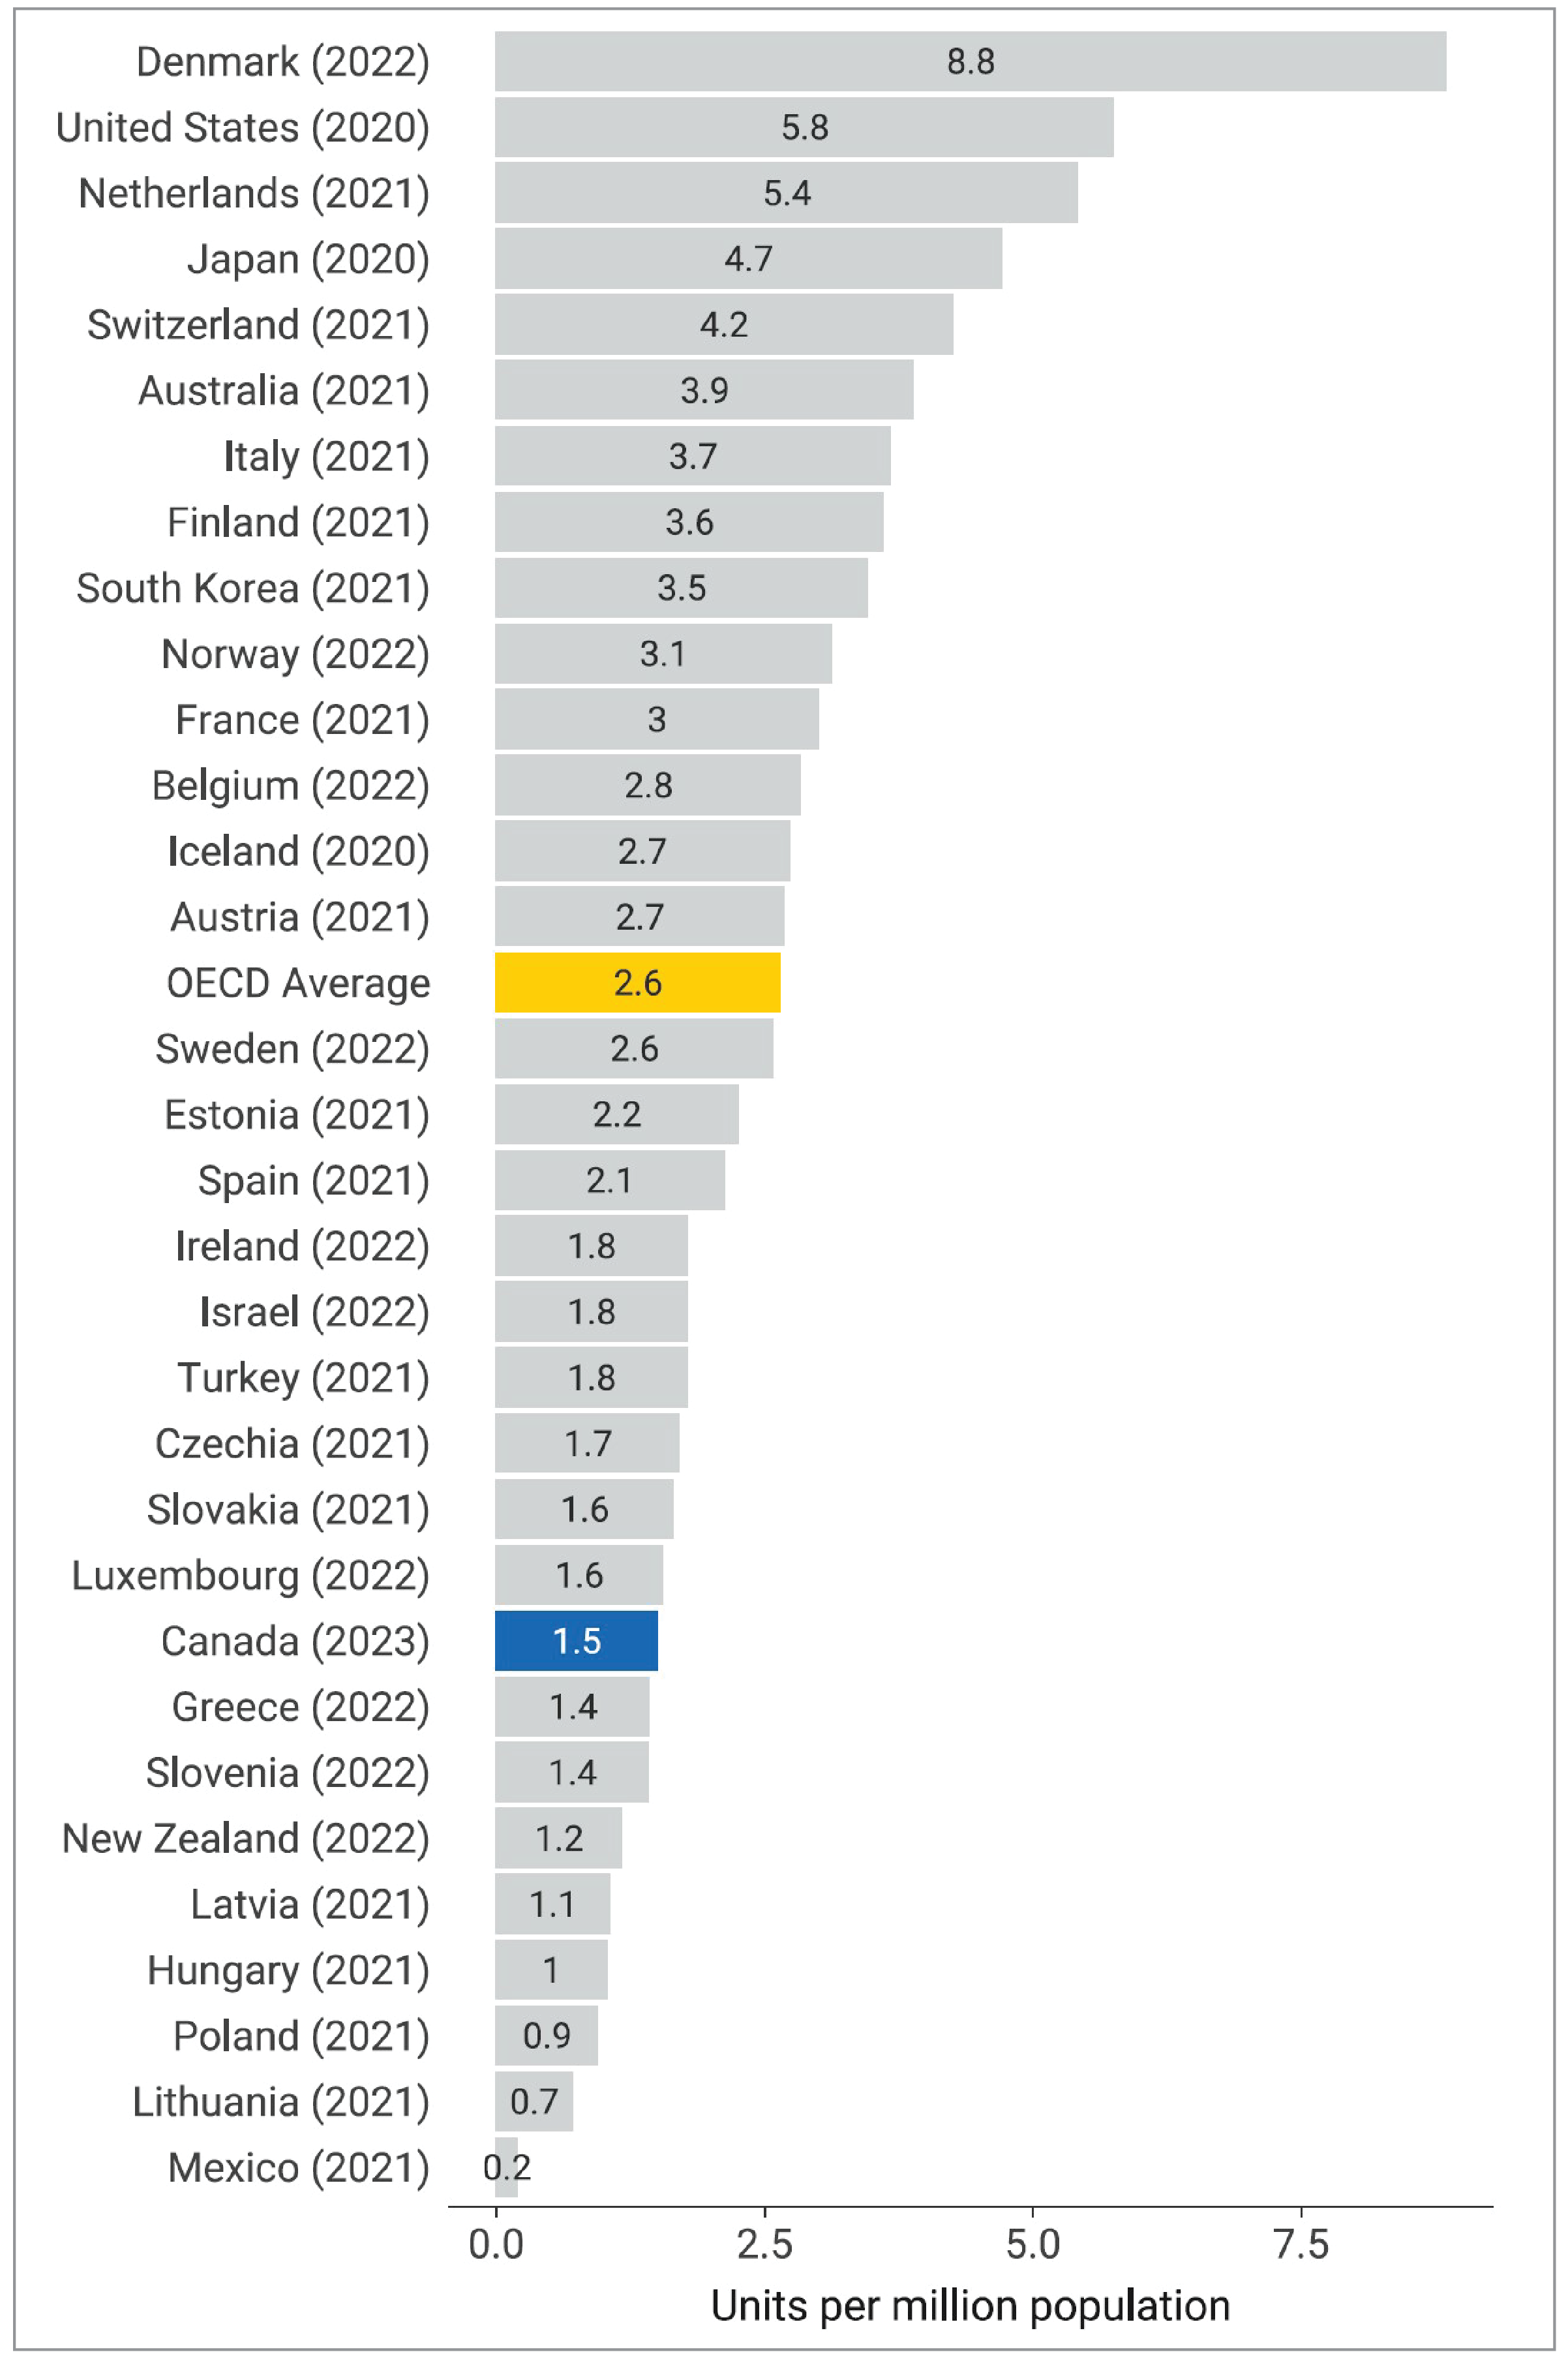
OECD = Organisation for Economic Co-operation and Development.
Note: The year is the last year with data available (refer to https://stats.oecd.org/ for details). OECD data retrieved on October 30, 2023.
Figure 18: Comparison of Canadian and OECD Data for PET or PET-CT Exams per 1,000 Population, 2022 to 2023
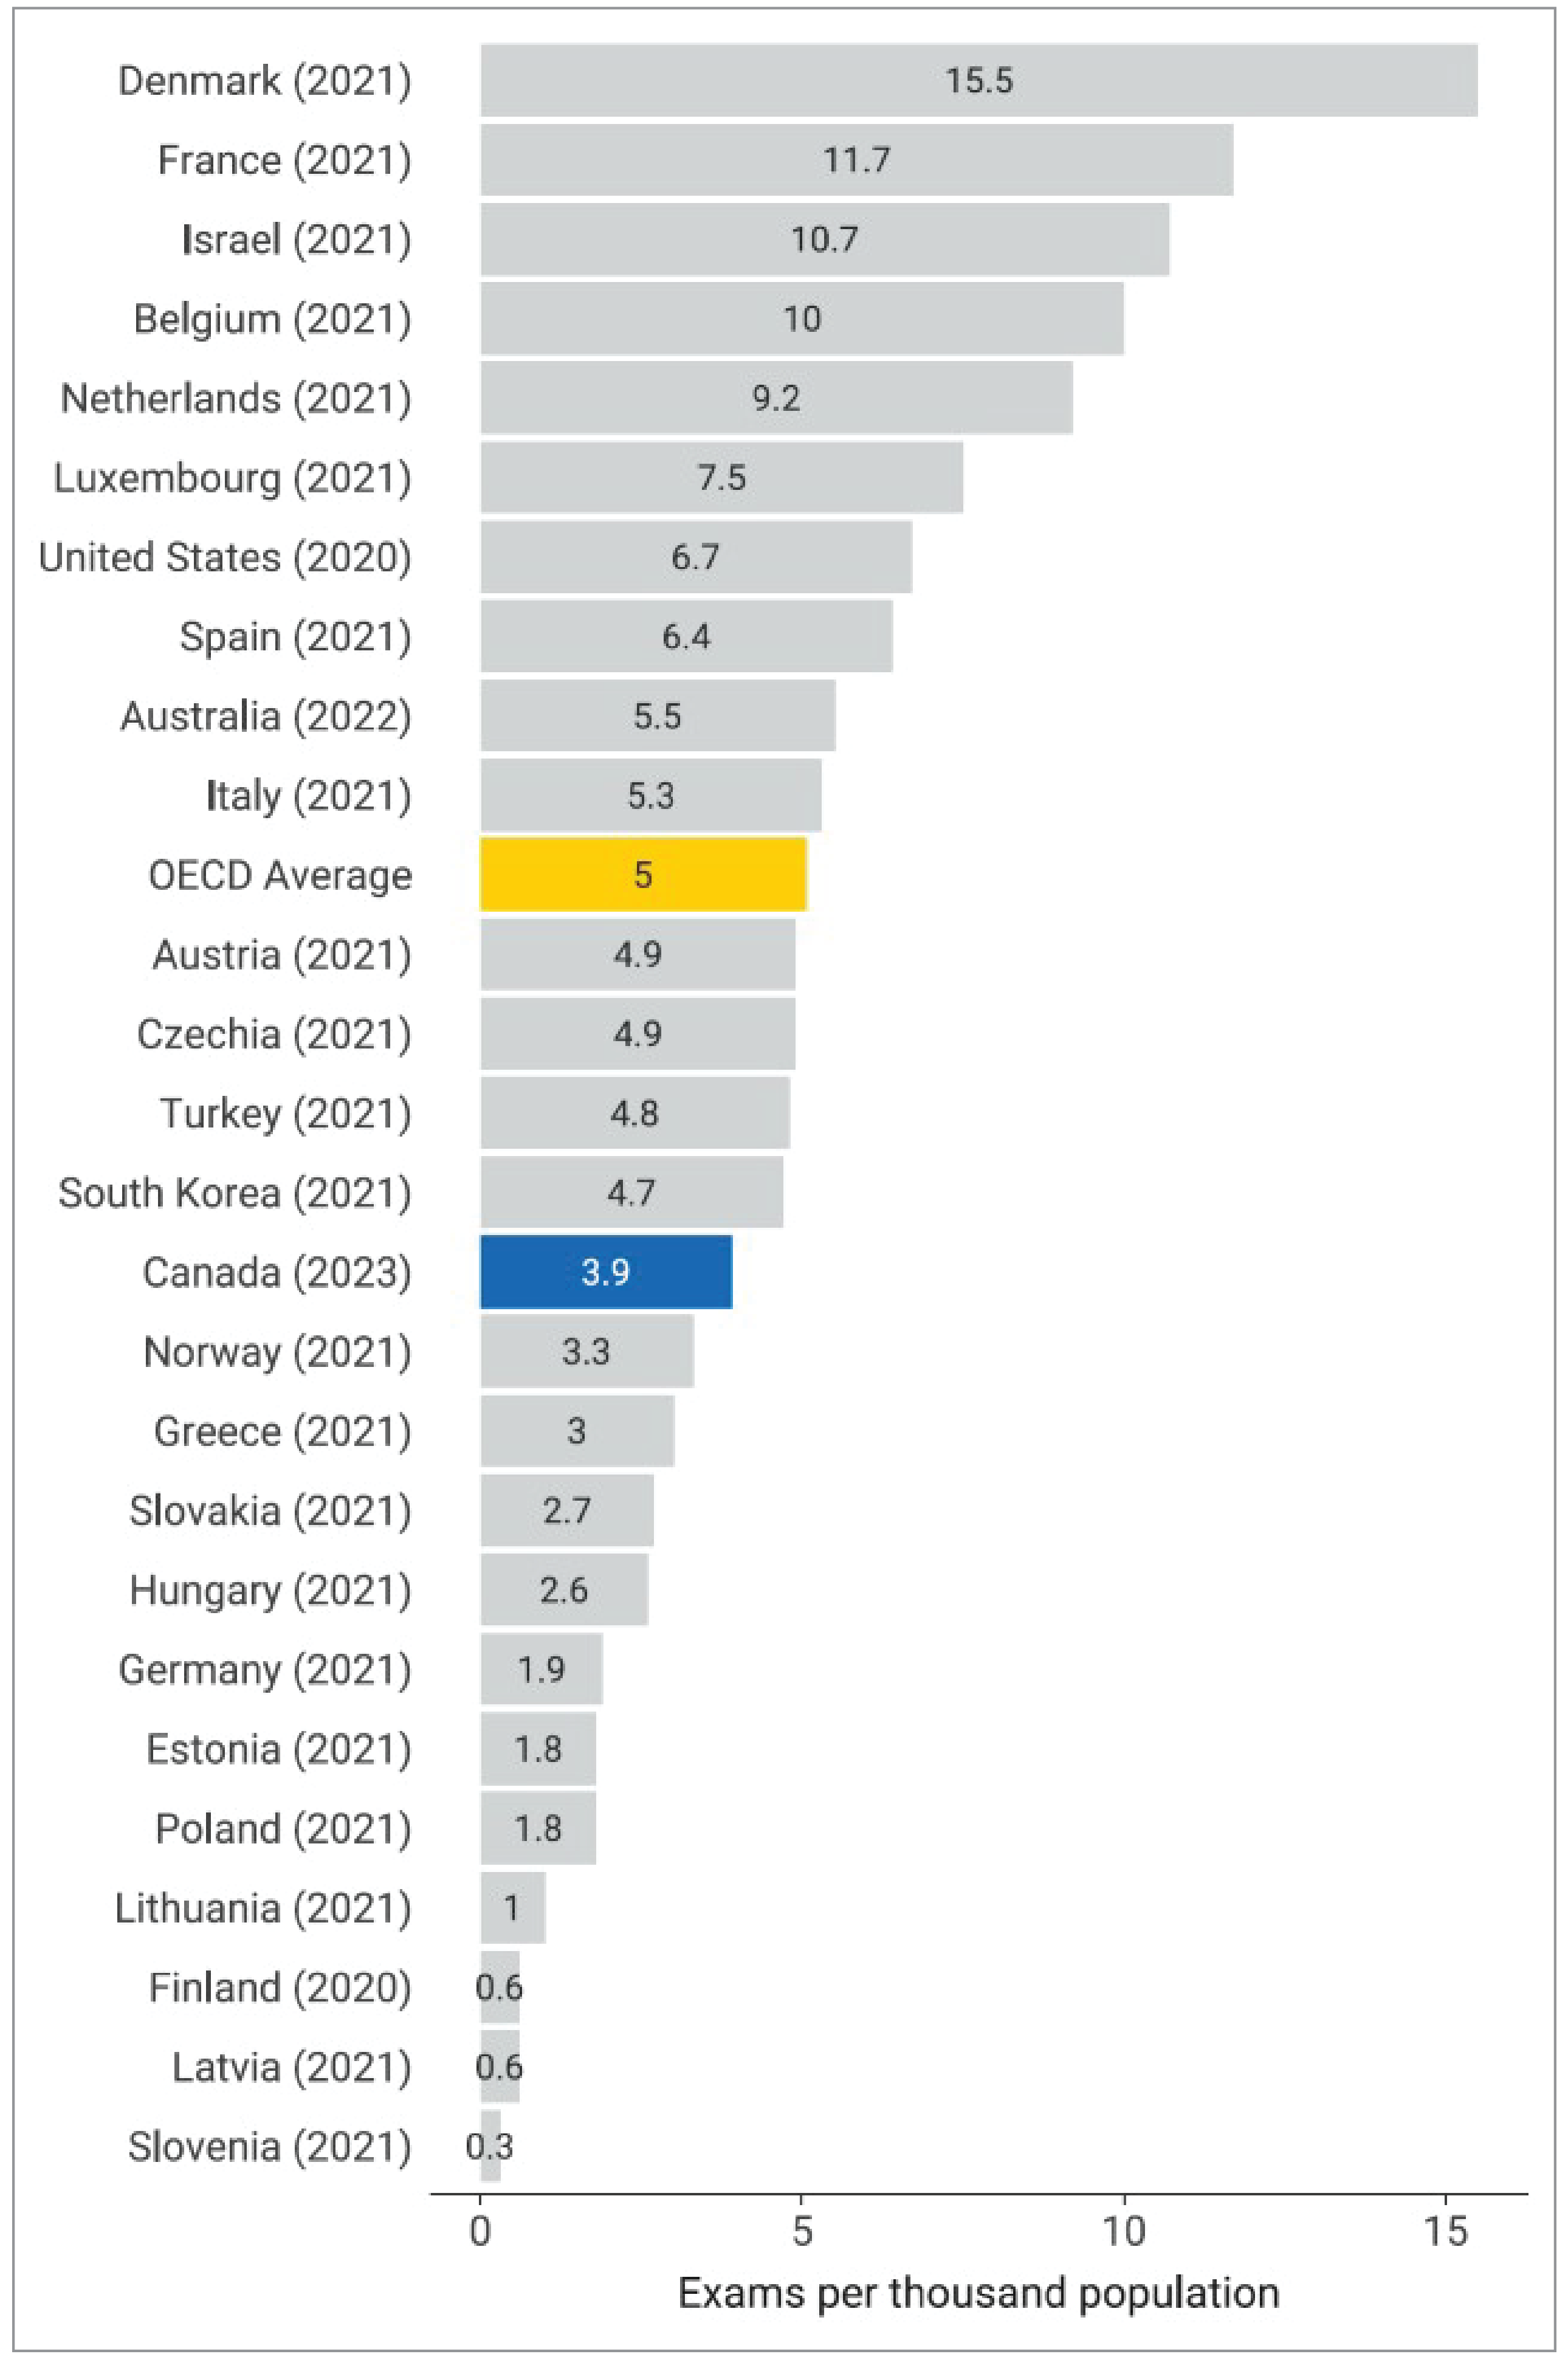
OECD = Organisation for Economic Co-operation and Development.
Note: The year is the last year with data available (refer to https://stats.oecd.org/ for details). OECD data retrieved on October 30, 2023.
Projections of the Number of PET-CT Units and Exams
The CMII forecasts the number of PET-CT units and the volume of exams needed to maintain current levels of service based on estimations of population growth in Canada for the following years: 2025, 2030, 2035, and 2040.
Our projections used a simple model based on 2022–2023 PET-CT imaging unit and exam findings, which were applied to estimated population projections from Statistics Canada. Three different population scenarios were envisioned for low, medium, and high projected growth and are presented in 5-year increments to 2040 (refer to Appendix 3, Table 25 for population projections). Projections use the current per capita number of units and exam volumes for 2022 to 2023, and are based on the assumption that population change is the only driver of growth over the forecasted period.
Projected Number of PET-CT Units for 2025, 2030, 2035, and 2040
Projections for the number of units for each province with existing PET-CT capacity are shown in Figure 19 and Appendix 3, Table 26. Assuming medium population growth:
in Canada, the number of PET-CT units is projected to increase by 18%, from 60 units in 2022–2023 to 71 units in 2040 (range, 66 to 78)
the number of PET-CT units is projected to increase for all provinces with existing capacity, except for Newfoundland and Labrador
3 provinces are projected to have the largest increase in units by 2040: Ontario, from 20 to 24 units; Quebec, from 24 to 26 units; and Alberta, from 5 to 7 units.
When low population growth is assumed, the number of PET-CT units is projected to increase in Ontario, Alberta, British Columbia, and Saskatchewan. Quebec is projected to remain unchanged.
Newfoundland and Labrador is the only province that has a projected population decline across growth scenarios.
The Northwest Territories, Nunavut, Yukon, and Prince Edward Island do not currently have any PET-CT units; therefore, growth projections could not be calculated.
Figure 19: Projected Number of PET-CT Units for 2025, 2030, 2035, and 2040
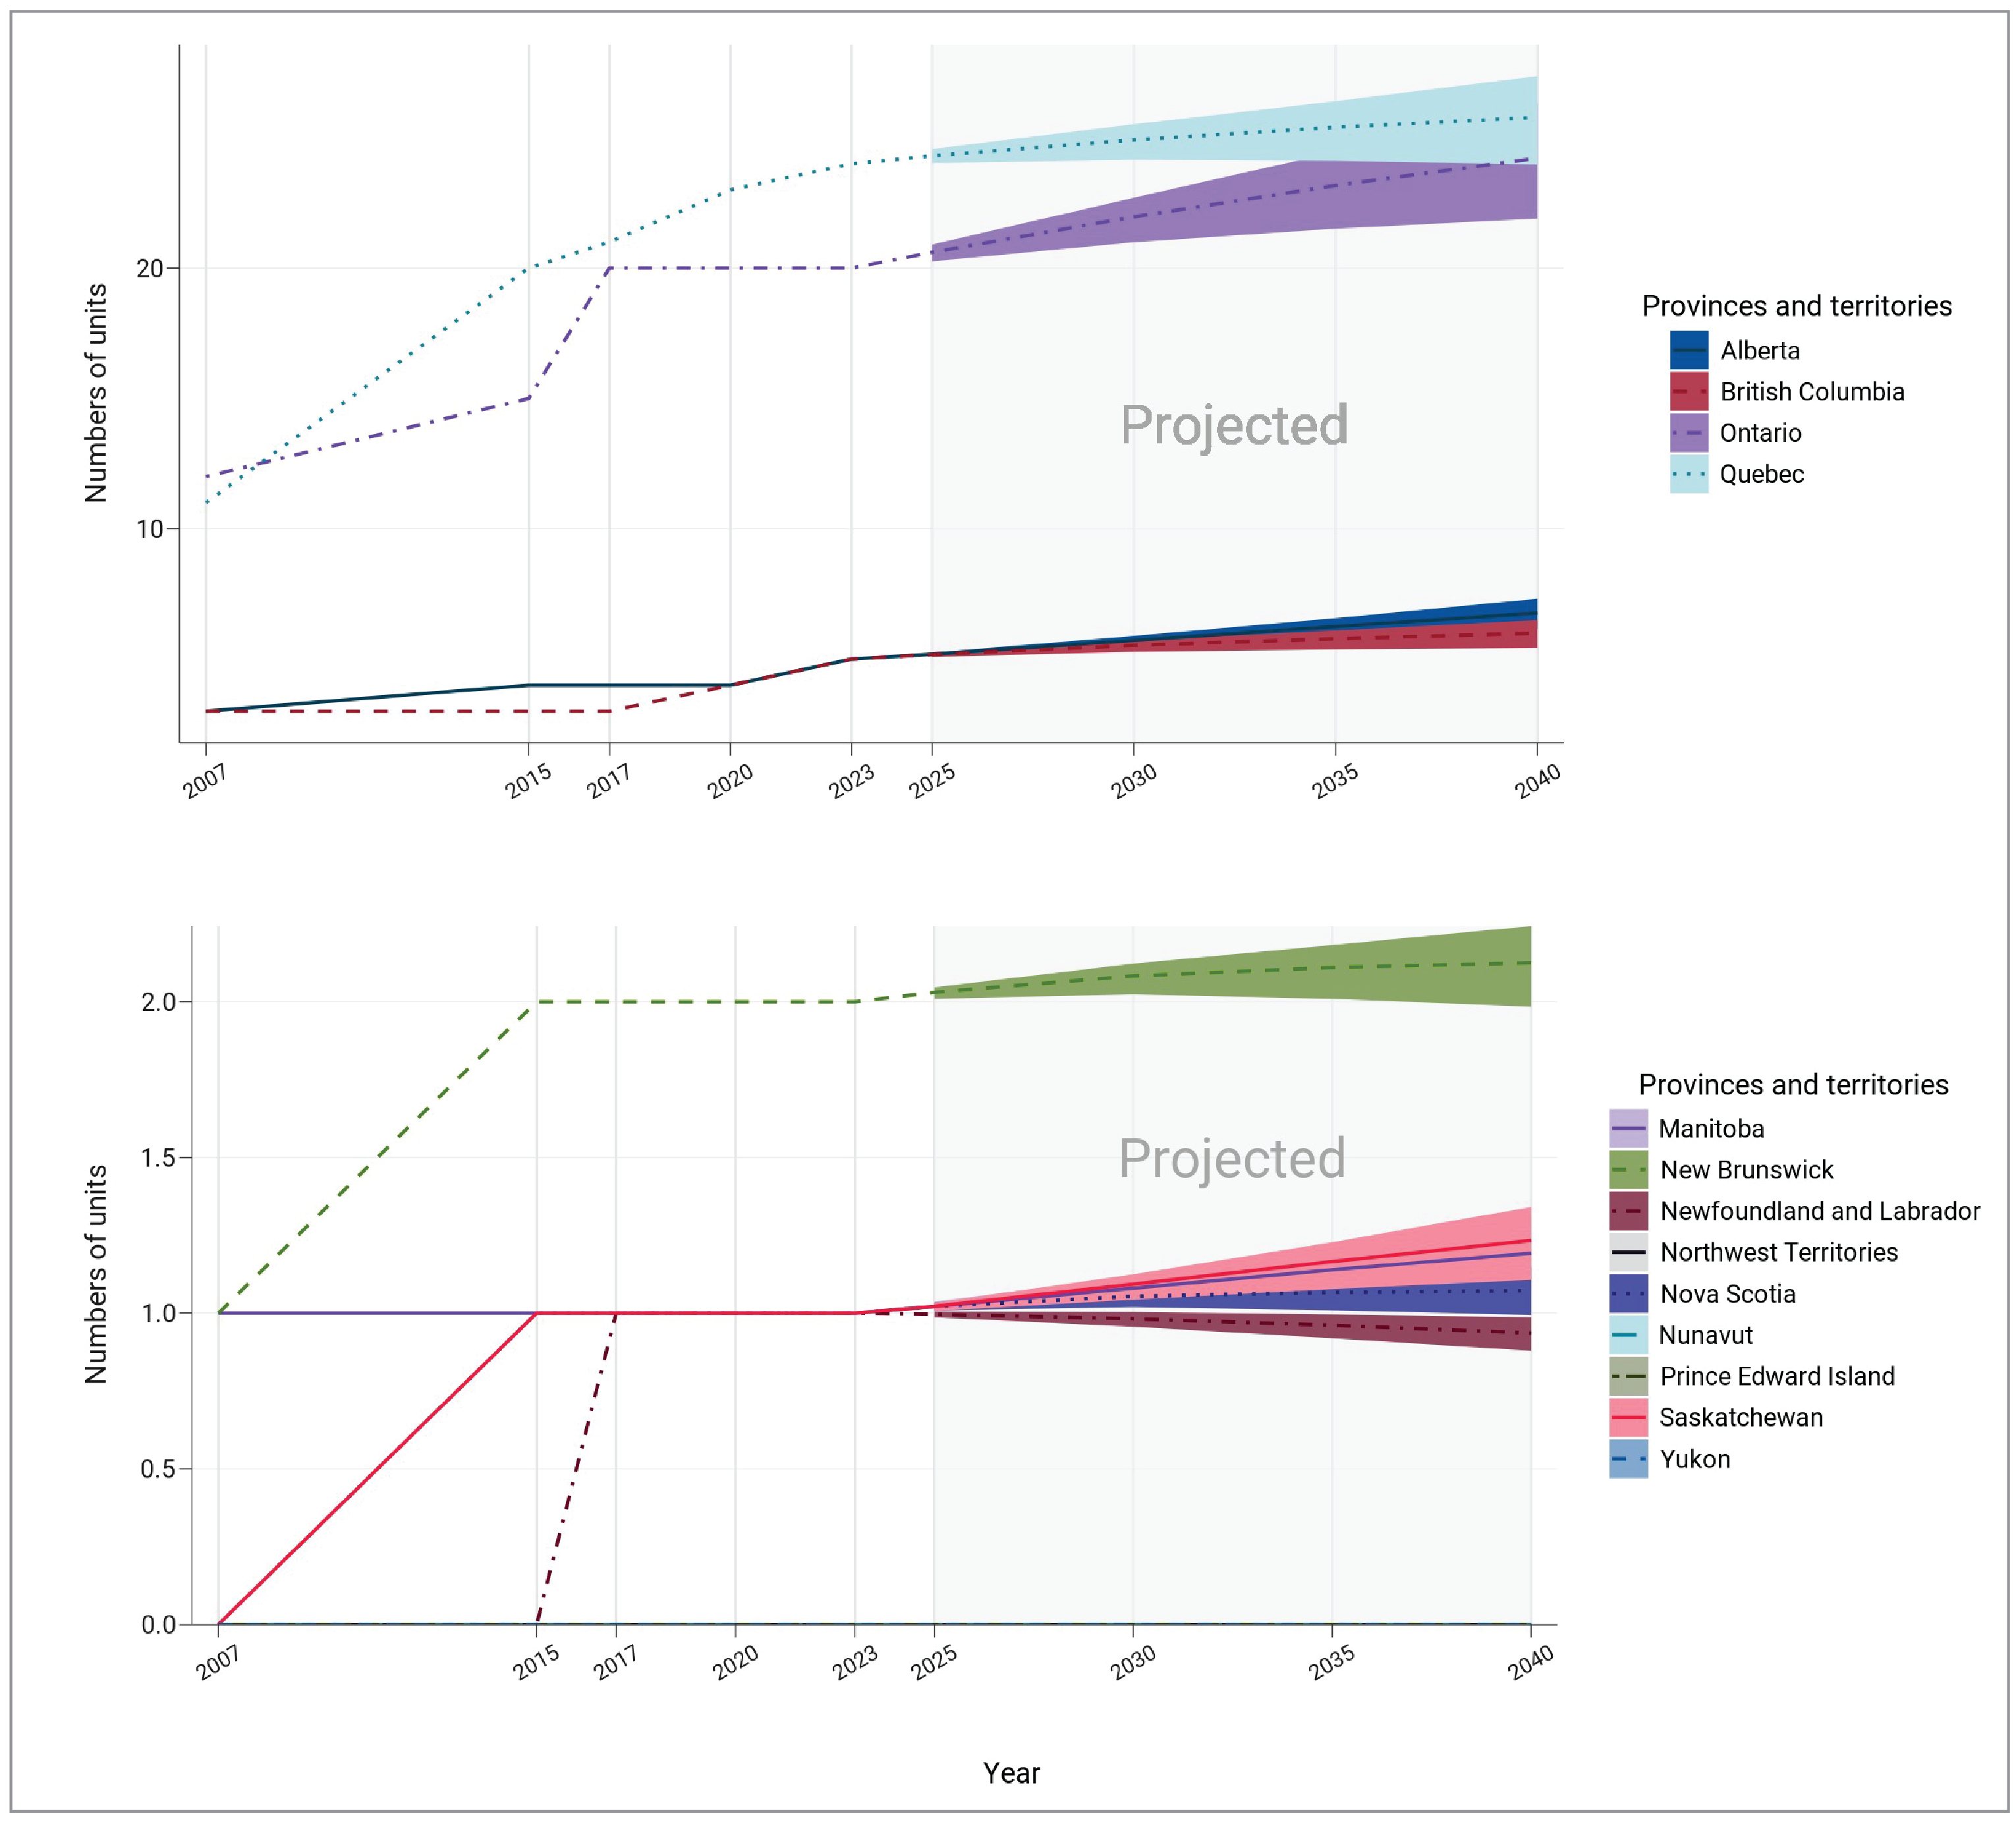
Notes: The projection was calculated from the products of the numbers of per capita units in 2022–2023 and the population projections in 2025, 2030, 2035, and 2040.
The numbers of imaging units or exams were provided by provincial or territorial validators in 2023.
The population projections were retrieved from the Statistics Canada website on January 18, 2024.33
The solid lines of projections were based on the population projection, assuming medium growth.
The upper and lower bounds were based on population projections, assuming high and low growth, respectively.
The data displayed in this figure are presented in greater detail in Appendix 3, Table 26.
Projected Number of PET-CT Exams for 2025, 2030, 2035, and 2040
Projections for the number of exams for each province with existing PET-CT capacity are shown in Figure 20 and Appendix 3, Table 27. Assuming medium population growth:
in Canada, the number of PET-CT exams is projected to increase by 18.5%, from 156,320 to 185,257, by 2040 (range, 168,841 to 199,964)
the number of PET-CT exams is projected to increase for all provinces with existing capacity, except for Newfoundland and Labrador
Alberta, Saskatchewan, and Ontario are projected to have the largest increase in exams by 2040, at 35%, 23%, and 21%, respectively, as they are projected to have the largest increase in medium population growth from 2022–2023 to 2040.
When low population growth is assumed, the number of PET-CT exams is projected to increase in Alberta, British Columbia, Manitoba, Ontario, and Saskatchewan. New Brunswick, Nova Scotia, and Quebec are projected to remain unchanged.
Figure 20: Projected Number of PET-CT Examinations (Times 1,000) for 2025, 2030, 2035, and 2040
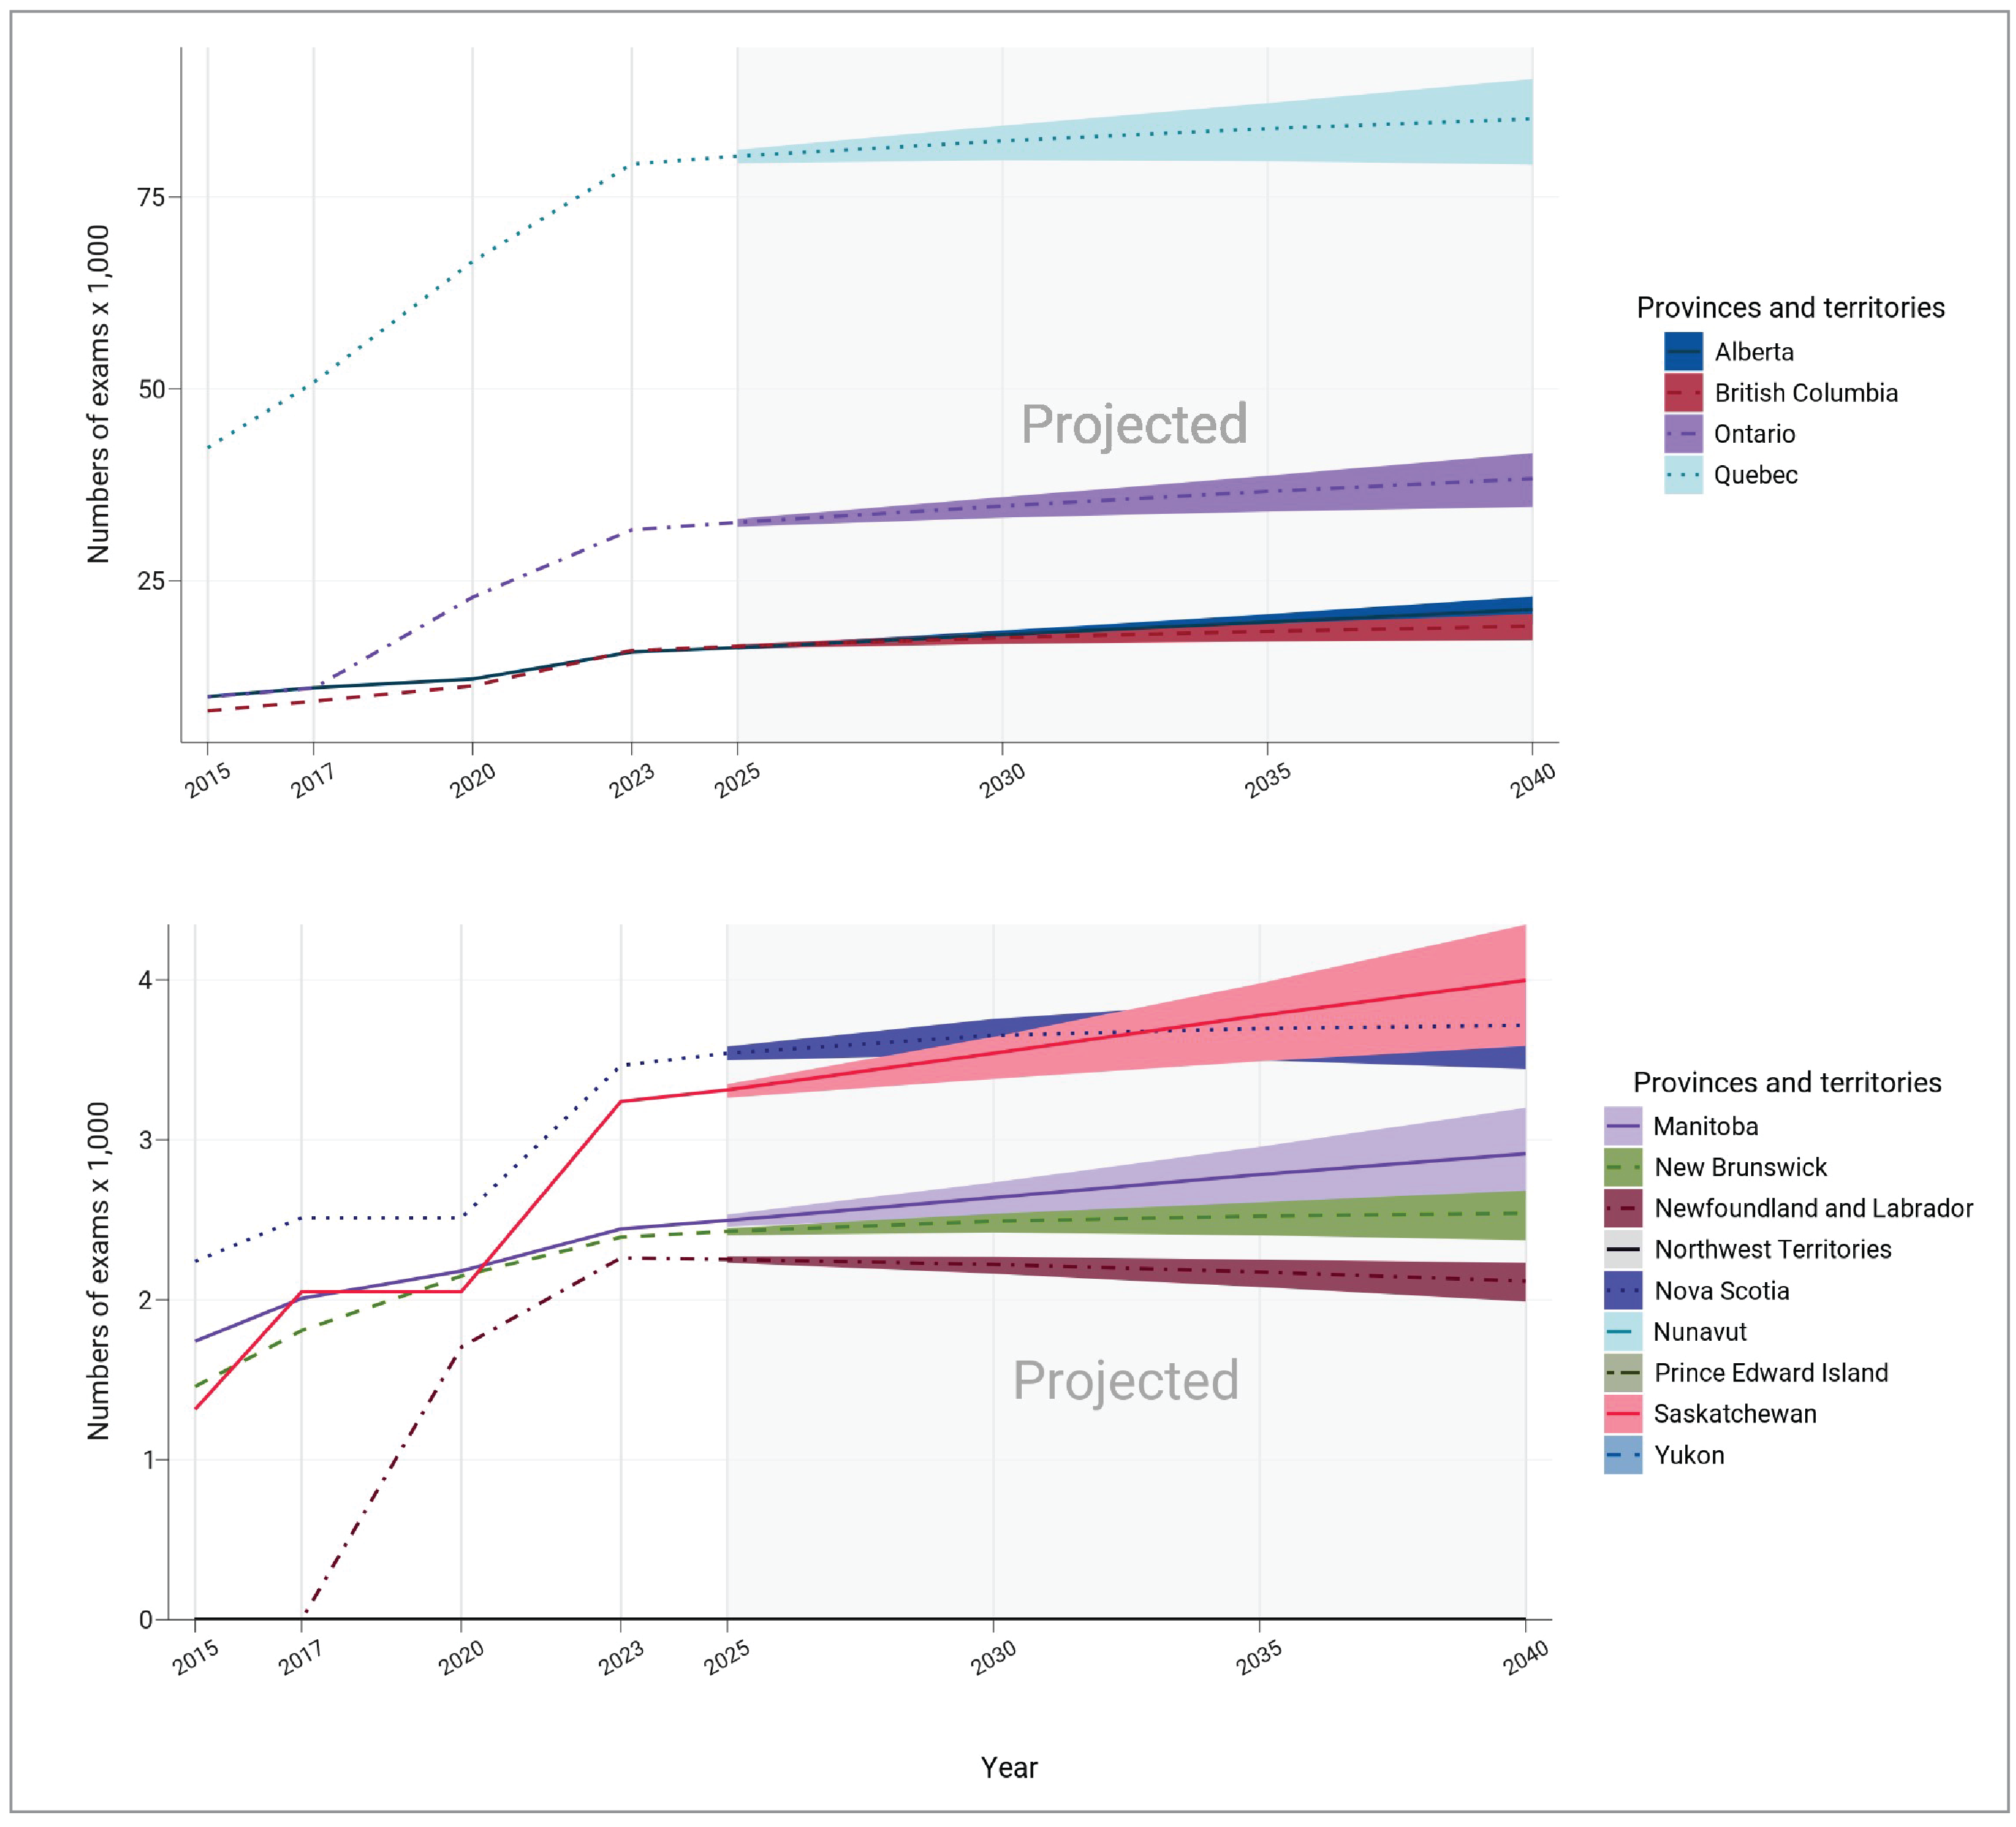
Notes: The projection was calculated from the products of the numbers of per capita exams in 2022–2023 and the population projections in 2025, 2030, 2035, and 2040.
The numbers of imaging units or exams were provided by provincial or territorial validators in 2023.
The population projections were retrieved from the Statistics Canada website on January 18, 2024.33
The solid lines of projections were based on the population projection, assuming medium growth.
The upper and lower bounds were based on population projections, assuming high and low growth, respectively.
The data displayed in this figure are presented in greater detail in Appendix 3, Table 27.
Projection Considerations and Limitations
Since 2015, the numbers of PET-CT units and exam volumes in Canada have increased by 27.7% and 103.5%, respectively. The rapid increase in exams over time, compared with the smaller increase in PET-CT units, suggests that demand for exams is outpacing the installation of units. Additionally, when considering the 2019–2020 CMII projections, the unit counts for 2025 and exam counts for 2040 have already been exceeded.14
Population growth is not the only factor that influences PET-CT projections. To assist with policy development and planning, many variables should be considered. These variables may include: changing health care priorities and policies, funding (with a set level of funding, there may be a limited number of exams that can be performed), an aging population, increasing disease prevalence, and the widening scope of clinical indications for which PET-CT can be used.
Limitations of Findings
While complete data are available from provincial and territorial validators for units and exams in the public setting, there is no equivalent in the private imaging sector, and therefore data for unit and exam counts are less complete. Additionally, there were challenges identifying private facilities and contacts within these facilities, which also contributed to the low number of survey responses. Therefore, this may lead to underestimating the total number of units and exams, particularly in jurisdictions where privately run imaging facilities contribute to the overall use.
For some survey questions, a low number of responses were received by participating sites, warranting caution when interpreting the data. For instance, while 6 sites reported PET-MRI capacity, only 1 site reported data for hours of operation, exam ordering and receiving practices, and patterns of use. Similarly, while the application of PET-CT outside the field of oncology continues to expand, which is reflected in our survey responses, the lower response rate to this survey question limits the generalizability of these findings. The number of sites that responded to each question are included alongside the reported data to enable readers to assess representativeness. Future work will be undertaken to identify patterns in missing data and how these may impact reporting bias.
To document the age of equipment, dates were variably reported as the year of installation or first year of operation (depending on data availability). This frequently varied across datasets, leading to a 1-year or 2-year uncertainty in the age of individual units, and a corresponding uncertainty in the reported mean age of equipment.
For specific survey questions, the accuracy of the data in this report relies in part on the survey participants’ personal knowledge of their particular health care setting (e.g., hours of operation and hours of unplanned downtime). For these survey questions, recall bias cannot be avoided, as we were unable to assess whether all information was visually verified and based on real-time observations, or whether questions were answered from memory. As a result, the accuracy and completeness of reporting may be impacted.
Since 2015, the CMII national survey forms have been prepopulated with responses from sites that participated in previous CMII national survey iterations. Invited survey respondents are asked to update their data to reflect the status at the time of responding to the survey. If the survey was not updated for this iteration, it was assumed that no changes had been made from the previous CMII survey response. While this method improved survey respondent engagement and reduced fatigue, in some instances, not all data may be up-to-date for some sites.
While we asked about replacement of units, we did not ask about technical upgrades that improve the operation of existing units, which directly impact the age of equipment and need for replacement.
What Else Are We Doing?
This Canadian Medical Imaging Inventory 2022–2023: PET-CT and PET-MRI report is part of a series of publications that we have produced as part of the CMII national survey.
The following additional publications, which can be found on the CMII webpage, are available to provide jurisdiction-level information on medical imaging modalities and resources:
Canadian Medical Imaging Inventory 2022–2023: Provincial and Territorial Overview
Canadian Medical Imaging Inventory 2022–2023: CT
Canadian Medical Imaging Inventory 2022–2023: MRI
Canadian Medical Imaging Inventory 2022–2023: SPECT and SPECT-CT
Canadian Medical Imaging Inventory 2022–2023: The Medical Imaging Team
provincial and territorial summaries.
What Else Have We Done?
Other CMII-related reports that we have released in 2023–2024 in response to specific decision-maker needs are listed here and published on the CMII website:
General Ultrasound Examination Volumes per Sonographer 8-Hour Workday
Average Volume of MRI Exams Conducted per Hour Across Canada
Use of MRI and CT in Private Imaging Facilities in Canada: Service Report
Imaging Implementation Advice Panel: Guidance for PSMA-PET Implementation
Individuals’ Access to Medical Imaging Results via Patient Portals
References
1.The Future of PET-CT in Canada. Canadian Medical Imaging Inventory Service Report. Ottawa (ON): CADTH; 2021: https://www.cadth.ca/sites/default/files/attachments/2021-10/cmii_service_future_of_PET_CT_0.pdf. Accessed 2024 Mar 9.
2.Jones T, Townsend D. History and future technical innovation in positron emission tomography. J Med Imaging. 2017;4(1):011013. PubMed
3.John Hopkins Medicine. Positron Emission Tomography (PET). 2024; https://www.hopkinsmedicine.org/health/treatment-tests-and-therapies/positron-emission-tomography-pet. Accessed 2024 Jan 10.
4.Ayesa L S. M, A. Positron emission tomography: Evolving modalities, radiopharmaceuticals and professional collaboration. J Med Radiat Sci. 2022;69(4):415-418. PubMed
5.Shukla AK, Kumar U. Positron emission tomography: An overview. J Med Phys. 2006;31(1):13-21. PubMed
6.Berger A. How does it work? Positron emission tomography. BMJ. 2003;326(7404):1449. PubMed
7.Hricak H CB, Scott AM, Sugimura K, Muellner A, von Schulthess GK, et al. Global trends in hybrid imaging. Radiology. 2010;257(2):498-506. PubMed
8.Delso G VE, Barbosa FG, Veit-Haibach P. Pitfalls and limitations in simultaneous PET/MRI. Seminars in Nuclear Medicine. 2015;45(6):552-559. PubMed
9.Vitor T, Martins KM, Ionescu TM, et al. PET/MRI: a novel hybrid imaging technique. Major clinical indications and preliminary experience in Brazil. Einstein. 2017;15(1):115-118. PubMed
10.The Implementation Considerations of PET-CT. Canadian Medical Imaging Inventory Service Report. Ottawa (ON): CADTH; 2022: https://www.cadth.ca/sites/default/files/attachments/2022-01/implementation_considerations_of_PET-CT.pdf. Accessed 2024 Mar 9.
11.Imaging Implementation Advice Panel: Guidance for PSMA-PET implementation. Medical Imaging Implementation Advice. Ottawa (ON): CADTH; 2023: https://www.cadth.ca/sites/default/files/hta-he/HC0060-Imaging-Implementation-Advice-meta.pdf. Accessed 2024 Mar 9.
12.Demeter S, Bornstein S, Butler J, Cramer B, Hollett P, Jones L. The development of a PET/CT program in Newfoundland and Labrador. St John's (NL): Newfoundland and Labrador Centre for Applied Health Research (NLCAHR); 2009: https://research.library.mun.ca/147/. Accessed 2024 Mar 9.
13.Sinclair A, Quay T, Pyke L, Morrison A. The Canadian Medical Imaging Inventory 2015. CADTH Optimal Use Report. Ottawa (ON): CADTH; 2016: https://www.cadth.ca/sites/default/files/pdf/canadian_medical_imaging_inventory_2015_e.pdf. Accessed 2024 Jan 10.
14.Chao Y-S, Sinclair A, Morrison A, Hafizi D, Pyke L. The Canadian Medical Imaging Inventory 2019-2020. CADTH Health Technology Review. Ottawa (ON): CADTH; 2021: https://www.cadth.ca/sites/default/files/ou-tr/op0546-cmii3-final-report.pdf. Accessed 2024 Jan 10.
15.Sinclair A, Morrison A, Young C, Pyke L. The Canadian Medical Imaging Inventory, 2017. CADTH Optimal Use Report. Ottawa (ON): CADTH; 2018: https://www.cadth.ca/sites/default/files/pdf/canadian_medical_imaging_inventory_2017.pdf. Accessed 2024 Jan 10.
16.Canadian Institute for Health Information (CIHI). QuickStats. Selected medical imaging equipment in Canada. 2012.
17.Canadian Institute for Health Information (CIHI). Medical imaging in Canada 2012 (executive summary). Ottawa: CIHI; 2013.
18.Canadian Institute for Health Information (CIHI). Medical imaging in Canada 2007. Ottawa: CIHI; 2008: https://publications.gc.ca/collections/collection_2008/cihi-icis/H118-13-2007E.pdf. Accessed 2024 Jan 10.
19.Canadian Institute for Health Information (CIHI). Medical imaging in Canada. Ottawa: CIHI; 2003: https://publications.gc.ca/Collection/H118-13-2003E.pdf. Accessed 2024 Jan 10.
20.Statistics Canada. Canada's population estimates, first quarter 2023. The Daily. Ottawa (ON): Government of Canada; 2023: https://www150.statcan.gc.ca/n1/daily-quotidien/230628/dq230628c-eng.htm. Accessed 2024 Jan 5.
21.Mason J, Morrison A, Visintini S. An overview of clinical applications of Artificial Intelligence. CADTH Issues in Emerging Health Technologies. 2018(174). https://www.cadth.ca/sites/default/files/pdf/eh0070_overview_clinical_applications_of_AI.pdf. Accessed 2024 Mar 9.
22.Najjar R. Redefining Radiology: A Review of Artificial Intelligence Integration in Medical Imaging. Diagnostics. 2023;13(17):2760. PubMed
23.Health Council of Canada. Decisions, decisions: Family doctors as gatekeepers to prescription drugs and diagnostic imaging in Canada. Ottawa (ON): Government of Canada; 2010: https://publications.gc.ca/collections/collection_2011/ccs-hcc/H174-19-2010-eng.pdf. Accessed 2024 Mar 22.
24.Health Quality Ontario. Peer review: A diagnostic imaging quality initiative for Ontario. Toronto (ON): Government of Ontario; 2016: https://www.hqontario.ca/Portals/0/documents/health-quality/di-expert-panel-report-en.pdf. Accessed 2024 Mar 9.
25.López-Mora DA, Carrió I, Flotats A. Digital PET vs Analog PET: Clinical Implications? Semin Nucl Med. 2022;52(3):302-311. PubMed
26.Canadian Nuclear Isotope Council. Isotopes in Canada. 2024; https://www.canadianisotopes.ca/isotopes-in-canada/. Accessed 2024 Mar 9.
27.Canada Nuclear Safety Commision. Certification of Class II Prescribed Equipment. Ottawa (ON): Government of Canada; 2023: https://api.cnsc-ccsn.gc.ca/dms/digital-medias/list-certified-class-II-prescribed-equipment-2023-03-eng.pdf/object?subscription-key=3ff0910c6c54489abc34bc5b7d773be0. Accessed 2024 Mar 9.
28.Professional Affairs Committee. Scope of practice for Canadian certified medical physicists. Kanata (ON): Canadian Organization of Medical Physicists; 2015: https://comp-ocpm.ca/_uploads/53jbyv2t9.pdf. Accessed 2024 Mar 25.
29.Rühm W, Harrison RM. High CT doses return to the agenda. Radiation and Environmental Biophysics. 2020;59(1):3-7. PubMed
30.Remedios D. Cumulative radiation dose from multiple CT examinations: stronger justification, fewer repeats, or dose reduction technology needed? European Radiology. 2020;30(4):1837-1838. PubMed
31.Verfaillie G, Franck C, De Crop A, Beels L, D'Asseler Y, Bacher K. A systematic review and meta-analysis on the radiation dose of computed tomography in hybrid nuclear medicine imaging. EJNMMI Phys. 2023;10(1):32. PubMed
32.Positron emission tomography (PET) scanners and exams. OECD.Stat. Paris (FR): Organisation for Economic Co-Operation and Development: https://stats.oecd.org/. Accessed 2023 Nov 9.
33.Statistics Canada. Population Projections for Canada (2021 to 2068), Provinces and Territories (2021 to 2043): Technical Report on Methodology and Assumptions. Catalogue no. 91-620-X. Ottawa (ON): Government of Canada; 2023: https://www150.statcan.gc.ca/n1/en/pub/91-620-x/91-620-x2022001-eng.pdf?st=My-XWuTK.
34.Statistics Canada. Indigenous peoples - 2021 Census promotional material. 2021; https://www.statcan.gc.ca/en/census/census-engagement/community-supporter/indigenous-peoples. Accessed 2023 Feb 22.
35.World Health Organization. Diagnostic imaging: nuclear medicine. 2016.
36.Couillard F. Anticipating a problem, proposing solutions. Ottawa (ON): Canadian Association of Medical Radiation Technologists; 2014: https://www.camrt.ca/blog/2014/11/25/anticipating-a-problem-proposing-solutions/. Accessed 2024 Jan 10.
37.Natural Resources Canada. Medical isotopes. Ottawa (ON): Government of Canada; 2020: https://natural-resources.canada.ca/our-natural-resources/energy-sources-distribution/nuclear-energy-uranium/medical-isotopes/23060. Accessed 2024 Jan 10.
38.Weber WA. PET/MR imaging: a critical appraisal. Journal of Nuclear Medicine. 2014;55. PubMed
39.Delso G, Voert E.T., Barbosa F.G., Veit-Haibach P. Pitfalls and limitations in simultaneous PET/MRI. Seminars in Nuclear Medicine. 2015;45(6):552-559. PubMed
40.Policy forum: health technology policy information. Ottawa (ON): CADTH; 2009: https://www.cadth.ca/sites/default/files/policy_forum_section/PET_Policy_Information_Document_e.pdf. Accessed 2024 Jan 10.
41.Shellock FG CJ. MRI: Bioeffects, safety and patient management. Los Angeles (CA): Biomedical Research Publishing Company; 2014.
42.MRIsafety.com. Safety information article list. 2024; https://www.mrisafety.com/SafetyInformation_list.php. Accessed 2024 Jan 11.
Appendix 1: Introduction to PET, PET-CT, and PET-MRI
Note that this appendix has not been copy-edited.
About PET and PET-CT
PET uses injection of a sugar or other metabolic tracer labelled with a positron-emitting radioisotope, sensitive radiation detector cameras, and powerful computers to detect and visualize areas of increased metabolism, such as tumours. It creates three-dimensional images of regions of interest, such as brain, bone, and heart.3,34
The main advantage of PET (and its successor PET-CT) imaging is the ability to precisely quantify metabolic processes (e.g., the rate of glucose metabolism) and, depending on the pathology, to more accurately localize abnormalities. PET-radiolabelled sugar (i.e.,18F-FDG) is the most common PET tracer currently used in Canada, but other tracers are becoming available, especially for cardiac and neurologic imaging. Another advantage of PET-CT imaging is that the whole body can be imaged, which is useful for assessing tumour spread or recurrence.
Medical specialties that commonly use PET imaging include oncology, neurology, psychiatry, cardiology, pediatrics, and infectious disease.
PET-CT combines the modalities of PET and CT, creating three-dimensional images of the body part of interest, such as brain, bone, and lung. Both scans are performed in sequence during a single session, and the images are computationally aligned.7 PET-CT is commonly used in oncology to diagnose and stage various cancers, such as lung, gastrointestinal, colorectal, breast, and thyroid cancer. Additionally, PET-CT is commonly employed to diagnose neurologic, cardiovascular, infectious, and inflammatory pathologies, and the CT component is used to detect coronary artery calcification, a marker of coronary atheroscleosis.35
The main advantage of PET-CT is the ability to demonstrate metabolic information with the precise anatomic detail of multislice high-resolution CT images; as a result, PET-CT has replaced PET in Canada. Medical specialties that commonly use PET-CT imaging include oncology, neurology, cardiology, internal medicine, and orthopedics.
The challenges of PET-CT are those of the component modalities, both of which involve exposure to ionizing radiation.35-37 The radioisotopes used in PET-CT have a half-life measured in hours, so imaging depends on availability of a cyclotron and transportation.
About PET-MRI
PET-MRI combines PET with MRI,38 permitting high-sensitivity metabolic imaging with high resolution of soft-tissue detail, enabling visualization of anatomy and pathologies not commonly attainable with other modalities. The 2 scans are performed in tandem, and the images are then computationally aligned. PET-MRI is the newest combination to reach clinical use and has applications in oncology, neurology, cardiology, internal medicine, and orthopedics.39,40
PET-MRI requires injection of radioisotope tracers and therefore requires the same risk-benefit assessment as other nuclear medicine imaging modalities for females of reproductive age and children.41,42 Since the CT component is replaced by MRI, X-ray exposure is avoided; however, the hazards of magnetic fields remain.41,42 The radioisotopes have a short half-life, requiring proximity to a cyclotron. The units and their infrastructure requirements are extremely expensive.
Appendix 2: Definitions in the CMII PET-CT and PET-MRI Report
Note that this appendix has not been copy-edited.
Type of Facility Operating Imaging Equipment
Hospital
An institution where patients are provided with continuing medical care and supporting diagnostic and therapeutic services. Hospitals are licensed or approved as hospitals by a provincial or territorial government or are operated by the Government of Canada. Included are those providing acute care.
Tertiary Care
A hospital that provides tertiary care, which is health care from specialists who investigate and treat patients in a large hospital after referral from primary care and secondary care facilities.
Private
A health care facility that operates privately but that is either privately or publicly funded, that ranges from specialized services by physicians, radiologists, dentists, chiropractors, or via mammography programs, to broad-based imaging centres offering a wide range of tests.
Community Hospital
A short-term (average length of stay with fewer than 30 days) hospital that provides acute care.
Picture Archiving and Communication Systems
PACS refers to an electronic system used to digitally manage images, including transmission, filing, storage, distribution, and retrieval of medical images. It is networked and frequently web-based. Combined with other web-based telehealth technologies, PACS allows timely access to medical images and specialists. PACS has replaced film and film library systems.
Access to images outside medical imaging departments by referring and consulting physicians is important for efficient patient care, particularly so in a country like Canada, with its large geographic size and dispersed population.
Type of Equipment Servicing Method Reported by Sites
À La Carte
Services and parts that are paid by the imaging facility on an as-needed basis, with the service provider charging for parts, labour, and travel.
Full Vendor Service Contracts
Full vendor contracts provide a wide range of services, such as corrective maintenance, operational maintenance, planned maintenance, and extended warranty, along with insurance maintenance programs for a set period.
Insurance
Insurance policy service contracts may vary, but most equipment insurance companies specialize in risk management, cost avoidance, or service billing audit functions.
Managed Equipment Service
This service package entails ownership, acquisition, installation and commissioning, user training, asset management, maintenance, and ongoing replacement of medical technology and equipment.
Shared Service
Organizations that have in-house expertise and resources may service their own imaging equipment and may use external service contracts for certain types of equipment.
Third Party
Third-party agreements may often be used for hardware support and to provide services offered through a company separate from the original equipment manufacturer.
Under Warranty
Equipment maintenance according to warranty service agreement. At the end of the warranty period, health care systems must select their service contract type.
Appendix 3: Supplementary Summary Tables for PET-CT and PET-MRI, the 2022–2023 CMII
Note that this appendix has not been copy-edited.
Table 8: Summary of Location of PET-CT Facilities Included in the CMII, 2022 to 2023
Province or territory | Urban | Rural | Remote |
|---|---|---|---|
Number of sites (% in each jurisdiction) | |||
Alberta | 4 (100) | 0 (0) | 0 (0) |
British Columbia | 4 (100) | 0 (0) | 0 (0) |
Manitoba | 1 (100) | 0 (0) | 0 (0) |
New Brunswick | 2 (100) | 0 (0) | 0 (0) |
Newfoundland and Labrador | 1 (100) | 0 (0) | 0 (0) |
Northwest Territories | — | — | — |
Nova Scotia | 1 (100) | 0 (0) | 0 (0) |
Nunavut | — | — | — |
Ontario | 18 (100) | 0 (0) | 0 (0) |
Prince Edward Island | — | — | — |
Quebec | 20 (100) | 0 (0) | 0 (0) |
Saskatchewan | 1 (100) | 0 (0) | 0 (0) |
Yukon | — | — | — |
Canada | 52 (100) | 0 (0) | 0 (0) |
CMII = Canadian Medical Imaging Inventory.
Notes: Survey response data were available for 52 out of 52 sites across all jurisdictions with PET-CT capacity.
Data were derived from the following survey question: “In which of the following settings are you located?”
Table 9: Summary of Type of PET-CT Facility Included in the CMII, 2022 to 2023
Province or territory | Hospital | Private | Community hospital | Tertiary care |
|---|---|---|---|---|
Number of sites (% in each jurisdiction) | ||||
Alberta | 3 (75) | 0 (0) | 0 (0) | 1 (25) |
British Columbia | 3 (75) | 1 (25) | 0 (0) | 0 (0) |
Manitoba | 0 (0) | 0 (0) | 0 (0) | 1 (100) |
New Brunswick | 1 (50) | 0 (0) | 0 (0) | 1 (50) |
Newfoundland and Labrador | 1 (100) | 0 (0) | 0 (0) | 0 (0) |
Northwest Territories | — | — | — | — |
Nova Scotia | 0 (0) | 0 (0) | 0 (0) | 1 (100) |
Nunavut | — | — | — | — |
Ontario | 11 (61.1) | 3 (16.7) | 0 (0) | 4 (22.2) |
Prince Edward Island | — | — | — | — |
Quebec | 13 (68.4) | 3 (15.8) | 0 (0) | 3 (15.8) |
Saskatchewan | 0 (0) | 0 (0) | 0 (0) | 1 (100) |
Yukon | — | — | — | — |
Canada | 32 (62.7) | 7 (13.7) | 0 (0) | 12 (23.5) |
CMII = Canadian Medical Imaging Inventory.
Notes: Survey response data were available for 51 out of 52 sites across all jurisdictions with PET-CT capacity.
Data were derived from the following survey question: “What type of facility is this?” The table includes only those facilities that responded to the survey question. In some instances, validator data, CMII data, and data from other publicly available sources supplemented survey responses. Definitions for the type of facility included in the survey are provided in Appendix 2.
Table 10: Summary of Source of Funding for PET-CT Sites Included in the CMII, 2022 to 2023
Province or territory | Public | Private | Both |
|---|---|---|---|
Number of sites (% in each jurisdiction) | |||
Alberta | 4 (100) | 0 (0) | 0 (0) |
British Columbia | 3 (75) | 1 (25) | 0 (0) |
Manitoba | 1 (100) | 0 (0) | 0 (0) |
New Brunswick | 2 (100) | 0 (0) | 0 (0) |
Newfoundland and Labrador | 1 (100) | 0 (0) | 0 (0) |
Northwest Territories | — | — | — |
Nova Scotia | NR | NR | NR |
Nunavut | — | — | — |
Ontario | 15 (83.3) | 0 (0) | 3 (16.7) |
Prince Edward Island | — | — | — |
Quebec | 15 (78.9) | 4 (21.1) | 0 (0) |
Saskatchewan | 1 (100) | 0 (0) | 0 (0) |
Yukon | — | — | — |
Canada | 42 (84) | 5 (10) | 3 (6) |
CMII = Canadian Medical Imaging Inventory; NR = not reported.
Notes: Survey response data were available for 50 out of 52 sites across 8 of the 9 jurisdictions with PET-CT capacity. No data were available for Nova Scotia.
Data were derived from the following survey question: “How is this facility funded?” The table includes only those facilities that responded to the survey question. In some instances, validator data, CMII data, and data from other publicly available sources supplemented survey responses.
Table 11: Number of PET-CT Units and Units per Capita, 2015 to 2022–2023
Province or territory | 2015 | 2017 | 2019 to 2020 | 2022 to 2023 | ||||
|---|---|---|---|---|---|---|---|---|
Units | Units per million population | Units | Units per million population | Units | Units per million population | Units | Units per million population | |
Alberta | 4 | 1.0 | 4 | 0.9 | 4 | 0.9 | 5 | 1.1 |
British Columbia | 3 | 0.6 | 3 | 0.6 | 4 | 0.8 | 5 | 0.9 |
Manitoba | 1 | 0.8 | 1 | 0.8 | 1 | 0.7 | 1 | 0.7 |
New Brunswick | 2 | 2.7 | 2 | 2.6 | 2 | 2.6 | 2 | 2.4 |
Newfoundland and Labrador | — | — | 1 | 1.9 | 1 | 1.9 | 1 | 1.9 |
Northwest Territories | — | — | — | — | — | — | — | — |
Nova Scotia | 1 | 1.1 | 1 | 1.1 | 1 | 1.0 | 1 | 1.0 |
Nunavut | — | — | — | — | — | — | — | — |
Ontario | 15 | 1.1 | 17 | 1.2 | 20 | 1.4 | 20 | 1.3 |
Prince Edward Island | — | — | — | — | — | — | — | — |
Quebec | 20 | 2.4 | 21 | 2.5 | 23 | 2.7 | 24 | 2.7 |
Saskatchewan | 1 | 0.9 | 1 | 0.9 | 1 | 0.8 | 1 | 0.8 |
Yukon | — | — | — | — | — | — | — | — |
Canada | 47 | 1.3 | 51 | 1.4 | 57 | 1.5 | 60 | 1.5 |
Notes: Complete unit count data were available for all public PET-CT units across all jurisdictions with capacity.
For the 2022 to 2023 survey, complete unit count data were available for 52 sites with PET-CT capacity out of 467 participating sites with advanced imaging capacity (i.e., SPECT-CT, SPECT, CT, MRI, PET-CT, PET-MRI). For 2019 to 2020, complete unit count data were available for 46 sites with PET-CT capacity out of 455 participating sites with advanced imaging capacity. For 2017, complete unit count data were available for 45 sites with PET-CT capacity out of 505 participating sites with advanced imaging capacity. For 2015, complete unit count data were available for sites with PET-CT capacity out of 392 participating sites with advanced imaging capacity.
Data were derived from the following survey question: “Do you have the following fixed, mobile, or portable units at the site?” Options included: CT, MRI, PET-CT, PET-MRI, SPECT-CT, and SPECT.
Sources: CADTH (2015),13 CADTH (2017),15 CADTH (2020),14 CADTH (2024).
Table 12: Volume of PET-CT Exams and Exams per 1,000 People Across Canadian Public Facilities, 2015 to 2022–2023
Province or territory | 2015 | 2017 | 2019 to 2020 | 2022 to 2023 | ||||
|---|---|---|---|---|---|---|---|---|
Exams | Exams per 1,000 | Exams | Exams per 1,000 | Exams | Exams per 1,000 | Exams | Exams per 1,000 | |
Alberta | 9,896 | 2.7 | 11,050 | 2.6 | 12,175 | 2.8 | 15,695 | 3.3 |
British Columbia | 8,028 | 1.4 | 9,280 | 1.9 | 11,286 | 2.2 | 15,898 | 2.9 |
Manitoba | 1,741 | 1.3 | 2,009 | 1.5 | 2,180 | 1.6 | 2,443 | 1.7 |
New Brunswick | 1,458 | 1.9 | 1,808 | 2.4 | 2,149 | 2.8 | 2,392 | 2.9 |
Newfoundland and Labrador | — | — | 0 | 0 | 1,704 | 3.3 | 2,262 | 4.2 |
Northwest Territories | — | — | — | — | — | — | — | — |
Nova Scotia | 2,241 | 2.4 | 2,512 | 2.6 | 2,512 | 2.6 | 3,465 | 3.3 |
Nunavut | — | — | — | — | — | — | — | — |
Ontario | 9,825 | 0.7 | 10,998 | 0.8 | 22,851 | 1.6 | 31,626 | 2.0 |
Prince Edward Island | — | — | — | — | — | — | — | — |
Quebec | 42,320 | 5.1 | 50,823 | 6.1 | 66,600 | 7.8 | 79,299 | 9.1 |
Saskatchewan | 1,315 | 1.2 | 2,050 | 1.8 | 2,050 | 1.7 | 3,240 | 2.7 |
Yukon | — | — | — | — | — | — | — | — |
Canada | 76,824 | 2.0 | 90,530 | 2.0 | 123,507 | 3.3 | 156,320 | 3.9 |
Notes: 2022–2023 exam volume data for public facilities was reported by validators for all jurisdictions with PET-CT capacity.
Data were derived from the following survey question: “For all units, how many examinations on average were conducted in the last fiscal/calendar year?”
Sources: CADTH (2015),13 CADTH (2017),15 CADTH (2020),14 CADTH (2024).
Table 13: Summary of Average Hours per Day of PET-CT Use by Province and Territory, 2022 to 2023
Province or territory | Number of reporting sites | Mean hours | Median (minimum to maximum) hours |
|---|---|---|---|
Alberta | 4 | 9.8 | 9.5 (9 to 11) |
British Columbia | NR | NR | NR |
Manitoba | 1 | 8 | 8 (8 to 8) |
New Brunswick | 1 | 10 | 10 (10 to 10) |
Newfoundland and Labrador | 1 | 8 | 8 (8 to 8) |
Northwest Territories | — | — | — |
Nova Scotia | 1 | 10 | 10 (10 to 10) |
Nunavut | — | — | — |
Ontario | 10 | 9.4 | 8 (8 to 14) |
Prince Edward Island | — | — | — |
Quebec | 6 | 9.5 | 9 (7 to 12) |
Saskatchewan | 1 | 9 | 9 (9 to 9) |
Yukon | — | — | — |
Canada | 25 | 9.4 | 9 (7 to 14) |
NR = not reported.
Notes: Survey response data were available for 25 out of 52 sites in 8 of the 9 jurisdictions with PET-CT capacity. No data were available for British Columbia.
Data derived from the survey question: “In an average 24-hour day, how many hours are the units staffed through regular scheduled service capacity (do not include hours where staff are only on call)”.
Table 14: Average Hours per Week of PET-CT Use by Province and Territory, 2022 to 2023
Province or territory | Number of reporting sites | Mean hours | Median (minimum to maximum) hours |
|---|---|---|---|
Alberta | 4 | 48.5 | 47 (45 to 55) |
British Columbia | NR | NR | NR |
Manitoba | 1 | 40 | 40 (40 to 40) |
New Brunswick | 1 | 26 | 26 (26 to 26) |
Newfoundland and Labrador | 1 | 56 | 56 (56 to 56) |
Northwest Territories | — | — | — |
Nova Scotia | 1 | 50 | 50 (50 to 50) |
Nunavut | — | — | — |
Ontario | 10 | 42.7 | 40 (10 to 78) |
Prince Edward Island | — | — | — |
Quebec | 6 | 44.3 | 45 (21 to 60) |
Saskatchewan | 1 | 45 | 45 (45 to 45) |
Yukon | — | — | — |
Canada | 25 | 44.2 | 45 (10 to 78) |
NR = not reported.
Notes: Survey response data were available for 25 out of 52 sites in 8 of the 9 jurisdictions with PET-CT capacity. No data were available for British Columbia.
Data were derived from the following survey question: “In an average 168-hour week, how many hours are the [modality] units staffed through regular scheduled service capacity (do not include hours where staff are only on call)?”
Table 15: Planned and Unplanned Downtime at Sites With PET-CT Units, 2022 to 2023
Province or territory | Annual planned downtime | Annual unplanned downtime | ||
|---|---|---|---|---|
Number of reporting sites | Mean hours (minimum to maximum) | Number of reporting sites | Mean hours (minimum to maximum) | |
Alberta | 3 | 37.3 (32 to 48) | 4 | 71.2 (32 to 131) |
British Columbia | NR | NR | NR | NR |
Manitoba | 1 | 36 (32 to 40) | 1 | 45 (40 to 50) |
New Brunswick | 1 | 16 (16 to 16) | NR | NR |
Newfoundland and Labrador | 1 | 32 (32 to 32) | 1 | 8 (8 to 8) |
Northwest Territories | — | — | — | — |
Nova Scotia | 1 | 24 (24 to 24) | 0 | 0 |
Nunavut | — | — | — | — |
Ontario | 9 | 58.1 (12 to 240) | 8 | 96.1 (8 to 480) |
Prince Edward Island | — | — | — | — |
Quebec | 6 | 12.8 (2 to 21) | 4 | 23.5 (7 to 60) |
Saskatchewan | 1 | 50 (50 to 50) | 1 | 36 (36 to 36) |
Yukon | — | — | — | — |
Canada | 23 | 37.8 (2 to 240) | 20 | 61.9 (0 to 480) |
NR = not reported.
Notes: Survey response data for planned downtime were available for 23 out of 52 sites across 8 of the 9 jurisdictions with PET-CT capacity. No data were available for British Columbia. Survey response data for unplanned downtime were available for 20 out of 52 sites across 7 of the 9 jurisdictions with PET-CT capacity. No data were available for British Columbia and New Brunswick.
Data were derived from the following survey question: “How much planned downtime is anticipated for scheduled maintenance for all units in a given year? (expressed in hours)” and “How much unplanned downtime is experienced for all units in a given year? (expressed in hours).”
Table 16: Average Age of PET-CT and PET-MRI Imaging Equipment, 2022 to 2023
Province or territory | Number of PET-CT units | Average age PET-CT (years, minimum to maximum) | Number of PET-MRI units | Average age PET-MRI (years, minimum to maximum) |
|---|---|---|---|---|
Alberta | 5 | 6 (1 to 11) | 1 | 5 (5 to 5) |
British Columbia | 1 | 3 (3 to 3) | NR | NR |
Manitoba | 1 | 2 (2 to 2) | — | — |
New Brunswick | 1 | 11 (11 to 11) | — | — |
Newfoundland and Labrador | 1 | 6 (6 to 6) | — | — |
Northwest Territories | 0 | — | — | — |
Nova Scotia | 1 | 3 (3 to 3) | — | — |
Nunavut | 0 | — | — | — |
Ontario | 15 | 8 (0 to 30) | 2 | 7.5 (7 to 8) |
Prince Edward Island | 0 | — | — | — |
Quebec | 7 | 7.71 (1 to 15) | — | — |
Saskatchewan | 1 | 10 (10 to 10) | — | — |
Yukon | 0 | — | — | — |
Canada | 33 | 7.2 (0 to 30) | 3 | 6.7 (5 to 8) |
NR = not reported.
Notes: Survey response data were available for 33 of 60 PET-CT units across all jurisdictions with capacity. Survey response data were available for 3 of 6 PET-MRI units across 2 of the 3 jurisdictions with capacity. No data were available for British Columbia.
Age for each unit was calculated from the following survey question: “What year did (or will) the [modality] unit become operational?” subtracted from 2023.
Table 17: Age of PET-CT and PET-MRI Imaging Units in Years, 2022 to 2023
Modality | Years | ||||
|---|---|---|---|---|---|
5 or less | 6 to 10 | 11 to 15 | 16 to 20 | Greater than 20 | |
Number of units (% of age categories) | |||||
PET-CT | 17 (51.5) | 7 (21.2) | 7 (21.2) | 0 | 2 (6.1) |
PET-MRI | 1 (33.3) | 2 (66.7) | 0 | 0 | 0 |
Notes: Survey response data were available for 33 of 60 PET-CT units across all jurisdictions with capacity. Survey response data were available for 3 of 6 PET-MRI units across 2 of the 3 jurisdictions with capacity. No data were available for British Columbia.
Age for each unit was calculated from the following survey question: “What year did (or will) the [modality] unit become operational?” subtracted from 2023.
Table 18: Summary of Type of Use by Clinical Specialty for PET-CT, 2022 to 2023
Use category | Average percent | Median (minimum to maximum) percent |
|---|---|---|
Oncology | 66.1 | 80 (0 to 100) |
Cardiac | 13.2 | 1.7 (0 to 100) |
Neurologic | 10.1 | 2 (0 to 100) |
Inflammatory | 5.4 | 0.5 (0 to 20) |
Musculoskeletal | 2.8 | 0 (0 to 24) |
Hepatobiliary | 1.2 | 0 (0 to 10) |
Respiratory | 1.2 | 0 (0 to 9) |
Trauma | 0.1 | 0 (0 to 1) |
Other | 0 | 0 (0 to 0) |
Notes: Survey response data on the average percentage of PET-CT use by discipline were available for 16 out of 52 sites across 4 of the 9 jurisdictions with PET-CT capacity.
Data were derived from the following survey question: “On average, what percentage of these exams fall into the following categories? The total percentage, expressed as a number, must add up to 100.” The following categories were asked: oncology, respiratory disease, hepatobiliary or gastrointestinal, musculoskeletal disorders, inflammatory or infectious diseases, cardiac, trauma, and other use.
Table 19: Summary of Type of Use by Medical Category for PET-CT Units, 2022 to 2023
Use category | Average percent | Median percent (minimum to maximum) |
|---|---|---|
Diagnostic noncardiac | 80.4 | 95 (0 to 100) |
Diagnostic cardiac | 12.2 | 1.4 (0 to 95) |
Research | 4.5 | 0 (0 to 40) |
Interventional | 0.1 | 0 (0 to 2.5) |
Other | 0.0 | 0 (0 to 0) |
Notes: Survey response data on the average percentage of PET-CT use by discipline were available for 22 out of 52 sites across 5 of the 9 jurisdictions with PET-CT capacity.
Data derived from survey question: “Based on your experience in the last fiscal year, what is the average percentage of overall time PET-CT units are used for?” The following categories were asked: cardiac, noncardiac, research, interventional, and other use.
Table 20: Summary of Use of AI in PET-CT, 2022 to 2023
Use of AI in PET-CT | Number of responses | Number of sites – yes (%) | Number used for clinical or research purposesa | Provinces (number of sites)b |
|---|---|---|---|---|
Lowering radiation dose | 22 | 4 (18.2) | Clinical: 2, research: 1, NR: 1 | NB (1), ON (2), QC (1) |
Reading and interpreting images | 23 | 0 | Clinical: 0, research: 1 | ON (1) |
Image reconstruction | 22 | 3 (13.6) | Clinical: 3, research: 1 | NB (1), ON (2), QC (1) |
Treatment planning | 22 | 0 | Clinical: 0, research: 1 | ON (1) |
Predicting outcomes | 22 | 0 | Clinical: 0, research: 1 | ON (1) |
Administrative tasks | 22 | 1 (4.5) | Clinical: 0, research: 1, NR: 1 | ON (1) |
AI = artificial intelligence; NR = not reported; NB = New Brunswick; ON = Ontario; QC = Quebec.
Notes: Number of sites out of 52 sites with PET-CT capacity that provided survey response data are indicated in the “Number of responses” column.
Data derived from the following survey questions: “Is artificial intelligence used to support: The reading/interpretation of images? Predicting outcomes? Lower radiation dose? Image resolution/reconstruction enhancement? Treatment planning? Administrative tasks?”
aIncludes sites that did not select “yes” for the use of AI, but provided responses for the setting of use (clinical/research).
bIncludes provinces that did not respond “yes,” but indicated setting of AI use.
Table 21: Types of Health Care Professionals That Have PET-CT Exam-Ordering Privileges, 2022 to 2023
Province or territory | Clinical specialists | Family physicians or general practitioners | Nurse practitioners |
|---|---|---|---|
Alberta | Yes, all | Yes | NR |
British Columbia | Yes, all | No | NA |
PET-CT are currently under the sole governance of the BC Cancer Agency and primarily for oncology indications with limited use for cardiac indications | |||
Manitoba | Yes, all | Requests will be accepted from family doctors, but a nuclear medicine physician will first review the request to ensure it is clinically appropriate before it is accepted | No |
New Brunswicka | Yes, all | NR | NR |
Newfoundland and Labrador | Yes, all | Requests will be accepted from family doctors, but a nuclear medicine physician will first review the request to ensure it is clinically appropriate before it is accepted | Requests will be accepted from nurse practitioners, but a nuclear medicine physician will first review the request to ensure it is clinically appropriate before it is accepted |
All requests are reviewed for clinical appropriateness before being accepted. Not all clinical indications are feasible (i.e., staging for breast cancer, all lymphoma related clinical indications, neurodegenerative diseases, and infection) due to limited capacity in the program. This is reviewed and re-evaluated on a routine basis with the clinical specialists. | |||
Northwest Territories | PET-CT are referred out of territory. No PET-CT units are available in the Northwest Territories. | Yes | Uncertain, may need physician co-signature |
Nova Scotia | Yes | No | No |
Nunavut | Uncertain. These are referrals out of territory and uncertain who has the capability to order. | ||
Ontario | Yes, all | Requests will be accepted from family doctors, but a nuclear medicine physician will first review the request to ensure it is clinically appropriate before it is accepted | No |
Prince Edward Island | — | — | — |
Quebec | Yes, all | Under certain conditions, not specified | Under certain conditions, not specified |
Saskatchewan | Yes, all | Yes | Yes |
Yukon | — | — | — |
BC = British Columbia; NR = not reported.
Notes: Survey response data were available from 11 out of 13 jurisdictions. No data were available for Prince Edward Island and Yukon.
Data were derived from the following question: “Which health care professionals can order imaging exams for PET-CT?”
aFor New Brunswick, the responses came from 1 of the 2 regional health authorities, the Horizon Health Network.
Table 22: Exam-Ordering Practice at Sites With PET-CT Units, 2022 to 2023
Province or territory | Automated entry | Paper forms | Requests by fax | Requests by telephone | Central booking | ||||||
|---|---|---|---|---|---|---|---|---|---|---|---|
Yes | No | Yes | No | Yes | No | Yes | No | All exams | Some exams | Not used | |
Number (%) of sites that use these exam-ordering practices | |||||||||||
Alberta | 3 (75) | 1 (25) | 4 (100) | 0 (0) | 4 (100) | 0 (0) | 3 (75) | 1 (25) | 0 (0) | 2 (50) | 2 (50) |
British Columbia | NR | NR | NR | NR | NR | NR | NR | NR | NR | NR | NR |
Manitoba | 0 (0) | 1 (100) | 1 (100) | 0 (0) | 1 (100) | 0 (0) | 1 (100) | 0 (0) | 0 (0) | 0 (0) | 1 (100) |
New Brunswick | 0 (0) | 1 (100) | 1 (100) | 0 (0) | 1 (100) | 0 (0) | 1 (100) | 0 (0) | 1 (100) | 0 (0) | 0 (0) |
Newfoundland and Labrador | 0 (0) | 1 (100) | 1 (100) | 0 (0) | 1 (100) | 0 (0) | 0 (0) | 1 (100) | 1 (100) | 0 (0) | 0 (0) |
Northwest Territories | — | — | — | — | — | — | — | — | — | — | — |
Nova Scotia | 0 (0) | 1 (100) | 1 (100) | 0 (0) | 1 (100) | 0 (0) | 0 (0) | 1 (100) | 1 (100) | 0 (0) | 0 (0) |
Nunavut | — | — | — | — | — | — | — | — | — | — | — |
Ontario | 7 (63.6) | 4 (36.4) | 10 (90.9) | 1 (9.1) | 9 (81.8) | 2 (18.2) | 3 (30) | 7 (70) | 8 (80) | 0 (0) | 2 (20) |
Prince Edward Island | — | — | — | — | — | — | — | — | — | — | — |
Quebec | 2 (33.3) | 4 (66.7) | 5 (83.3) | 1 (16.7) | 5 (83.3) | 1 (16.7) | 1 (16.7) | 5 (83.3) | 2 (33.3) | 1 (16.7) | 3 (50) |
Saskatchewan | 0 (0) | 1 (100) | 1 (100) | 0 (0) | 1 (100) | 0 (0) | 0 (0) | 1 (100) | 0 (0) | 1 (100) | 0 (0) |
Yukon | — | — | — | — | — | — | — | — | — | — | — |
Canada | 12 (46) | 14 (54) | 24 (92) | 2 (8) | 23 (88) | 3 (12) | 9 (36) | 16 (64) | 13 (52) | 4 (16) | 8 (32) |
NR = not reported.
Notes: Survey response data were available for 27 out of 52 sites across 8 of the 9 jurisdictions with PET-CT capacity. No data were available from British Columbia and Manitoba.
Data were derived from the following survey question: “Are automated order entry forms (exams request) used?”; “Are paper forms (exams requests) used?”; “Are requests received by fax?”; “Are requests received by phone?”; and “Is a centralized order entry (booking) system used? For all exams: Yes/no; For some exams: yes/no.”
Table 23: Trends in Reported Slices for PET-CT Units, 2012 to 2022–2023
Slices | 2012 | 2015 | 2017 | 2019–2020 | 2022–2023 |
|---|---|---|---|---|---|
Number of units (% of total responses per survey year) | |||||
1 | 1 (3.1) | 1 (2.7) | 0 | 0 | 0 |
2 | 3 (9.4) | 1 (2.7) | 0 | 0 | 0 |
4 | 0 | 0 | 1 (2.6) | 1 (2.6) | 0 |
6 | 1 (3.1) | 1 (2.7) | 1 (2.6) | 0 | 0 |
8 | 0 | 0 | 0 | 0 | 1 (3.7) |
16 | 24 (75) | 26 (70.3) | 25 (65.8) | 20 (51.3) | 3 (11.1) |
32 | 0 | 0 | 0 | 1 (2.6) | 2 (7.4) |
40 | 0 | 2 (5.4) | 2 (5.3) | 2 (5.1) | 3 (11.1) |
64 | 3 (9.4) | 6 (16.2) | 8 (21.1) | 11 (28.2) | 14 (51.9) |
128 | 0 | 0 | 0 | 2 (5.1) | 4 (14.8) |
256 | 0 | 0 | 1 (2.6) | 1 (2.6) | 0 |
320 | 0 | 0 | 0 | 1 (2.6) | 0 |
Notes: 2022 to 2023 survey response data were available for 27 out of 60 PET-CT units across 8 of the 9 jurisdictions with capacity. No data were available for British Columbia.
Data derived from the survey question: “How many multi-detectors does the CT unit have (how many slices)?”
Table 24: Availability and Use of Technologies for Control of Radiation Exposure for PET-CT, 2015 to 2022–2023
Response | 2015 n (%) | 2017 n (%) | 2019 to 2020 n (%) | 2022 to 2023 n (%) |
|---|---|---|---|---|
Does the PET-CT unit have dose-management controls? | ||||
Yes | 8 (18.6) | 22 (40.7) | 28 (51.9) | 20 (33.3) |
No | 1 (2.3) | 3 (5.6) | 3 (5.6) | 3 (5.0) |
Don't know | 0 | 1 (1.9) | 4 (7.4) | 3 (5.0) |
Missing | 34 (79.1) | 28 (51.9) | 19 (35.2) | 34 (56.7) |
If yes, are the dose-management controls used? | ||||
Yes | NA | 14 (25.9) | 20 (37) | NA |
No | NA | 8 (14.8) | 8 (14.8) | NA |
Don't know | NA | 3 (5.6) | 7 (13) | NA |
Missing | NA | 29 (53.7) | 19 (35.2) | NA |
Does the PET-CT unit incorporate image reconstruction techniques for dose reduction? | ||||
Yes | 8 (18.6) | 19 (35.2) | 24 (44.4) | NA |
No | 2 (4.7) | 2 (3.7) | 4 (7.4) | NA |
Don't know | 0 | 0 | 1 (1.9) | NA |
Missing | 33 (76.7) | 33 (61.1) | 25 (46.3) | NA |
Does the PET-CT unit record patient radiation dose by exam (e.g., as a save screen on PACS)? | ||||
Yes | 8 (18.6) | 18 (33.3) | 26 (48.1) | 22 (36.7) |
No | 2 (4.7) | 5 (9.3) | 4 (7.4) | 1 (1.7) |
Don't know | 0 | 3 (5.6) | 5 (9.3) | 2 (3.3) |
Missing | 33 (76.7) | 28 (51.9) | 19 (35.2) | 35 (58.3) |
NA = not applicable; PACS = picture archiving and communication system.
Notes: For NA, question not asked during survey time point.
The 2022–2023 survey response data were available for 26 of the 60 PET-CT units across 6 of the 9 jurisdictions with capacity.
Data were derived from the following survey questions: “Does the PET-CT unit have dose management controls?”, “Does the modality make regularly use of dose management controls?”; “Does the PET-CT unit incorporate image reconstruction techniques for dose reduction?”; “Does the PET-CT unit record patient CT radiation dose (e.g., as a save screen on PACS)?”; “Do you capture patient cumulative radiation dose tracking?”; and “If no, do you plan to capture patient cumulative radiation tracking in the future?.”
Table 25: Population Estimates and Projections for Canada by Province and Territory, 2007 to 2040
Province or territory | 2007 | 2015 | 2017 | 2020 | 2023 | 2025 (low- to high-growth projections) | 2030 (low- to high-growth projections) | 2035 (low- to high-growth projections) | 2040 (low- to high-growth projections) |
|---|---|---|---|---|---|---|---|---|---|
Number of people | |||||||||
Alberta | 3,533,414 | 4,163,048 | 4,253,530 | 4,412,013 | 4,591,100 | 4,761,500 (4,696,600 to 4,816,400) | 5,254,600 (5,040,300 to 5,411,900) | 5,739,800 (5,356,300 to 6,033,800) | 6,212,900 (5,654,900 to 6,714,200) |
British Columbia | 4,312,048 | 4,795,547 | 4,962,706 | 5,173,896 | 5,451,700 | 5,642,800 (5,541,600 to 5,729,700) | 6,027,500 (5,752,300 to 6,238,900) | 6,306,700 (5,855,000 to 6,653,900) | 6,541,200 (5,917,400 to 7,085,800) |
Manitoba | 1,191,684 | 1,298,120 | 1,340,426 | 1,381,809 | 1,414,400 | 1,445,300 (1,422,700 to 1,467,000) | 1,527,900 (1,460,300 to 1,582,600) | 1,611,300 (1,493,300 to 1,711,800) | 1,686,700 (1,520,100 to 1,852,900) |
New Brunswick | 746,136 | 759,971 | 768,029 | 783,814 | 804,300 | 816,400 (808,200 to 822,800) | 837,700 (813,900 to 853,700) | 848,700 (808,100 to 877,500) | 854,700 (798,100 to 902,100) |
Newfoundland and Labrador | 510,256 | 528,843 | 530,153 | 526,046 | 519,500 | 517,500 (512,500 to 522,000) | 510,100 (496,900 to 521,200) | 499,300 (477,700 to 517,200) | 486,300 (456,900 to 512,600) |
Northwest Territories | 43,286 | 44,443 | 44,825 | 44,395 | 46,300 | 47,100 (46,500 to 47,600) | 48,600 (46,900 to 49,900) | 49,500 (46,600 to 51,800) | 50,100 (46,100 to 54,000) |
Nova Scotia | 935,433 | 938,914 | 956,074 | 989,154 | 1,023,500 | 1,046,100 (1,032,900 to 1,058,600) | 1,079,200 (1,043,800 to 1,109,400) | 1,091,800 (1,033,100 to 1,142,000) | 1,097,600 (1,016,900 to 1,175,100) |
Nunavut | 31,560 | 36,602 | 37,829 | 39,581 | 40,200 | 41,000 (40,700 to 41,300) | 43,000 (42,100 to 43,700) | 45,300 (43,600 to 46,500) | 47,700 (45,200 to 49,700) |
Ontario | 12,807,497 | 13,759,762 | 14,610,084 | 14,757,582 | 15,372,100 | 15,837,800 (15,573,200 to 16,067,500) | 16,883,800 (16,134,300 to 17,446,900) | 17,807,200 (16,534,000 to 18,795,500) | 18,615,400 (16,830,000 to 20,232,300) |
Prince Edward Island | 138,020 | 144,949 | 150,595 | 159,179 | 171,800 | 177,400 (174,300 to 179,900) | 187,700 (179,200 to 193,600) | 196,600 (182,200 to 207,200) | 204,400 (184,400 to 222,000) |
Quebec | 7,712,616 | 8,190,074 | 8,326,075 | 8,551,865 | 8,746,600 | 8,859,200 (8,757,800 to 8,953,600) | 9,080,500 (8,802,700 to 9,298,900) | 9,256,500 (8,788,300 to 9,621,900) | 9,396,500 (8,739,100 to 9,970,200) |
Saskatchewan | 1,007,305 | 1,125,588 | 1,151,044 | 1,165,963 | 1,199,500 | 1,226,100 (1,208,100 to 1,239,500) | 1,311,100 (1,251,800 to 1,349,100) | 1,398,300 (1,292,400 to 1,472,700) | 1,479,800 (1,327,800 to 1,608,600) |
Yukon | 32,663 | 37,730 | 39,705 | 42,109 | 45,000 | 46,500 (45,900 to 47,000) | 48,900 (47,600 to 50,200) | 50,100 (47,500 to 52,300) | 50,900 (47,200 to 54,300) |
Canada | 33,001,918 | 35,823,491 | 36,722,075 | 38,027,406 | 39,426,000 | 40,647,000 (39,861,100 to 40,992,800) | 42,840,800 (41,111,900 to 44,150,000) | 44,901,100 (41,958,100 to 47,184,200) | 46,724,200 (42,584,000 to 50,433,700) |
Note: Data retrieved from the Statistics Canada website.33
Table 26: Reported and Projected Numbers of PET-CT Units by Province and Territory, 2007 to 2040
Province or territory | 2007 | 2015 | 2017 | 2020 | 2023 | 2025 (low- to high-growth projections) | 2030 (low- to high-growth projections) | 2035 (low- to high-growth projections) | 2040 (low- to high-growth projections) |
|---|---|---|---|---|---|---|---|---|---|
Alberta | 3.0 | 4.0 | 4.0 | 4.0 | 5.0 | 5.2 (5.1 to 5.2) | 5.7 (5.5 to 5.9) | 6.3 (5.8 to 6.6) | 6.8 (6.2 to 7.3) |
British Columbia | 3.0 | 3.0 | 3.0 | 4.0 | 5.0 | 5.2 (5.1 to 5.3) | 5.5 (5.3 to 5.7) | 5.8 (5.4 to 6.1) | 6.0 (5.4 to 6.5) |
Manitoba | 1.0 | 1.0 | 1.0 | 1.0 | 1.0a | 1.0 (1.0 to 1.1) | 1.1 (1.0 to 1.1) | 1.1 (1.1 to 1.2) | 1.2 (1.1 to 1.3) |
New Brunswick | 1.0 | 2.0 | 2.0 | 2.0 | 2.0 | 2.0 (2.0 to 2.0) | 2.1 (2.0 to 2.1) | 2.1 (2.0 to 2.2) | 2.1 (2.0 to 2.2) |
Newfoundland and Labrador | 0.0 | 0.0 | 1.0 | 1.0 | 1.0 | 1.0 (1.0 to 1.0) | 1.0 (1.0 to 1.0) | 1.0 (0.9 to 1.0) | 0.9 (0.9 to 1.0) |
Northwest Territories | 0.0 | 0.0 | 0.0 | 0.0 | 0.0 | 0.0 (0.0 to 0.0) | 0.0 (0.0 to 0.0) | 0.0 (0.0 to 0.0) | 0.0 (0.0 to 0.0) |
Nova Scotia | 0.0 | 1.0 | 1.0 | 1.0 | 1.0 | 1.0 (1.0 to 1.0) | 1.1 (1.0 to 1.1)b | 1.1 (1.0 to 1.1) | 1.1 (1.0 to 1.1) |
Nunavut | 0.0 | 0.0 | 0.0 | 0.0 | 0.0 | 0.0 (0.0 to 0.0) | 0.0 (0.0 to 0.0) | 0.0 (0.0 to 0.0) | 0.0 (0.0 to 0.0) |
Ontario | 12.0 | 15.0 | 20.0 | 20.0 | 20.0 | 20.6 (20.3 to 20.9) | 22.0 (21.0 to 22.7) | 23.1 (21.5 to 24.5) | 24.2 (21.9 to 26.3) |
Prince Edward Island | 0.0 | 0.0 | 0.0 | 0.0 | 0.0 | 0.0 (0.0 to 0.0) | 0.0 (0.0 to 0.0) | 0.0 (0.0 to 0.0) | 0.0 (0.0 to 0.0) |
Quebec | 11.0 | 20.0 | 21.0 | 23.0 | 24.0 | 24.3 (24.0 to 24.6) | 24.9 (24.2 to 25.5) | 25.4 (24.1 to 26.4) | 25.8 (24.0 to 27.4) |
Saskatchewan | 0.0 | 1.0 | 1.0 | 1.0 | 1.0 | 1.0 (1.0 to 1.0) | 1.1 (1.0 to 1.1) | 1.2 (1.1 to 1.2) | 1.2 (1.1 to 1.3) |
Yukon | 0.0 | 0.0 | 0.0 | 0.0 | 0.0 | 0.0 (0.0 to 0.0) | 0.0 (0.0 to 0.0) | 0.0 (0.0 to 0.0) | 0.0 (0.0 to 0.0) |
Canada | 31.0 | 47.0 | 54.0 | 57.0 | 60.0 | 61.6 (60.7 to 62.4) | 65.2 (62.6 to 67.2) | 68.3 (63.9 to 71.8) | 71.1 (64.8 to 76.8) |
Note: The projection was calculated as the product of the numbers of per capita units in 2022 to 2023 and the population projections in 2025, 2030, 2035, and 2040. The numbers of imaging units were provided by provincial or territorial validators in 2023. The population projections were retrieved from Statistics Canada website on January 18, 2024.33 The population projection assumed medium, low, and high growth.
aOne new PET-CT scanner was installed midyear 2023; anticipated exam volume was not included in the projected unit counts.
bProjected unit count does not include 1 additional unit anticipated for installation by 2030.
Table 27: Reported and Projected Numbers of PET-CT Exams by Province and Territory, 2007 to 2040
Province or territory | 2007 | 2015 | 2017 | 2020 | 2023 | 2025 (low- to high-growth projections) | 2030 (low- to high-growth projections) | 2035 (low- to high-growth projections) | 2040 (low- to high-growth projections) |
|---|---|---|---|---|---|---|---|---|---|
Alberta | – | 9,826 | 11,050 | 12,175 | 15,695 | 16,277.5 (16,055.7 to 16,465.2) | 17,963.2 (17,230.6 to 18,501.0) | 19,621.9 (18,130.9 to 20,627.0) | 21,239.2 (19,331.7 to 22,953.0) |
British Columbia | – | 8,028 | 9,280 | 11,286 | 15,898 | 16,455.3 (16,160.2 to 16,708.7) | 17,577.1 (16,774.6 to 18,193.6) | 18,391.3 (17,074.1 to 19,403.8) | 19,075.2 (17,256.1 to 20,663.3) |
Manitoba | – | 1,741 | 2,009 | 2,180 | 2,443a | 2,496.4 (2,457.3 to 2,533.9) | 2,639.0 (2,522.3 to 2,733.5) | 2,783.1 (2,579.3 to 2,956.7) | 2,913.3 (2,625.6 to 3,200.4) |
New Brunswick | – | 1,458 | 1,808 | 2,149 | 2,392 | 2,428.0 (2,403.6 to 2,447.0) | 2,491.3 (2,420.6 to 2,538.9) | 2,524.0 (2,403.3 to 2,609.7) | 2,541.9 (2,373.6 to 2,682.9) |
Newfoundland and Labrador | – | 0 | 0 | 1,704 | 2,262 | 2,253.3 (2,231.5 to 2,272.9) | 2,221.1 (2,163.6 to 2,269.4) | 2,174.0 (2,080.0 to 2,252.0) | 2,117.4 (1,989.4 to 2,232.0) |
Northwest Territories | – | 0 | 0 | 0 | 0 | 0.0 (0.0 to 0.0) | 0.0 (0.0 to 0.0) | 0.0 (0.0 to 0.0) | 0.0 (0.0 to 0.0) |
Nova Scotia | – | 2,241 | 2,512 | 2,512 | 3,465 | 3,541.5 (3,496.8 to 3,583.8) | 3,653.6 (3,533.7 to 3,755.8) | 3,696.2 (3,497.5 to 3,866.2) | 3,715.9 (3,442.7 to 3,978.2) |
Nunavut | – | 0 | 0 | 0 | 0 | 0.0 (0.0 to 0.0) | 0.0 (0.0 to 0.0) | 0.0 (0.0 to 0.0) | 0.0 (0.0 to 0.0) |
Ontario | – | 9,825 | 10,998 | 22,851 | 31,626 | 32,584.1 (32,039.7 to 33,056.7) | 34,736.1 (33,194.1 to 35,894.6) | 36,635.9 (34,016.5 to 38,669.2) | 38,298.7 (34,625.4 to 41,625.2) |
Prince Edward Island | – | 0 | 0 | 0 | 0 | 0.0 (0.0 to 0.0) | 0.0 (0.0 to 0.0) | 0.0 (0.0 to 0.0) | 0.0 (0.0 to 0.0) |
Quebec | – | 42,230 | 50,823 | 66,600 | 79,299 | 80,319 (79,400.5 to 81,175.7) | 82,326.2 (79,807.6 to 84,306.3) | 83,921.9 (79,677.1 to 87,234.7) | 85,191.2 (79,321.0 to 90,392.5) |
Saskatchewan | – | 1,315 | 2,050 | 2,050 | 3,240 | 3,311.9 (3,263.2 to 3,348.0) | 3,541.4 (3,381.3 to 3,644.1) | 3,777.0 (3,490.9 to 3,977.9) | 3,997.1 (3,586.6 to 4,345.0) |
Yukon | – | 0 | 0 | 0 | 0 | 0.0 (0.0 to 0.0) | 0.0 (0.0 to 0.0) | 0.0 (0.0 to 0.0) | 0.0 (0.0 to 0.0) |
Canada | – | 76,824 | 90,530 | 123,507 | 156,320 | 160,438.3 (158,045.1 to 162,532.2) | 169,859.3 (163,004.4 to 175,050.2) | 178,028.2 (166,359.5 to 187,080.5) | 185,256.6 (168,841.1 to 199,964.4) |
Note: The projection was calculated as the product of the numbers of per capita exams in 2022 to 2023 and the population projections in 2025, 2030, 2035, and 2040. The numbers of imaging exams were provided by provincial or territorial validators in 2023. The population projections were retrieved from Statistics Canada website on January 18, 2024.33 The population projection assumed medium, low, and high growth.
aA new PET-CT scanner was installed midyear 2023, which is not included in the projected exam counts.
Appendix 4: Supplementary Summary Tables for Publicly Funded Sites With PET-CT Units, 2022-2023
Note that this appendix has not been copy-edited.
Table 28: Average Hours per Day of PET-CT Use at Publicly Funded Sites by Province and Territory, 2022 to 2023
Province or territory | Number of reporting sites | Mean hours | Median (minimum to maximum) hours |
|---|---|---|---|
Alberta | 4 | 9.8 | 9.5 (9 to 11) |
British Columbia | NR | NR | NR |
Manitoba | 1 | 8 | 8 (8 to 8) |
New Brunswick | 1 | 10 | 10 (10 to 10) |
Newfoundland and Labrador | 1 | 8 | 8 (8 to 8) |
Northwest Territories | — | — | — |
Nova Scotia | 1 | 10 | 10 (10 to 10) |
Nunavut | — | — | — |
Ontario | 10 | 9.4 | 8 (8 to 14) |
Prince Edward Island | — | — | — |
Quebec | 6 | 9.5 | 9 (7 to 12) |
Saskatchewan | 1 | 9 | 9 (9 to 9) |
Yukon | — | — | — |
Canada | 25 | 9.4 | 9 (7 to 14) |
NR = not reported.
Notes: Overall, 25 out of 25 sites that reported information for PET-CT daily operation identified as public facilities.
Data were derived from the following survey question: “In an average 24-hour day, how many hours are the units staffed through regular scheduled service capacity (do not include hours where staff are only on call)”.
Table 29: Average Hours per Week of PET-CT Use at Publicly Funded Sites by Province and Territory, 2022 to 2023
Province or territory | Number of reporting sites | Mean hours | Median (minimum to maximum) hours |
|---|---|---|---|
Alberta | 4 | 48.5 | 47 (45 to 55) |
British Columbia | NR | NR | NR |
Manitoba | 1 | 40 | 40 (40 to 40) |
New Brunswick | 1 | 26 | 26 (26 to 26) |
Newfoundland and Labrador | 1 | 56 | 56 (56 to 56) |
Northwest Territories | — | — | |
Nova Scotia | 1 | 50 | 50 (50 to 50) |
Nunavut | — | — | — |
Ontario | 10 | 42.7 | 40 (10 to 78) |
Prince Edward Island | — | — | — |
Quebec | 6 | 44.3 | 45 (21 to 60) |
Saskatchewan | 1 | 45 | 45 (45 to 45) |
Yukon | — | — | — |
Canada | 25 | 44.2 | 45 (10 to 78) |
NR = not reported.
Notes: Overall, 25 out of 25 sites that reported information for PET-CT weekly operation identified as public facilities.
Data were derived from the following survey question: “In an average 168-hour week, how many hours are the [modality] units staffed through regular scheduled service capacity (do not include hours where staff are only on call)?”
Table 30: Average Age of Publicly Funded PET-CT Imaging Equipment, 2022 to 2023
Province or territory | Number of PET-CT units | Average age PET-CT (years, minimum to maximum) |
|---|---|---|
Alberta | 5 | 6 (1 to 11) |
British Columbia | 1 | 3 (3 to 3) |
Manitoba | 1 | 2 (2 to 2) |
New Brunswick | 1 | 11 (11 to 11) |
Newfoundland and Labrador | 1 | 6 (6 to 6) |
Northwest Territories | 0 | — |
Nova Scotia | 1 | 3 (3 to 3) |
Nunavut | 0 | — |
Ontario | 14 | 7.6 (0 to 30) |
Prince Edward Island | 0 | — |
Quebec | 7 | 7.7 (1 to 15) |
Saskatchewan | 1 | 10 (10 to 10) |
Yukon | 0 | — |
Canada | 32 | 7.1 (0 to 30) |
Notes: Overall, 32 out of 33 PET-CT units with information reported for operational age were located at public facilities.
Age for each unit was calculated from the following survey question: “What year did (or will) the [modality] unit become operational?” subtracted from 2023.
ISSN: 2563-6596
Disclaimer: The information in this document is intended to help Canadian health care decision-makers, health care professionals, health systems leaders, and policy-makers make well-informed decisions and thereby improve the quality of health care services. While patients and others may access this document, the document is made available for informational purposes only and no representations or warranties are made with respect to its fitness for any particular purpose. The information in this document should not be used as a substitute for professional medical advice or as a substitute for the application of clinical judgment in respect of the care of a particular patient or other professional judgment in any decision-making process. The Canadian Agency for Drugs and Technologies in Health (CADTH) does not endorse any information, drugs, therapies, treatments, products, processes, or services.
While care has been taken to ensure that the information prepared by CADTH in this document is accurate, complete, and up-to-date as at the applicable date the material was first published by CADTH, CADTH does not make any guarantees to that effect. CADTH does not guarantee and is not responsible for the quality, currency, propriety, accuracy, or reasonableness of any statements, information, or conclusions contained in any third-party materials used in preparing this document. The views and opinions of third parties published in this document do not necessarily state or reflect those of CADTH.
CADTH is not responsible for any errors, omissions, injury, loss, or damage arising from or relating to the use (or misuse) of any information, statements, or conclusions contained in or implied by the contents of this document or any of the source materials.
This document may contain links to third-party websites. CADTH does not have control over the content of such sites. Use of third-party sites is governed by the third-party website owners’ own terms and conditions set out for such sites. CADTH does not make any guarantee with respect to any information contained on such third-party sites and CADTH is not responsible for any injury, loss, or damage suffered as a result of using such third-party sites. CADTH has no responsibility for the collection, use, and disclosure of personal information by third-party sites.
Subject to the aforementioned limitations, the views expressed herein are those of CADTH and do not necessarily represent the views of Canada’s federal, provincial, or territorial governments, or any third-party supplier of information.
This document is prepared and intended for use in the context of the Canadian health care system. The use of this document outside of Canada is done so at the user’s own risk.
This disclaimer and any questions or matters of any nature arising from or relating to the content or use (or misuse) of this document will be governed by and interpreted in accordance with the laws of the Province of Ontario and the laws of Canada applicable therein, and all proceedings shall be subject to the exclusive jurisdiction of the courts of the Province of Ontario, Canada.
The copyright and other intellectual property rights in this document are owned by CADTH and its licensors. These rights are protected by the Canadian Copyright Act and other national and international laws and agreements. Users are permitted to make copies of this document for noncommercial purposes only, provided it is not modified when reproduced and appropriate credit is given to CADTH and its licensors.
About CADTH: CADTH is an independent, not-for-profit organization responsible for providing Canada’s health care decision-makers with objective evidence to help make informed decisions about the optimal use of drugs, medical devices, diagnostics, and procedures in our health care system.
Funding: CADTH receives funding from Canada’s federal, provincial, and territorial governments, with the exception of Quebec.
Questions or requests for information about this report can be directed to Requests@CADTH.ca