CADTH Health Technology Review
Canadian Medical Imaging Inventory 2022–2023: Provincial and Territorial Overview
CMII Report
Abbreviations
CIHI
Canadian Institute for Health Information
CMII
Canadian Medical Imaging Inventory
MRT
medical radiation technologist
OECD
Organisation for Economic Co-operation and Development
PACS
picture archiving and communication system
Key Messages
The average age of imaging equipment in Canada has increased for all imaging modalities over the past 2 decades. Most imaging equipment is more than 5 years old, and at least one-third of equipment is more than 10 years old.
Investing in new equipment to meet growing demand may not increase imaging capacity without also considering staffing.
There is no current international benchmark for the optimal number of imaging units per population, but there is a general assumption that too few units may limit access and increase wait times while too many units may encourage low-value imaging.
Canada remains below the average for Organisation for Economic Co-operation and Development (OECD) countries and is positioned in the bottom 30% of OECD countries in units per million population for CT, MRI, and PET-CT.
Canada is positioned in the bottom 50% of OECD countries for volume of publicly funded CT, MRI, and PET-CT exams per 1,000 population.
Since 2012, both the overall numbers of MRI, PET-CT, and SPECT-CT units and the numbers of MRI, PET-CT, and SPECT-CT units per million people have grown.
The number of units for all modalities operating in Canada has increased since 2019–2020, except for SPECT units. In most provinces, the number of SPECT units per population decreased, indicating that population growth outpaced installation.
The imaging workforce is under strain. Clearing the backlog of exams deferred during the pandemic has exacerbated existing staffing shortages.
New investment in radiology staffing, particularly imaging technologists, is required, including improved recruitment and retention policies.
Compared to the prepandemic period, there are now fewer full-time radiology professionals in practice across Canada, with medical physicists experiencing the largest decline per million population.
Wait times for medical imaging remain above the recommended maximum wait time in many jurisdictions and are influenced by a variety of factors.
The adoption of supportive tools and technologies — such as clinical decision support tools, automated order entry, and AI-driven solutions — can assist the workforce, add value to imaging services, and increase access to medical imaging.
What Is the Context?
Medical imaging is a vital service within the health care system in Canada.1 Medical imaging has transformed the delivery of health care by enabling the early detection of disease and improving patient outcomes.1,2 Information from medical imaging is essential for both acute and nonurgent care, as well as for inpatient and outpatient services.3
Advanced medical imaging (CT, MRI, PET-CT, SPECT, SPECT-CT, and PET-MRI) are used routinely in publicly funded radiology and nuclear medicine departments and in private imaging facilities across Canada, with a geographic concentration in urban settings.
These advanced imaging equipment are expensive4 and contribute to the growth in health care costs.4 At the same time, because the rapid diagnosis of patients can reduce further testing and accelerate time to treatment,5 access to advanced imaging equipment is associated with decreased long-term health care costs.5
As imaging modalities advance, decision-makers and clinicians face complex choices about which medical imaging technologies to use. Each modality offers unique characteristics, advantages, and disadvantages. However, decisions about adoption and implementation are made within the context of a finite health care budget and limited availability of clinical and technical expertise.
In response, the Canadian Medical Imaging Inventory (CMII) was created in 2015 to track, compare, and map trends over time related to the availability, distribution, technical specifications, and use of advanced imaging equipment in Canada. The CMII collects data through a survey conducted approximately every 2 years and details the use of strategies for improving appropriate imaging, enhancing system efficiencies, reducing wait lists, and addressing other systemic challenges. Through this work, the CMII provides health care decision-makers with information on the imaging landscape in Canada that may be used to identify and address service and medical equipment gaps and inform strategic planning.
Since the publication of the last iteration of the CMII national survey in January 2021,6 there has been a worldwide pandemic and activities in the medical imaging community that continue to challenge health care systems across Canada:
increased reliance on the private delivery of publicly funded exams, which has resulted in the expansion of private services, chain ownerships, and investment firm acquisition of private imaging facilities7
new inventory procurement management practices to support sustainable and secure supply chains, as demonstrated by the global shortage of iodinated contrast media (an agent used in approximately 50% of CT exams) caused by pandemic lockdowns8
rapid adoption of innovative tools and technologies to support increased imaging capacity and improved access
introduction of renewed recruitment and retention policies to address medical imaging staff stress, which has exacerbated existing staffing shortages.10,11
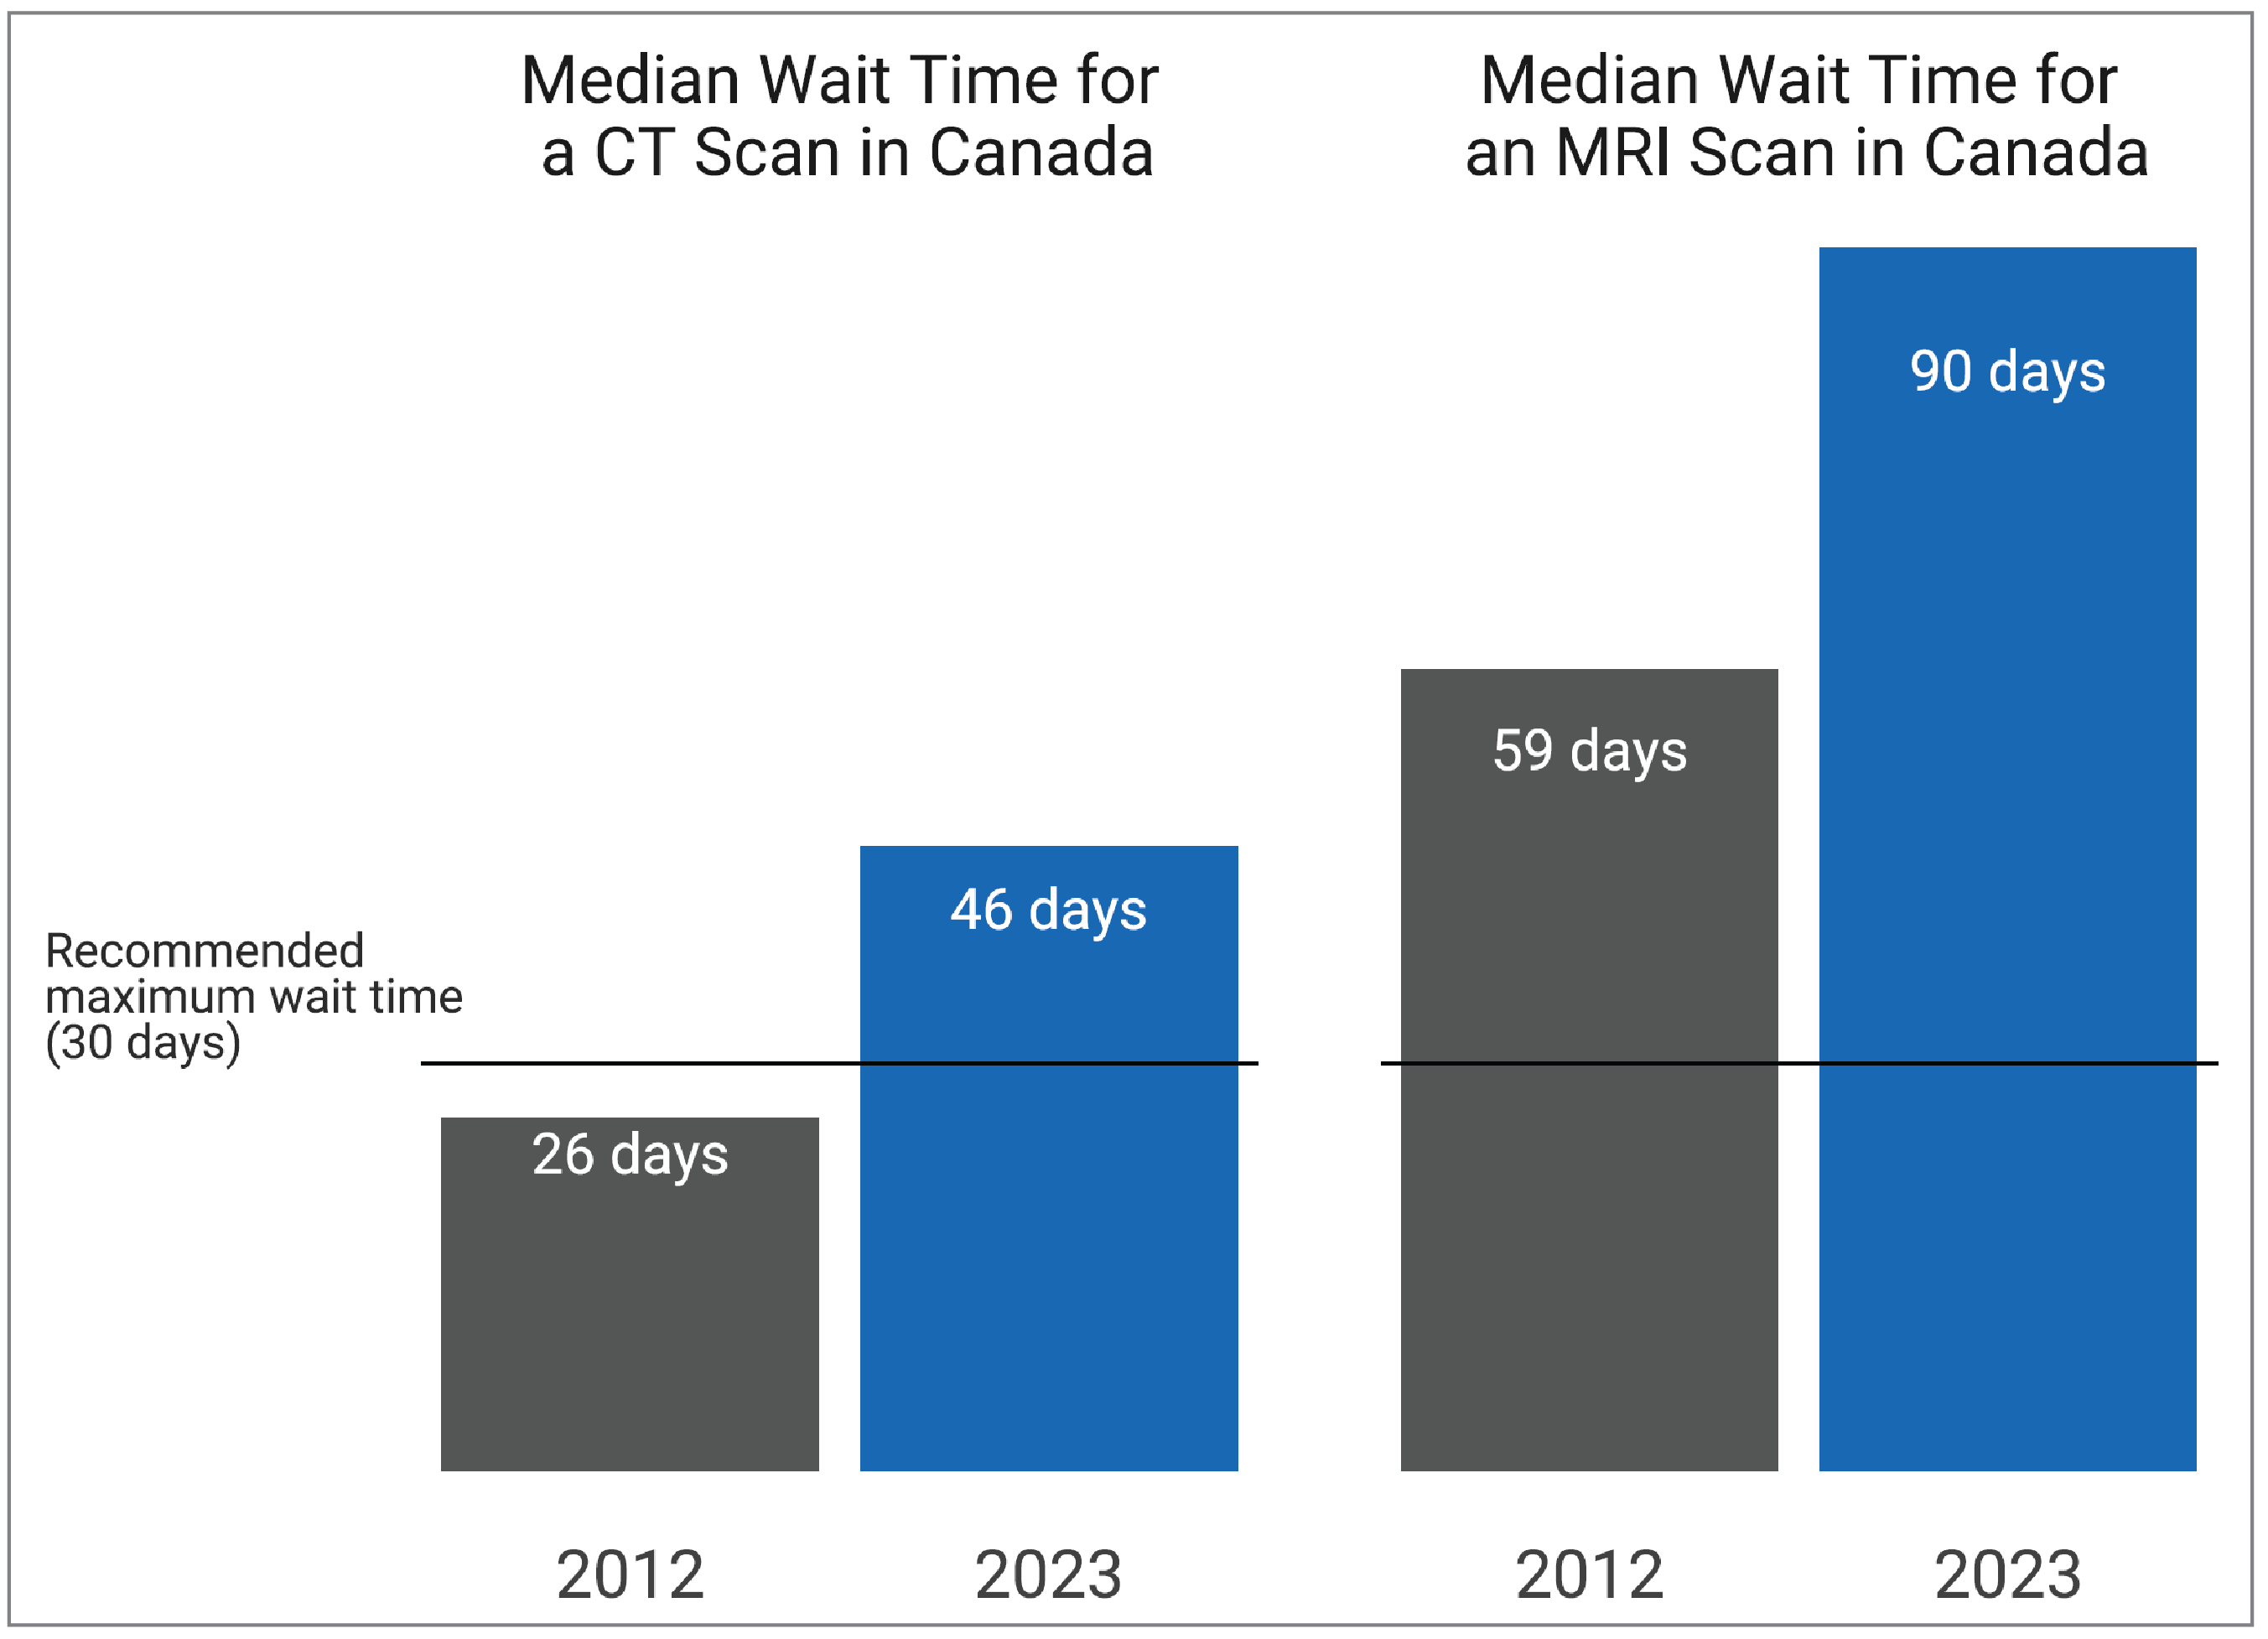
Some of these activities may be politically sensitive, and it may be challenging to implement strategies to address their impacts; however, failure to act on them may contribute to longer waiting times for imaging exams. In 2023, wait times for medically necessary elective CT exams exceeded the recommended 30-day maximum target12 in all provinces (data for territories were not available) apart from Quebec, with a national average wait time of 46 days.13 Similarly, for MRI, wait times exceeded the 30-day recommended maximum target in all provinces (data for territories were not available), with a national average wait time of 90 days.13 This is consistent with trends over time that show an ongoing deterioration in timely access to imaging.13
In 2001, CADTH’s predecessor (then the Canadian Coordinating Office for Health Technology Assessment (CCOHTA) conducted its first inventory of diagnostic imaging equipment in Canada. From 2003 to 2012, the Canadian Institute for Health Information (CIHI) continued to collect data on the inventory and use of diagnostic imaging equipment.14-16 In 2014, CADTH resumed work on the inventory to meet the ongoing needs of decision-makers, publishing reports in 2016,17 2018,18 and 2021.6
This CMII report summarizes the findings of the 2022–2023 iteration of the national inventory.
What Did We Do?
This report provides a summary of imaging capacity for CT, MRI, PET-CT, PET-MRI, SPECT, and SPECT-CT across Canada at the jurisdictional level for 2022–2023. The data presented are based primarily on the results of the CMII, a national self-report survey of imaging facilities in every province and territory. A summary of the methodology is presented in the Methods Overview section, with detailed information available in the Canadian Medical Imaging Inventory 2022–2023: Methods report located on the CMII webpage. An overview for each modality is provided in Appendix 1.
Why Did We Do This?
CADTH maintains the CMII to provide information on the medical imaging landscape across Canada to help support health care decision-making. Robust data are required to ensure health systems can deliver the imaging required to provide timely, safe, patient-centred care; improve health outcomes; and deliver health care efficiencies. The data collected by the CMII can be used by decision-makers for the following purposes:
identify gaps in service
inform benchmark practices
help optimize existing capacity
define outcomes and promote processes that are responsive to patients, workforce, and health system needs
identify sustainable solutions to promote health care system resilience
enable data-driven decisions to be made, highlighting system-level pressure points to improve service delivery and reduce wait times
monitor the adoption of innovations within medical imaging
identify implementation concerns associated with the introduction of new drug therapies and innovations outside medical imaging
understand existing and future demand for services
enable decision-makers to plan for future sustainability
compare inventory of units within Canada with that of other countries.
Methods Overview
Data were primarily collected on 6 imaging modalities using a web-based self-report survey (refer to Canadian Medical Imaging Inventory 2022–2023: Methods report located on the CMII webpage), supplemented with information from provincial and territorial validators (i.e., senior medical imaging–related health care decision-makers), report peer reviewers, literature searches, CIHI, and previous iterations of CMII data. Both English and French versions of the survey were provided.
The CMII survey collected the following data:
number and location of imaging equipment
volume of exams
hours of equipment operation
age of imaging equipment
technical specifications of machines
imaging storing and communication services.
The survey opened on May 5, 2023, and primary data collection and validator responses were collected up until October 31, 2023. The full data collection and analysis strategy, including survey development, respondent identification, sources of data used, and data validation procedures can be found in the Canadian Medical Imaging Inventory 2022–2023: Methods report on the CMII website.
The CMII also presents data from both the survey and other sources relating to human resources, funding structures, ordering and referral practices, and the adoption of tools that may support appropriate imaging, system efficiencies, and wait list reductions.
Comparisons between data from Canada and data from other OECD countries are reported, as are trends and projections on imaging capacity.
Imaging Facility Overview
Response Rate for the 2022–2023 National Survey
A total of 504 sites were invited to participate in the survey. Data on modalities and unit counts were available for 467 sites (92.7%).
A 100% participation rate was received from publicly funded facilities (i.e., hospitals) in 7 provinces and all territories. The participation rate for the remaining provinces ranged from 51% to 93% for publicly funded facilities (Figure 30).
A complete response rate was received for unit counts and exam volumes by provincial and territorial validators, while the response rate varied for other survey questions. A total of approximately 308 sites provided updated or new information (72%), reflecting an increased response rate of 34% since the CMII 2019–2020 survey.
Although the overall survey participation rate was high, not all survey questions were answered. This may lead to a nonresponse bias, which may result in the overgeneralization of some findings. To enable readers to assess representativeness of each data point, the number of sites that responded to each question are included alongside the reported data.
Provincial and territorial validators provided high-level information for nonresponding publicly funded health facilities. Validators are senior decision-makers involved in medical imaging in all jurisdictions. Data obtained from the previous survey iteration, and from other sources (e.g., personal communications, websites of health care facilities), were used to inform the status of the remaining sites. Data from private sites with private imaging capacity supplemented data for public capacity; detailed information for private imaging facilities is limited due to the low number of survey responses.
The survey questions and full data collection and analysis strategy, including survey development, respondent identification, sources of data used, and data validation procedures can be found in the Canadian Medical Imaging Inventory 2022–2023: Methods report on the CMII webpage. Definitions for the type of facility included in the survey are provided in Appendix 2.
Characteristics of Facilities Responding to the 2022–2023 National Survey
The following is a summary of the type, location, and funding source for facilities in Canada included in the 2022–2023 national survey:
Among 427 sites with known facility type, 274 (64.2%) were hospitals, 50 (11.7%) were community hospitals, 34 (8.0%) were tertiary care centres, and 69 (16.2%) were private facilities (e.g., privately managed) (Figure 1 and Appendix 3, Table 10).
Among the 332 sites that provided setting information, 209 (63.0%) were urban, 112 (33.7%) were rural, and 11 (3.3%) were remote (Figure 2 and Appendix 3, Table 11).
Among the 377 sites that reported sources of funding, 318 (84.4%) sites reported that they were publicly funded, 46 (12.2%) sites were privately funded, and 13 (3.4%) sites reported receiving funds from both public and private sources (Figure 3 and Appendix 3, Table 12).
Figure 1: Types of Imaging Facilities in Canada, 2022–2023
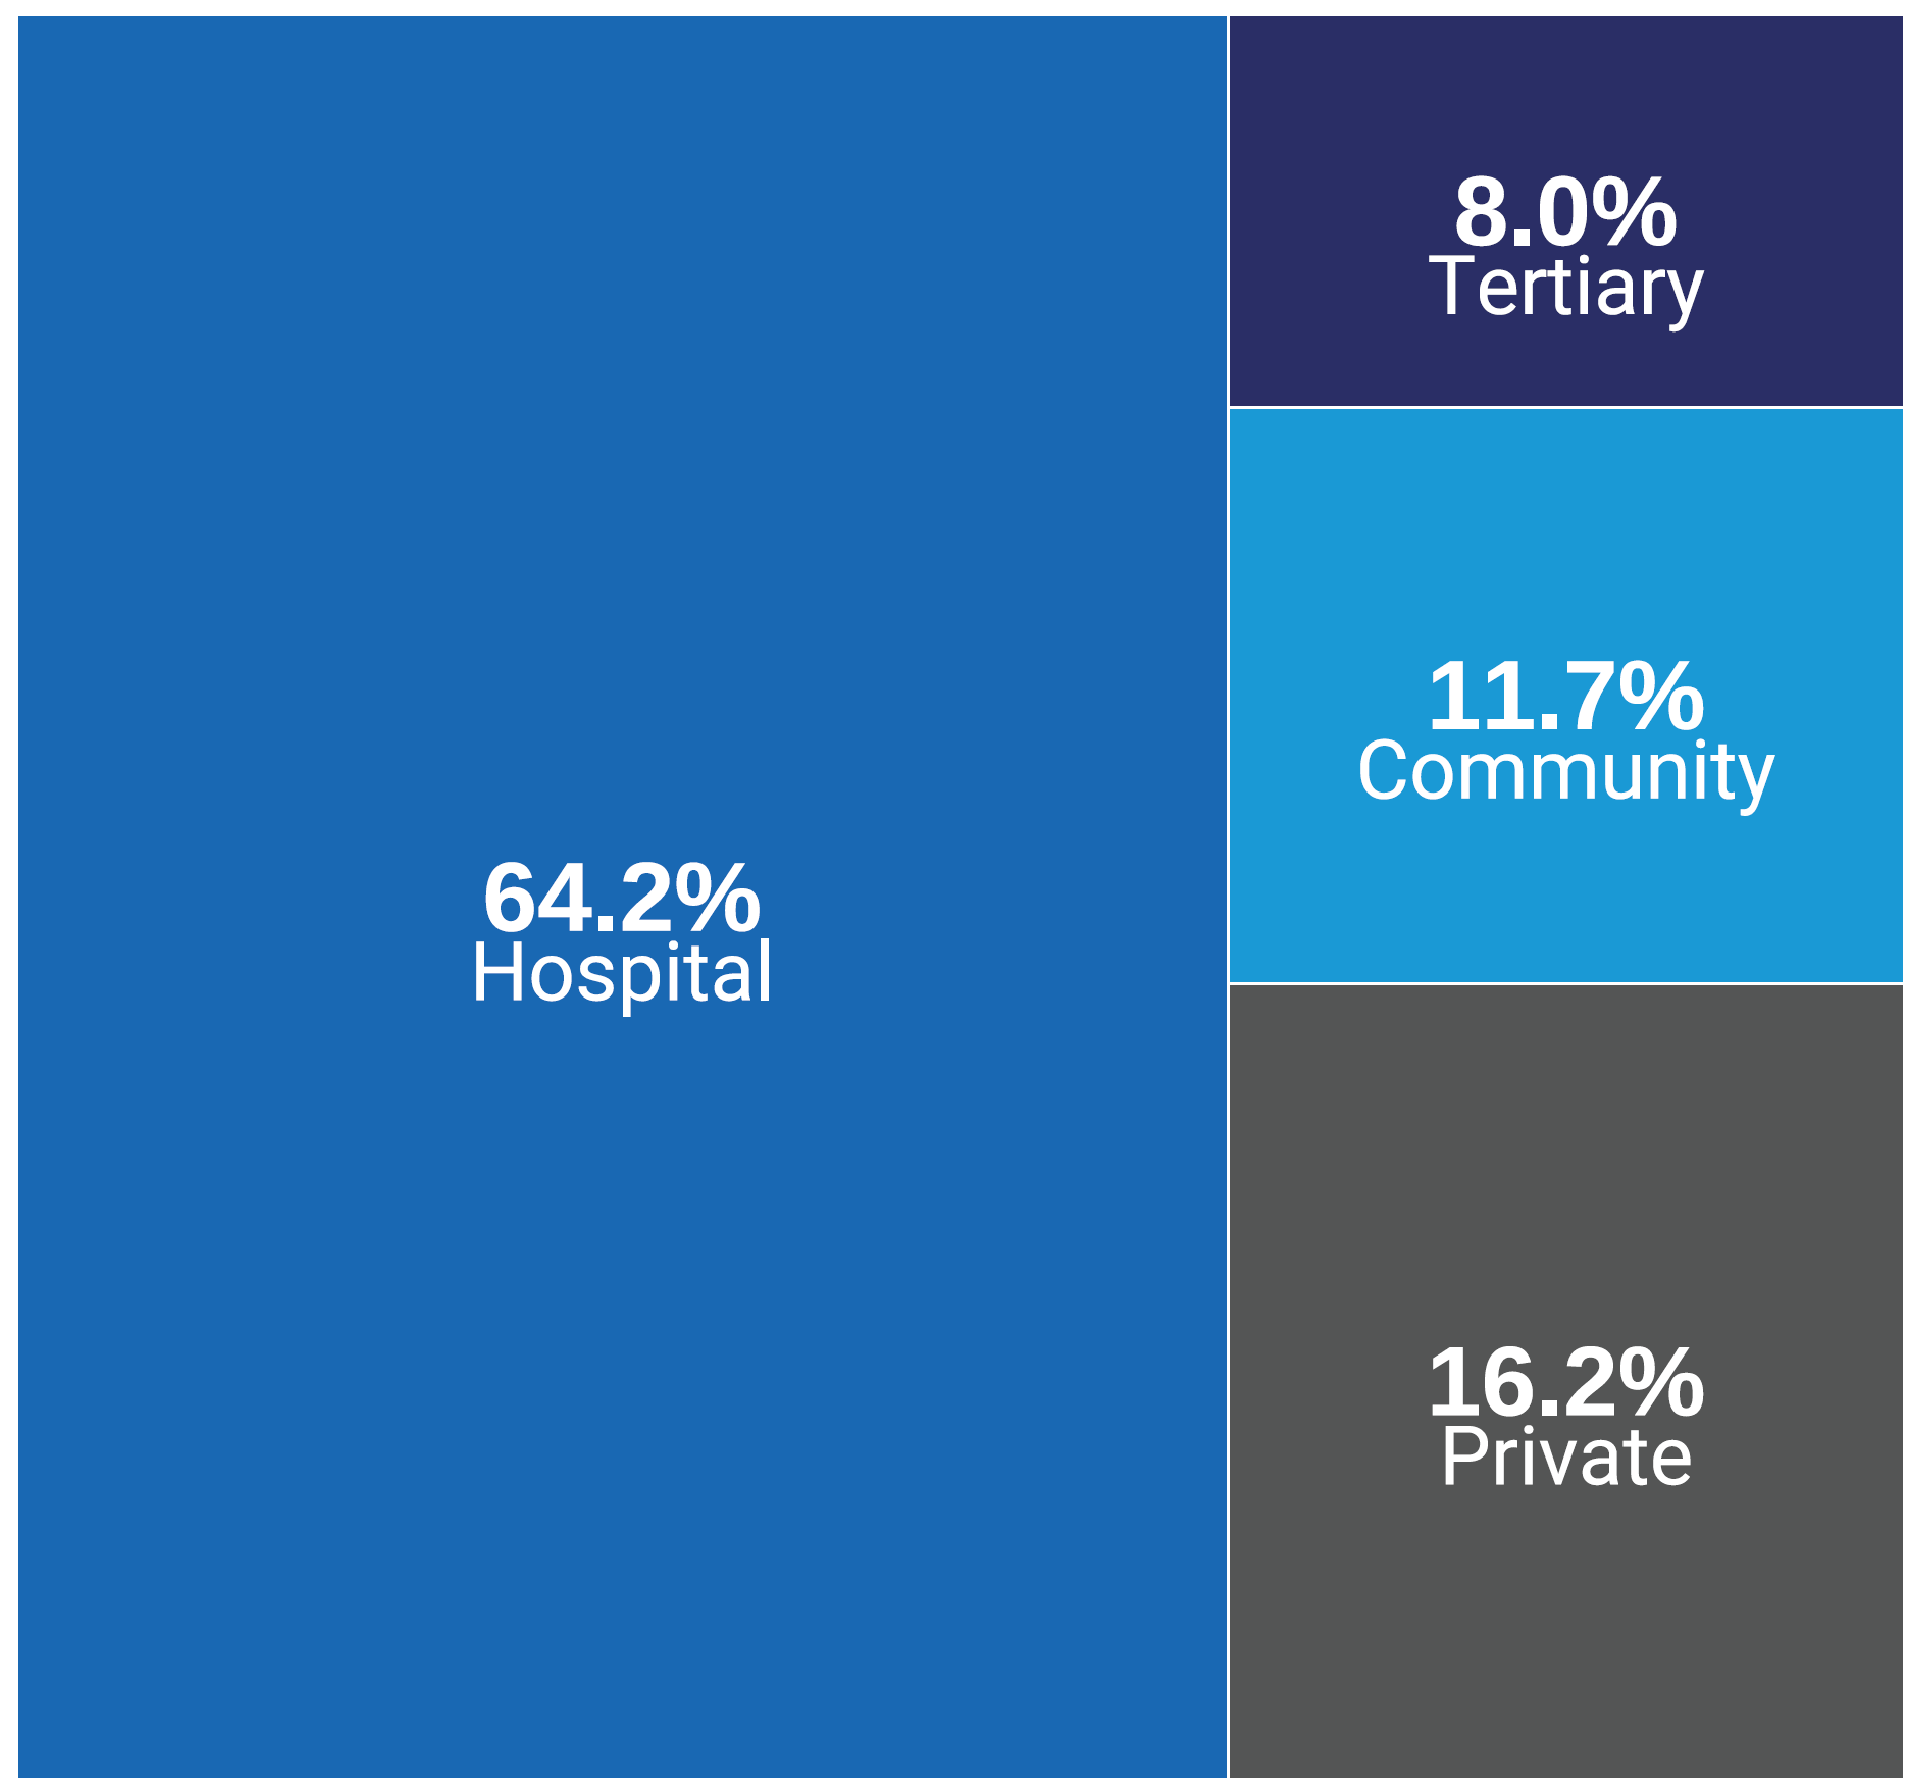
Notes: Data were derived from the survey question: “What type of facility is this?” (427 site responses were received).
Data summaries by province and territory are available in Appendix 3, Table 10.
The number of sites are presented as proportions according to facility type of all reported sites. Survey responses for facility type from private sites were limited due to a low response rate.
Definitions for type of facility are presented in Appendix 2.
Of the facilities that provided data on the type of facility:
Alberta reported the highest percentage of community hospitals (27.1%) of all jurisdictions.
Saskatchewan reported the highest percentage of tertiary care hospitals (37.5%) of all jurisdictions.
Alberta reported the highest percentage of private sites (29.2%) of all jurisdictions.
Of the facilities that provided location information for imaging facilities:
All sites in Prince Edward Island reported operating in urban locations (100%).
Newfoundland and Labrador reported the highest percentage of sites operating in rural locations (64.3%) of all jurisdictions.
All sites in Nunavut, the Northwest Territories, and Yukon reported operating in remote locations (100%).
Of the facilities that provided funding information:
Ontario, Alberta, and New Brunswick reported receiving both public and private funding.
Figure 2: Location of Imaging Facilities in Canada, 2022–2023
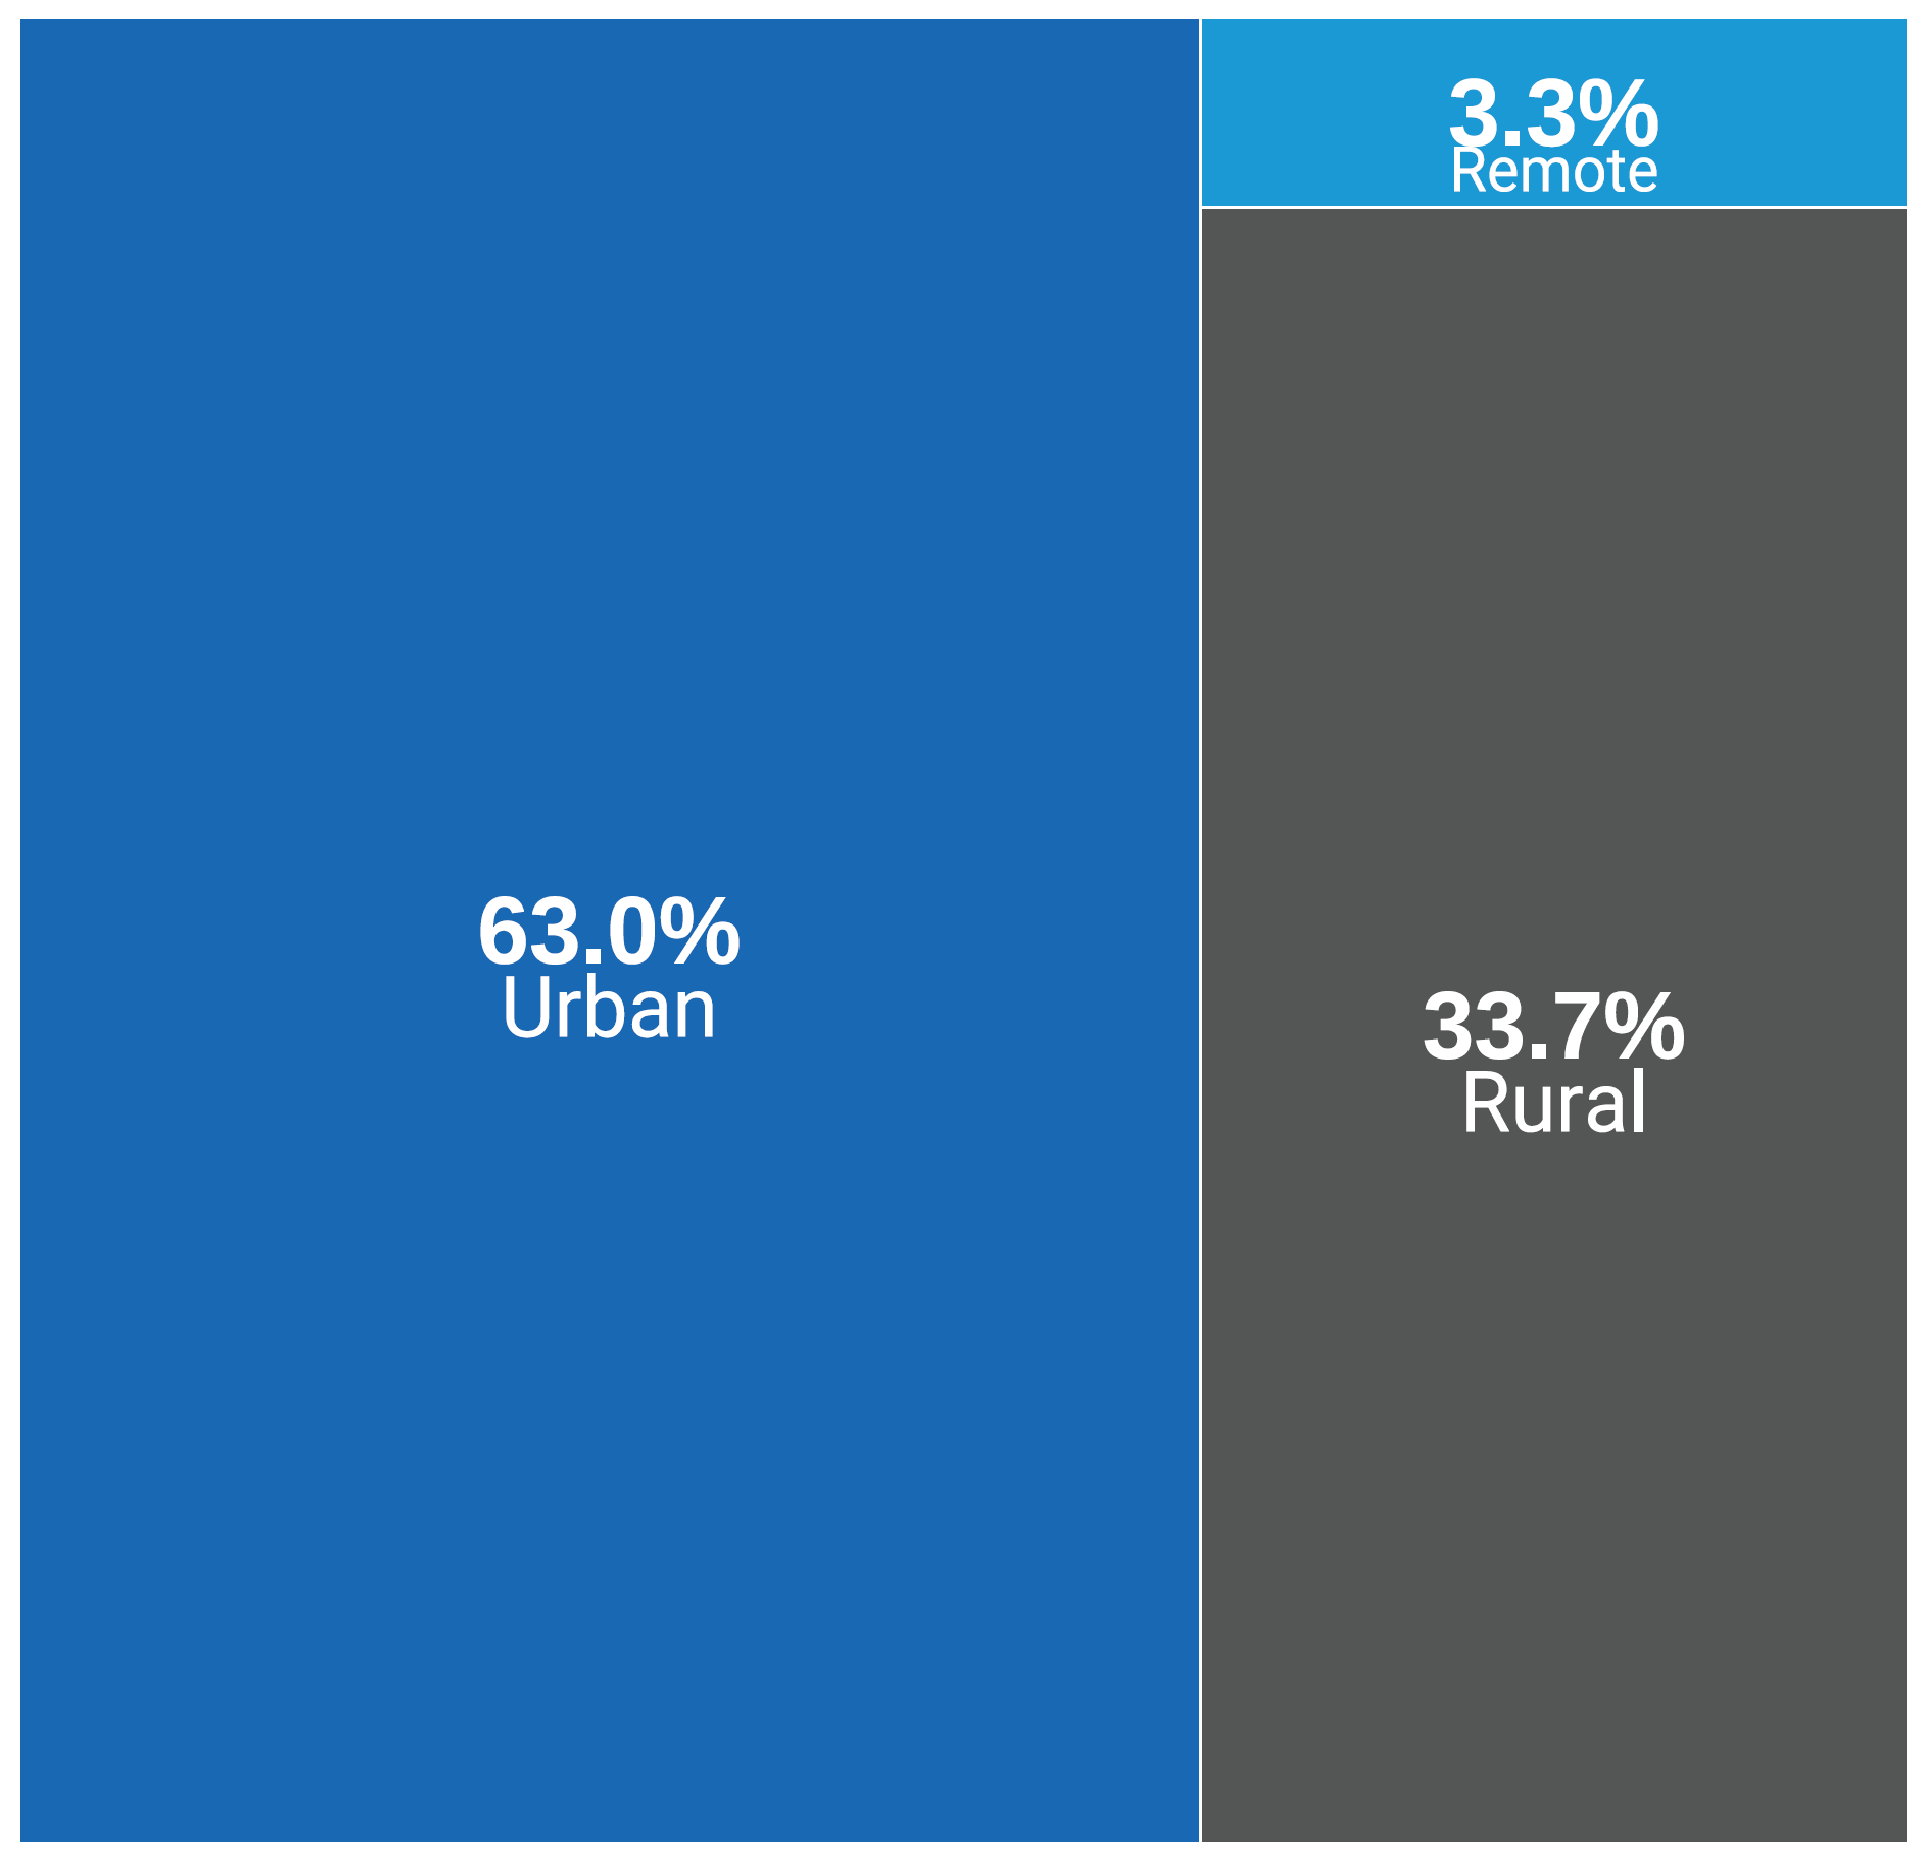
Notes: Data derived from survey question: “In which of the following settings are you located?” (332 site responses were received).
Data summaries by province and territory are available in Appendix 3, Table 11.
The number of sites are presented as proportions according to facility location of all reported sites.
Figure 3: Sources of Funding for Imaging Facilities, 2022–2023
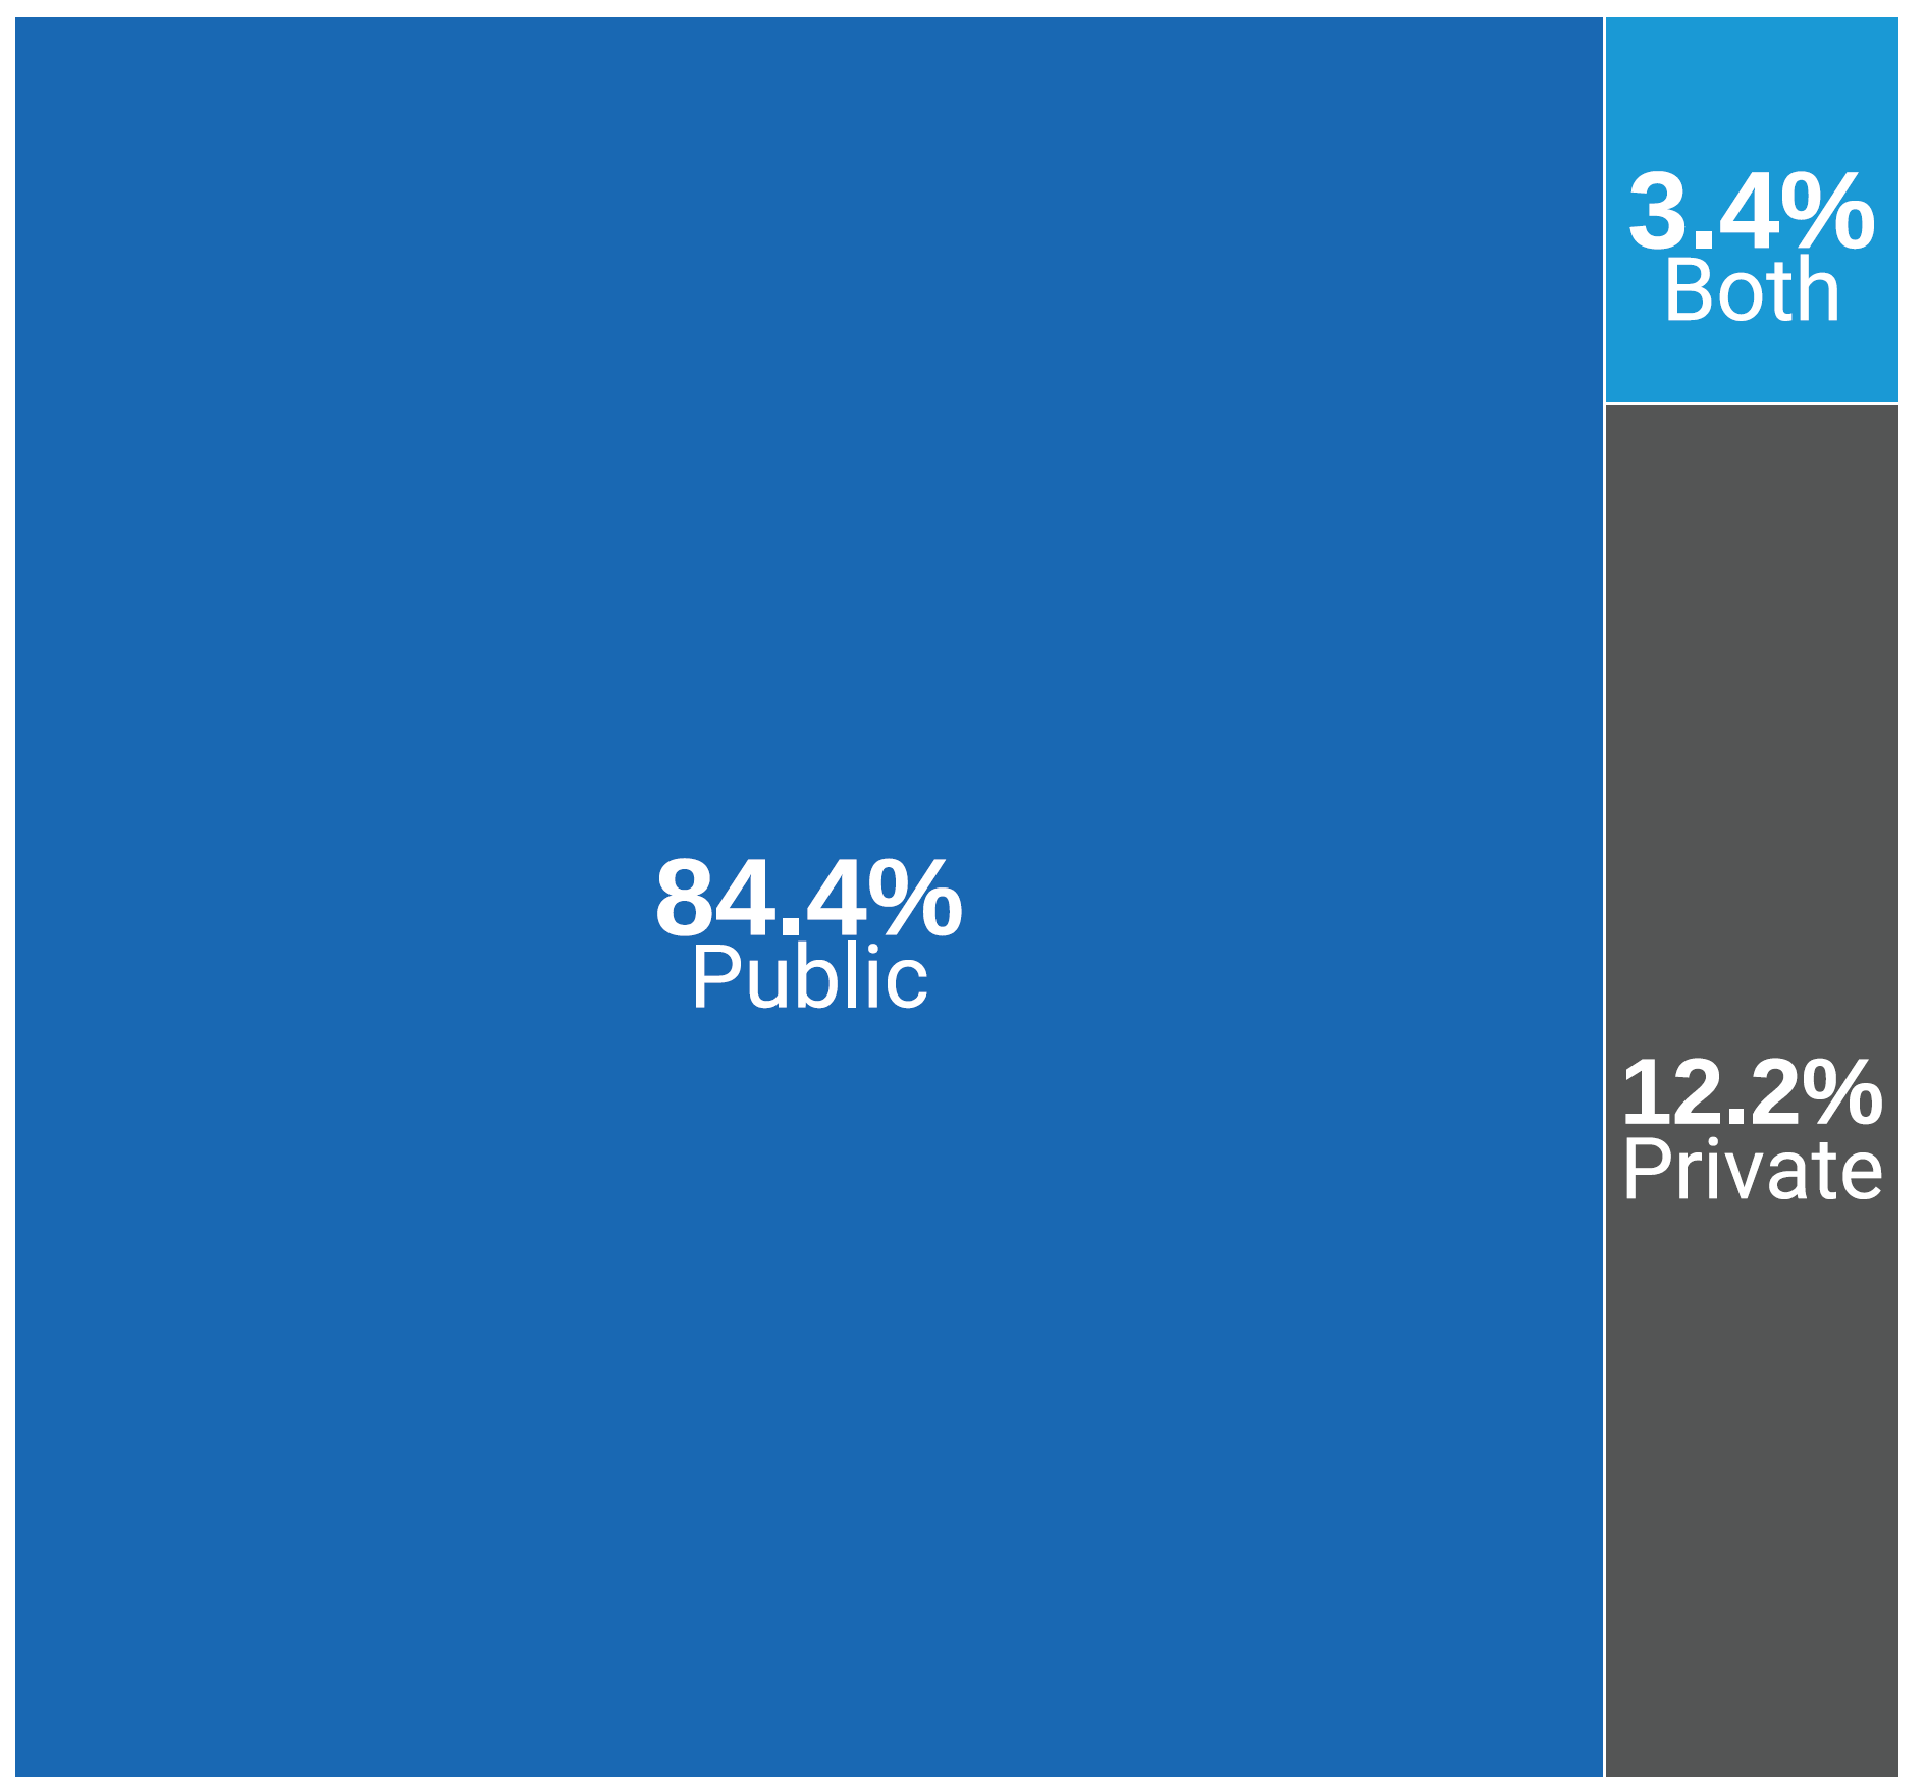
Notes: Funding source data were derived from the survey question: “How is this facility funded?” (377 site responses were received).
Data summaries by province and territory are available in Appendix 3, Table 12.
The number of sites are presented as proportions according to the funding source of all reported sites.
Overall Inventory of Equipment
Total Number of Units in 2022–2023
A total of 560 CT units, 432 MRI units, 60 PET-CT units, 6 PET-MRI units, 210 SPECT units, and 331 SPECT-CT units were reported for 2022–2023 in both public and private facilities (Table 1 and Figure 4). Of the 1,477 imaging units with information on previous use, 56 units (3.8%) were previously used and owned by another health care facility. MRI is the imaging modality with the highest percentage of units that were previously used (44.6%), whereas no PET-MRI units were previously used. A breakdown of the number of sites included in the 2022–2023 inventory is presented in Appendix 3, Table 9.
Table 1: Overall Provincial and Territorial Inventory of CT, MRI, PET-CT, PET-MRI, SPECT, and SPECT-CT Units in Public and Private Facilities, 2022–2023
Province or territory | CT | MRI | PET-CT | PET-MRIa | SPECT | SPECT-CT |
|---|---|---|---|---|---|---|
Number of unitsb (number of private units)c | ||||||
Alberta | 53 (3) | 43d (13) | 5 (0) | 1 (0) | 36 (27) | 39 (11) |
British Columbia | 75e (5) | 55d (12) | 5 (1) | 1 (0) | 16 (0) | 50 (0) |
Manitoba | 24f (0) | 14d (0) | 1 (0) | 0 | 4 (0) | 10 (0) |
New Brunswick | 15 (0) | 11d (1) | 2 (0) | 0 | 6 (0) | 8 (0) |
Newfoundland and Labrador | 16 (0) | 5 (0) | 1 (0) | 0 | 1 (0) | 8 (0) |
Northwest Territories | 1 (0) | 0 (0) | 0 | 0 | 0 | 0 |
Nova Scotia | 18 (0) | 11 (1) | 1 (0) | 0 | 7 (0) | 9 (0) |
Nunavut | 1 (0) | 0 (0) | 0 | 0 | 0 | 0 |
Ontario | 192 (9) | 157d (15) | 20g (2)h,i | 4 (0) | 102 (9) | 92 (0) |
Prince Edward Island | 2 (0) | 1 (0) | 0 (0) | 0 | 0 | 2 (0) |
Quebec | 144e (13) | 123d (32) | 24 (3) | 0 | 32 (0) | 107 (0) |
Saskatchewan | 18 (2) | 11 (4) | 1 (0) | 0 | 6 (0) | 6 (0) |
Yukon | 1 (0) | 1 (0) | 0 | 0 | 0 | 0 |
Canada | 560 (32) | 432 (78) | 60 (6) | 6 (0) | 210 (36) | 331 (11) |
aPET-MRI is used primarily for research purposes.
bThe unit counts per jurisdiction were according to the validator if the validator provided lists of units; if these were unavailable, the data were from the survey.
cPrivate units = a unit located in a health care facility that operates privately but that is either privately or publicly funded. Validator-supplied combined unit counts for SPECT and SPECT-CT.
dIncludes 1 or more MRI mobile units, operating either as mobile or fixed.
eIncludes 1 or more CT mobile units.
fIncludes 3 CT units in Manitoba that are used for radiation planning purposes.
gIncludes 1 PET unit that was not hybrid (i.e., without CT or MRI capabilities).
hIncludes 1 public and 1 private PET-CT unit, both operating as fixed.
IIncudes 2 PET-CT units used for research purposes only.
Figure 4: Overall Provincial and Territorial Inventory of CT, MRI, PET or PET-CT, PET-MRI, SPECT, and SPECT-CT Units, 2022–2023
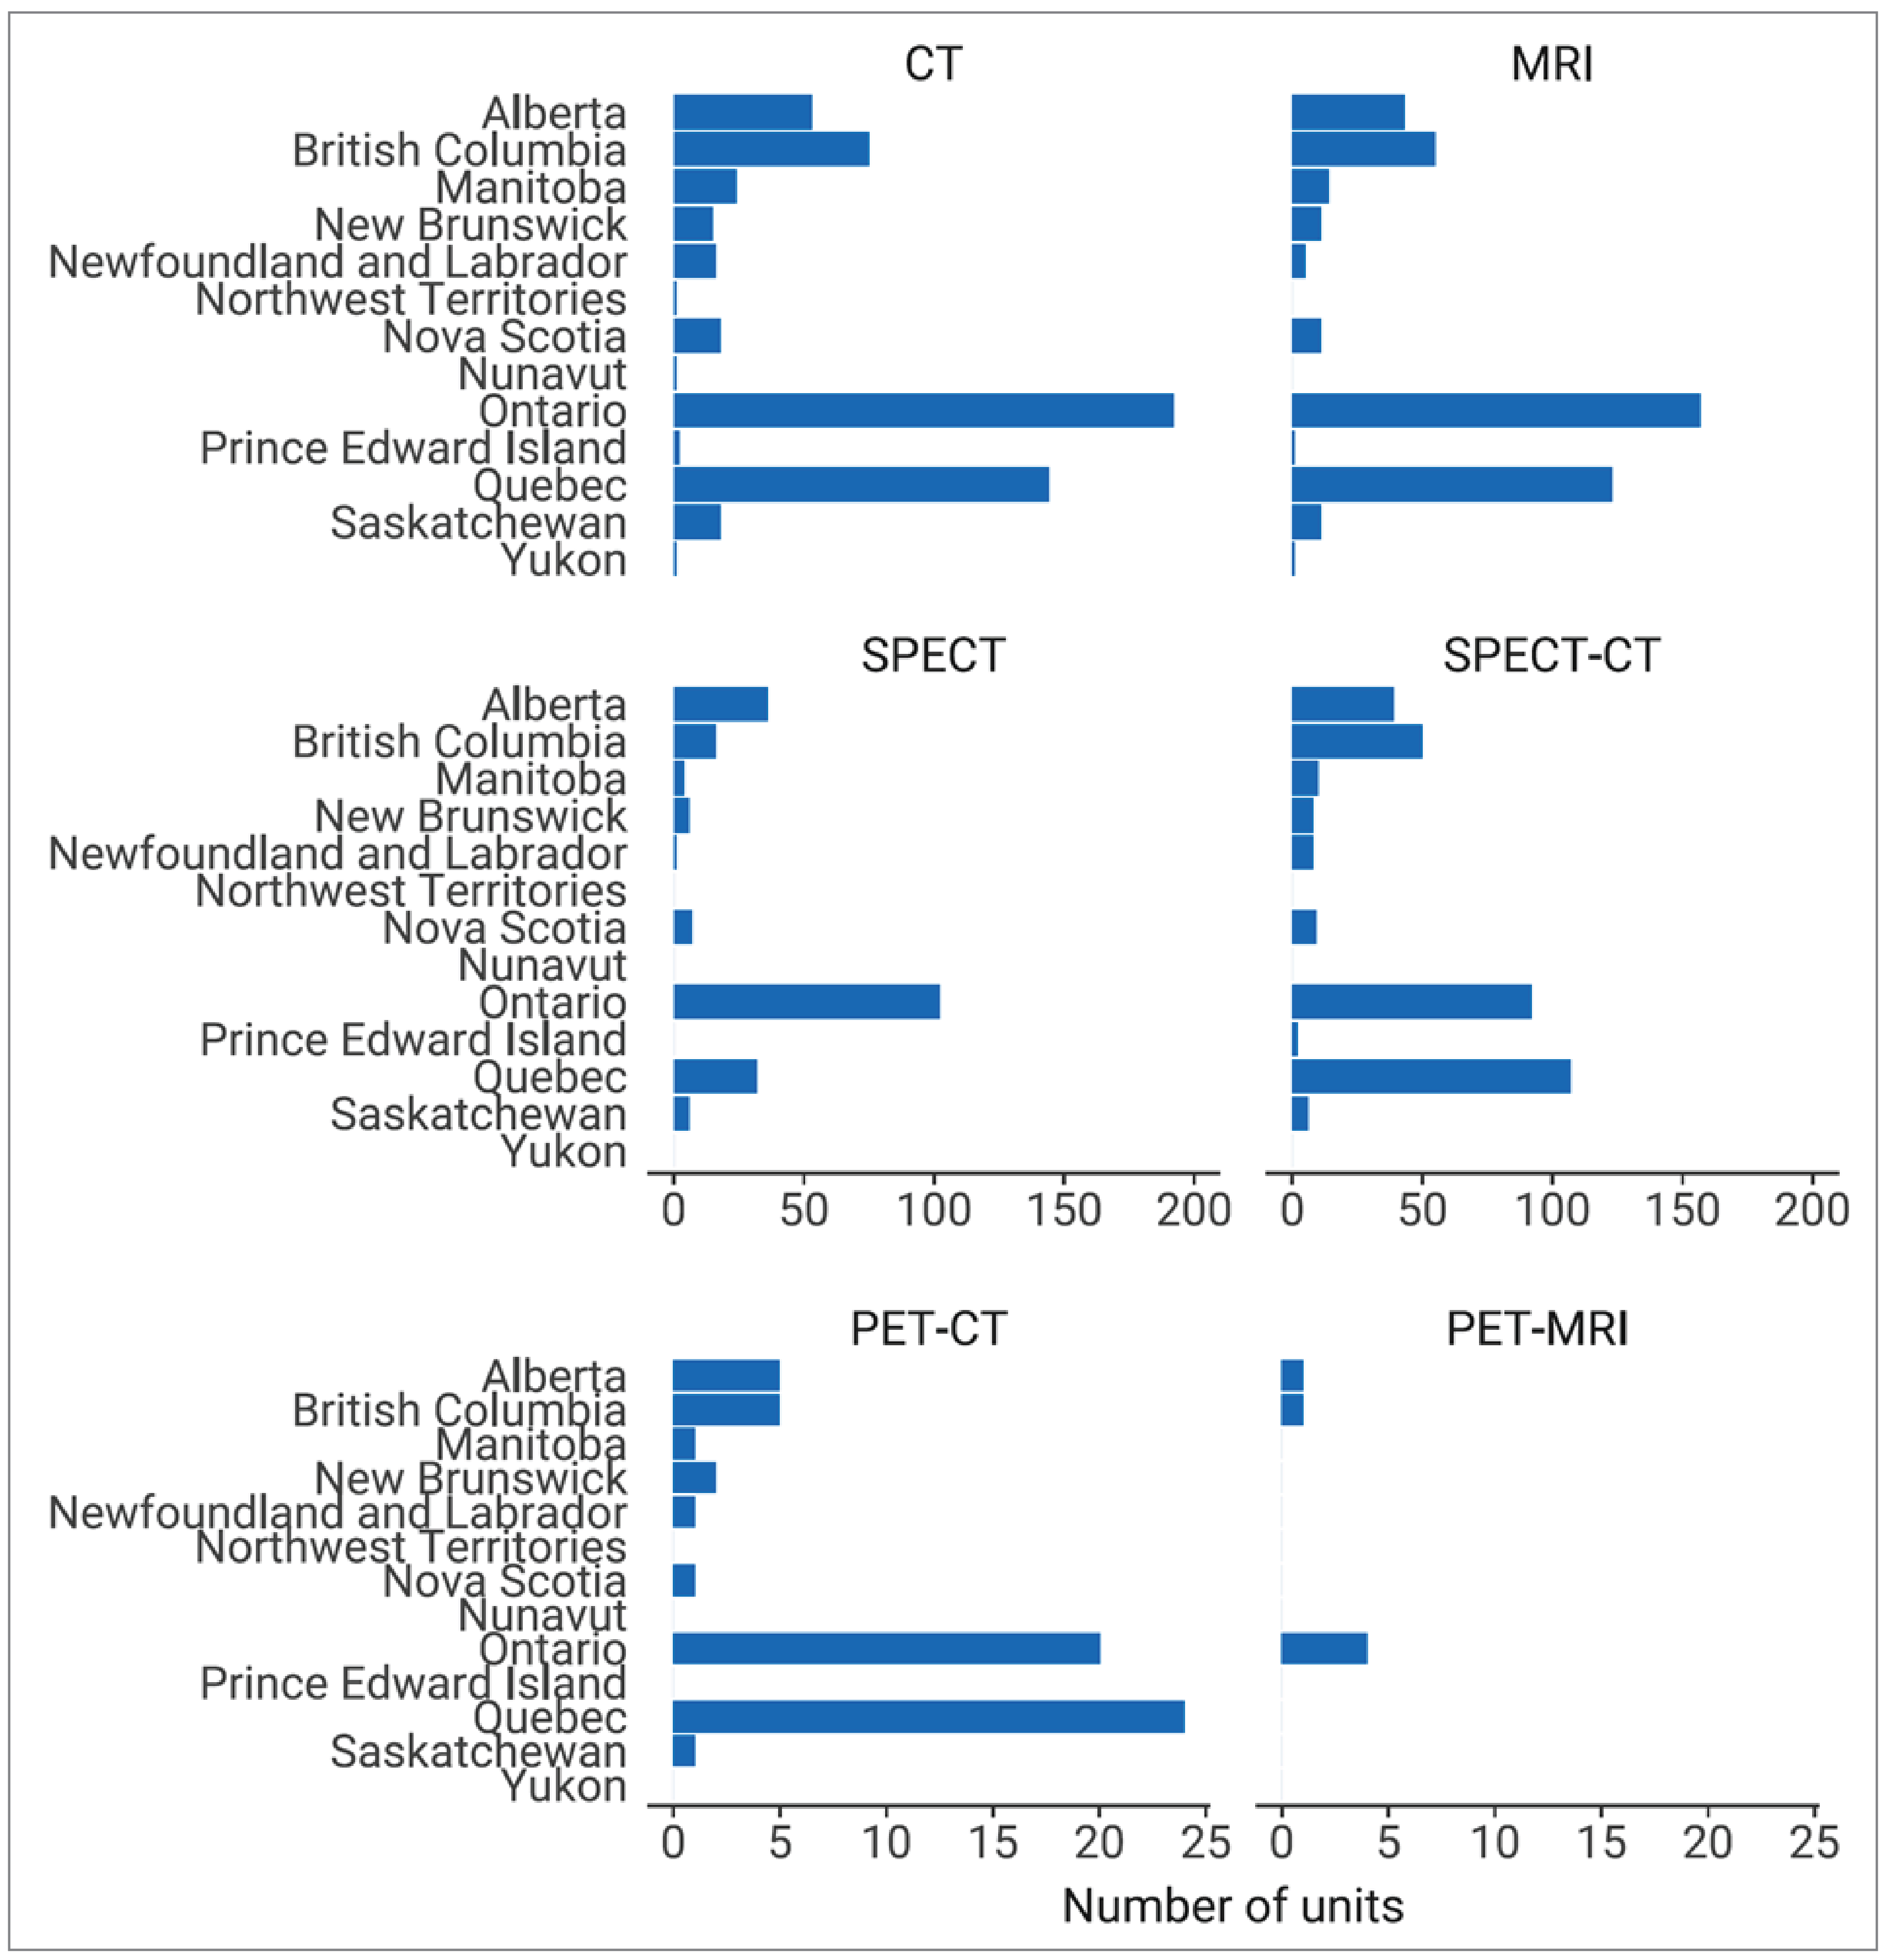
Notes: PET-MRI is used only for research purposes.
Data are available in Table 1.
The x-axis scales for the number of units differ across graphs due to considerable variability in the total number of units for each modality.
Table 2: CT, MRI, PET-CT, PET-MRI, SPECT, and SPECT-CT Units per Million Provincial and Territorial Population, 2022–2023
Province or territory | Population | CT | MRI | PET-CT | PET-MRIa | SPECT | SPECT-CT |
|---|---|---|---|---|---|---|---|
Number of unitsb per million populationc | |||||||
Alberta | 4,703,772 | 11.3 | 9.1 | 1.1 | 0.2 | 7.7 | 8.3 |
British Columbia | 5,437,722 | 13.8 | 10.1 | 0.9 | 0.2 | 2.9 | 9.2 |
Manitoba | 1,444,190 | 16.6 | 9.7 | 0.7 | 0 | 2.8 | 6.9 |
New Brunswick | 831,618 | 18.0 | 13.2 | 2.4 | 0 | 7.2 | 9.6 |
Newfoundland and Labrador | 533,710 | 30.0 | 9.4 | 1.9 | 0 | 1.9 | 15.0 |
Northwest Territories | 45,668 | 21.9 | 0 | 0 | 0 | 0 | 0 |
Nova Scotia | 1,047,232 | 17.2 | 10.5 | 1.0 | 0 | 6.7 | 8.6 |
Nunavut | 40,715 | 24.6 | 0 | 0 | 0 | 0 | 0 |
Ontario | 15,500,632 | 12.4 | 10.1 | 1.3 | 0.3 | 6.6 | 5.9 |
Prince Edward Island | 176,113 | 11.4 | 5.7 | 0 | 0 | 0 | 11.4 |
Quebec | 8,831,257 | 16.3 | 13.9 | 2.7 | 0 | 3.6 | 12.1 |
Saskatchewan | 1,221,439 | 14.7 | 9.0 | 0.8 | 0 | 4.9 | 4.9 |
Yukon | 44,412 | 22.5 | 22.5 | 0 | 0 | 0 | 0 |
Canada | 39,858,480 | 14.0 | 10.8 | 1.5 | 0.2 | 5.3 | 8.3 |
aPET-MRI is used primarily for research purposes.
bUnit counts per province combine data from public and private facilities according to validator and private responses.
cThe population (estimated) as of first quarter 2023.19
Number of Units per Total Population in Canada, 2022–2023
There are 14.0 CT units, 10.8 MRI units, 1.5 PET-CT units, 0.2 PET-MRI units, 5.3 SPECT units, and 8.3 SPECT-CT units per million population in Canada (Table 2). The 6 PET-MRI units located in Alberta, British Columbia, and Ontario are used almost exclusively for research purposes. Of all modalities, CT and MRI both have the highest density of and variability in distribution of units among jurisdictions with available equipment (Figure 5):
The density of CT units per million population exceeds that of any other modality for all provinces and territories, with values ranging from 11.3 to 30 units per million population.
The density of MRI units per million population shows the greatest variability, ranging from 5.7 to 22.5 units per million population.
Figure 5: CT, MRI, PET or PET-CT, PET-MRI, SPECT, and SPECT-CT Units per Million Provincial and Territorial Population, 2022–2023
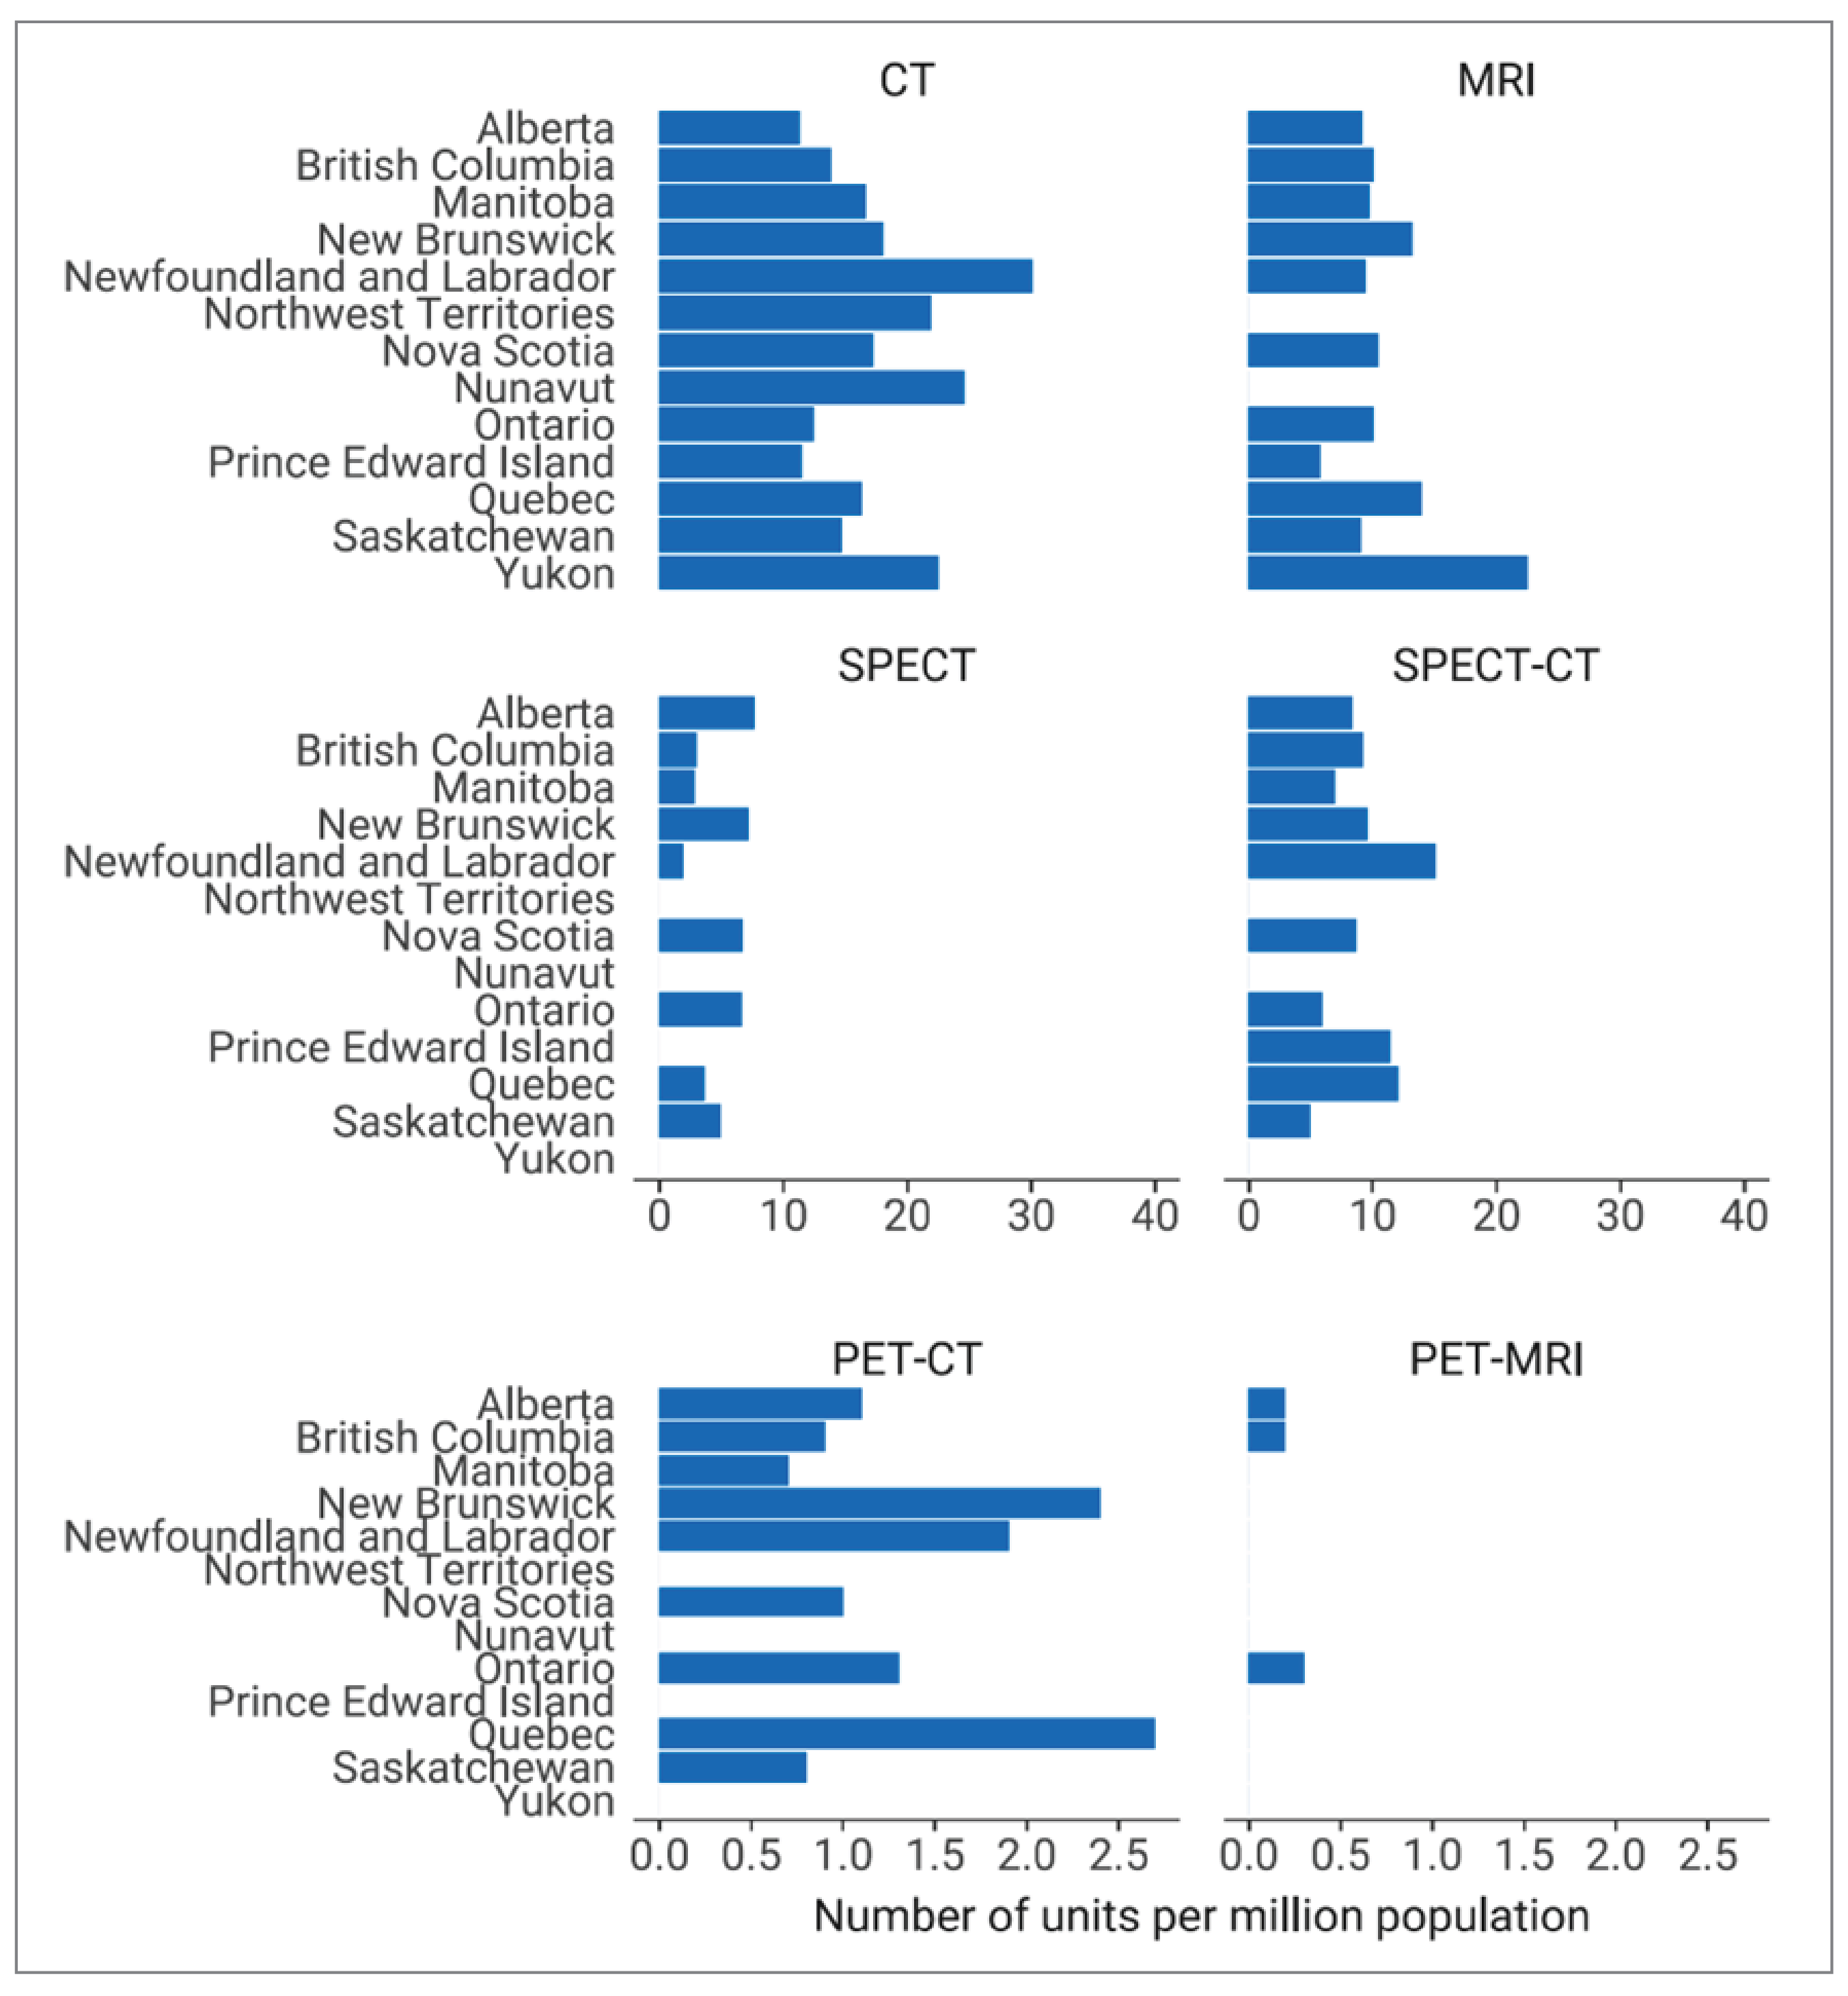
Notes: PET-MRI is used almost exclusively for research purposes.
Data are available in Table 2.
The x-axis scales for the number of units per million population differ across graphs due to considerable variability in the total number of units per million population for each modality.
Total Volume of Public Examinations in Canada, 2022–2023
The total number of overall public examinations and the total per capita (per 1,000 population) reported for all modalities across Canada for the most recent fiscal (or calendar) year are presented in Table 3 and Table 4.
For CT, 6,385,665 exams were performed, representing a national average of 160.2 exams per 1,000 population, ranging from 106.5 exams per 1,000 population to 213.4 exams per 1,000 population across all jurisdictions with capacity. Approximately 25% of CT exams were indicated for oncology.
For MRI, 2,214,157 exams were performed, representing a national average of 55.6 exams per 1,000 population, ranging from 33.0 exams per 1,000 population to 72 exams per 1,000 population across all jurisdictions with capacity. Approximately 30% of MRI exams were indicated for neurology.
For PET-CT, 156,320 exams were performed, representing a national average of 3.9 exams per 1,000 population, ranging from 1.7 exams per 1,000 population to 9 exams per 1,000 population across all jurisdictions with capacity. More than 65% of PET-CT exams were indicated for oncology.
For SPECT and SPECT-CT, 929,010 exams were performed, representing a national average of 23.3 exams per 1,000 population, ranging from 11.3 exams per 1,000 population to 56.3 exams per 1,000 population across all jurisdictions with capacity. Approximately 30% of SPECT and 25% SPECT-CT exams were indicated for cardiac disease and oncology, respectively.
For PET-MRI, a total of 1,200 exams were reported by a single site with a PET-MRI unit. However, all PET-MRI exams are conducted almost exclusively for research purposes only. Nearly all PET-MRI exams were indicated for neurology (97%).
Table 3: Total Examinations for the Most Recent Year for All Modalities Across Canada for Public Facilities, 2022–2023
Province or territory | CT | MRI | PET-CT | PET-MRIa | SPECT and SPECT-CTb |
|---|---|---|---|---|---|
Numbers of exams | |||||
Alberta | 520,507 | 231,033 | 15,695 | 0 | 59,099 |
British Columbia | 923,990 | 299,061 | 15,898 | 0 | 66,604c |
Manitoba | 260,661 | 91,497 | 2,443 | 0 | 22,378 |
New Brunswick | 177,477 | 49,376 | 2,392 | 0 | 28,408 |
Newfoundland and Labrador | 105,441 | 21,409 | 2,262 | 0 | 22,910 |
Northwest Territories | 8,115 | 0 | 0 | 0 | 0 |
Nova Scotia | 166,268 | 34,935 | 3,465 | 0 | 12,511 |
Nunavut | 4,336 | 0 | 0 | 0 | 0 |
Ontario | 2,383,569 | 963,563 | 31,626d | 1,200c | 192,189e |
Prince Edward Island | 25,368 | 5,803 | 0 | 0 | 1,985 |
Quebecf | 1,658,575 | 450,947 | 79,299 | 0 | 496,843 |
Saskatchewan | 144,903 | 63,335 | 3,240 | 0 | 26,083 |
Yukon | 6,455 | 3,198 | 0 | 0 | 0 |
Canada | 6,385,665 | 2,214,157 | 156,320 | 1,200 | 929,010 |
Note: Data were provided by validators for public facilities only. Few private facilities provided exam data to the survey. An aggregated total is reported for SPECT and SPECT-CT. Appendix 5 details reporting practices over the years.
aPET-MRI exams are conducted almost exclusively for research purposes.
bValidator-supplied combined exam counts for SPECT and SPECT-CT.
cData from 2019–2020.
dFunding through PET centres.
eData from 2017.
fData from 2021–2022.
Of all modalities, CT and MRI had the highest volume of public exams per 1,000 population across all jurisdictions with available imaging equipment (Table 4, Figure 6):
For all provinces and territories, the volume of CT exams per 1,000 population exceeded that of any other modality and had the greatest range of exam volume per capita across jurisdictions, with values ranging from 106.5 per 1,000 population to 213.4 exams per 1,000 population.
For MRI, the number of exams per 1,000 population varied significantly by jurisdiction, with exam volume per capita ranging from 33.4 per 1,000 population to 72 exams per 1,000 population.
Table 4: Exams per 1,000 Population for the Most Recent Fiscal (or Calendar) Year With Available Data for All Modalities in Public Facilities in Canada, 2022–2023
Province or territory | Populationa | CT | MRI | PET-CT | PET-MRIb | SPECT and SPECT-CTc |
|---|---|---|---|---|---|---|
Exams per 1,000 population | ||||||
Alberta | 4,703,772 | 110.7 | 49.1 | 3.3 | 0.0 | 12.6 |
British Columbia | 5,437,722 | 169.9 | 55.0 | 2.9 | 0.0 | 12.2d |
Manitoba | 1,444,190 | 180.5 | 63.4 | 1.7 | 0.0 | 15.5 |
New Brunswick | 831,618 | 213.4 | 59.4 | 2.9 | 0.0 | 34.2 |
Newfoundland and Labrador | 533,710 | 197.6 | 40.1 | 4.2 | 0.0 | 42.9 |
Northwest Territories | 45,668 | 177.7 | 0 | 0 | 0.0 | 0 |
Nova Scotia | 1,047,232 | 158.8 | 33.4 | 3.3 | 0.0 | 11.9 |
Nunavut | 40,715 | 106.5 | 0 | 0 | 0.0 | 0 |
Ontario | 15,500,632 | 153.8 | 62.2 | 2.0e | 0.1d | 12.4f |
Prince Edward Island | 176,113 | 144.0 | 33 | 0 | 0.0 | 11.3 |
Quebecg | 8,831,257 | 187.8 | 51.1 | 9.0 | 0.0 | 56.3 |
Saskatchewan | 1,221,439 | 118.6 | 51.9 | 2.7 | 0.0 | 21.4 |
Yukon | 44,412 | 145.3 | 72.0 | 0 | 0.0 | 0 |
Canada | 39,858,480 | 160.2 | 55.6 | 3.9 | 0.0 | 23.3 |
aThe population (estimated) as of first quarter, 2023.19
bPET-MRI exams are conducted almost exclusively for research purposes.
cValidator-supplied combined exam counts for SPECT and SPECT-CT.
dData from 2019–2020.
eFunding through PET centres.
fData from 2017.
gData from 2021–2022.
Figure 6: Exams per 1,000 Population for the Most Recent Fiscal (or Calendar) Year With Available Data for All Modalities in Public Facilities in Canada, 2022–2023
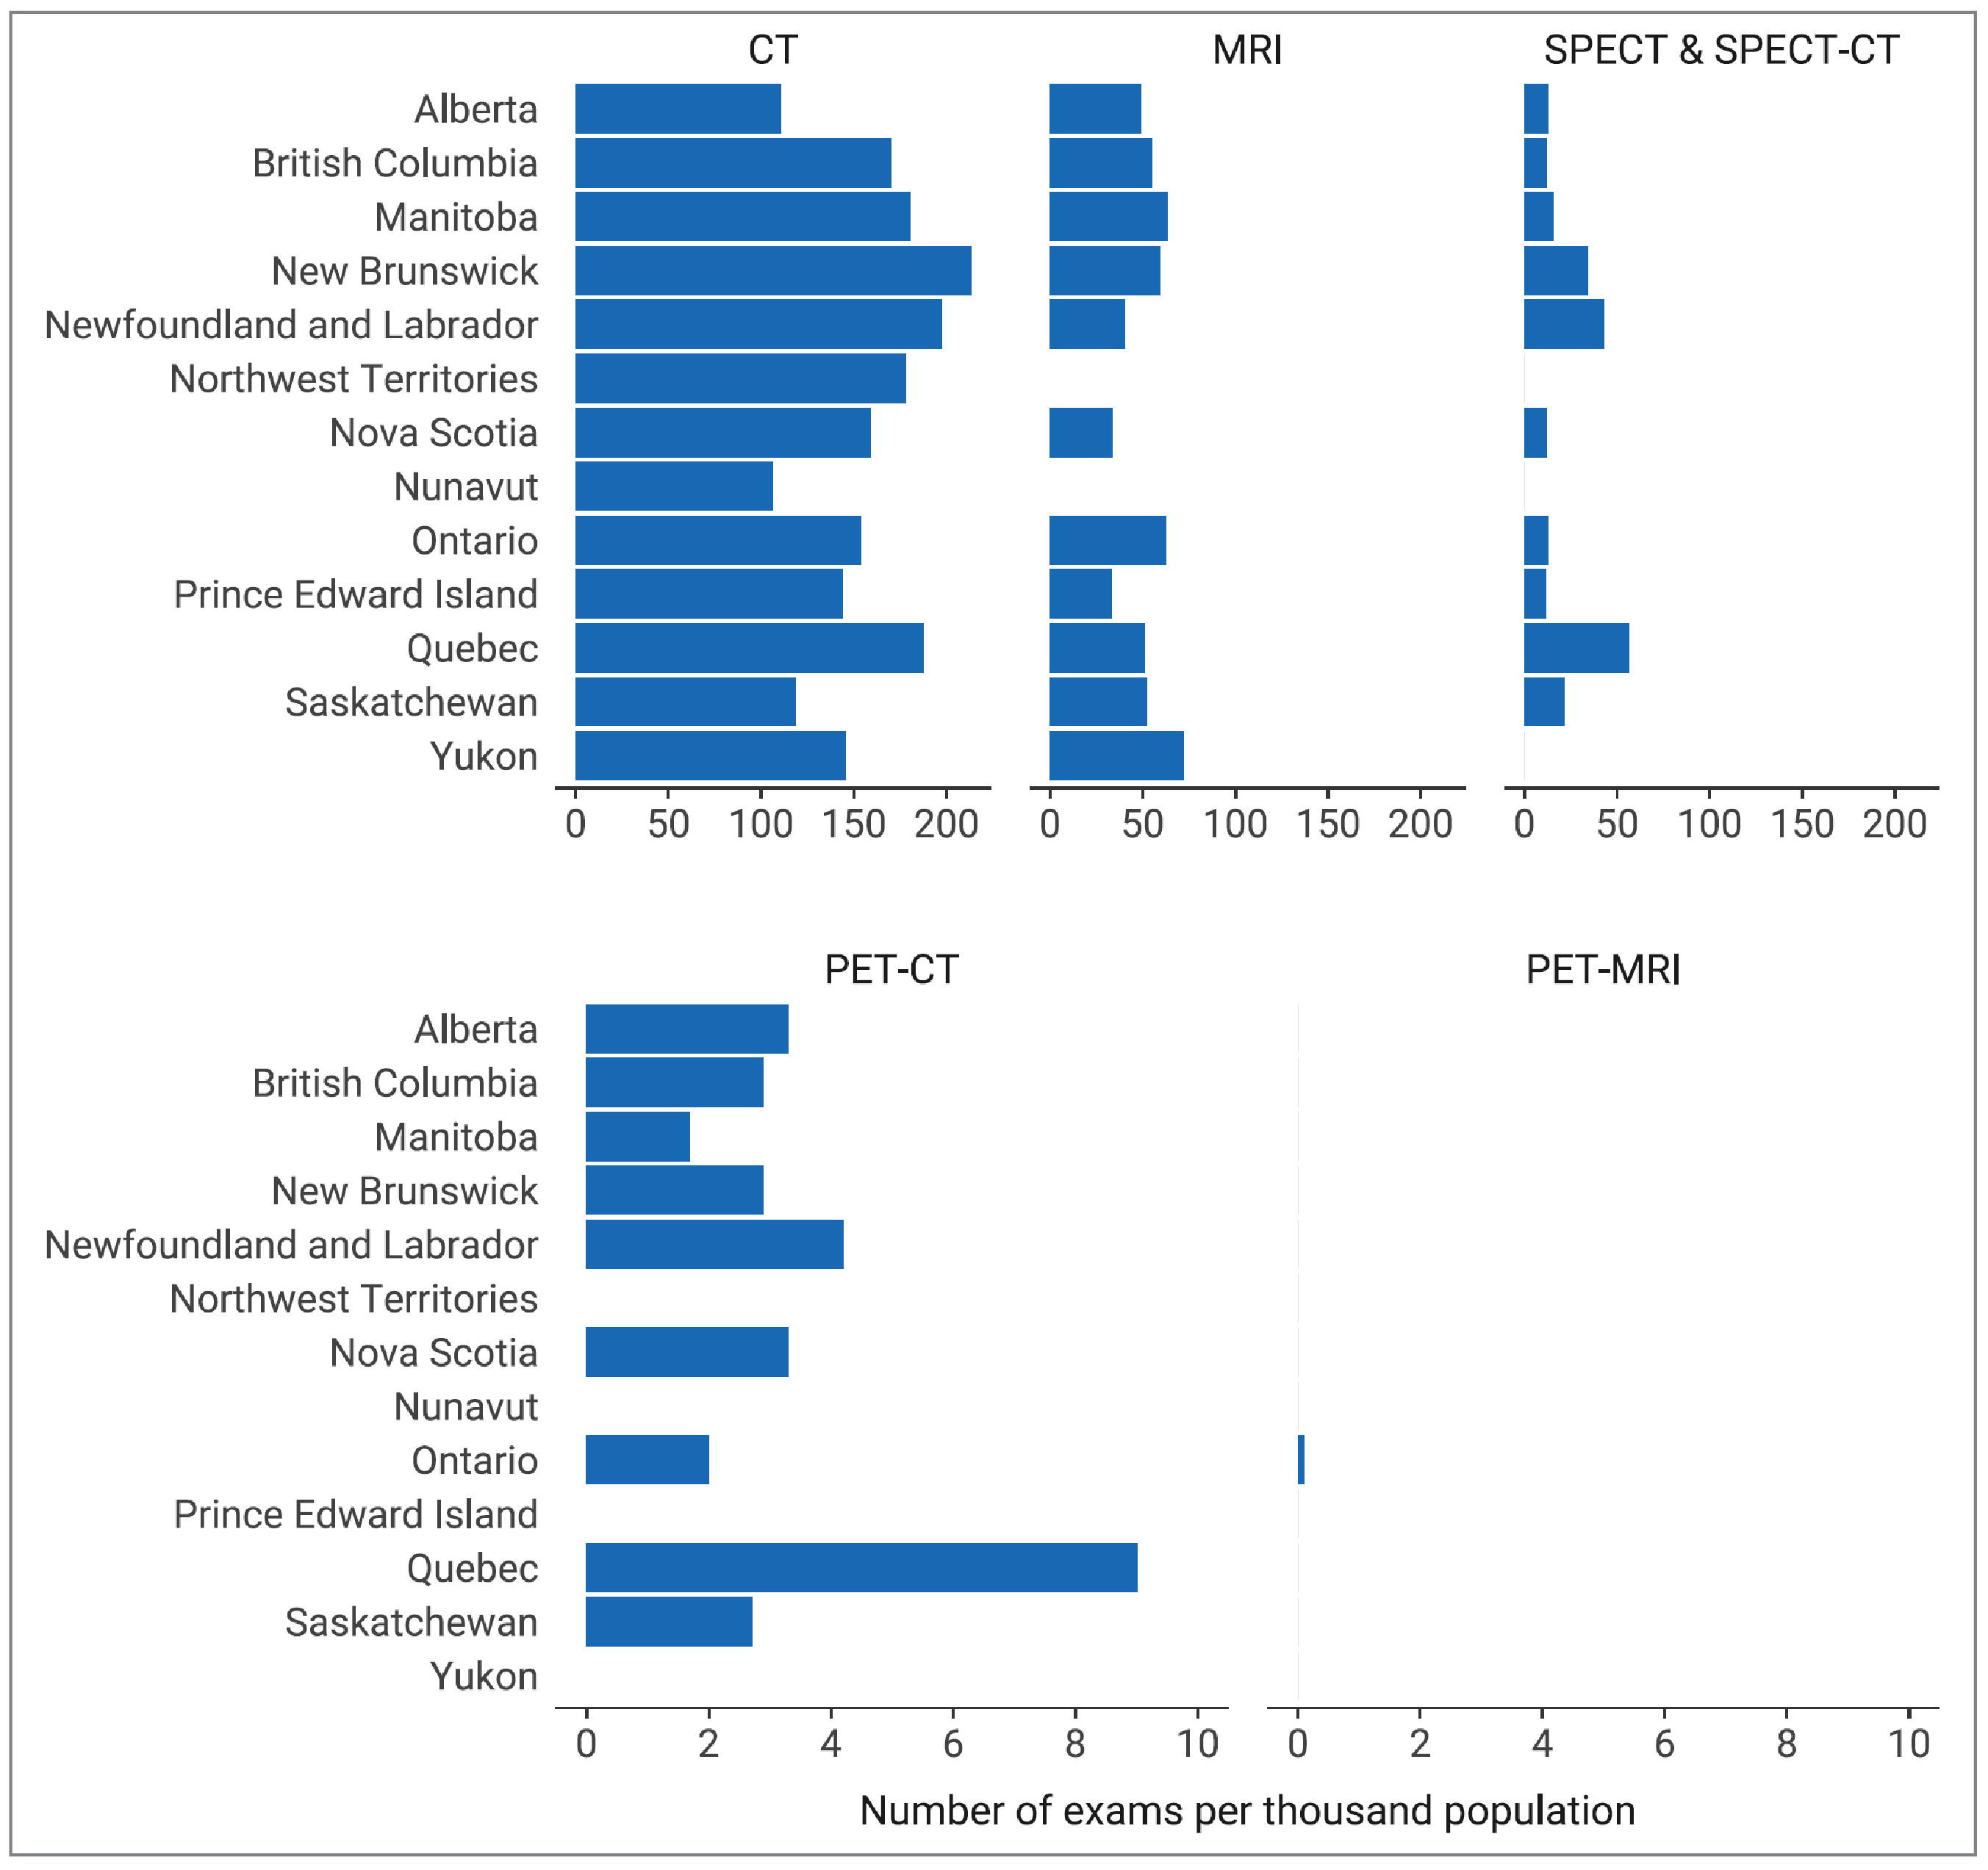
Notes: PET-MRI is used only for research purposes.
Data are available in Table 4.
The x-axis scales for the number of exams per thousand population differ across graphs due to considerable variability in the total number of exams per thousand population for each modality.
Private Imaging Clinics
Current and past CMII survey iterations have indicated that private clinics operate in at least 7 provinces in Canada (Table 5), and no private facilities operate in the territories. Within their respective regulatory frameworks, these clinics are permitted to provide either publicly funded exams, privately funded exams, or a combination of both.
MRI is available privately in at least 7 provinces.
CT is available privately in at least 5 provinces.
PET-CT is available privately in at least 3 provinces.
SPECT and SPECT-CT is available privately in at least 2 provinces.
Private imaging services can be paid for through supplementary health insurance, employer health spending accounts, or out-of-pocket.20 According to our data, the estimated operating revenue sourced from out-of-pocket patient payments or private insurance in private clinics is approximately 50%.
Table 5: Operation of Private Imaging Clinics in Canada by Modality, 2022–2023
Province or territory | CT | MRI | PET-CT | SPECT or SPECT-CT |
|---|---|---|---|---|
Alberta | Yes | Yes | No | Yesa |
British Columbia | Yes | Yes | Yes | No |
Manitoba | No | No | No | No |
New Brunswick | No | Yes | No | No |
Newfoundland and Labrador | No | No | No | No |
Northwest Territories | No | No | No | No |
Nova Scotia | No | Yes | No | No |
Nunavut | No | No | No | No |
Ontario | Yes | Yes | Yes | Yes |
Prince Edward Island | No | No | No | No |
Quebec | Yes | Yes | Yes | No |
Saskatchewan | Yes | Yes | No | No |
Yukon | No | No | No | No |
aSPECT and/or SPECT-CT exams conducted in private community clinics are publicly funded by the Alberta government.
Operation of Imaging Equipment
Hours of Operation per Day by Modality in Canada
In 2022–2023, CT and MRI machines operated the longest number of hours a day, averaging 14 and 15 hours of use, respectively. The other modalities, SPECT-CT, SPECT, PET-CT, and PET-MRI, operate on average less than 10 hours per day (Figure 7).
Approximately 23% of sites with CT units and 14% of sites with MRI units reported daily operation exceeding 18 hours.
No site reported operating other imaging modalities for more than 18 hours per day (Figure 8).
Figure 7: Average Hours per 24-Hour Day of Use for Modalities in Canada, 2022–2023
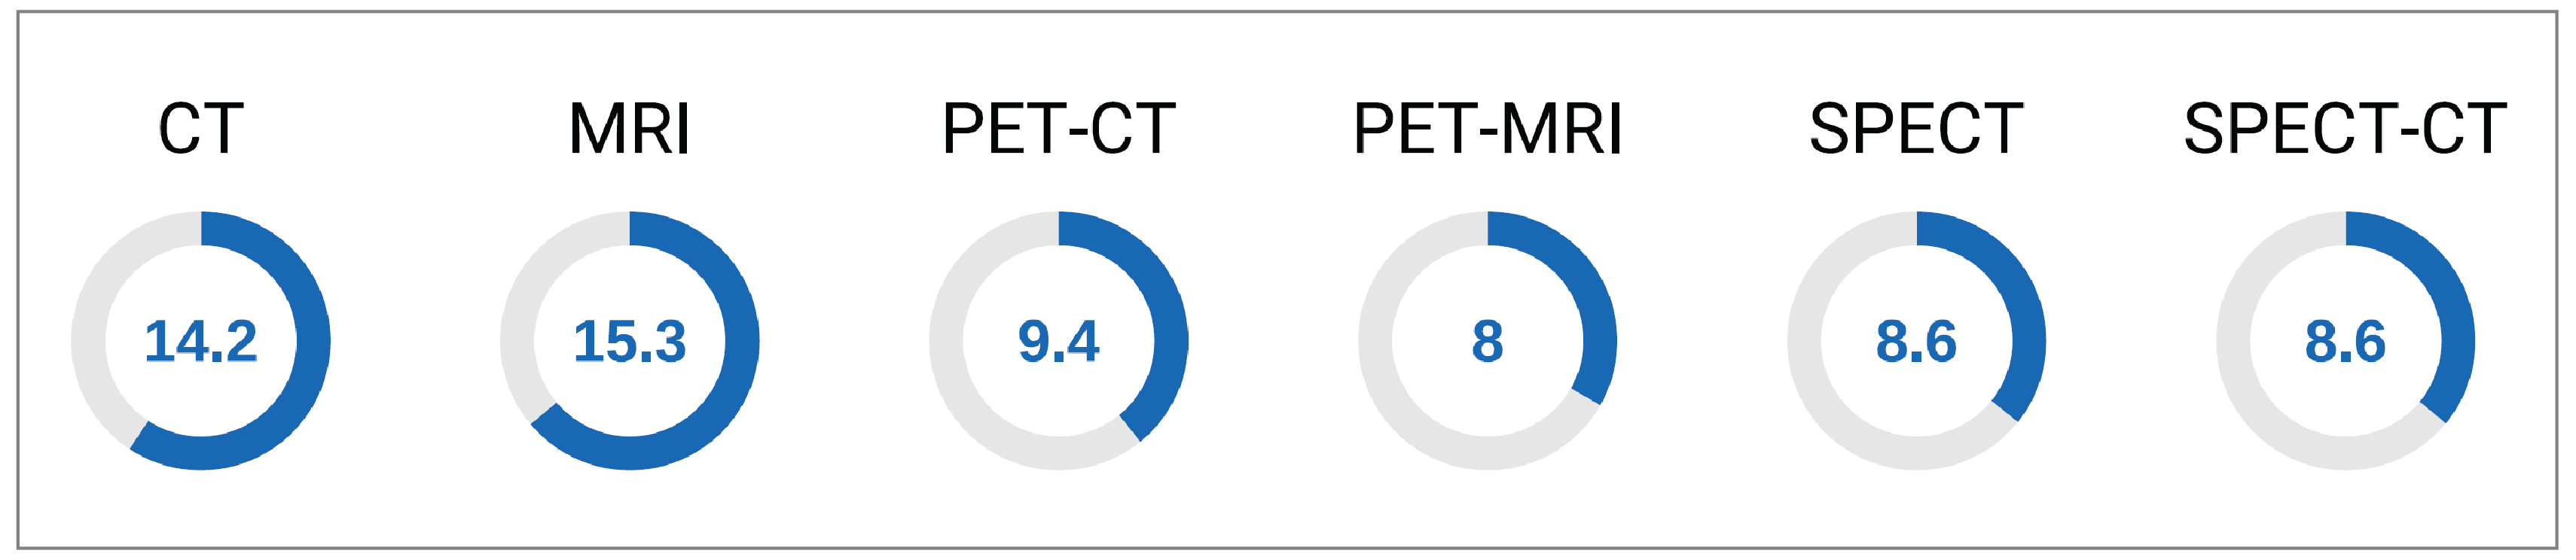
Notes: Data were derived from the survey question: “In an average 24-hour day, how many hours are all units staffed through regular scheduled service capacity? (Do not include hours where staff are only on call).”
One site reported hours of operation data for PET-MRI.
Figure 8: Daily Use of Diagnostic Imaging Equipment in Hours by Percentage of Sites, 2022–2023
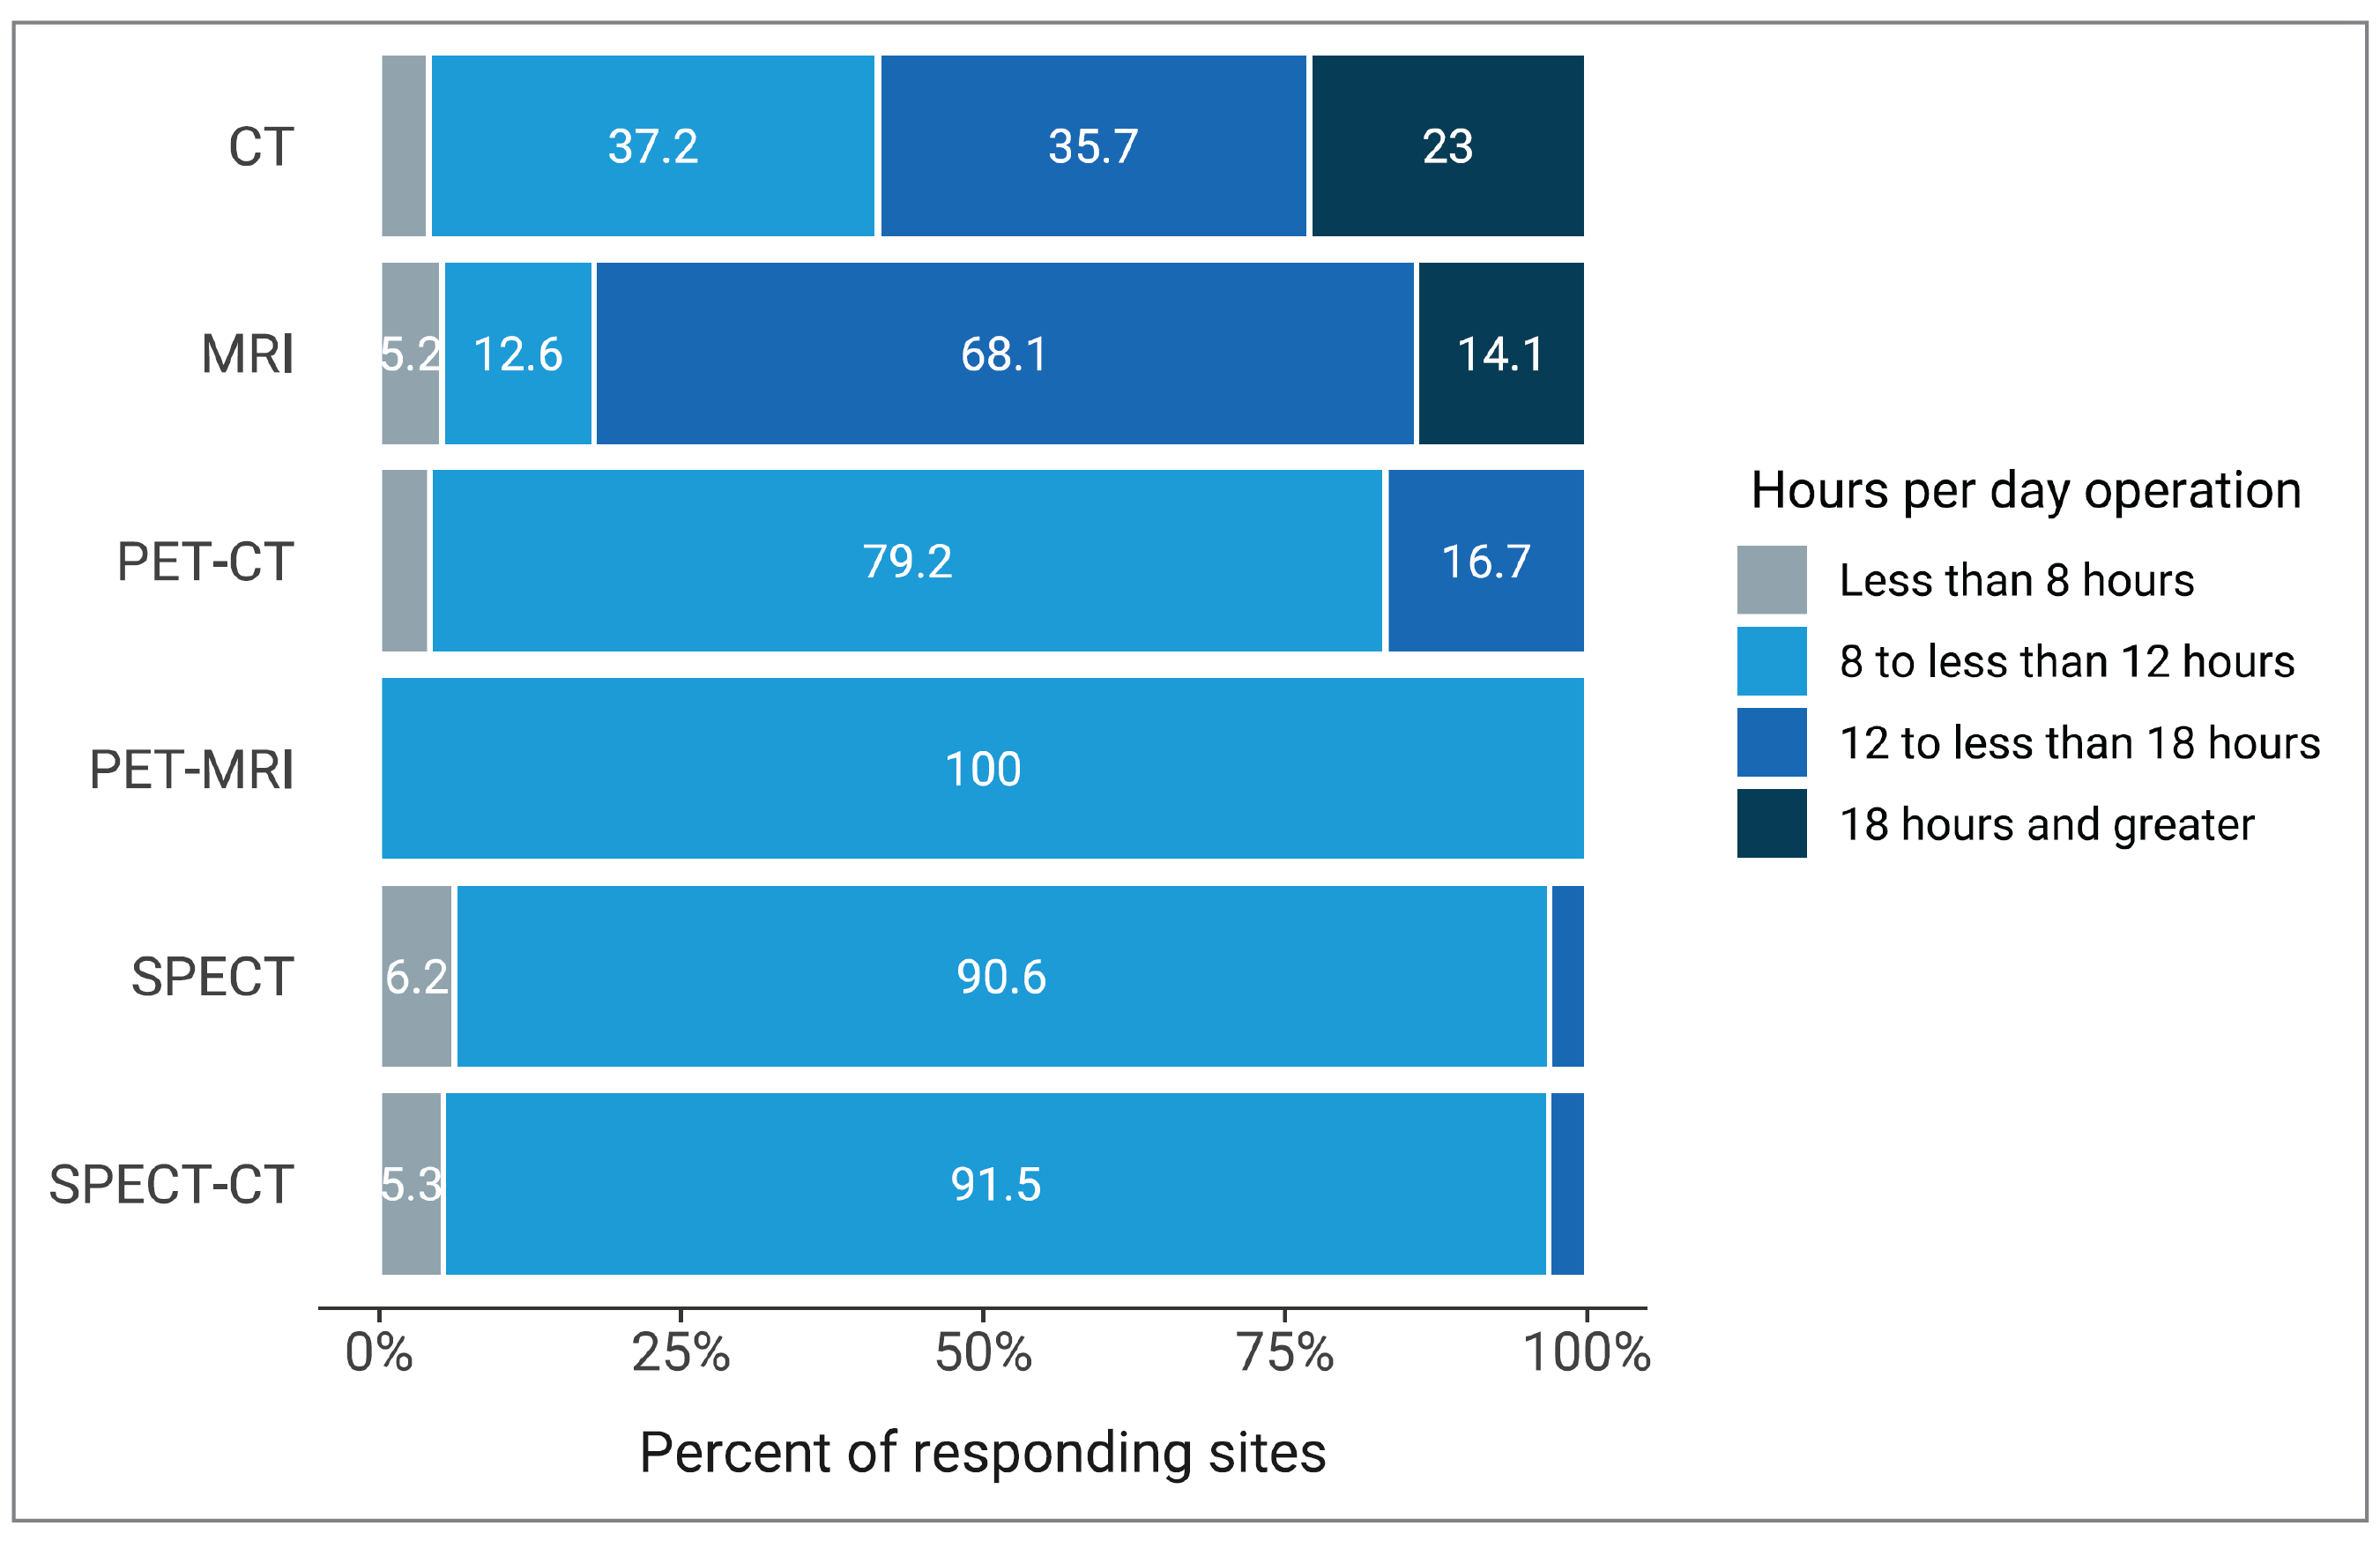
Notes: Data were derived from the survey question: “In an average 24-hour day, how many hours are all units staffed through regular scheduled service capacity? (Do not include hours where staff are only on call.)” If no data were provided for 2022–2023, no imputation was done, and the site was not included in the totals. Bars are labelled with the percentage of sites in each category (less than 8 hours, 8 to less than 12 hours, 12 to less than 18 hours, 18 or more hours).
One site reported hours of operation data for PET-MRI.
Hours of Operation per Week by Modality in Canada
CT and MRI units operate between 91 and 97 hours per week in Canada, while PET-CT, SPECT-CT, SPECT, and PET-MRI operate between 40 and 45 hours per week (Figure 9).
The most heavily used modalities are CT and MRI, with 23.7% and 18.7% of sites reporting 120 hours of operation or more per week, respectively (Figure 10).
Overall, 21% of sites with PET-CT or SPECT machines reported operation for less than 40 hours per week.
Figure 9: Average Hours per Week of Use for All Modalities in Canada, 2022–2023
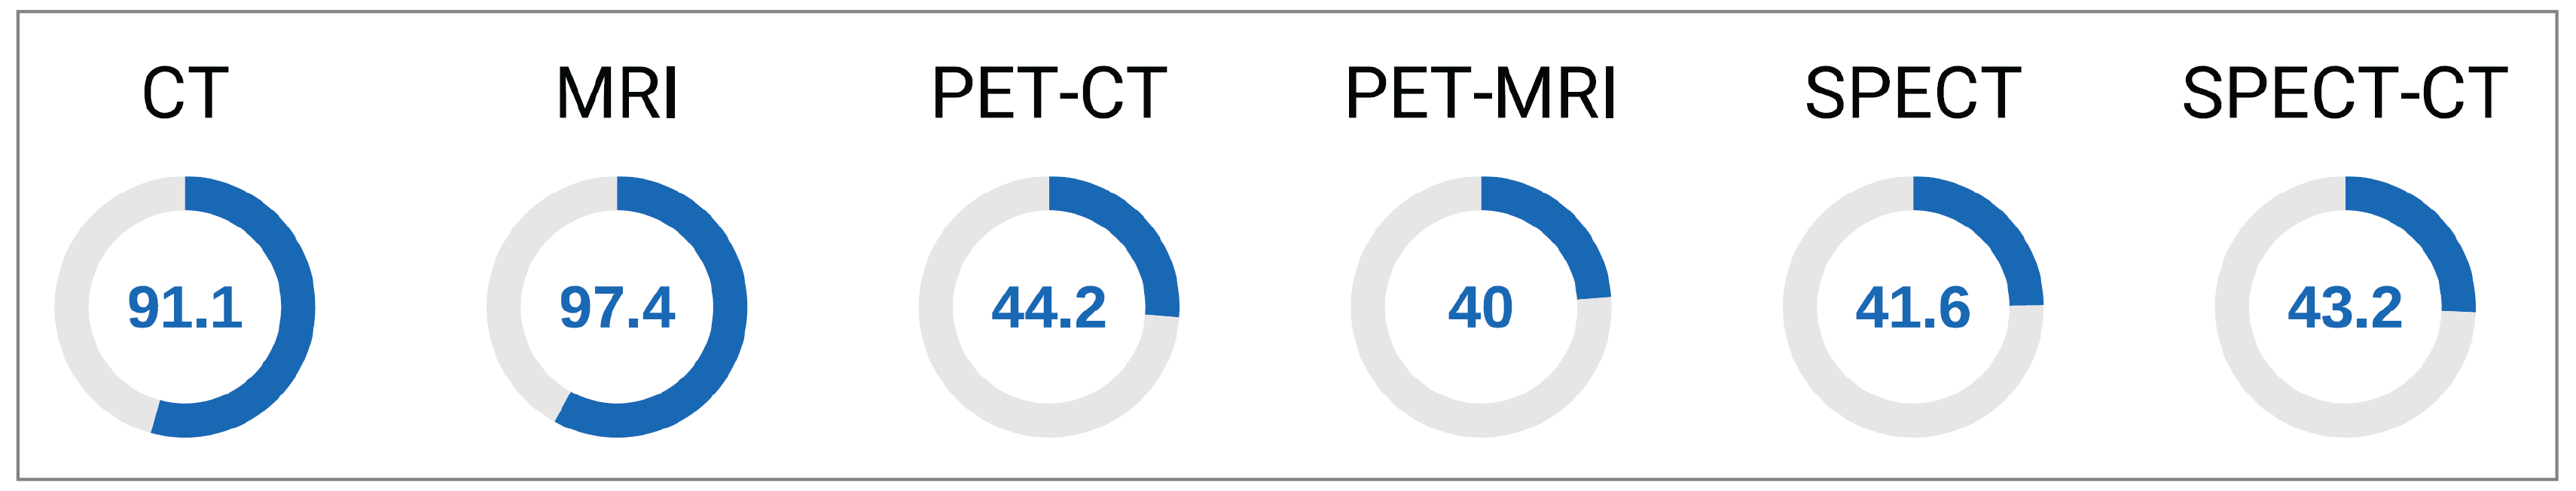
Notes: Data were derived from the survey question: “In an average 168-hour week, how many hours are all units staffed through regular scheduled service capacity? (Do not include hours where staff are only on call.)”
One site reported hours of operation data for PET-MRI.
Figure 10: Weekly Use of Diagnostic Imaging Equipment in Hours by Percentages of Sites, 2022–2023
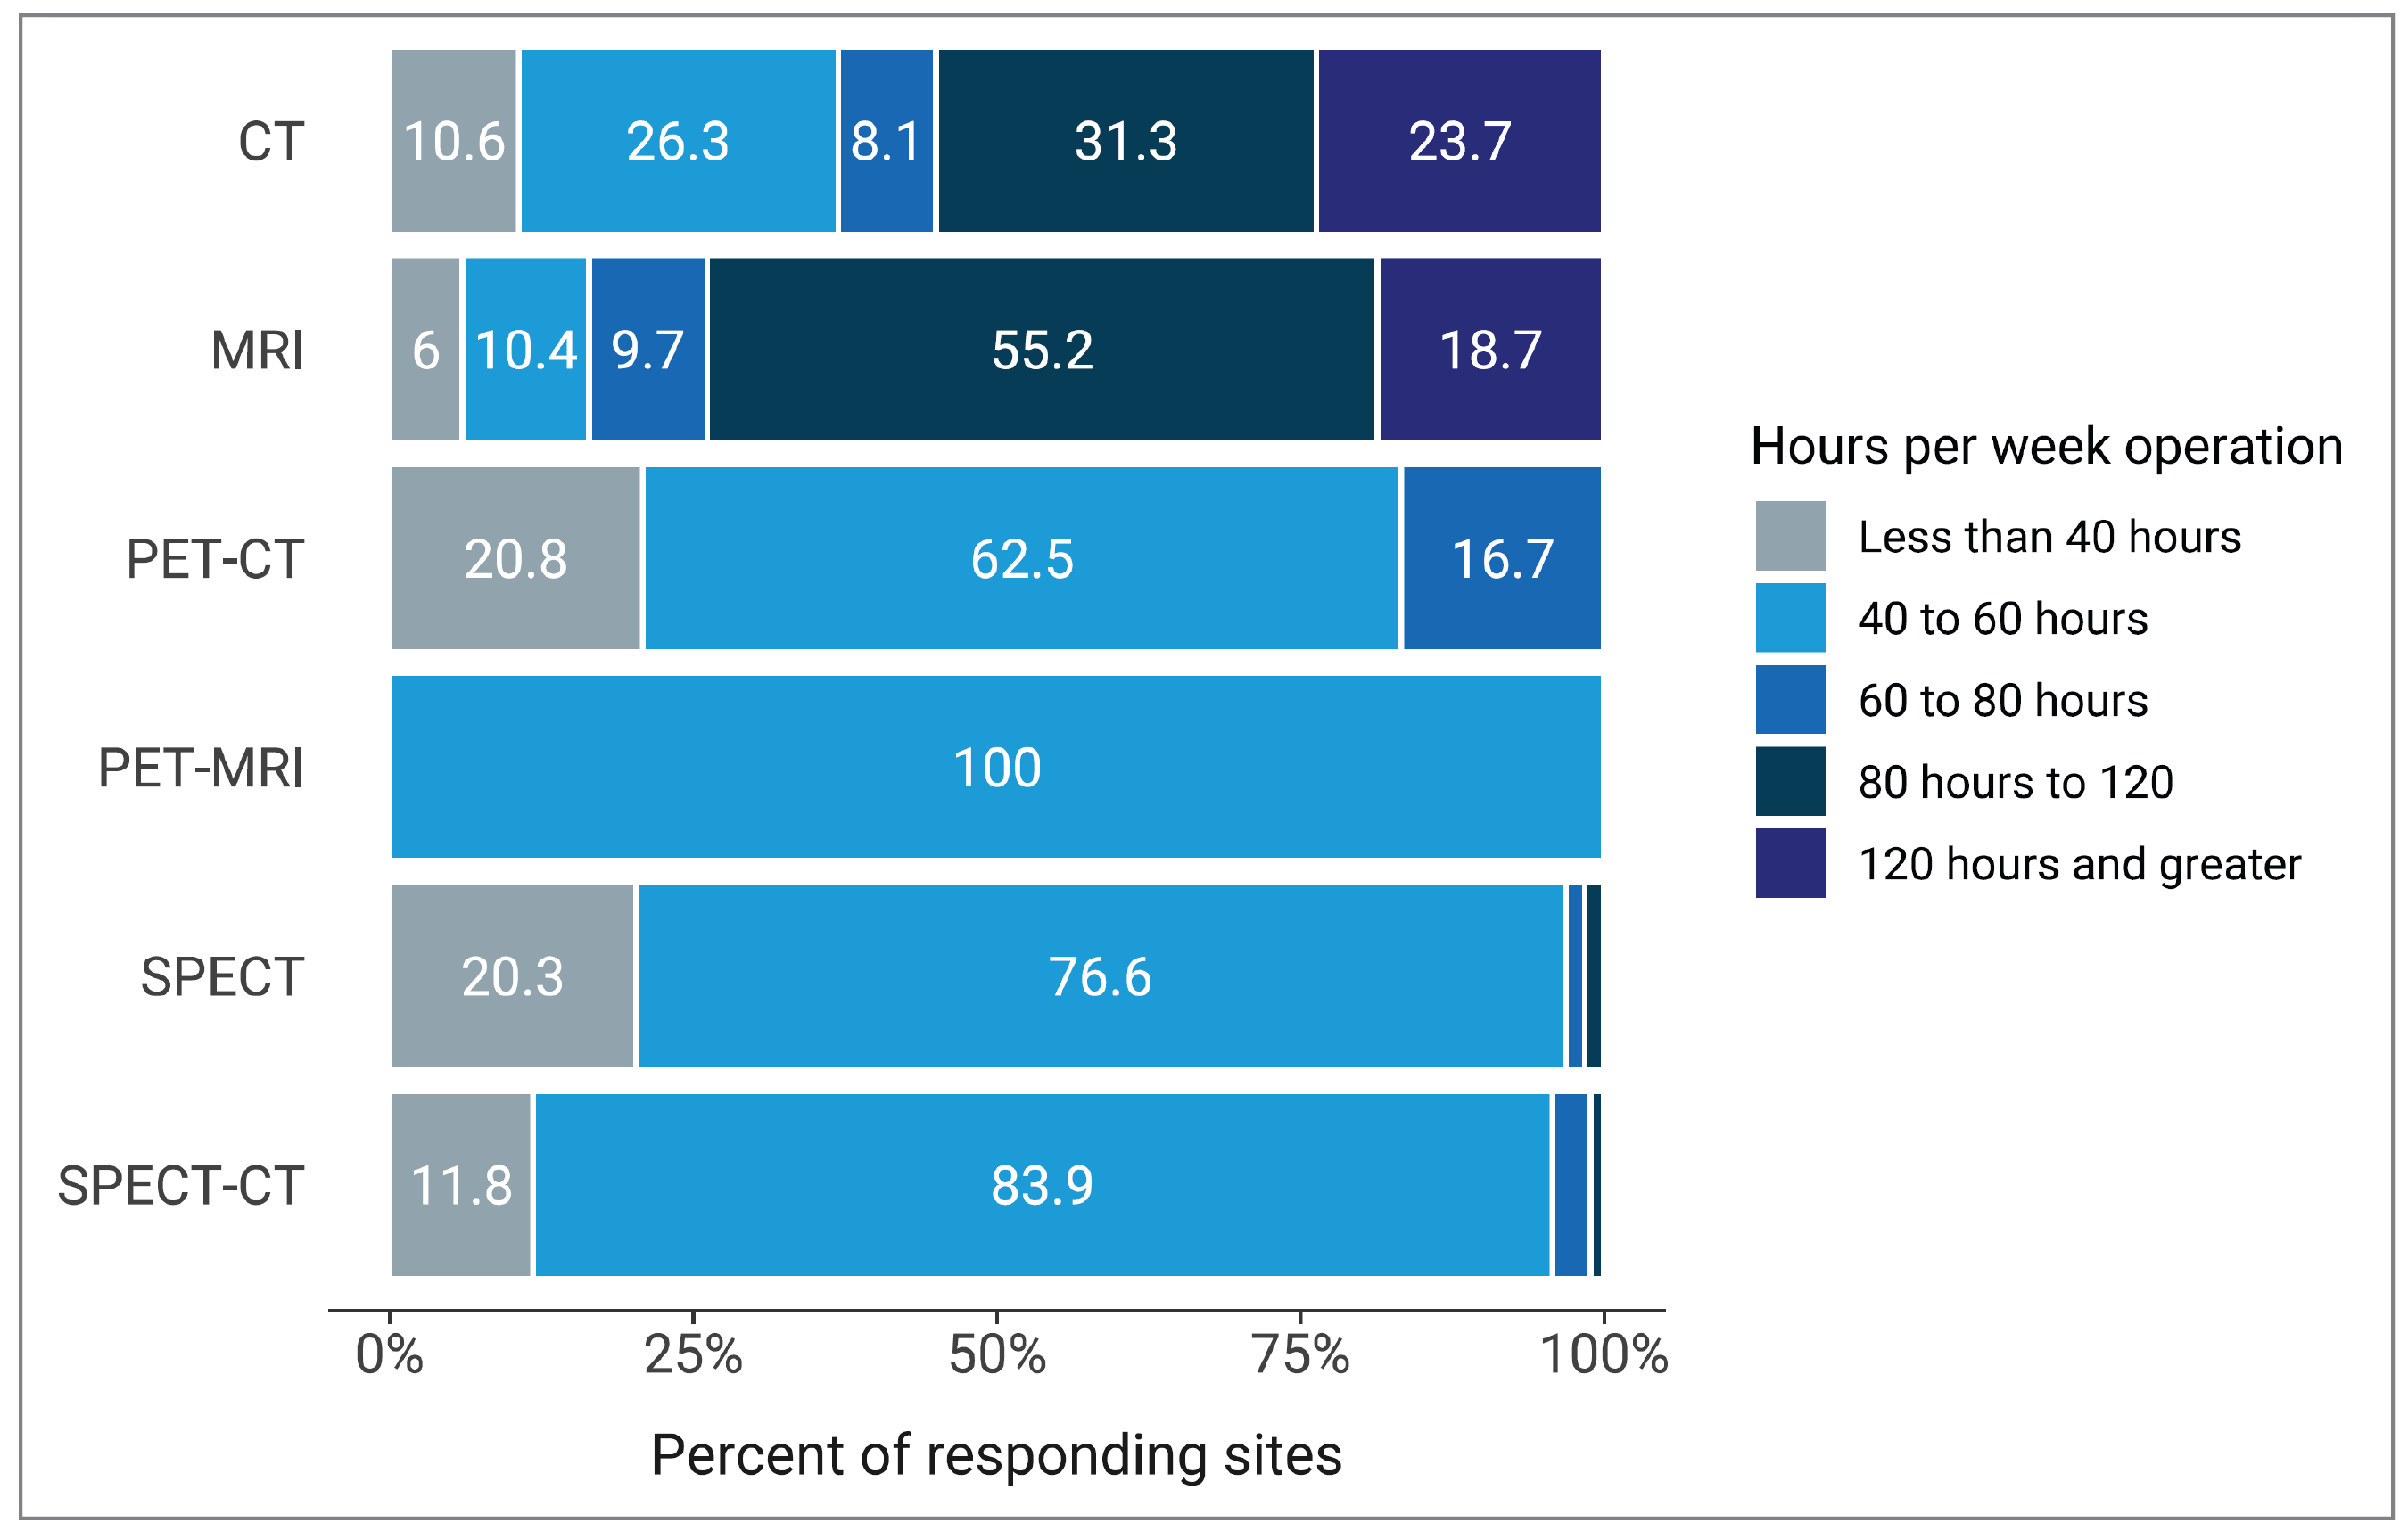
Notes: Data were derived from the survey question: “In an average 168-hour week, how many hours are the [modality] units staffed through regular scheduled service capacity (do not include hours where staff are only on call)?” If no data were provided for 2022–2023, no imputation was done, and the site was not included in the totals. Bars are labelled with the percentage of sites in each category (less than 40 hours, 40 to less than 60 hours, 60 to less than 80 hours, 80 to less than 120 hours, 120 or more hours).
One site reported hours of operation data for PET-MRI.
Age of Imaging Equipment
Age and Life Expectancy of Equipment in Canada in 2022–2023
Across all imaging modalities, the average age of equipment in Canada was 9.2 years in 2022–2023, ranging between 0 and 30 years irrespective of the modality (Figure 11 and Appendix 3, Table 13). SPECT had the highest average age at 14.5 years, followed by SPECT-CT (9.5 years), CT (8.2 years), MRI (8.4 years), PET-CT (7.2 years), and PET-MRI (6.7 years).
Most imaging equipment was more than 5 years old:
29.8% of CT units, 35.1% of MRI units, 51.5% of PET-CT units, 8.9% of SPECT units, 18.9% of SPECT-CT units, and 33.3% of PET-MRI units were 5 years old or less.
At least 20% of imaging equipment was between 6 and 10 years old:
36.7% of CT units, 27.7% of MRI units, 21.2% of PET-CT units, 18.9% of SPECT units, 35.7% of SPECT-CT, and 66.7% of PET-MRI were between 6 and 10 years old.
At least 30% imaging equipment was more than 10 years old:
33.4% of CT units, 37.2% of MRI units, 27.3% of PET-CT units, 72.3% of SPECT units, and 45.5% of SPECT-CT were older than 10 years.
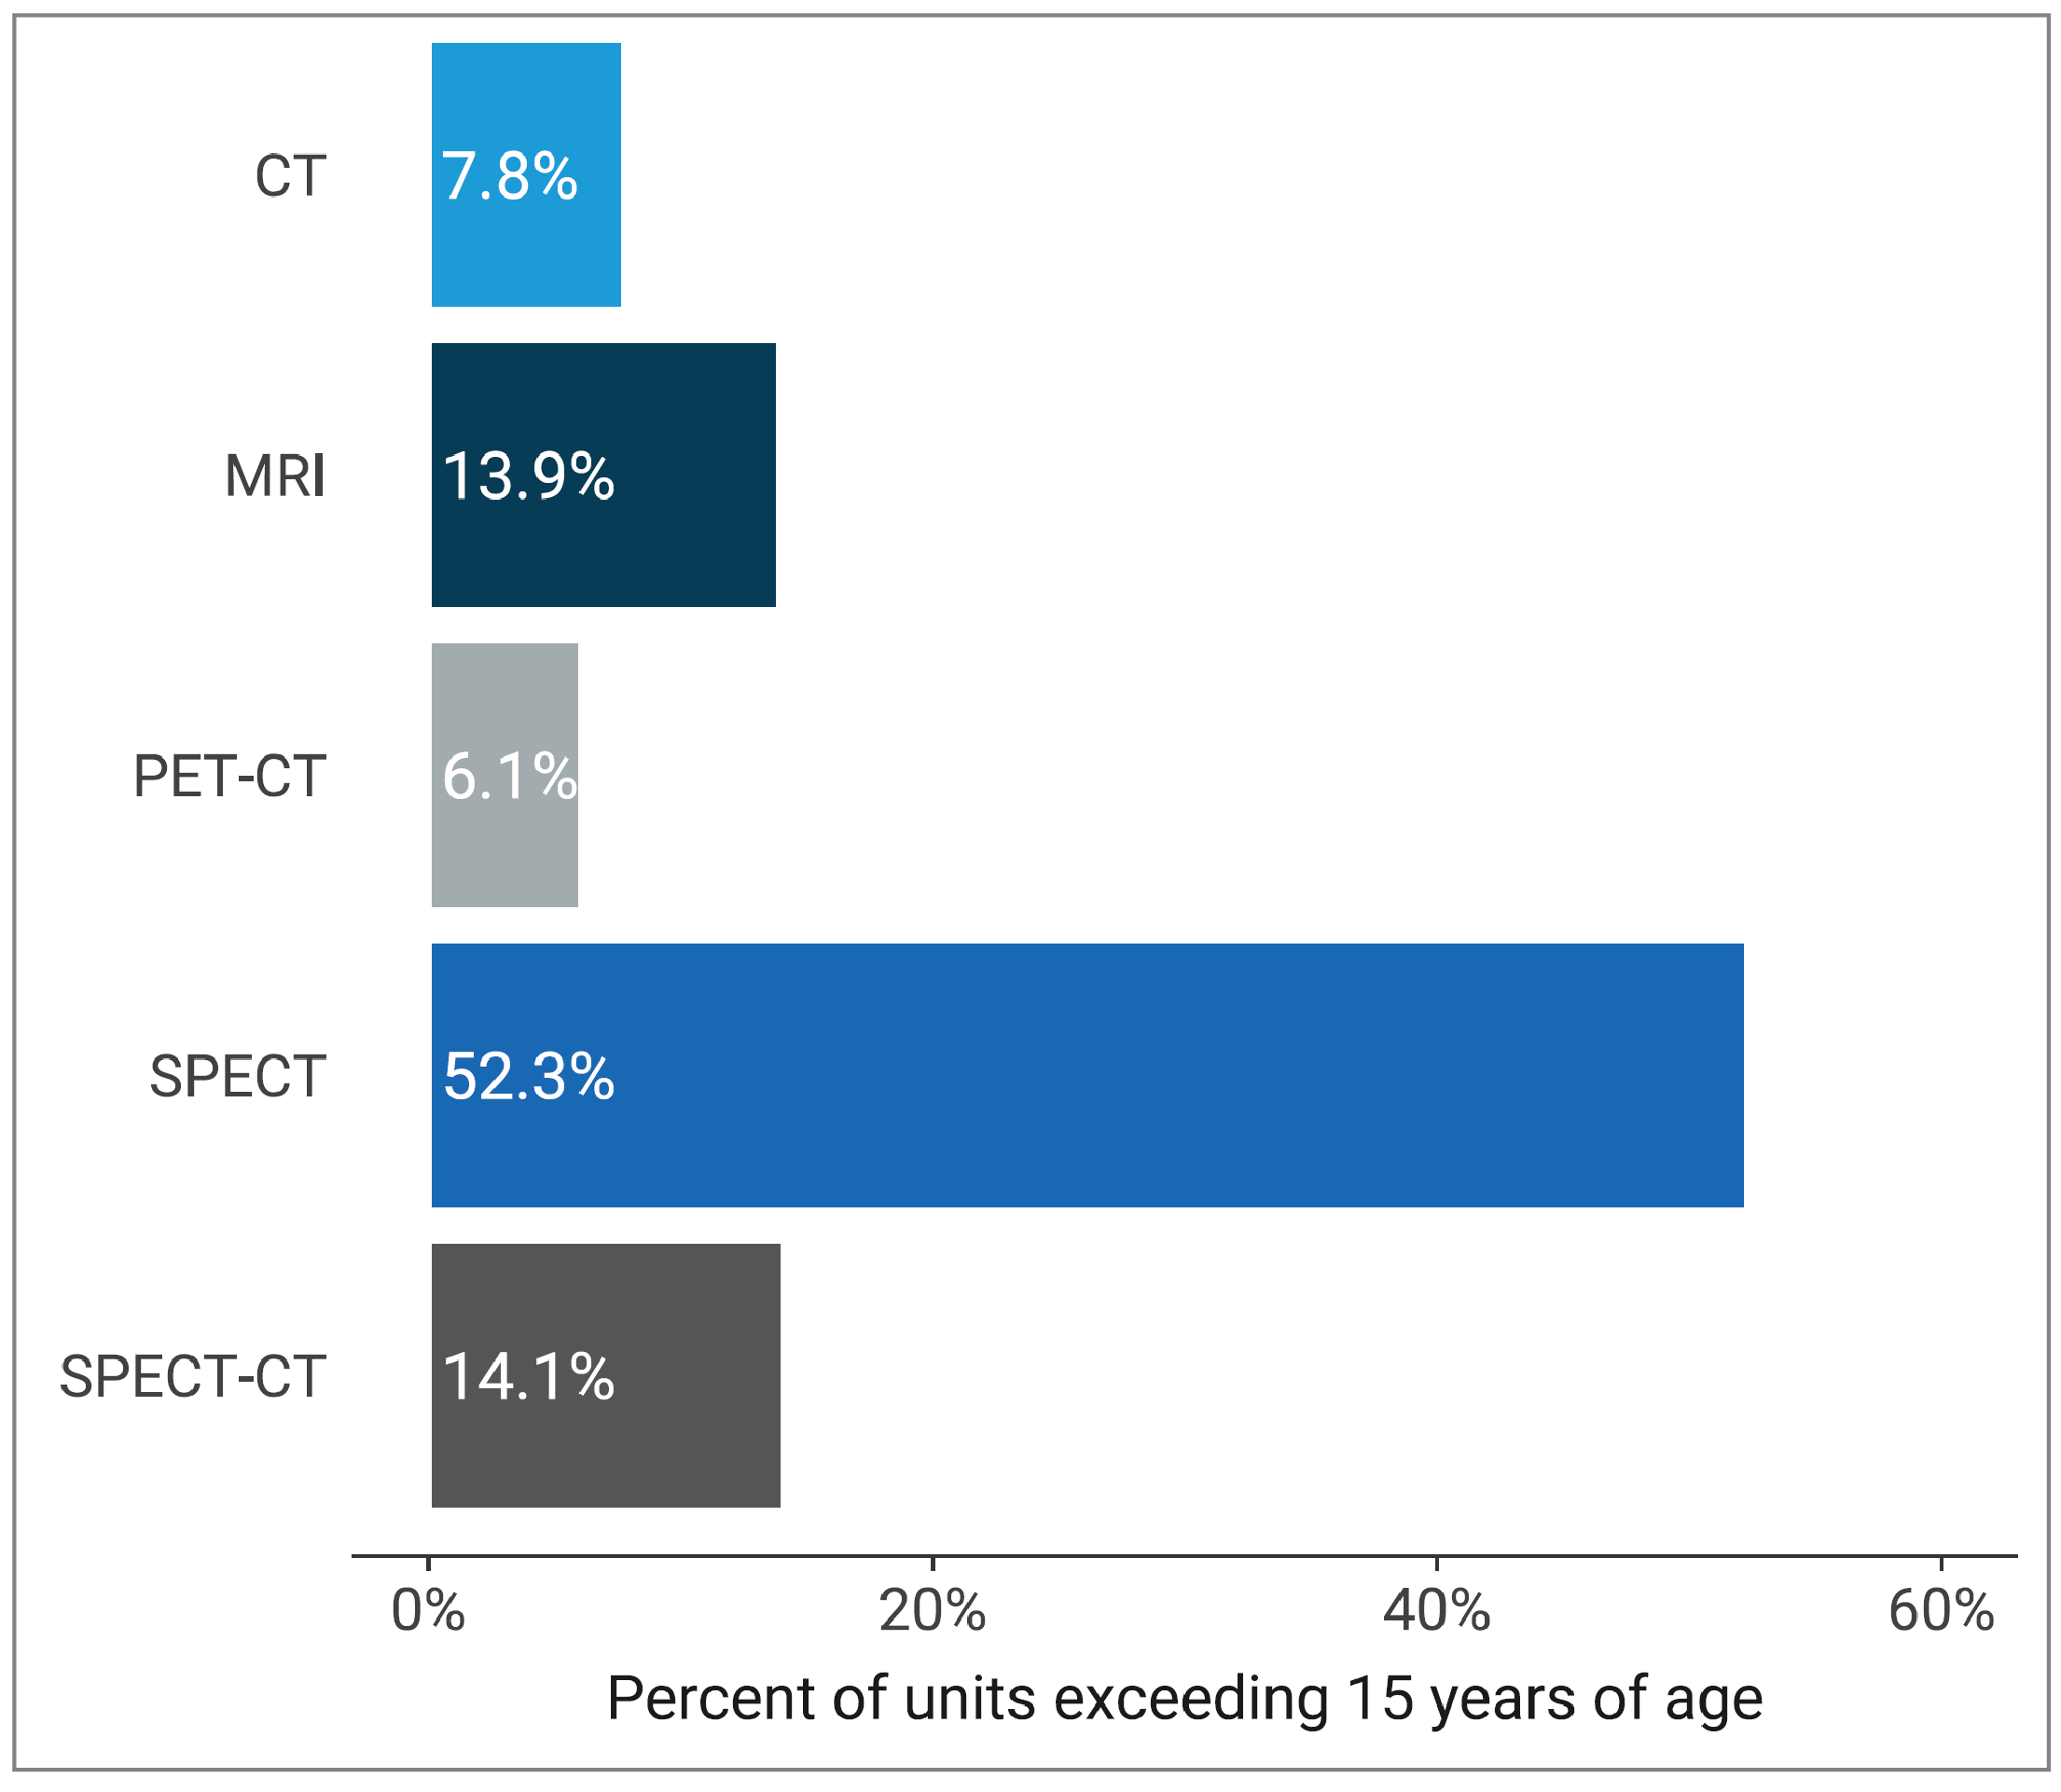
Up to 50% of imaging equipment was more than 15 years old:
7.8% of CT units, 13.9% of MRI units, 6.1% of PET-CT units, 52.3% of SPECT units, and 14.1% of SPECT-CT units were older than 15 years (Figure 12).
Figure 11: Proportions of Imaging Equipment by Operational Age in Canada, 2022–2023
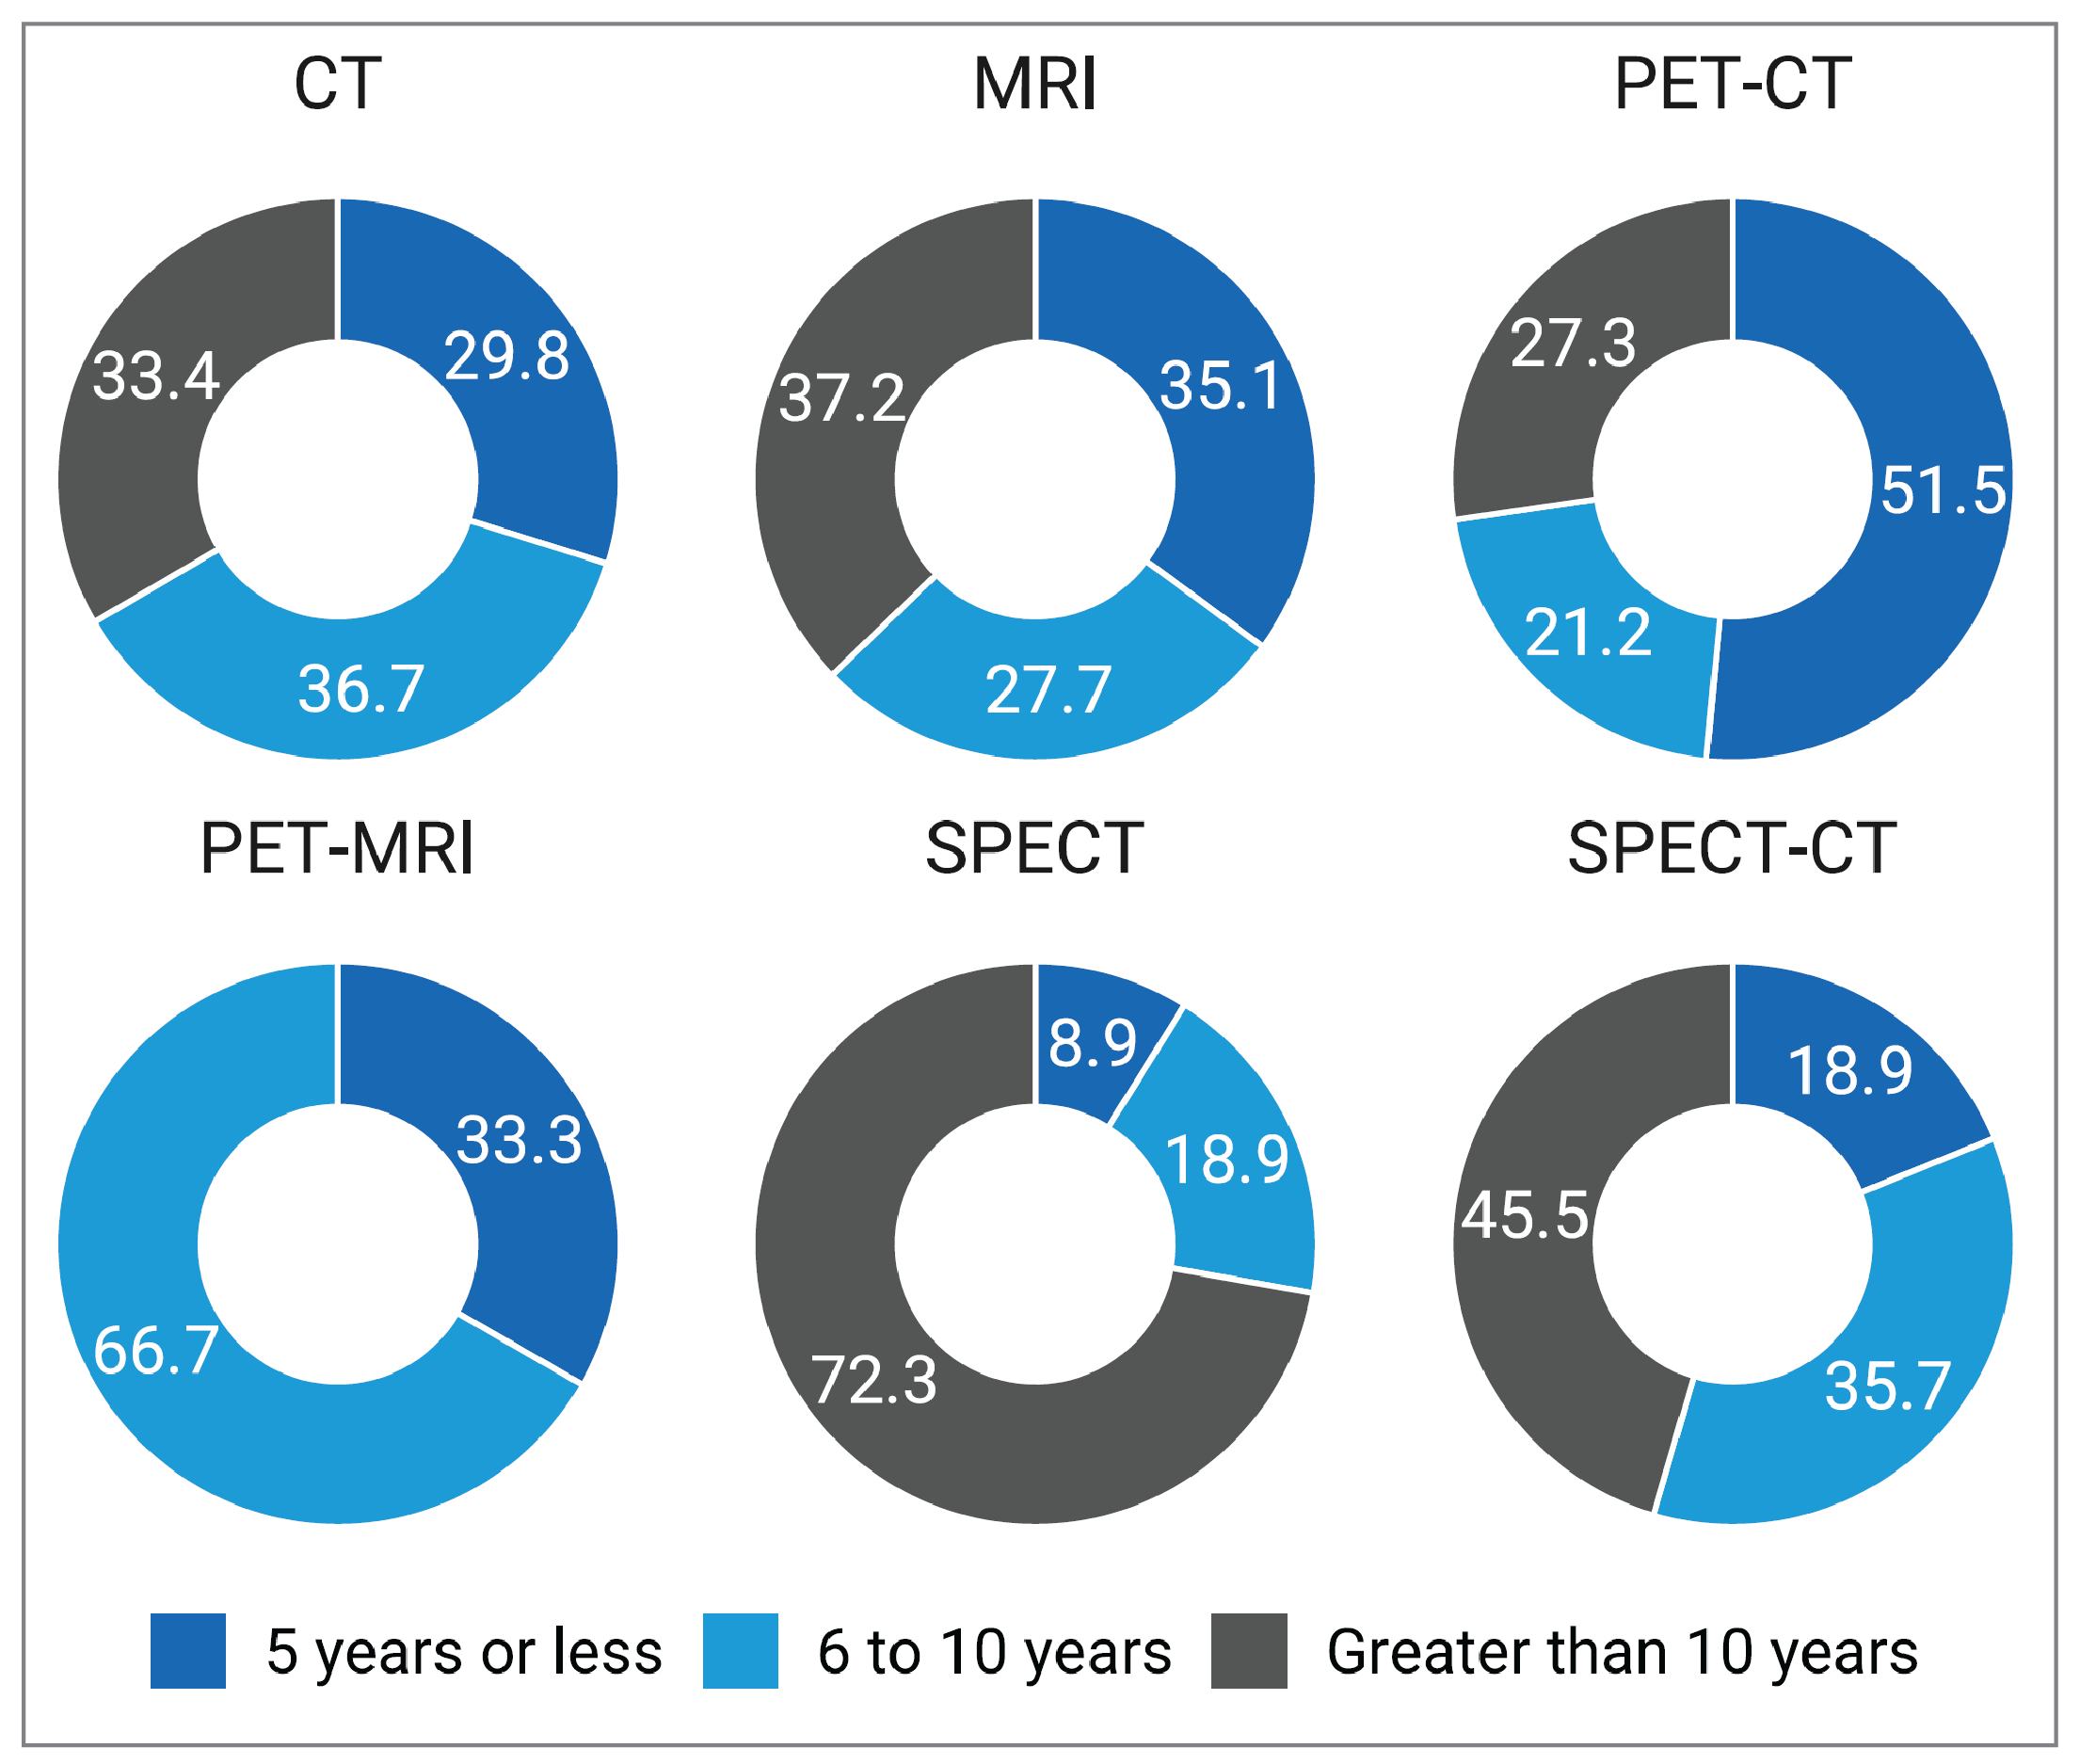
Notes: Age for each unit was calculated from the survey question: “What year did (or will) the [modality] unit become operational?” subtracted from 2023. Age was converted into percentages. Bars are labelled with the proportion of sites in each category (5 years or less, 6 to 10 years, greater than 10 years).
Data summaries by modality for years of operation are available in Appendix 3, Table 14.
Average Age of Equipment in Canada From 2003 to 2022–2023
The average age of equipment has increased over time for all imaging modalities between 2003 and 2022–2023 (Figure 13):
The mean age of CT units has increased from 4.8 years21 to 8.2 years.
The mean age of MRI units has increased from 4.3 years22 to 8.4 years.
The mean age of PET and PET-CT has increased from 5.4 years23 to 7.2 years.
The mean age of SPECT-CT units has increased from 3.6 years23 to 9.5 years since 2012.
In 2015, SPECT units were reported separately from planar units. That year, the mean age of SPECT units was 9.9 years24 and increased to 14.5 years.
Appropriateness of Received Exam Orders
An imaging exam referral may be considered inappropriate for several reasons, such as referring physician practice patterns, an exam’s inability to contribute to patient management, the performance of an exam at the incorrect time in a patient’s care pathway, failure to obtain imaging when indicated, unnecessary patient exposure to radiation, and inadequate referral information.25-28 Ensuring patients receive an appropriate examination at the most appropriate time is critical for patient care and reducing health care system costs:25-28
74.2% of sites have a process to determine the appropriateness of received exam referrals (173 of 233 responding sites) Figure 14).
Sites were asked to report whether exam referrals undergo review for appropriateness by 1 or more of the following: radiologist, technologist, computer-aided order entry, or other (Appendix 3, Table 15). Of the 173 sites that provided data on specific type of review process, the most adopted processes for determining exam referral appropriateness were:
radiologist review at 95.4% (165 sites)
technologist review at 72.3% (125 sites)
clinical decision support tool review at 28.3% (49 sites)
computer-aided order entry at 12.7% (22 sites).
Figure 13: Aging and Succession of Equipment Over Time, 2003 to 2022–2023
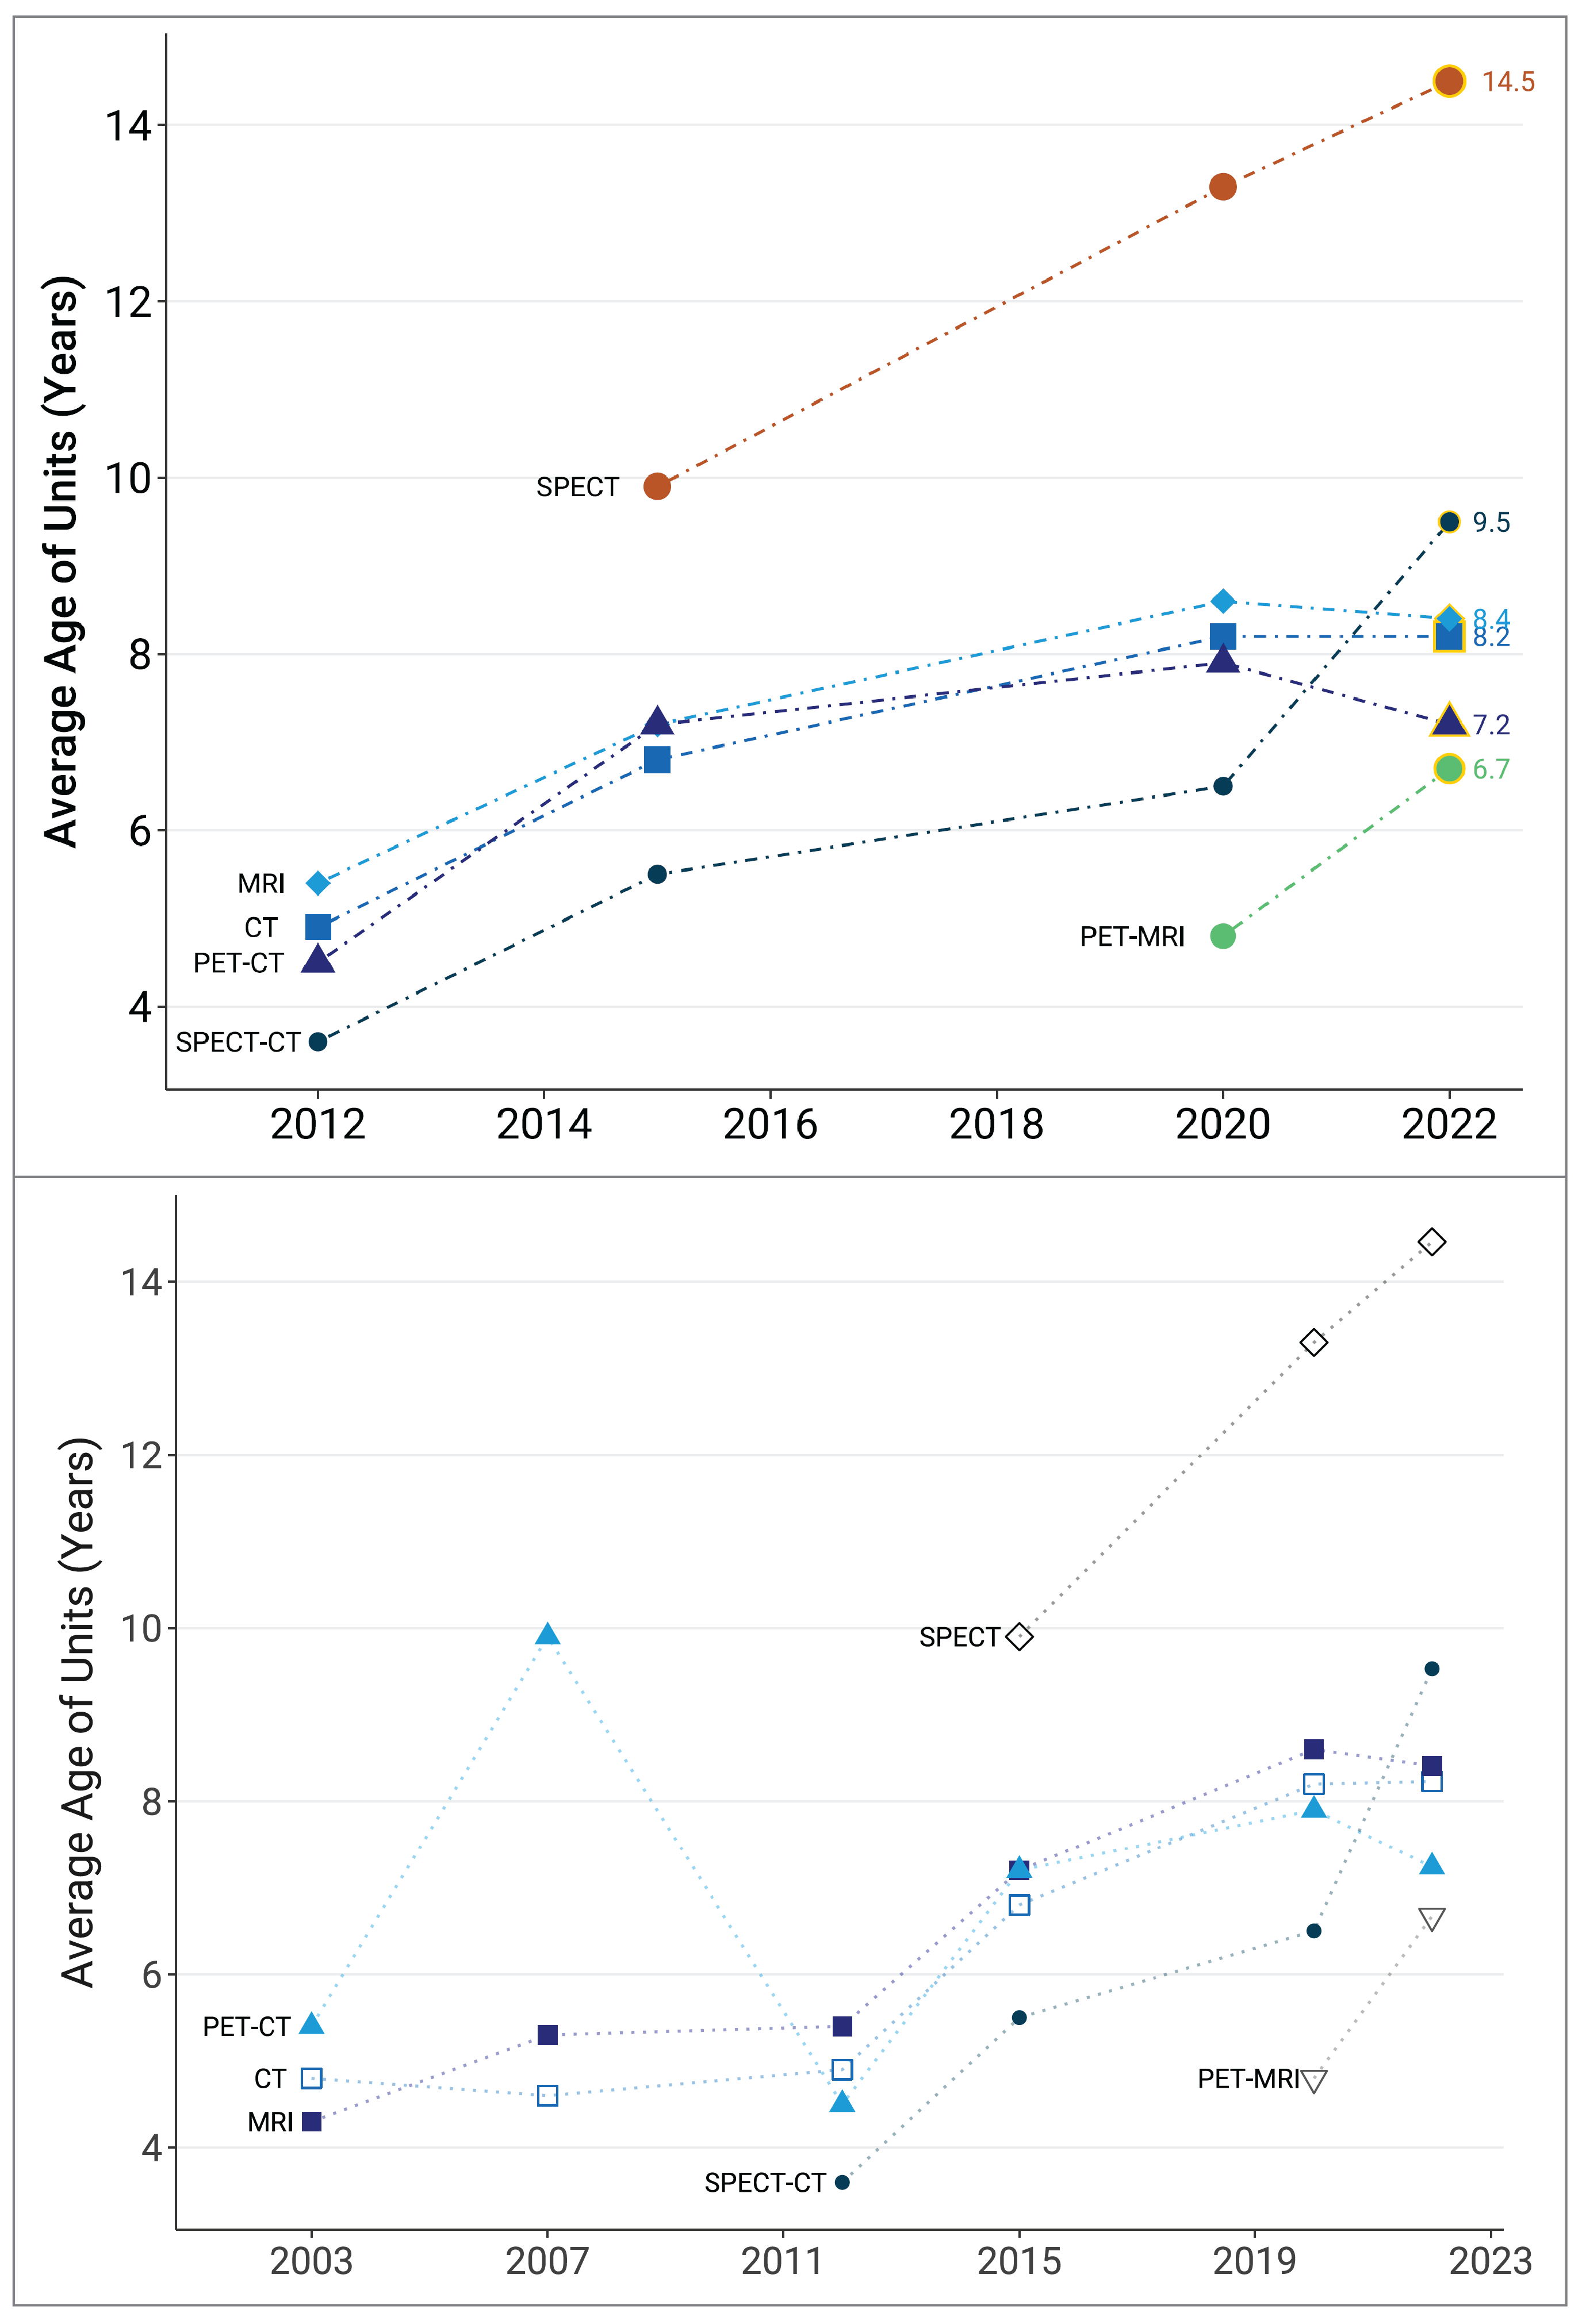
Notes: Jurisdiction-level survey data were used for all reported years. The recent decrease in the mean age of CT, MRI, and PET-CT units can be attributed to both the replacement of older machines and closure of several sites since 2019.
Years were the average age of imaging modality was reported were 2003, 2007, 2011, 2015, 2019, and 2023.
Sources: Canadian Institute for Health Information (2003),23 Canadian Institute for Health Information (2007),16 Canadian Institute for Health Information (2012),15 CADTH (2015),17 CADTH (2017),18 CADTH (2020),6 CADTH (2021).24
Figure 14: Proportion of Sites With an Appropriate Use Process by Province and Territory, 2022–2023
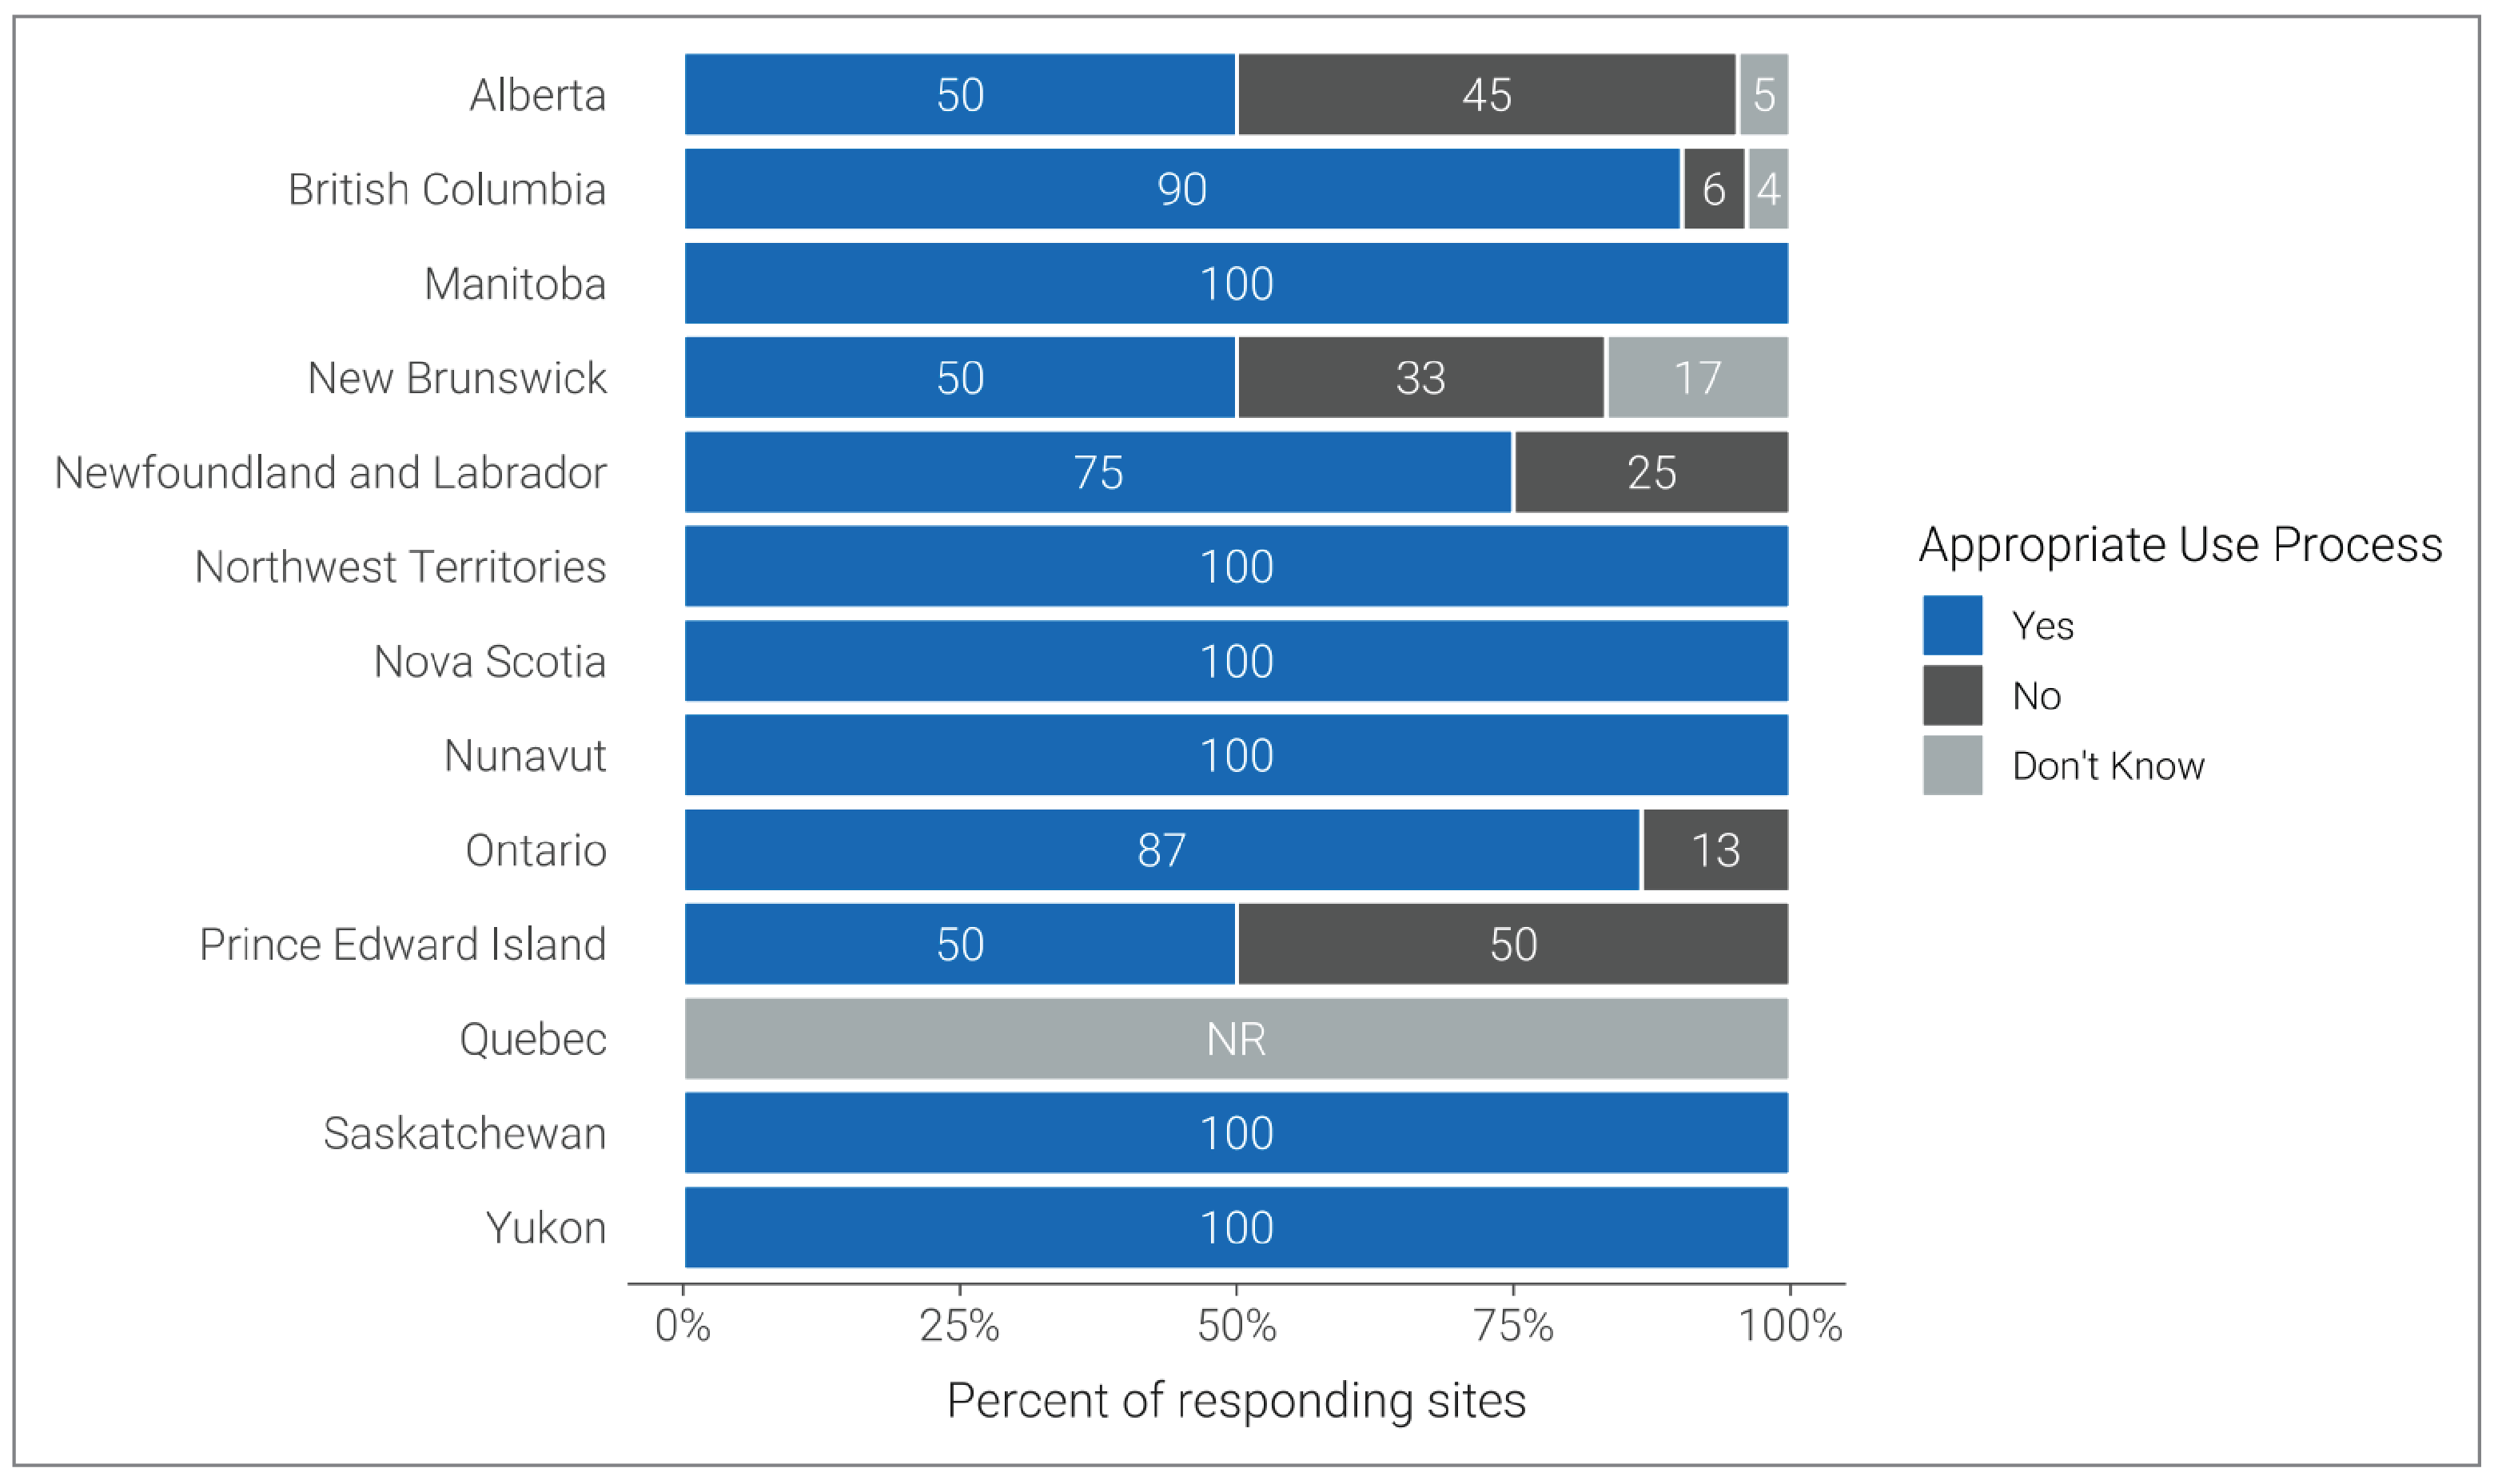
NR = not reported.
Notes: Data were derived from the survey question: “Do you have a process for determining the appropriateness of orders that are received?”
Data are available in Appendix 3, Table 15.
Trends Over Time
Change in Number of Units Since 2012: A 10-Year Comparison
Each imaging modality experienced growth in the past decade in Canada in terms of both the overall number of units and the number of units per million people, apart from CT and SPECT (Figure 15). The data for this comparison are drawn from this report for 2022–2023 and from CIHI for 2012.15 Overall, Canada’s population has increased by 15% since 2012 (Figure 31).
Figure 15: Percentage Change in Units per Million Population, 2012 to 2022–2023
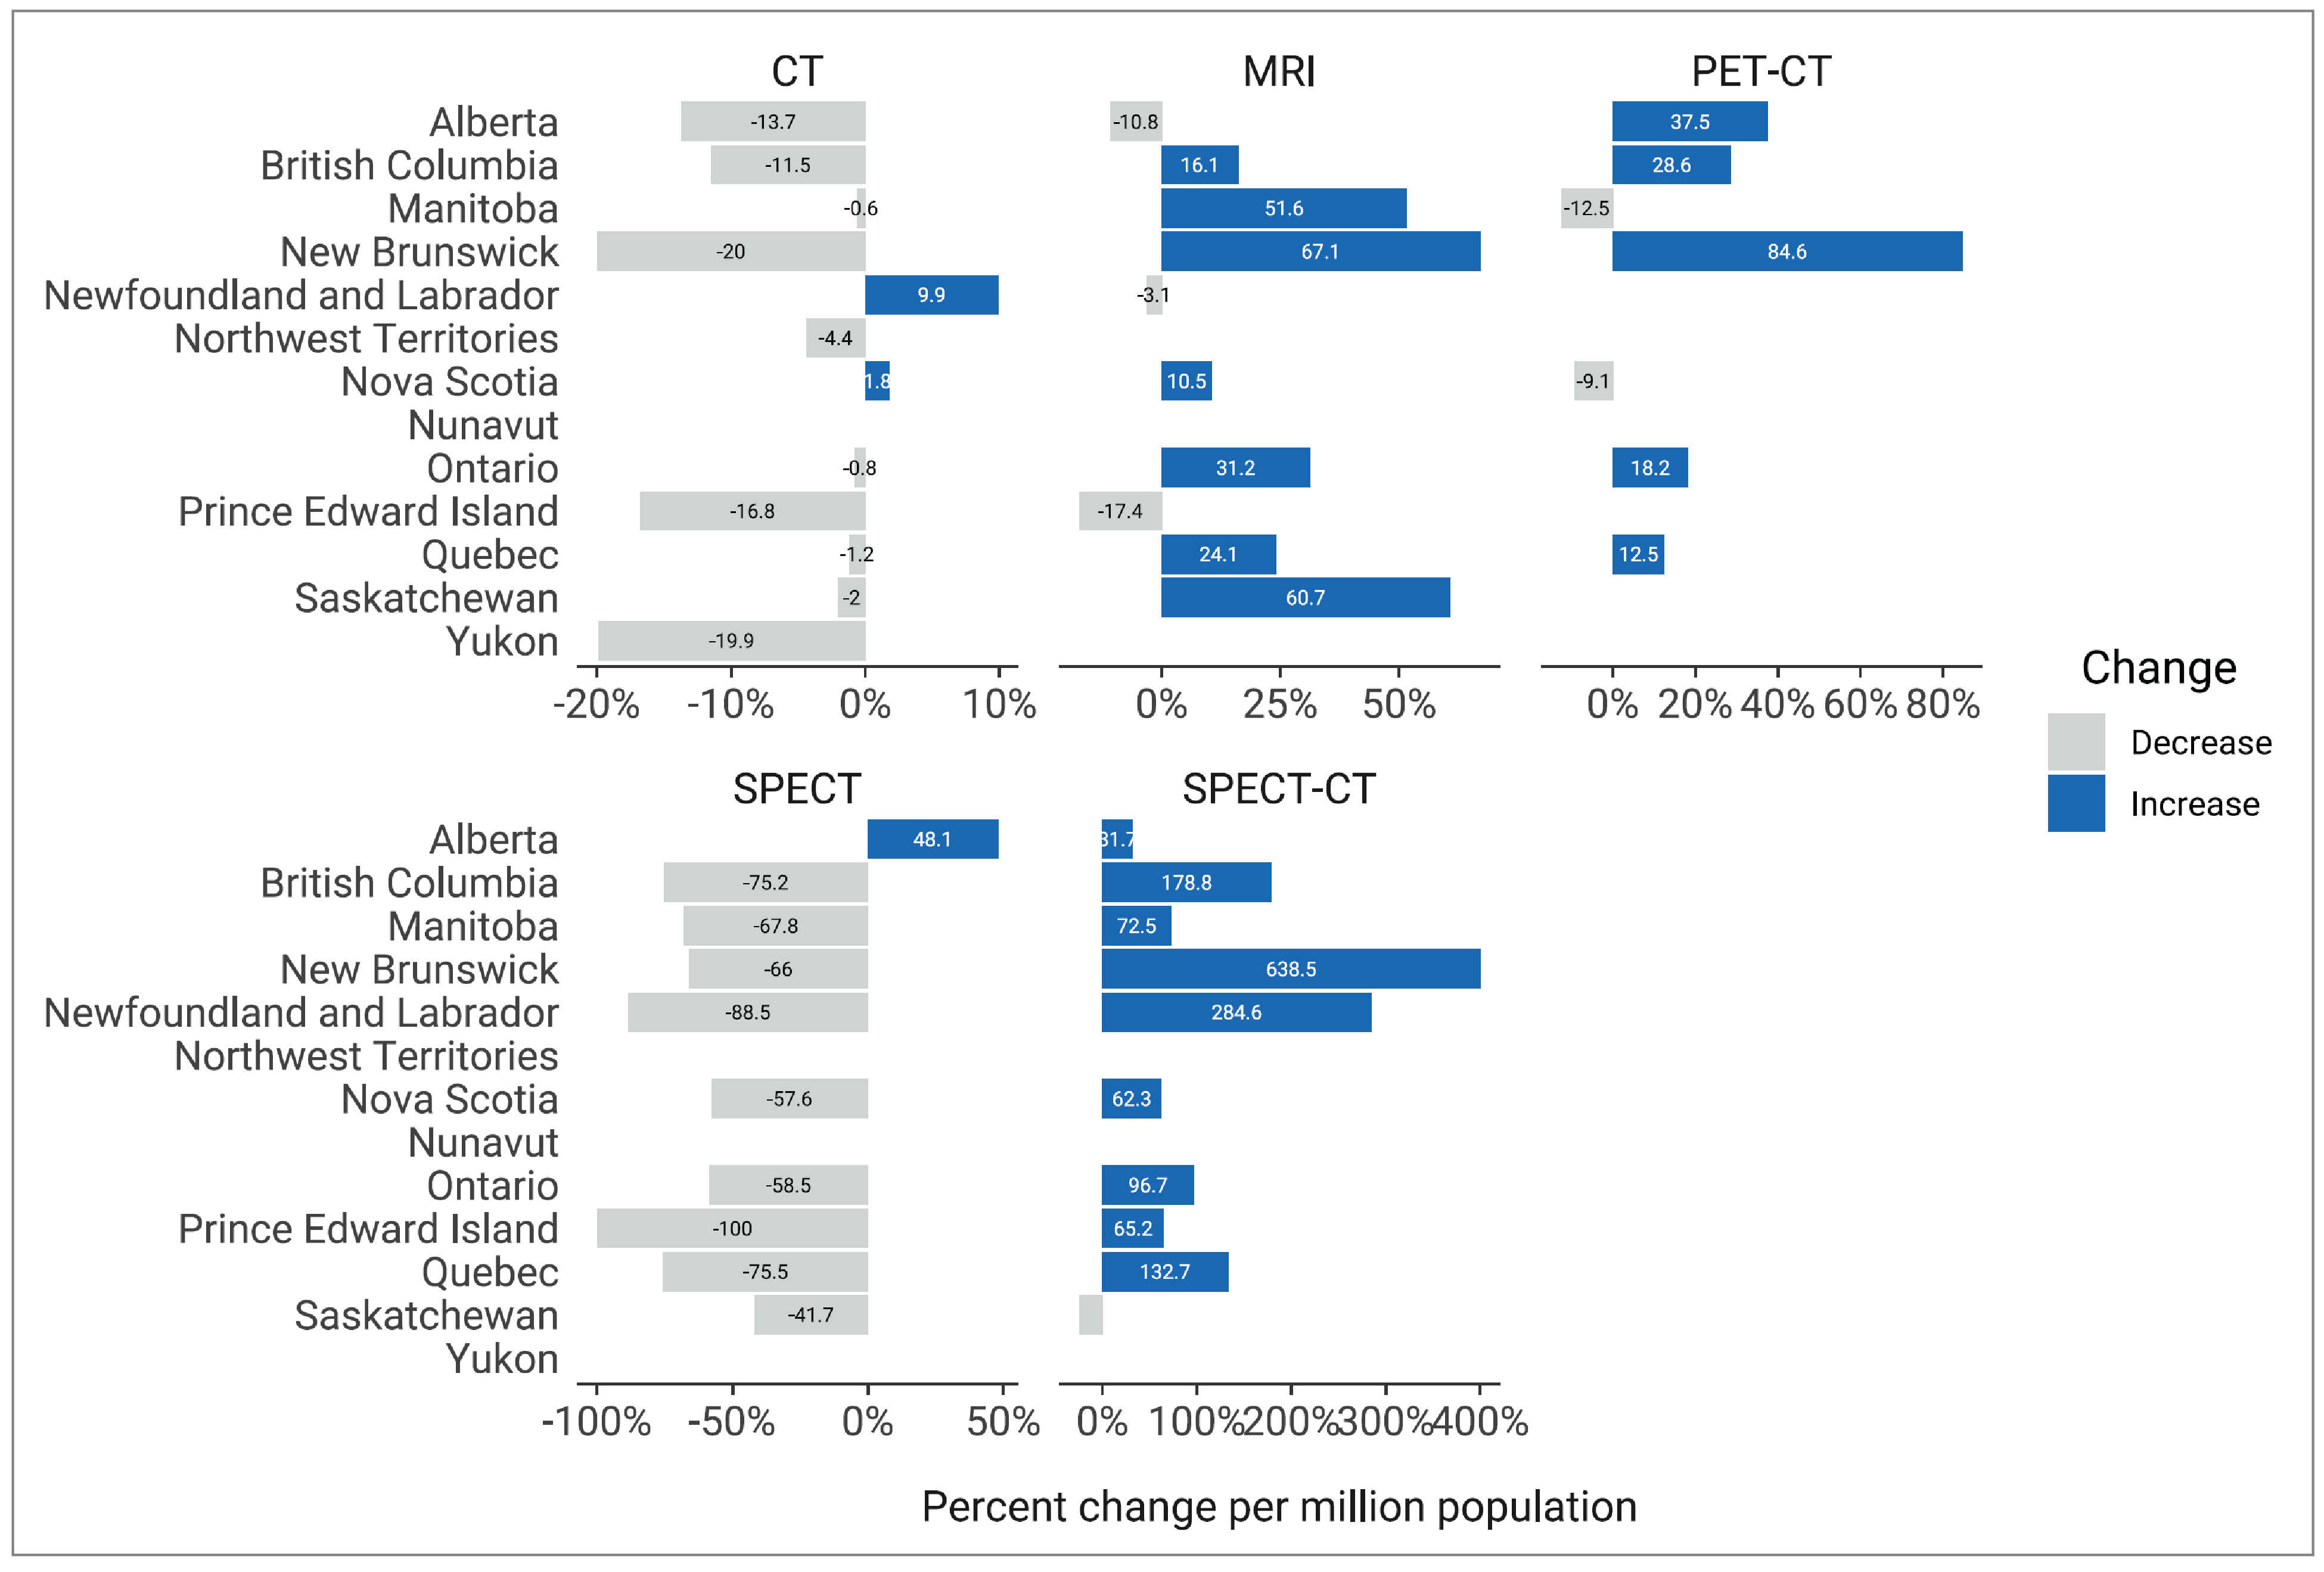
Notes: Jurisdiction-level survey data were used for 2012 and 2022–2023.
The x-axis scales for the number of units differ across graphs due to considerable variability in the total number of units for each modality.
Sources: Canadian Institute for Health Information (2012),15 CADTH (2023).
CT Unit Changes Over a Decade15
The overall number of CT units in Canada increased by 9.8%, from 510 units in 2012 to 560 in 2022–2023 (Appendix 3, Table 16).
In 2012, jurisdictions had at least 1 CT, and the largest number in a single jurisdiction was 168 CT units. In comparison, in 2022–2023, all 13 jurisdictions had at least 1 CT, and the largest number in a single jurisdiction was 192 CT units.
In 2012, approximately 60% of all CT units were located in the 2 most densely populated provinces, Ontario and Quebec, which was the same in 2022–2023.
CT has fallen behind population growth by 4.8%, decreasing from 14.7 CT units per million population to 14.0 units per million population.
The number of CT units per million people decreased for all jurisdictions with existing CT capacity 10 years ago, except for 2 (Figure 15). These jurisdictions with the greatest growth in units per million were Newfoundland and Labrador (9.9%) and Nova Scotia (1.8%).
MRI Unit Changes Over a Decade15
The overall number of MRI units in Canada increased by 40.3%, from 308 units in 2012 to 432 in 2022–2023 (Appendix 3, Table 17).
In 2012, 10 jurisdictions had 1 to 104 MRI units per jurisdiction compared to 2022–2023 when 11 jurisdictions had 1 to 157 units per jurisdiction.
In 2012, approximately 65% of all MRI units were in Ontario and Quebec, which was the same in 2022–2023.
MRI has experienced a 21.3% growth rate, increasing from 8.9 units per million people in 201215 to 10.8 units per million in 2022–2023.
The number of MRI units per million people increased for 7 of 10 jurisdictions that had existing MRI 10 years ago (Figure 15). The jurisdictions with the greatest growth in units per million were New Brunswick (67.1%), Saskatchewan (60.7%), and Manitoba (51.6%).
PET-CT Unit Changes Over a Decade15
The overall number of PET or PET-CT units in Canada increased by 39.5%, from 43 in 2012 to 60 in 2022–2023 (Appendix 3, Table 18).
In 2012, 7 jurisdictions had 1 to 19 PET-CT units per jurisdiction compared to 2022–2023 when 9 jurisdictions had 1 to 24 units per jurisdiction.
In 2012, approximately 80% of PET or PET-CT units were in Ontario and Quebec compared to 72% in 2022–2023.
PET-CT has experienced a 15.4% growth rate, increasing from 1.3 per million people in 2012 to 1.5 per million people in 2022 –2023.
The number of PET-CT units per million people increased for 5 of 7 jurisdictions with existing PET-CT capacity 10 years ago (Figure 15). The jurisdictions with the greatest growth in units per million were New Brunswick (84.6%) and Alberta (37.5%). Manitoba and Nova Scotia experienced a decline in number of units per million people (−12.5% and −9.1%, respectively), and another reported no change.
SPECT Unit Changes Over a Decade15
SPECT is the only imaging modality reviewed in this report that decreased in number of units over the past 10 years. The overall number of units in Canada decreased by 54.9%, from 466 in 2012 to 210 in 2022–2023. (Appendix 3, Table 19).
In 2012, 10 jurisdictions had 1 to 214 SPECT units per jurisdiction, compared to 2022–2023 when 9 jurisdictions had 1 to 102 units per jurisdiction.
In 2012, approximately 46% of SPECT units were in Ontario compared to 49% in 2022–2023.
SPECT has experienced a 60.4% decline in growth rate, decreasing from 13.4 units per million people in 2012 to 5.3 units per million people in 2022–2023. The decline in SPECT may be attributed to its gradual replacement by SPECT-CT.
The number of SPECT units per million people decreased for 9 of 10 jurisdictions with existing SPECT capacity 10 years ago (Figure 15). Alberta was the only jurisdiction that experienced a growth in the number of units per million people (48.1%).
SPECT-CT Unit Changes Over a Decade15
SPECT-CT stands out from the other imaging modalities discussed in this report because it has experienced rapid growth over the past decade. The overall number of units in Canada increased by 133.1% from 142 in 2012 to 331 in 2022–2023 (Appendix 3, Table 20).
In 2012, 10 jurisdictions had 1 to 42 SPECT-CT units per jurisdiction, compared to 2022–2023 when 10 jurisdictions had 2 to 107 units per jurisdiction.
In 2012, approximately 58% of SPECT-CT units were in Ontario and Quebec, which was the same in 2022–2023.
SPECT-CT has experienced a 102.4% growth rate, increasing from 4.1 units per million people in 201215 to 8.3 units per million people in 2022–2023.
The number of SPECT-CT units per million people increased for 9 of 10 jurisdictions with existing SPECT-CT capacity over the past 10 years (Figure 15). The jurisdictions with the greatest growth in units per million were New Brunswick (638.5%), Newfoundland and Labrador (284.6%), and British Columbia (178.8%). One province experienced a decline in units per million people (−24.6%).
PET-MRI
PET-MRI is still an emerging technology, with 6 units used for research purposes in 3 provinces.
Change in Exam Volume Since 2012: 10-Year Comparison
Due to data availability, exam data for 2022–2023 are compared with 201215 for only CT and MRI. Between 2012 and 2022–2023, the overall volume of CT and MRI exams both increased and outpaced population growth in Canada (Figure 16).
CT Exam Volume Changes Over a Decade
The overall volume of CT exams in Canada increased by 45.9%, from 4,377,919 in 2012 to 6,385,665 exams in 2022–2023.
In 2012, approximately 64% of CT exams were performed in Ontario and Quebec, which was the same in 2022–2023.
CT exam volume experienced a 27.6% growth rate, increasing from 125.5 exams per 1,000 people in 2012 to 160.2 exams per 1,000 people in 2022–2023 (Figure 16).
The number of CT exams per 1,000 people increased for 11 of 12 jurisdictions with existing CT capacity 10 years ago. The jurisdictions with the greatest growth in exams per 1,000 people were the Northwest Territories (104.7%), Yukon (85.6%), and Prince Edward Island (55.2%). One province experienced a decline in volume of exams per 1,000 people (−18.2%).
Figure 16: Percentage Change in CT and MRI Exams per 1,000 Population, 2012 to 2022–2023
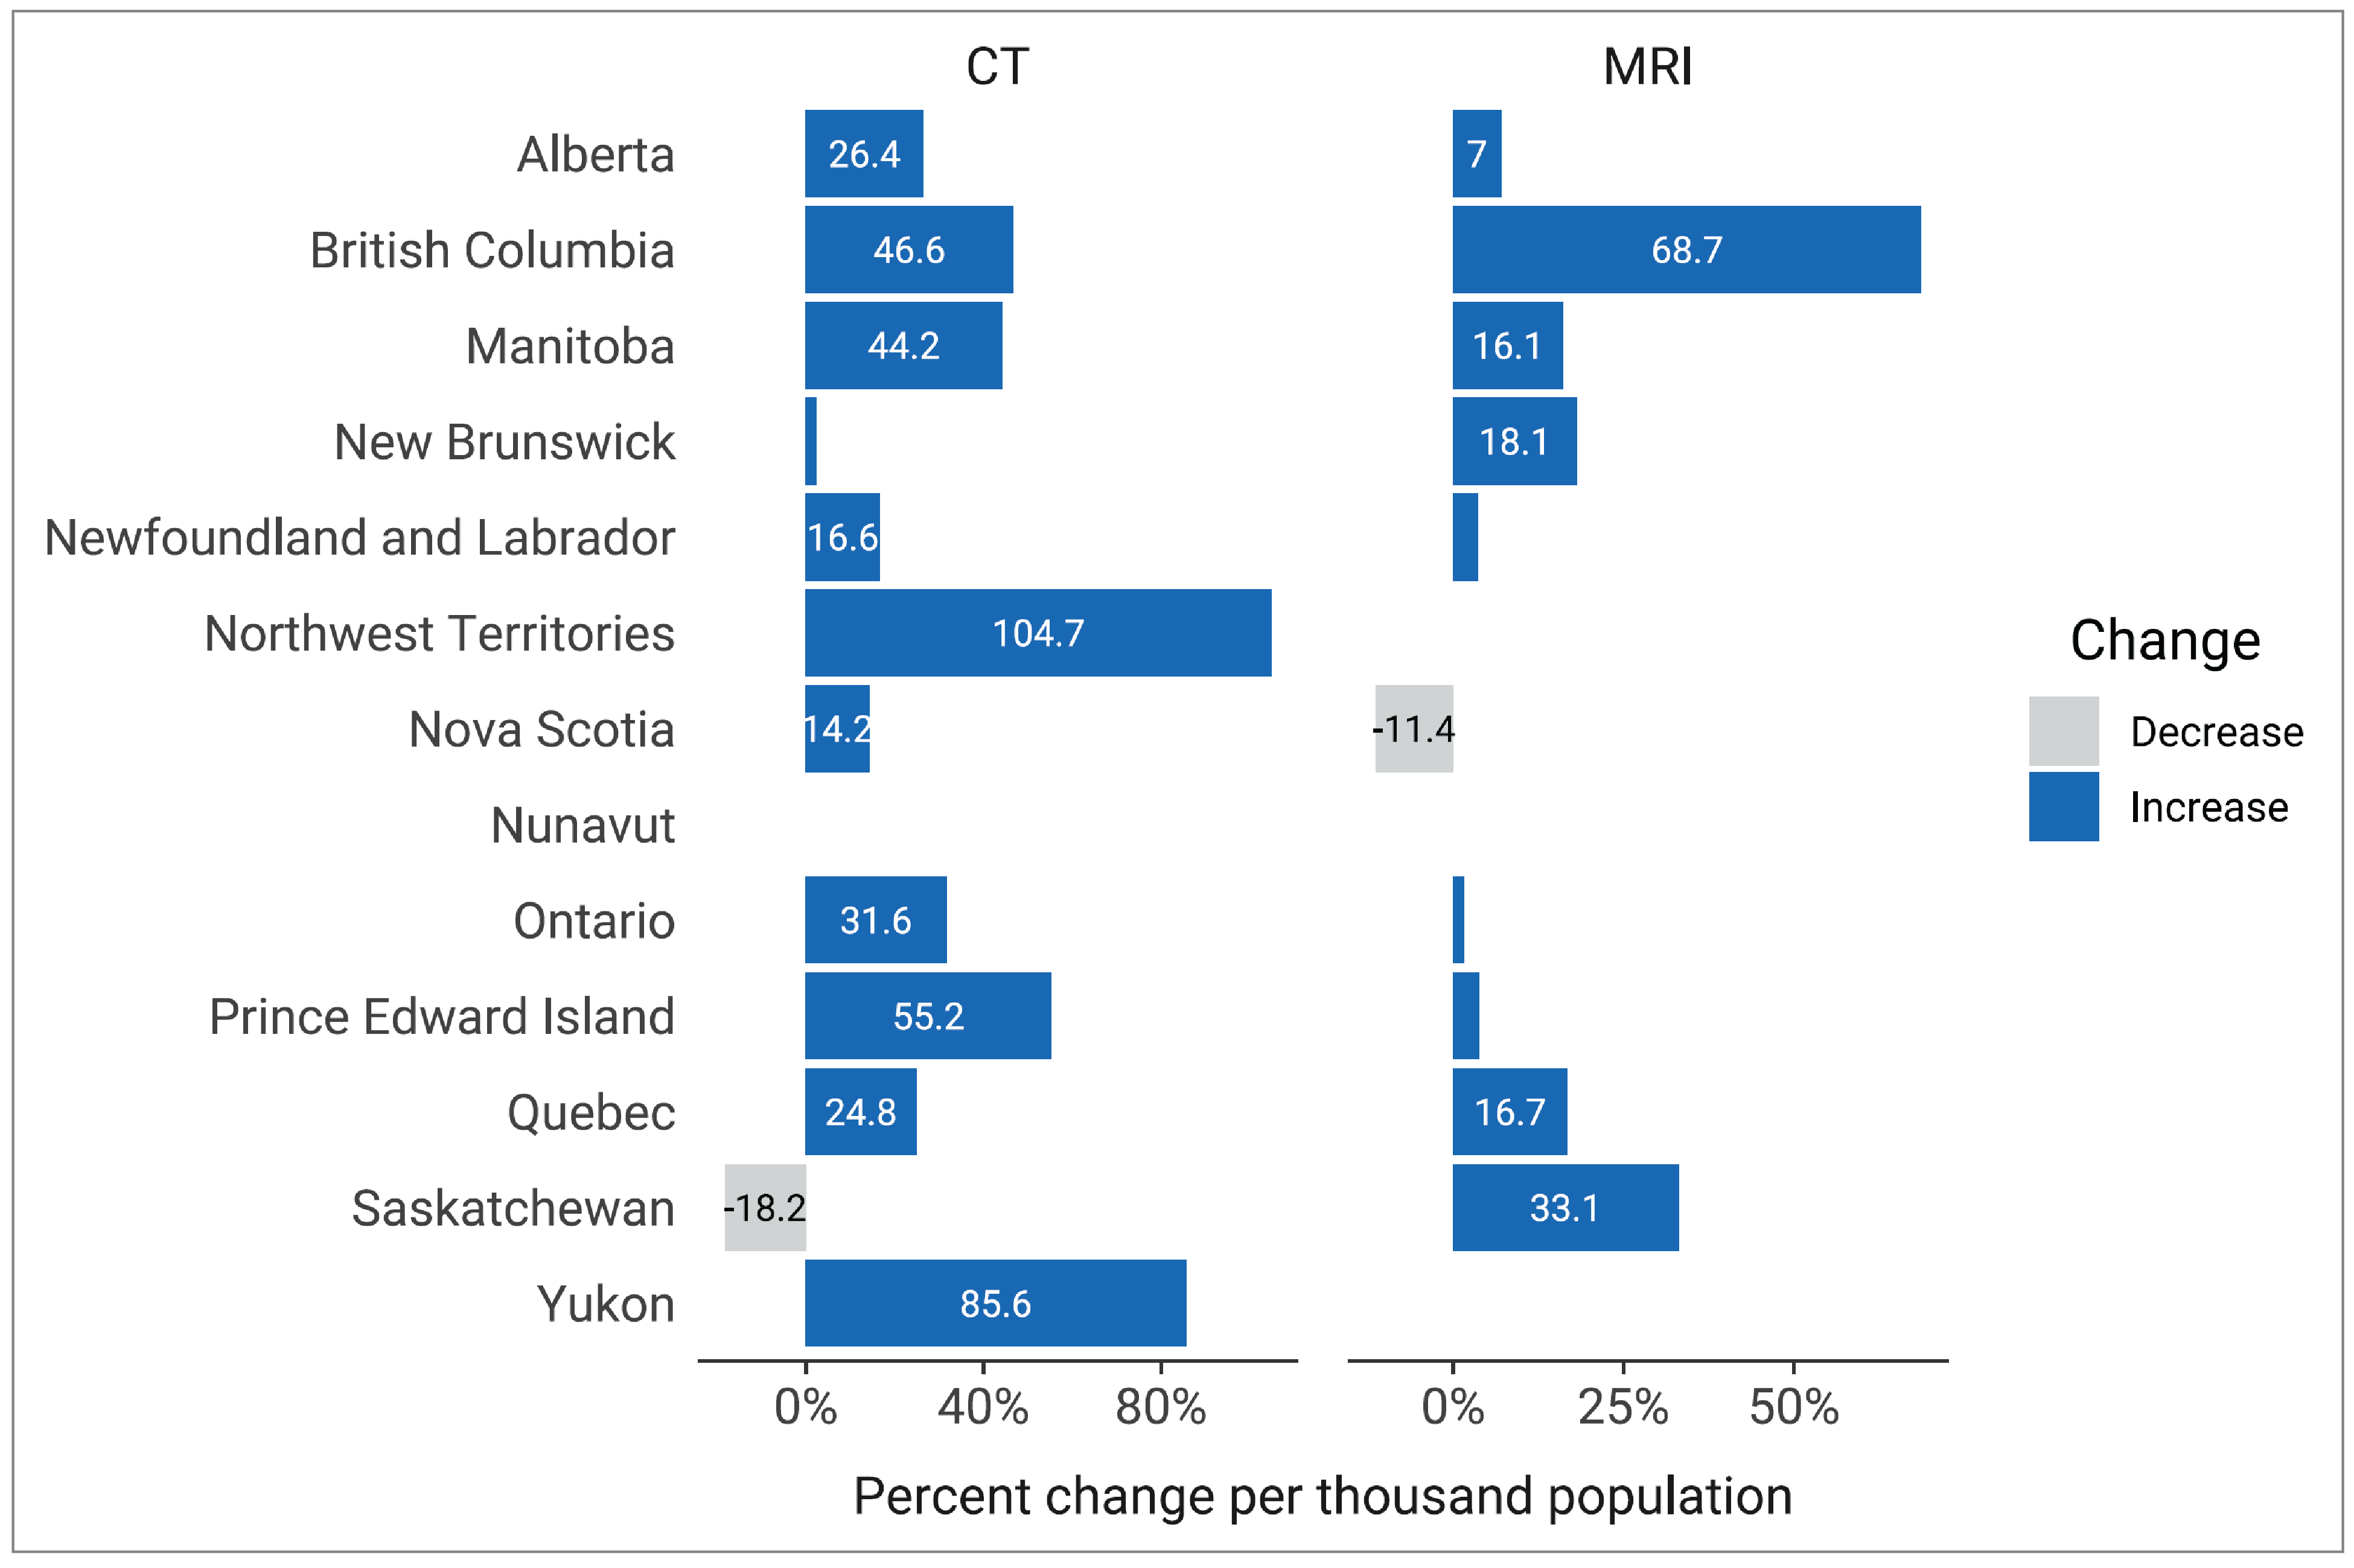
Notes: Jurisdiction-level survey data were used for 2012 and 2022–2023.
The x-axis scales for the number of units differ across graphs due to considerable variability in the total number of units for each modality.
Sources: Canadian Institute for Health Information (2012),15 CADTH (2020).6
MRI Exam Volume Changes Over a Decade
The overall volume of MRI exams in Canada increased by 28.8%, from 1,718,633 in 2012 to 2,214,157 exams in 2022–2023.
In 2012, approximately 69% of MRI exams were performed in Ontario and Quebec, compared to 65% in 2022–2023 (Figure 16).
MRI exam volume has experienced a 12.8% growth rate, increasing from 49.3 exams per 1,000 people in 2012 to 55.6 exams per 1,000 people in 2022–2023.
The number of MRI exams per 1,000 people increased for 9 of 10 jurisdictions with existing MRI capacity 10 years ago. The jurisdictions with the greatest growth in exams per 1,000 people were British Columbia (68.7%), Saskatchewan (33.1%), and New Brunswick (18.1%). One province experienced a decline in exams per 1,000 people (−11.4%).
Change in Number of Units Since the 2019–2020 Report
Compared to 2019 to 2022,6 there is an increase in the number of machines for all modalities, except SPECT, which has decreased. In most provinces, the number of SPECT units per population decreased, indicating that population growth outstripped installation. Provincial results for CT, MRI, PET-CT, and SPECT-CT were variable (Figure 17). Overall, Canada’s population has increased by 5.5% since 2019 (Figure 32).
CT Unit Changes Between 2019–20206 and 2022–2023
The overall number of CT units in Canada increased by 2.0%, from 549 units in 2019–2020 to 560 in 2022–2023 (Appendix 3, Table 16).
CT has fallen behind population growth by 3.4%, decreasing from 14.5 units per million people in 2019–2020 to 14.0 units per million people in 2022–2023.
The jurisdictions with the greatest growth in units per million people since 2019–2020 were Saskatchewan (8.1%), Ontario (7.8%), and Newfoundland and Labrador (4.5%) (Figure 17).
MRI Unit Changes Between 2019–20206 and 2022–2023
The overall number of MRI units in Canada increased by 14.3%, from 378 units in 2019–2020 to 432 in 2022–2023 (Appendix 3, Table 17).
MRI has experienced an 8% growth rate, increasing from 10 units per million people in 2019–2020 to 10.8 units per million people in 2022–2023.
The jurisdictions with the greatest growth in units per million people since 2019–2020 were Ontario (18.8%) and Quebec (15.8%) (Figure 17).
PET-CT Unit Changes Between 2019–20206 and 2022–2023
The overall number of PET-CT units in Canada increased by 5.3%, from 57 units in 2019–2020 to 60 in 2022–2023 (Appendix 3, Table 18).
The number of PET-CT units in operation in Canada has kept pace with population growth, with 1.5 units per million people in both 2019–2020 and 2022–2023.
The jurisdictions with the greatest growth in units per million people since 2019–2020 were Alberta (22.2%) and British Columbia (12.5%) (Figure 17).
Figure 17: Percentage Change in Units per Million Population for Imaging Modalities, 2019–2020 to 2022–2023
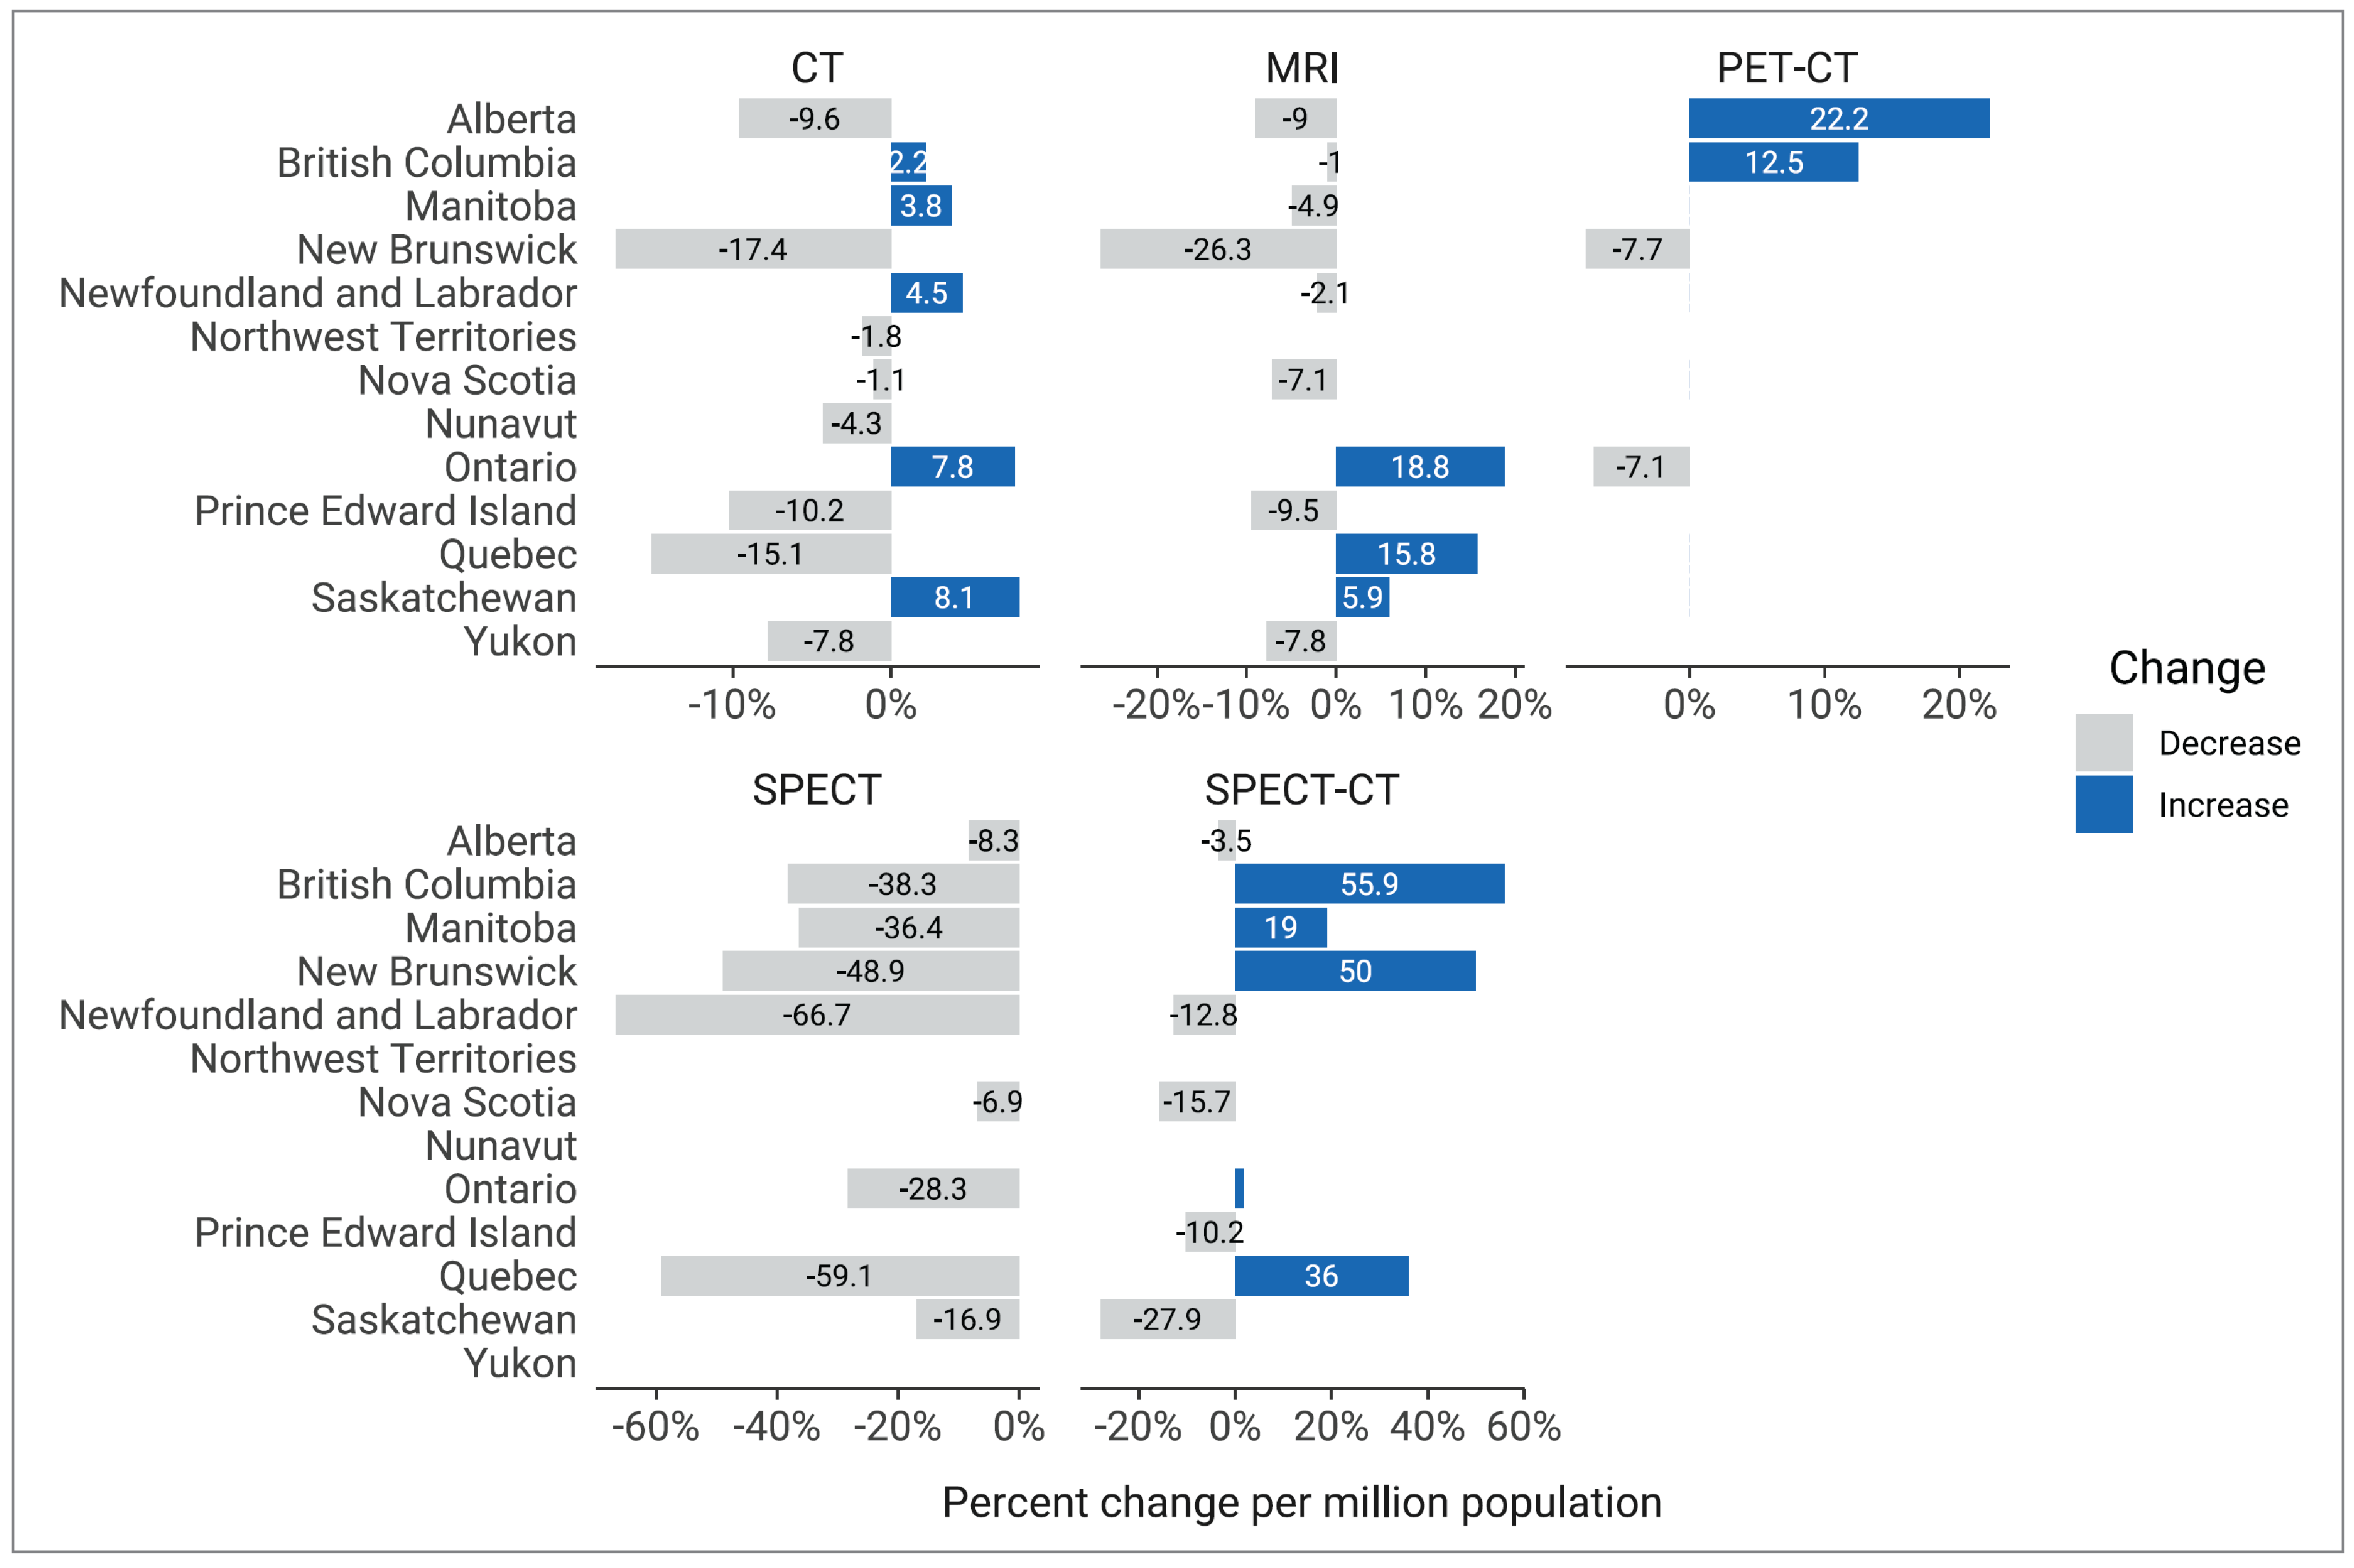
Note: The x-axis scales for the number of units differ across graphs due to considerable variability in the total number of units for each modality.
Sources: CADTH (2020),6 CADTH (2023).
SPECT Unit Changes Between 2019–20206 and 2022–2023
The overall number of SPECT units in Canada decreased by 31.1%, from 305 units in 2019–2020 to 210 in 2022–2023 (Appendix 3, Table 19).
SPECT has fallen behind population growth by 34.6%, decreasing from 8.1 units per million people in 2019–2020 to 5.3 units per million people in 2022–2023.
The operation of SPECT equipment per million population declined across all jurisdictions, possibly reflecting the replacement of SPECT by the hybrid modality (Figure 17).
The overall number of SPECT-CT units in Canada increased by 22.1%, from 271 units in 2019–2020 to 331 in 2022–2023 (Appendix 3, Table 20).
SPECT-CT has experienced a 15.3% growth rate, increasing from 7.2 units per million people in 2019–2020 to 8.3 units per million people in 2022–2023.
The jurisdictions with the greatest growth in units per million people since 2019–2020 were British Columbia (55.9%), New Brunswick (50%), and Quebec (36%) (Figure 17).
PET-MRI Unit Changes Between 2019–20206 and 2022–2023
The overall number of PET-MRI units in Canada increased by 20%, from 5 units in 2019–2020 to 6 in 2022–2023.
PET-MRI has experienced a 100% growth rate, increasing from 0.1 units per million people in 2019–2020 to 0.2 units per million people in 2022–2023.
Change in Exam Volume Since the 2019–2020 Report
Between 2019–20206 and 2022–2023, the overall volume of publicly funded CT, MRI, and PET-CT exams both increased and outpaced population growth in Canada, while SPECT and SPECT-CT exams have both declined and fallen behind population growth (Figure 18).
CT Exam Volume Changes Between 2019–20206 and 2022–2023
The overall volume of CT exams in Canada increased by 18.4%, from 5,393,052 in 2019–2020 to 6,385,665 exams in 2022–2023.
CT exam volume has experienced a 12.3% growth rate, increasing from 142.7 exams per 1,000 people in 2019–2020 to 160.2 exams per 1,000 people in 2022–2023.
The jurisdictions with the greatest growth in exams per 1,000 people were the Northwest Territories (49.6%), Nunavut (34.3%), and Saskatchewan (27.8%) (Figure 18).
MRI Exam Volume Changes Between 2019–20206 and 2022–2023
The overall volume of MRI exams in Canada increased by 10.0%, from 2,013,730 in 2019–2020 to 2,214,157 exams in 2022–2023.
MRI exam volume has experienced a 4.3% growth rate, increasing from 53.3 exams per 1,000 people in 2019–2020 to 55.6 exams per 1,000 people in 2022–2023.
The jurisdictions with the greatest growth in exams per 1,000 people were Yukon (25.7%), British Columbia (11.1%), and Ontario (9.7%) (Figure 18).
PET-CT Exam Volume Changes Between 2019–20206 and 2022–2023
The overall volume of PET-CT exams in Canada increased by 26.6%, from 123,507 in 2019–2020 to 156,320 exams in 2022–2023.
PET-CT exam volume has experienced an 18.2% growth rate, increasing from 3.3 exams per 1,000 people in 2019–2020 to 3.9 exams per 1,000 people in 2022–2023.
The jurisdictions with the greatest growth in exams per 1,000 people were Saskatchewan (58.8%), New British Columbia (31.8%), and Newfoundland and Labrador (27.3%) (Figure 18).
Figure 18: Percentage Change in Exams per 1,000 Population, 2019–2020 to 2022–2023
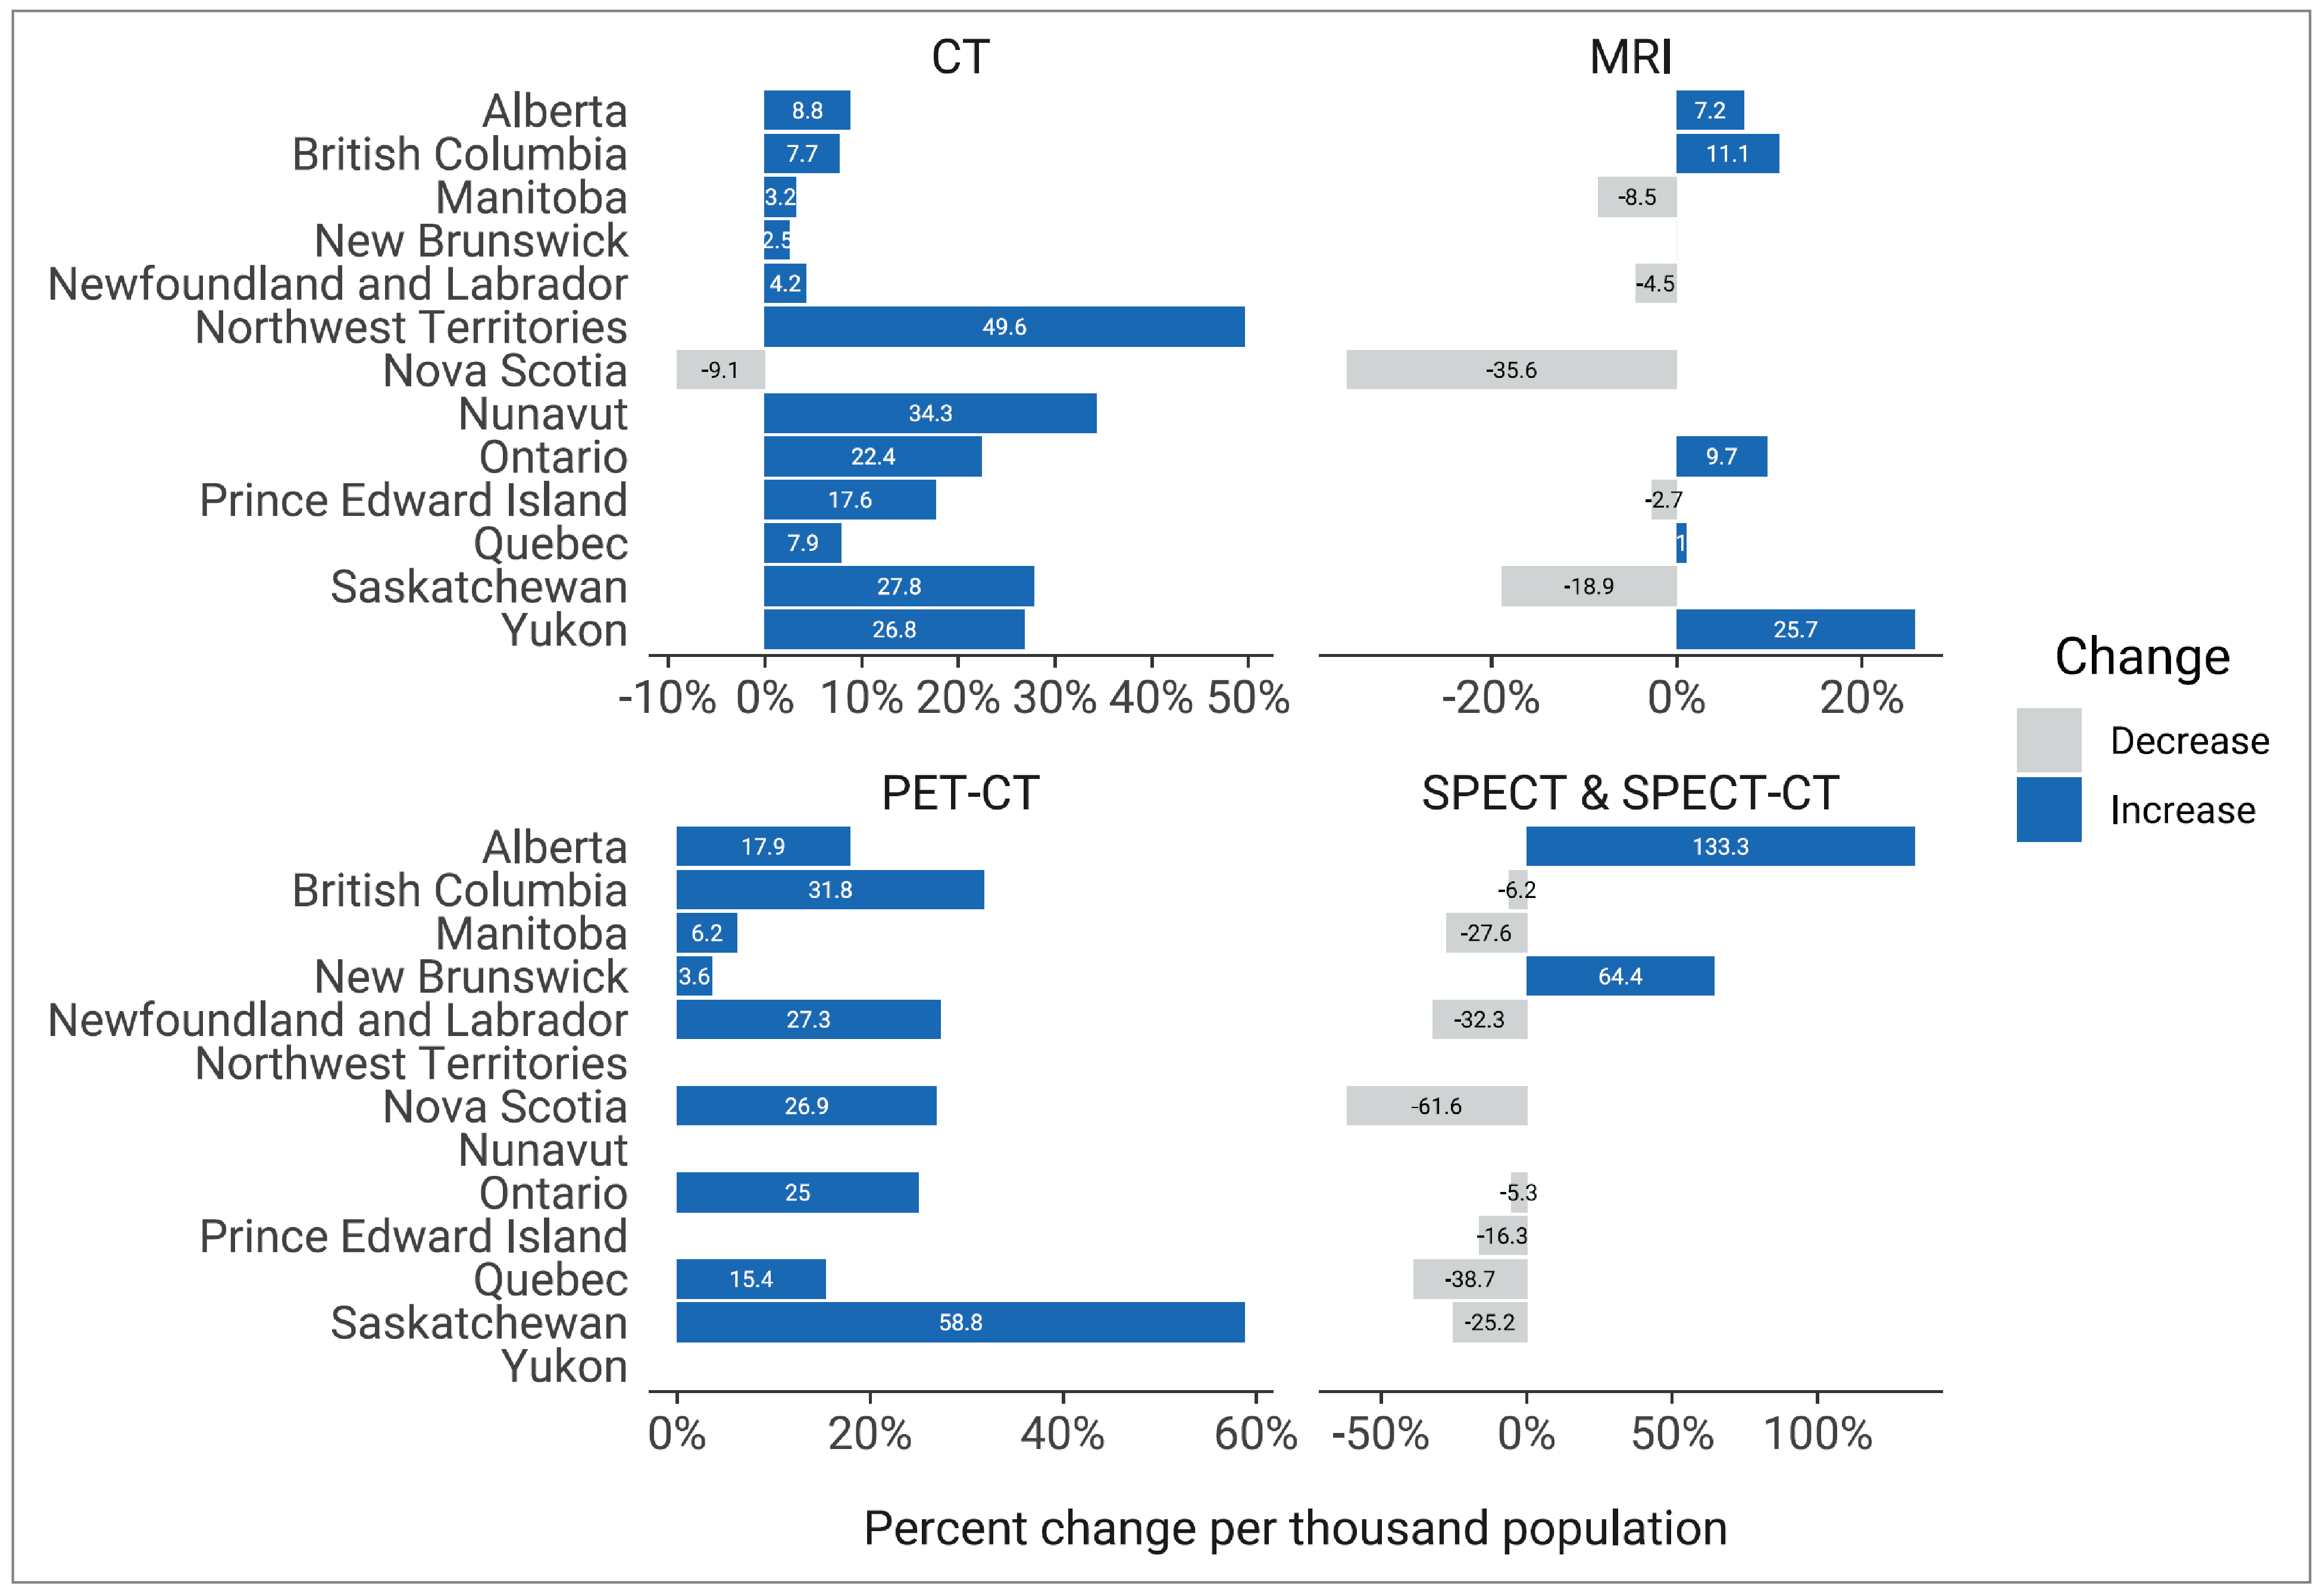
Note: The x-axis scales for the number of exams differ across graphs due to considerable variability in the total number of exams for each modality.
Sources: CADTH (2020),6 CADTH (2023).
SPECT and SPECT-CT Exam Volume Changes Between 2019–2020 and 2022–20236
The overall volume of SPECT and SPECT-CT exams in Canada decreased by 23.3% from 1,210,993 in 2019–2020 to 929,010 exams in 2022–2023.
Multiple jurisdictions reported combined SPECT and SPECT-CT exams. The combined SPECT and SPECT-CT exam volume has fallen behind population growth by 27.2%, decreasing from 32 exams per 1,000 people in 2019–2020 to 23.3 exams per 1,000 people in 2022–2023.
Only 2 jurisdictions reported growth in exams per 1,000 people since 2019–2022: Alberta (133.3%) and New Brunswick (64.4%) (Figure 18).
PET-MRI Exam Volume Changes Between 2019–20206 and 2022–2023
The overall volume of PET-MRI exams in Canada has remained stable at 1,200 exams in both 2019–2020 and 2022–2023.
International Comparisons
Data From Canada Compared with International Data
The CMII compared unit counts in Canada with exam volume data with that in other Organisation for Economic Co-operation and Development (OECD) countries. Information was available for CT, MRI, and PET-CT.
Overall, Canada ranked below the OCED average for CT, MRI, and PET-CT units per million population and exams per 1,000 population.29-34
For CT units, Canada is below the OECD average of 29.9 per million population at 14.0 per million population, ranking 30th among 34 countries (Figure 19).33 Similarly, Canada ranks below the OECD average of 161.7 exams per 1,000 population at 160.2 per 1,000 population, ranking 12th among 28 countries (Figure 20).34
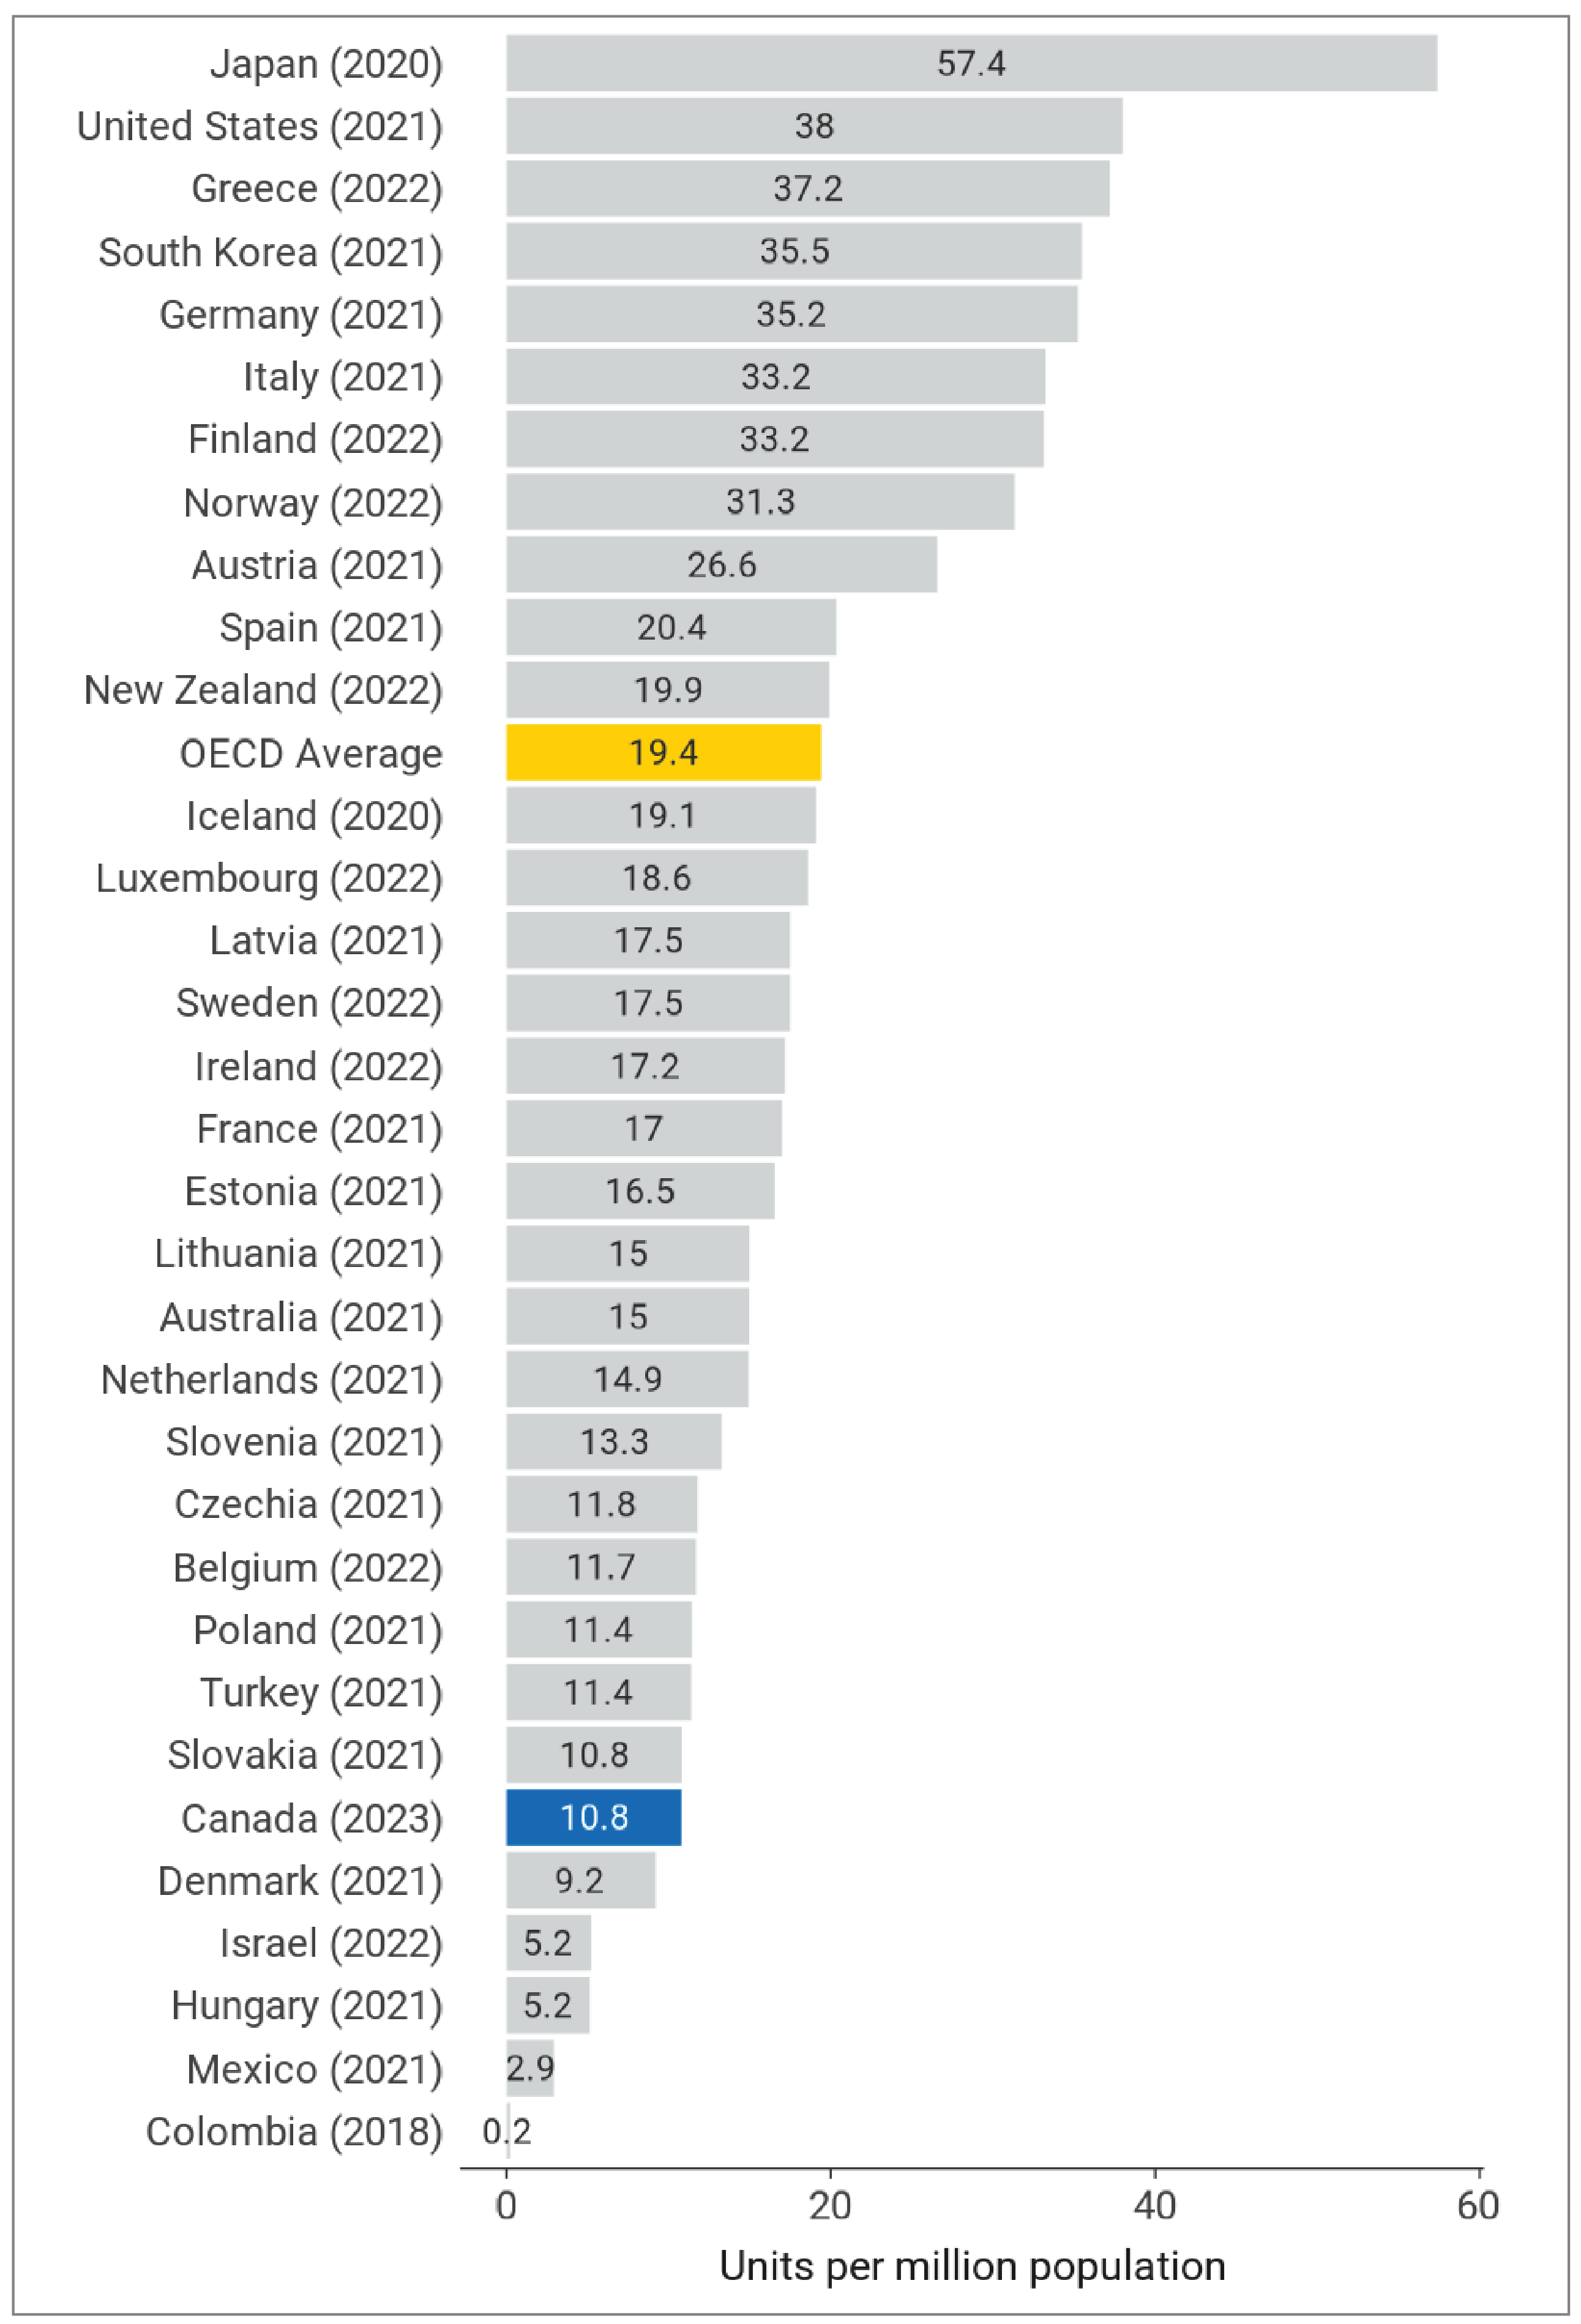
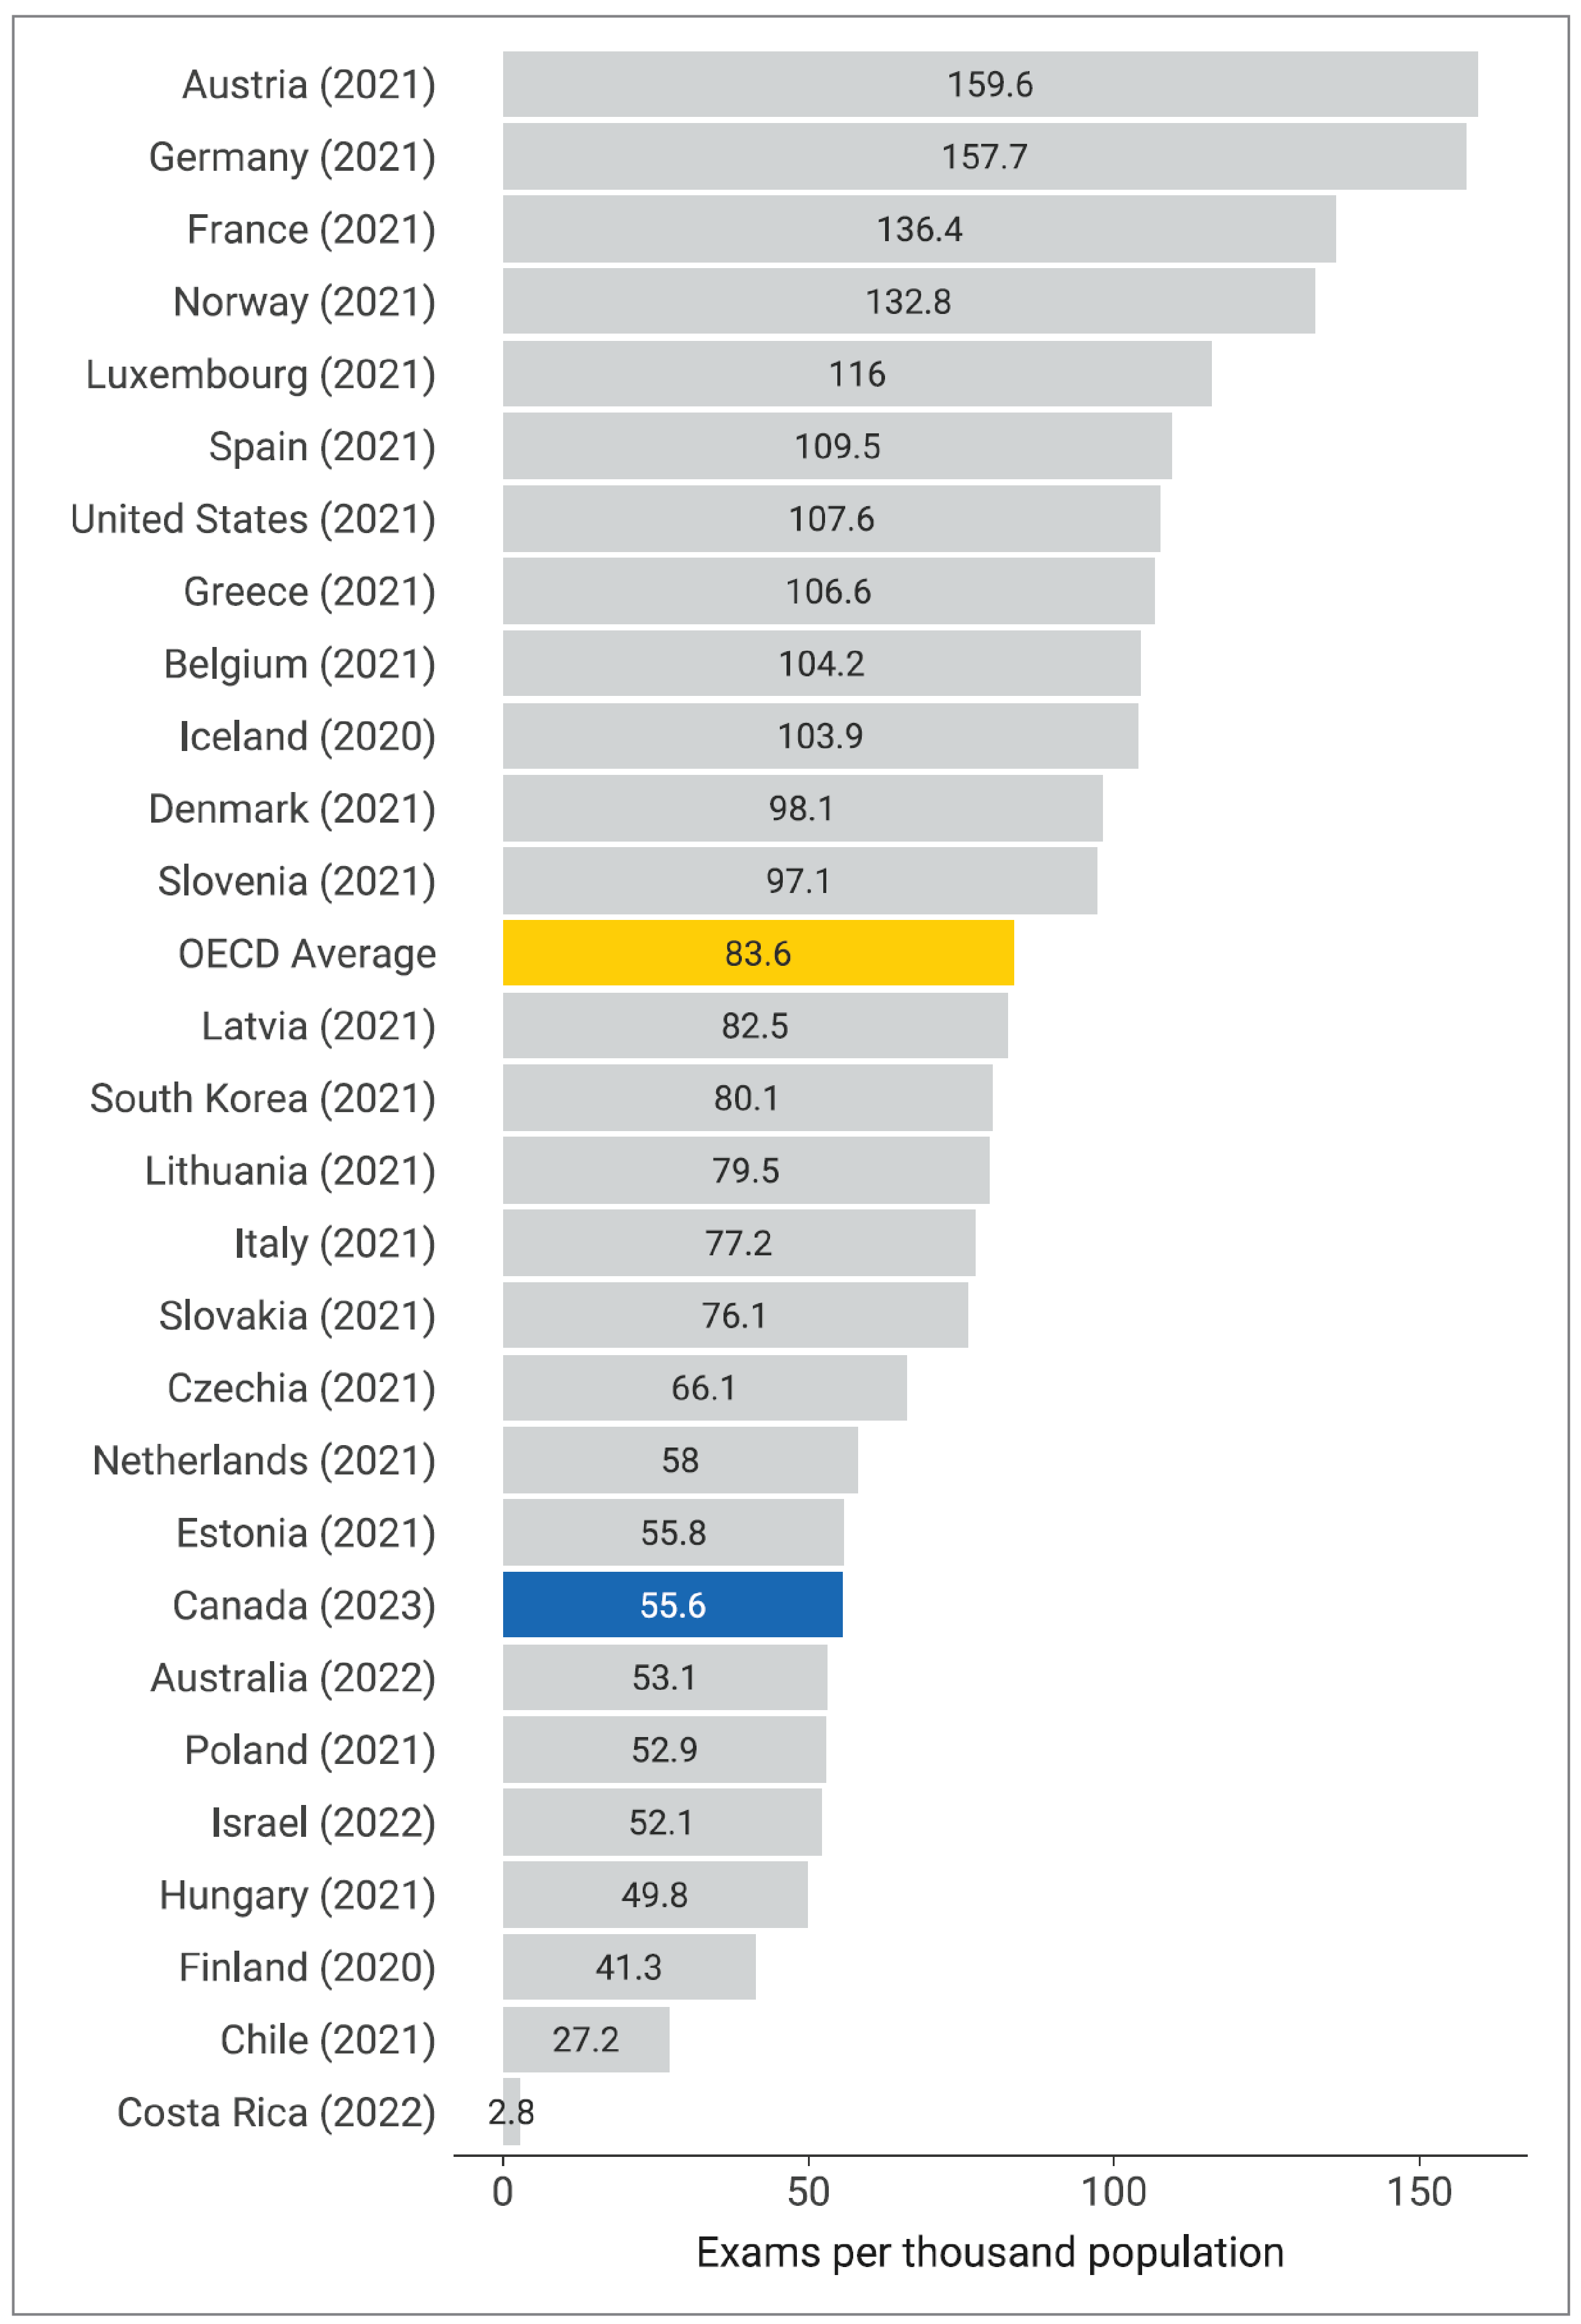
For MRI units, Canada is below the OECD average of 19.4 per million population at 10.8 per million population, ranking 28th among 33 countries (Figure 21).33 Similarly, Canada ranks below the OECD average of 83.6 exams per 1,000 population at 55.6 per 1,000 population, ranking 21st among 28 countries (Figure 22).32
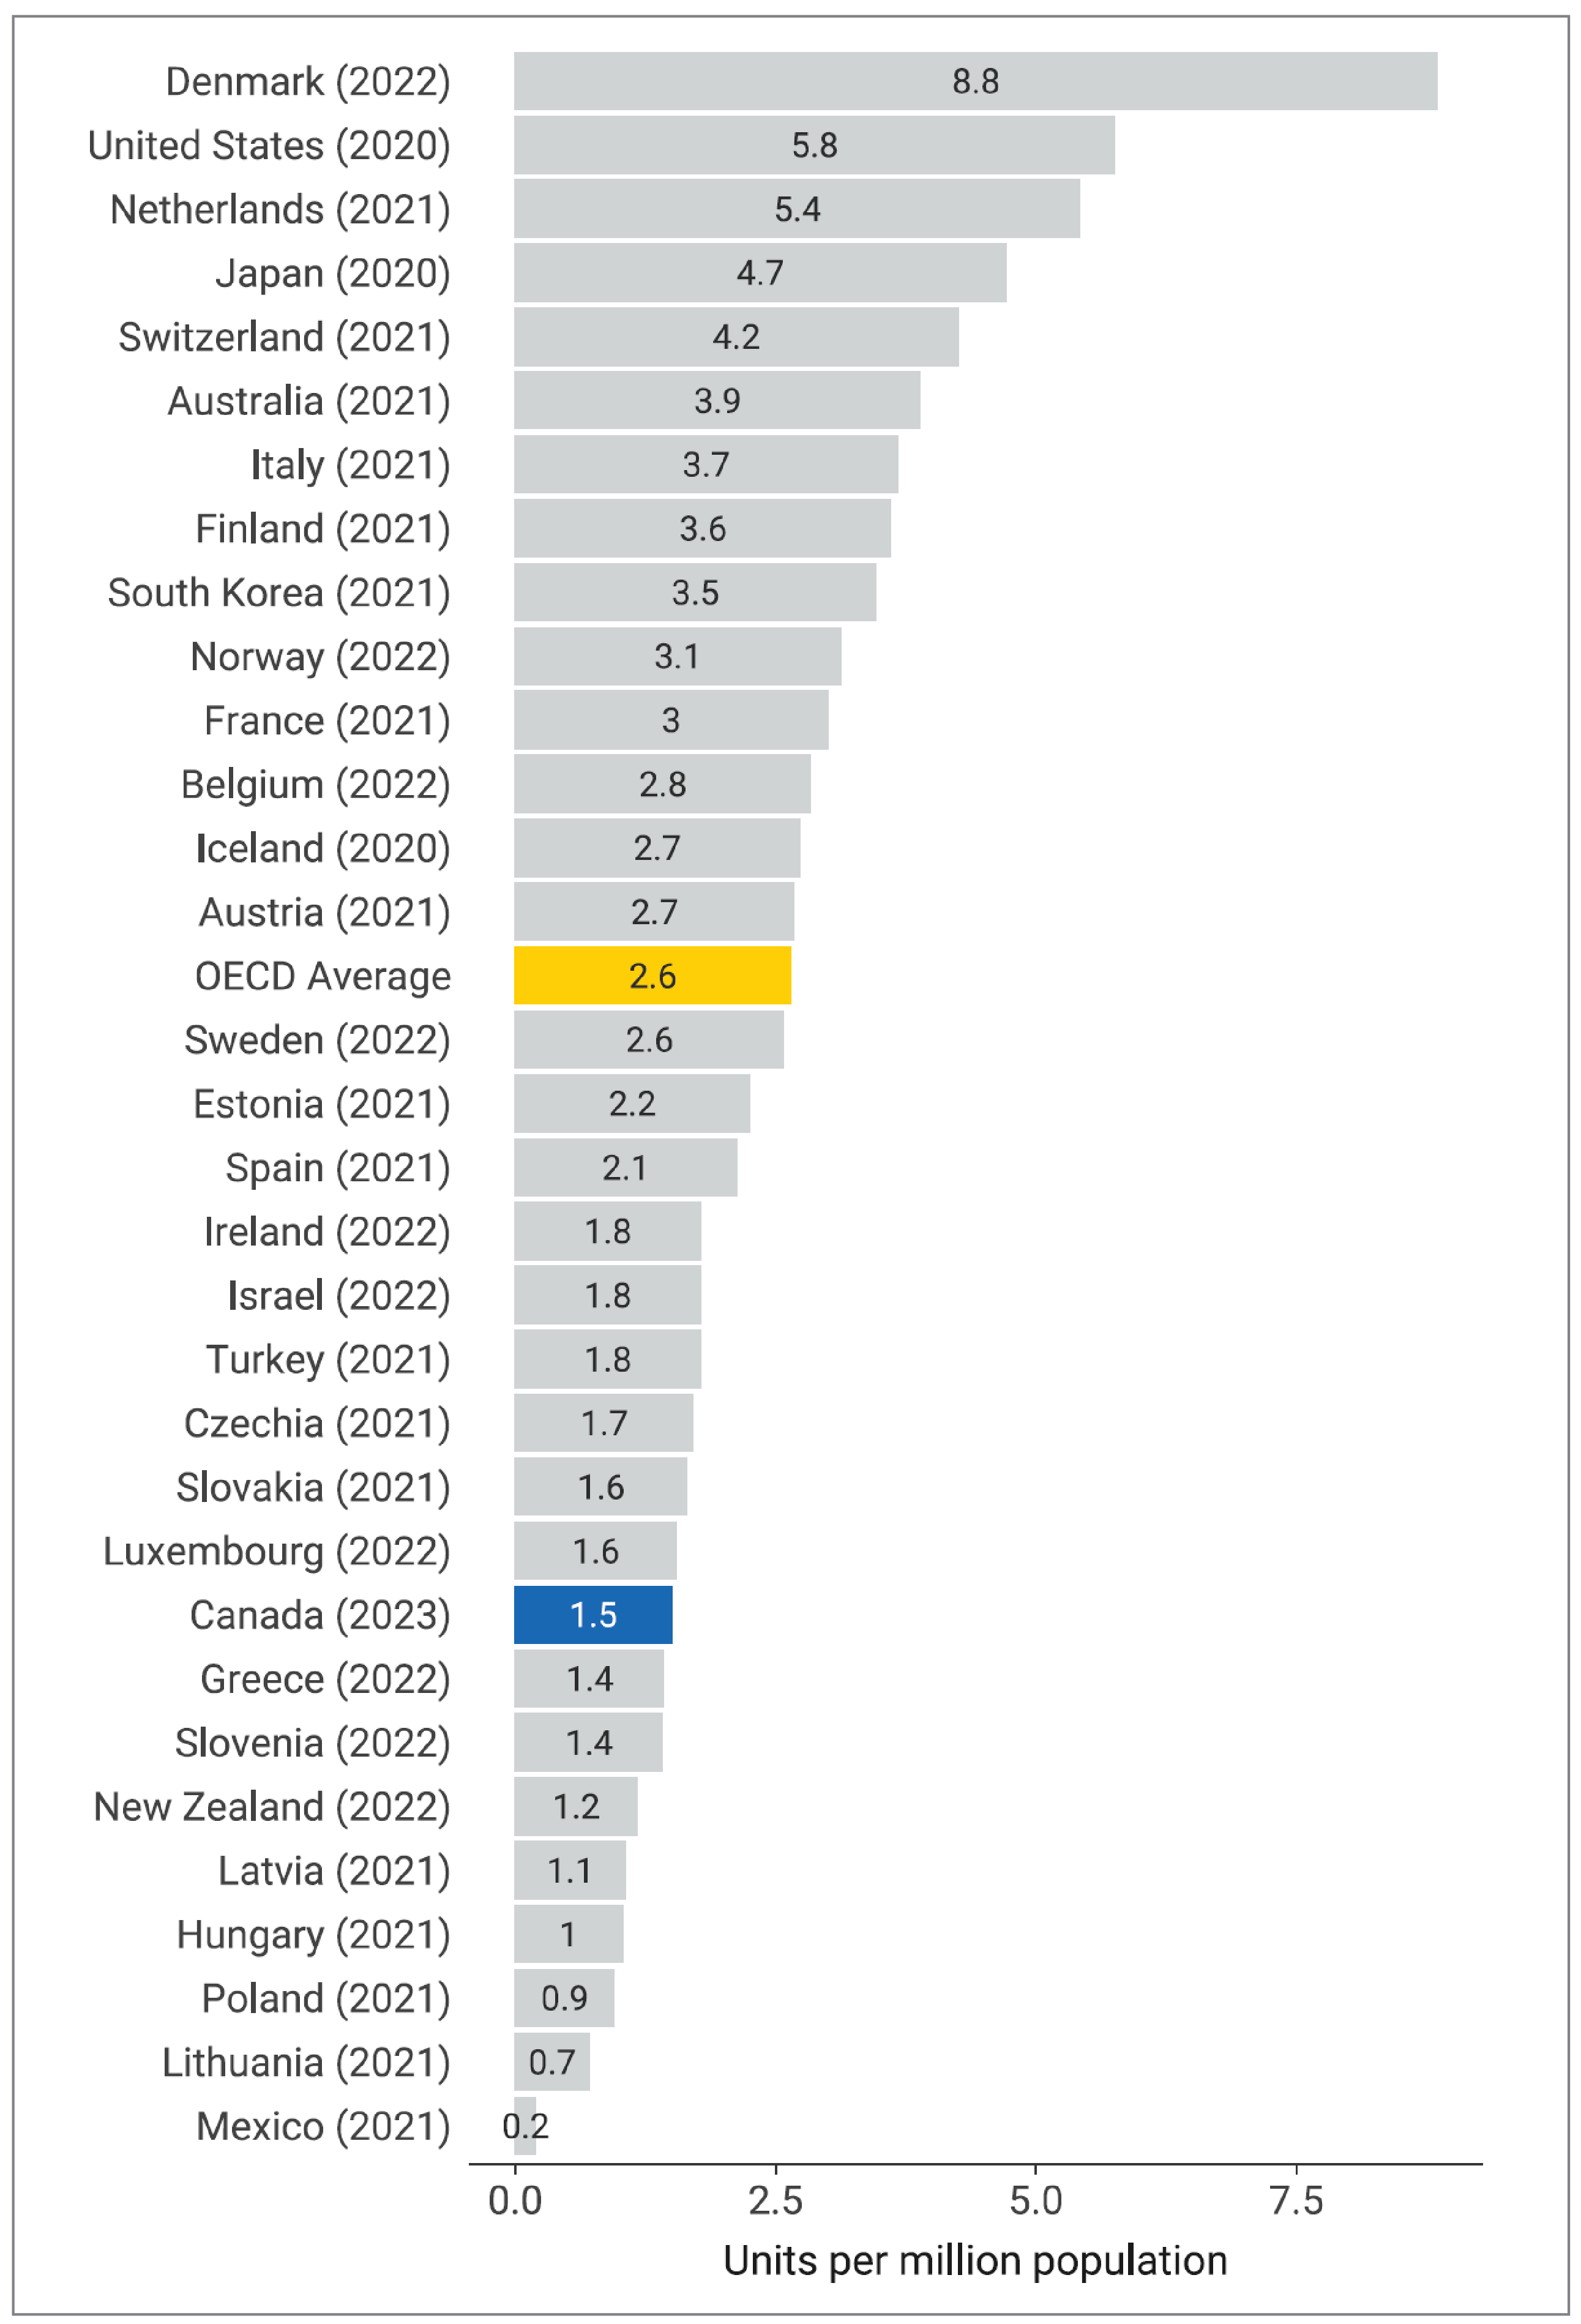
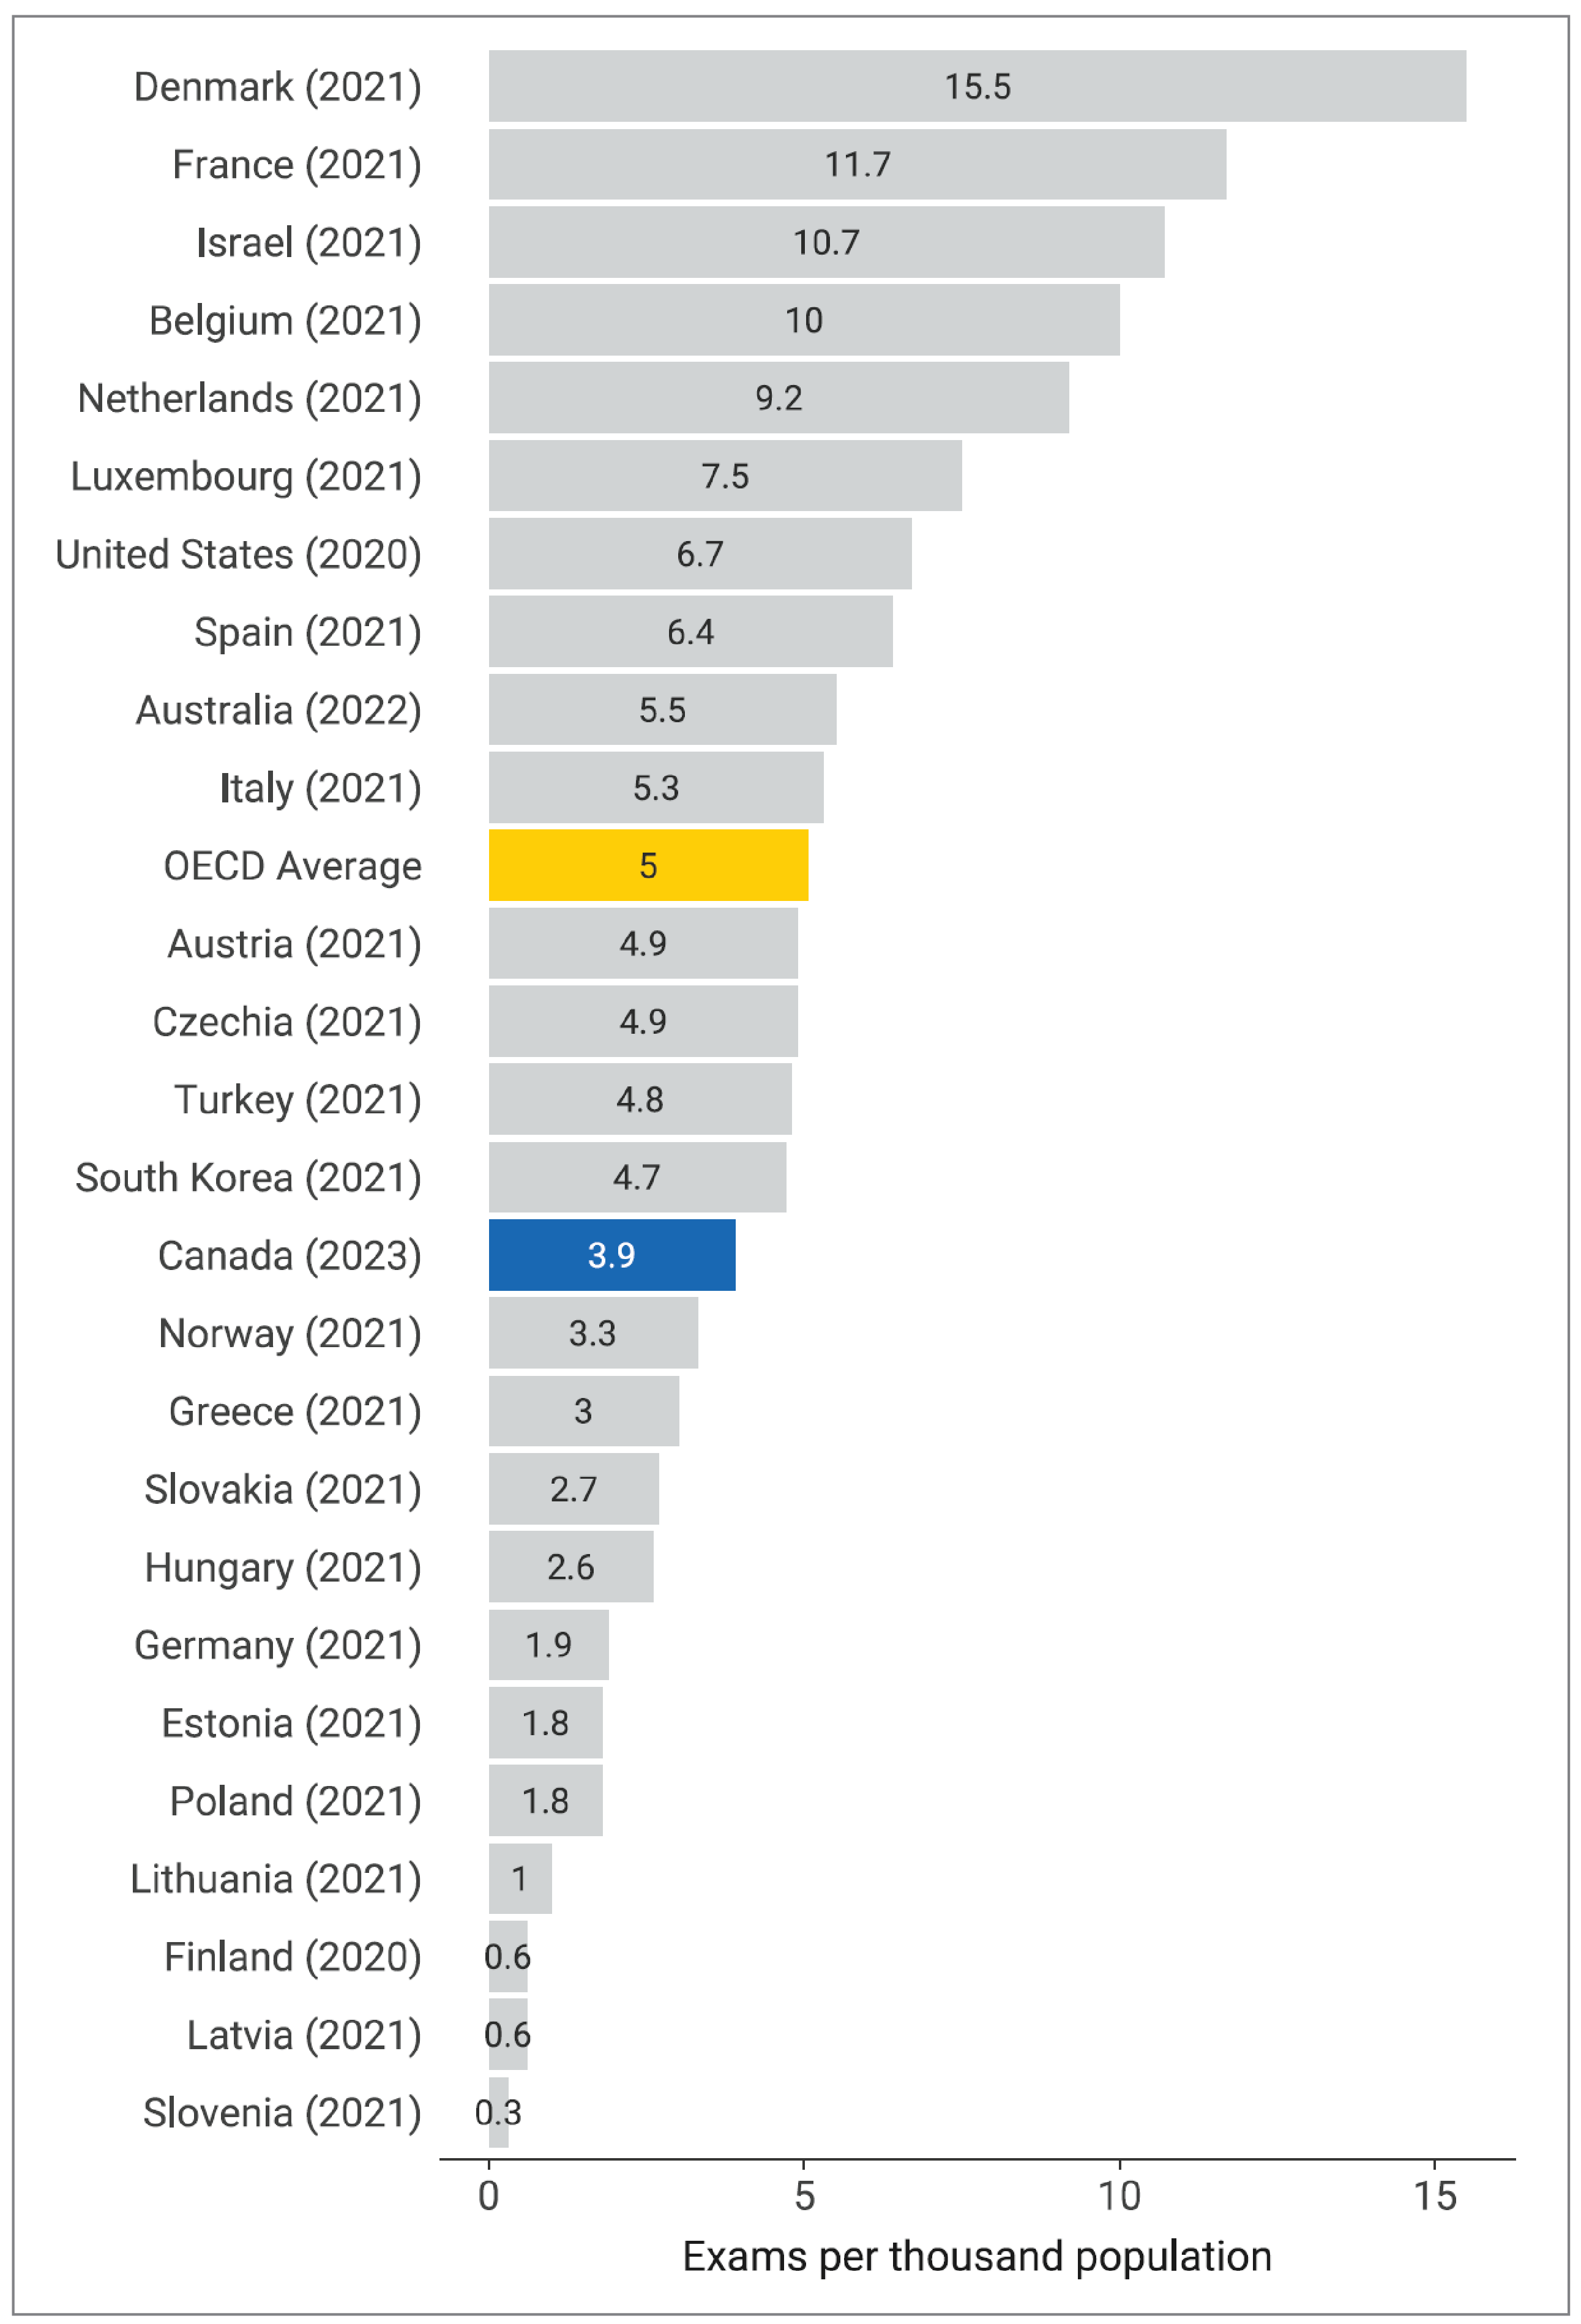
For PET-CT units, Canada is below the OECD average of 2.6 per million population at 1.5 per million population, ranking 24th among 32 countries (Figure 23). Similarly, Canada ranks below the OECD average of 5.0 exams per 1,000 population at 3.9 per 1,000 population, ranking 15th among 26 countries (Figure 24).34
Canada’s position relative to international comparators is not substantively different from other years comparisons were reported, generally ranking between the lower tertile and the average.6,15-18
Differences regarding how countries count units and exams may influence the true number of exams performed in OECD countries, thus affecting the OECD average and the ranking of countries.
There is no international benchmark or guidance regarding the ideal number of imaging units per million population. Nonetheless, there is a general assumption that too few units may lead to access problems in terms of geographic proximity and wait times, while too many may result in low-value imaging that delivers no clear benefit.35
CT Units
Among the 34 OECD countries with information,33 Canada ranked 30th in CT units per million population, based on the statistics in the years with the most recent information available (Figure 19).
Figure 19: Comparison of CT Units per Million Population in Canada and OECD Countries, 2022–2023
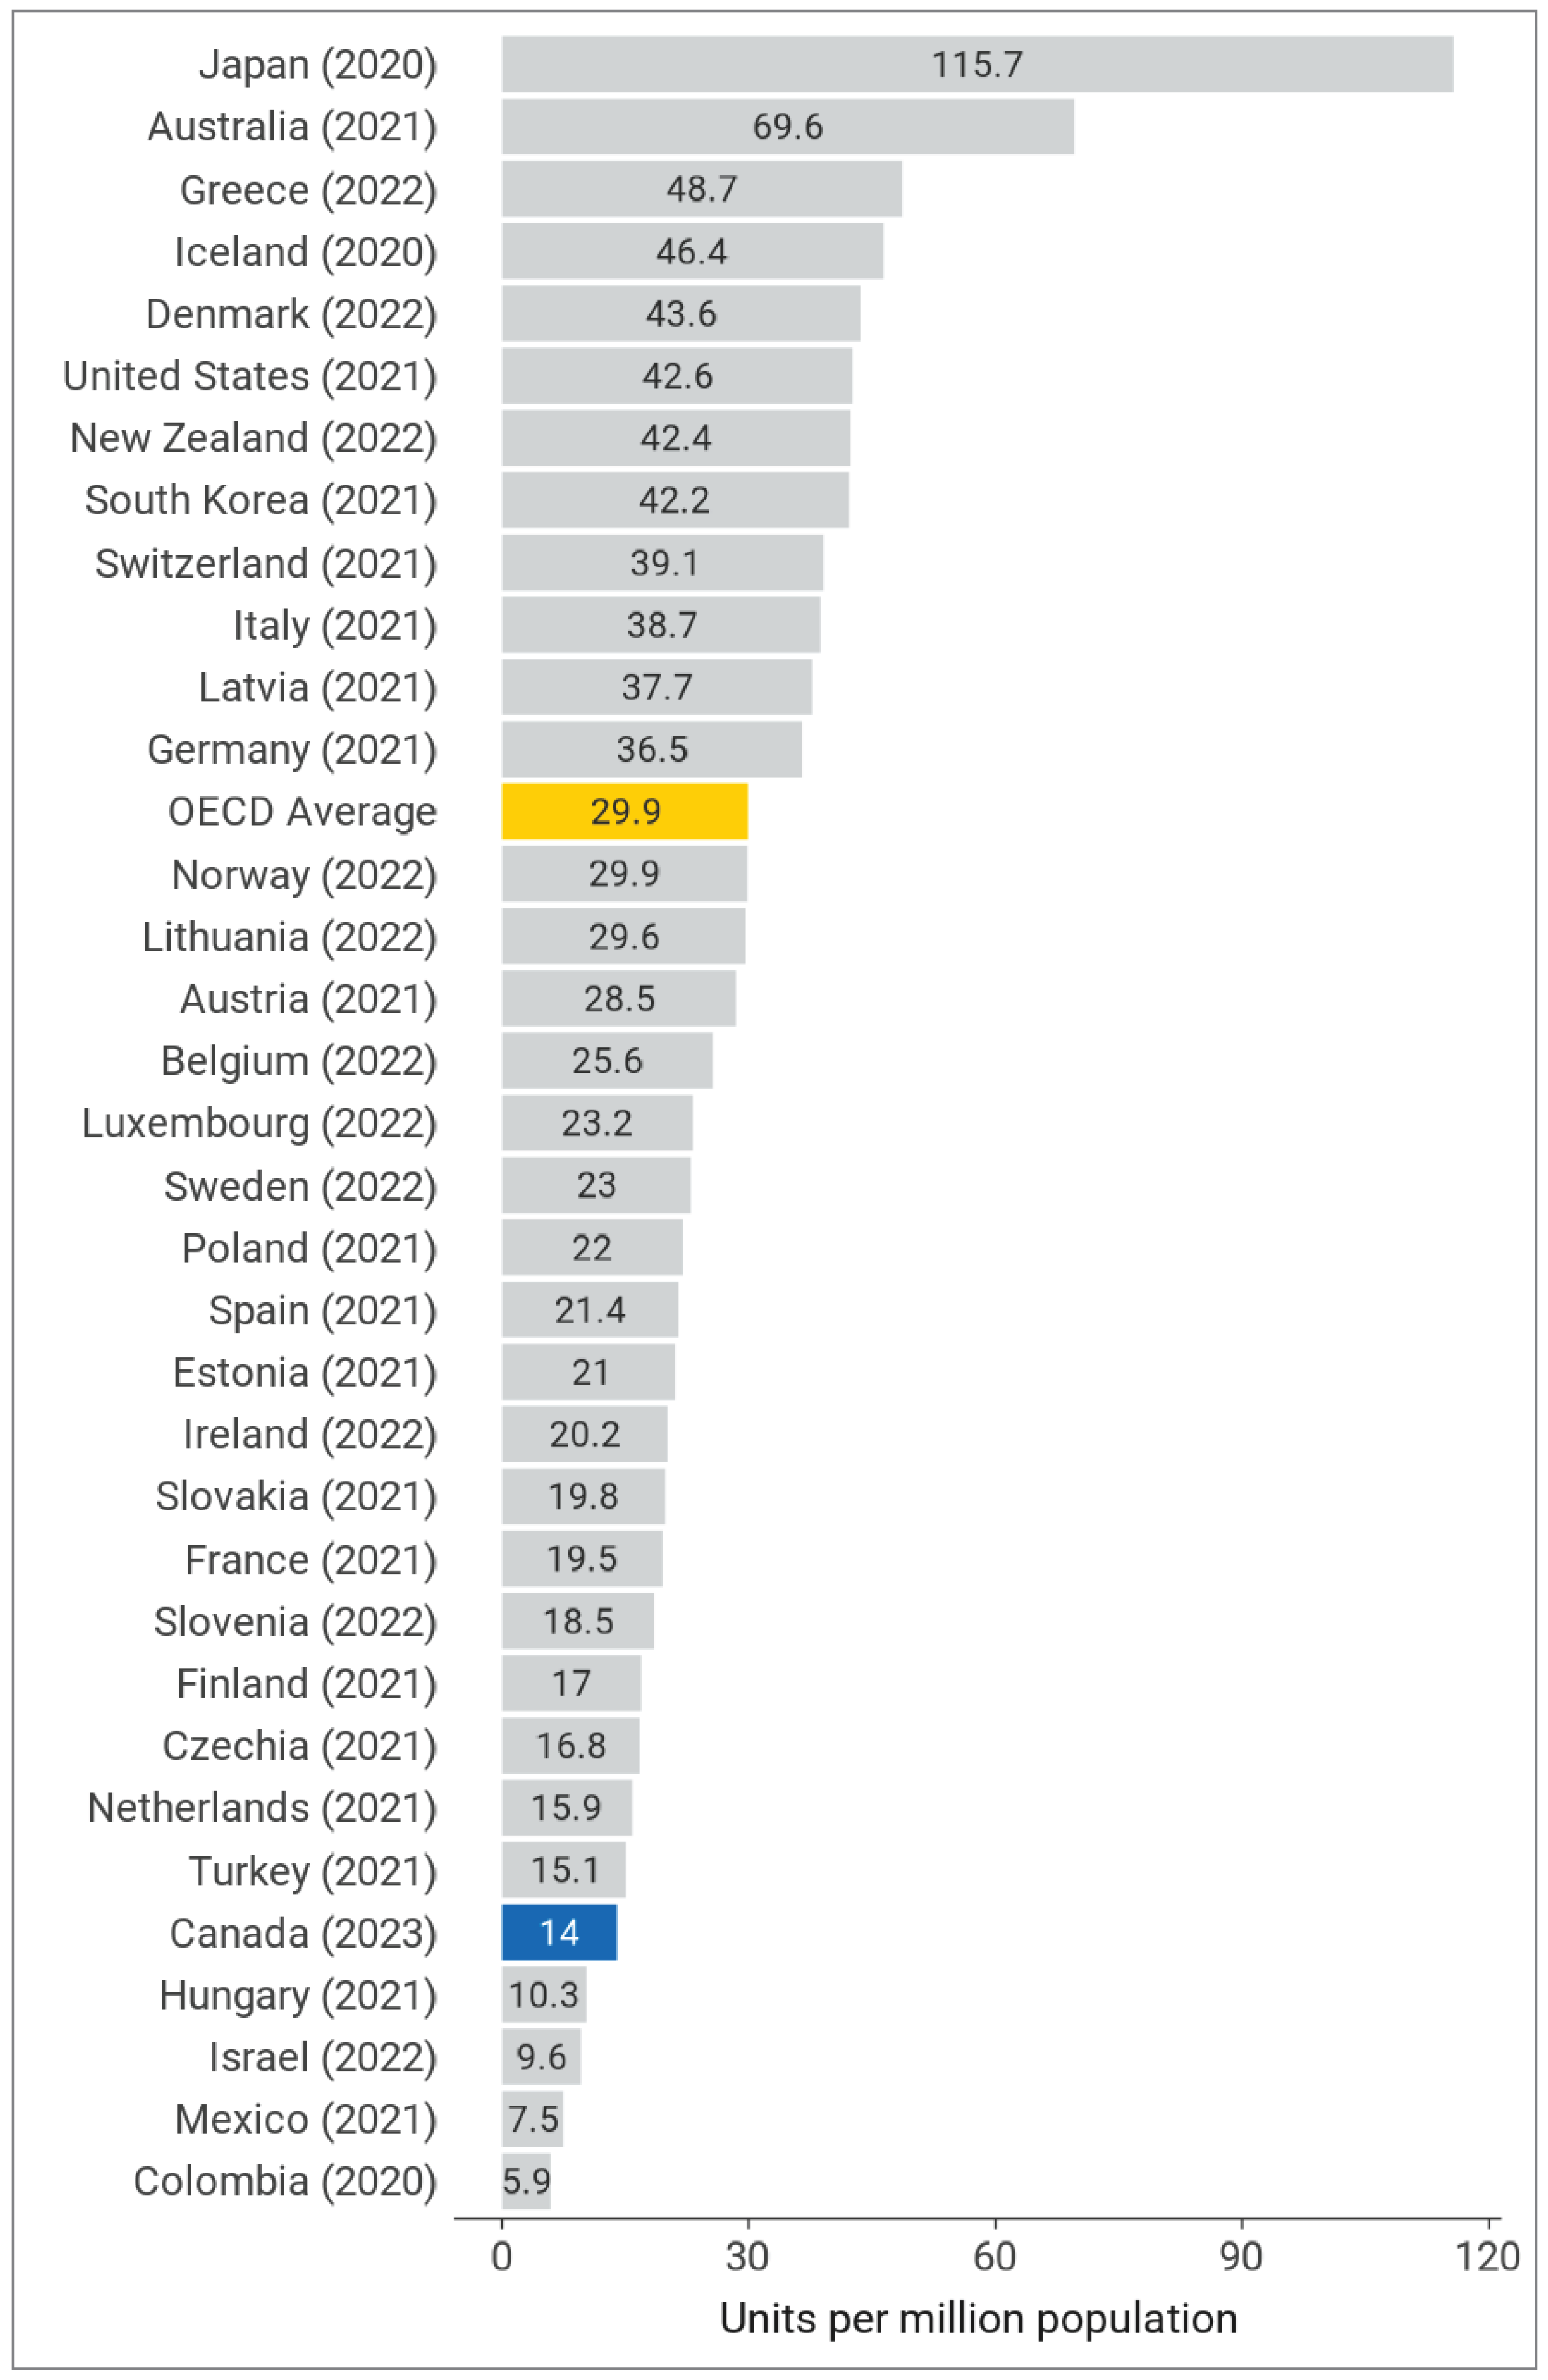
OECD = Organisation for Economic Co-operation and Development.
Note: The year for each country is the most recent year with data available (refer to OECD Data Explorer for details). OECD data retrieved on October 30, 2023.
CT Exams
Among the 28 OECD countries with information,34 Canada ranked 12th in the volume of CT exams per 1,000 population, based on the statistics in the years with the most recent information available (Figure 20).
Figure 20: Comparison of CT Exams per 1,000 Population in Canada and OECD Countries, 2022–2023
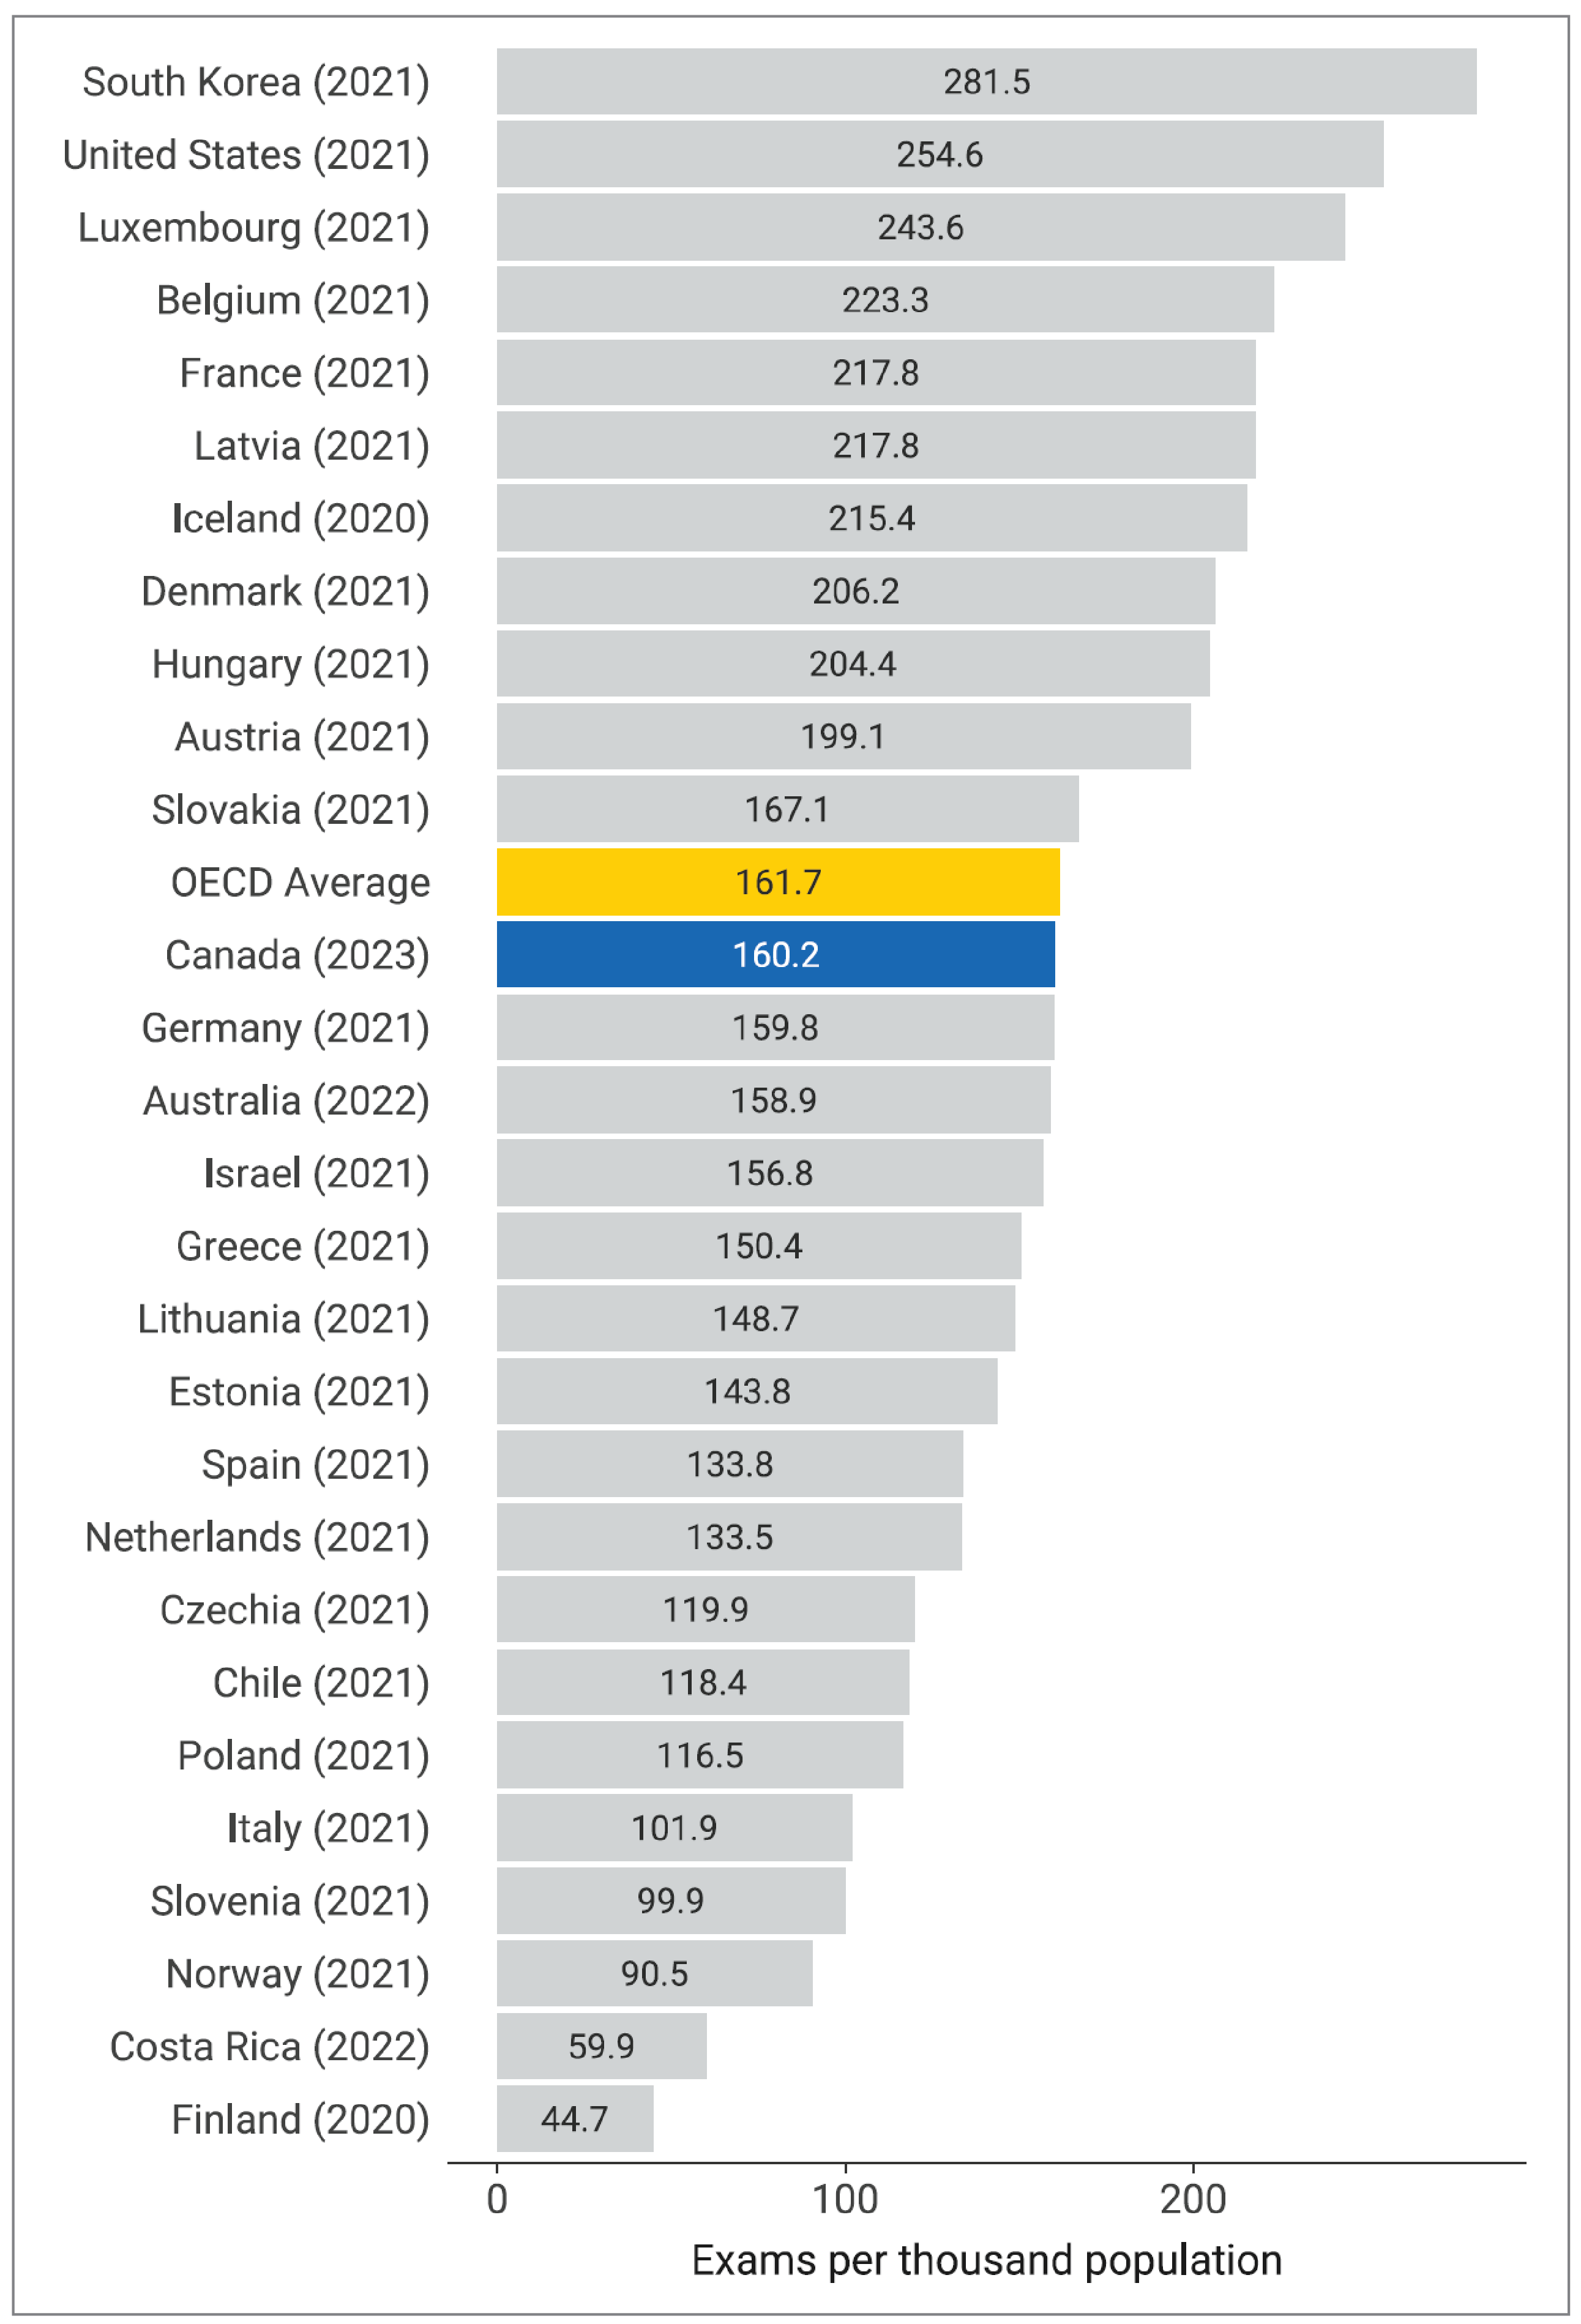
OECD = Organisation for Economic Co-operation and Development.
Note: The year for each country is the most recent year with data available (refer to OECD Data Explorer for details). OECD data retrieved on October 30, 2023.
MRI Units
Among the 33 OECD countries with information,35 Canada ranked 28th in MRI units per million population, based on the statistics in the years with the most recent information available (Figure 21).
Figure 21: Comparison of MRI Units per Million Population in Canada and OECD Countries, 2022–2023
OECD = Organisation for Economic Co-operation and Development.
Note: The year for each country is the most recent year with data available (refer to OECD Data Explorer for details). OECD data retrieved on October 30, 2023.
MRI Exams
Among the 28 OECD countries with information,32 Canada ranked 21st in volume of MRI exams per 1,000 population, based on the statistics in the years with the most recent information available (Figure 22).
Figure 22: Comparison of MRI Exams per 1,000 Population in Canada and OECD Countries, 2022–2023
OECD = Organisation for Economic Co-operation and Development.
Note: The year for each country is the most recent year with data available (refer to OECD Data Explorer for details). OECD data retrieved on October 30, 2023.
PET-CT and PET Units
Among the 32 OECD countries with information,34 Canada ranked 24th in PET or PET-CT units per million population, based on the statistics in the years with the most recent information available (Figure 23).
Figure 23: Comparison of PET or PET-CT Units per Million Population in Canada and OECD Countries, 2022–2023
OECD = Organisation for Economic Co-operation and Development.
Note: The year for each country is the most recent year with data available (refer to OECD Data Explorer for details). OECD data retrieved on October 30, 2023.
PET-CT and PET Exams
Among the 26 OECD countries with information,34 Canada ranked 15th in the volume of PET or PET-CT exams per 1,000 population based on the statistics in the years with the most recent information (Figure 24).
Figure 24: Comparison of PET and PET-CT Exams per 1,000 Population in Canada and OECD Countries, 2022–2023
OECD = Organisation for Economic Co-operation and Development.
Note: The year for each country is the most recent year with data available (refer to OECD Data Explorer for details). OECD data retrieved on October 30, 2023.
Equipment Decision-Making Considerations
Jurisdictional validators across Canada were asked to report on equipment funding and factors that influence equipment procurement and placement decisions.
Sources of Funding for Imaging Equipment
Nine provinces receive most of their funding for capital and operating costs from publicly funded sources. Responses are summarized in Appendix 3, Table 16.
Provincial and Territorial Funding
Between 90% and 100% of all funding originates from public health plans in Alberta, New Brunswick, Manitoba, Newfoundland and Labrador, Nova Scotia, Quebec, Northwest Territories, and Nunavut.
British Columbia receives between 40% and 60% of funding from public sources.
Saskatchewan receives 35% of funding from public sources.
Ontario receives 100% of its PET-CT equipment funding from the PET Scans Ontario Program.
Yukon receives primary funding from the territory.
Charitable Funding
Nine provinces and territories receive funding for imaging equipment from charitable donations:
PEI receives 100% of funding from charitable donations
Saskatchewan receives 65% of funding from charitable donations
British Columbia receives between 40% and 60% of funding from charitable donations
Alberta and New Brunswick receive 10% of funding from charitable donations
the Northwest Territories receives a portion of funding through charitable donations for imaging software
Yukon receives an unspecified proportion of their funding from charitable donations
Nova Scotia receives additional support through hospital foundations and auxiliaries.
Stimulus Program Funding
Nunavut receives a proportion of its funding from a federal stimulus program.
Research Funding
British Columbia receives 10% to 20% of funding from research programs, primarily from postsecondary institutions.
For New Brunswick, the responses were from 1 of the 2 regional health authorities, the Horizon Health Network. The response for Ontario was from Cancer Care Ontario and was solely for PET-CT equipment that are part of the program. No data were available for Manitoba.
Budgetary Differences Among Jurisdictions
In some provinces, hospitals are either exclusively or partially responsible for the purchase of new equipment through capital budgets, which may require approval from a health ministry or health authority for expensive items. Sources of funding for hospital capital budgets often include:36
corporate gifts
foundation or individual charitable donations
debt incurred through loans and bonds
social impact bonds and grants
government funds
Charitable funding may contribute significantly to financing capital budgets,38 but often is unevenly distributed among hospitals, based on size and location.37 In some jurisdictions, hospitals in small and relatively underfunded communities must contribute the same amount of funding for new imaging equipment as larger, wealthier regions.38
For rural hospitals that provide specialized services, such as imaging for stroke patients for large geographic areas, fundraising for essential imaging equipment can be challenging.38 A larger patient population and reliance on expensive imaging equipment may not be reflected in their capital budgets. As well, rural hospitals may lack the fundraising expertise of their urban counterparts, and the threshold for donor fatigue may be lower.38
Urgent competing issues, changing community priorities, a shrinking donor pool, and donor skepticism about how efficiently their charitable donations are being used39 prompt questions about relying on donations for critical health care equipment, including imaging equipment. It also raises concerns about whether funding imaging equipment from capital budgets, especially those relying heavily on charitable donations, may undermine the principle of health care equity. Centres that rely heavily on charitable donations for funding of imaging equipment must consider the ongoing operational costs.40
Volume of Publicly Funded Exams Conducted in Private Settings
Overall, there is a low volume of publicly funded exams conducted in private settings. Two provinces, Saskatchewan and Ontario, reported conducting 10% and 4% of publicly funded CT exams in private settings, respectively. Three provinces reported conducting publicly funded MRI exams in private settings: Saskatchewan with a percentage volume of 25%, Alberta with a percentage volume of 5%, and Ontario with a percentage volume of 4%. Ontario reported that 14% of publicly funded PET-CT exams are performed in private settings. In Manitoba, no publicly funded exams are conducted in private setting. No data were reported for Quebec.
Increased reliance on the private delivery of publicly funded exams as a means of managing pandemic induced wait time backlogs is resulting in the expansion of private services, chain ownerships and investment firm acquisition of private imaging facilities.7 As the private imaging landscape changes to accommodate increased demand, the volume of publicly funded exams is expected to change.
Factors That Inform Decision-Making About Replacing, Upgrading, and Adding New Imaging Equipment
Figure 25 shows the factors that inform overall equipment decision-making in Canada ranked according to priority.
The main drivers for decisions to replace existing equipment were:
end of manufacturer support
equipment failure
equipment age.
The main driver for decisions to upgrade imaging equipment were:
end of manufacturer support
equipment failure
operational or capital budget.
The main drivers for decisions to acquire new equipment were:
increased patient demand
operational or capital budget
evolving clinical practice.
Jurisdictional validators were asked to prioritize criteria that influence decision-making on replacing, upgrading, and/or adding new imaging equipment. Priorities were assigned a numerical ranking scale from 1 to 9 and reverse-scored, with 1 representing the lowest priority and 9 representing the highest (Appendix 3, Table 17).
Budgetary priorities included both operational costs (i.e., day-to-day costs) and capital costs (i.e., equipment costs), which were combined into 1 category for the purpose of validator ranking.
Criteria Used to Expand Imaging Equipment to New Geographic Locations
Validators most often reported the following as reasons for expanding imaging to new locations (Appendix 3, Table 18):
increased patient volume
travel distance
health human resources
cost considerations
infrastructure to support equipment
changes in patient demographics
government priorities.
Other expansion considerations included demand for new services and provincial wait time targets.
Data for Ontario were limited to PET-CT. In addition, for New Brunswick, the responses came from 1 of the 2 regional health authorities, the Horizon Health Network.
Figure 25: Priorities That Inform Decisions About Replacing, Upgrading, or Adding New Imaging Equipment, 2022–2023
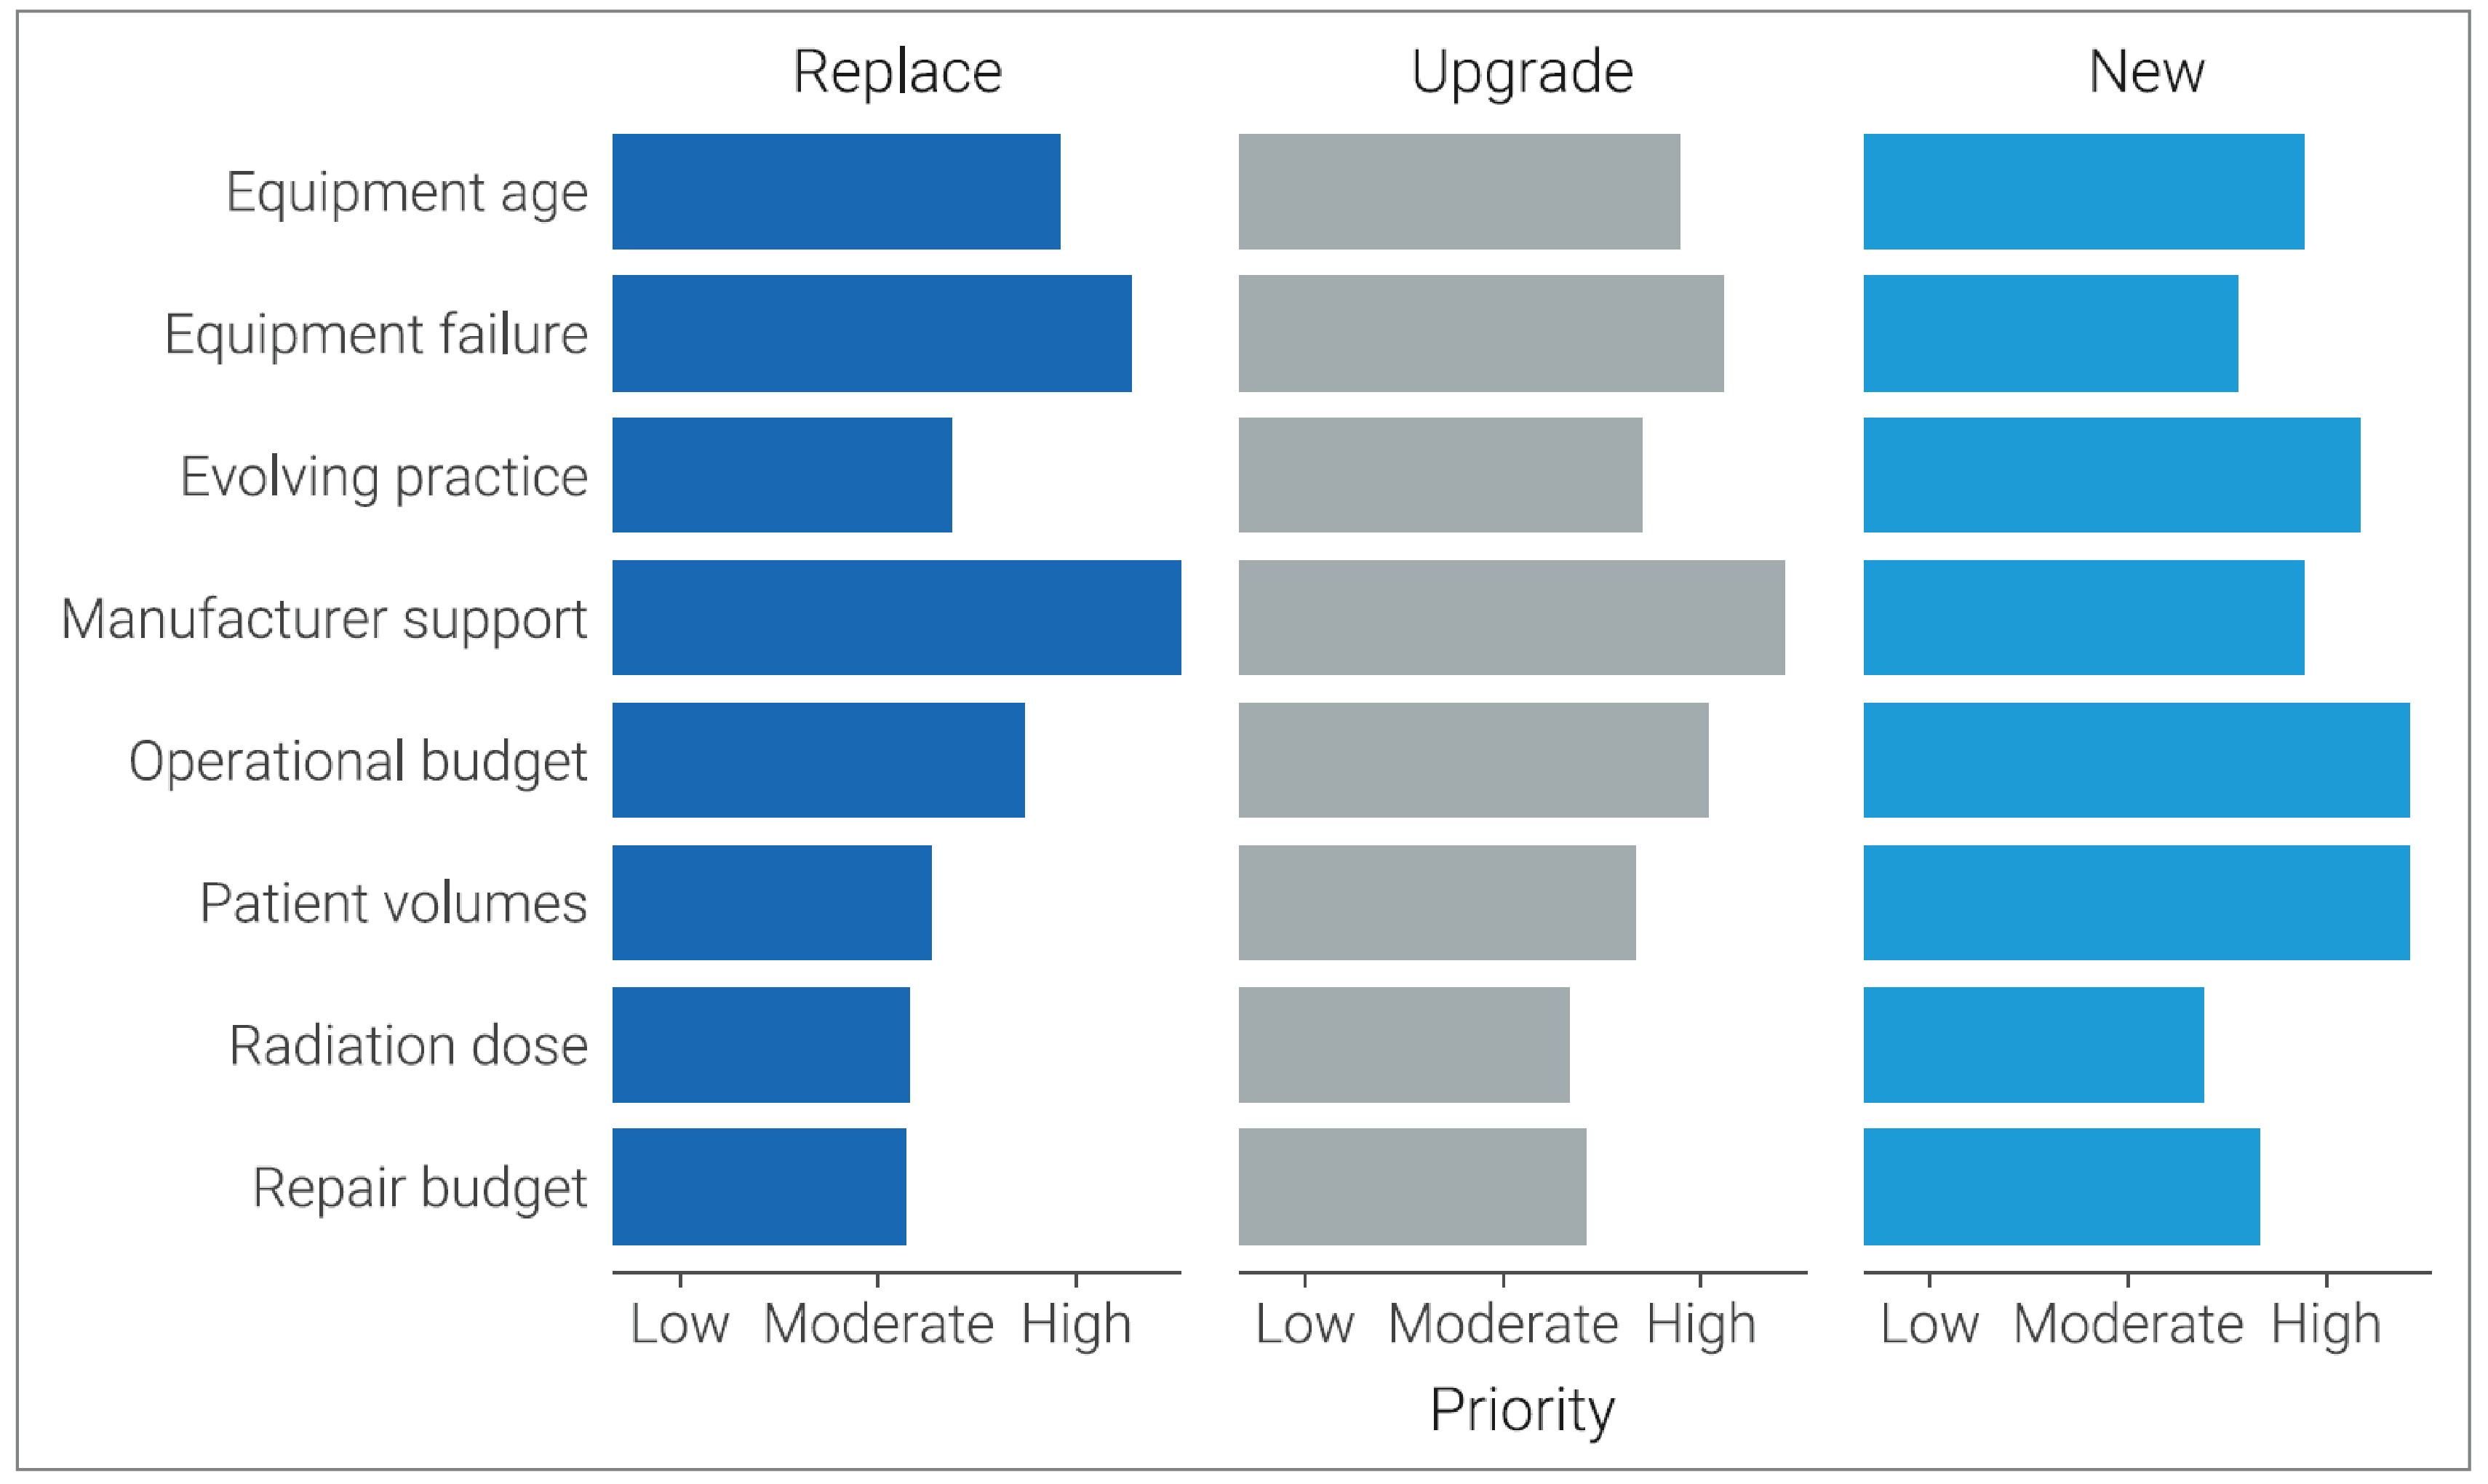
Notes: Scores using the ranking criteria were divided into 3 categories representing the amount that a factor was prioritized for informing equipment decisions (i.e., low priority = score 1 to 3, medium priority = 4 to 6, high priority = 7 to 9). The level of priority is represented on the x-axis by a gradient that includes low, moderate, and high.
Data from question: “When making decisions about replacing, upgrading, or adding new imaging equipment, what are the main drivers that dictate jurisdictional decisions?”
In Ontario, these decisions are left up to hospitals and Independent Health Facilities. The Ontario Ministry of Health does not set guidelines or criteria that hospitals must follow regarding decisions on imaging equipment. These decisions are relevant for CT and MRI.
Length of Time Taken to Review and Approve Designations for CT and PET-CT in New Sites
The length of time and approval process for installing and operating CT and PET-CT units differs across Canada and depends on a variety of factors (Table 6):
the review and approval process for new equipment can take up to 2 years
the length of time for approval depends on program alignment, funding sources, and budgetary planning cycles.
Table 6: Length of Time to Review and Approve CT and PET-CT Units at New Sites, 2022–2023
Province or territory | Criteria used |
|---|---|
Alberta | Depends on various factors, including zone program alignment and funding source |
British Columbia | Accreditation is done by the College of Physicians and Surgeons of BC, presumably 1 month to 2 months |
Manitoba | Depends on the budgetary planning cycle and approval |
New Brunswick | CT and PET-CT designations are not required in the province of New Brunswick |
Newfoundland and Labrador | Depends on the budgetary planning cycle and approval |
Northwest Territories | Years |
Nova Scotia | Between 52 to 104 weeks (1 year to 2 years) |
Nunavut | NA: There is only 1 CT machine in Nunavut, and it is currently not used for PET-CT |
Ontario | Ontario Health cannot comment on the duration; Ontario hospitals may be able to advise estimated timing |
Prince Edward Island | NR |
Quebec | From 3 to 6 weeks |
Saskatchewan | 1 year to 2 years |
Yukon | NR |
NA = not applicable; NR = not reported.
Note: Data derived from the question: “Approximately how long does it take (in weeks) to review and approve a CT or PET-CT designation for the use of these modalities at a new site?”
Use of Teleradiology Services
Teleradiology is the “electronic transmission of diagnostic imaging studies from one location to another for the purposes of interpretation and/or consultation.”41 Teleradiology services have traditionally been used to overcome geographic boundaries for patients and physicians, to provide overnight coverage,42 and to help manage the increase in radiology workload.43
Ten jurisdictions reported using teleradiology services, and most services are provided within the jurisdiction where the imaging exams originate Table 7):
9 jurisdictions reported using teleradiology services within their borders
5 jurisdictions reported using out-of-province teleradiology services
Saskatchewan reported using teleradiology services based outside of Canada.
Table 7: Use of Teleradiology Services in Canada, 2022–2023
Province or territory | Provincially based | Out of province | Out of country |
|---|---|---|---|
Alberta | No | No | NR |
British Columbia | Yes | No | No |
Manitoba | Yes | No | No |
New Brunswick | Yes | No | No |
Newfoundland and Labrador | Yes | No | No |
Northwest Territories | No | Yes | No |
Nova Scotia | No | No | No |
Nunavut | Yes | Yes | Unsure |
Ontario | NR | NR | NR |
Prince Edward Island | Yes | Yes | No |
Quebec | Yes | No | No |
Saskatchewan | Yes | Yes | Yes |
Yukon | Yes | Yes | No |
NR = not reported.
Note: Data derived from the question: “Are teleradiology services used in your jurisdiction?”
Barriers to the broader adoption of teleradiology services across Canada include: 43,44
some regulatory bodies do not permit radiologists to perform teleradiology work outside the province where the patient resides, even if licensed and accredited in that province
medicolegal issues
reimbursement considerations
quality assurance issues
interoperability of systems
storage capacity
privacy and security concerns.
Picture Archiving and Communication Systems
Picture archiving and communication systems (PACS) refer to electronic systems used to digitally manage images, including transmission, filing, storage, distribution, and retrieval of medical images. A detailed definition is provided in Appendix 2.
Of the sites, 86.4% reported PACS access throughout the provincial and territorial health care system without manual retrieval (based on responses from 242 of 280 sites).
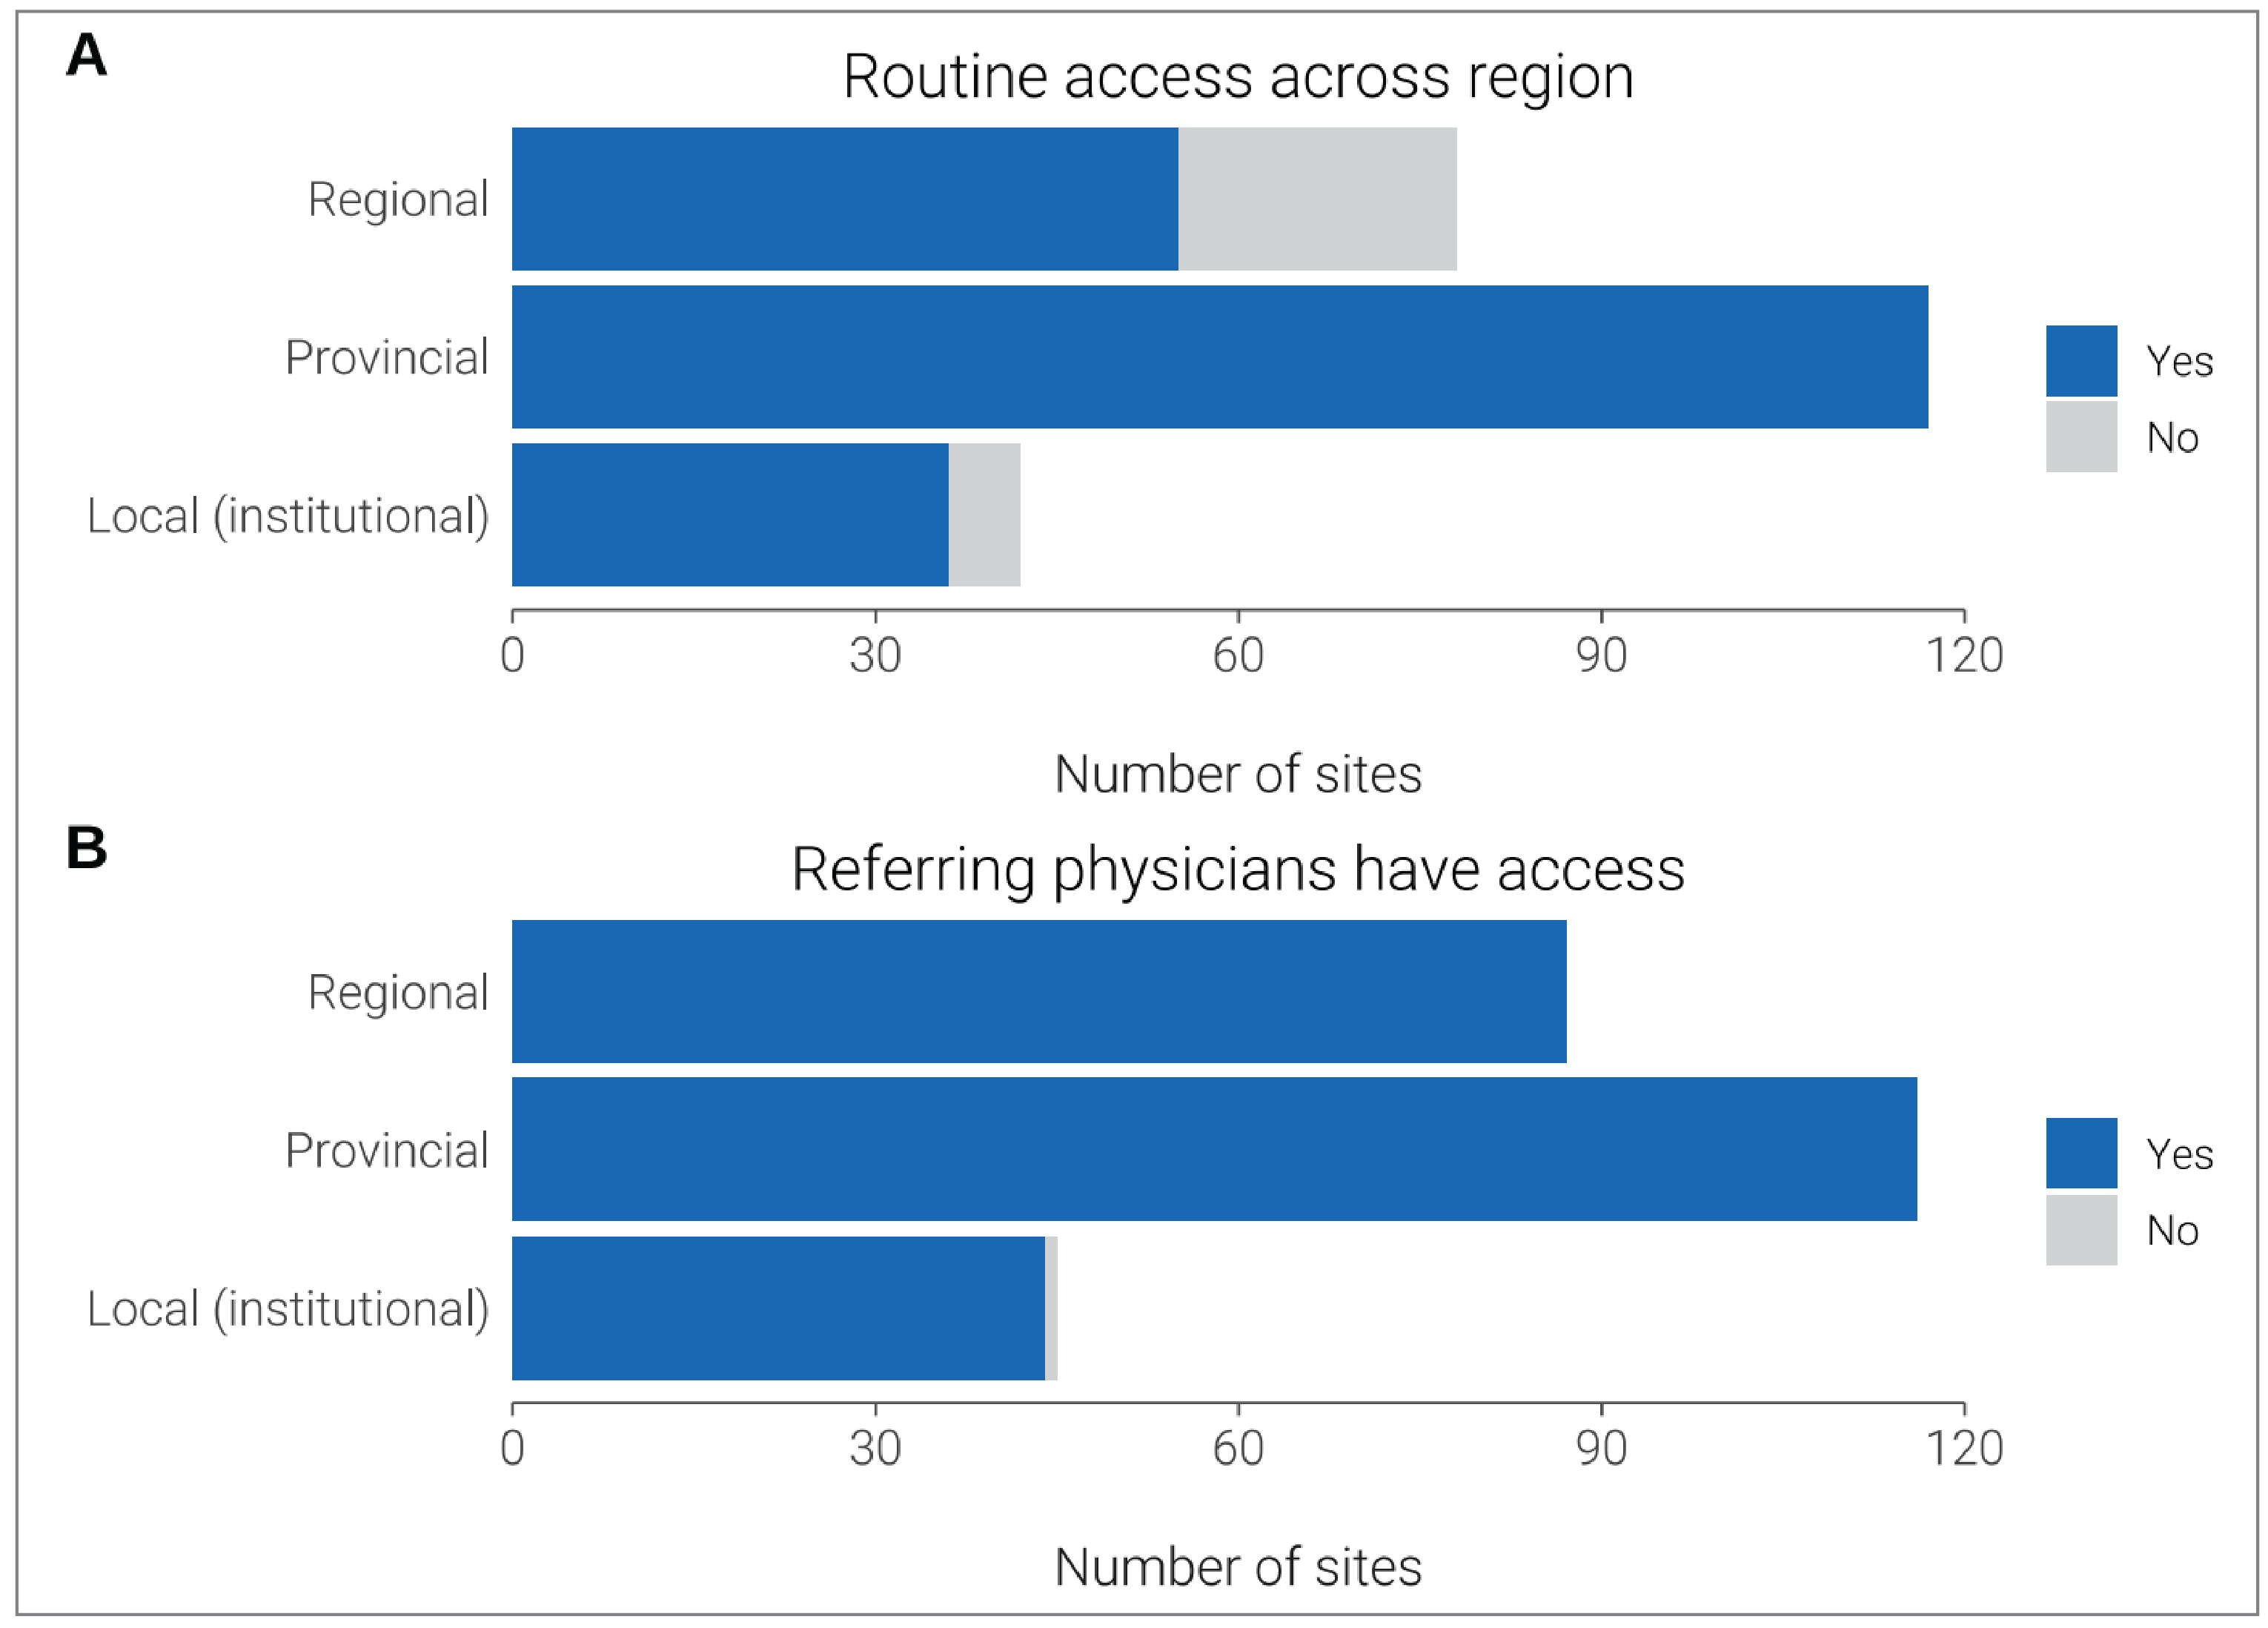
A total of 237 sites reported information on routine access to PACS at local, regional, or provincial or territorial levels (part A of Figure 26):
85.7% of sites had local access to PACS (36 of 42 sites with data)
70.5% of sites had regional access to PACS (55 of 78 sites with data)
all sites had intraprovincial and intraterritorial access to PACS (117 sites with data).
PACS images were widely accessible to referring physicians located in areas of the hospital outside of diagnostic imaging (based on responses from 293 of 297 sites; part B of Figure 26):
of sites, 97.8% with local or institutional access to PACS were accessible to referring physicians (44 of 45 sites with data)
all sites with regional access or provincial or territorial access to PACS were accessible to referring physicians.
Access to PACS images throughout a provincial health care network, without the need to manually push images from any location or modality, was provided by all sites with provincial or territorial access, 70.5% (55 of 78) of sites with regional access, and 85.7% (36 of 42) of sites with local (institutional) access. Some sites that lack a particular modality have access to images from that modality taken elsewhere.
Figure 27 and Table 8 shows the relationship between modality availability and PACS status for all sites and modalities with data available. Among sites that reported having modality specific PACS availability, CT and MRI are the modalities with the most PACS availability at 73.6% and 74.1%, respectively.
Figure 26: Access to PACS Images Without Manual Retrieval and by Referring Physicians, 2022–2023
PACS = picture archiving and communication system.
Note: A) Data were derived from the survey questions: “Are PACS images routinely accessible throughout your provincial health care system without the need to manually push images from any particular location/modality?” and “Is your PACS local, regional, or provincial?” A total of 36 of 42 sites had local access to PACS, 55 of 78 sites had regional access to PACS, and 117 sites had provincial access to PACS. B) Data were derived from the survey questions: “Do referring physicians have access to PACS images in areas of the hospital outside of diagnostic imaging (e.g., hospital clinics, the OR, case rounds meeting rooms, etc.)?” and “Is your PACS local, regional, or provincial?” PACS images were accessible to physicians at 44 of 45 sites with local access to PACS and at all sites with regional (87 sites) and provincial access (116 sites).
Figure 27: Availability of Modalities and Images on PACS, 2022–2023
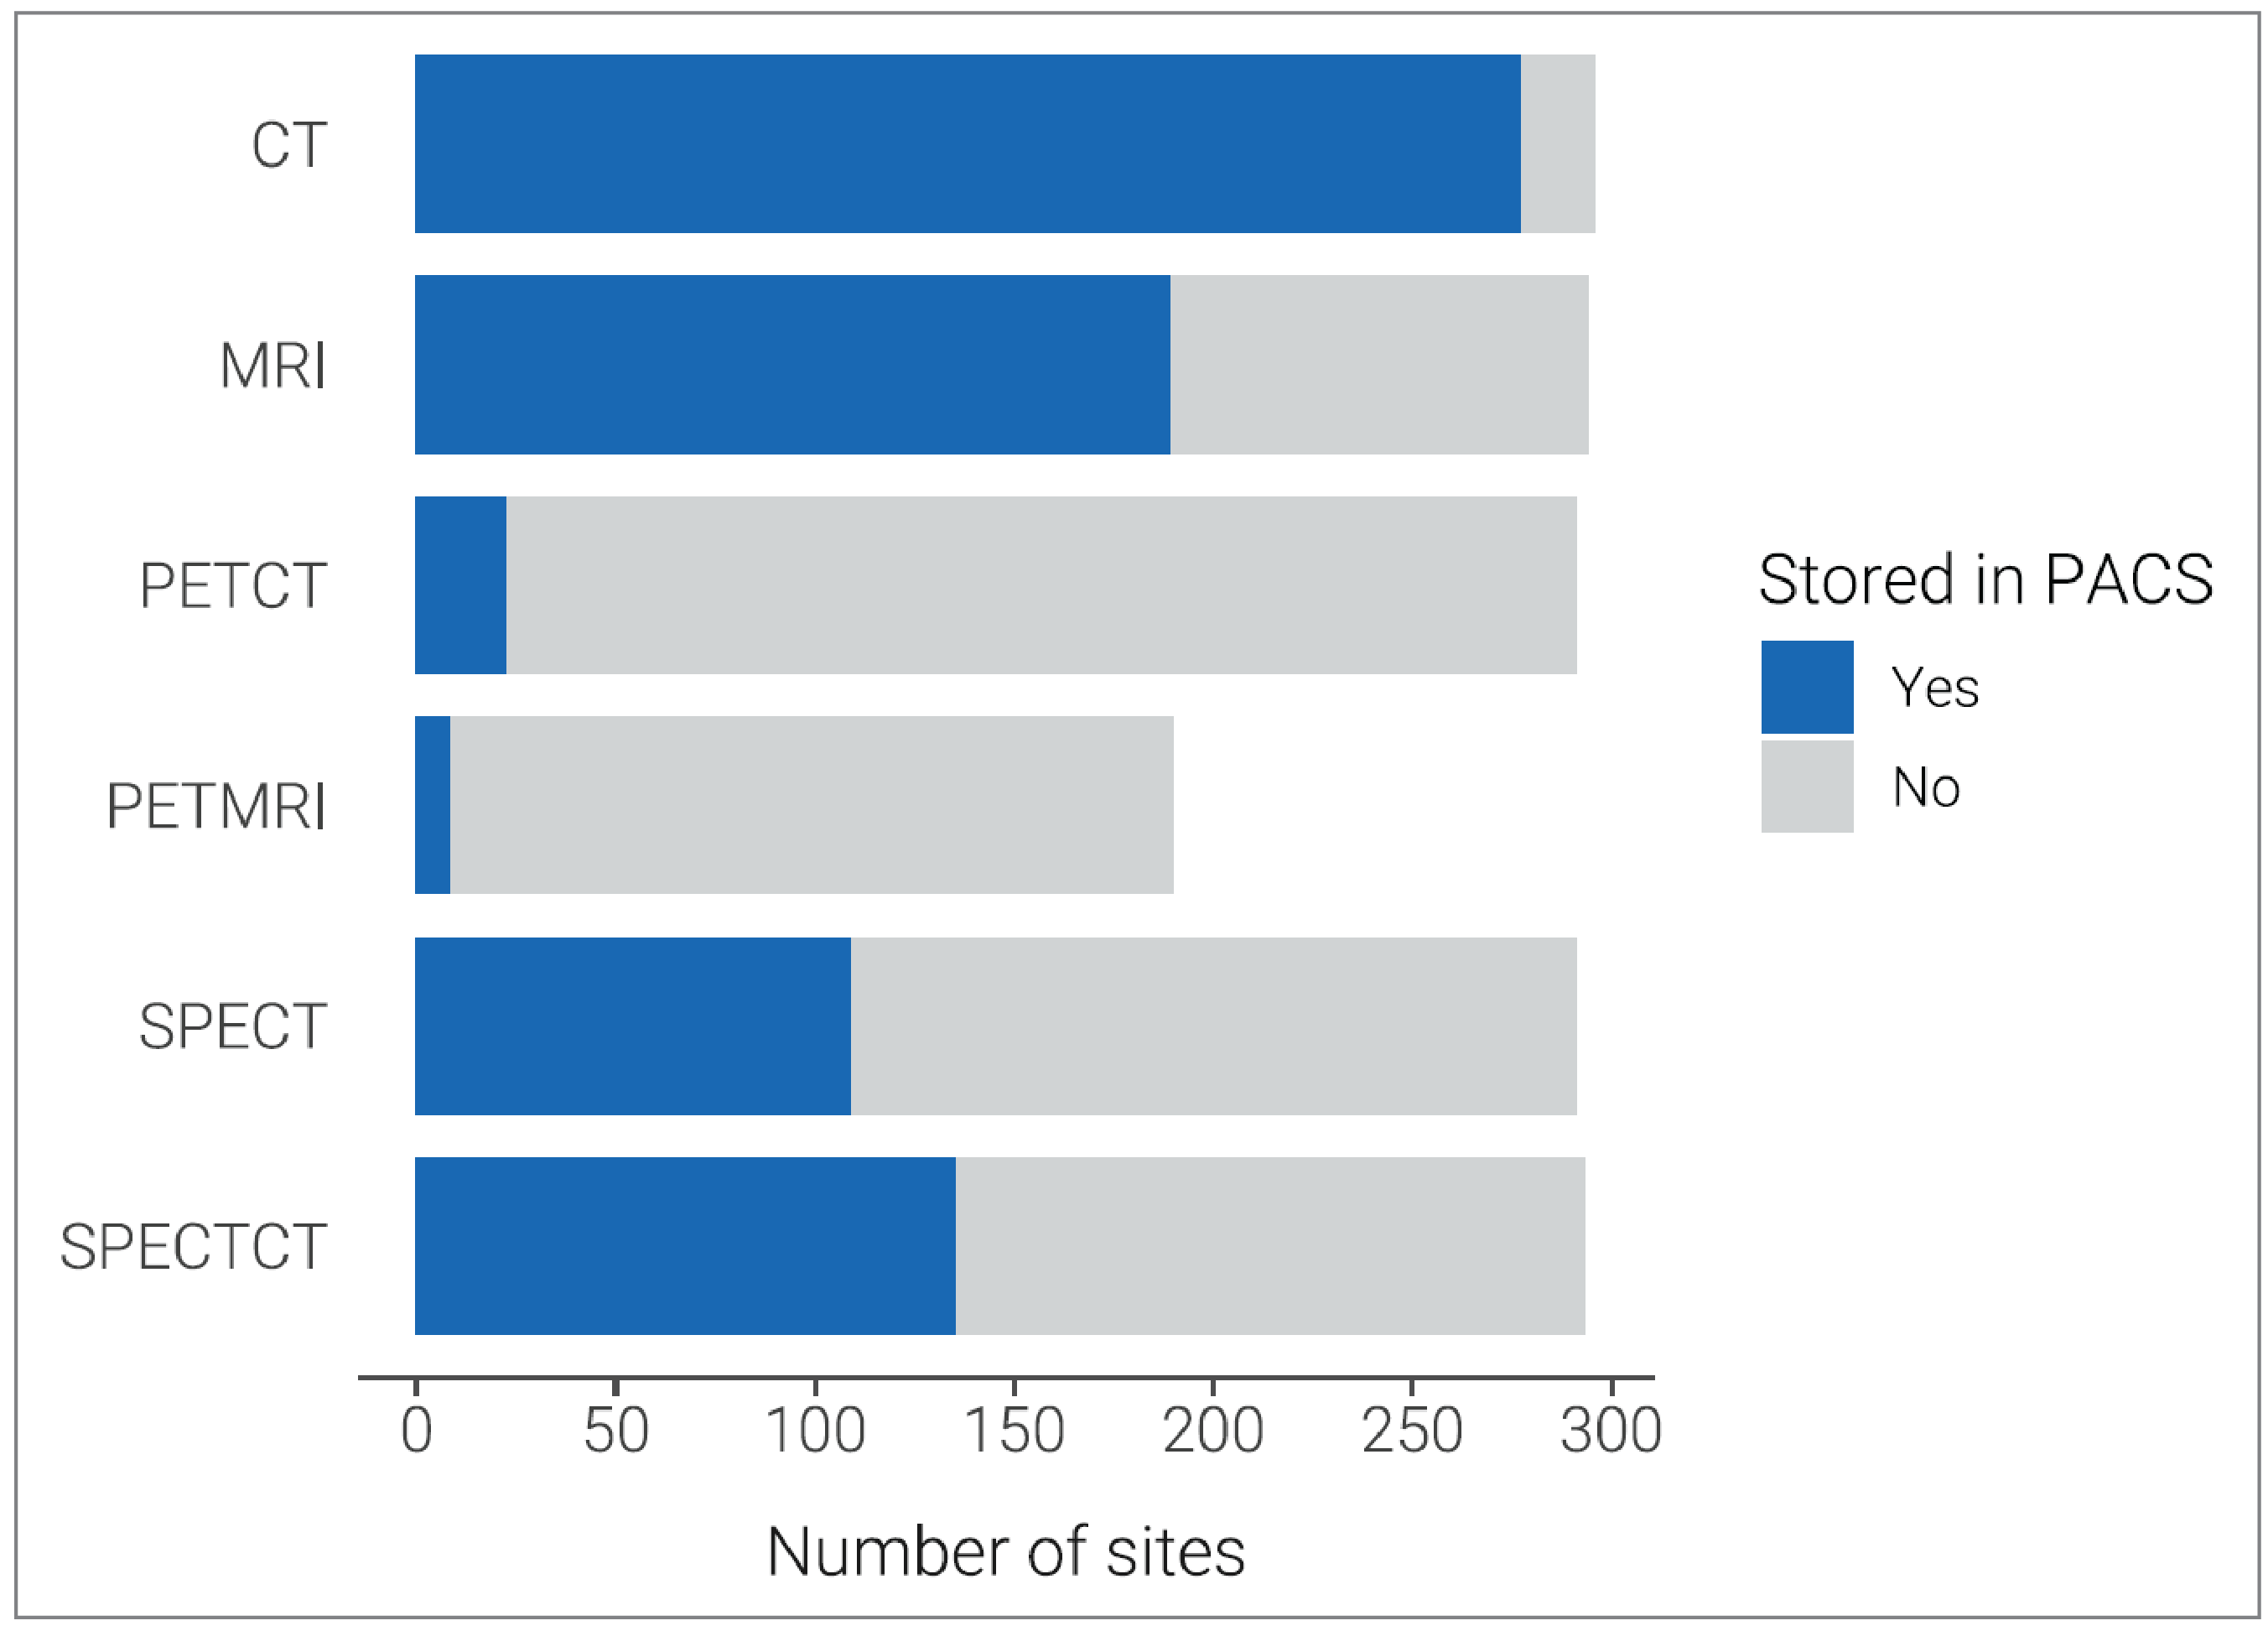
PACS = picture archiving communications system.
Notes: Data were derived from the question: “Are medical images stored on a Picture Archive and Communication System (PACS)?” Data derived from question: “If yes, which imaging modalities are stored on PACS systems? PET-CT or PET / CT / MRI / PET-MRI / SPECT-CT / SPECT.”
Table 8: Availability of Modalities and Images on PACS, 2022–2023
Modality and PACS status | CT | MRI | PET-CT | PET-MRI | SPECT | SPECT-CT |
|---|---|---|---|---|---|---|
Number of sites (% of sites) | ||||||
Site has modality and uses PACS to store images | 271 of 368 (73.6) | 177 of 239 (74.1) | 15 of 48 (31.2) | 3 of 6 (50) | 78 of 122 (63.9) | 127 of 175 (72.6) |
Site has modality and does not use PACS to store images | 97 of 368 (26.4) | 62 of 239 (25.9) | 33 of 48 (68.8) | 3 of 6 (50) | 44 of 122 (36.1) | 48 of 175 (27.4) |
Site does not have modality but can access images via PACS | 4 of 35 (11.4) | 11 of 164 (6.7) | 7 of 355 (2) | 8 of 397 (2) | 32 of 281 (11.4) | 8 of 228 (3.5) |
Site does not have modality and does not access images via PACS | 31 of 35 (88.6) | 153 of 164 (93.3) | 348 of 355 (98) | 389 of 397 (98) | 249 of 281 (88.6) | 220 of 228 (96.5) |
PACS Accessibility
All facilities with available data reported PACS access throughout the provincial or territorial health care system. A minority of sites without a given modality (e.g., PET-CT) may have access via PACS to images obtained at a different site or sites that are on the same network.
Geographic proximity does not guarantee image sharing if sites operate on different regional networks or systems. The inability to share images easily with PACS may delay patient care, adversely affect patient outcomes, and impact radiologist workflow and efficiency.
The use of PACS is not necessarily an indicator of how accessible images are across different hospitals, which has prompted improvements in PACS functionality.45 Several sites outlined plans to extend PACS coverage within their jurisdictions.
Medical Imaging Team Overview
Medical Imaging Team
Advanced medical imaging teams often comprise multidisciplinary professionals, including medical radiation technologists (MRTs), radiologists, nuclear medicine specialists, medical imaging physicists, biomedical engineers, and other support staff. These skilled professionals work collaboratively to provide numerous services, including:16
preparing patients for exams
designing, installing, operating, and maintaining equipment
radiation safety and quality assurance
reading and interpreting exams
managing the day-to-day operations of an imaging department.
The CMII reports on data relating to the main professionals working in the imaging department: MRTs, radiologists, nuclear medicine specialists, and medical imaging physicists.
The highest number and density of full-time medical imaging staff for these disciplines are based in Ontario, Quebec, British Columbia, and Alberta.46-48
In 2022–2023, MRTs comprised the largest professional group within the advanced imaging work force, followed by radiologists, nuclear medicine specialists, and medical imaging physicists. There are radiologists and MRTs practising in facilities in every province and territory, while 9 provinces have nuclear medicine specialists, and 6 provinces employ medical imaging physicists.
Staffing Shortage
The shortage of medical imaging staff is increasing in Canada. The COVID-19 pandemic has exacerbated existing staff shortages in Canada’s health care system.46-48
Compared to the prepandemic period, there is now a lower density of full-time professionals in practice across Canada (Figure 28), with medical physicists experiencing the largest decline per million population (9.7%).
There are now fewer MRTs in practice per million population, while the volume of CT and MRI exams per technician has increased since 2019.6,49
Figure 28: Percentage Change in Full-Time Radiology Professional Imaging Staff per Million Population, 2019 to 2022–2023
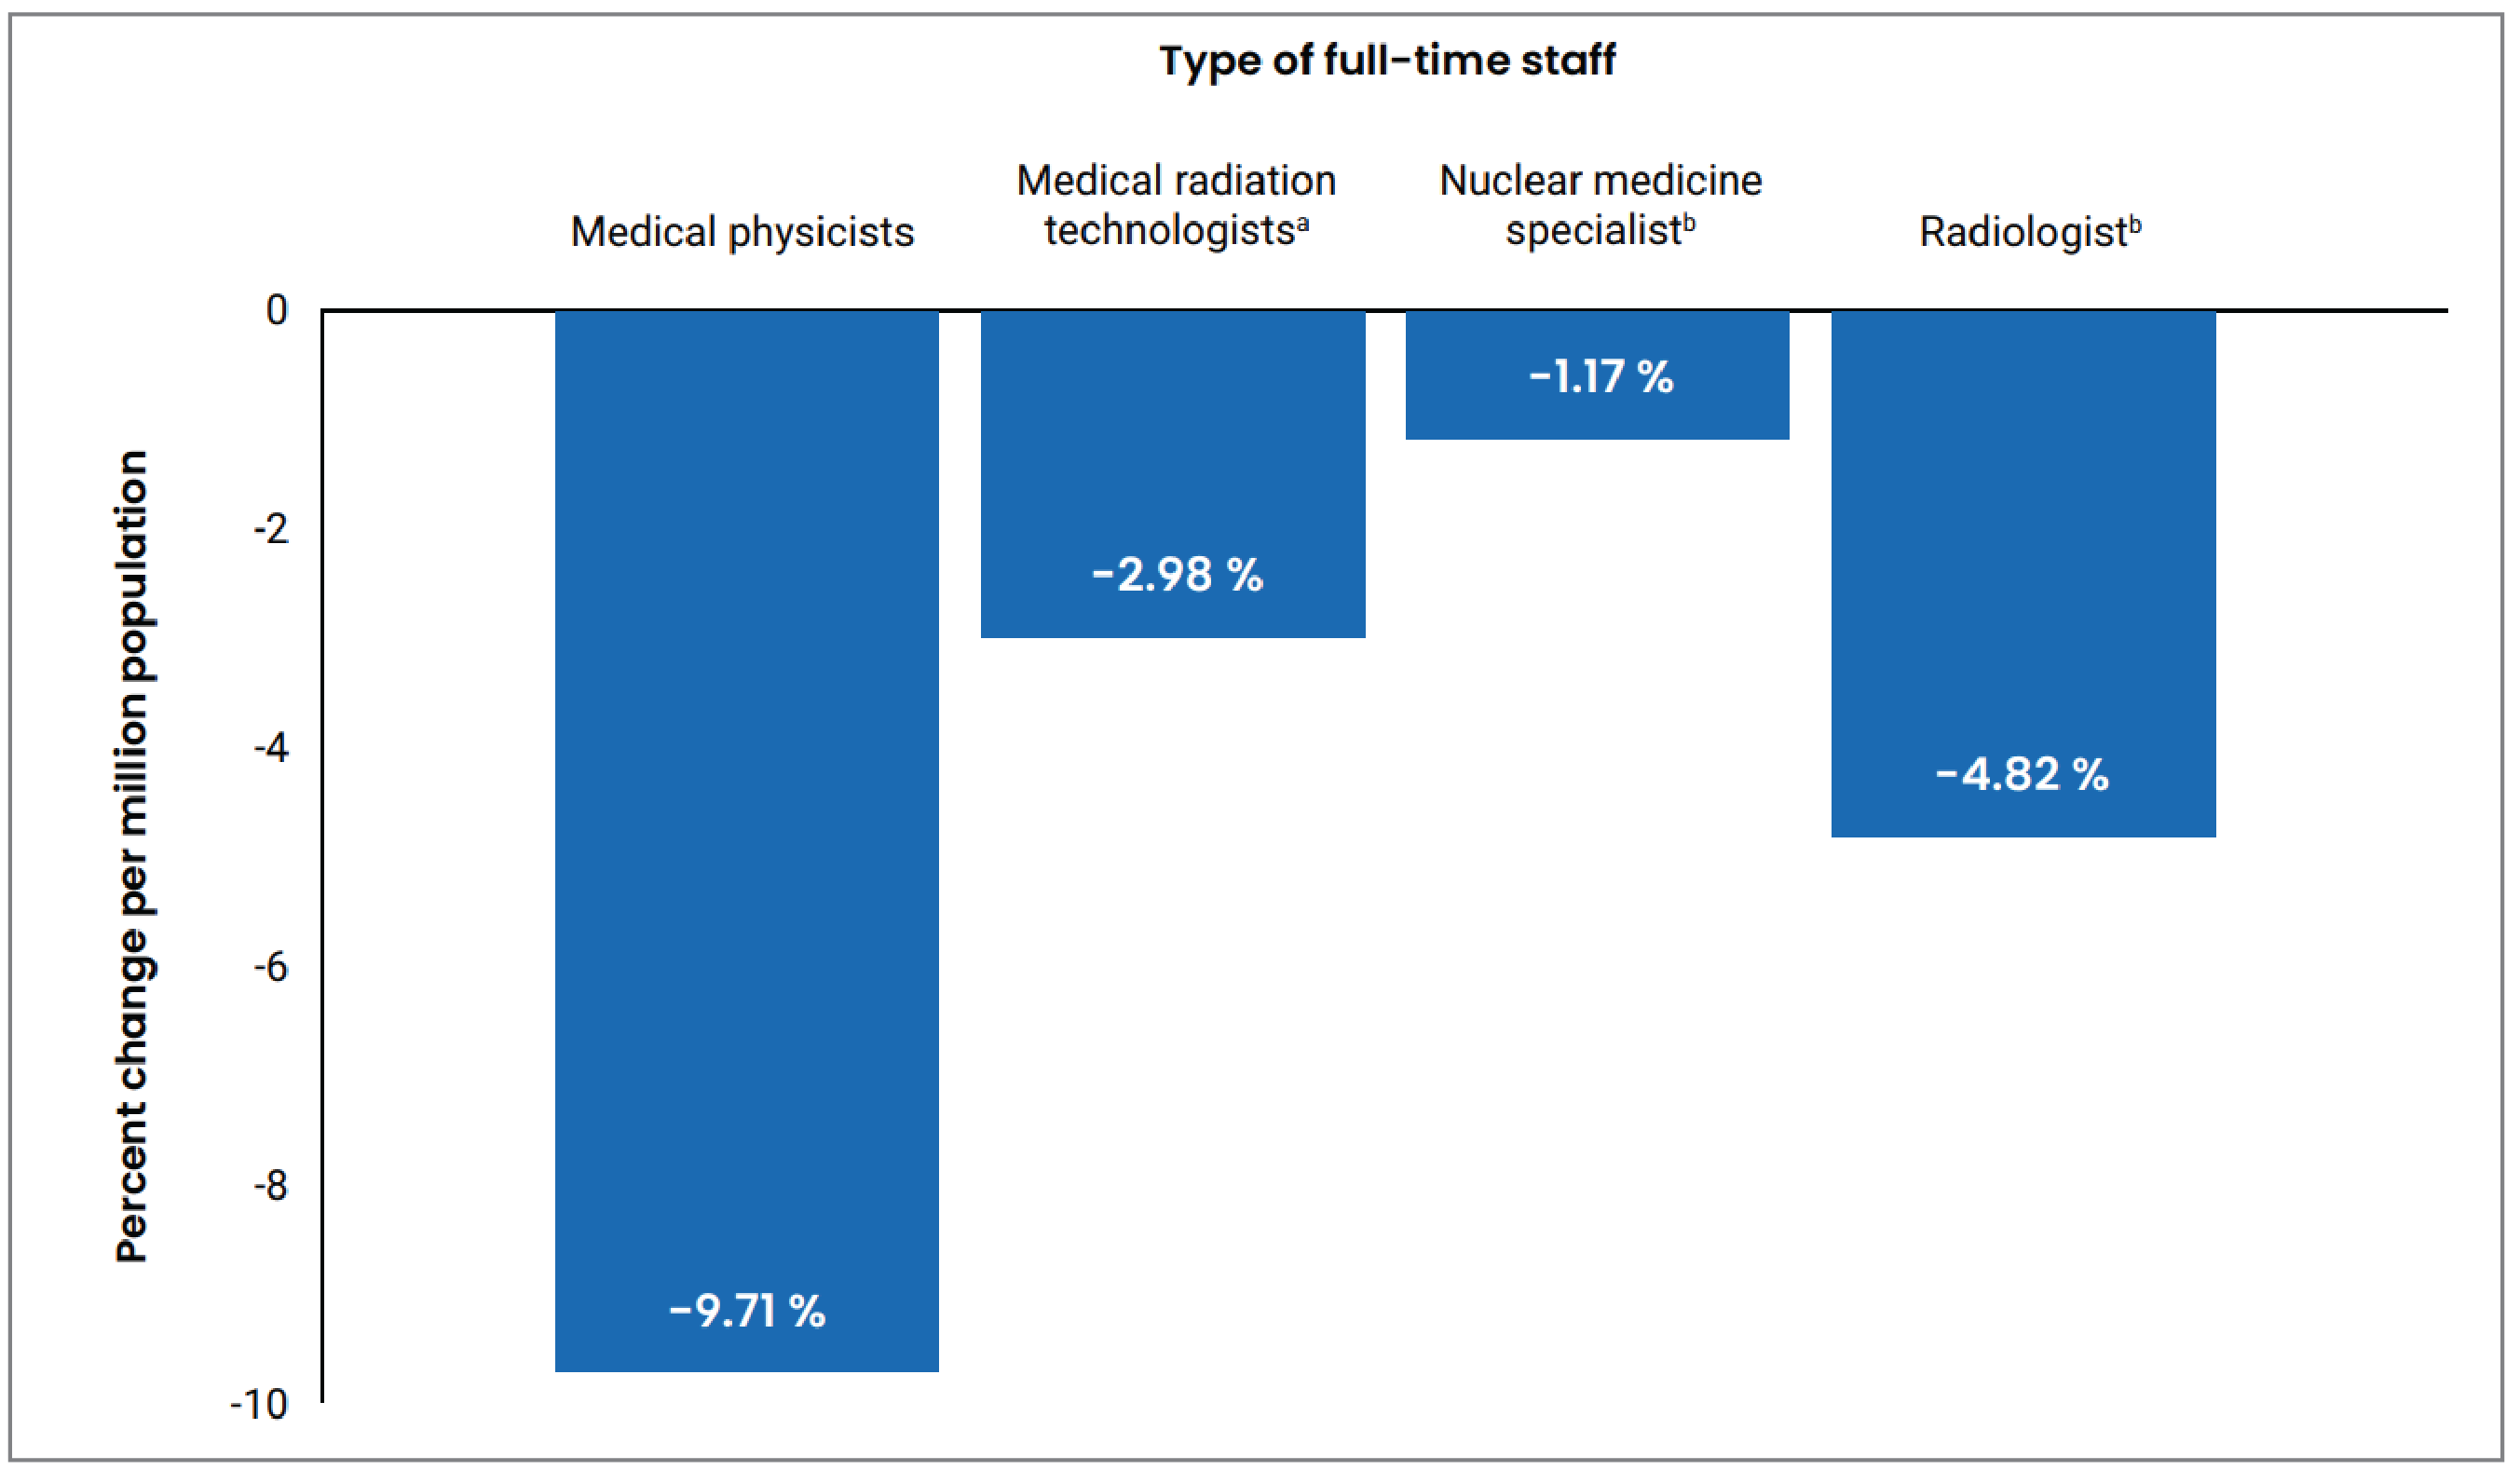
a Data from 2021.
b Nuclear medicine specialist and radiologist data from 2019. Assumed unchanged staff retention since 2019 and increased population growth.46,47
The following factors, among others, have been identified as contributing to the human health shortage and negatively impacting staff well-being:50,51
limited innovative or diagnostic screening and radiation therapy enhancements to reduce imaging staff workload52
geographical and organizational financial constraints to support employing and retaining highly trained professionals53
less-efficient equipment or a lack of access to imaging equipment, especially in remote or rural areas, leading to long wait times and increased patient load53
limited career opportunities, progression, training incentives and programs, and human health resource strategies
stress and poor mental and/or physical health, contributing to overall worsened well-being, absenteeism, underperformance, and potential negative impact on patient care.10,50,54
Wait Times
Wait times for medical imaging are an ongoing concern in Canada as patients wait beyond recommended wait times.13,55,56 Overall, there is an increasing trend in wait times for CT and MRI exams over the past decade reported by CIHI and the Fraser Institute.13,57-59 Between 2012 and 2023, the median wait time for CT increased by 77% (from 26 to 46 days) and the wait time for MRI increased by 53% (from 59 to 90 days) (Figure 29).13,57
There are various potential causes of long wait times, and specific causes may vary between jurisdictions and facilities. In addition to the increased demand on services and staffing shortages, funding challenges, less-efficient equipment with results in longer scan times, and low-value exam volumes contribute to growing wait times.52
To help with wait times and staff shortages, several strategies have been recommended by organizations and from Canada and internationally, as detailed in the report Wait List Strategies for CT and MRI Scans:52
investment in innovative medical technologies and replacement of obsolete equipment
developing a robust health human resources strategy for medical imaging departments
improving referral and scheduling processes and communication (e.g., referral pathway, booking, intake)
ensuring equitable distribution of equipment and incentivizing professionals to practice in underserved regions.
Details on the scope and distribution of practice for each imaging team member in Canada, and further information on staffing and wait list–related challenges will be published separately in Canadian Medical Imaging Inventory 2022–2023: The Medical Imaging Team report on the CMII webpage in spring 2024.
Overall Findings
Most of the sites that responded to the survey are in publicly funded, urban hospital settings.
MRI and CT units have the highest daily and weekly average operational hours, followed by PET-CT, SPECT-CT, SPECT, and PET-MRI.
Since 2004, the growth in number of CT and MRI units per million people and number of exams per 1,000 people has exceeded population growth, with a levelling out of growth in recent periods.
CT is the most widely available imaging modality in Canada and is the only imaging modality available in every jurisdiction (province or territory).
SPECT-CT has experienced rapid growth over the past decade, followed by PET-CT, MRI, and CT. SPECT is the only modality that decreased in number of units since 2012.
Since 2019, PET-MRI, an emerging technology, has experienced the largest growth in units of any modality, increasing from 5 to 6 units.
Most sites report routine access to PACS throughout the provincial health care network and widespread referring physician access.
Most sites have a process in place to determine the appropriateness of received examinations orders.
Most provinces and territories receive equipment funding from public health plans, although this is variable.
The survey results provide insight into the current context of medical imaging across Canada. The findings of this report may help decision-makers identify gaps in service; inform medical imaging–related strategic planning on a national, provincial, or territorial basis; and help anticipate future growth and need for replacement.
CMII data, particularly data collected on current demand and available resources, may help guide strategies and identify planning opportunities to improve timely access to medical imaging.
Limitations of Findings
For feasibility, recent survey iterations have been restricted to 6 advanced imaging modalities, creating a bias toward urban areas. This focus bias does not capture alternative imaging options, such as ultrasound or X-ray, available outside these regions, especially in remote or rural areas, where patients need to travel or be transferred significant distances for imaging.
Potential relationships among modalities (e.g., in pathways that involve multiple modalities) may not be fully captured and may limit consideration of funding allocation for diagnostic imaging across all modalities.
Publicly funded facilities were more readily identified than private facilities because their data tend to be held at multiple administrative levels. Most provinces lack a publicly available repository of private imaging facilities. This may lead to underestimation of the number of units and of the total number of exams, particularly in jurisdictions where privately run imaging contributes to the overall use.
Complete data are available from provincial and territorial validators for units and exams. Data from private sites with private imaging capacity supplemented data for public capacity; detailed information for private imaging facilities is limited due to the low number of survey responses.
Approximately 70% of sites entered or updated data. Where appropriate, we have carried forward data from the 2019–2020 CMII.
SPECT and SPECT-CT accounting has been variable. Possible reasons include sites’ and validators’ uncertain identification of units with low CT resolution as SPECT rather than as SPECT-CT and the tendency for some jurisdictions to report combined unit and exam counts, leading us to estimate how many are SPECT and how many are SPECT-CT.
Dates were variously reported as year of installation or first year of operation and frequently varied across datasets, leading to a 1- or 2-year uncertainty in the age of individual units, and a corresponding uncertainty in the means.
The accuracy of the data in this report relies in part on the survey participants’ personal knowledge of their health care setting. Recall bias cannot be avoided because we were unable to assess whether all information was visually verified and based on real data or whether questions were answered from memory. As a result, the accuracy and completeness of reporting may be affected.
What Else Are We Doing?
This Canadian Medical Imaging Inventory 2022–2023: Provincial and Territorial Overview report is part of a series of publications that is part of a series of publications produced based on the CMII national survey.
The following additional publications, which can be found on the CMII website, are available to provide jurisdiction-level information on medical imaging modalities and resources:
Canadian Medical Imaging Inventory 2022–2023: CT
Canadian Medical Imaging Inventory 2022–2023: MRI
Canadian Medical Imaging Inventory 2022–2023: PET-CT and PET-MRI
Canadian Medical Imaging Inventory 2022–2023: SPECT and SPECT-CT
Canadian Medical Imaging Inventory 2022–2023: The Medical Imaging Team
provincial and territorial summaries
What Else Have We Done?
The following are other CMII-related reports released in 2023 to 2024 in response to specific decision-maker needs and are published on the CMII website:
General Ultrasound Examination Volumes per Sonographer 8-Hour Workday
Average Volume of MRI Exams Conducted per Hour Across Canada
Use of MRI and CT in Private Imaging Facilities in Canada: Service Report
Imaging Implementation Advice Panel: Guidance for PSMA-PET Implementation
Individuals’ Access to Medical Imaging Results via Patient Portals
References
1.Rehani MM. Challenges in radiation protection of patients for the 21st century. Am J Roentgenol. 2013;200(4):762-764. PubMed
2.Canadian Cardiovascular Society Position Statement on radiation exposure from cardiac imaging and interventional Pprocedures. Can J Cardiol. 2013;29(11):1361-1368. https://www.onlinecjc.ca/article/S0828-282X%2813%2900363-2/abs3. tract. Accessed 2024 Jan 27. PubMed
3.Cote MJ, Smith MA. Forecasting the demand for radiology services. Health Syst (Basingstoke). 2018;7(2):79-88. https://www.ncbi.nlm.nih.gov/pmc/articles/PMC6452837/. Accessed 2024 Jan 27. PubMed
4.Crowell MS, Dedkam EA, Johnson MR, et al. Diagnostic imaging in a direct-access sports physical therapy clinic: a 2-year retrospective practice analysis. Int J Sports Phys Ther. 2016;11(5):708-717. https://www.ncbi.nlm.nih.gov/pmc/articles/PMC5046964/. Accessed 2024 Jan 27. PubMed
5.Laframboise D. Centralized booking as the solution to the CT and MRI wait time problem in Ontario [dissertation]. Athabasca (AB): Athabasca University; 2014.
6.Chao Y-S, Sinclair A, Morrison A, Hafizi D, Pyke L. The Canadian medical imaging inventory 2019-2020. CADTH Health Technology Review. Ottawa (ON): CADTH; 2021: https://www.cadth.ca/sites/default/files/ou-tr/op0546-cmii3-final-report.pdf. Accessed 2024 Jan 10.
7.Huizinga R. New Brunswick medical imaging suffering from pandemic burnout. CBC News. 2022 Mar 10. https://www.cbc.ca/news/canada/new-brunswick/new-brunswick-medical-imaging-technologists-burnout-1.6379322. Accessed 2024 Jan 11.
8.Harmonay V. Rising costs for CT, MRI, & C-Arms. 2022; https://info.atlantisworldwide.com/blog/rising-costs-for-ct-mri-c-arms. Accessed 2024 Feb 29.
9.The Canadian medical imaging inventory: 2022–2023. Evidence preview. CADTH Health Technology Review. Ottawa: CADTH; 2023: https://www.cadth.ca/sites/default/files/hta-he/HC0024_cmii_2022_2023_evidence_preview.pdf. Accessed 2024 Jan 10.
10.Cao DJ, Hurrell C, Patlas MN. Current Status of Burnout in Canadian Radiology. Can Assoc Radiol J. 2023;74(1):37-43. PubMed
11.A struggling system: understanding the health care impacts of the pandemic. Ottawa (ON): Canadian Medical Association; 2021: https://www.cma.ca/sites/default/files/pdf/health-advocacy/Deloitte-report-nov2021-EN.pdf. Accessed 2024 Jan 10.
12.Addressing the medical imaging dilemma in Canada: Restoring timely access for patients post-pandemic. Ottawa (ON): Canadian Association of Radiologists; 2022: https://car.ca/wp-content/uploads/2021/07/CAR-PreBudgetSubmission-2022-e-web-FINAL.pdf. Accessed 2023 Nov 9.
13.Moir M, Barua B, Wannamaker H. Waiting your turn: Wait times for health care in Canada, 2023 Report. Vancouver (BC): Fraser Institute; 2023: https://www.fraserinstitute.org/sites/default/files/waiting-your-turn-2023.pdf. Accessed 2024 Jan 10.
14.Medical imaging in Canada 2012 (executive summary). Ottawa (ON): Canadian Institute for Health Information (CIHI); 2013.
15.QuickStats: Selected medical imaging equipment in Canada. Ottawa (ON): Canadian Institute for Health Information (CIHI); 2012.
16.Medical imaging in Canada 2007. Ottawa (ON): Canadian Institute for Health Information (CIHI); 2008: https://publications.gc.ca/collections/collection_2008/cihi-icis/H118-13-2007E.pdf. Accessed 2024 Jan 10.
17.Sinclair A, Quay T, Pyke L, Morrison A. The Canadian Medical Imaging Inventory 2015. CADTH Optimal use report. Ottawa (ON): CADTH; 2016: https://www.cadth.ca/sites/default/files/pdf/canadian_medical_imaging_inventory_2015_e.pdf. Accessed 2024 Jan 10.
18.Sinclair A, Morrison A, Young C, Pyke L. The Canadian medical imaging inventory, 2017. CADTH Optimal use report. Ottawa (ON): CADTH; 2018: https://www.cadth.ca/sites/default/files/pdf/canadian_medical_imaging_inventory_2017.pdf. Accessed 2024 Jan 10.
19.Statistics Canada. Canada's population estimates, first quarter 2023. The Daily. Ottawa (ON): Government of Canada; 2023: https://www150.statcan.gc.ca/n1/daily-quotidien/230628/dq230628c-eng.htm. Accessed 2024 Jan 5.
20.Mayfair Diagnostics. How private MRI fits into public health care. 2018; https://www.radiology.ca/article/how-private-mri-fits-public-health-care. Accessed 2024 Feb 29.
21.Canadian Coordinating Office for Health Technology Assessment (CCOHTA). Computed tomography scanners in Canadian hospitals. Ottawa (ON): CCOHTA; 2000: https://www.cadth.ca/sites/default/files/pdf/ct_report_01.pdf. Accessed 2024 Feb 29.
22.Canadian Coordinating Office for Health Technology Assessment (CCOHTA). Magnetic resonance imaging scanners in Canadian hospitals. Ottawa (ON): CCOHTA; 2001: https://www.cadth.ca/sites/default/files/pdf/mri_report_01.pdf. Accessed 2024 Feb 29.
23.Medical imaging in Canada. Ottawa (ON): Canadian Institute for Health Information (CIHI); 2003: https://publications.gc.ca/Collection/H118-13-2003E.pdf. Accessed 2024 Jan 10.
24.The age of imaging equipment in Canada. Canadian medical imaging inventory service report. Ottawa: CADTH; 2021: https://www.cadth.ca/sites/default/files/attachments/2021-11/cmii_service_age_of_imaging_equipment.pdf. Accessed 2024 Jan 10.
25.Appropriateness of requisition, order or prescription. Ottawa (ON): Canadian Association of Medical Radiation Technologists; 2024: https://camrt-bpg.ca/quality-of-care/appropriate-care/appropriateness-of-requisition/. Accessed 2024 Jan 10.
26.Walther F, Eberlein-Gonska, M., Hoffmann, RT et al. Measuring appropriateness of diagnostic imaging: a scoping review. Insights Imaging. 2023;14:62. PubMed
27.Choosing Wisely Canada. Imaging Wisely: Communicating and Collaborating to Improve Imaging Services. 2017; https://choosingwiselycanada.org/imaging-wisely/. Accessed 2024 Jan 11.
28.Fraser J, Reed M. Appropriateness of imaging in Canada. Can Assoc Radiol J. 2013;64(2):82-84. PubMed
29.Organisation for Economic Co-Operation and Development. Computed tomography (CT) scanners. 2020; https://data.oecd.org/healtheqt/computed-tomography-ct-scanners.htm. Accessed 2024 Feb 29.
30.Organisation for Economic Co-Operation and Development. Computed tomography (CT) exams. 2023; https://data.oecd.org/healthcare/computed-tomography-ct-exams.htm. Accessed 2023 Nov 9.
31.Organisation for Economic Co-Operation and Development. Computed tomography (CT) scanners https://data.oecd.org/healtheqt/computed-tomography-ct-scanners.htm. Accessed 2023 Nov 9.
32.Organisation for Economic Co-Operation and Development. Magnetic resonance imaging (MRI) exams. 2023; https://data.oecd.org/healthcare/magnetic-resonance-imaging-mri-exams.htm#indicator-chart. Accessed 2023 Nov 9.
33.Organisation for Economic Co-Operation and Development. Magnetic resonance imaging (MRI) units. https://data.oecd.org/healtheqt/magnetic-resonance-imaging-mri-units.htm#indicator-chart. Accessed 2023 Nov 9.
34.Organisation for Economic Co-Operation and Development. Positron emission tomography (PET) scanners and exams. https://stats.oecd.org/ Accessed 2023 Nov 9.
35.Organisation for Economic Co-Operation and Development. Health at a glance 2019: OECD Indicators. 2019; https://www.oecd-ilibrary.org/docserver/4dd50c09-en.pdf?expires=1601301199&id=id&accname=guest&checksum=51E4BE1F3D672BD296E87EF96DBDFBC1. Accessed 2024 Feb 29.
36.Valand HA, Chu S, Bhala R, Foley JA, Hirsch JA, Tu RK. Comparison of advanced imaging resources, radiology workforce, and payment methodologies between the United States and Canada. AJNR. 2018;39(10):1785-1790. https://www.ajnr.org/content/39/10/1785. Accessed 2024 Feb 29. PubMed
37.Teja B, Daniel I, Pink GH, Brown A, et al. Ensuring adequate capital investment in Canadian health care. CMAJ. 2020;192(25):E677-E683. https://www.cmaj.ca/content/192/25/E677%20. Accessed 2024 Feb 29. PubMed
38.Rayar M, Pendharkar S, Laupacis A, Petch J. Is Ontario’s reliance on donations to fund hospital infrastructure fair and sustainable? healthydebate.2015 Feb 19: https://healthydebate.ca/2015/02/topic/politics-of-health-care/philanthropy. Accessed 2024 Feb 29.
39.Lasby D, Barr C. 30 Years of giving in Canada: The giving behaviour of Canadians: Who gives, how, and why? Ottawa (ON): Rideau Hall Foundation and Imagine Canada; 2018: https://www.cagp-acpdp.org/sites/default/files/media/rideau_hall_foundation_30years_report_eng_fnl.pdf. Accessed 2024 Feb 29.
40.Khanna R, Yen T. Computerized physician order entry: promise, perils and experience. Neurohospitalist. 2014;4(1):26-33. https://www.ncbi.nlm.nih.gov/pmc/articles/PMC3869307/. Accessed 2024 Feb 29. PubMed
41.CAR standards for teleradiology. Ottawa (ON): Canadian Association of Radiologists; 2008: https://car.ca/wp-content/uploads/Teleradiology-2008.pdf. Accessed 2024 Feb 29.
42.ACR white paper on teleradiology practice: A report from the Task Force on Teleradiology Practice. J Am Coll Radiol. 2013;10:575-585. https://www.acr.org/-/media/ACR/Files/Legal-and-Business-Practices/ACR_White_Paper_on_Teleradiology_Practice1.pdf. Accessed 2024 Feb 29. PubMed
43.McClung A, McKibbon A, Archer N. Novel eHealth trends in the field of radiology: A scoping review. Working paper No. 49. Hamilton (ON): McMaster eBusiness Research Centre (MeRC); 2014: https://macsphere.mcmaster.ca/bitstream/11375/17711/1/merc_wp_49.pdf. Accessed 2024 Feb 29.
44.Koff N, Koff D. An experience in teleradiology: A Canadian solution for collaboration and quality assurance in radiology. HealthManagement. 2013;13(3). https://healthmanagement.org/c/healthmanagement/issuearticle/an-experience-in-teleradiology. Accessed 2024 Feb 29.
45.Alhajeri M, Shah SGS. Limitations in and Solutions for Improving the Functionality of Picture Archiving and Communication System: an Exploratory Study of PACS Professionals' Perspectives. J Digit Imaging. 2019;32(1):54-67. PubMed
46.Diagnostic radiology profile. Ottawa (ON): Canadian Medical Association; 2019: https://cma.ca/sites/default/files/2019-01/diagnostic-radiology-e.pdf. Accessed 2023 Nov 9.
47.Nuclear medicine profile. Ottawa (ON): Canadian Medical Association; 2019: https://www.cma.ca/sites/default/files/2019-01/nuclear-e.pdf. Accessed 2023 Nov 9.
48.Health workforce in Canada, 2017 to 2021: Overview — Data tables. Ottawa (ON): Canadian Institute for Health Information (CIHI); 2022: https://www.cihi.ca/sites/default/files/document/health-workforce-canada-2017-2021-overview-data-tables-en.xlsx. Accessed 2023 Nov 10.
49.Morrill S, Baerlocher MO, Patlas MN, Kanani S, Kantarevic J, van der Pol CB. CT, MRI, and Medical Radiation Technologist Trends in Ontario. Can Assoc Radiol J. 2023:8465371231209923. PubMed
50.The mental health of medical radiation technologists in Canada: 2021 survey. Ottawa (ON): Canadian Association of Medical Radiation Technologists 2021: https://www.camrt.ca/wp-content/uploads/2021/10/CAMRT-National-Mental-Health-Survey-2021.pdf. Accessed 2023 Nov 9.
51.Wright T. ‘Requests are just piling up’: Patients continue to suffer long waits for medical imaging. Global News. 2022. https://globalnews.ca/news/9125436/medical-imaging-canada-backlogs-covid/. Accessed 2023 Nov 9.
52.Wait list strategies for CT and MRI exams. Can J Health Technol. 2023;3(1). https://www.cadth.ca/sites/default/files/attachments/2023-01/CM0002-HC0052-Wait-List%20Strategies-for-CT-and-MRI-Scans.pdf. Accessed 2024 Jan 10.
52.Job prospects: Medical Radiation Technologist (MRT) in Ontario. Government of Canada Job Bank; 2023: https://www.on.jobbank.gc.ca/marketreport/outlook-occupation/18254/ON. Accessed 2024 Jan 5.
53.Government of Saskatchewan. Expanded and upgraded interventional radiology suites open in Regina. 2022; https://www.saskatchewan.ca/government/news-and-media/2022/march/15/expanded-and-upgraded-interventional-radiology-suites-open-in-regina. Accessed 2023 Feb 22.
54.Canadian Association of Radiologists. Addressing the health human resource crisis in radiology departments across Canada. Newswire.2023: https://www.newswire.ca/news-releases/addressing-the-health-human-resource-crisis-in-radiology-departments-across-canada-842727175.html. Accessed 2023 Nov 9.
55.Wait list strategies for CT and MRI exams. Can J Health Technol. 2023;3(1). https://www.cadth.ca/sites/default/files/attachments/2023-01/CM0002-HC0052-Wait-List%20Strategies-for-CT-and-MRI-Scans.pdf. Accessed 2024 Jan 10.
56.Emery DJ, Forser AJ, Shojania KG, Magnan S, et al. Management of MRI wait lists in Canada Healthc Policy. 2009;4(3):76-86. https://www.ncbi.nlm.nih.gov/pmc/articles/PMC2653696 Accessed 2024 Feb 29. PubMed
57.Waiting your turn: Wait times for health care in Canada 2012 report. Studies in health policy. Vancouver (BC): Fraser Institute; 2012: https://www.fraserinstitute.org/sites/default/files/waiting-your-turn-2012-rev.pdf. Accessed 2023 Nov 9.
58.Canadian Institute for Health Information (CIHI). Explore wait times for priority procedures across Canada. 2023; https://www.cihi.ca/en/explore-wait-times-for-priority-procedures-across-canada. Accessed 2024 Jan 5.
59.Canadian Institute for Health Information (CIHI). Wait Times for Priority Procedures in Canada, 2014 2014; https://secure.cihi.ca/free_products/2014_WaitTimesAiB_EN.pdf. Accessed 2024 Jan 5.
60.Ghadimi M, Sapra A. Magnetic resonance imaging contraindications. Treasure Island (FL): StatPearls Publishing; 2023: https://www.ncbi.nlm.nih.gov/books/NBK551669/. Accessed 2024 Jan 10.
61.National Institute of Biomedical Imaging and Bioengineering. Nuclear medicine. Washington (DC): U.S. Department of Health & Human Services; 2024: https://www.nibib.nih.gov/science-education/science-topics/nuclear-medicine. Accessed 2024 Jan 10.
62.HealthLink BC. Single Photon Emission Computed Tomography (SPECT). 2022; https://www.healthlinkbc.ca/tests-treatments-medications/medical-tests/single-photon-emission-computed-tomography-spect#:~:text=Results-,Single%20photon%2Demission%20computed%20tomography%20(SPECT)%20is%20a%20test,you%20right%20after%20the%20test. Accessed 2024 Jan 10.
63.Statistics Canada. Indigenous peoples - 2021 Census promotional material. 2021; https://www.statcan.gc.ca/en/census/census-engagement/community-supporter/indigenous-peoples. Accessed 2024 Jan 10.
64.John Hopkins Medicine. Positron Emission Tomography (PET). 2024; https://www.hopkinsmedicine.org/health/treatment-tests-and-therapies/positron-emission-tomography-pet. Accessed 2024 Jan 10.
65.Diagnostic imaging: nuclear medicine. Geneva (CHE): World Health Organization; 2016.
66.Canadian Association of Medical Radiation Technologists. Breastfeeding and lactation in nuclear medicine (RTNM). 2013; https://camrt-bpg.ca/patient-safety/radiation-safety-patients/breastfeeding-in-rtnm/. Accessed 2024 Jan 10.
67.Hricak H CB, Scott AM, Sugimura K, Muellner A, von Schulthess GK, et al. Global trends in hybrid imaging. Radiology. 2010;257(2):498-506. PubMed
68.Couillard F. Anticipating a problem, proposing solutions. Ottawa (ON): Canadian Association of Medical Radiation Technologists; 2014: https://www.camrt.ca/blog/2014/11/25/anticipating-a-problem-proposing-solutions/. Accessed 2024 Jan 10.
69.Natural Resources Canada. Medical isotopes. Ottawa (ON): Government of Canada; 2020: https://natural-resources.canada.ca/our-natural-resources/energy-sources-distribution/nuclear-energy-uranium/medical-isotopes/23060. Accessed 2024 Jan 10.
70.Weber WA. ET/MR imaging: a critical appraisal. Journal of Nuclear Medicine. 2014;55. PubMed
71.Delso G, Voert E.T., Barbosa F.G., Veit-Haibach P. Pitfalls and limitations in simultaneous PET/MRI. Seminars in Nuclear Medicine. 2015;45(6):552-559. PubMed
72.Positron emission tomography in oncology. Policy forum: health technology policy information. Ottawa (ON): CADTH; 2009: https://www.cadth.ca/sites/default/files/policy_forum_section/PET_Policy_Information_Document_e.pdf. Accessed 2024 Jan 10.
73.Shellock FG CJ. MRI: Bioeffects, safety and patient management. Los Angeles (CA): Biomedical Research Publishing Company; 2014.
74.MRIsafety.com. Safety information article list. 2024; https://www.mrisafety.com/SafetyInformation_list.php. Accessed 2024 Jan 11.
75.Statistics Canada. Quarterly demographic estimates July to September 2019. Ottawa (ON): Government of Canada; 2019: https://www150.statcan.gc.ca/n1/pub/91-002-x/91-002-x2019003-eng.htm. Accessed 2024 Feb 27.
Appendix 1: Introduction to Imaging Modalities Collected in 2022–2023
Note that this appendix has not been copy-edited.
CT
CT employs X-rays as a source of ionizing radiation, sensitive radiation detectors, and computer analysis to create cross-sectional images of the body, including the head, heart, lungs, cardiovascular system, musculoskeletal system, abdomen, pelvis, and spine.21 Specialties that routinely employ CT include neurology, cardiology, oncology, internal medicine, orthopedics, and emergency trauma care.
The main advantages of CT are its speed, which enables rapid imaging and diagnosis in urgent situations, and its ability to visualize fine details in bone, lungs, and other organs.21,29 CT involves exposure to ionizing radiation, which means that the risks and benefits of its use in pregnancy, in young children, and of repeated use must be assessed.21
MRI
MRI uses powerful electromagnetic and radiofrequency fields and computation to produce cross-sectional images of the body, including the head, neck, cardiovascular system, breast, abdomen, pelvis, musculoskeletal system, and spine.22 Specialties that commonly employ MRI include neurology, gastroenterology, cardiology, oncology, internal medicine, orthopedics, and emergency services.22
MRI does not use ionizing radiation, and therefore may be preferred when CT and MRI would provide comparable information, for example, when imaging children.22 MRI provides high sensitivity and soft-tissue details, especially in the abdomen and pelvis, allowing for visualization of anatomy and pathologies. In oncology, this assists early diagnosis, staging and re-staging, identification of treatment response, and detection of recurrence in various cancers.22
A challenge of MRI is that exams can take up to an hour or more, and patients must remain motionless within a narrow enclosure. It may not be suitable for people with claustrophobia, those who cannot lie flat for prolonged periods, or those who are obese.22 The magnetic fields and radiofrequencies used in MRI are incompatible with many common implantable medical devices, such as deep brain stimulators, cochlear implants, and pacemakers.22,60 All people undergoing an MRI exam must be screened beforehand to identify any potentially contraindicated devices or metallic foreign bodies.20,22,60
Nuclear Medicine (SPECT and PET)
SPECT
In nuclear medicine imaging, trace amounts of radiopharmaceuticals are administered to patients intravenously or by injection (e.g., subcutaneously or intradermally), ingestion, or inhalation to visualize areas of radioisotope uptake within the body.47,61 Depending on the radiopharmaceutical administered, the function (i.e., physiology) of almost any organ system can be observed. Nuclear medicine gamma cameras detect the gamma rays emanating from the radioisotope and form flat images; most cameras are also capable of cross-sectional imaging (SPECT).62
Nuclear medicine exams identify and evaluate a variety of pathologies, including cancer, heart disease, as well as gastrointestinal, endocrine, and neurologic disorders. Medical specialties that commonly use SPECT imaging include oncology, neurology, cardiology, internal medicine, orthopedics, pediatrics, pneumology, and infectious disease.47,61
PET
PET uses injection of a sugar or other metabolic tracer labelled with a positron-emitting radioisotope, sensitive radiation detector cameras, and powerful computers to detect and visualize areas of increased metabolism, such as tumours. It creates three-dimensional images of regions of interest, such as brain, bone, and heart.63,64
The main advantage of PET (and its successor PET-CT) imaging is the ability to precisely quantify metabolic processes (e.g., the rate of glucose metabolism) and, depending on the pathology, to more accurately localize abnormalities. PET-radiolabelled sugar (i.e.,18F-FDG) is the most common PET tracer currently used in Canada, but other tracers are becoming available, especially for cardiac and neurologic imaging. Another advantage of PET-CT imaging is that the whole body can be imaged, which is useful for assessing tumour spread or recurrence.
Medical specialties that commonly use PET imaging include oncology, neurology, psychiatry, cardiology, pediatrics, and infectious disease.
Challenges of Nuclear Imaging Modalities
SPECT exams may involve scanning over hours to days (at intervals), although the duration of the imaging may be like that of an MRI. Nuclear medicine also involves exposure to ionizing radiation, which means that the risks and benefits of its use in pregnancy, in young children, and of repeated use must be carefully assessed. Nuclear medicine scans have lower resolution than other imaging modalities.
The cost associated with obtaining and transporting medical radioisotopes is an ongoing concern.65
Hybrid Medical Imaging Technologies (SPECT-CT, PET-CT, and PET-MRI)
Hybrid imaging combines 2 or more imaging modalities to take advantage of the characteristics of each. Therefore, hybrid imaging can simultaneously provide high anatomic detail and metabolic and/or physiological function, enabling more accurate diagnosis, better care pathways, refined treatment regimes, and improved patient outcomes.65
SPECT-CT
SPECT-CT combines SPECT and CT to create three-dimensional images of the body part of interest, such as brain, bone, and heart. Its main advantage is that it offers both metabolic and physiologic information, coupled with the resolution of CT. During a hybrid SPECT-CT, both scans are performed in sequence; the images are then computationally aligned with each other to show anatomic and functional detail, and to enable attenuation correction of the SPECT signal. Medical specialties that commonly use SPECT-CT imaging include oncology, neurology, cardiology, internal medicine, and orthopedics.
The challenges of SPECT-CT are those of the component modalities, both of which involve exposure to ionizing radiation,66 and concerns about availability of radioisotopes.
PET-CT
PET-CT combines the modalities of PET and CT, creating three-dimensional images of the body part of interest, such as brain, bone, and lung. Both scans are performed in sequence during a single session, and the images are computationally aligned.67 PET-CT is commonly used in oncology to diagnose and stage various cancers, such as lung, gastrointestinal, colorectal, breast, and thyroid cancer. Additionally, PET-CT is commonly employed to diagnose neurologic, cardiovascular, infectious, and inflammatory pathologies, and the CT component is used to detect coronary artery calcification, a marker of coronary atherosclerosis.65
The main advantage of PET-CT is the ability to demonstrate metabolic information with the precise anatomic detail of multislice high resolution CT images; as a result, PET-CT has replaced PET in Canada. Medical specialties that commonly use PET-CT imaging include oncology, neurology, cardiology, internal medicine, and orthopedics.
The challenges of PET-CT are those of the component modalities, both of which involve exposure to ionizing radiation.65,68,69 The radioisotopes used in PET-CT have a half-life measured in hours, so imaging depends on availability of a cyclotron and transportation.
PET-MRI
PET-MRI combines PET with MRI,70 permitting high-sensitivity metabolic imaging with high resolution of soft-tissue detail, enabling visualization of anatomy and pathologies not commonly attainable with other modalities. The 2 scans are performed in tandem, and the images are then computationally aligned. PET-MRI is the newest combination to reach clinical use and has applications in oncology, neurology, cardiology, internal medicine, and orthopedics.71,72
PET-MRI requires injection of radioisotope tracers and therefore requires the same risk-benefit assessment as other nuclear medicine imaging modalities for females of reproductive age and children.73,74 Since the CT component is replaced by MRI, X-ray exposure is avoided; however, the hazards of magnetic fields remain.73,74 The radioisotopes have a short half-life, requiring proximity to a cyclotron. The units and their infrastructure requirements are extremely expensive.
Appendix 2: Definitions in the CMII 2022–2023 Report
Note that this appendix has not been copy-edited.
Picture Archiving and Communication Systems
PACS refers to an electronic system used to digitally manage images, including transmission, filing, storage, distribution, and retrieval of medical images. It is networked and frequently web-based. Combined with other web-based telehealth technologies, PACS allows timely access to medical images and specialists. PACS has replaced film and film library systems.
Access to images outside medical imaging departments by referring and consulting physicians is important for efficient patient care, particularly so in a country like Canada, with its large geographic size and dispersed population.
Type of Facility Operating Imaging Equipment
Hospital
An institution where patients are provided with continuing medical care and supporting diagnostic and therapeutic services. Hospitals are licensed or approved as hospitals by a provincial or territorial government or are operated by the Government of Canada. Included are those providing acute care.
Tertiary Care
A hospital that provides tertiary care, which is health care from specialists who investigate and treat patients in a large hospital after referral from primary care and secondary care facilities.
Private Facility
A health care facility that operates privately but that is either privately or publicly funded, that ranges from specialized services by physicians, radiologists, dentists, chiropractors, or via mammography programs, to broad-based imaging centres offering a wide range of tests.
Community Hospital
A short-term (average length of stay with fewer than 30 days) hospital that provides acute care.
Appendix 3: Summary Tables for the CMII 2022–2023
Note that this appendix has not been copy-edited.
Table 9: Number of Facilities With CT, MRI, PET-CT, PET-MRI, SPECT, and SPECT-CT Capacity, 2022–2023
Province or territory | CT | MRI | PET-CT | PET-MRI | SPECT | SPECT-CT |
|---|---|---|---|---|---|---|
Number of sitesa (number of private sites)b | ||||||
Alberta | 39 (3) | 28 (10) | 4 (0) | 1 (0) | 23 (17) | 23 (10) |
British Columbia | 50 (4) | 44 (12) | 4 (1) | 1 (0) | 10 (0) | 25 (0) |
Manitoba | 17 (0) | 8 (0) | 1 (0) | 0 (0) | 3 (0) | 5 (0) |
New Brunswick | 11 (0) | 9 (1) | 2 (0) | 0 (0) | 5 (0) | 5 (0) |
Newfoundland and Labrador | 14 (0) | 5 (0) | 1 (0) | 0 (0) | 1 (0) | 3 (0) |
Northwest Territories | 1 (0) | 0 (0) | 0 (0) | 0 (0) | 0 (0) | 0 (0) |
Nova Scotia | 14 (0) | 10 (1) | 1 (0) | 0 (0) | 7 (0) | 9 (1) |
Nunavut | 1 (0) | 0 (0) | 0 (0) | 0 (0) | 0 (0) | 0 (0) |
Ontario | 124 (9) | 89 (11) | 18 (2) | 4 (0) | 63 (9) | 56 (0) |
Prince Edward Island | 2 (0) | 1 (0) | 0 (0) | 0 (0) | 0 (0) | 1 (0) |
Quebec | 105 (13) | 92 (32) | 20 (3) | 0 (0) | 23 (0) | 50 (0) |
Saskatchewan | 15 (2) | 9 (4) | 1 (0) | 0 (0) | 3 (0) | 3 (0) |
Yukon | 1 (0) | 1 (0) | 0 (0) | 0 (0) | 0 (0) | 0 (0) |
Canada | 394 (31) | 296 (71) | 52 (6) | 6 (0) | 138 (26) | 180 (11) |
aPer-jurisdiction site counts according to the validator if the validator provided lists of sites with availability; where these were unavailable, the data were from the survey.
bFree standing site — a health care facility that operates privately but that is either privately or publicly funded.
Table 10: Summary of Type of Facility Included in the CMII, 2022–2023
Province or territory | Hospital | Community hospital | Tertiary care | Private |
|---|---|---|---|---|
Number of sites (% in each jurisdiction) | ||||
Alberta | 19 (39.6) | 13 (27.1) | 2 (4.2) | 14 (29.2) |
British Columbia | 36 (63.2) | 12 (21.1) | 6 (10.5) | 3 (5.3) |
Manitoba | 13 (72.2) | 1 (5.6) | 3 (16.7) | 1 (5.6) |
New Brunswick | 10 (90.9) | 0 (0) | 1 (9.1) | 0 (0) |
Newfoundland and Labrador | 14 (100) | 0 (0) | 0 (0) | 0 (0) |
Northwest Territories | 1 (100) | 0 (0) | 0 (0) | 0 (0) |
Nova Scotia | 8 (53.3) | 2 (13.3) | 4 (26.7) | 1 (6.7) |
Nunavut | 1 (100) | 0 (0) | 0 (0) | 0 (0) |
Ontario | 77 (61.6) | 22 (17.6) | 10 (8) | 16 (12.8) |
Prince Edward Island | 2 (100) | 0 (0) | 0 (0) | 0 (0) |
Quebec | 84 (70.6) | 0 (0) | 3 (2.5) | 32 (26.9) |
Saskatchewan | 8 (50) | 0 (0) | 5 (37.5) | 2 (12.5) |
Yukon | 1 (100) | 0 (0) | 0 (0) | 0 (0) |
Canada | 274 (64.2) | 50 (11.7) | 34 (8.0) | 69 (16.2) |
Notes: Survey response data were available for 427 of the 467 sites with reported advanced imaging capacity.
Data derived from survey question: “What type of facility is this?”
The table includes only those facilities that responded to the above survey question. In some instances, validator responses supplemented survey responses.
Hospital = An institution where patients are provided with continuing medical care and supporting diagnostic and therapeutic services. Hospitals are licensed or approved as hospitals by a provincial or territorial government or are operated by the Government of Canada. Included are those providing acute care.
Tertiary care = A hospital that provides tertiary care, which is health care from specialists who investigate and treat patients in a large hospital after referral from primary care and secondary care facilities.
Community hospital = A short-term (average length of stay with fewer than 30 days) hospital that provides acute care.
Private = A health care facility that operates privately but that is either privately or publicly funded.
Table 11: Summary of Location of Facilities Included in the CMII, 2022–2023
Province or territory | Urban | Rural | Remote |
|---|---|---|---|
Number of sites (% in each jurisdiction) | |||
Alberta | 24 (50) | 24 (50) | 0 (0) |
British Columbia | 34 (59.6) | 20 (35.1) | 3 (5.3) |
Manitoba | 10 (55.6) | 8 (44.4) | 0 (0) |
New Brunswick | 8 (72.7) | 3 (27.3) | 0 (0) |
Newfoundland and Labrador | 5 (35.7) | 9 (64.3) | 0 (0) |
Northwest Territories | 0 (0) | 0 (0) | 1 (100) |
Nova Scotia | 8 (53.3) | 7 (46.7) | 0 (0) |
Nunavut | 0 (0) | 0 (0) | 1 (100) |
Ontario | 75 (68.2) | 32 (29.1) | 3 (2.7) |
Prince Edward Island | 2 (100) | 0 (0) | 0 (0) |
Quebec | 34 (89.5) | 3 (7.9) | 1 (2.6) |
Saskatchewan | 9 (56.2) | 6 (37.5) | 1 (6.2) |
Yukon | 0 (0) | 0 (0) | 1 (100) |
Canada | 209 (63.0) | 112 (33.7) | 11 (3.3) |
Notes: Survey response data were available for 332 of the 467 sites with reported advanced imaging capacity.
Data derived from survey question: “In which of the following settings are you located?”
The table includes only those facilities that responded to the above survey question. In some instances, validator responses supplemented survey responses.
Table 12: Summary of Source of Funding for Sites Included in the CMII, 2022–2023
Province or territory | Publicly | Privately | Both |
|---|---|---|---|
Number of sites (%) | |||
Alberta | 42 (97.7) | 0 (0) | 1 (2.3) |
British Columbia | 49 (100) | 0 (0) | 0 (0) |
Manitoba | 18 (100) | 0 (0) | 0 (0) |
New Brunswick | 8 (88.9) | 0 (0) | 1 (11.1) |
Newfoundland and Labrador | 13 (100) | 0 (0) | 0 (0) |
Northwest Territories | 1 (100) | 0 (0) | 0 (0) |
Nova Scotia | 10 (100) | 0 (0) | 0 (0) |
Nunavut | 1 (100) | 0 (0) | 0 (0) |
Ontario | 76 (75.2) | 14 (13.9) | 11 (10.9) |
Prince Edward Island | 2 (100) | 0 (0) | 0 (0) |
Quebec | 84 (72.4) | 32 (27.6) | 0 (0) |
Saskatchewan | 13 (100) | 0 (0) | 0 (0) |
Yukon | 1 (100) | 0 (0) | 0 (0) |
Canada | 318 (84.4) | 46 (12.2) | 13 (3.4) |
Notes: Survey response data were available for 377 of the 467 sites with reported advanced imaging equipment.
Data derived from the survey question: “How is this facility funded?”
The table includes only those facilities that responded to the above survey question. In some instances, validator responses supplemented survey responses. Some private facilities receive public funding.
Table 13: Average Age of Imaging Equipment, 2022–2023
Modality | Number of sites | Number of units | Average age (years, minimum to maximum) |
|---|---|---|---|
CT | 238 | 332 | 8.2 (0 to 23) |
MRI | 139 | 202 | 8.4 (0 to 23) |
PET-CTa | 29 | 33 | 7.2 (0 to 30) |
PET-MRI | 3 | 3 | 6.7 (5 to 8) |
SPECT | 62 | 90 | 14.5 (0 to 26) |
SPECT-CT | 103 | 185 | 9.5 (0 to 19) |
Notes: Data derived from the survey question: “What year did (or will) the [modality] unit become operational?” subtracted from 2023. Units yet to be installed and units that did not have a reported installation date were not included in this table.
The table includes only those facilities that responded to the above survey question.
aIncludes a combination of PET-CT and PET only machines.
Table 14: Age of the Imaging Units in Years, 2022–2023
Modality | Yearsa | ||||
|---|---|---|---|---|---|
5 or less | 6 to 10 | 11 to 15 | 16 to 20 | More than 20 | |
Number of units (% by year category) | |||||
CT | 99 (29.8) | 122 (36.7) | 85 (25.6) | 23 (6.9) | 3 (0.9) |
MRI | 71 (35.1) | 56 (27.7) | 47 (23.3) | 23 (11.4) | 5 (2.5) |
PET-CT | 17 (51.5) | 7 (21.2) | 7 (21.2) | 0 (0) | 2 (6.1) |
PET-MRI | 1 (33.3) | 2 (66.7) | 0 (0) | 0 (0) | 0 (0) |
SPECT | 8 (8.9) | 17 (18.9) | 18 (20.0) | 33 (36.7) | 14 (15.6) |
SPECT-CT | 35 (18.9) | 66 (35.7) | 58 (31.4) | 26 (14.1) | 0 (0) |
Note: Data derived from the survey question: “What year was this unit installed?” The table includes only those facilities that responded to the survey question.
aAge for each unit was calculated by subtracting year of first operation from 2023.
Table 15: Number of Sites With an Appropriateness Review Process by Province and Territory, 2022–2023
Province and territory | Review process exists | Radiologist review process | Technologist review process | Clinical decision support toola process | Computer-aided order entry process |
|---|---|---|---|---|---|
Number of sites | |||||
Alberta | 21 | 21 | 5 | 0 | 0 |
British Columbia | 46 | 44 | 30 | 18 | 2 |
Manitoba | 9 | 8 | 3 | 9 | 1 |
New Brunswick | 3 | 3 | 3 | 0 | 0 |
Newfoundland and Labrador | 9 | 9 | 9 | 0 | 0 |
Northwest Territories | 1 | 1 | 1 | 0 | 0 |
Nova Scotia | 10 | 10 | 6 | 0 | 0 |
Nunavut | 1 | 0 | 1 | 0 | 0 |
Ontario | 58 | 55 | 53 | 12 | 12 |
Prince Edward Island | 1 | 1 | 1 | 0 | 0 |
Quebec | NR | NR | NR | NR | NR |
Saskatchewan | 13 | 13 | 13 | 10 | 7 |
Yukon | 1 | NR | NR | NR | NR |
Canada | 173 | 165 | 125 | 49 | 22 |
NR = not reported.
Note: Data derived from the survey question: “What process is used to determine the appropriateness of orders received?”
aA clinical decision support tool provides real-time guidance to the referring physician on the appropriateness of a diagnostic imaging test for a given patient during the ordering process.
Table 16: Change in Number of CT Units Since 2012 and 2019 to 2022 Compared With 2022–2023
Province | Change in number of units since 2012 | % Change in number of units since 2012 | Change in number of units since 2019 | % Change in number of units since 2019 |
|---|---|---|---|---|
Alberta | 3 | 6.0% | −2 | −3.6% |
British Columbia | 3 | 4.2% | 6 | 8.7% |
Manitoba | 3 | 14.3% | 2 | 9.1% |
New Brunswick | −2 | −11.8% | −2 | −11.8% |
Newfoundland and Labrador | 2 | 14.3% | 1 | 6.7% |
Northwest Territories | 0 | 0% | 0 | 0% |
Nova Scotia | 2 | 12.5% | 1 | 5.9% |
Nunavut | 1 | — | 0 | 0% |
Ontario | 24 | 14.3% | 23 | 13.6% |
Prince Edward Island | 0 | 0% | 0 | 0% |
Quebec | 12 | 9.1% | −20 | −12.2% |
Saskatchewan | 2 | 12.5% | 2 | 12.5% |
Yukon | 0 | 0% | 0 | 0% |
Canada | 50 | 9.8% | 11 | 2.0% |
“—” = not applicable.
Note: The percentage of change in the number of units was calculated for jurisdictions with at least 1 operational unit in 2012 or 2019–2020.
Table 17: Change in Number of MRI Units Since 2012 and 2019 to 2022 Compared With 2022–2023
Province | Change in number of units since 2012 | % Change in number of units since 2012 | Change in number of units since 2019 | % Change in number of units since 2019 |
|---|---|---|---|---|
Alberta | 4 | 10.3% | −1 | −2.3% |
British Columbia | 15 | 37.5% | 3 | 5.8% |
Manitoba | 6 | 75% | 0 | 0% |
New Brunswick | 5 | 83.3% | −3 | −21.4% |
Newfoundland and Labrador | 0 | 0% | 0 | 0% |
Northwest Territories | 0 | — | 0 | — |
Nova Scotia | 2 | 22.2% | 0 | 0% |
Nunavut | 0 | — | 0 | — |
Ontario | 53 | 51% | 33 | 26.6% |
Prince Edward Island | 0 | 0% | 0 | 0% |
Quebec | 33 | 36.7% | 21 | 20.6% |
Saskatchewan | 5 | 83.3% | 1 | 10% |
Yukon | 1 | — | 0 | 0% |
Canada | 124 | 40.3% | 54 | 14.3% |
“—” = not applicable.
Note: The percentage of change in the number of units was calculated for jurisdictions with at least 1 operational unit in 2012 or 2019–2020.
Table 18: Change in Number of PET-CT Units Since 2012 and 2019 to 2022 Compared With 2022–2023
Province | Change in number of units since 2012 | % Change in number of units since 2012 | Change in number of units since 2019 | % Change in number of units since 2019 |
|---|---|---|---|---|
Alberta | 2 | 66.7% | 1 | 25% |
British Columbia | 2 | 66.7% | 1 | 25% |
Manitoba | 0 | 0% | 0 | 0% |
New Brunswick | 1 | 100% | 0 | 0% |
Newfoundland and Labrador | 1 | — | 0 | 0% |
Northwest Territories | 0 | — | 0 | — |
Nova Scotia | 0 | 0% | 0 | 0% |
Nunavut | 0 | — | 0 | — |
Ontario | 5 | 33.3% | 0 | 0% |
Prince Edward Island | 0 | — | 0 | — |
Quebec | 5 | 26.3% | 1 | 4.3% |
Saskatchewan | 1 | — | 0 | 0% |
Yukon | 0 | — | 0 | —% |
Canada | 17 | 39.5% | 3 | 5.3% |
“—” = not applicable.
Note: The percentage of change in the number of units was calculated for jurisdictions with at least 1 operational unit in 2012 or 2019–2020.
Table 19: Change in Number of SPECT Units Since 2012 and 2019 to 2022 Compared With 2022–2023
Province | Change in number of units since 2012 | % Change in number of units since 2012 | Change in number of units since 2019 | % Change in number of units since 2019 |
|---|---|---|---|---|
Alberta | 16 | 80% | −1 | −2.7% |
British Columbia | −38 | −70.4% | −8 | −33.3% |
Manitoba | −7 | –63.6% | −2 | −33.3% |
New Brunswick | −10 | −62.5% | −5 | −45.5% |
Newfoundland and Labrador | −7 | −87.5% | −2 | −66.7% |
Northwest Territories | 0 | — | 0 | — |
Nova Scotia | −8 | −53.3% | 0 | 0% |
Nunavut | 0 | — | 0 | — |
Ontario | −112 | −52.3% | −33 | −24.4% |
Prince Edward Island | −1 | −100% | 0 | — |
Quebec | –86 | −72.9% | −43 | −57.3% |
Saskatchewan | −3 | −33.3% | −1 | −14.3% |
Yukon | 0 | — | 0 | — |
Canada | –256 | –54.9% | –95 | –31.1% |
“—” = not applicable.
Note: The percentage of change in the number of units was calculated for jurisdictions with at least 1 operational unit in 2012 or 2019–2020.
Table 20: Change in Number of SPECT-CT Units Since 2012 and 2019 to 2022 Compared With 2022–2023
Province | Change in number of units since 2012 | % Change in number of units since 2012 | Change in number of units since 2019 | % Change in number of units since 2019 |
|---|---|---|---|---|
Alberta | 15 | 62.5% | 1 | 2.6% |
British Columbia | 35 | 233.3% | 20 | 66.7% |
Manitoba | 5 | 100% | 2 | 25.0% |
New Brunswick | 7 | 700% | 3 | 60% |
Newfoundland and Labrador | 6 | 300% | −1 | −11.1% |
Northwest Territories | 0 | — | 0 | — |
Nova Scotia | 4 | 80% | −1 | −10% |
Nunavut | 0 | — | 0 | — |
Ontario | 52 | 130% | 7 | 8.2% |
Prince Edward Island | 1 | 100% | 0 | 0% |
Quebec | 65 | 154.8% | 31 | 40.8% |
Saskatchewan | −1 | −14.3% | −2 | −25% |
Yukon | 0 | — | 0 | — |
Canada | 189 | 133.1% | 60 | 22.1% |
“—” = not applicable.
Note: The percentage of change in the number of units was calculated for jurisdictions with at least 1 operational unit in 2012 or 2019–2020.
Table 21: Sources of Funding for Imaging Equipment, 2022–2023
Province or territory | Provincial funding, % | Charitable donation, % | Stimulus program, % | Research program, % |
|---|---|---|---|---|
Alberta | 90 | 10 | 0 | 0 |
British Columbia | 40 to 60 | 40 to 60 (hospital foundation) | 0 | 10 to 20 (few units, usually postsecondary institutions) |
Manitoba | 90 to 100 | 0 | 0 | 0 |
New Brunswicka | 90 | 10 | 0 | 0 |
Newfoundland and Labrador | 99 | 1 (various health care foundations) | 0 | 0 |
Northwest Territories | 100 | Additional features funded by the regional hospital foundation | 0 | 0 |
Nova Scotia | 100 | Yes (hospital foundations and auxiliaries) | 0 | 0 |
Nunavut | 90 | 0 | 10 b | 0 |
Ontarioc | 100 (PET-CT only) | Yes (the vast majority of charitable donations are provided through hospital foundations) | 0 | Yes |
Prince Edward Island | 0 | 100 | 0 | 0 |
Quebec | 95 | 5 | 0 | 0 |
Saskatchewan | 35 | 65 | 0 | 0 |
Yukon | Yes | Yes | 0 | 0 |
NR = not reported.
Note: Data from question: “What are the sources of funding for imaging equipment at your site?”
aResponse was from Horizon Health Network, one of 2 New Brunswick regional health authorities.
bFederal stimulus program.
cResponse was from Cancer Care Ontario, which only oversees PET-CT use in Ontario.
Table 22: Factors That Inform Decisions About Replacing, Upgrading, or Adding New Imaging Equipment Across Jurisdictions in Canada, 2022–2023
Decision | AB | BC | MB | NB | NL | NS | NT | NU | ON | PE | QC | SK | YK |
|---|---|---|---|---|---|---|---|---|---|---|---|---|---|
Evolving clinical practice, guideline or evidence | |||||||||||||
Replace | 7 | 5 | 3 | 6 | 2 | 6 | 6 | 7 | NR | NR | 6 | NR | 3 |
Upgrade | 9 | 6 | 8 | 8 | 2 | NR | 3 | 8 | —a | 7 | 6 | 7 | 3 |
New | 9 | 8 | 7 | 8 | 7 | 8 | 9 | 9 | NR | 8 | 8 | 6 | 3 |
Equipment age | |||||||||||||
Replace | 6 | 7 | 6 | 2 | 4 | 7 | 9 | 9 | —b | 7 | 8 | 9 | 7 |
Upgrade | 5 | 7 | 6 | NR | 4 | 9 | 7 | 8 | NR | NR | 7 | NR | 7 |
New | — | — | — | NR | — | NR | 6 | 7 | NR | NR | NR | NR | 7 |
End of manufacturer support, obsolescence, and reduced availability of parts | |||||||||||||
Replace | 8 | 8 | 9 | 7 | 9 | 9 | 8 | 9 | NR | 9 | 9 | 9 | 9 |
Upgrade | 7 | 8 | 9 | NR | 8 | NR | 9 | 7 | NR | NR | 9 | NR | 9 |
New | — | — | — | NR | — | NR | 3 | 8 | NR | NR | NR | NR | 9 |
Equipment failure, reliability, and downtime | |||||||||||||
Replace | 9 | 9 | 7 | 9 | 8 | 8 | 7 | 8 | NR | 8 | 7 | NR | 6 |
Upgrade | — | 9 | 5 | NR | 7 | 7 | 8 | 9 | NR | NR | 8 | 7 | 6 |
New | — | — | — | NR | — | NR | 4 | 7 | NR | NR | NR | NR | 6 |
Evolving patient volumes, demographics, and clinical demand | |||||||||||||
Replace | 3 | 8 | 3 | 5 | 5 | 3 | 5 | 7 | NR | NR | 5 | NR | 4 |
Upgrade | 8 | 8 | 3 | 9 | 5 | 6 | 4 | 8 | NR | NR | 5 | NR | 4 |
New | 8 | 9 | 9 | 9 | 8 | 9 | 7 | 9 | — | 9 | 9 | 9 | 4 |
Capital or operational budget | |||||||||||||
Replace | 5 | 9 | 8 | 8 | 7 | 2 | —d | 7 | NR | NR | 2 | NR | 8 |
Upgrade | 6 | 9 | 8 | NR | 9 | 8 | 6 | 8 | NR | NR | 2 | NR | 8 |
New | — | 9 | 8 | NR | 9 | NR | 8 | 9 | NR | NR | 7 | 8 | 8 |
Service repair budget | |||||||||||||
Replace | 2 | 5 | 2 | 3 | 4e | 4 | — | 7 | NR | NR | 3 | 7 | 5 |
Upgrade | — | 5 | 2 | NR | 6 | NR | 5 | 8 | NR | 8 | 3 | NR | 5 |
New | — | 5 | — | NR | — | NR | 5 | 9 | NR | NR | 5 | 7 | 5 |
Radiation dose reduction | |||||||||||||
Replace | 4 | 6 | 4 | 4 | 3 | 5 | 4 | 8 | NR | NR | 4 | 5 | 2 |
Upgrade | 4 | 6 | 4 | 7 | 3 | 5 | 2 | 9 | NR | 9 | 4 | 5 | 2 |
New | — | 8 | — | NR | 6 | NR | 2 | 7 | NR | NR | 6 | 5 | 2 |
Other | |||||||||||||
Replace | NR | NR | NR | NR | NR | NR | NR | NR | NR | NR | NR | NR | NR |
Upgrade | NR | NR | NR | NR | NR | NR | NR | NR | NR | NR | NR | NR | NR |
New | NR | NR | NR | NR | NR | NR | NR | NR | NR | NR | NR | NR | NR |
“—” = not applicable, AB = Alberta; BC = British Columbia; MB = Manitoba; NB = New Brunswick; NL = Newfoundland and Labrador; NR = not reported; NS = Nova Scotia; NT = Northwest Territories, NU = Nunavut; ON = Ontario; PE = Prince Edward Island; QC = Quebec; SK = Saskatchewan; YT = Yukon.
Notes: 1 = least important, 9 = most important.
Data from question: “When making decisions about replacing, upgrading, or adding new imaging equipment, what are the main drivers that dictate jurisdictional decisions?”
aUpgrade: Ontario Health does not currently have a mechanism to fund upgrades. Currently, we have limited line of sight about upgrades to PET/CT systems through other funding sources.
bReplacement: Age of the equipment is the primary driver of prioritization of replacement machine funding. Ontario’s definition of equipment life cycle may differ from those provided by professional groups in Canada.
cNew: Evolving patient volumes/demographics is the primary driver for prioritizing the addition of new machines within the PET Capital Investment Strategy. All other drivers are considered in determining when and where a new machine is installed.
dEvergreening program: each piece of equipment is on a list for replacement, with dedicated budget dedicated for the prompt replacement of the aging equipment.
eThis should be included with operational budget.
Table 23: Criteria Used to Expand Imaging Modalities to New Geographic Locations, 2022–2023
Province or territory | Criteria used |
|---|---|
Alberta |
|
British Columbia |
|
Manitoba |
|
New Brunswicka |
|
Newfoundland and Labrador |
|
Northwest Territories |
|
Nova Scotia |
|
Nunavut |
|
Ontario |
|
Prince Edward Island |
|
Quebec |
|
Saskatchewan |
|
Yukon |
|
Note: Data derived from the question: “What criteria are used when expanding imaging modalities into new geographic locations where they did not previously exist?”
aResponse was from Horizon Health Network.
Appendix 4: Supplementary Figures for the CMII 2022–2023
Note that this appendix has not been copy-edited.
Figure 30: Percentage of Participating Publicly Funded Facilities by Province and Territory, 2022–2023
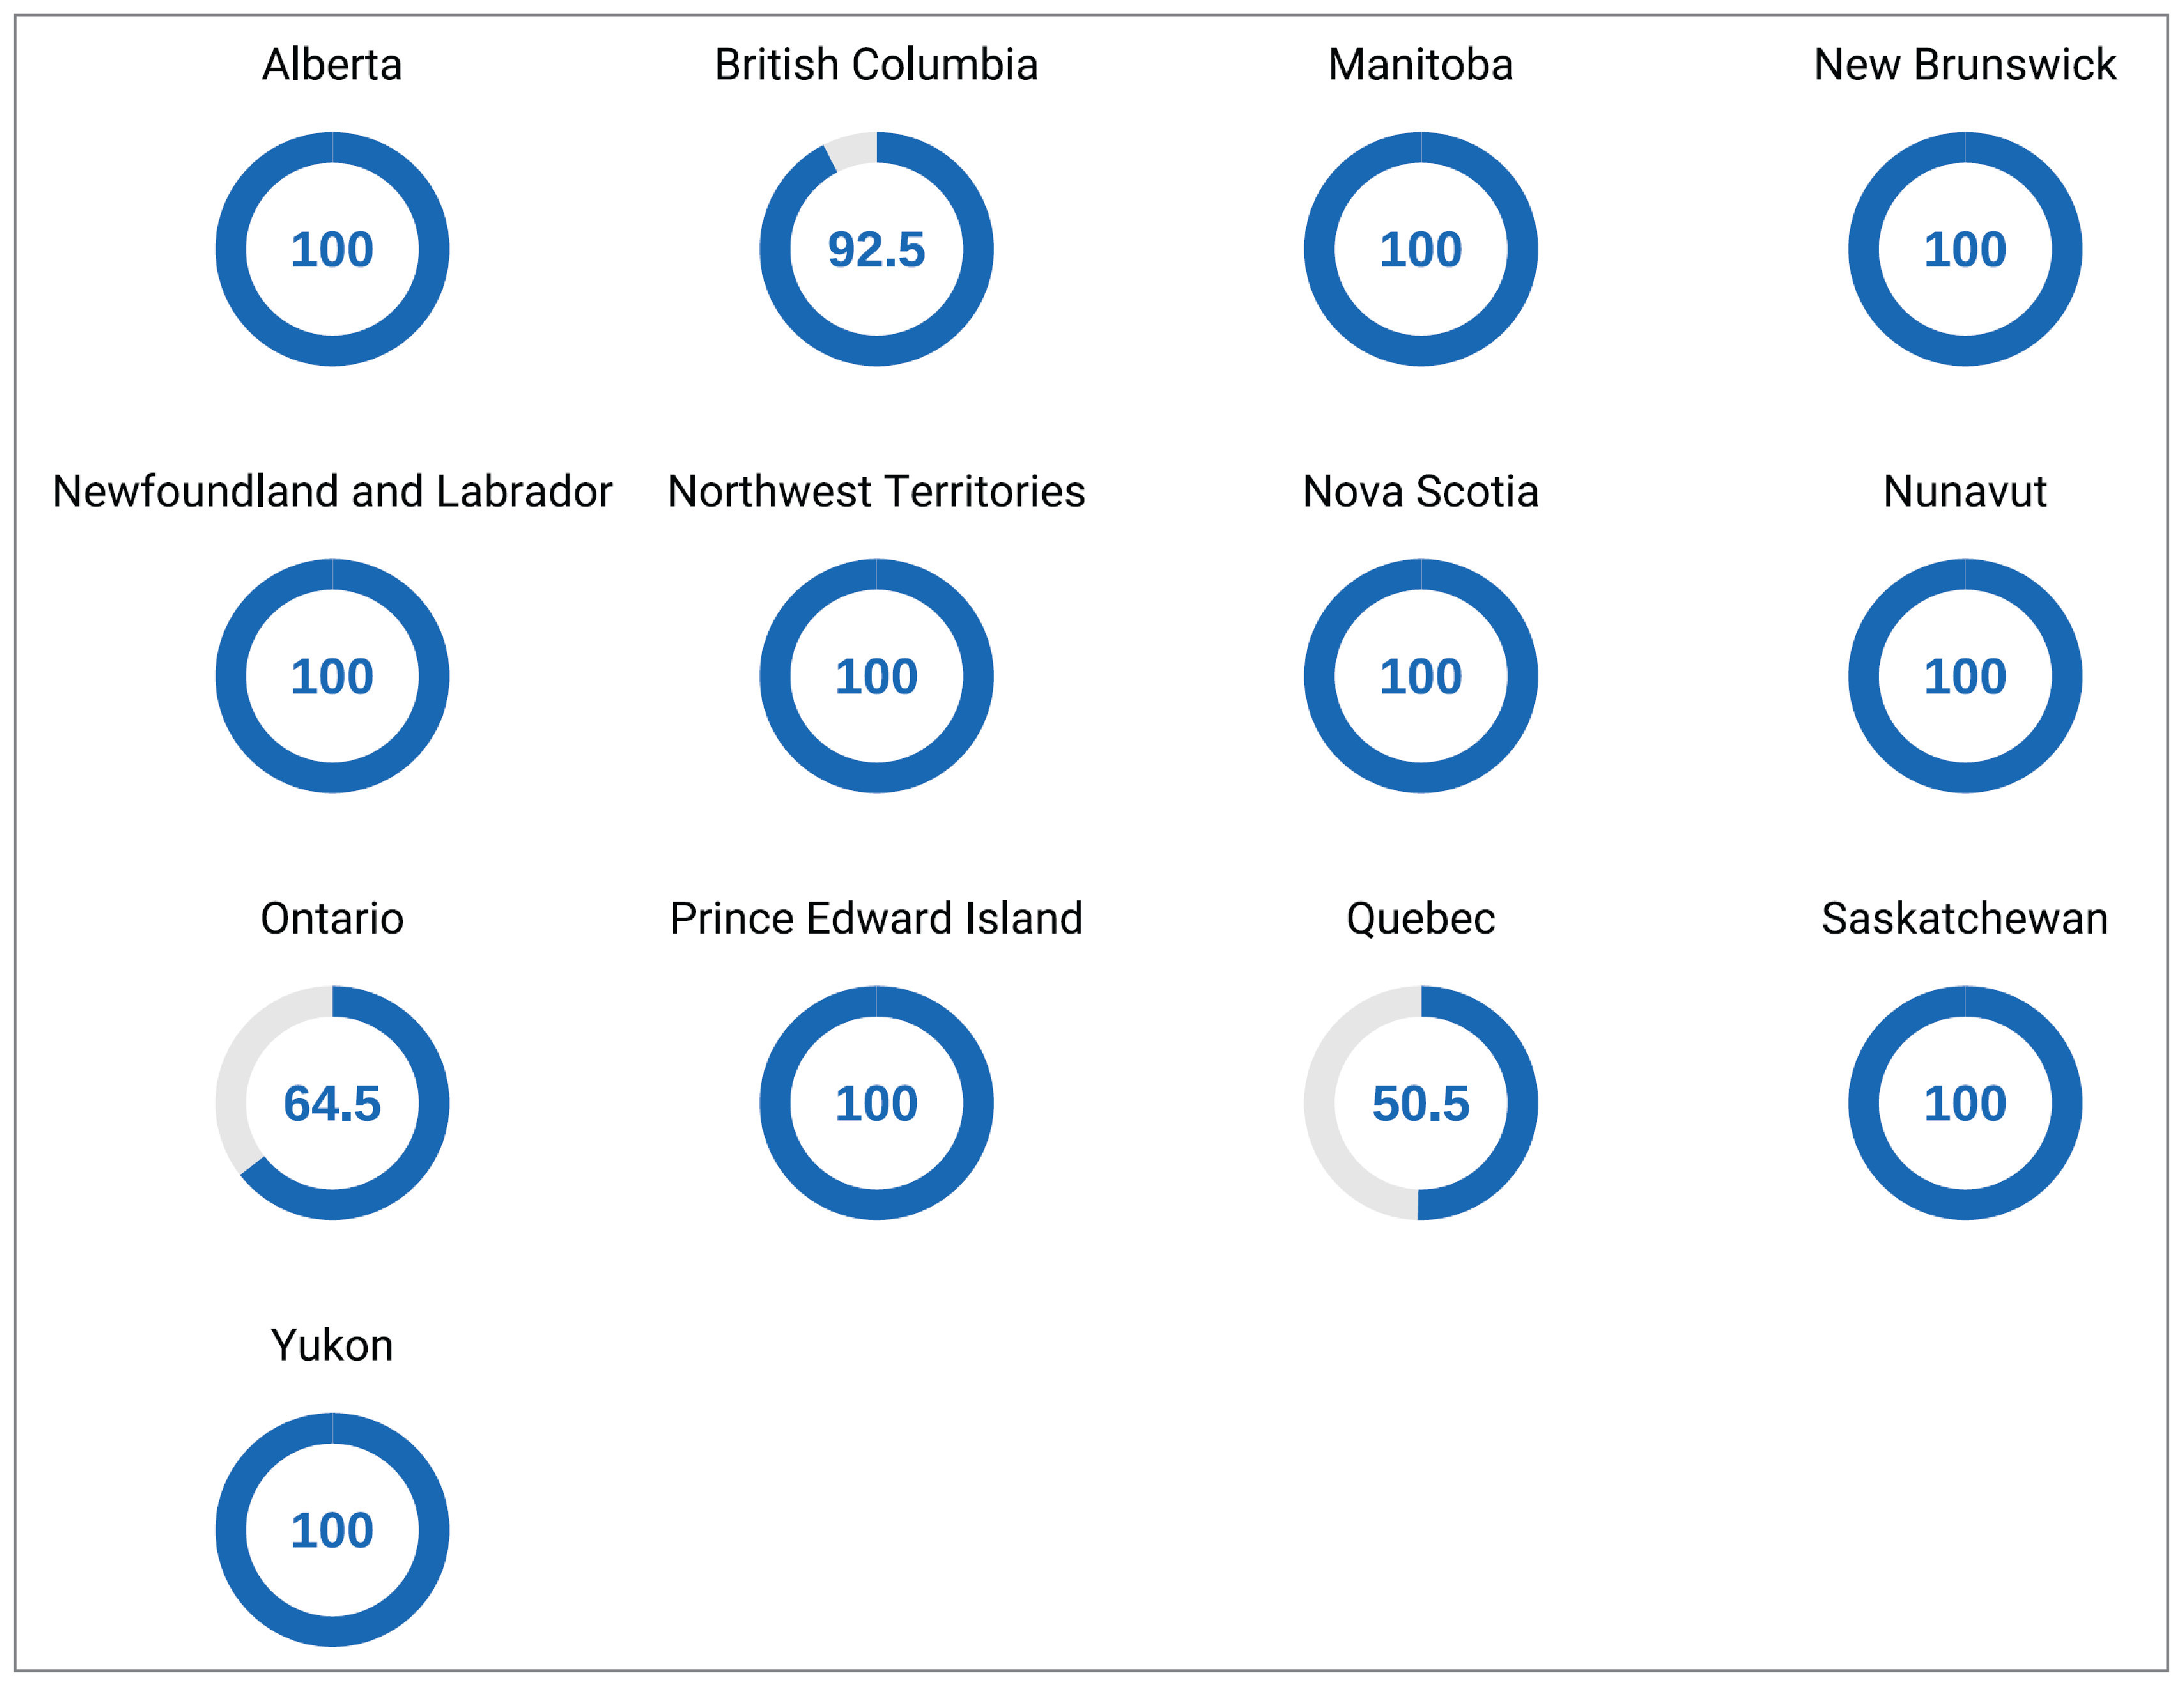
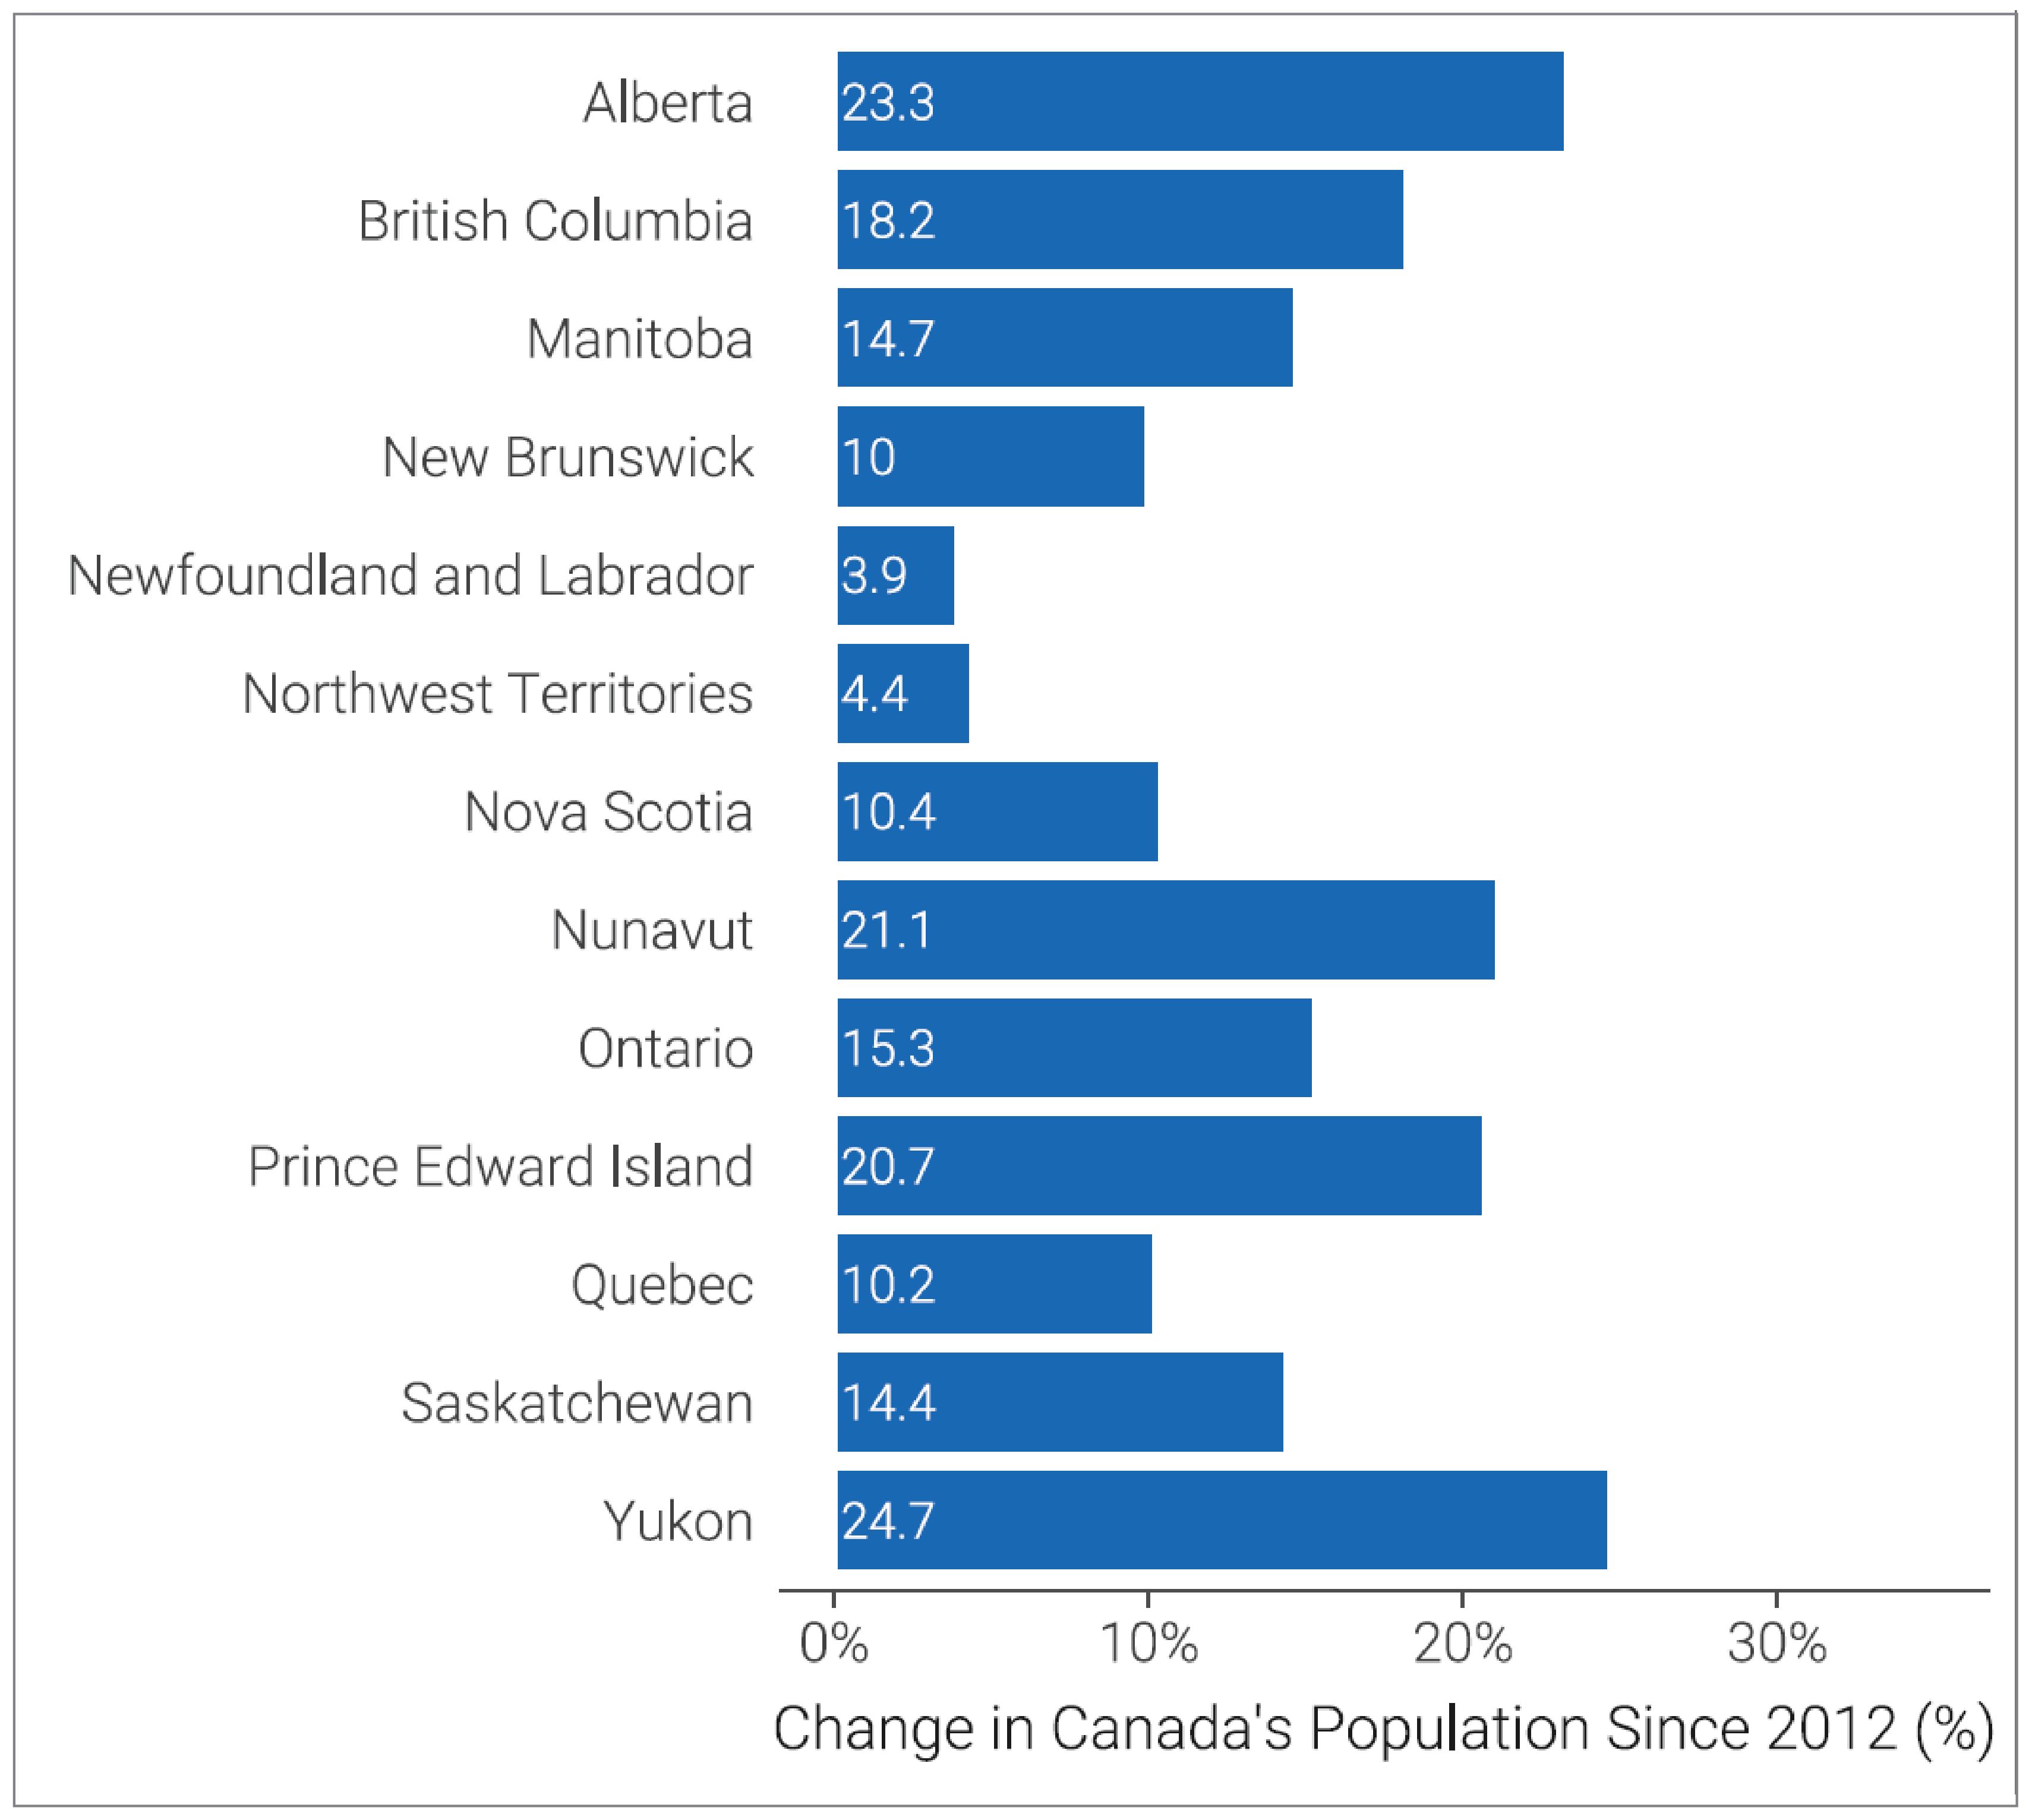
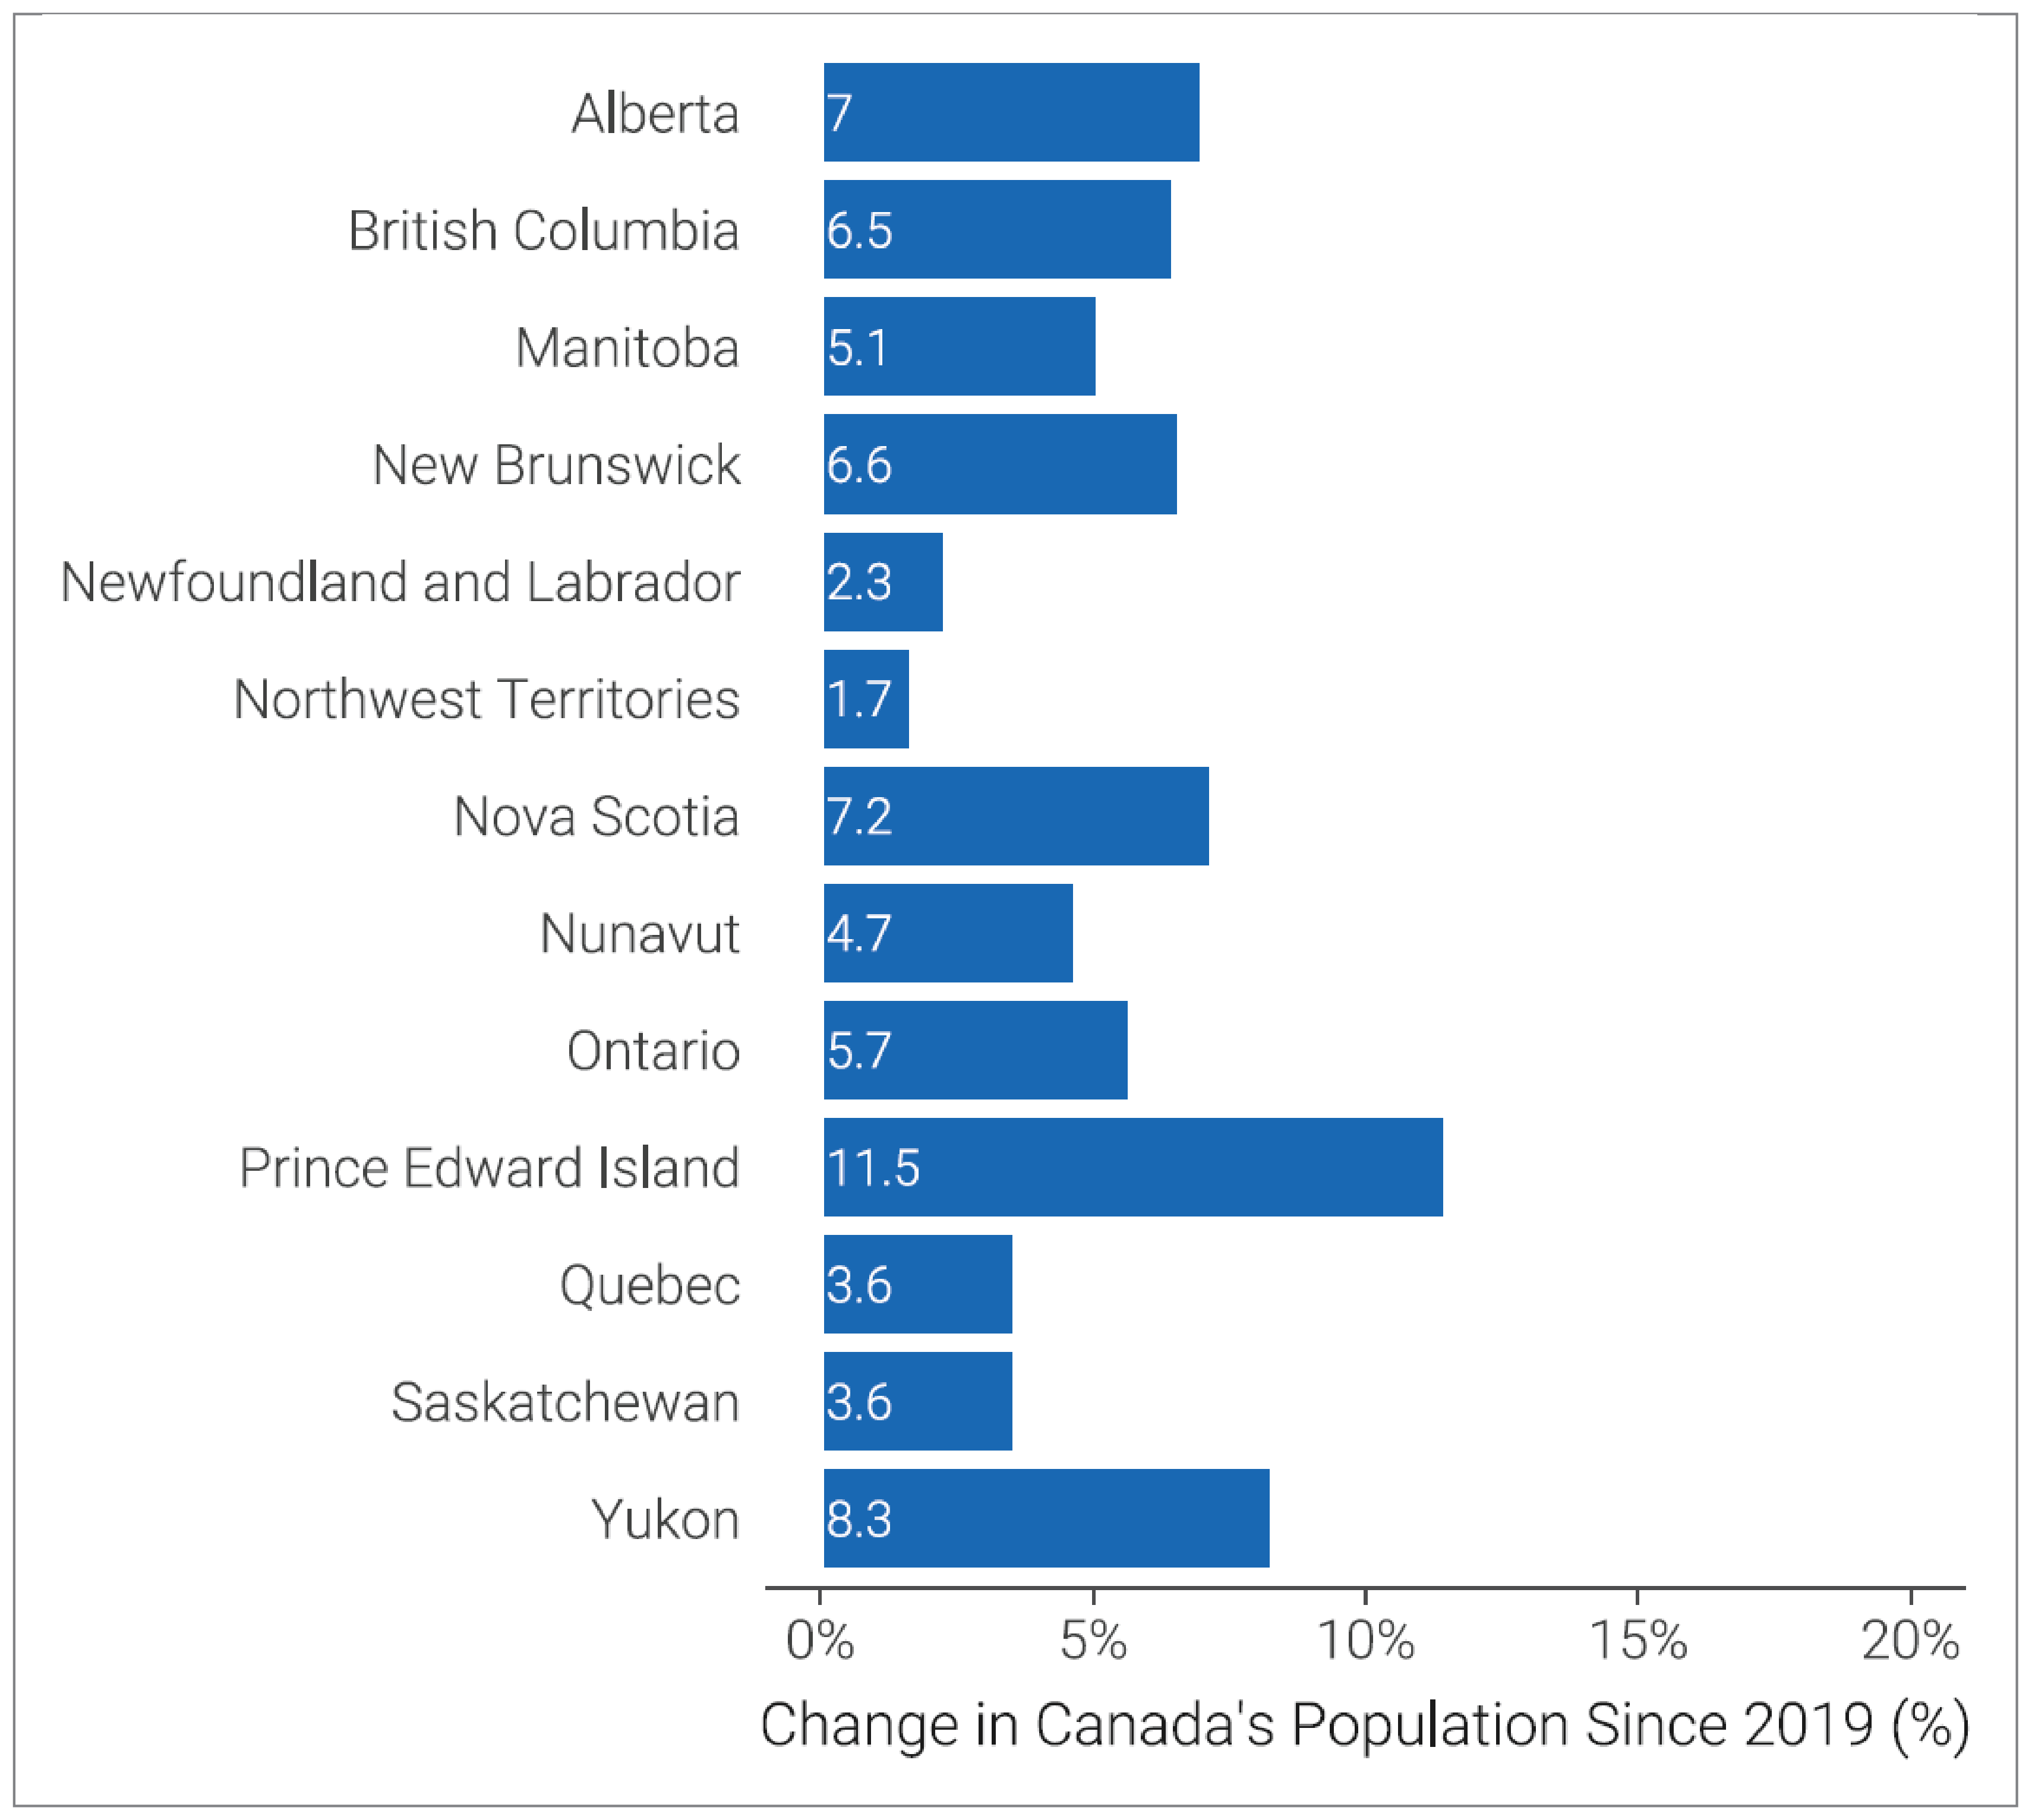
Appendix 5: Note for Age of Imaging Equipment
Note that this appendix has not been copy-edited.
Data were available for CT and MRI throughout the period of reporting (2003 to 2022–2023). PET and PET-CT were reported separately until the survey of 2012 and combined for the survey of 2015 and after. Since 2019–2020, PET units have largely been replaced by PET-CT units. A similar, although slower, replacement appears to involve the replacement of SPECT by SPECT-CT. In the earlier iterations of the survey, SPECT units were reported in combination with planar cameras under the category “nuclear medicine,” and data on SPECT-CT were collected only for the later years of the inventory.
ISSN: 2563-6596
Disclaimer: The information in this document is intended to help Canadian health care decision-makers, health care professionals, health systems leaders, and policy-makers make well-informed decisions and thereby improve the quality of health care services. While patients and others may access this document, the document is made available for informational purposes only and no representations or warranties are made with respect to its fitness for any particular purpose. The information in this document should not be used as a substitute for professional medical advice or as a substitute for the application of clinical judgment in respect of the care of a particular patient or other professional judgment in any decision-making process. The Canadian Agency for Drugs and Technologies in Health (CADTH) does not endorse any information, drugs, therapies, treatments, products, processes, or services.
While care has been taken to ensure that the information prepared by CADTH in this document is accurate, complete, and up-to-date as at the applicable date the material was first published by CADTH, CADTH does not make any guarantees to that effect. CADTH does not guarantee and is not responsible for the quality, currency, propriety, accuracy, or reasonableness of any statements, information, or conclusions contained in any third-party materials used in preparing this document. The views and opinions of third parties published in this document do not necessarily state or reflect those of CADTH.
CADTH is not responsible for any errors, omissions, injury, loss, or damage arising from or relating to the use (or misuse) of any information, statements, or conclusions contained in or implied by the contents of this document or any of the source materials.
This document may contain links to third-party websites. CADTH does not have control over the content of such sites. Use of third-party sites is governed by the third-party website owners’ own terms and conditions set out for such sites. CADTH does not make any guarantee with respect to any information contained on such third-party sites and CADTH is not responsible for any injury, loss, or damage suffered as a result of using such third-party sites. CADTH has no responsibility for the collection, use, and disclosure of personal information by third-party sites.
Subject to the aforementioned limitations, the views expressed herein are those of CADTH and do not necessarily represent the views of Canada’s federal, provincial, or territorial governments, or any third-party supplier of information.
This document is prepared and intended for use in the context of the Canadian health care system. The use of this document outside of Canada is done so at the user’s own risk.
This disclaimer and any questions or matters of any nature arising from or relating to the content or use (or misuse) of this document will be governed by and interpreted in accordance with the laws of the Province of Ontario and the laws of Canada applicable therein, and all proceedings shall be subject to the exclusive jurisdiction of the courts of the Province of Ontario, Canada.
The copyright and other intellectual property rights in this document are owned by CADTH and its licensors. These rights are protected by the Canadian Copyright Act and other national and international laws and agreements. Users are permitted to make copies of this document for noncommercial purposes only, provided it is not modified when reproduced and appropriate credit is given to CADTH and its licensors.
About CADTH: CADTH is an independent, not-for-profit organization responsible for providing Canada’s health care decision-makers with objective evidence to help make informed decisions about the optimal use of drugs, medical devices, diagnostics, and procedures in our health care system.
Funding: CADTH receives funding from Canada’s federal, provincial, and territorial governments, with the exception of Quebec.
Questions or requests for information about this report can be directed to Requests@CADTH.ca.