Drugs, Health Technologies, Health Systems
Health Technology Review
No-Shows in Medical Imaging Departments in Canada: Trends and Mitigations Strategies
“No-shows” (i.e., missed medical imaging appointments) can lead to reduced capacity, increased wait times, and avoidable emergency department admissions. This report combines findings from an informal survey of medical imaging sites, patient engagement sessions, and a limited literature search to examine the prevalence of medical imaging no-shows in Canada and strategies to reduce them.
Key Messages
What Is the Issue?
Canada’s Drug Agency received a request to examine strategies used in medical imaging departments to reduce patient no-shows (i.e., missed medical imaging appointments), as well as the underlying reasons behind missed appointments. Reducing no-shows in medical imaging has the potential to help:
shorten wait times and limit unnecessary emergency department visits — fewer no-shows may shorten wait-lists, enable more timely diagnosis, and reduce reliance on emergency care
increase cost savings and efficiencies — no-shows can result in lost operational time for imaging staff, underused equipment, and added administrative costs related to rescheduling and managing missed appointments
enable targeted solutions — understanding why individuals miss appointments allows for the development of tailored, evidence-informed solutions to improve attendance and optimize service delivery.
What Did We Do?
Canada’s Drug Agency conducted an informal survey of health care leaders from every province and territory to gather insights on no-shows in medical imaging. Our survey focused on CT, MRI, X-ray, and ultrasound services across both urban and rural settings, and collected information on:
estimated no-show rates
proactive and reactive strategies used to mitigate no-shows
the perceived effectiveness of those approaches in minimizing no-shows.
To build on the survey findings, we also reviewed supporting literature and held patient engagement sessions to better understand reasons for missed appointments and the strategies to reduce them. Together, these sources offer a complementary view of current practices, challenges, and opportunities related to no-show management in medical imaging services in Canada.
What Did We Find?
Of the 85 respondents who participated in the survey, 63 (74%) reported that they tracked no-show rates, either formally or informally. According to survey estimates:
No-show rates for CT, MRI, X-ray, and ultrasound were generally low nationwide, typically not exceeding 5%. This aligns with the published literature, which reports radiology no-show rates between 3% and 8%.1,2
No-show rates varied by modality and geographic region, with ultrasound appointments showing the highest rates of nonattendance overall.
Proactive strategies (i.e., implemented to prevent no-shows before they occur) were reported as more effective at reducing no-show rates than reactive strategies (i.e., implemented after a no-show has occurred), with 88% of responding sites reporting positive outcomes from proactive interventions, compared to 35% for reactive measures.
A variety of factors are believed to contribute to no-shows, including social, cultural, logistical, environmental, psychological, behavioural, and cognitive considerations.
What Does This Mean?
Missed imaging appointments may disrupt care, contribute to wait times, and reduce system efficiency. While our survey estimates suggest no-show rates are generally low (typically under 5%), they vary by modality and region. This variability suggests strategies must be tailored to local contexts and informed by continuous monitoring.
Reducing no-shows requires an understanding of their root causes and tracking patterns over time. Proactive, targeted strategies appear to be more effective than reactive ones, underscoring the need for early, patient-centred approaches.
Monitoring of no-show rates supports:
measuring their impact on imaging capacity
identifying trends by region or modality
informing tailored interventions to improve attendance and access.
These findings highlight the value of data-driven, patient-centred approaches to managing no-shows and improving imaging services.
Abbreviations
AI
artificial intelligence
CDA-AMC
Canada’s Drug Agency
EMR
emergency medical record
SMS
short message service
Context
Medical imaging is a cornerstone of modern health care, playing a vital role in diagnosing disease, guiding treatment, and monitoring therapeutic response. Modalities such as CT, MRI, X-ray, and ultrasound allow clinicians to noninvasively visualize internal anatomy and physiological processes, enabling early detection and informed clinical decision-making.3 The 4 modalities in this report were selected as they represent the majority of medical imaging appointments.
Timely access to imaging is particularly critical for conditions like cancer, stroke, and trauma, for which delays can lead to missed or late diagnoses, treatment delays, and poorer clinical outcomes.4 Attendance at imaging appointments helps ensure appropriate and timely care.5,6 However, a range of factors — such as psychological, sociodemographic, logistical, and system-level barriers — can prevent a patient from attending their scheduled medical imaging appointment, resulting in a “no-show.”2,7-9
A “no-show” is defined as a missed appointment without prior notification or cancellation. In this report, we use the term “no-show” because it is widely used in clinical practice, the medical literature, and was identified as an acceptable term by the patient representatives consulted for this report.
The consequences of no-shows extend beyond individual care, and are reported to include:
Health system implications: No-shows result in lost clinical time, underused equipment, idle staff time, and added administrative burden.7,8
Increased wait times: Missed appointments may lead to reduced capacity and can delay care for others.5,8
Worse health outcomes: Delayed imaging may result in increased emergency department visits for conditions that could have been managed earlier.7,8
Erosion of trust: Delays and inefficiencies are reported to contribute to negative perceptions of the health care system.5,8,10
The impact of no-shows may be particularly important in high-demand, resource-intensive areas like medical imaging, in which fixed costs persist regardless of patient attendance. When appointment slots go unfilled, resources are underused and system capacity is further strained.10 No-show mitigation strategies can be used to help address factors that contribute to missed appointments and to support people in attending their medical imaging exams. These strategies fall into 2 categories:
Proactive strategies: These are applied to prevent no-shows before they occur and include appointment reminders, dynamic scheduling, and increasing accessibility.
Reactive strategies: These are applied to reduce future occurrences or mitigate impact and include implementing no-show fees, offering after-hour clinics, and providing telehealth services.
Globally, no-show rates across the broader health system are estimated to be between 20% and 25%.8,11 In contrast, rates in medical imaging are generally lower, typically ranging from 1% to 8%, depending on the modality.2,7 The literature consistently identifies mammography, both for population-based screening and diagnostic imaging, as having the highest imaging-related no-show rate (8%).8
While researchers have explored factors influencing no-show rates, there is limited data on observed rates and little evidence on which strategies may be most effective at reducing missed appointments. To address these gaps, Canada’s Drug Agency (CDA-AMC) drew on our unique access to the Canadian Medical Imaging Inventory’s pan-Canadian network of health care leaders to examine current no-show rates, explore contributing factors, and share mitigation strategies used across the country.
This report presents practices from medical imaging departments nationwide, along with perspectives from patients and their caregivers, to share information that may support efforts to understand and manage no-shows within Canada. These findings can support health system decision-makers in developing targeted, evidence-informed approaches to reduce no-shows and improve the sustainability and efficiency of imaging services.8
Objectives
The purpose of this report is to identify and describe strategies used to reduce no-show rates in medical imaging across Canada for CT, MRI, X-ray, and ultrasound.
For each of these imaging modalities this report aims to:
provide estimates of no-show rates across Canada
compare no-show rates between urban and rural sites to inform tailored reduction strategies and support equitable health care access
identify proactive and reactive strategies used at medical imaging sites across Canada to mitigate no-shows
report on the perceived effectiveness of implemented strategies by comparing no-show rates before and after implementation, enabling data-driven evaluation of successful practices in different settings
report on factors contributing to no-shows by incorporating patient perspectives.
About This Document
This report presents findings from an informal national survey on strategies to manage no-shows in diagnostic imaging, complemented by a targeted literature review and 2 patient engagement sessions. It integrates key insights from all sources to highlight current practices, identify common challenges, and inform potential solutions to reduce no-show rates in medical imaging across Canada.
Survey Methods
To enable timely data collection, an informal survey approach was used to gather self-reported data on no-show rates and mitigation strategies from medical imaging staff in hospitals across Canada. Respondents were identified through the Canadian Medical Imaging Inventory network. In some instances, the survey was distributed through a central jurisdictional contact who then circulated it to additional sites at their discretion. As a result, while the total number of completed responses is known, the overall number of recipients is not. Consequently, it is not possible to calculate an exact response rate.
To ensure relevance, the survey targeted individuals responsible for sites offering at least 2 of the following modalities: CT, MRI, X-ray, or ultrasound. Responses reflect practices at the regional, provincial, or individual hospital level; however, site-specific data are not reported. The survey was open from April 14 to May 15, 2025.
Due to the limited number of imaging sites in the territories, data from Yukon, the Northwest Territories, and Nunavut were consolidated and presented as a single jurisdiction to preserve site-level anonymity.
Literature Review Methods
An information specialist also conducted a targeted literature search to identify factors contributing to no-shows and strategies for reducing and managing them in the medical imaging context. This search balanced comprehensiveness and relevance, incorporating peer-reviewed sources, focused internet searches, and regularly updated findings. Input and peer review were provided by subject matter experts.
Patient Engagement Methods
CDA-AMC actively involves patients, families, patient groups, and other interested parties to enhance the quality and relevance of assessments, providing those affected by our findings with an opportunity to contribute their perspectives. The organization has adopted a Framework for Patient Engagement in Health Technology Assessment to guide these activities.
For this project, CDA-AMC sought a diverse range of perspectives through 2 community engagement sessions focused on gaining a deeper understanding of no-shows in medical imaging and strategies to reduce no-shows. Overall, we involved 18 individuals with direct personal experience with medical imaging no-shows.
The findings from our survey and the literature were discussed at the engagement sessions to provide context and to better understand no-shows in Canada. Virtual sessions were held on August 27, 2025, and September 5, 2025. The sessions included an overview of our workplan followed by round table questions (refer to the patient engagement questions in Appendix 1).
The findings from our engagement sessions are detailed throughout this report, as are those identified in the literature and our survey. The engagement summary (refer to the Engagement Summary section in Appendix 1) details the approach to, and full summaries of, these sessions.
Results
Participating Facilities
National Overview
We received 85 responses to our survey, including at least 1 response from each province and territory, representing either individual hospitals, regions, or jurisdictions (refer to Table 2, Appendix 1, for respondent data). A total of 69 respondents represented individual hospitals and 16 survey respondents answered on behalf of a network of regional hospitals (rather than a single site) across 9 provinces. For reporting purposes, these networks were treated as single sites. The distribution of survey respondents across 10 provinces and 3 territories (combined) are presented in Figure 1.
Regional Overview
Out of the 85 total survey respondents, 43 were located in urban settings (51%), 38 in rural settings (44%), and 4 in remote settings (5%). Urban, rural, or remote status was self-reported by hospitals and regional health networks. Regional status by province and territory was reported as follows:
Newfoundland and Labrador: 1 urban, 4 rural, 0 remote
Prince Edward Island: 0 urban, 1 rural, 0 remote
Nova Scotia: 2 urban, 5 rural, 0 remote
New Brunswick: 4 urban, 2 rural, 0 remote
Quebec: 8 urban, 1 rural, 2 remote
Ontario: 13 urban, 13 rural, 0 remote
Manitoba: 1 urban, 1 rural, 0 remote
Saskatchewan: 1 urban, 0 rural, 0 remote
Alberta: 1 urban, 3 rural, 0 remote
British Columbia: 10 urban, 7 rural, 0 remote
The territories: 0 urban, 2 rural, 2 remote
Figure 1: Location of Participating Survey Respondents
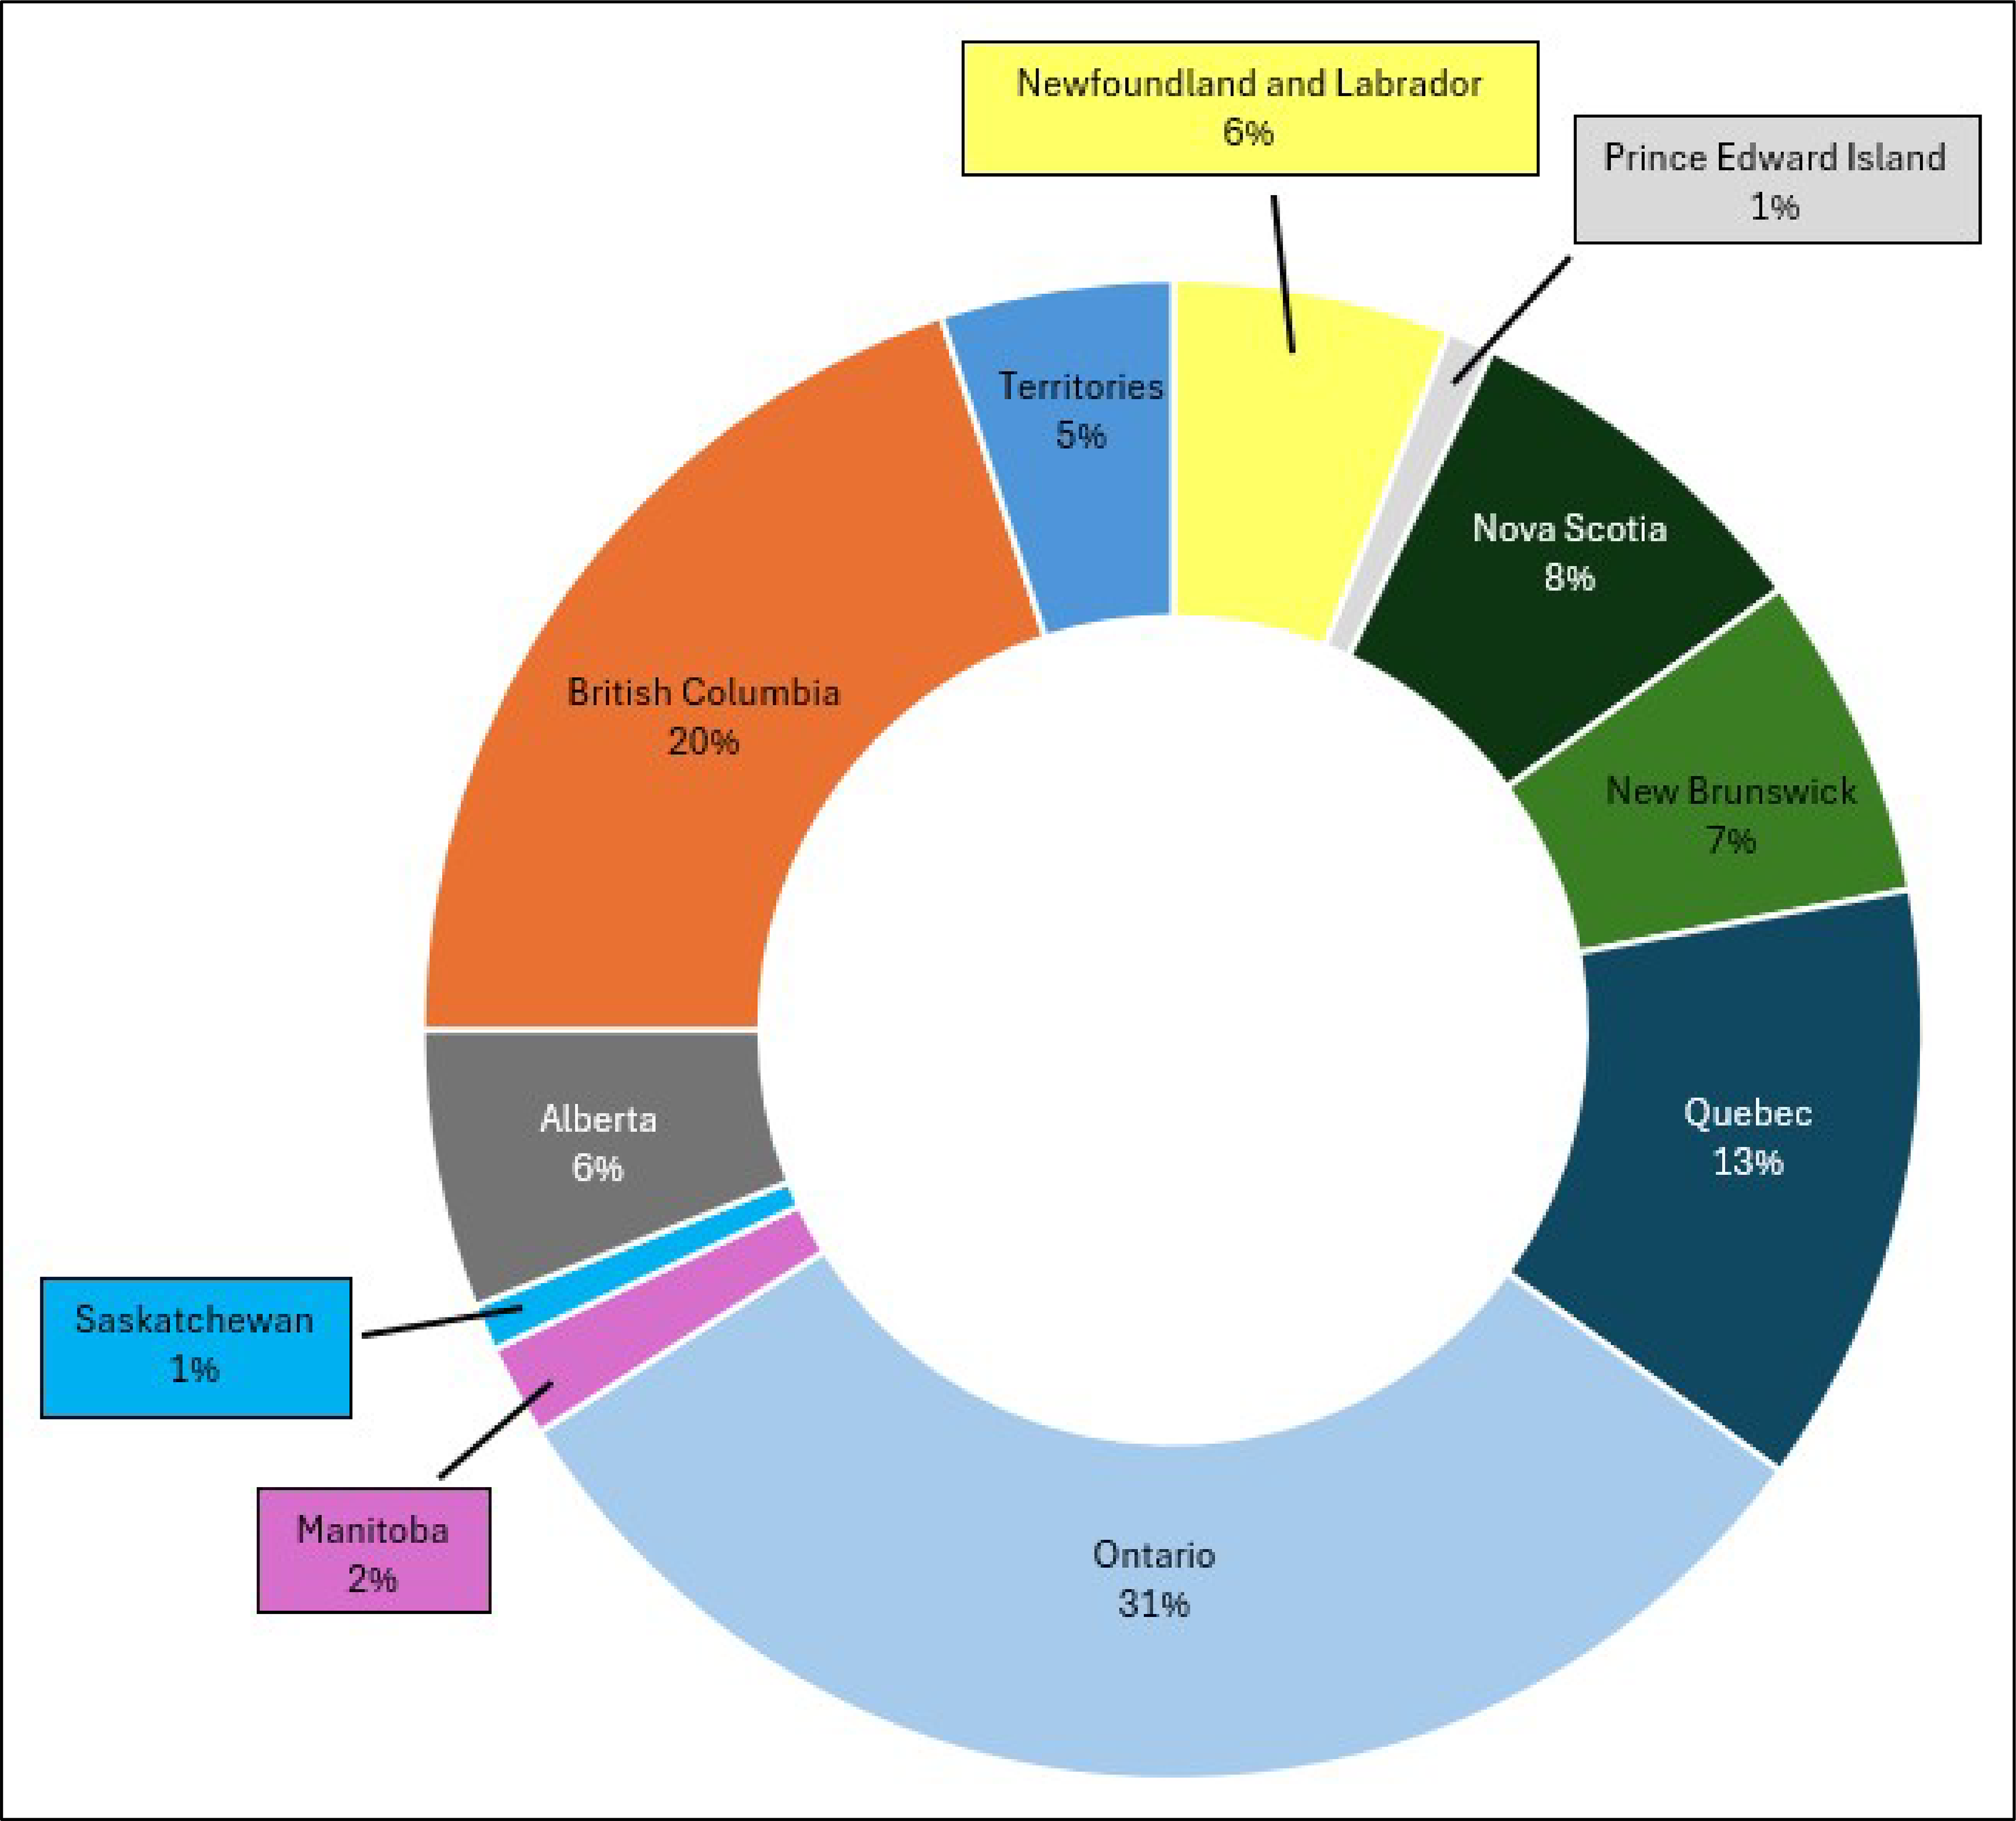
Note: Data are from 85 respondents across 10 provinces and 3 territories: Newfoundland and Labrador (5 respondents), Prince Edward Island (1 respondent), Nova Scotia (7 respondents), New Brunswick (6 respondents), Quebec (11 respondents), Ontario (26 respondents), Manitoba (2 respondents), Saskatchewan (1 respondent), Alberta (5 respondents), British Columbia (17 respondents), and the territories (4 respondents).
Trends in No-Show Rates
According to our survey, most imaging sites tracked no-show rates, with 74% indicating they monitored rates (either formally or informally).
National no-show rates were generally low across all 4 imaging modalities. Average estimated no-show rates by modality were 5% for CT and MRI, 4% for X-ray, and 7% for ultrasound.
Geographic setting appeared to have the greatest influence on no-show patterns, with effects differing by modality:
Urban sites reported slightly higher no-show rates for MRI and X-ray.
Rural sites reported slightly higher no-show rates for CT and ultrasound.
Provincial rates varied widely, with some provinces reporting no-show rates between 11% and over 25% for some modalities.
National and Regional Overview
The survey respondents were asked to report no-show rates for each of the 4 imaging modalities at their site. Sixty-three responding sites out of 85 (74%) reported that they tracked no-show rates, either formally through data management or informally through staff observation (or other informal data collection methods). Conversely, 22 responding sites out of 85 (26%) indicated they did not track no-shows by any method. Responses were based on general estimates and, in some cases, may reflect staff perceptions rather than formally collected data.
To estimate no-show rates, respondents selected from predefined percentage categories: 0% to 5%, 6% to 10%, 11% to 15%, 16% to 20%, 21% to 25%, and over 25%. The midpoint of each range was used to calculate the average no-show rates.
Nationally, most responding sites reported low no-show rates for imaging appointments, with the majority falling in the 0% to 5% range (refer to Figure 2). The average no-show rates are summarized by modality, along with the full range of response categories selected:
CT: 5% on average; responses ranged from 0% to 5% to over 25%
MRI: 5% on average; responses ranged from 0% to 5% to 16% to 20%
X-ray: 4% on average; responses ranged from 0% to 5% to 21% to 25%
Ultrasound: 7% on average; responses ranged from 0% to 5% to over 25%
A key finding for both rural and urban areas is that most responses for all modalities fell within the 0% to 5% and 6% to 10% ranges, indicating generally low no-show rates.
Ultrasound had the highest average no-show rates based on our survey results and exhibited the greatest variability between jurisdictions.
The estimated average no-show rates for ultrasound reported in our survey (7%) aligned with those documented in the literature.1,2
X-ray had the lowest average no-show rate based on our survey results (4%). However, based on literature findings, X-ray had the highest no-show rates among the 4 modalities.1,2
Geographic setting and no-show rates:
While no-show rates described by modality and geographic setting were not widely reported in the literature, the available published evidence suggested no-show rates may be higher in rural areas.8,12,13
Our survey results indicate that differences in regional no-show rates are modality-specific:
Responding urban sites reported slightly higher no-show rates for MRI (refer to Figure 6) and X-ray (refer to Figure 8) than responding rural sites.
Responding rural sites reported slightly higher no-show rates for CT (refer to Figure 4) and ultrasound (refer to Figure 10) than responding urban sites.
Regionally, the highest reported no-show rates for CT, MRI, and ultrasound were observed in the territories. For X-ray, the highest no-show rates were reported in Quebec.
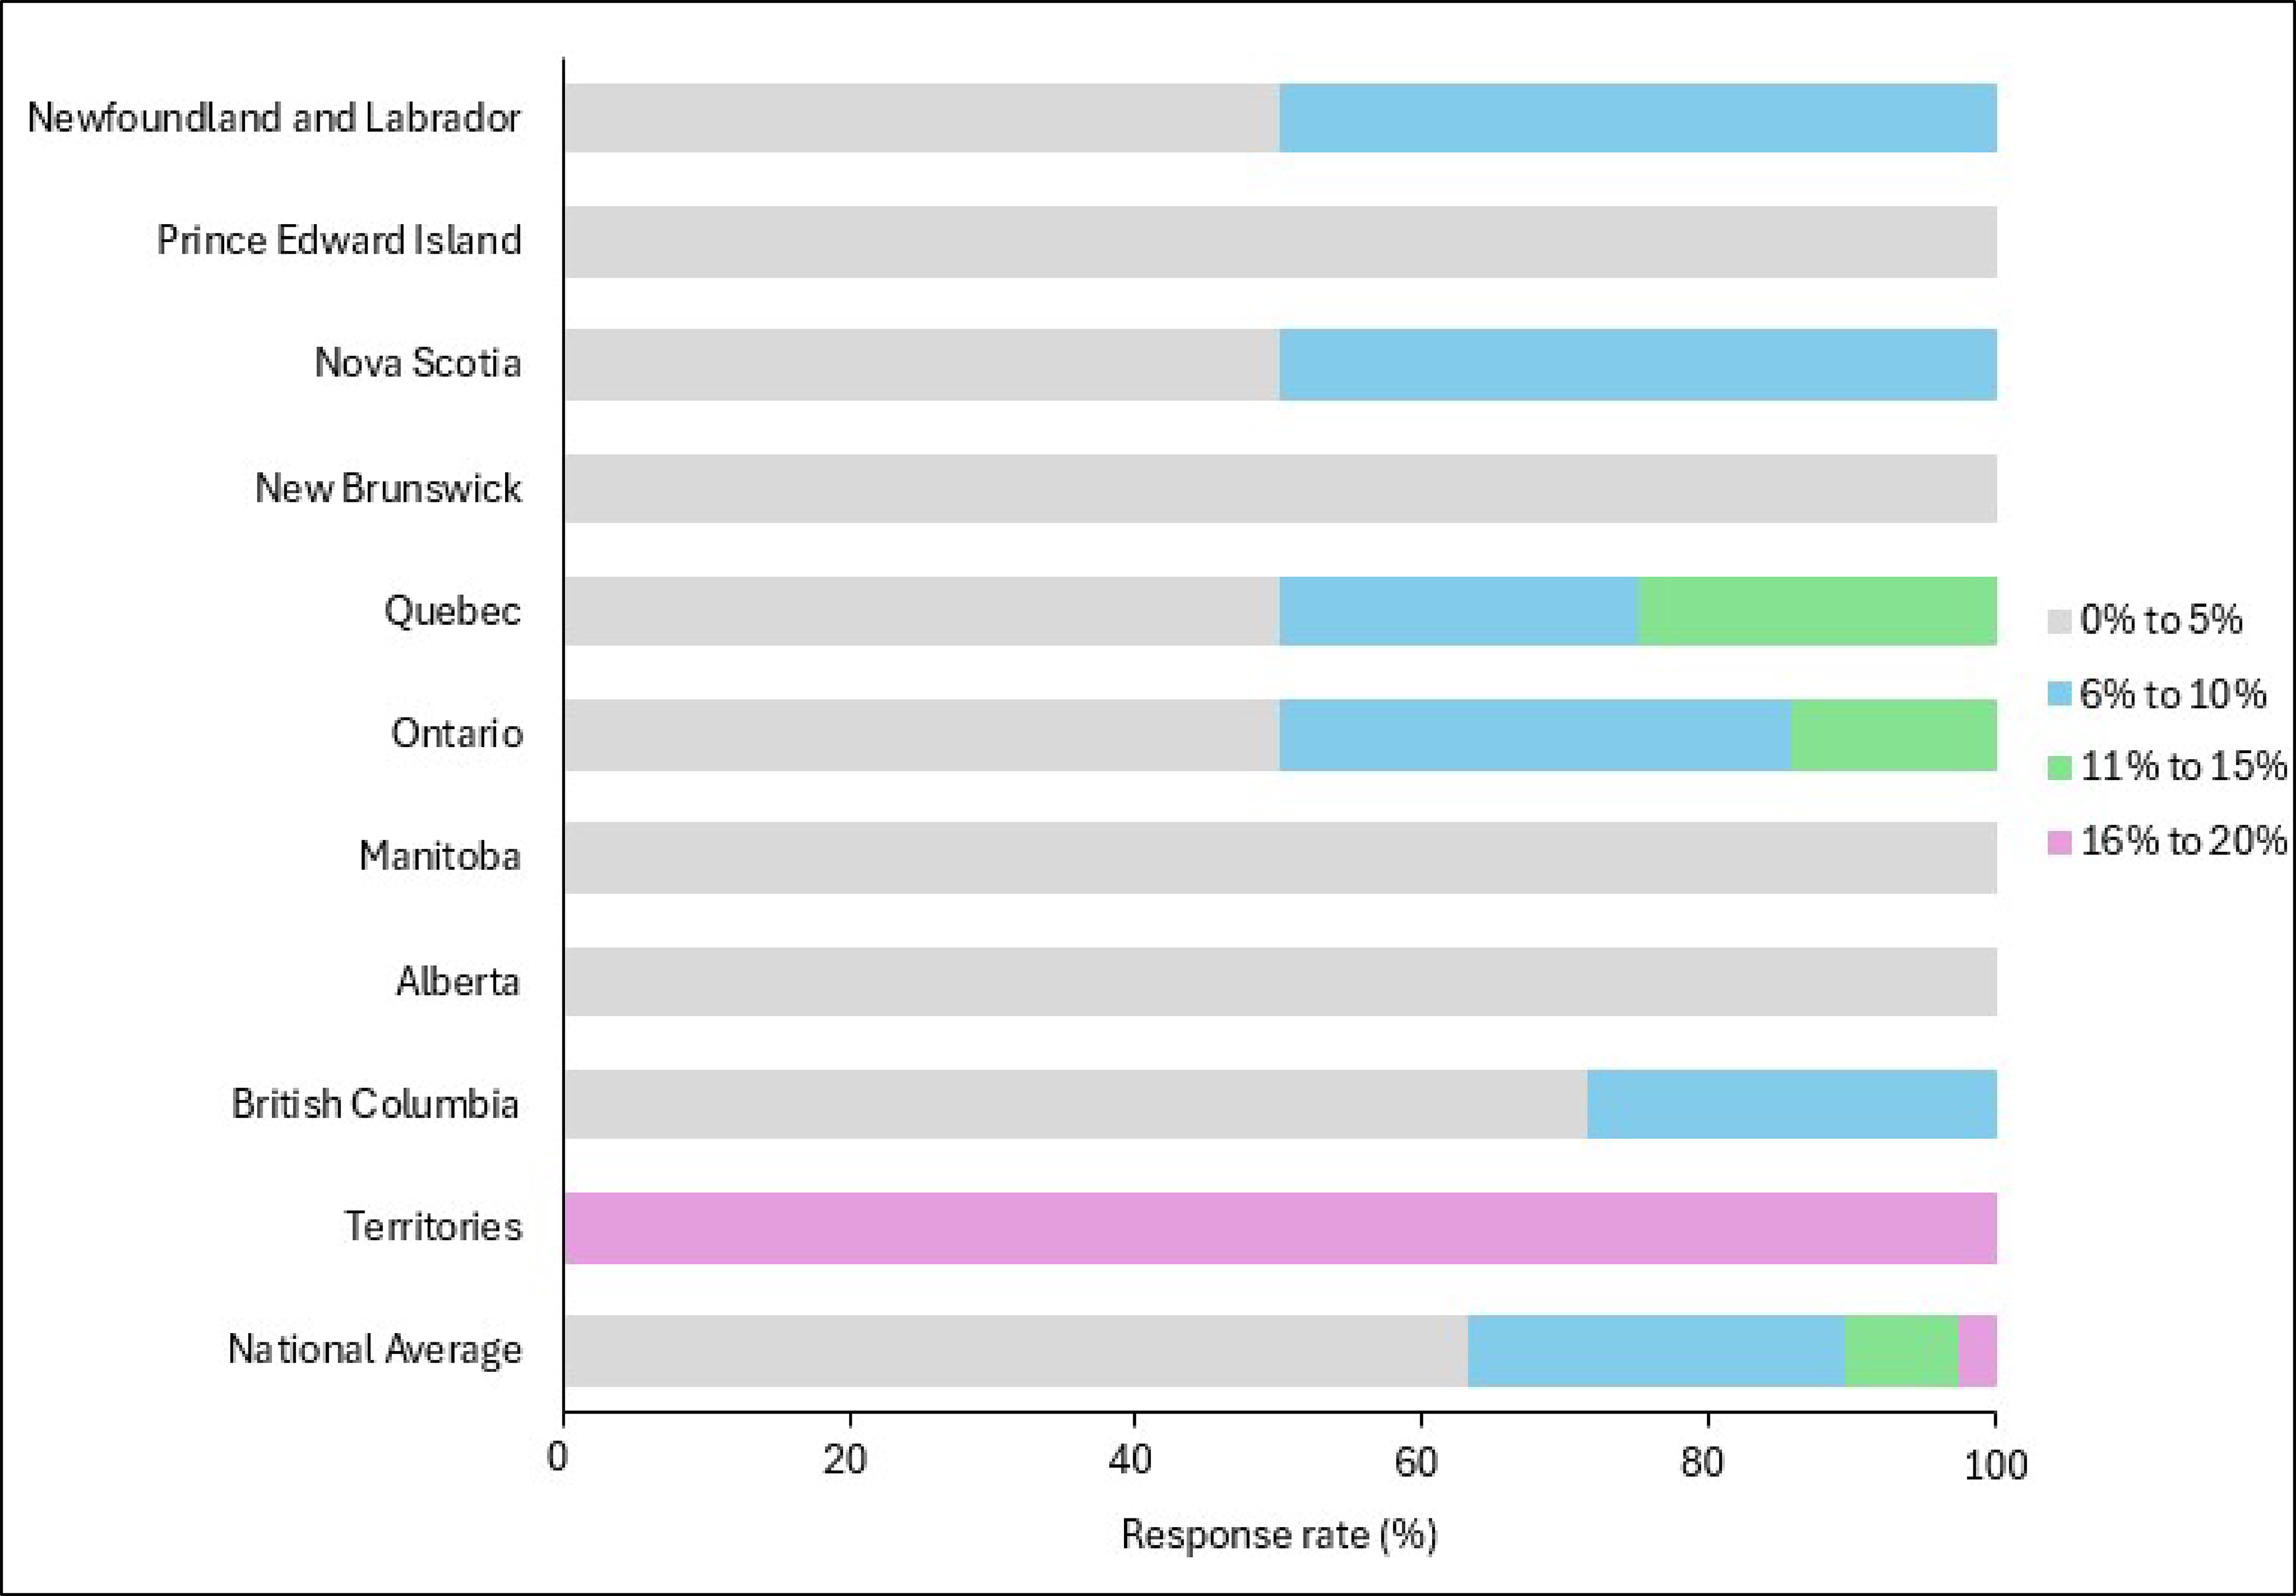
Figure 2: Medical Imaging No-Show Rates for CT, MRI, X-Ray, and Ultrasound
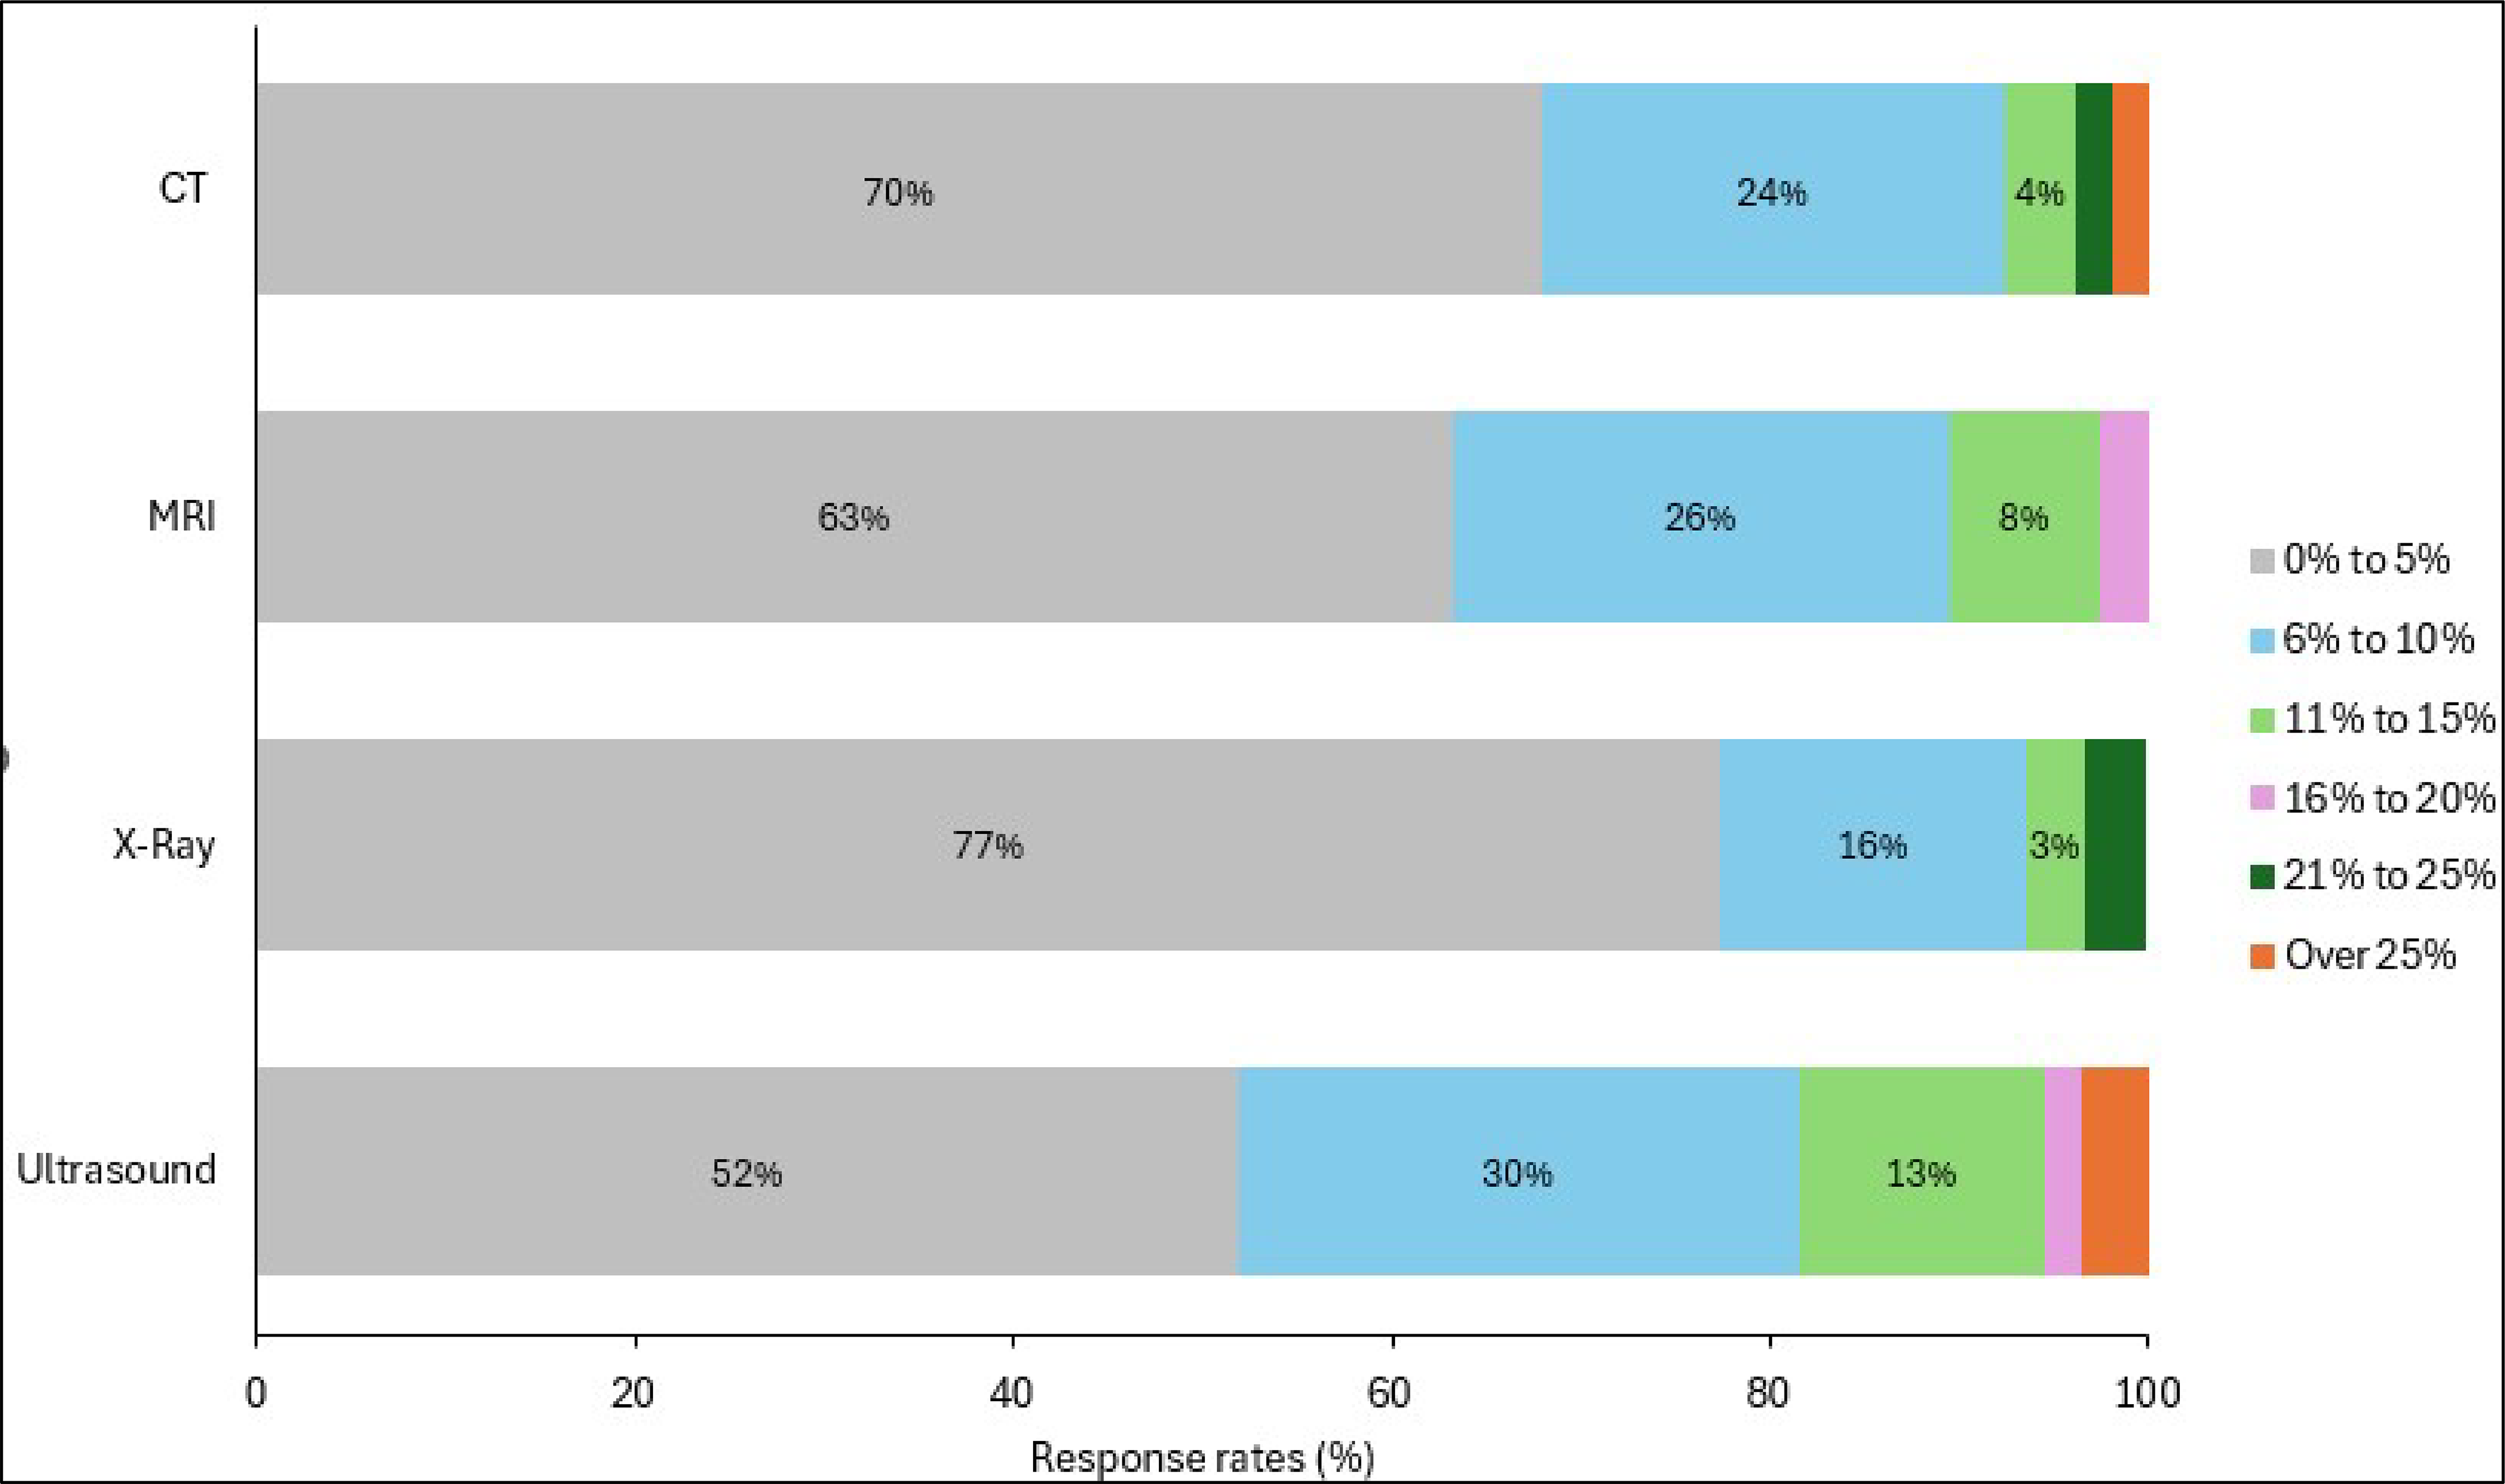
CT (n = 53), MRI (n = 38), X-ray (n = 31), ultrasound (n = 55). Notes: No data were available for Saskatchewan. Respondents were asked for general estimates; therefore, some responses may be opinion-based rather than quantitative.
CT No-Show Rates
Survey Response Overview
Seventy-five responding sites out of 85 reported offering CT services. Among these, 53 responding sites (71%) reported that they tracked no-show rates for this modality, while 22 (29%) indicated they did not track or report this information. The breakdown of responding sites that booked CT appointments by geographic setting was as follows:
Urban: 38 responding sites
Rural: 34 responding sites
Remote: 3 responding sites
Estimated National No-Show Rates
Based on our sample, most responding medical imaging sites reported CT no-show rates ranging from 0% to 5% or 6% to 10% (per survey response categories). The national estimated average no-show rate for CT was 5% (based on our survey sample).
There was variability between jurisdictions, with some responding sites in Quebec and the territories reporting higher no-show rates for CT than responding sites in other parts of the country. Based on our sample, 20% of responding sites in Quebec reported no-show rates between 21% and 25%, while 33% of responding sites in the territories reported no-show rates over 25% for CT (refer to Figure 3).
No-Show Rates by Geographic Setting
When comparing CT no-show rates between urban and rural settings, the differences were minimal, with most responses in both settings falling within the same low no-show ranges. The following observations were noted (refer to Figure 4):
Four percent of rural responding sites reported no-show rates for CT in the over 25% range, while no urban sites reported no-show rates for CT above this range.
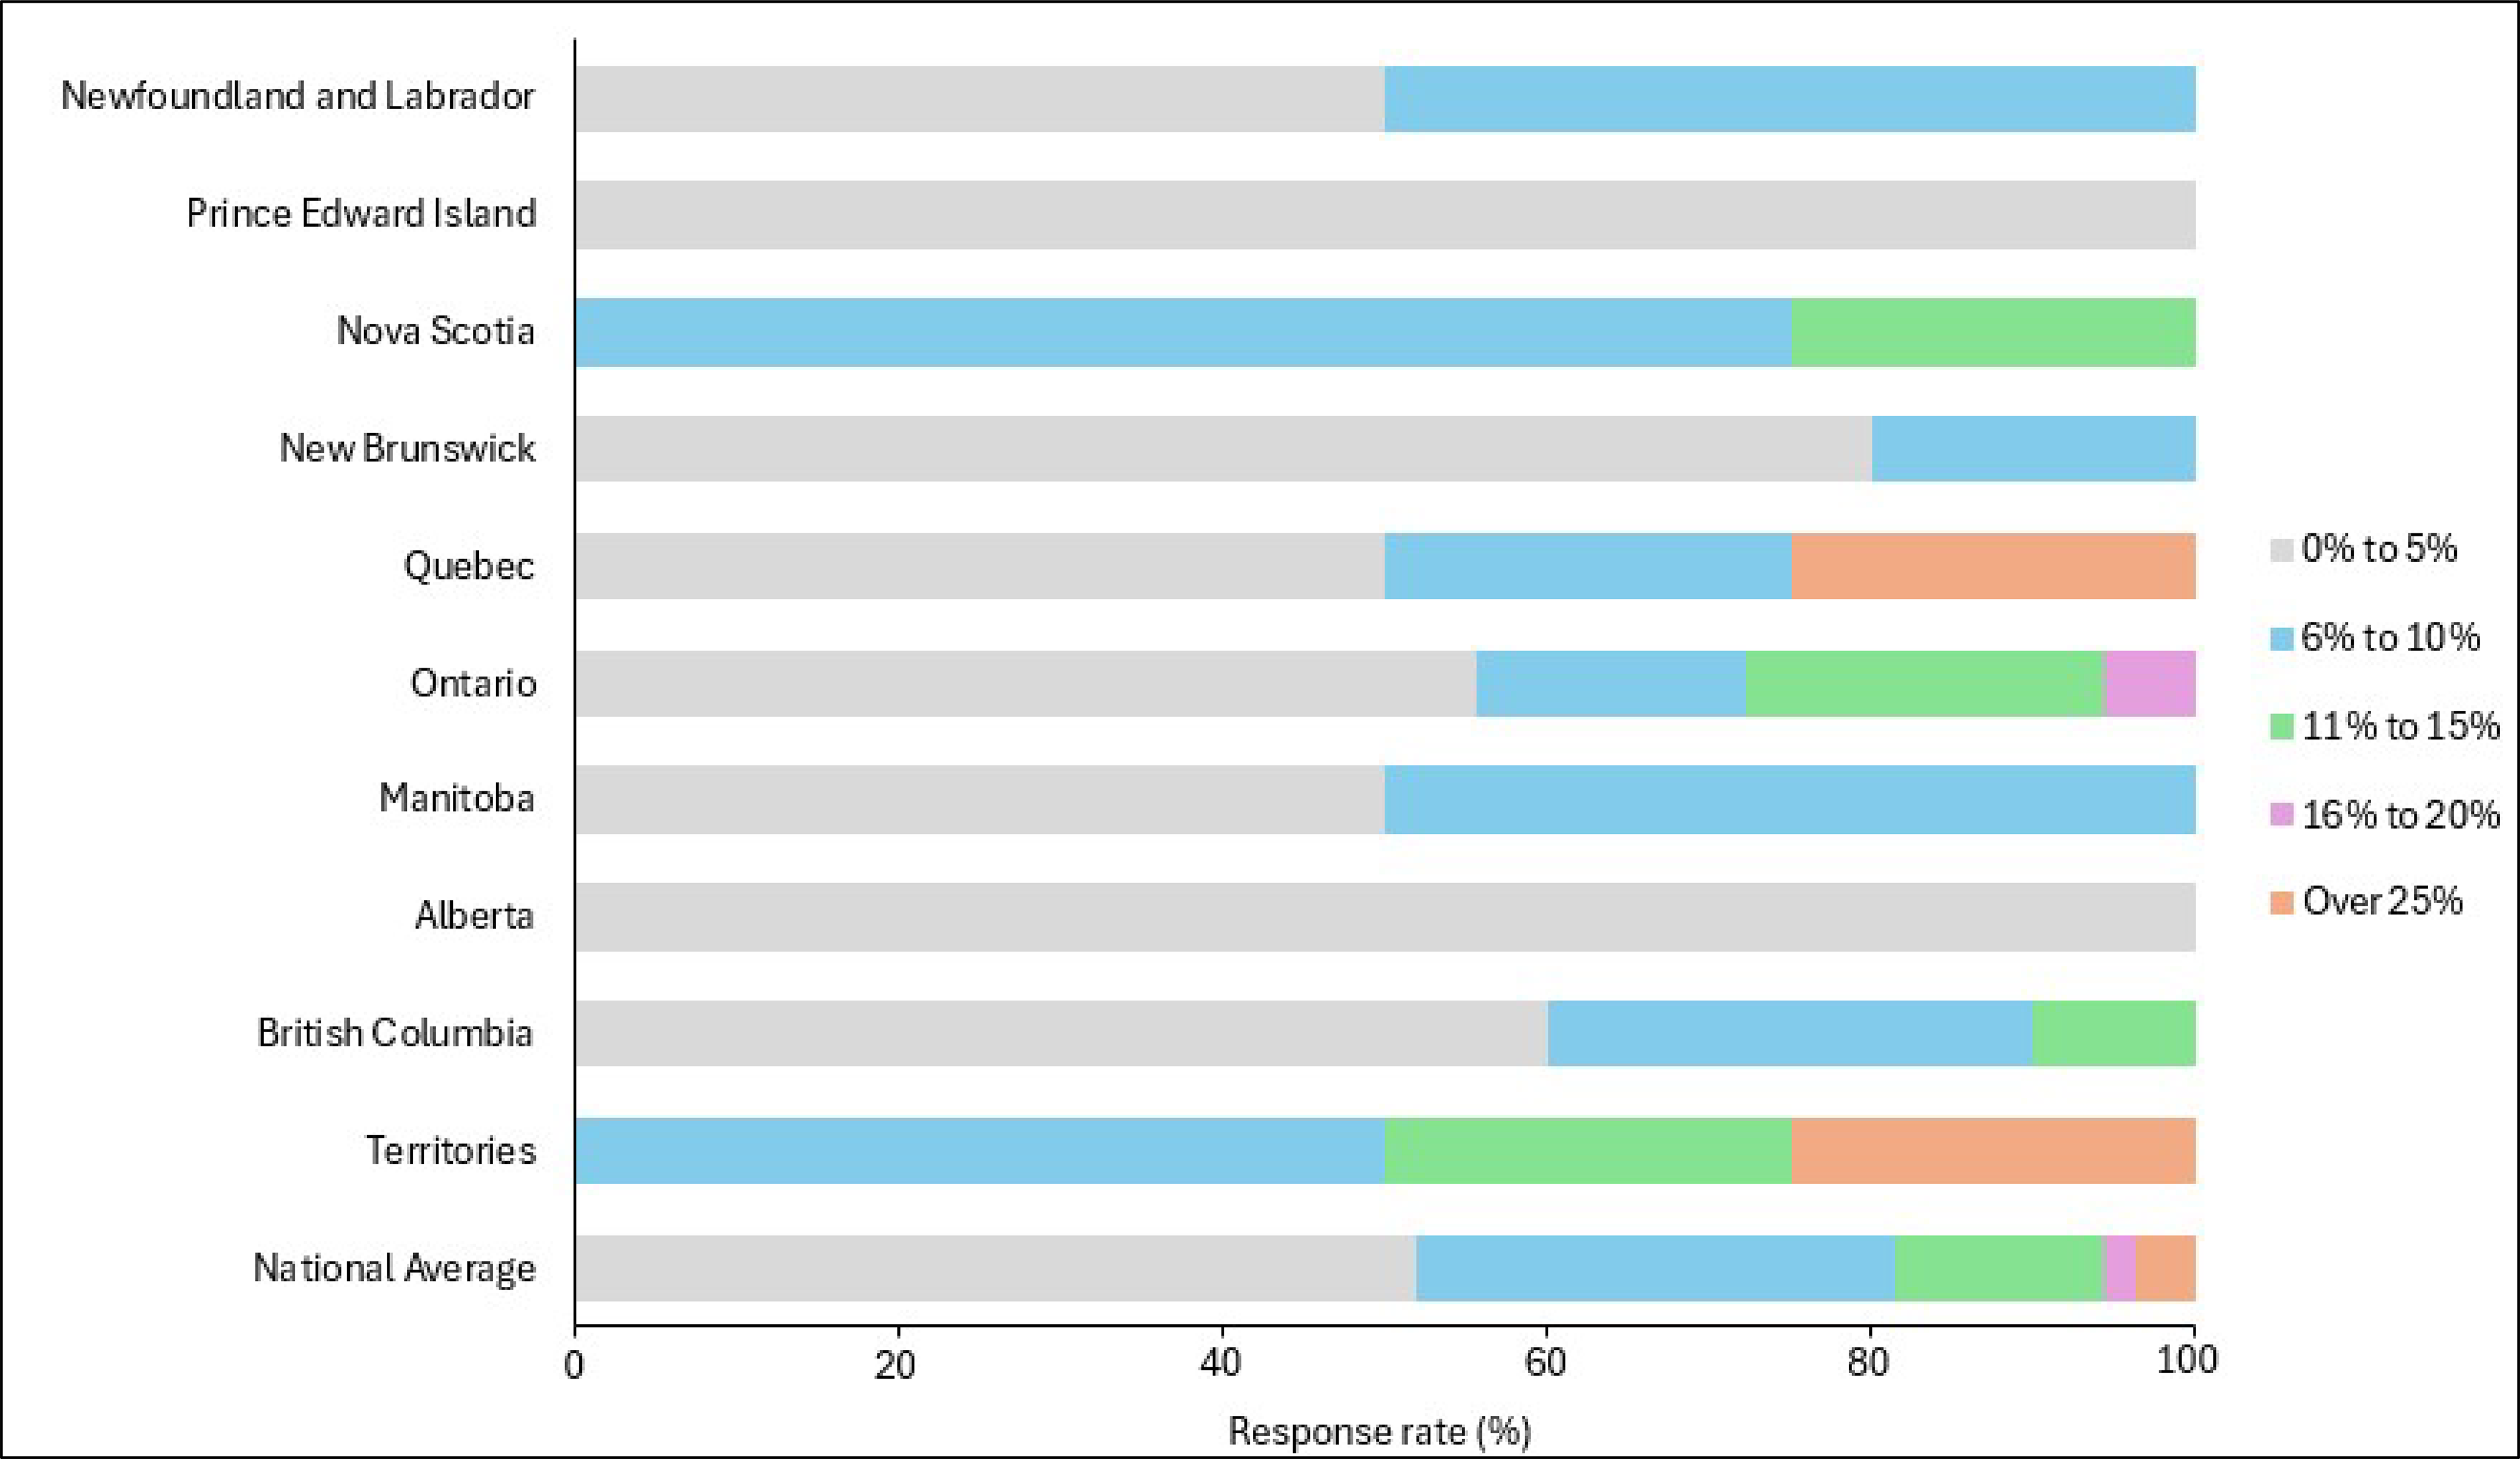
Figure 3: CT Appointment No-Show Rates by Province
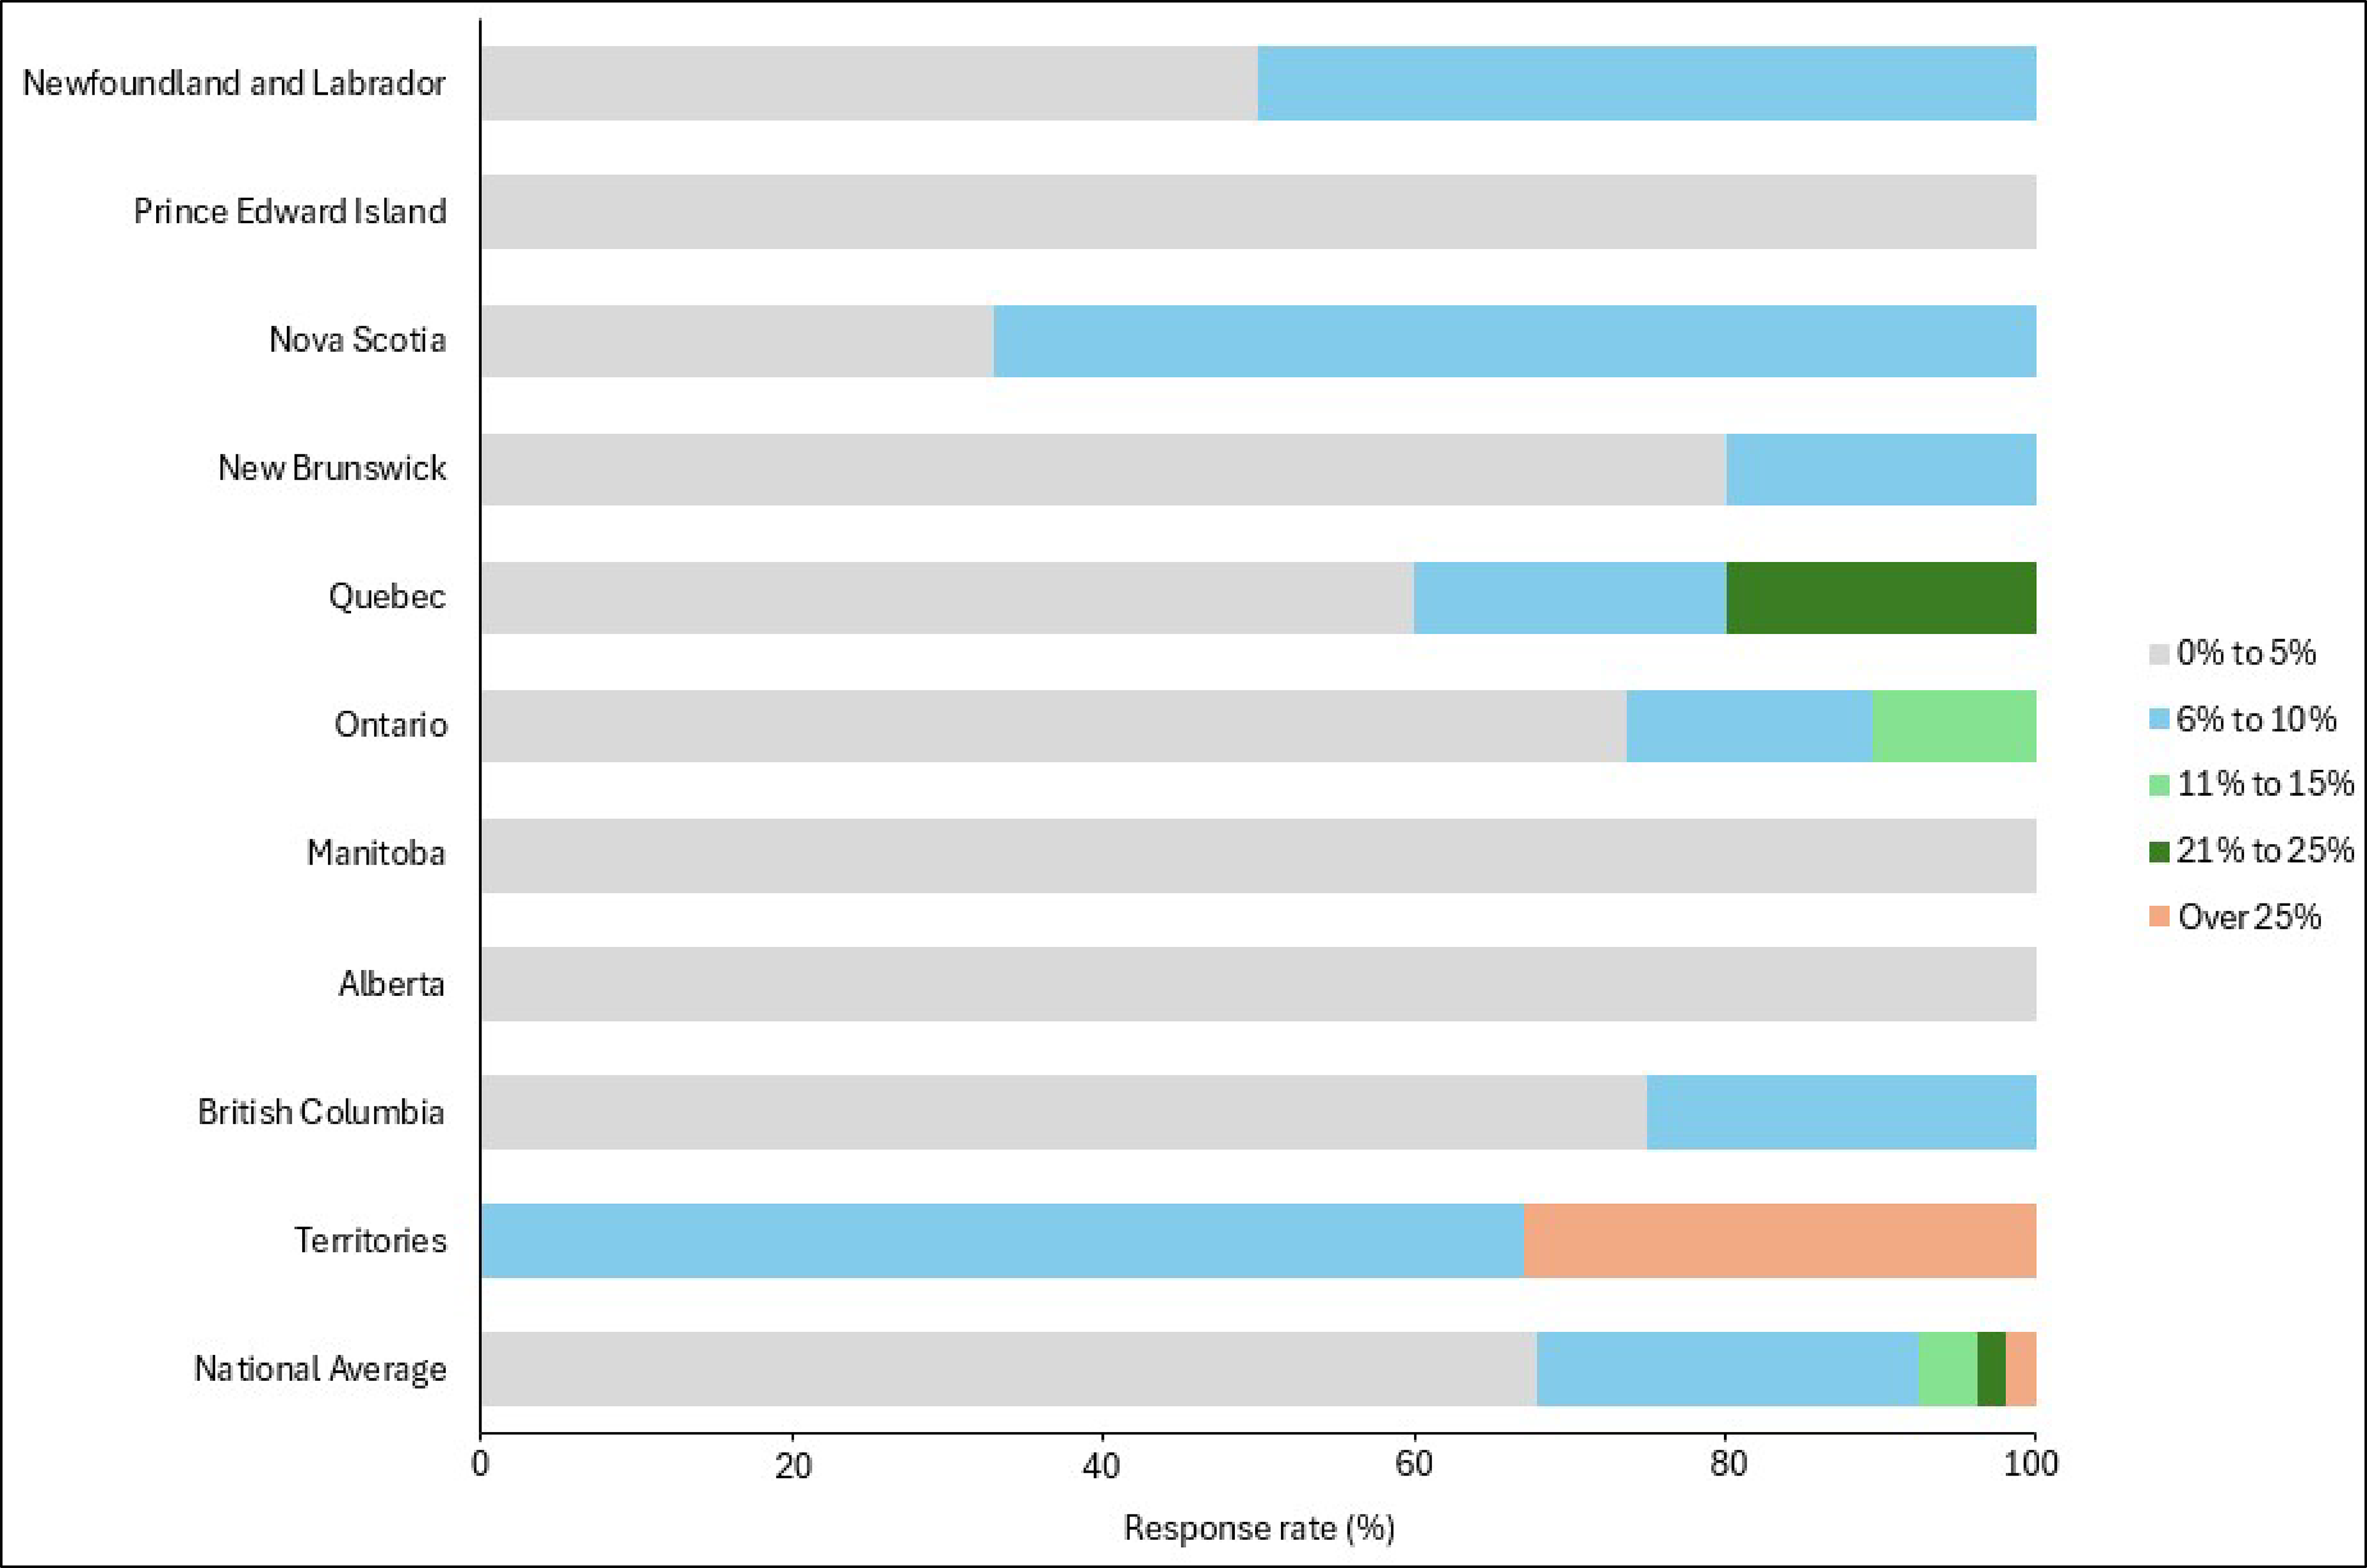
Notes: Newfoundland and Labrador (n = 4), Prince Edward Island (n = 1), Nova Scotia (n = 3), New Brunswick (n = 5), Quebec (n = 5), Ontario (n = 19), Manitoba (n = 2), Alberta (n = 3), British Columbia (n = 8), the territories (n = 3), and national average (n = 53). No data were available for Saskatchewan. Respondents were asked for general estimates; therefore, some responses may be opinion-based rather than quantitative. No responses were provided for the 16% to 20% category.
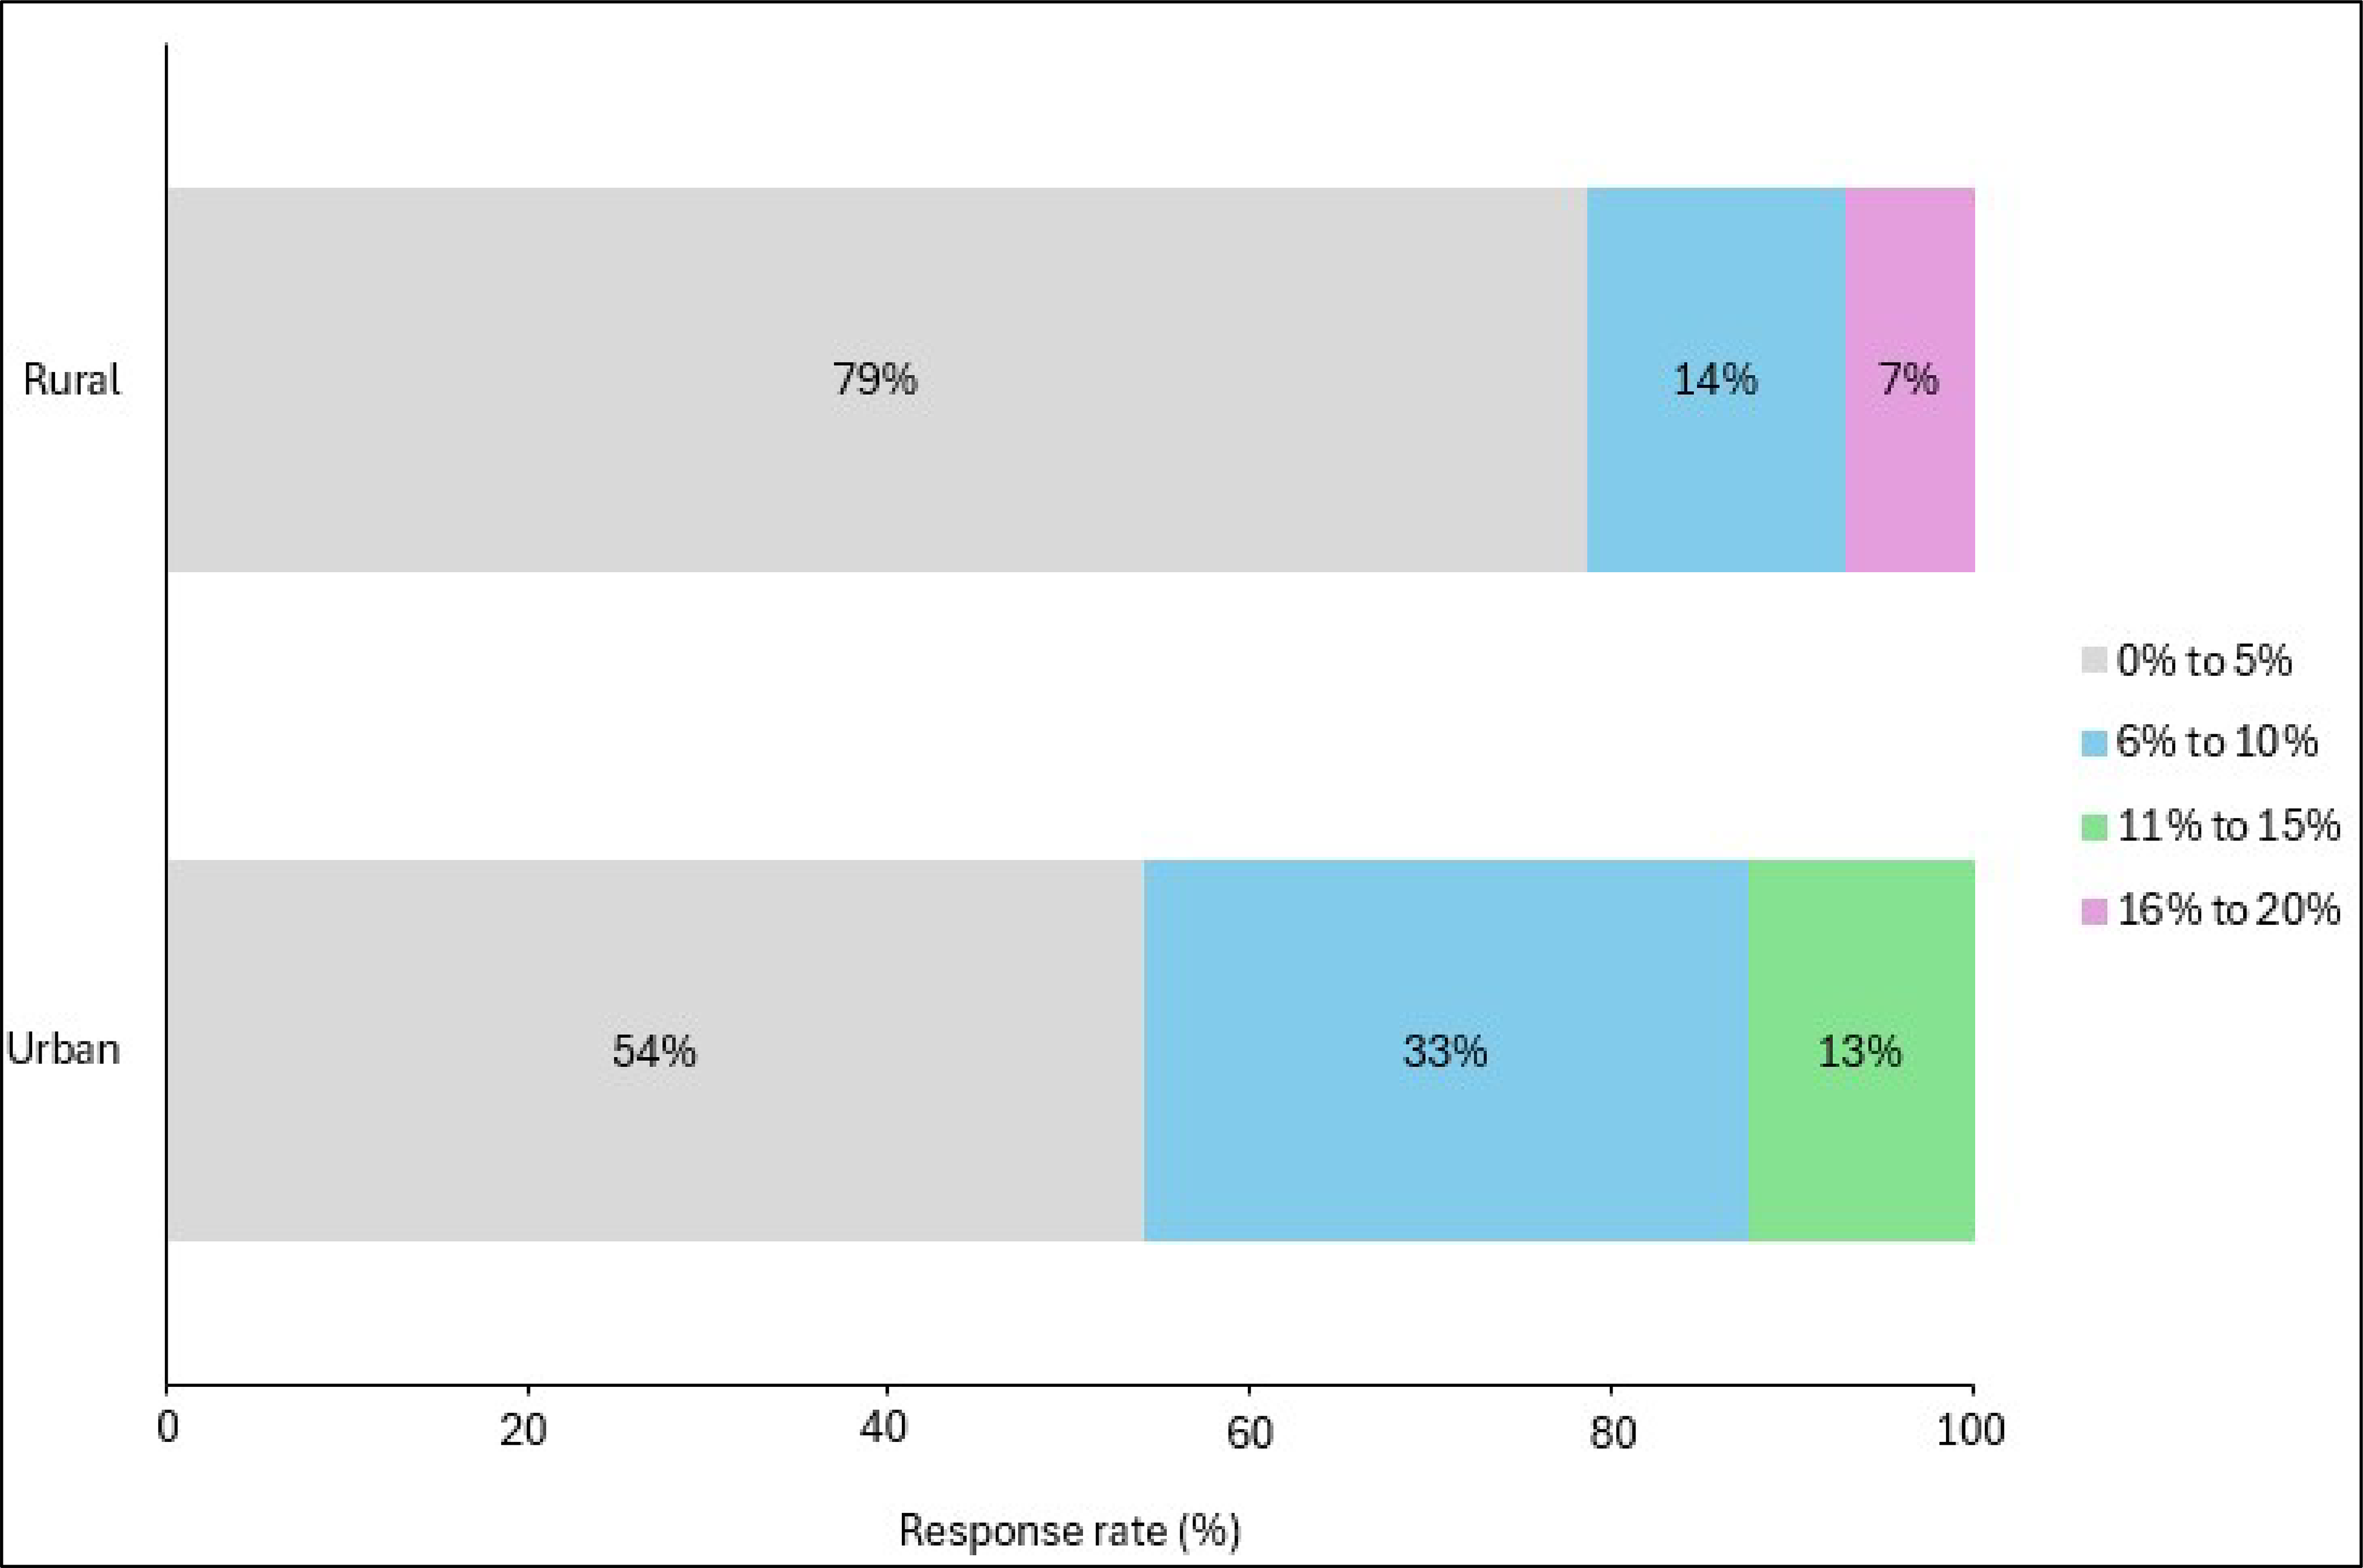
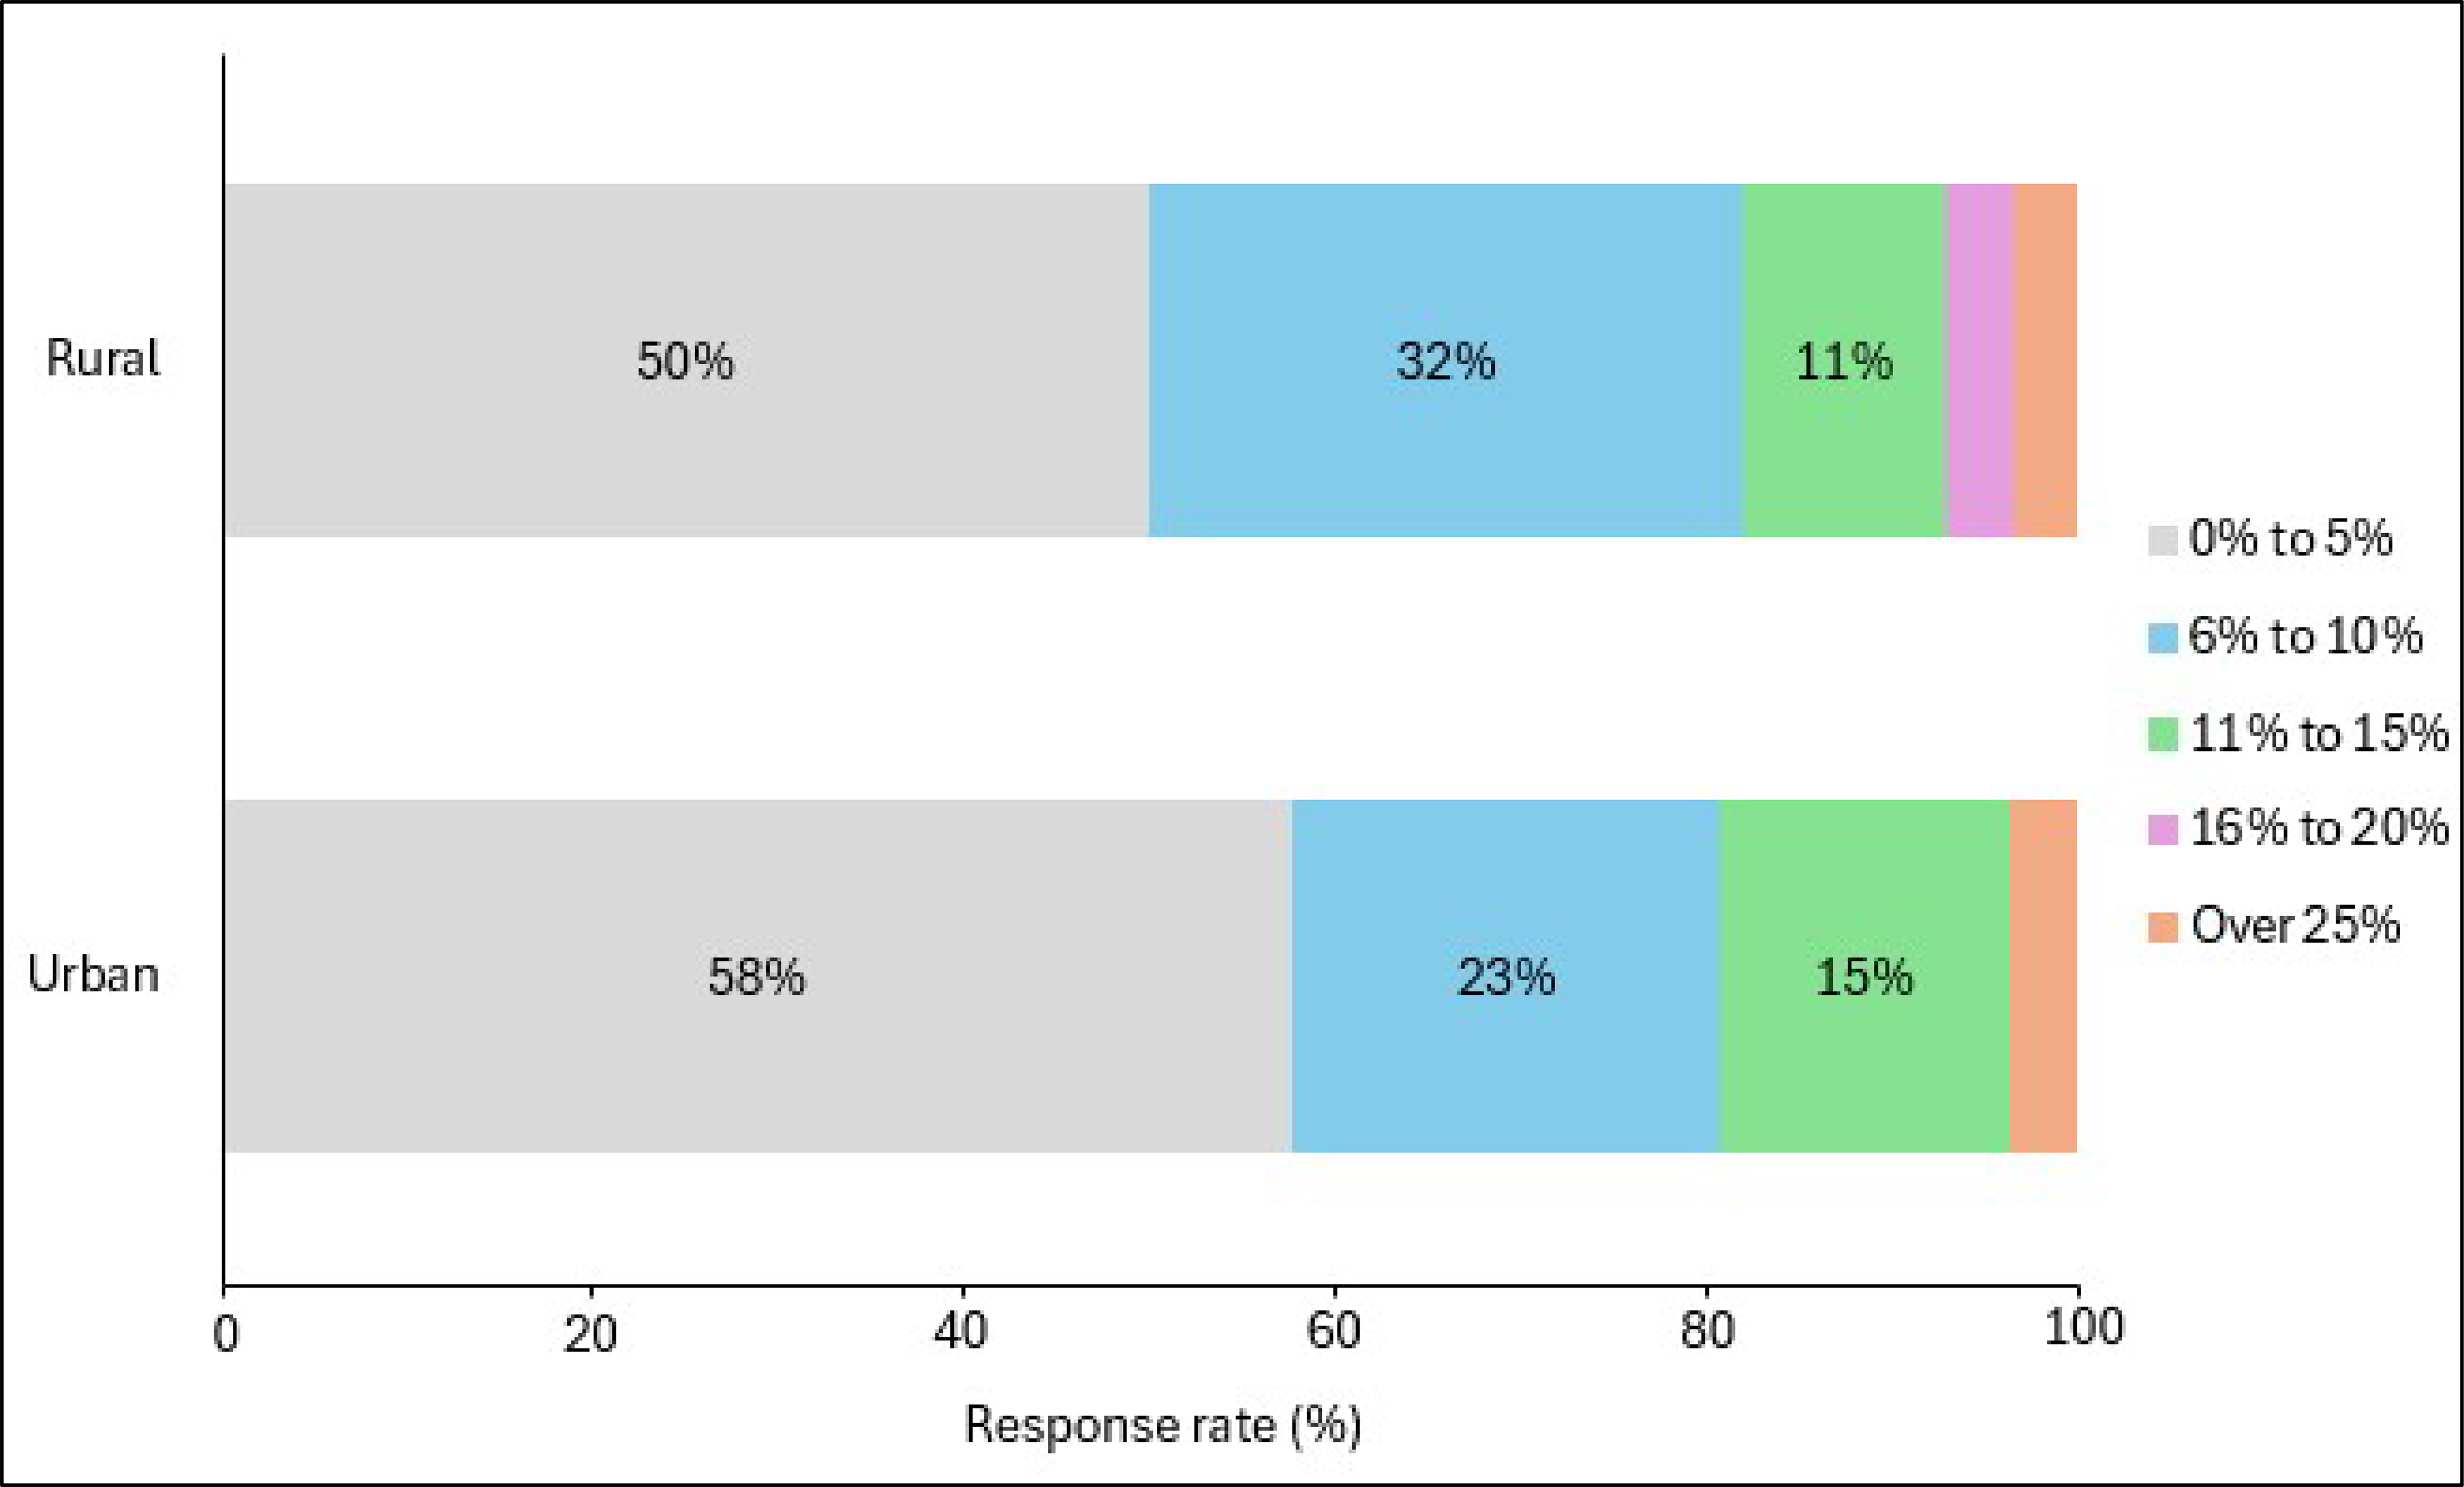
Figure 4: CT Appointment No-Show Rates by Setting (Urban vs. Rural)
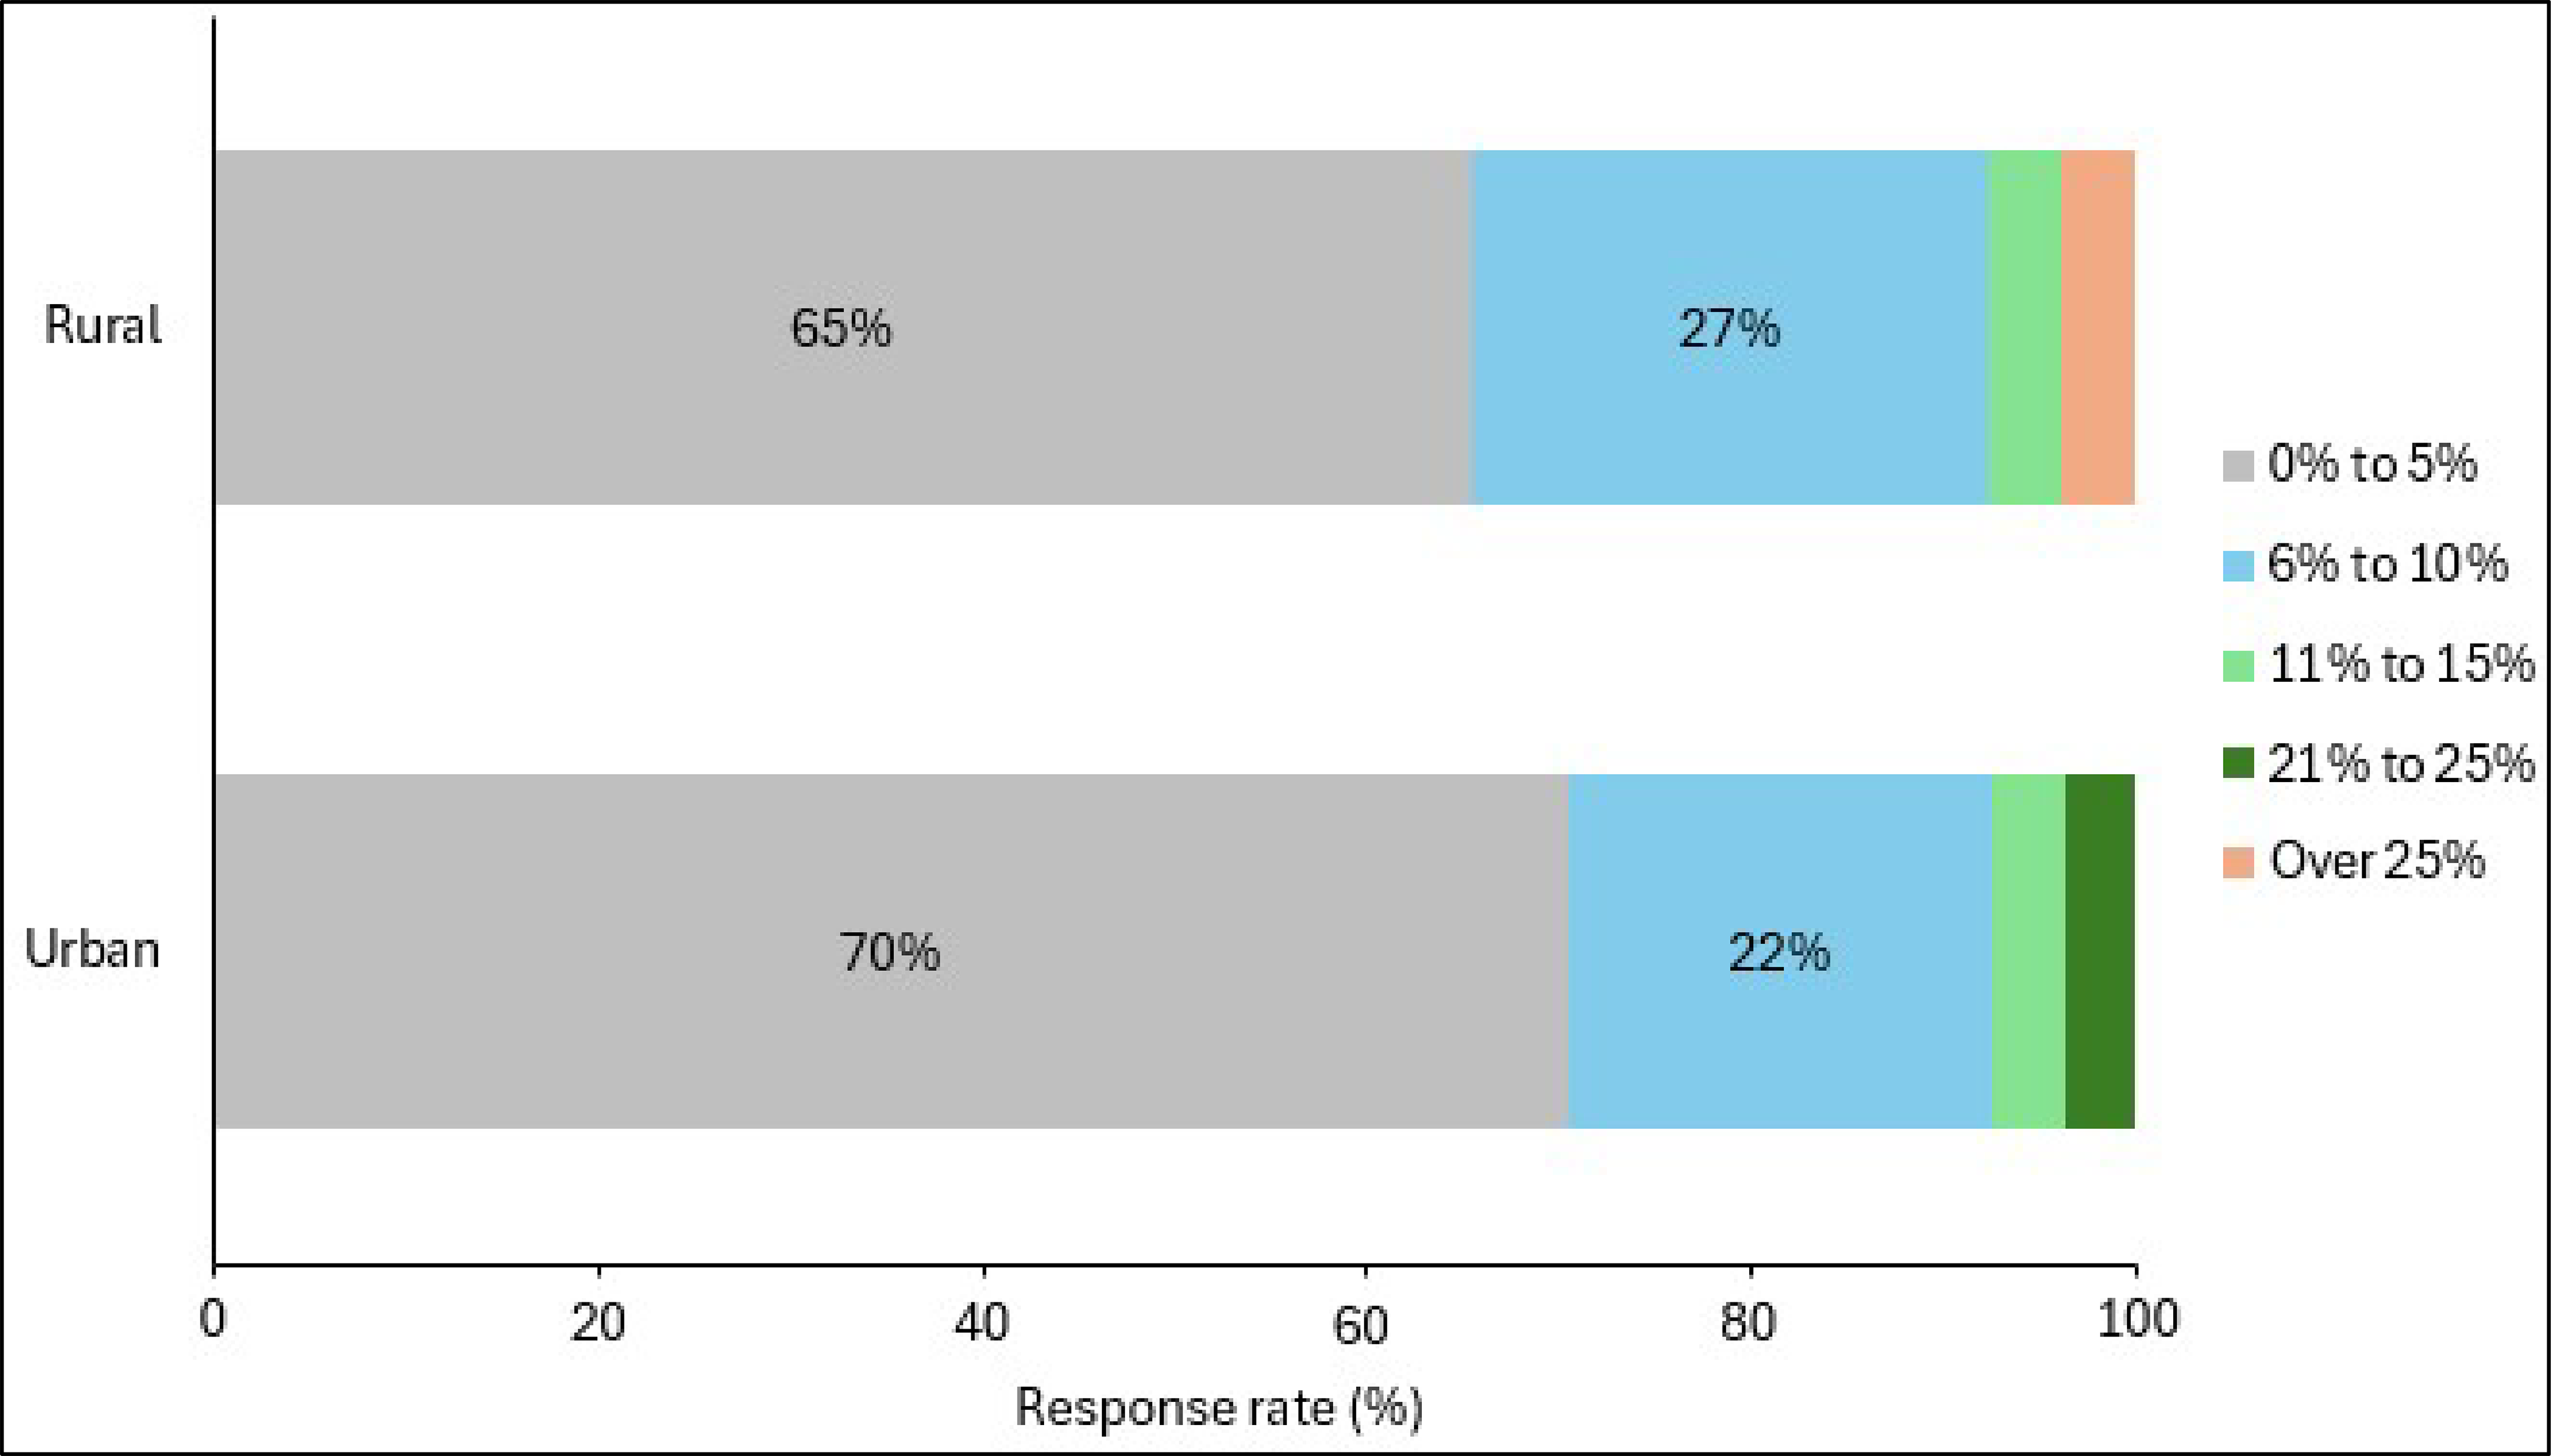
vs. = versus.
Notes: Urban (n = 38), rural (n = 34), and remote (n = 2). Two remote sites were combined with rural sites for this analysis. Respondents were asked for general estimates; therefore, some responses may be opinion-based rather than quantitative. No responses were provided for the 16% to 20% category.
MRI No-Show Rates
Survey Response Overview
Fifty-four responding sites out of 85 reported offering MRI services. Among these, 38 responding sites (70%) reported that they tracked no-show rates for this modality, while 16 (30%) indicated they did not track this information. The breakdown of responding sites that booked MRI appointments by geographic setting was as follows:
Urban: 33 responding sites
Rural: 20 responding sites
Remote: 1 responding site
Estimated National No-Show Rates
Based on our sample, most responding medical imaging sites reported MRI no-show rates ranging from 0% to 5% or 6% to 10% (per our survey response categories). The national estimated average no-show rate for MRI was 5% (based on our survey sample).
There was variability between jurisdictions, with some responding sites in Ontario, Quebec, and the territories reporting higher no-show rates for MRI than responding sites in other parts of the country. Based on our sample, 14% of responding sites in Ontario and 25% of responding sites in Quebec reported rates between 11% to 15%. All responding medical imaging sites in the territories reported a 16% to 20% no-show rate for MRI (refer to Figure 5).
No-Show Rates by Geographic Setting
When comparing MRI no-show rates between urban and rural settings, the differences were minimal, with most responses in both settings falling within the same low no-show ranges. The following observation was noted (refer to Figure 6):
Seven percent of respondents in rural areas reported no-show rates in the 16% to 20% range, while no urban sites reported no-show rates at or above this range for MRI.
Figure 5: MRI Appointment No-Show Rates by Jurisdiction
Notes: Newfoundland and Labrador (n = 2), Prince Edward Island (n = 1), Nova Scotia (n = 2), New Brunswick (n = 5), Quebec (n = 4), Ontario (n = 14), Manitoba (n = 1), Alberta (n = 1), British Columbia (n = 7), the territories (n = 1), and national average (n = 38). No data were available for Saskatchewan. Respondents were asked for general estimates; therefore, some responses may be opinion-based rather than quantitative. No responses were provided for the 21% to 25% or over 25% categories.
Figure 6: MRI Appointment No-Show Rates by Geographic Setting (Urban vs. Rural)
vs. = versus.
Notes: Urban (n = 33), rural (n = 20), and remote (n = 1). One remote site was combined with rural sites for this analysis. Respondents were asked for general estimates; therefore, some responses may be opinion-based rather than quantitative. No responses were provided for the 21% to 25% or over 25% categories.
X-Ray No-Show Rates
Survey Response Overview
Fifty-three responding sites out of 85 reported offering X-ray services. Among these, 31 responding sites (58%) reported that they tracked no-show rates for this modality, while 22 (42%) indicated they did not track this information. The breakdown of responding sites that booked X-ray appointments by geographic setting was as follows:
Urban: 25 responding sites
Rural: 27 responding sites
Remote: 1 responding site
Estimated National No-Show Rates
Based on our sample, most responding medical imaging sites reported X-ray no-show rates ranging from 0% to 5% or 6% to 10% (per our survey response categories). The national estimated average no-show rate for X-ray was 4% (based on our survey sample).
There was variability between jurisdictions, with some responding sites in Nova Scotia and Quebec reporting higher no-show rates for X-ray than responding sites in other parts of the country. Based on our sample, 50% of responding sites in Nova Scotia reported rates between 11% and 15%, while 50% of responding sites in Quebec reported rates between 21% and 25% for X-ray (refer to Figure 7).
No-Show Rates by Geographic Setting
When comparing X-ray no-show rates between urban and rural settings, the differences were minimal, with most responses in both settings falling within the same low no-show ranges. The following observation was noted (refer to Figure 8):
Six percent of responding urban sites reported no-show rates in the 21% to 25% range, while no rural sites reported no-show rates at or above this range for X-ray.
Figure 7: X-Ray Appointment No-Show Rates by Jurisdiction
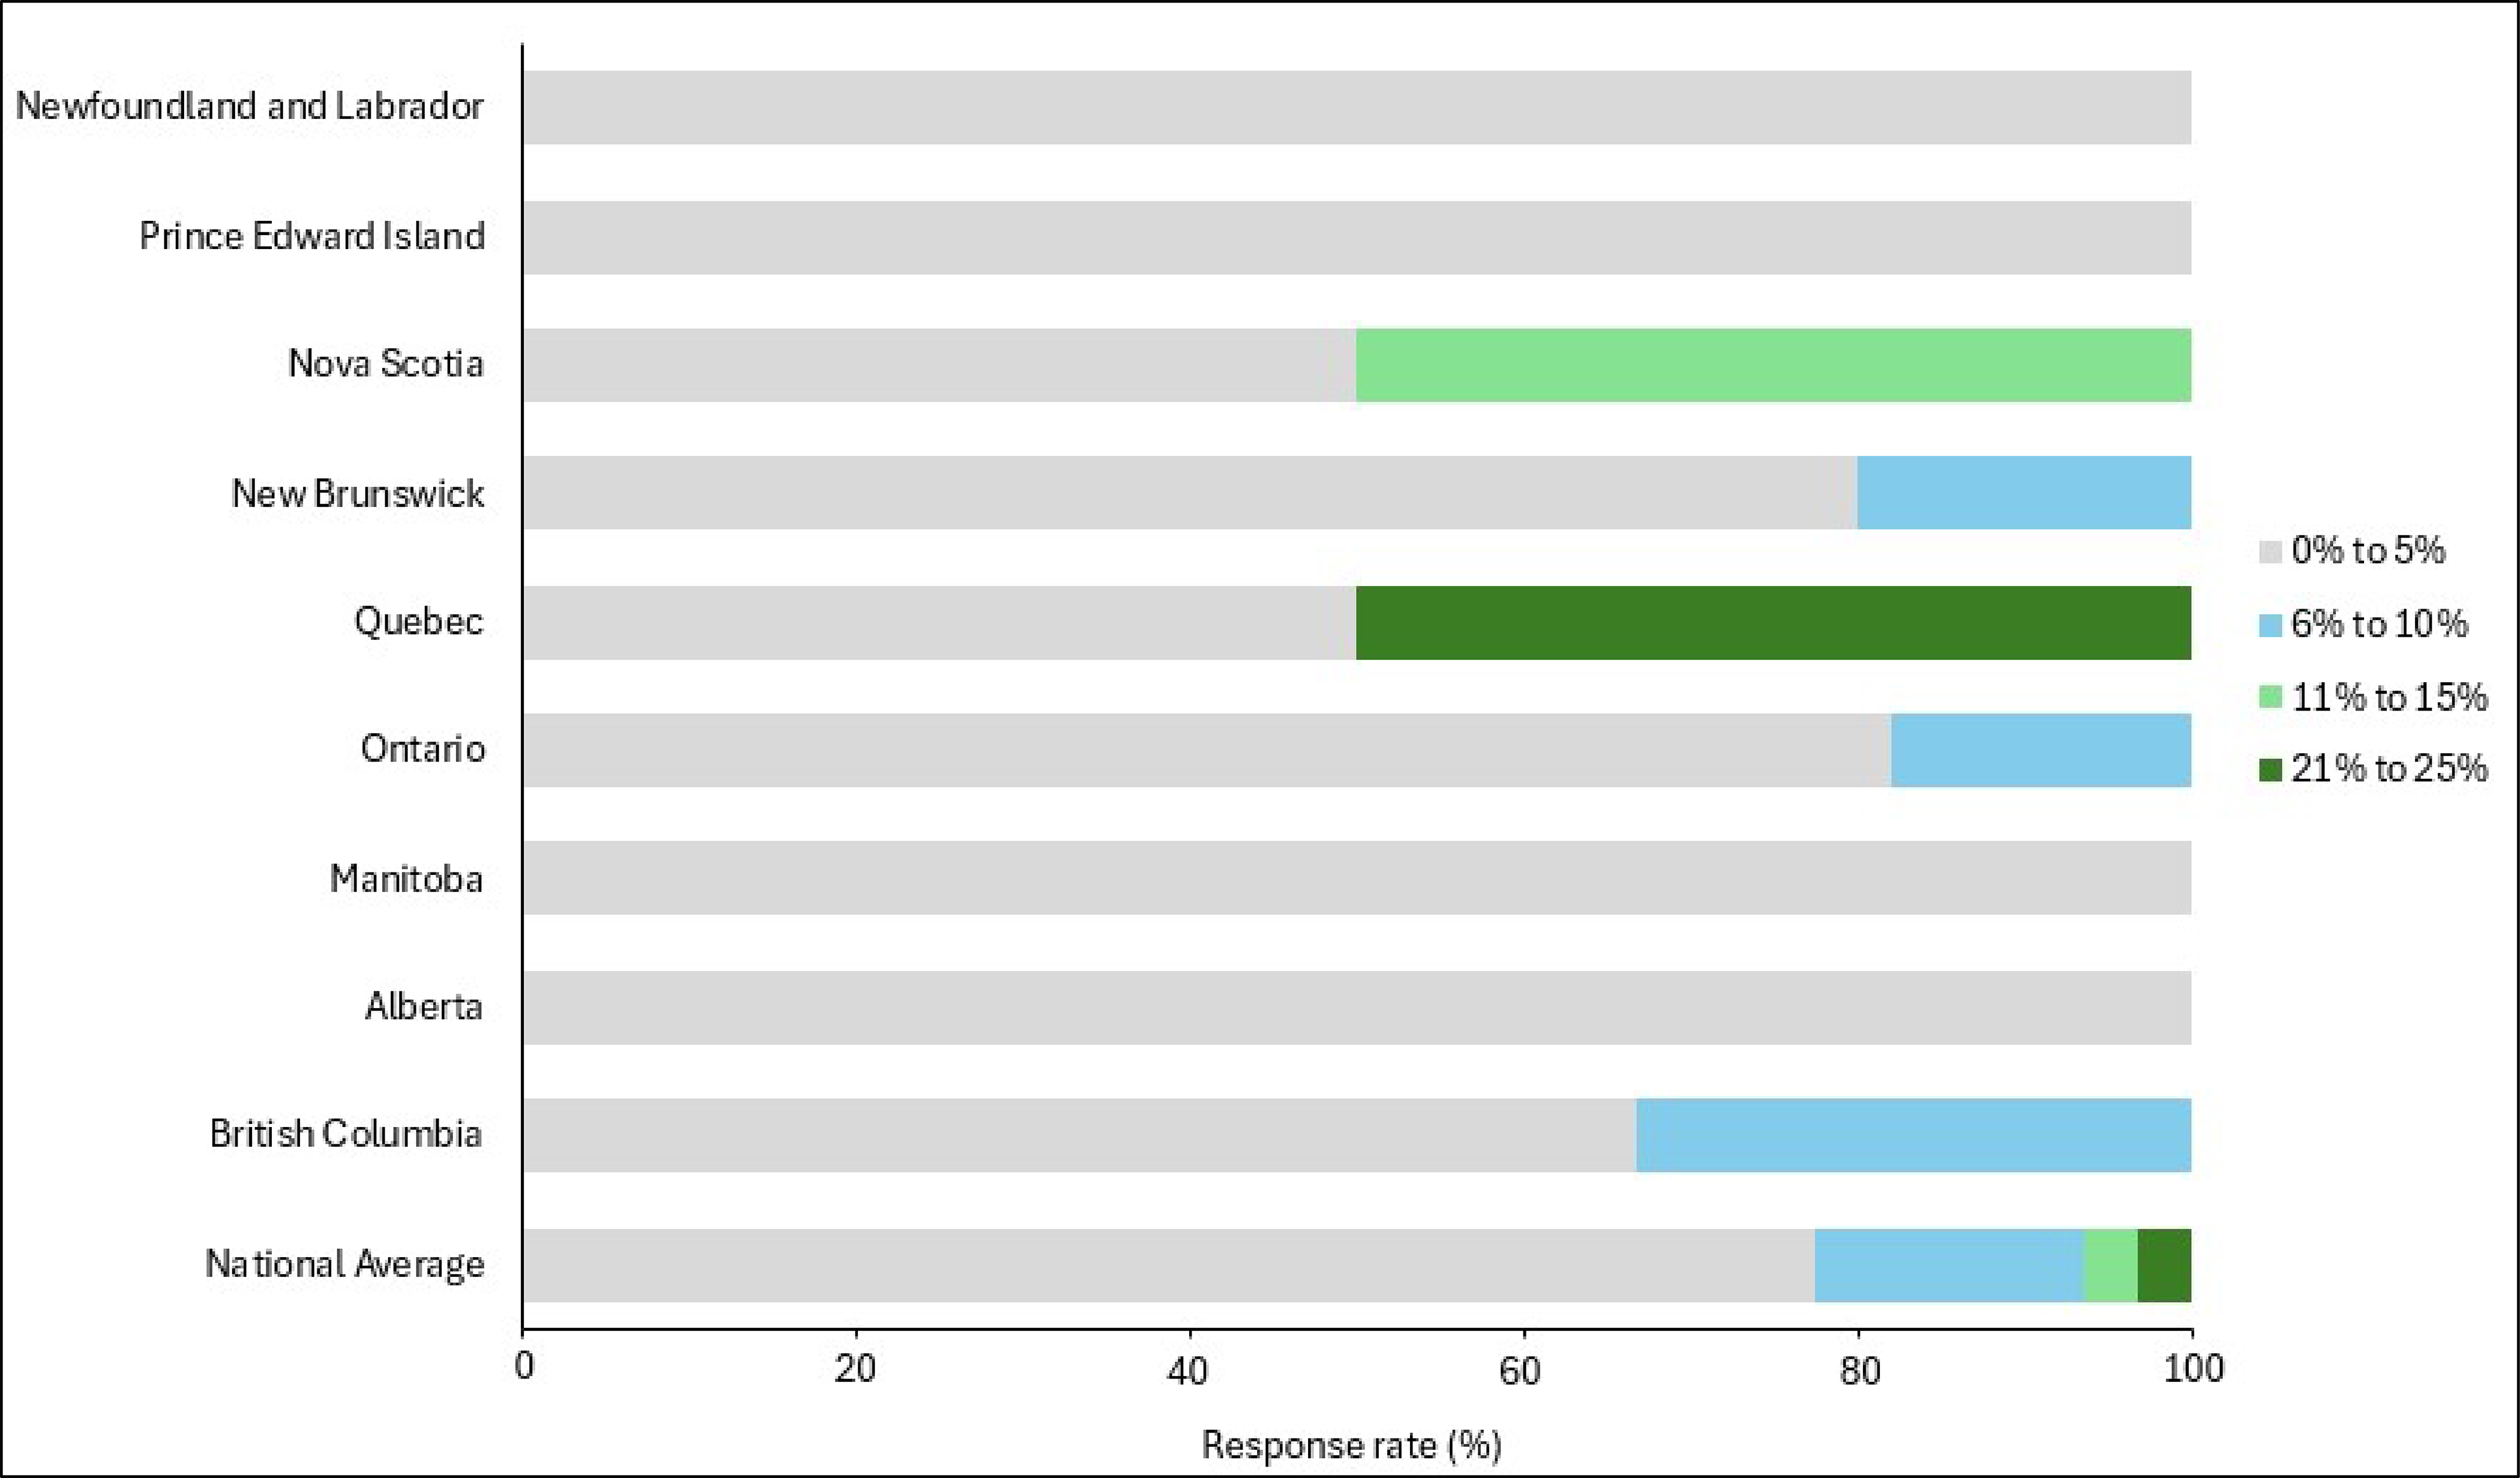
Notes: Newfoundland and Labrador (n = 1), Prince Edward Island (n = 1), Nova Scotia (n = 2), New Brunswick (n = 5), Quebec (n = 2), Ontario (n = 11), Manitoba (n = 2), Alberta (n = 1), British Columbia (n = 6), and national average (n = 31). No data were available for Saskatchewan or the territories. Respondents were asked for general estimates; therefore, some responses may be opinion-based rather than quantitative. No responses were provided for the 16% to 20% or over 25% categories.
Figure 8: X-Ray Appointment No-Show Rates by Region (Urban vs. Rural)
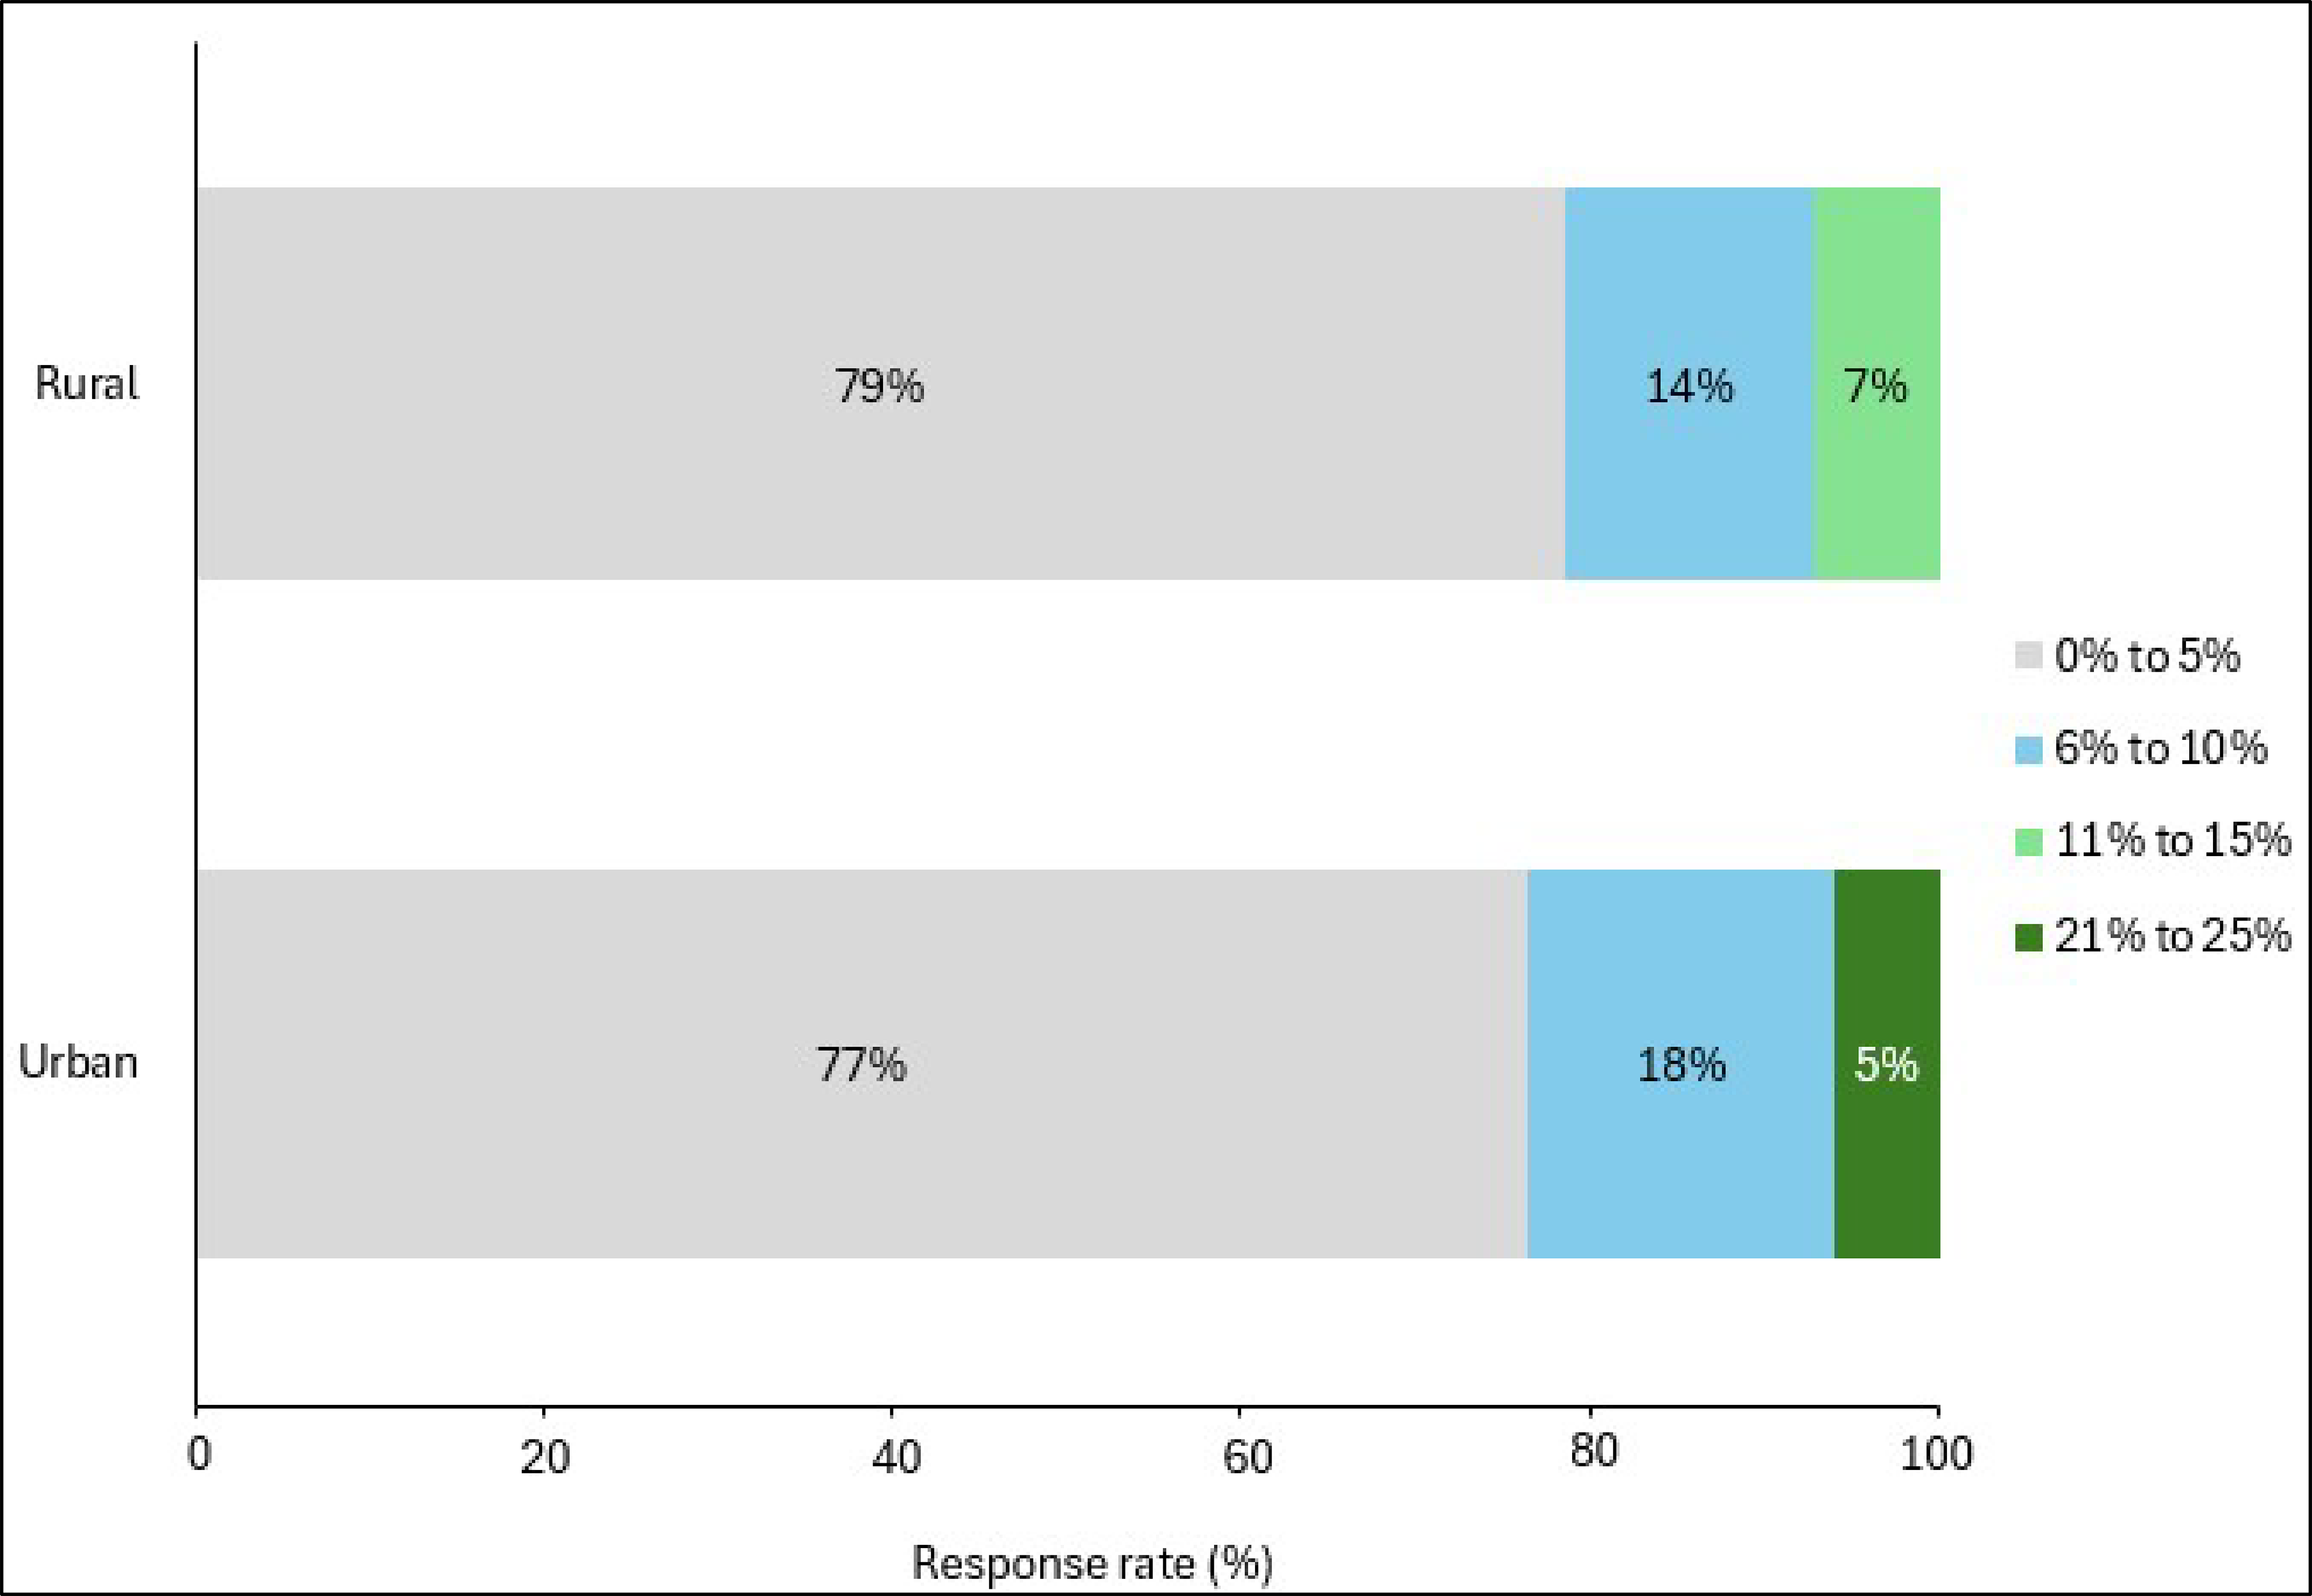
vs. = versus.
Notes: Urban (n = 25), rural (n = 29), and remote (n = 1). One remote site was combined with the rural sites for analysis. Respondents were asked for general estimates; therefore, some responses may be opinion-based rather than quantitative. No responses were provided for the 16% to 20% or over 25% categories.
Ultrasound No-Show Rates
Survey Response Overview
Seventy-six responding sites out of 85 reported offering ultrasound services. Among these, 54 responding sites (71%) indicated that they tracked no-show rates for this modality, while 22 (29%) indicated they did not track this information. The breakdown of responding sites that booked ultrasound appointments by geographic setting was as follows:
Urban: 36 responding sites
Rural: 36 responding sites
Remote: 4 responding sites
Estimated National No-Show Rates
Based on our sample, no-show rates for ultrasound appointments displayed the most variation between provinces and were highest on average when compared to the other modalities. The national estimated average no-show rate for ultrasound was 7% (based on our survey sample).
There was variability between jurisdictions, with some responding sites in Quebec and the territories reporting substantially higher no-show rates for ultrasound than responding sites in other parts of the country. Based on our sample, 25% of responding sites in Quebec and the territories reported no-show rates over 25%. In Ontario, 6% of responding sites reported rates between 16% to 20%, while responding sites in Nova Scotia (25%), Ontario (22%), British Columbia (10%), and the territories (25%) all reported no-show rates between 11% to 15% for ultrasound (refer to Figure 9).
No-Show Rates by Geographic Setting
When comparing ultrasound no-show rates between urban and rural settings, the differences were minimal, with most responses in both settings falling within the same low no-show ranges. The following observations were noted (refer to Figure 10):
Four percent of responding rural sites reported no-show rates in the 16% to 20% range, while no responding urban sites reported no-show rates in this range for ultrasound.
Four percent of responding sites in both urban and rural areas reported no-show rates in the over 25% range, which was unique to this modality.
Figure 9: Ultrasound No-Show Rates by Jurisdiction
Notes: Newfoundland and Labrador (n = 4), Prince Edward Island (n = 1), Nova Scotia (n = 4), New Brunswick (n = 5), Quebec (n = 4), Ontario (n = 18), Manitoba (n = 2), Alberta (n = 2), British Columbia (n = 10), the territories (n = 4), and national average (n = 54). No data were available for Saskatchewan. Respondents were asked for general estimates; therefore, some responses may be opinion-based rather than quantitative. No responses were provided for the 21% to 25% category.
Figure 10: Ultrasound No-Show Rates by Geographic Setting (Urban vs. Rural)
vs. = versus.
Notes: Urban (n = 36), rural (n = 36), and remote (n = 4). Four remote sites were combined with the rural sites for analysis. Respondents were asked for general estimates; therefore, some responses may be opinion-based rather than quantitative. No responses were provided for the 21% to 25% category.
Proactive No-Show Reduction Strategies in Medical Imaging
Most responding sites (88%) reported using proactive strategies to reduce no-shows, mainly through automated reminders and centralized phone numbers for cancellations or rescheduling.
Proactive strategies were widely used for sites that book CT, MRI, and ultrasound appointments (about 80% of sites with each modality), but were less common for X-ray (34%).
Automated reminders (via text message, phone, or email), confirmation calls, appointment instructions in reminders, and centralized rescheduling support were the most frequently reported interventions.
Some sites reported improvements after implementing proactive no-show reduction strategies, with the largest reported reductions occurring for CT and MRI appointments.
Patients emphasized the need for clear and consistent communication tools, reduced lead times between booking an appointment and the actual appointment date, access to self-scheduling tools, and strong patient-centric supports (e.g., language services, care navigators).
Survey Response Overview
To better understand current practices, survey respondents were asked to report the proactive strategies they used to limit no-shows across the 4 imaging modalities: CT, MRI, X-ray, and ultrasound. Proactive strategies are interventions applied before an appointment to prevent missed visits. The following section provides a detailed summary of our survey findings, including implementation rates, their perceived impact on no-shows, and how strategies align with patient engagement and literature findings.
Implementation Rates
The survey results indicate that most medical imaging departments in our sample actively implemented proactive measures to reduce no-shows. Among the 85 sites surveyed, 75 sites (88%) reported using proactive strategies in medical imaging departments, while 10 sites (12%) did not. However, implementation rates varied by modality:
CT: Sixty-one respondents out of 75 (81%) that offer CT services indicated they applied proactive strategies to mitigate no-shows for this modality, and 14 respondents (19%) did not.
MRI: Forty-four respondents out of 54 that offer MRI services (81%) indicated they applied proactive strategies to mitigate no-shows for this modality, and 10 respondents (19%) did not.
X-ray: Eighteen respondents out of 53 that offer X-ray services (34%) indicated they applied proactive strategies to mitigate no-shows for this modality, and 35 (66%) did not.
Ultrasound: Sixty out of 76 respondents that offer ultrasound services (79%) indicated they applied proactive strategies to mitigate no-shows for this modality, and 16 respondents (21%) did not.
Overall, proactive strategies were widely used for CT, MRI, and ultrasound among survey respondents. X-ray showed the lowest rate of adoption, which may partially be attributed to the fact that these services often allow for walk-in access, which reduces time between an imaging request and exam completion compared to scheduled exams.
Proactive Strategies Used
The most common strategies reported for CT, MRI, X-ray, and ultrasound appointments were automated reminders (via phone, text, or email) and centralized phone numbers for rescheduling or cancelling appointments (refer to Figure 16, Figure 17, Figure 18, and Figure 19, Appendix 1, for survey response data). In addition to these commonly reported strategies, the following were also noted as proactive strategies used to reduce no-shows for each modality.
For CT, strategies included requiring patient confirmation of appointments through manual calls before an appointment, including appointment instructions in reminders, decreasing booking lead times, coordinating imaging appointment with other departments, and overbooking.
For MRI, strategies included requiring patient confirmation of appointments, scheduling patient arrival times earlier than actual exam times, decreasing booking lead times, and including appointment instructions in reminders.
For X-ray, strategies included conducting manual phone reminders to receive patients’ confirmation of upcoming appointments. No responding sites indicated they applied overbooking to X-ray appointments, which was unique to this modality.
For ultrasound, strategies included coordinating imaging appointments with other departments and including appointment instructions in reminder calls or texts.
Perceived Impact of Proactive Strategies on No-Show Rates
Survey respondents were asked whether they felt that proactive strategies were effective in reducing no-shows, and to what extent, based on predefined survey response categories. Most sites that responded to this question reported an improvement in no-shows associated with proactive interventions, with the most substantial decreases in no-shows reported for CT and MRI. These data reflect self-reported observations rather than measured comparisons before and after implementation. Refer to Figure 11 for general response trends. The average reported no-show rate for each modality before and after implementation of proactive strategies was as follows:
CT: Twenty-nine responding sites out of 75 that offer CT services (38%) reported that proactive strategies had reduced no-shows, while 32 (43%) reported no impact; 14 responding sites (19%) did not apply proactive strategies to CT appointments.
Average no-show rates for CT reportedly dropped from 9% before implementation to 5% after implementation.
MRI: Twenty-six responding sites out of 54 that offer MRI services (48%) reported that proactive strategies had reduced no-shows, while 18 (33%) reported no impact; 10 responding sites (19%) did not apply proactive strategies to MRI appointments.
Average no-show rates for MRI reportedly dropped from 9% before implementation to 5% after implementation.
X-ray: Six responding sites out of 53 that offer X-ray services (11%) reported that proactive strategies had reduced no-shows, while 12 (23%) reported no impact; 35 responding sites (66%) did not apply proactive strategies to X-ray appointments.
Average no-show rates for X-ray reportedly dropped from 7% before implementation to 4% after implementation.
Ultrasound: Twenty-eight responding sites out of 76 that offer ultrasound services (37%) reported that proactive strategies had reduced no-shows, while 32 (42%) reported no impact; 16 responding sites (21%) did not apply proactive strategies to ultrasound appointments.
Average no-show rates for ultrasound reportedly dropped from 10% before implementation to 7% after implementation.
The most commonly reported proactive strategies that survey respondents listed to reduce no-shows were manual phone reminders requesting patients to confirm upcoming appointments, providing access to an online application or portal for patients to book appointments and receive reminders, and providing a centralized phone number or portal for patients to cancel or reschedule appointments. Refer to Table 3, Appendix 1, for a summary of all proactive strategies reported to have had an impact on reducing no-shows for each modality.
Figure 11: Differences in No-Show Rates Before and After Implementation of Proactive No-Show Reduction Strategies
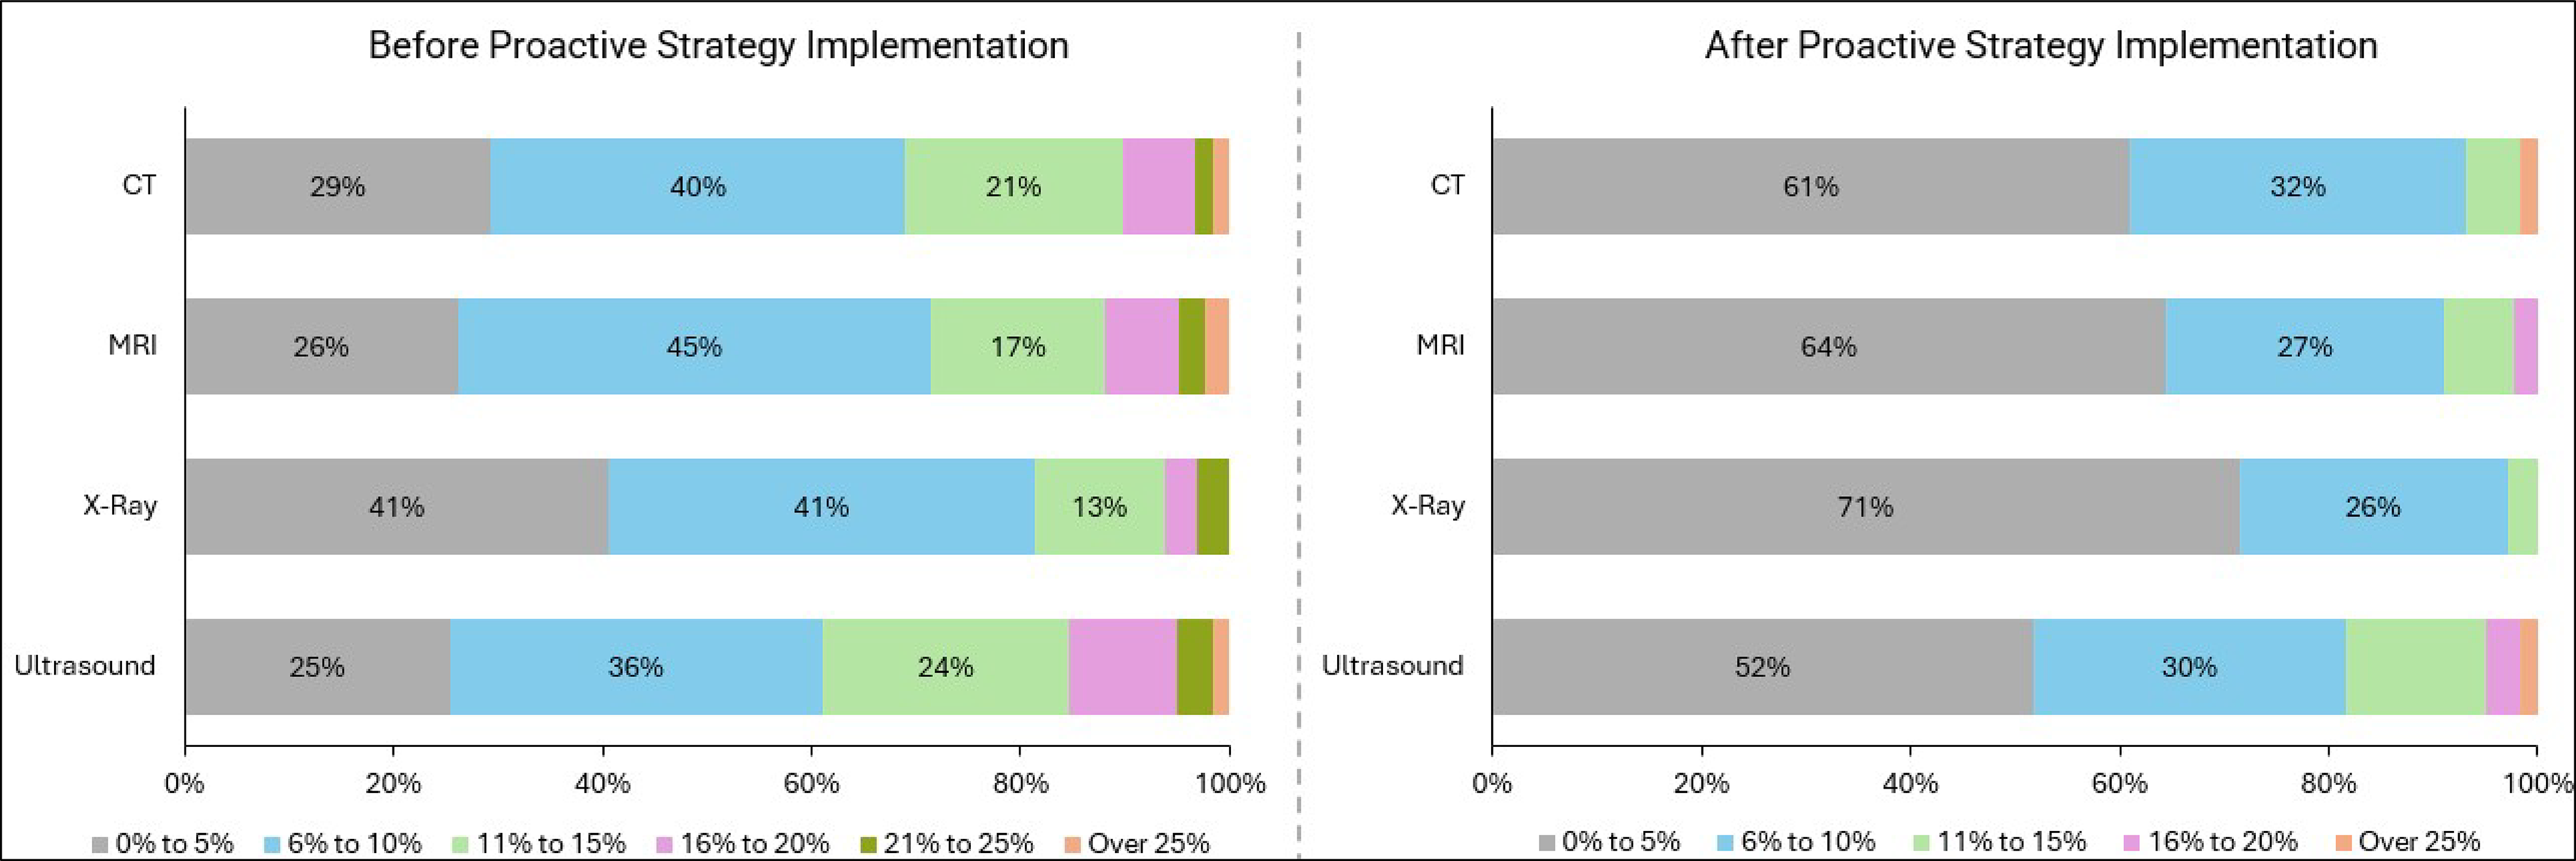
Note: Respondents were asked for general estimates; therefore, some responses may be opinion-based rather than quantitative.
Proactive Strategies: Survey Results and Literature Findings
Five main categories of proactive strategies emerged from the survey responses and the reviewed literature (refer to Figure 12). Strategies were primarily centred around improving communication with patients and increasing flexibility in scheduling. The following section summarizes the proactive no-show reduction strategies reported by survey respondents, alongside supporting information from the literature to provide contextual insights — such as recommendations for optimal implementation approaches, limitations, and considerations for patient-centric design (refer to Figure 16, Figure 17, Figure 18, and Figure 19, Appendix 1, for survey response data).

Appointment Reminders
Tailored Appointment Reminders — Reported for CT, MRI, and Ultrasound
The literature suggests that reminders are most effective when they are aligned with patient preferences and include clear, detailed information about the appointment.14,15 Reminders that encourage patients to reschedule or cancel if they are unable to attend appointments may also be effective.14
Automated Appointment Reminders — Reported for All 4 Modalities
The literature indicates that text messages (i.e., short message service [SMS])5,16 and phone reminders14 may be cost-effective methods of improving patient attendance. Automated reminders delivered via text, phone call, or email have been shown to be effective in reducing no-show rates for medical imaging appointments.8,17,18
Appointment Descriptions in Reminders — Reported for CT, MRI, and Ultrasound
The literature suggests that including clear details about the appointment — such as the exam type, preparation instructions, location, and duration — can help reduce confusion, increase preparedness, and improve attendance.14 Additionally, framing reminders to include instructions on how to cancel or reschedule if unable to attend has been shown to further reduce no-show rates.8
Dynamic Scheduling Options
Reduced Lead Times — Reported for CT, MRI, and Ultrasound
The literature suggests that shorter wait periods (e.g., same-day or next-day appointments) are consistently associated with lower no-show rates than longer intervals.14,16
Overbooking — Reported for CT, MRI, and Ultrasound
One report suggested that while overbooking can increase efficiency and access, there are potential drawbacks, including longer wait times and disproportionate impacts on staff and populations that are underserved if not implemented carefully.8
Self-Scheduling Tools and Online Patient Portals — Reported for All 4 Modalities
The literature indicates that the use of patient-directed scheduling platforms (e.g., web or app-based) has been shown to simplify appointment management and reduce missed visits.14,17
Centralized Rescheduling Support — Reported for All 4 Modalities
One report indicated that the provision of a toll-free, centralized phone number for cancellations or rescheduling has been shown to reduce no-shows and increase timely rebookings.19
Proactive Strategies Unique to the Reviewed Literature
According to the literature we reviewed, some of the more effective strategies are patient-centred — focused on educating patients about their exams and providing targeted reminders to those at higher risk of missing appointments.14,20,21 The following strategies are discussed in the literature but were not reported by survey respondents.
Dynamic Scheduling Options
Atypical Appointments
One strategy is to offer after-hours and weekend appointments to help accommodate individuals unable to take time off work and provide flexibility to patients with limited availability.22
Accessibility Enhancements
Transportation
Another strategy is to provide access to a rideshare program to help ensure patients attend their scheduled appointments and decrease no-show rates for those who do not have access to transportation.23 One study found that patients scheduled for MRI that used the rideshare program were more likely to be on time for the appointment. The program was especially beneficial for patients who were older, unemployed, or uninsured, as they were more likely to use the service.24
Parking
Expanding parking availability near medical imaging clinics has been reported to help address accessibility barriers that may contribute to reducing no-shows.13,25
Patient-Centric Approach
Communication
Clear communication between patients and providers was reported to help ensure proper preparation, provide clear instructions about the appointment, and reduce anxiety related to the procedure.20,21
Cultural Sensitivity Training
Equipping health care teams with training to effectively engage diverse populations was reported to enable them to better respond to patient needs.20
Patient-Centric Care
Access to translators helps provide multilingual support to overcome language barriers.15
Predictive Analytics and Artificial Intelligence Tools
Predictive Models
Implementing artificial intelligence (AI)-based models that predict no-shows based on various criteria (such as distance from clinic, exam type, age, previously missed appointments) has been reported to accurately identify individuals at high risk of missing appointments to facilitate targeted outreach and intervention.26
Leveraging Electronic Medical Records
This strategy was reported in the literature for CT, X-ray, and ultrasound. Assessing information from electronic medical records (EMRs) (i.e., before the no-show) was shown to help identify patients who may benefit from additional reminder engagement.2,27,28
Patient Engagement Feedback
As no-shows are highly influenced by individual experiences, circumstances, and behaviour, CDA-AMC consulted people who are regularly engaged with medical imaging to gain their feedback on the survey results and findings in the literature regarding proactive strategies to reduce no-shows. Participants in the patient engagement sessions emphasized the need for education and awareness campaigns to highlight the services available to patients, as well as the implementation of reduction strategies tailored to patients’ preferences. The following is a summary of the themes discussed around proactive no-show reduction strategies with patients and caregivers.
Appointment Reminders
Tailored Appointment Reminders
Multiple patients indicated that appointment reminders should be brief and easy to read, as dense text message (SMS) can be overwhelming — especially when people are stressed about their health.
Automated Appointment Reminders
Participants indicated that having too many tools and systems to schedule and remind people of appointments can be an impediment to attendance. Some clinics use phone calls to schedule or remind people, while other use applications or paper-based reminders.
Streamlined and centralized software was suggested as a strategy to support accessibility and help reduce no-shows due to forgetfulness or misplacement of reminder cards.
Some patients also noted that reminders are most effective when delivered in multiple stages and when they include caregivers in the communications; especially for older patients or those with cognitive delays.
Appointment Descriptions in Reminders
Including appointment-specific instructions within reminders, such as bloodwork requirements or preparation steps, could help reduce no-shows. Postvisit surveys and appointment follow-ups were also seen as valuable, as they give patients the opportunity to provide feedback on their experiences and the perceived effectiveness of reminders or other proactive strategies. The opportunity to provide feedback was noted as helping to keep patients engaged with the health care system.
Dynamic Scheduling Options
Reduced Lead Times
Shorter lead times were described as a way to potentially help patients avoid missing appointments, especially when bookings are scheduled several months in advance.
Participants noted that increasing walk-in opportunities for medical imaging exams could contribute to reducing these lead times.
Self-Scheduling Tools and Online Patient Portals
Participants reported that self-referral systems would be helpful in scheduling exams at clinics closer to them, and at times more suitable to their schedules.
Participants also suggested improving accessibility by including options to request support for accessibility needs such as anxiety or disability. Online patient portals were viewed as valuable for providing access to health records and delivering personalized reminders.
Centralized Rescheduling Support
Participants indicated that centralized rescheduling would improve accessibility, as some patient messaging applications are not monitored in real time, and cancellations often cannot be made available to those on a wait-list.
Overbooking
Overbooking was generally not supported by the participants in the patient engagement sessions. Past negative experiences and concerns about increased delays and confusion were reasons the participants gave for resisting this strategy. Participants with experience caring for those at a later stage of illness specifically discouraged overbooking, citing the risk associated with cancelled or delayed exams for patients who are extremely sick.
Patient-Centric Approach
Communication
Participants emphasized a need for clear communication between health care providers and patients to explain why medical imaging appointments are important to their health, and the impact that missing an appointment can have on themselves or the health care system more broadly.
It was generally believed that if people understood the importance of exams and the negative impact of missed appointments on the health system more broadly, they would be more likely to attend the appointment or call to cancel. One way to achieve this is posting notices in clinics to describe the importance of attending medical imaging exams and the impact a no-show can have (refer to Figure 32, Figure 33, and Figure 34, Appendix 1).
Patient-Centric Care
Many participants explained that they were unaware of support services that may be available, such as ride share programs, cultural liaisons, and social workers. One suggested approach was to include a system navigator or care coordinator on medical imaging requisitions for patients who may be differently abled, who have cognitive impairments, or whose first language is not English.
Participants also recommended coordinating multiple scans on the same day to reduce travel time and the financial burden associated with attending more than 1 appointment.
Trauma-Informed care
Trauma-informed care was identified as a helpful approach for patients who have experienced previous harms within the health care system, particularly Indigenous or racialized individuals.
Appointment Reminders: Frequency, Methods, and Strategies
Appointment reminders — commonly delivered by phone, email, or text message (SMS) — are a widely used proactive strategy to help reduce no-shows for medical imaging appointments. Our survey asked respondents how they implemented appointment reminders, and which approaches they found the most effective. Specifically, the survey explored the timing and frequency of reminders, and whether they were delivered manually or through automated systems. For clinics that did not use reminders, we asked respondents to identify any barriers to implementation.
Among the responding sites that reported sending appointment reminders, those sent by phone were the most common, while text message (SMS) and email were less commonly used. Text message (SMS) and email reminders were fully automated, whereas phone reminders split evenly between manual and automated workflows. Reminder lead times clustered at 2 to 3 days before appointments for phone and text message (SMS) reminders, while email reminders were sent earlier (4 to 7 days before appointments). The majority of responding sites reported sending a single reminder per appointment. Our survey results for each reminder method are summarized in Table 1 and additional information for each reminder method is available by modality in Figure 20, Figure 21, Figure 22, Figure 23, Figure 24, and Figure 25, Appendix 1.
Survey respondents were asked for their opinion on the role that automated software has on reducing no-shows in medical imaging (refer to Figure 31, Appendix 1, for the survey response breakdown):
Twenty-nine survey respondents out of 85 (34%) indicated that automated software played a role in reducing missed appointments.
Twenty-two survey respondents out of 85 (26%) indicated that automated software did not play a role in reducing missed appointments.
Thirty-four survey respondents out of 85 (40%) were unsure of the relationship between automated software and no-show reduction.
Automated reminders via systems such as NotifyMe and PocketHealth, and online self-booking systems such as MyHealthApp and Patient Connect were reported by responding medical imaging clinics to play a role in reducing no-shows.
Table 1: Summary of Survey Results on Appointment Reminders (Frequency, Methods, and Strategies)
Reminder method | Implementation rate | Automation | Lead time | Frequency | Barriers to implementation |
|---|---|---|---|---|---|
Phone | 73% (62/85) | Manual and automated (approximately 50% manual and 50% automated) | 2 to 3 days | Single reminder |
|
Text | 24% (20/85) | Automated only | 2 to 3 days | Single reminder |
|
16% (14/85) | Automated only | 4 to 7 days | Single reminder |
|
Phone, Text, and Email Reminders: Literature Results
The literature on appointment reminders indicates they can be effective in improving attendance at medical appointments, particularly when the reminders include additional information beyond just the time, date, and location, such as preparation instructions or the importance of the visit (e.g., the Reminder-Plus tool).27
According to 1 source, the exact timing of reminders has minimal impact on improving attendance; however, reminders are reported to be effective when delivered within a broad window — from 2 hours to 2 weeks before the appointment — as they may help reduce no-shows by prompting timely cancellation.14
Many sites that responded to our survey indicated that they used manual reminders that require input from patients. This aligns with the literature findings, which noted that automated reminders often have low confirmation rates (i.e., less than 15%);29 interactive reminders were reported to be more effective because they allow follow-up to focus on those who have missed appointments in the past.22,28
Automated reminders have shown mixed results in the literature in terms of their effectiveness at reducing no-shows, but have been shown to increase cancellations.8 Although patients are reported to be less likely to confirm appointments through automated reminders,29 they do increase patient awareness and reduce miscommunication, especially when appointment preparation information is included.14 The effectiveness of automated reminders is also complicated by privacy concerns and legal obligations that sometimes require patients to consent to this reminder method.30
The specific method of a reminder seemed to be less important than tailoring the approach to patient preference.22,28 The reviewed literature focused on phone reminders rather than email or text message (SMS), largely due to privacy concerns and implementation challenges.14,27,29 Phone calls were also the most commonly reported reminder method in 1 study,30 which was consistent with the results of our survey findings.
Reactive No-Show Reduction Strategies in Medical Imaging
Overall, the implementation of reactive strategies to manage no-shows (35% of survey respondents) was lower than proactive strategies (88% of survey respondents) among responding medical imaging sites.
Implementation rates for reactive strategies were less than 40% among responding sites for all modalities, with X-ray having the lowest uptake (15% of respondents).
Limiting the number of no-shows before cancelling a referral was the primary reactive strategy reported across CT, MRI, X-ray, and ultrasound.
Additional approaches listed by survey respondents included offering after-hours clinics, switching communication methods, and sending extra reminders to patients with unconfirmed appointments.
No medical imaging sites that responded to the survey reported charging for missed medical imaging appointments, and patient engagement feedback favoured interventions that increase accessibility over punitive measures.
Survey Response Overview
To better understand current practices, survey respondents were also asked to report on the reactive strategies they used to limit the impact of no-shows across CT, MRI, X-ray, and ultrasound. Reactive strategies are interventions that are applied after a no-show occurs to limit the impact on scheduling and prevent future no-shows. The following section provides a detailed summary of our survey findings, including implementation rates, the perceived impact of reactive strategies on no-shows, and how strategies align with patient engagement and the literature findings.
Implementation Rates
The survey results indicate that most medical imaging departments in our sample did not actively implement reactive measures to reduce no-shows. Among the 85 sites surveyed, 30 sites (35%) reported using reactive strategies in medical imaging departments, while 55 sites (65%) did not. However, implementation rates varied by modality:
CT: Twenty-five respondents out of 75 that offered CT services (33%) indicated they applied reactive strategies to mitigate no-shows for this modality, and 50 respondents (67%) did not.
MRI: Twenty-five respondents out of 54 that offer MRI services (37%) indicated they applied reactive strategies to mitigate no-shows for this modality, and 34 respondents (63%) did not.
X-ray: Eight respondents out of 53 that offer X-ray services (15%) indicated they applied reactive strategies to mitigate no-shows for this modality, and 45 respondents (85%) did not.
Ultrasound: Twenty-four respondents out of 76 that offer ultrasound services (32%) indicated they applied reactive strategies to mitigate no-shows for this modality, and 52 respondents (78%) did not.
Adoption of reactive strategies remained low across all 4 imaging modalities, with less than 40% of responding sites reporting implementation for any 1 modality (ranging from 15% to 37%).
Reactive Strategies Used
The most common reactive no-show mitigation strategy reported for all 4 modalities was limiting the number of no-shows permitted for a patient before a referral was cancelled and sent back to an ordering provider for follow-up, followed by offering after-hours clinics and switching communication methods (refer to Figure 26, Figure 27, Figure 28, and Figure 29, Appendix 1, for survey response data). In addition to these commonly reported strategies, the following were noted as reactive strategies used to reduce no-shows for each modality.
CT: Communicating with health care practitioners regarding a patient’s no-show and sending additional reminders to those who had not confirmed appointments.
MRI: Communicating with health care practitioners regarding a patient’s no-show and requesting that the patient rebook through the provider for a new imaging appointment.
X-ray: No other strategies were reported for X-ray.
Ultrasound: Communicating with health care practitioners regarding a patient’s no-show and requesting a patient rebook through their provider for a new imaging appointment.
Perceived Impact of Reactive Strategies on No-Show Rates
Survey respondents were asked whether they felt reactive strategies were effective in reducing no-shows, and to what extent, based on predefined survey response categories. Most sites that responded to this question reported an improvement in no-shows associated with reactive interventions, though, based on respondent opinion, the impact of reactive strategies on no-show rates was less pronounced than that of proactive strategies. The most substantial decreases were reported for CT and MRI, but it is worth noting that these data reflect self-reported observations rather than measured comparisons before and after implementation. Refer to Figure 13 for general response trends. The average reported no-show rate for each modality before and after implementation of reactive strategies is as follows:
CT: Four responding sites out of 75 that offer CT services (5%) reported that reactive strategies had reduced no-shows, while 21 (28%) reported no impact; 50 responding sites (67%) did not apply reactive strategies to CT appointments.
Average no-show rates for CT reportedly dropped from 8% before implementation to 7% after implementation.
MRI: Five responding sites out of 54 that offer MRI services (9%) reported that reactive strategies had reduced no-shows, while 15 (28%) reported no impact; 34 responding sites (63%) did not apply reactive strategies to MRI appointments.
Average no-show rates for MRI reportedly dropped from 7% before implementation to 5% after implementation.
X-ray: Two responding sites out of 53 that offer X-ray services (4%) reported that reactive strategies had reduced no-shows, while 6 (11%) reported no impact; 45 responding sites (85%) did not apply proactive strategies to X-ray appointments.
Average no-show rates for X-ray reportedly dropped from 5% before implementation to 4% after implementation.
Ultrasound: 3 responding sites out of 76 that offer ultrasound services (4%) reported that reactive strategies had reduced no-shows, while 21 (28%) reported no impact; 52 responding sites (68%) did not apply proactive strategies to ultrasound appointments.
Average no-show rates for ultrasound reportedly dropped from 9% before implementation to 7% after implementation.
The most commonly reported reactive strategies that survey respondents listed to reduce no-shows were returning referrals to ordering providers after 3 or more consecutive no-shows for rebooking appointments, directed phone calls to patients who have not confirmed appointments, and offering after-hours appointments. Refer to Table 3, Appendix 1, for a summary of all reactive strategies reported to have had an impact on reducing no-shows for each modality.
Figure 13: Differences in No-Show Rates Before and After Implementation of Reactive No-Show Reduction Strategies
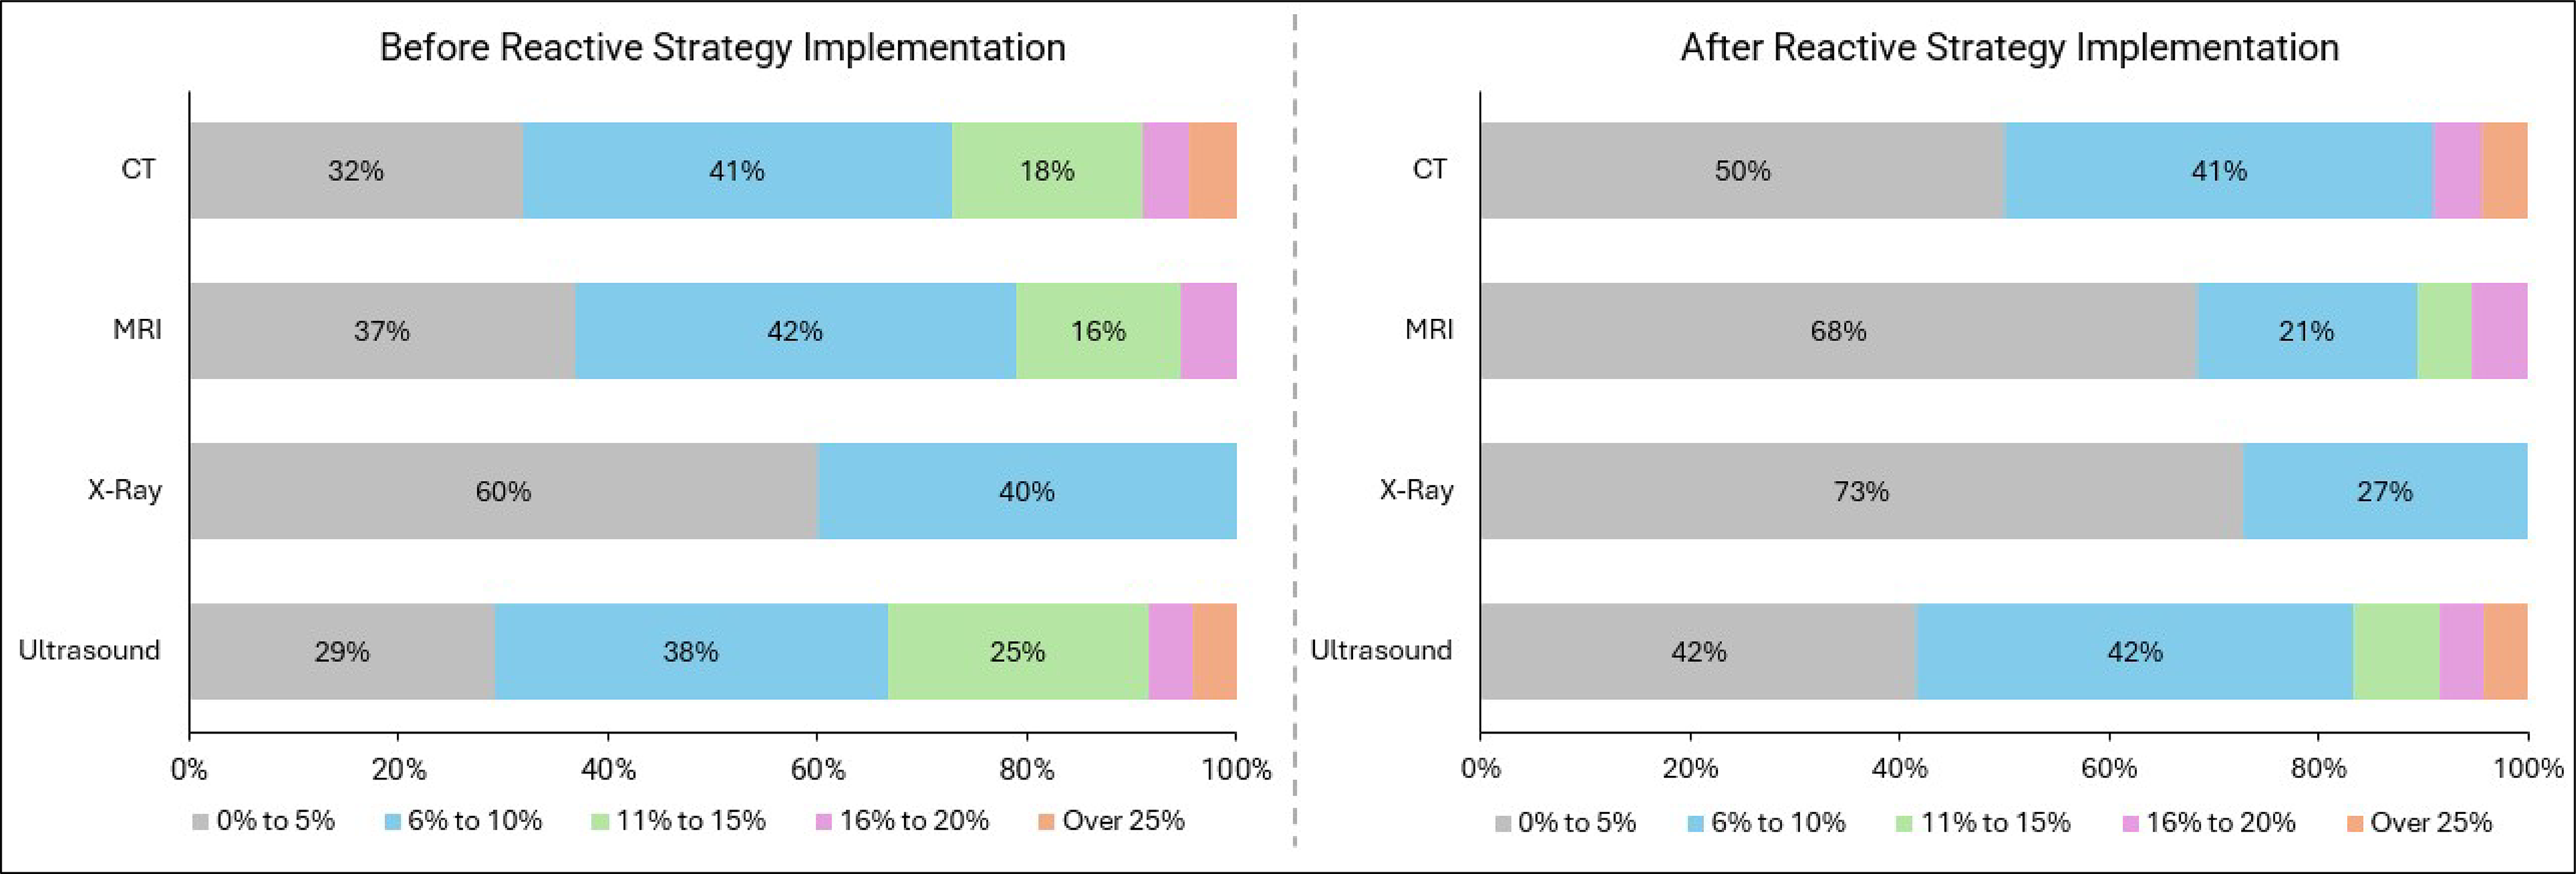
Note: Respondents were asked for general estimates; therefore, some responses may be opinion-based rather than quantitative.
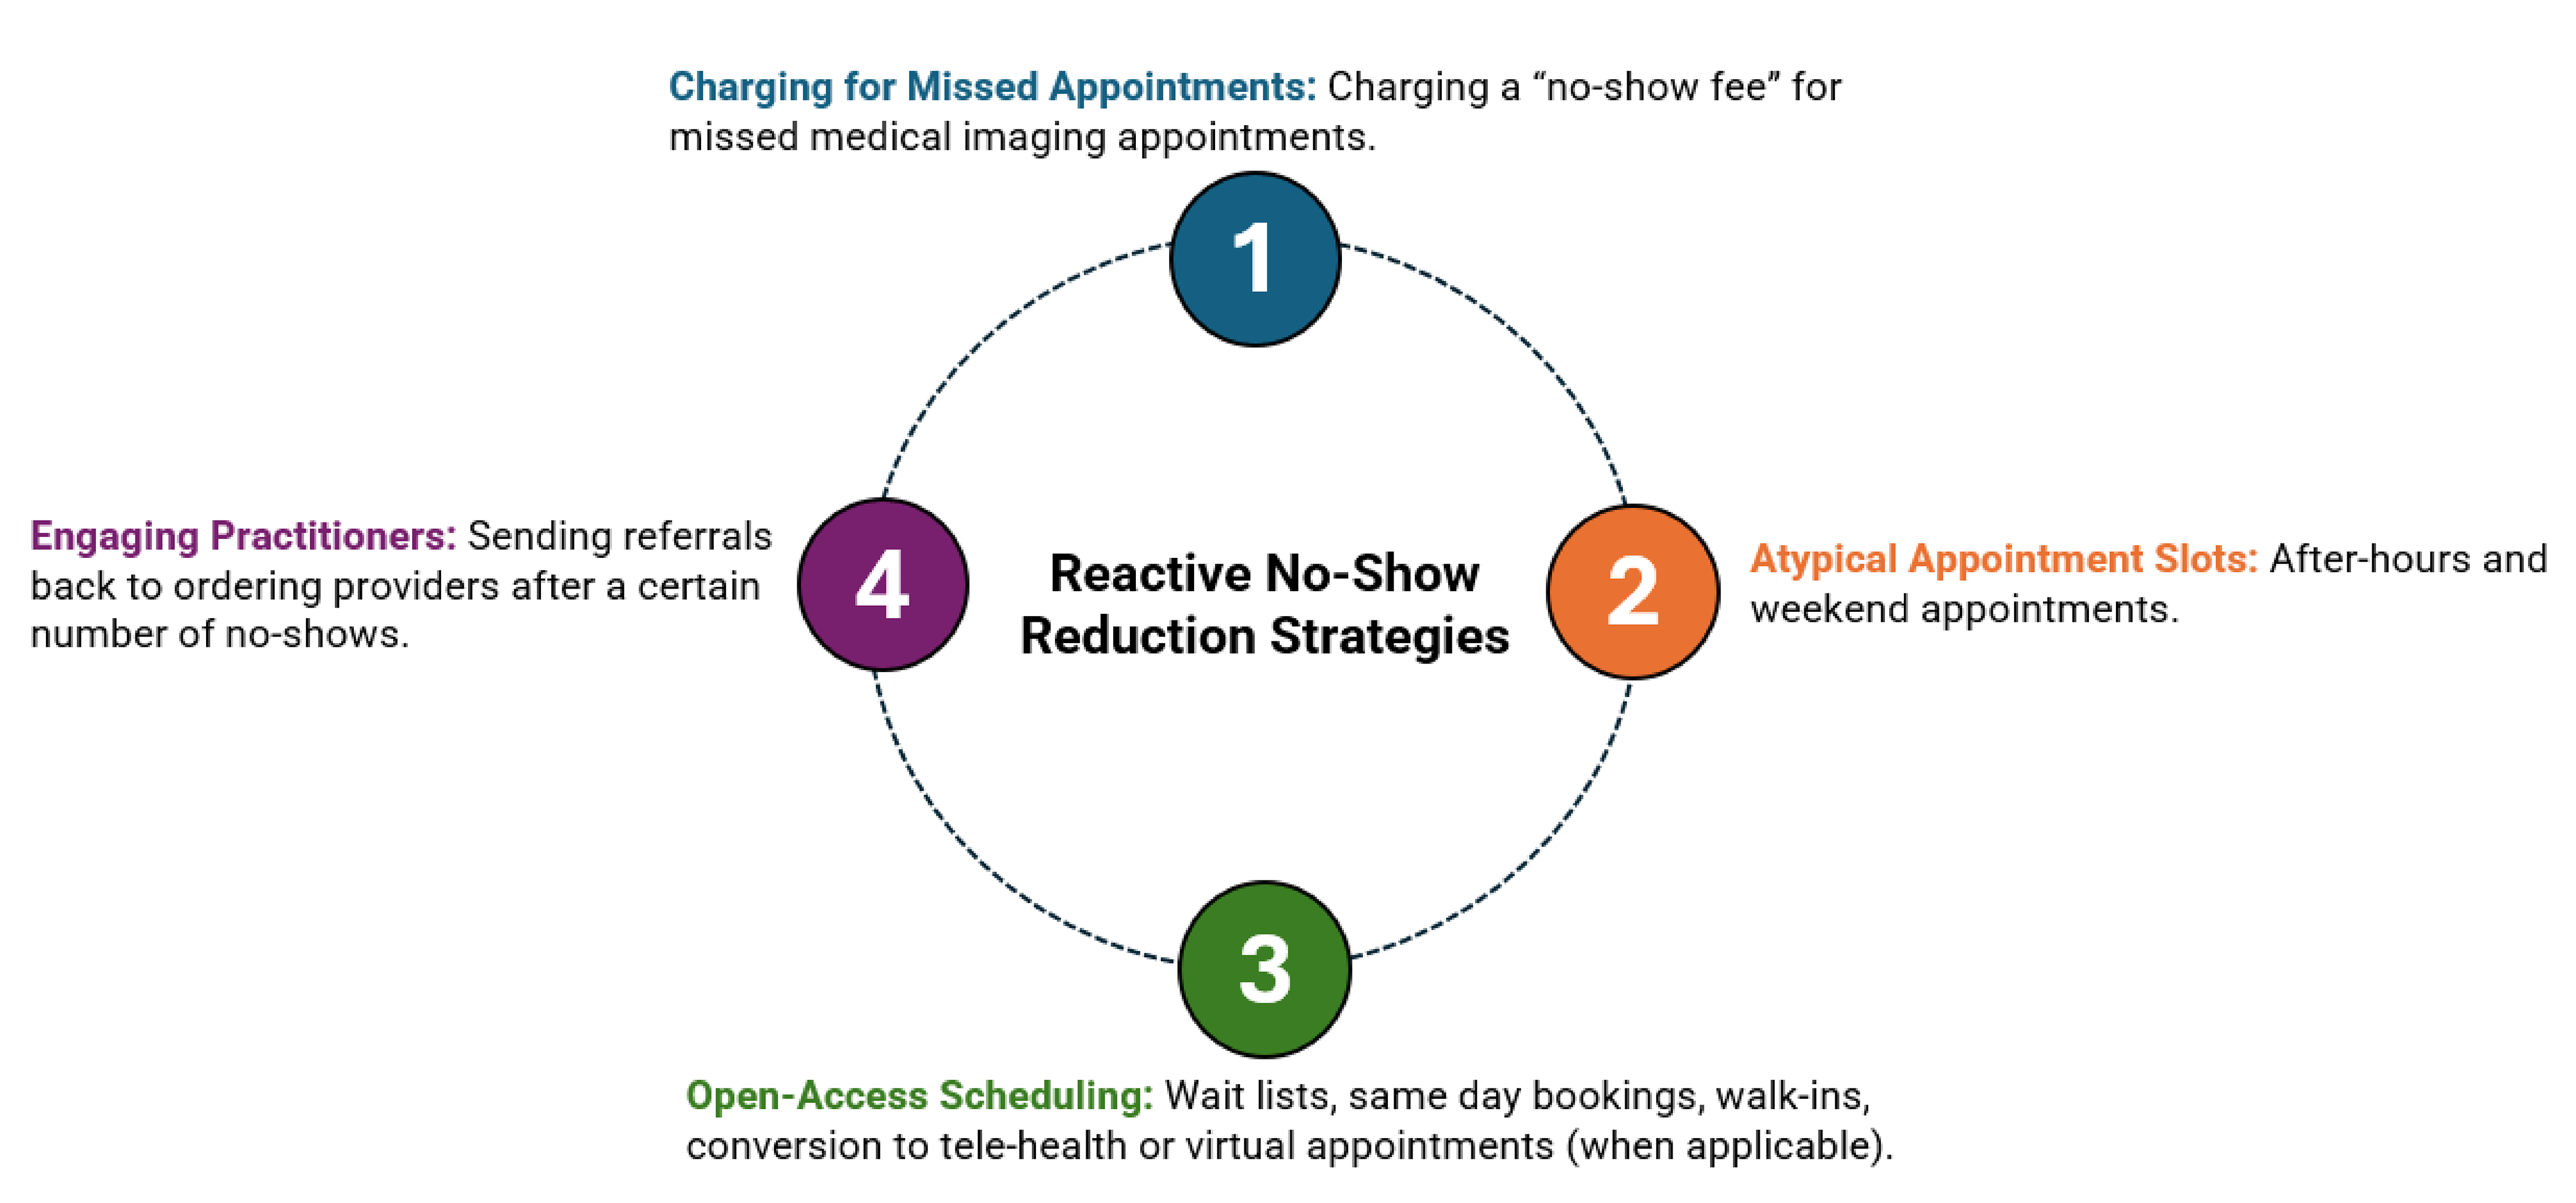
Reactive Strategies: Survey Results and Literature Findings
Four main categories of reactive strategies emerged from both the survey responses and the reviewed literature (refer to Figure 14). Reactive strategies primarily centred around offering after-hours or alternative appointment options and engaging a patient’s general practitioner after a no-show. No published literature was identified that specifically investigates limiting the number of no-shows allowed before a referral is cancelled and returned to an ordering provider for follow-up or rescheduling. One report, however, suggested that follow-up contact from ordering providers can encourage patients to attend their appointments — suggesting that this practice may be effective when applied after a no-show.32
The following section summarizes the reactive no-show reduction strategies reported by survey respondents, alongside supporting information from the literature to provide contextual insights, such as recommendations for optimal implementation approaches, limitations, and considerations for patient-centric design (refer to Figure 26, Figure 27, Figure 28, and Figure 29, Appendix 1, for survey response data).
Atypical Appointment Slots
After-Hours and Weekend Appointments — Reported for CT, MRI, X-Ray, and Ultrasound
One report indicated that after-hours and weekend appointments helped to accommodate individuals unable to take time off work and provided flexibility to patients with limited availability.22
Open-Access Scheduling
Walk-Ins and Same-Day Bookings — Reported for X-Ray
Keeping short appointment slots open for same-day scheduling and booking more involved appointments ahead of time decreased no-shows in 1 instance.31 Another report also encouraged medical professionals to reserve 50% of their time for same-day or next-day bookings.30
Engaging Practitioners
Returning Referrals to Ordering Providers — Reported for CT, MRI, X-Ray, and Ultrasound
Some responding sites indicated they would cancel a referral and send it back to an ordering provider after a certain number of no-shows for patient follow-up. Although this method does not appear in the literature explored as part of this report specifically, follow-up reminders by ordering providers was noted to incentivize patients to attend their appointments in 1 report.32
Reactive Strategies Unique to the Literature Findings
Reactive strategies reported by survey respondents focused primarily on engaging general practitioners and increasing appointment access. Other strategies, such as charging for missed appointments, have been described in the literature as potential approaches to limit future no-shows. Charging a “no-show fee” for missed medical imaging appointments was not reported as a reactive strategy employed at any of the medical imaging sites that responded to our survey. The following strategies are discussed in the literature but were not reported by survey respondents.
Charging for Missed Appointments
No-Show Fees
Charging people a fee for missed appointments is a reactive strategy discussed in some of the explored literature. While this approach has not been shown to improve attendance, it may contribute to inequities by disproportionately affecting patients from groups that are underserved.14 It was also noted that fees were less effective at reducing missed appointments than adding incentives for appointment attendance.14
Open-Access Scheduling
Wait-Lists
One source noted that adjusting appointment schedules to offer openings to patients on the waitlist, especially during extreme weather periods when no-shows and cancellations are more likely, can help reduce missed appointments.1 Maintaining a wait-list also allows urgent cases to be accommodated when appointment slots become available through the day.
Conversion to Telehealth
Offering virtual or telehealth options for patients with an elevated risk of no-shows has been reported to help increase appointment attendance.29 This strategy is not an option for in-person imaging exams but may be effective for consultations and follow-ups.
Patient Engagement Feedback
Because reactive strategies are not extensively applied in medical imaging departments across Canada (based on our survey results), this topic was not a major focus of our patient engagement sessions. Participants expressed a general reluctance toward punitive measures, such as a no-show fee, viewing them as unfair. Instead, they favoured approaches aimed at increasing accessibility, such as after-hours appointments.
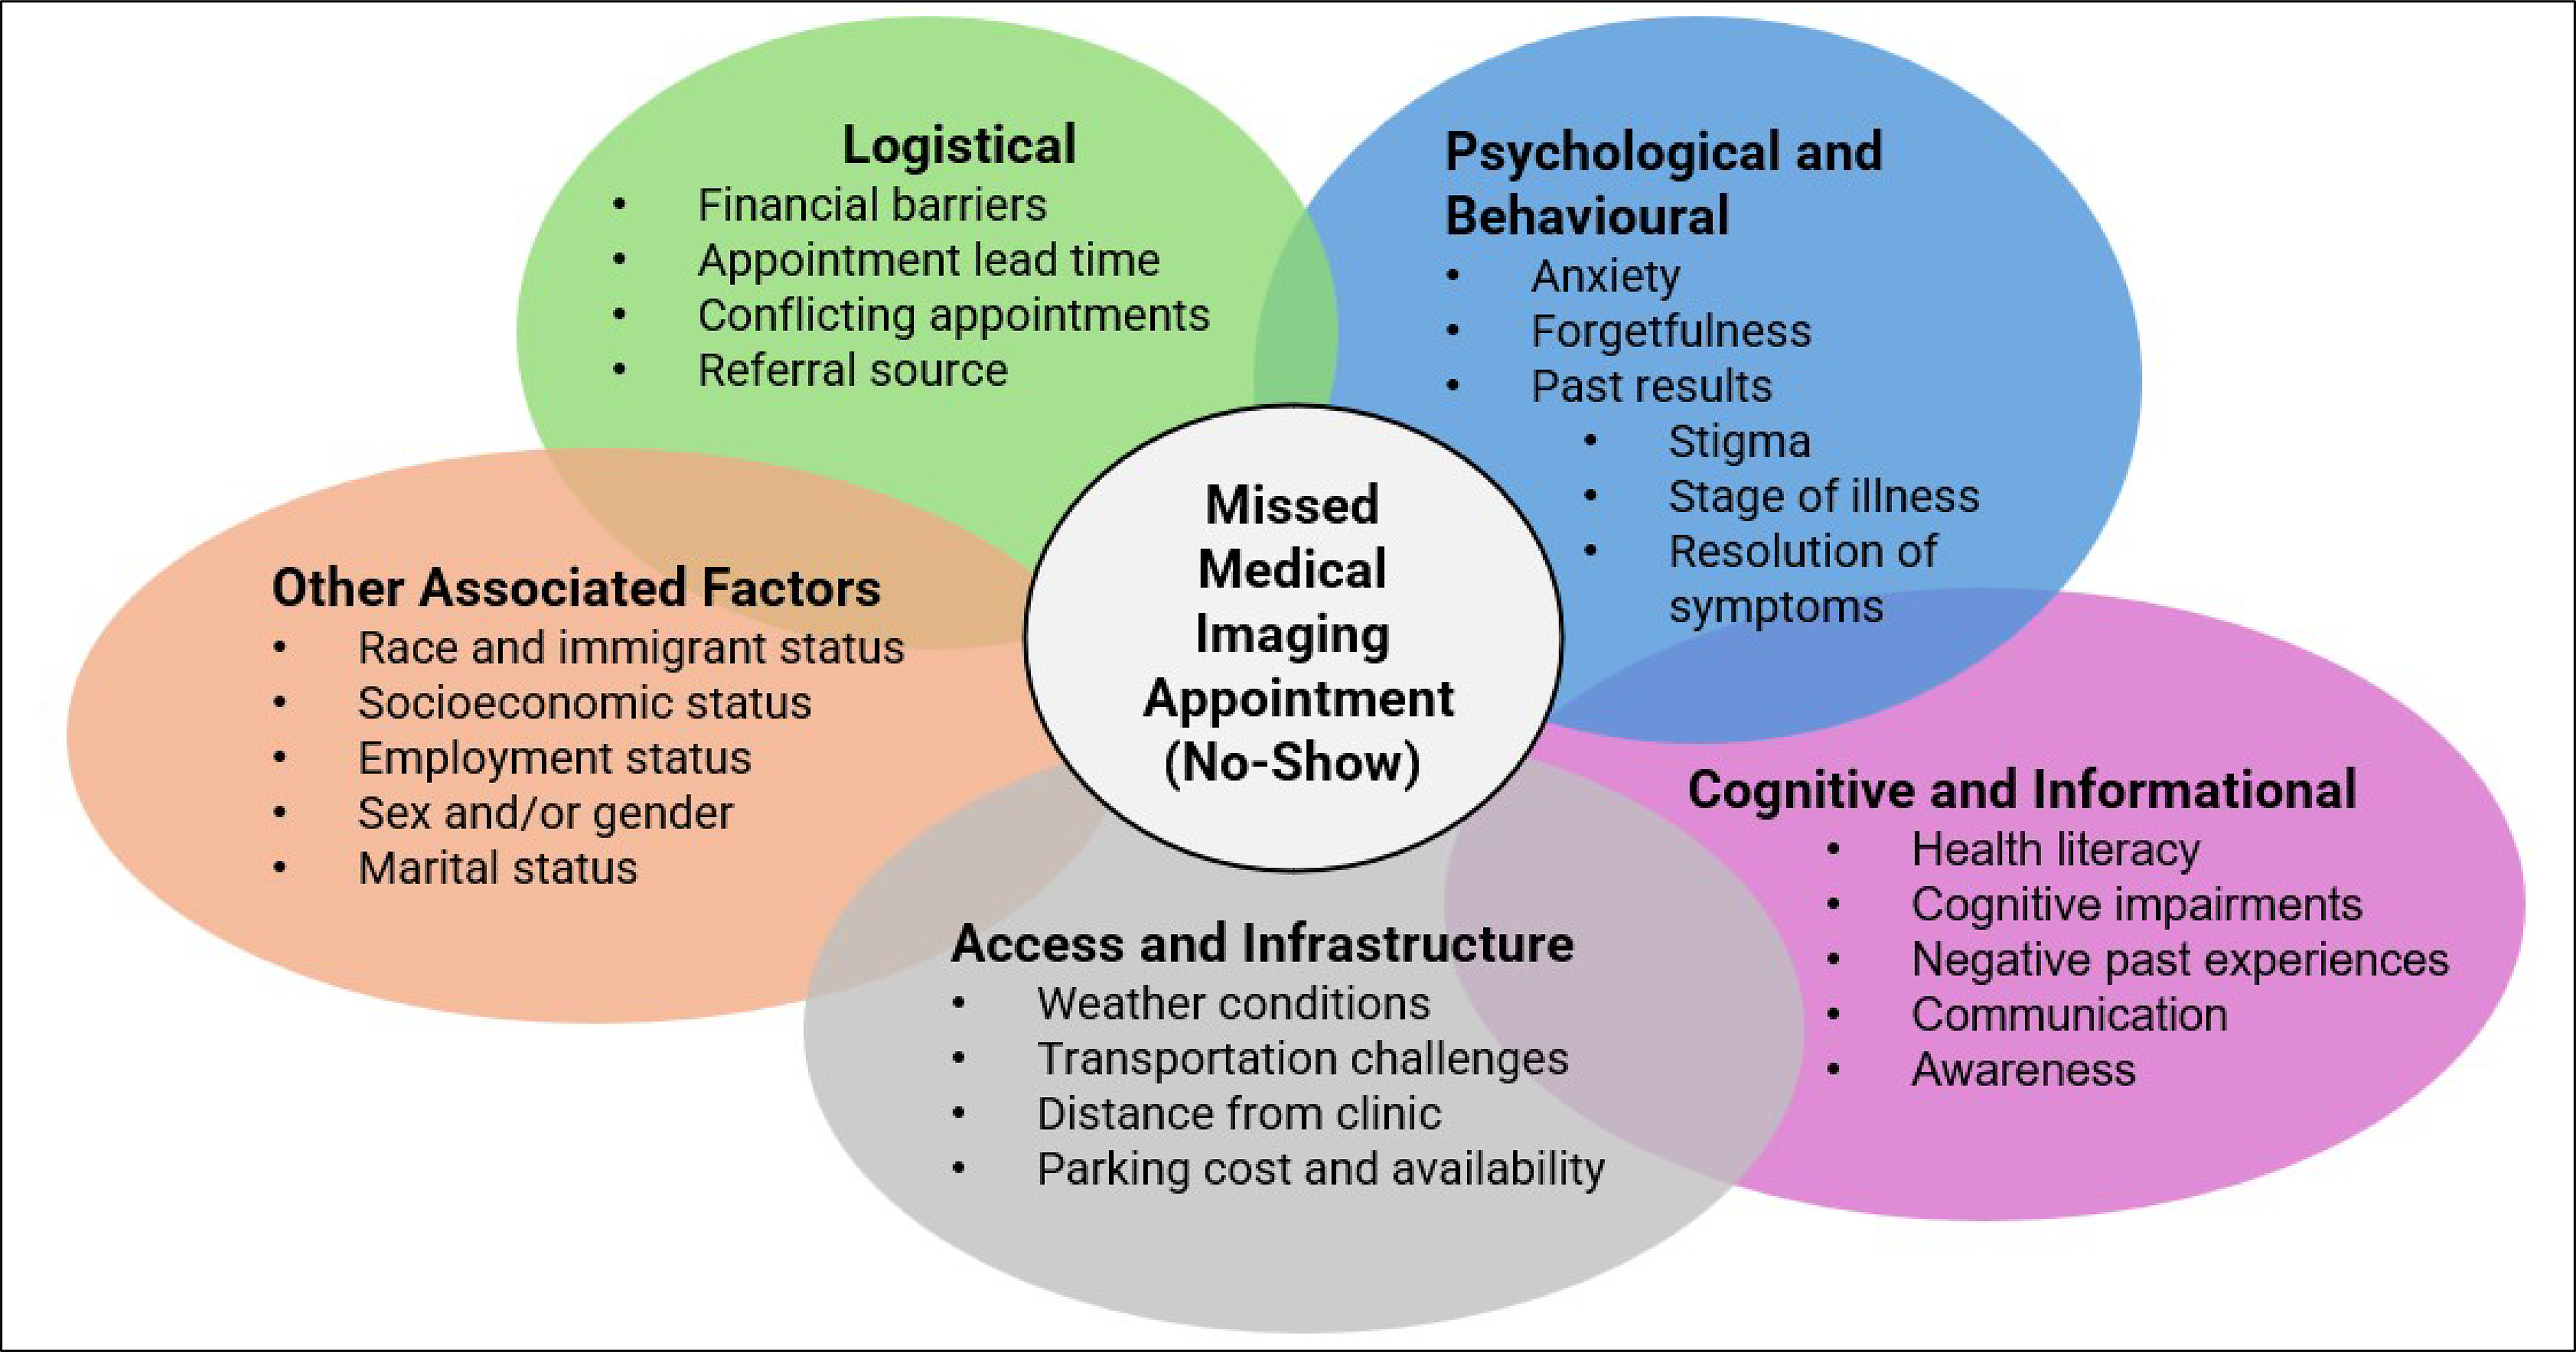
Factors Contributing to No-Shows in Medical Imaging
Factors the contribute to missed medical imaging exams can be separated into 5 categories (i.e., logistical challenges, access and infrastructure, psychological and behavioural, cognitive and informational, and other).
Factors in all 5 categories often overlap, creating complex, multilayered barriers that affect appointment attendance and require tailored interventions to address patient needs.
Transportation, parking, accommodation, and lost wages often compete with basic living expenses, indicating that the costs and logistics associated with medical imaging appointments can make attendance difficult.
Appointments scheduled more than 15 days in advance account for about one-third of no-shows; patients emphasized the need for multiple reminders close to the exam date as long lead times can contribute to patient forgetfulness.
“Scan-xiety” and emotional factors also impact attendance. Fear of diagnosis, repeated callbacks, and stigma lead to avoidance; patients suggested webinars and clear communication to reduce anxiety.
Systemic and social barriers, such as language, navigating the health system, and colonial structures that affect Indigenous and immigrant patients can affect appointment attendance; care navigators and culturally safe approaches were recommended to address these factors.
To develop effective strategies for reducing no-shows in medical imaging, it is essential to first understand why patients miss appointments. Both the literature and feedback from the patient engagement sessions highlight several key factors that contribute to missed imaging appointments (refer to Figure 15). Based on the literature findings and patient engagement sessions, these factors were broadly categorized into the following 5 categories:
logistical
access and infrastructure
psychological and behavioural
cognitive and informational
other associated factors (e.g., immigrant status, socioeconomic status, marital status).
The factors that contribute to no-shows in medical imaging were primarily identified through a noncomprehensive literature review and consultation with 18 patients and caregivers with extensive experience in medical imaging. These categories often overlap, creating a complex network of influences that impact a person’s ability or decision to attend a scheduled imaging exam.2,6 While socioeconomic and demographic factors do not directly cause missed appointments, they can influence a person’s access to and engagement with health care services. These determinants are often embedded within broader societal structures, making them critical to consider — though challenging to address in isolation.
The reasons that patients miss medical imaging exams was not a topic of the no-show survey sent to key medical imaging decision-makers, as there is no system in place for clinics to track and report on these factors. The following is a summary of what we heard during the patient engagement sessions, and how it relates to the findings from the literature.
Logistical
Financial Barriers
Appointments that involve out-of-pocket expenses — such as taking time off work, travel costs, requiring accommodation, or other incidentals — are more likely to be missed.13 Patients described that the practical burdens of attending imaging appointments can also lead to lost wages and compete with basic living expenses.
Appointment Lead Time
Increased time between when an appointment is scheduled and the actual date of an appointment (lead time) is positively correlated with increased no-shows.6,33,34 Appointments scheduled 15 or more days in advance account for approximately one-third of all no shows, while same-day appointments account for approximately 2% of no-shows.30 Patients in the engagement sessions agreed that long lead times were an issue, especially when reminders are not sent closer to the exam date after long waiting periods.
Conflicting Appointments
Overlapping or competing medical appointments can prevent patients from attending their scheduled imaging exams.28
Booking Method
Individuals who are actively engaged with booking systems to book appointments, such as portals or websites, are less likely to miss their appointments, and more likely to cancel or reschedule when needed.6
Multiple Requests or Duplicated Effort
According to 2 survey respondents and a senior decision-maker in Quebec, some no-shows may be due to patients completing a scan at a site other than the one that received the initial referral. The lack of centralized booking systems in some jurisdictions can lead to situations in which patients take referrals to multiple locations in hopes of receiving a shorter wait time. In some cases, patients also can receive a scheduled exam as part of an emergency department visit. Patients confirmed that these situations can inadvertently result in missed appointments as they are unaware of the duplicate request.
Referral Source
The source of referrals for medical imaging exams also impacts no-show rates. Referrals from medical and surgical sources have been associated with missed appointments.8,12 Referral source has also been used as a parameter in predictive modelling to determine the likelihood of a potential no-show and to inform targeted reminder systems.31 Survey respondents were asked about the differences in no-show rates between patients referred by a family doctor and those referred by a specialist for medical imaging exams based on their experience and observations (refer to Figure 30, Appendix 1, for a survey response breakdown):
Twenty-six respondents out of 85 (30%) reported there was no difference in no-shows based on the referring provider.
Twenty-one respondents out of 85 (25%) noted higher no-show rates when the referral source was a family doctor.
One respondent out of 85 (1%) reported a higher no-show rate when the referral source was a specialist.
Thirty-seven respondents out of 85 (44%) did not know if referring providers had an impact on no-show rates.
Access and Infrastructure Challenges
Weather Conditions
Extreme weather, including heat, cold, precipitation, and snowfall, have been correlated with increased no-show rates.1
Transportation
Lack of access to a personal vehicle or reliable public transportation is associated with higher no-show rates.1,33 According to 2 survey respondents, patients in rural communities have indicated they occasionally have issues with medical driver availability and transportation from northern communities.
Distance
The likelihood of missing an appointment increases with living a greater distance from the clinic; living more than 5 km away significantly reduces attendance rates.13 Patients from rural and remote areas often need air travel and overnight stays to facilitate medical imaging appointments, with accommodation costs quickly becoming prohibitive — especially when appointments are rescheduled.
Parking
Limited or unavailable parking is commonly reported as a reason for missed appointments.13,25,13 Patients confirmed that removing this barrier would promote appointment attendance.
Psychological and Behavioural
Anxiety
Fear of diagnosis and expectation of pain are psychological reasons a patient may not attend an imaging exam.35 Some patients may intentionally avoid receiving medical care as a psychological coping mechanism, especially when facing chronic or life-altering conditions.36 “Scan-xiety” (i.e., the fear of what the scan might reveal) was a recurring theme in the patient engagement discussions.
Forgetfulness
Simply forgetting an appointment is a common and often-cited reason for missed medical imaging appointments.5,6,27 Parents involved in the patient engagement sessions highlighted that childcare gaps and overlapping responsibilities can lead to missed appointments. Participants noted that multiple reminders sent in a manner that meets a patient’s preferences (i.e., timing, frequency, and format) would be helpful in addressing forgetfulness.
Stigma
Patients may resist seeking medical diagnoses or treatments due to fear or misconceptions associated with certain conditions.35 Several patients consulted for this report spoke about the stress of requesting time off work, noting stigma around leaving for medical appointments.
Past Results
Those with abnormal results or false positives in earlier screening visits are more likely to have lower rates of medical imaging reattendance.13,16,32 Some patients described avoidance after repeated callbacks or long waits, saying these experiences eroded trust and created emotional fatigue. Fear of relapse also led some people to report dismissing symptoms to avoid a scan.
Stage of Illness or Resolution of Symptoms
Chronic pain and mobility challenges can also make it difficult for some individuals to travel to or complete an imaging exam.8,30 Patients may be too unwell to attend their appointment, or their symptoms may have been resolved before the appointment date.
Cognitive and Informational
Health Literacy
Individuals may be unaware of the importance of attending appointments to receive a timely diagnosis, or they may underestimate the severity of their health condition.11,34 Patient engagement participants suggested webinars or information sessions with imaging professionals to demystify procedures and reduce anxiety. Patients emphasized the need for clear explanations of why imaging matters, not just how to prepare. They also noted that misinformation or disinformation from inaccurate internet sources can deter people from attending medical imaging appointments.
Cognitive Impairments
Individuals with dementia, Alzheimer disease, or other cognitive impairments may forget appointments or misunderstand their importance — particularly without caregiver support.33,37 Patients reiterated that for those with cognitive impairments, caregiver involvement and simple, visual instructions are critical.
Awareness and Responsibility
A lack of clear communication can lead to patients being unaware that they are expected to cancel or reschedule appointments they cannot attend. In some cases, patients may be unsure how to initiate the cancellation process.28 Many patients were also unaware that they were expected to cancel or reschedule appointments proactively and said they would respond better to messaging that frames cancellations as a benefit to others rather than a threat of fees.
Past Experiences
Positive interactions with primary care providers have been shown to influence a person’s future visit attendance.17 Patients with prior negative interactions within the health care system are more likely to miss a scheduled appointment.8
Other Associated Factors
Race and Immigrant Status
Racialized people and immigrants may have higher rates of no-shows compared to people who are not racialized or immigrants.29,33 For example, lower follow-up attendance has been observed among racialized and immigrant women compared to other women of the same age group who have been diagnosed with advanced breast cancer.20,38 Patients noted that the stigma associated with some conditions in certain communities can lead to isolation, and those who are unsure of how to navigate the health care systems in Canada may resist attending appointments.
Age
Older patients are reported to be less likely to miss appointments compared to younger individuals, who may face competing commitments such as work or school. However, older individuals living alone or without social or family support remain at increased risk of missing appointments.7,28,30
Socioeconomic Status
Individuals with lower income and limited insurance coverage are reported to be more likely to miss medical imaging appointments.1,39 Conversely, attendance at medical appointments improves as median household income increases.1,40
Sex
Overall, females are reported to have higher no-show rates across health care services. The likelihood of missing a medical imaging appointment is greater for males aged 18 to 30 who live in rural settings compared to older males living in urban settings.29,33
Employment Status
Individuals experiencing unemployment are reported to be at a higher risk of missing appointments.6
Marital Status
Individuals who are single have higher no-show rates than those who are married.33
Disease Outbreaks
Social context and public health measures can also influence no-shows and cancellations. For example, during the COVID-19 pandemic, imaging volumes across all modalities in North America dropped significantly between March and May 2020. Following the initial declaration of COVID-19 as a public health emergency, no-shows and same-day cancellations increased five-fold within 4 weeks.18
Limitations
The results in this report for national no-show rates, proactive strategies, and reactive strategies used at medical imaging sites across Canada were generated by an informal survey and may not be an accurate representation of rates and processes in all jurisdictions at all times. Provincial and territorial data are reported as a sample and are not meant to be representative of any jurisdiction. Similarly, some survey respondents were from health networks but were treated as single sites for the purpose of comparisons with the majority of the responding sites. Our survey also specifically focused on no-show rates for outpatients at public imaging sites and excluded other admission types and private clinics. Due to the sampling methods, it was not possible to estimate a response rate; therefore, the representativeness of the sample cannot be ascertained.
No-show rates vary by site and can be affected by numerous inter-related factors that cannot be covered fully due to the uniqueness of people’s individual circumstances. Because survey respondents may have been tracking no-show rates by informal observation rather than site-level data, changes in no-show rates reported after the implementation of a reactive or proactive strategy may have been influenced by 1 or more biases (e.g., selection bias, confirmation bias). Urban, rural, and remote status was also a self-reported variable for medical imaging sites and was not strictly defined based on geographical criteria.
The information presented on factors contributing to missed appointments and strategies to reduce no-shows was informed by both a literature review and patient engagement sessions. As such, the findings may reflect the perspectives of people who were more engaged in their own care or in caregiving roles, and who may be more attentive to strategies implemented at medical imaging clinics. The summary presented in this report may not fully represent the experiences of less-engaged or harder-to-reach populations. Additionally, the literature findings were limited to the sources identified during our search, which was not comprehensive and may not completely cover topics in this field. Some of the reasons for missed appointments and strategies to mitigate no-shows presented in this report originate from literature focused on other types of medical appointments and are not exclusive to medical imaging. The majority of the literature identified on this topic focused mostly on reminder methods and demographic trends in no-show rates, and not on proactive or reactive no-show reduction strategies. The literature sourced for this report is also not exclusive to Canada, and reported no-show rates or no-show reduction strategies may be unique to other countries based on infrastructure, size, cultural considerations, payment structures, and the health care systems. As such, conclusions should be interpreted with caution.
Our survey focused on CT, MRI, X-ray, and ultrasound, as these modalities account for most appointments in medical imaging. However, it is important to note that they do not fully represent the entire scope of services across medical imaging departments in Canada. For example, our survey did not include nuclear medicine appointments, as no-show rates are typically lower for modalities that conduct oncologic scans, such as PET and PET-CT.2 Several nuclear medicine experts reported that while no-shows for oncologic exams are quite rare, multiple calls and letters are typically sent to patients to minimize missed visits. According to the consulted experts, cardiac scans in nuclear medicine average a higher no-show rate than oncologic scans, and these appointments may be susceptible to issues with compliance with visit preparation instructions. We heard that it is also difficult to tailor reactive strategies, such as overbooking, to nuclear medicine appointments due to the nature of the preparation involved. Incomplete nuclear medicine exams due to no-shows or incorrect patient preparation result in the loss of the costly radiopharmaceuticals used for these tests, making no-shows for these modalities a topic that could also be explored in future work.
Implications for Decision-Making
No-shows are a preventable issue in the medical imaging field that may benefit from targeted strategies to mitigate the negative impact missed appointments can have on patients and the health care system. Expanding knowledge of the different factors that influence missed appointments can serve as a foundational step to better understand existing or emerging disparities and to inform strategies to advance health equity in medical imaging.
This report provides an opportunity to describe no-show rates at medical imaging sites in Canada, and to estimate the magnitude of the problem and its impact on the health care system. As imaging demand for all modalities is expected to rise with the aging population in Canada,41 implementing strategies to reduce missed exams may help reduce the associated costs and impacts of missed exams.
Overall, there is limited diversity in the strategies we identified in the literature to reduce no-shows, suggesting that the potential benefits of alternative or innovative approaches may be underexplored, or not reported in the published literature.14 Most published studies focused on the effectiveness of reminder systems, and while strategies such as ride share programs, care navigators, and information campaigns were identified through our survey and engagement sessions for their potential to reduce no-shows, their effectiveness remains largely unstudied or unpublished. Insights from patient engagement sessions also revealed that people may be unaware of the broader impact that missed appointments have on the health care system. Participants suggested that increased communication — such as posters in waiting areas — could help raise awareness and potentially influence attendance (refer to Figure 32, Figure 33, and Figure 34, Appendix 1).
Optimal no-show reduction strategies are those that are low cost to the health care system and bring value to patients.42 Test messages (i.e., SMS)5,16 and phone reminders14 are examples of effective and inexpensive methods that improve patient attendance rates. Strategies that attempt to remove barriers, such as patient-centric approaches and education, can also encourage patients to attend appointments. Transportation-assistance initiatives and including appointment information in reminders (such as preparation instructions) can also help to decrease attendance barriers.
Leveraging the information in this report also allows for a regional or modality-specific approach based on individual circumstances at different clinics. For example, we noted that proactive and reactive reduction measures were applied least frequently to X-ray appointments by responding sites in our survey sample, yet X-ray appointments had the lowest reported no-show rate among responding sites nationally. This suggests there may be other factors to consider when implementing no-show reduction strategies, and modality-specific and region-specific approaches may be needed. Multiple survey respondents noted that despite implementing proactive and reactive no-show reduction strategies, no-show rates have continued to increase in subsequent years; suggesting that different or targeted approaches may be needed.
Many responding sites reported that manual phone calls requiring patient confirmation were effective in reducing no-shows across all 4 imaging modalities examined in this report (i.e., CT, MRI, X-ray, and ultrasound). This method was reported to not only improve attendance rates but also to offer an opportunity to focus reminder efforts on a patient's likelihood of missing an appointment (determined by leveraging EMR information, such as appointment lead time, prior missed appointments, distance from clinic, exam type, age, sex, time of day, time of year, and interpreter status).26 Additionally, targeted reminders can ease administrative burden by giving patients a clear pathway to cancel or reschedule appointments. However, some responding sites noted that staff time is required to initiate these targeted calls, though some sites reported using volunteers to carry out this task.
Reactive strategies such as overbooking or charging for missed appointments have the potential to exacerbate existing disparities in access to health care, and it is important to acknowledge that factors that lead to no-shows are typically beyond a patient’s control. In Ontario, for example, clinics must consider a patient’s ability to pay before charging for a missed appointment, and physicians in Quebec must prove that downtime from missed appointments could not be filled with other professional activities before charging.30 The patient engagement discussions also showed a general reluctance to measures such as overbooking or no-show fees due to the potential to introduce harm to patients. Furthermore, studies have documented that punitive approaches may harm the patient-physician relationship.30
Predictive models are an emerging tool for reducing no-shows in medical imaging. Factors such as a patient’s history of missed appointments and the distance they live from the clinic can be predictors of future no-shows.8 When combined with variables like appointment lead time, visit type, and patient age, these models can leverage EMR data to proactively identify individuals who may benefit from additional outreach or targeted reminders before their appointments.2 These models would benefit from tailoring for specific clinics and imaging modalities, as patient demographics and individual factors can vary across different settings.
Implementing patient-centred no-show reduction strategies may help optimize health care resource use while improving equitable access to medical imaging. The survey respondents expressed a strong interest in the strategies discussed in this report, noting their potential to benefit both patients and clinical operations. Several respondents highlighted the lack of a current technology to support automated email and text message (SMS) reminders but indicated that such systems are of high interest to both patients and staff. Automated reminders were viewed as a valuable tool to reduce the administrative burden on clinic staff. Additionally, multiple responding sites reported they are actively working to collect patient contact information and explore reminder platforms, underscoring the growing momentum behind no-show reduction.
Conclusion
Missed medical imaging appointments are more than just scheduling inefficiencies — they represent lost opportunities for timely diagnosis, treatment, and patient care. The consequences of no-shows extend beyond the individual, and have downstream effects on other patients, clinical workflows, and the broader health system. While reasons for nonattendance are well established and multifactorial — ranging from logistical and social barriers to psychological and environmental factors — strategies to reduce no-shows are less consistently documented and understood in practice.
This report brings together data from a national survey and findings from the literature to provide an overview of no-show patterns and mitigation efforts across Canada. While the survey responses reflect the best available insights from participating sites, they are based on estimates from a sample that may not be representative. As such, the results may not capture the full scope or variability of no-show rates across all regions and/or modalities.
Our findings suggest that most responding imaging departments employ proactive strategies, such as automated reminders and centralized rescheduling avenues, to reduce no-shows. Based on the opinion of those from responding sites, proactive strategies were more commonly associated with reductions in no-show rates than reactive strategies, highlighting the value of early patient-centred interventions. Regional and modality-specific differences were also observed, as well as the influence of factors such as lead time, referral source, and a patient’s access to technology.
By synthesizing current practices and the literature findings, this report supports the development of informed, practical strategies to reduce no-shows in medical imaging and improve access for all impacted.
References
1.Mieloszyk RJ, Rosenbaum JI, Hall CS, Hippe DS, Gunn ML, Bhargava P. Environmental Factors Predictive of No-Show Visits in Radiology: Observations of Three Million Outpatient Imaging Visits Over 16 Years. J Am Coll Radiol. 2019;16(4 Pt B):554-559. doi: 10.1016/j.jacr.2018.12.046 PubMed
2.Harvey HB, Liu C, Ai J, et al. Predicting No-Shows in Radiology Using Regression Modeling of Data Available in the Electronic Medical Record. J Am Coll Radiol. 2017;14(10):1303-1309. doi: 10.1016/j.jacr.2017.05.007 PubMed
3.America RSoN. Body CT, MRI, X-ray, and ultrasound. RadiologyInfo. 2024. Accessed July 15, 2025. https://www.radiologyinfo.org/en/info/bodyct
4.Elridge L. What is Radiology? Understanding diagnostic, interventional, and therapeutic radiology. Very Well Health. 2024. Accessed July 15, 2025. https://www.verywellhealth.com/what-is-radiology-5085100
5.Alturbag M. Effectiveness of Personalised Phone Calls and Short Message Service Reminders in Improving Patient Attendance at a Radiology Department. Cureus. 2024;16(9):e69568. doi: 10.7759/cureus.69568 PubMed
6.Mohammadi I, Wu H, Turkcan A, Toscos T, Doebbeling BN. Data Analytics and Modeling for Appointment No-show in Community Health Centers. J Prim Care Community Health. 2018;9. doi: doi: 10.1177/2150132718811692 PubMed
7.Rosenbaum JI, Mieloszyk RJ, Hall CS, Hippe DS, Gunn ML, Bhargava P. Understanding Why Patients No-Show: Observations of 2.9 Million Outpatient Imaging Visits Over 16 Years. J Am Coll Radiol. 2018;15(7):944-950. doi: 10.1016/j.jacr.2018.03.053 PubMed
8.Marbouh D, Khaleel I, Al Shanqiti K, et al. Evaluating the Impact of Patient No-Shows on Service Quality. Risk Manag Healthc Policy. 2020;13:509-517. doi: 10.2147/RMHP.S232114 PubMed
9.Hensing WL, Poplack SP, Herman CR, Sutcliffe S, Colditz GA, Ademuyiwa FO. Racial differences in no-show rates for screening mammography. Cancer. 2021;11(127):1857-63. doi: doi: 10.1002/cncr.33435 PubMed
10.Ramakrishnan MS, Yu Y, VanderBeek BL. Visit adherence and visual acuity outcomes in patients with diabetic macular edema: a secondary analysis of DRCRnet Protocol T. Graefes Arch Clin Exp Ophthalmol. 2021;259(6):1419-1425. doi: 10.1007/s00417-020-04944-w. PubMed
11.Dantas LF, Fleck JL, Cyrino Oliveira FL, Hamacher S. No-shows in appointment scheduling – a systematic literature review. Health Policy. 2018;122(4):412-21. doi: 10.1016/j.healthpol.2018.02.002 PubMed
12.Mander GTW, Reynolds L, Cook A, Kwan MM. Factors associated with appointment non-attendance at a medical imaging department in regional Australia: a retrospective cohort analysis. J Med Radiat Sci. 2018;65(3):192-199. doi: 10.1002/jmrs.284 PubMed
13.Zidar MN, Larm P, Tillgren P, Akhavan S. Non-attendance of mammographic screening: the roles of age and municipality in a population-based Swedish sample. Int J Equity Health. 2015;14:157. doi: 10.1186/s12939-015-0291-7 PubMed
14.Werner K, Alsuhaibani SA, Alsukait RF, et al. Behavioural economic interventions to reduce health care appointment non-attendance: a systematic review and meta-analysis. BMC Health Serv Res. 2023;23(1):1136. doi: 10.1186/s12913-023-10059-9 PubMed
15.Aljuaid MA, Li J, Lin C, et al. Does the Combination of Phone, Email and Text-Based Reminders Improve No-show Rates for Patients in Breast Imaging? Curr Probl Diagn Radiol. 2023;52(2):125-129. doi: 10.1067/j.cpradiol.2022.09.003 PubMed
16.Roman R, Sala M, De La Vega M, et al. Effect of false-positives and women's characteristics on long-term adherence to breast cancer screening. Breast Cancer Res Treat. 2011;130(2):543-52. doi: 10.1007/s10549-011-1581-4 PubMed
17.Aysola J, Xu C, Huo H, Werner RM. The Relationships Between Patient Experience and Quality and Utilization of Primary Care Services. J Patient Exp. 2020;7(6):1678-1684. doi: 10.1177/2374373520924190 PubMed
18.Doshi AH, Kihira S, Mahmoudi K, et al. Impact of COVID-19 social distancing regulations on outpatient diagnostic imaging volumes and no-show rates. Clin Imaging. 2021;76:65-69. doi: 10.1016/j.clinimag.2021.01.025 PubMed
19.Laroche J. New toll-free line aims to reduce medical appointment no-shows. 2023. Accessed March 15, 2025. https://www.cbc.ca/lite/story/1.6970301
20.Bhargava S, Moen K, Qureshi SA, Hofvind S. Mammographic screening attendance among immigrant and minority women: a systematic review and meta-analysis. Acta Radiol. 2018;59(11):1285-1291. doi: 10.1177/0284185118758132 PubMed
21.North F, Nelson EM, Buss RJ, Majerus RJ, Thompson MC, Crum BA. The Effect of Automated Mammogram Orders Paired With Electronic Invitations to Self-schedule on Mammogram Scheduling Outcomes: Observational Cohort Comparison. JMIR Med Inform. 2021;9(12):e27072. doi: 10.2196/27072 PubMed
22.Hasvold PE, Wootton R. Use of telephone and SMS reminders to improve attendance at hospital appointments: a systematic review. J Telemed Telecare. 2011;17(7):358-64. doi: 10.1258/jtt.2011.110707 PubMed
23.McLean SM, Booth A, Gee M, et al. Appointment reminder systems are effective but not optimal: results of a systematic review and evidence synthesis employing realist principles. Patient Prefer Adherence. 2016;10:479-99. doi: 10.2147/PPA.S93046 PubMed
24.Whorms DS, Narayan AK, Pourvaziri A, et al. Analysis of the Effects of a Patient-Centered Rideshare Program on Missed Appointments and Timeliness for MRI Appointments at an Academic Medical Center. J Am Coll Radiol. 2021;18(2):240-247. doi: 10.1016/j.jacr.2020.05.037 PubMed
25.Cuyegkeng A, Hao Z, Rashidi A, Bansal R, Dhillon J, Sadigh G. Prevalence of financial hardship and health-related social needs among patients with missed radiology appointments. Clin Imaging. 2024;113:110232. doi: 10.1016/j.clinimag.2024.110232 PubMed
26.Rothenberg S, Bame B, Herskovitz E. Prospective Evaluation of a Machine-Learning Prediction Model for Missed Radiology Appointments. J Digit Imaging. 2022;35(6):1690-1693. doi: 10.1007/s10278-022-00670-3 PubMed
27.McLean S, Gee M, Booth A, et al. Targeting the Use of Reminders and Notifications for Uptake by Populations (TURNUP): a systematic review and evidence synthesis. Health Services and Delivery Research. 2014;2(34). doi: 10.3310/hsdr02340 PubMed
28.Savience. Tackling Medical Appointment No Shows With Savience. 2021. Accessed March 15, 2025. https://savience.com/2023/01/06/medical-appointment-no-shows/
29.Tarabichi Y, Higginbotham J, Riley N, Kaelber DC, Watts B. Reducing Disparities in No Show Rates Using Predictive Model-Driven Live Appointment Reminders for At-Risk Patients: a Randomized Controlled Quality Improvement Initiative. J Gen Intern Med. 2023;38(13):2921-27. doi: 10.1007/s11606-023-08209-0 PubMed
30.Glauser W. How can doctors reduce no-shows? CMAJ. 2020;192(6):151-2. doi: 10.1503/cmaj.1095842 PubMed
31.Ansell D, Crispo JAG, Simard B, Bjerre LM. Interventions to reduce wait times for primary care appointments: a systematic review. BMC Health Serv Res. 2017;17(1):295. doi: 10.1186/s12913-017-2219-y PubMed
32.Gurol-Urganci I, de Jongh T, Vodopivec-Jamsek V, Atun R, Car J. Mobile phone messaging reminders for attendance at healthcare appointments. Cochrane Database Syst Rev. 2013;2013(12):CD007458. doi: 10.1002/14651858.CD007458.pub3 PubMed
33.Aijaz A, Hao Z, Tran TG, Anderson D, Shah J, Sadigh G. Sociodemographic Factors Associated with Outpatient Radiology No-shows Versus Cancellations. Acad Radiol. 2024;31(8):3406-14. doi: 10.1016/j.acra.2024.04.020 External Link. PubMed
34.Zackrisson S, Andersson I, Manjer J, Janzon L. Non-attendance in breast cancer screening is associated with unfavourable socio-economic circumstances and advanced carcinoma. Int J Cancer. 2004;108(5):754-60. doi: 10.1002/ijc.11622 PubMed
35.Aro AR, de Koning HJ, Absetz P, Schreck M. Psychosocial predictors of first attendance for organised mammography screening. J Med Screen. 1999;6(2):82-8. doi: 10.1136/jms.6.2.82 PubMed
36.Crump SR, Mayberry RM, Taylor BD, Barefield KP, Thomas PE. Factors related to noncompliance with screening mammogram appointments among low-income African-American women. J Natl Med Assoc. 2000 92(5):237-46. PubMed
37.Bulliard JL, de Landtsheer JP, Levi F. Profile of women not attending in the Swiss Mammography Screening Pilot Programme. Breast. 2004;13(4):284-9. doi: 10.1016/j.breast.2004.03.001 PubMed
38.Bhargava S, Tsuruda K, Moen K, Bukholm I, Hofvind S. Lower attendance rates in immigrant versus non-immigrant women in the Norwegian Breast Cancer Screening Programme. J Med Screen. 2018;25(3):155-161. doi: 10.1177/0969141317733771 PubMed
39.Ooi JWL, Leong GKW, Oh HC. The impact of common variables on non-attendance at a radiology centre in Singapore. Radiography (Lond). 2021;27(3):854-860. doi: 10.1016/j.radi.2021.01.007 PubMed
40.Flores EJ, Daye D, Pena MA, Lopez DB, Jaimes C, Glover Mt. Analysis of socioeconomic and demographic factors and imaging exam characteristics associated with missed appointments in pediatric radiology. Pediatr Radiol. 2021;51(11):2083-2092. doi: 10.1007/s00247-021-05111-x PubMed
41.Smith-Bindman R KM, Marlow EC, et al. Trends in Use of Medical Imaging in US Health Care Systems and in Ontario, Canada, 2000-2016. JAMA. 2019;9:843-856. doi: 10.1001/jama.2019.11456 PubMed
42.Aguirre AO, Lim J, Kuo CC, et al. Social Determinants of Health and Associations With Outcomes in Pediatric Patients With Brain Tumors. Neurosurgery. 2024;94(1):108-116. doi: 10.1227/neu.0000000000002624 PubMed
Appendix 1: Supplemental Survey Response Data
Please note that this appendix has not been copy-edited.
Table 2: Survey Respondent Breakdown
Province | Respondents | Urban | Rural | Remote | CT | MRI | X-Ray | US |
|---|---|---|---|---|---|---|---|---|
Newfoundland and Labrador | 5 | 1 | 4 | 0 | 5 | 2 | 2 | 5 |
Prince Edward Island | 1 | 0 | 1 | 0 | 1 | 1 | 1 | 1 |
Nova Scotia | 7 | 2 | 5 | 0 | 4 | 3 | 6 | 5 |
New Brunswick | 6 | 4 | 2 | 0 | 5 | 5 | 5 | 5 |
Quebec | 11 | 8 | 1 | 2 | 11 | 8 | 5 | 10 |
Ontario | 26 | 13 | 13 | 0 | 26 | 22 | 18 | 26 |
Manitoba | 2 | 1 | 1 | 0 | 2 | 1 | 2 | 2 |
Saskatchewan | 1 | 1 | 0 | 0 | 1 | 1 | 0 | 0 |
Alberta | 5 | 3 | 2 | 0 | 4 | 1 | 2 | 3 |
British Columbia | 17 | 10 | 7 | 0 | 13 | 9 | 12 | 15 |
Territories | 4 | 0 | 2 | 2 | 3 | 1 | 0 | 4 |
Total | 85 | 43 | 38 | 4 | 75 | 54 | 53 | 76 |
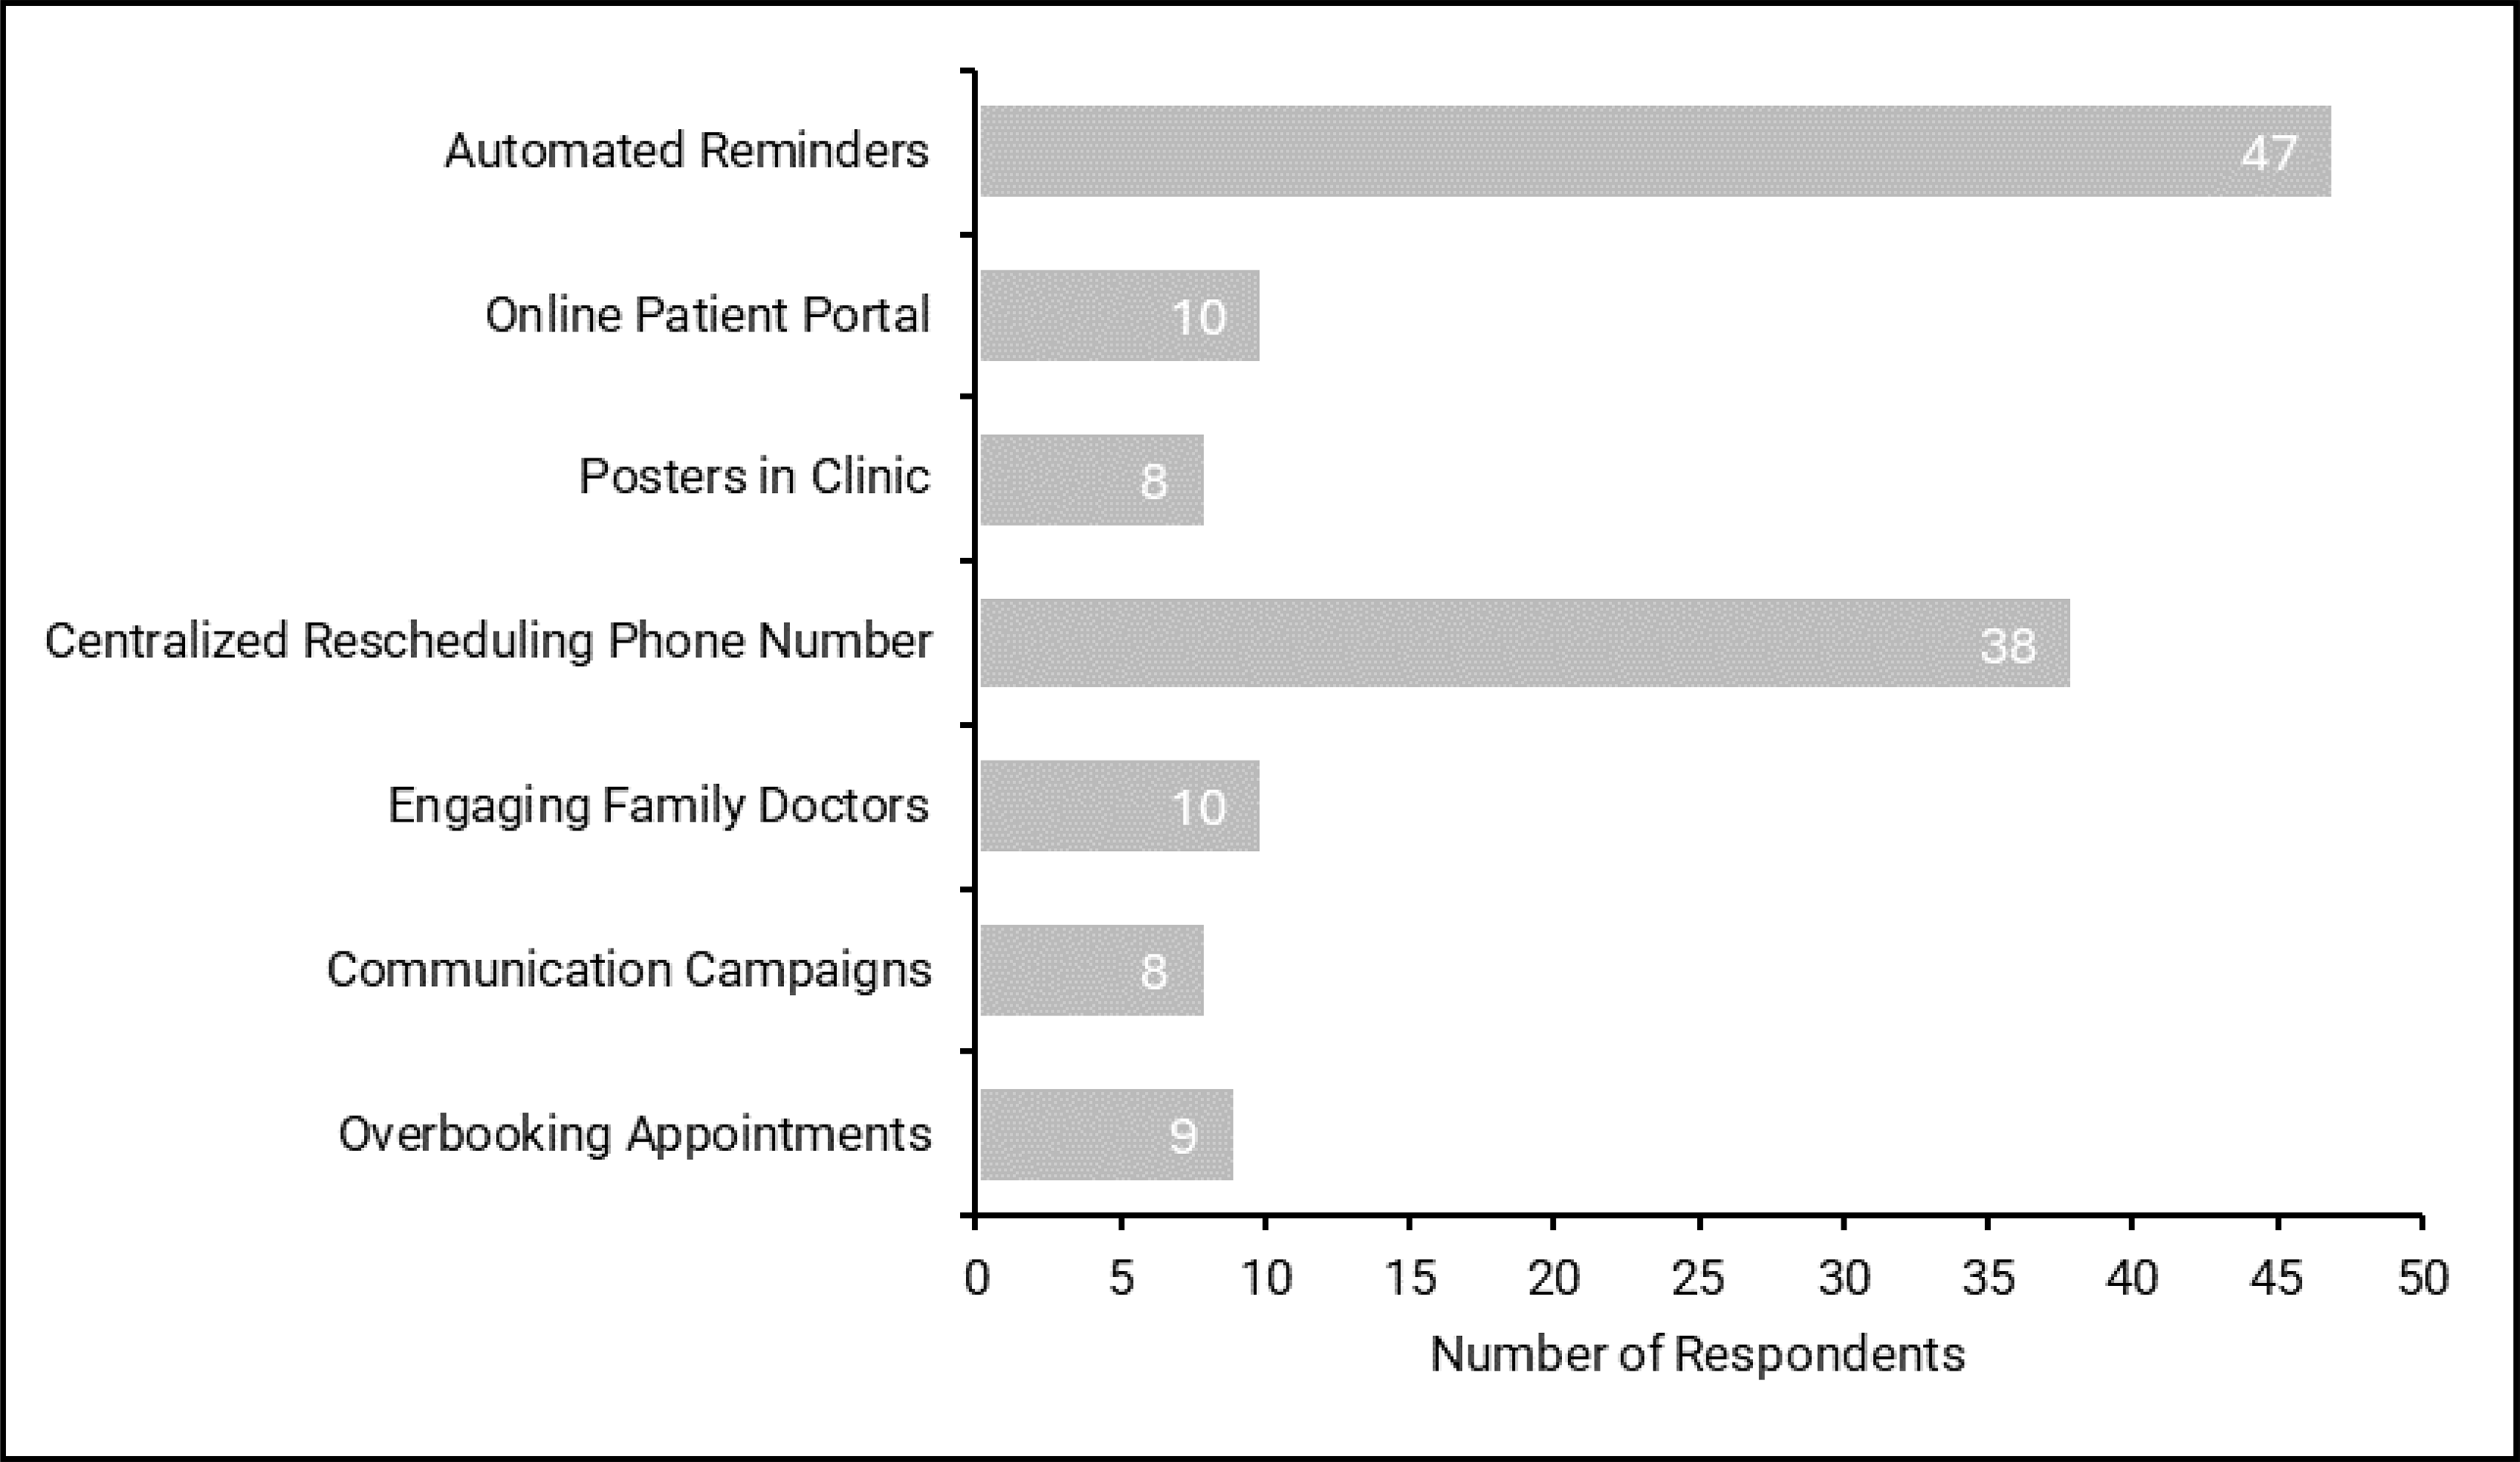
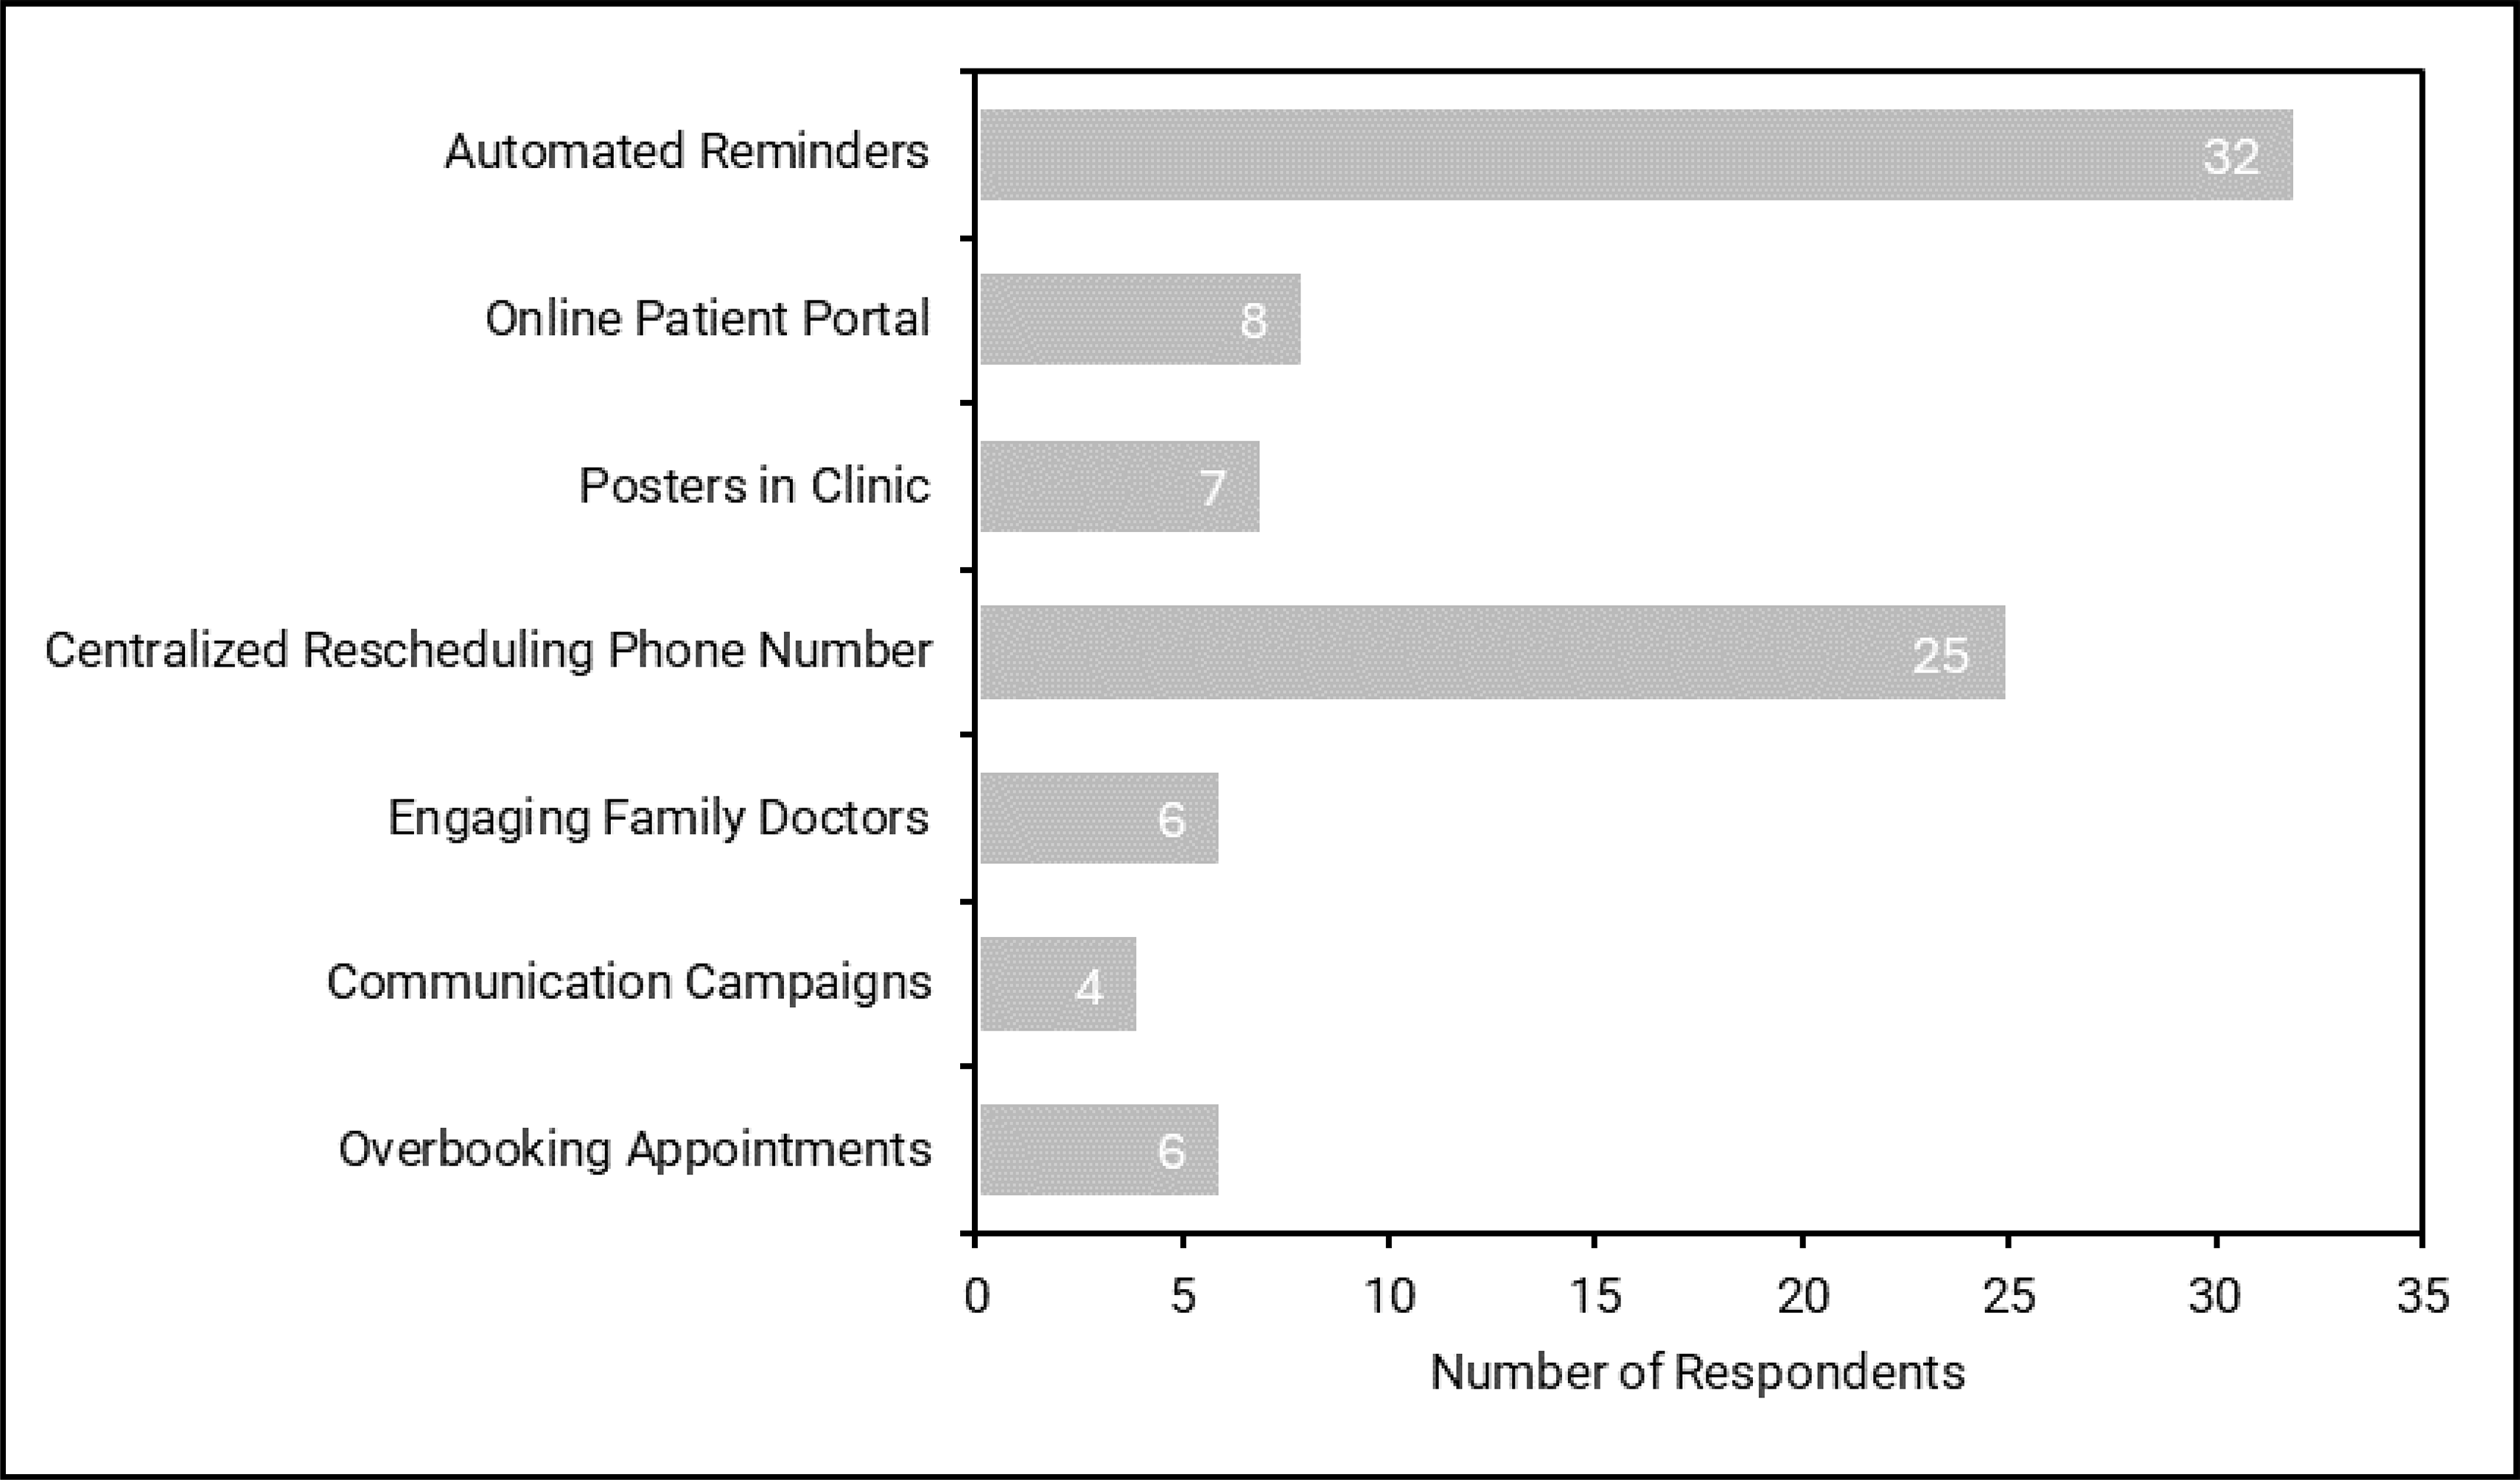
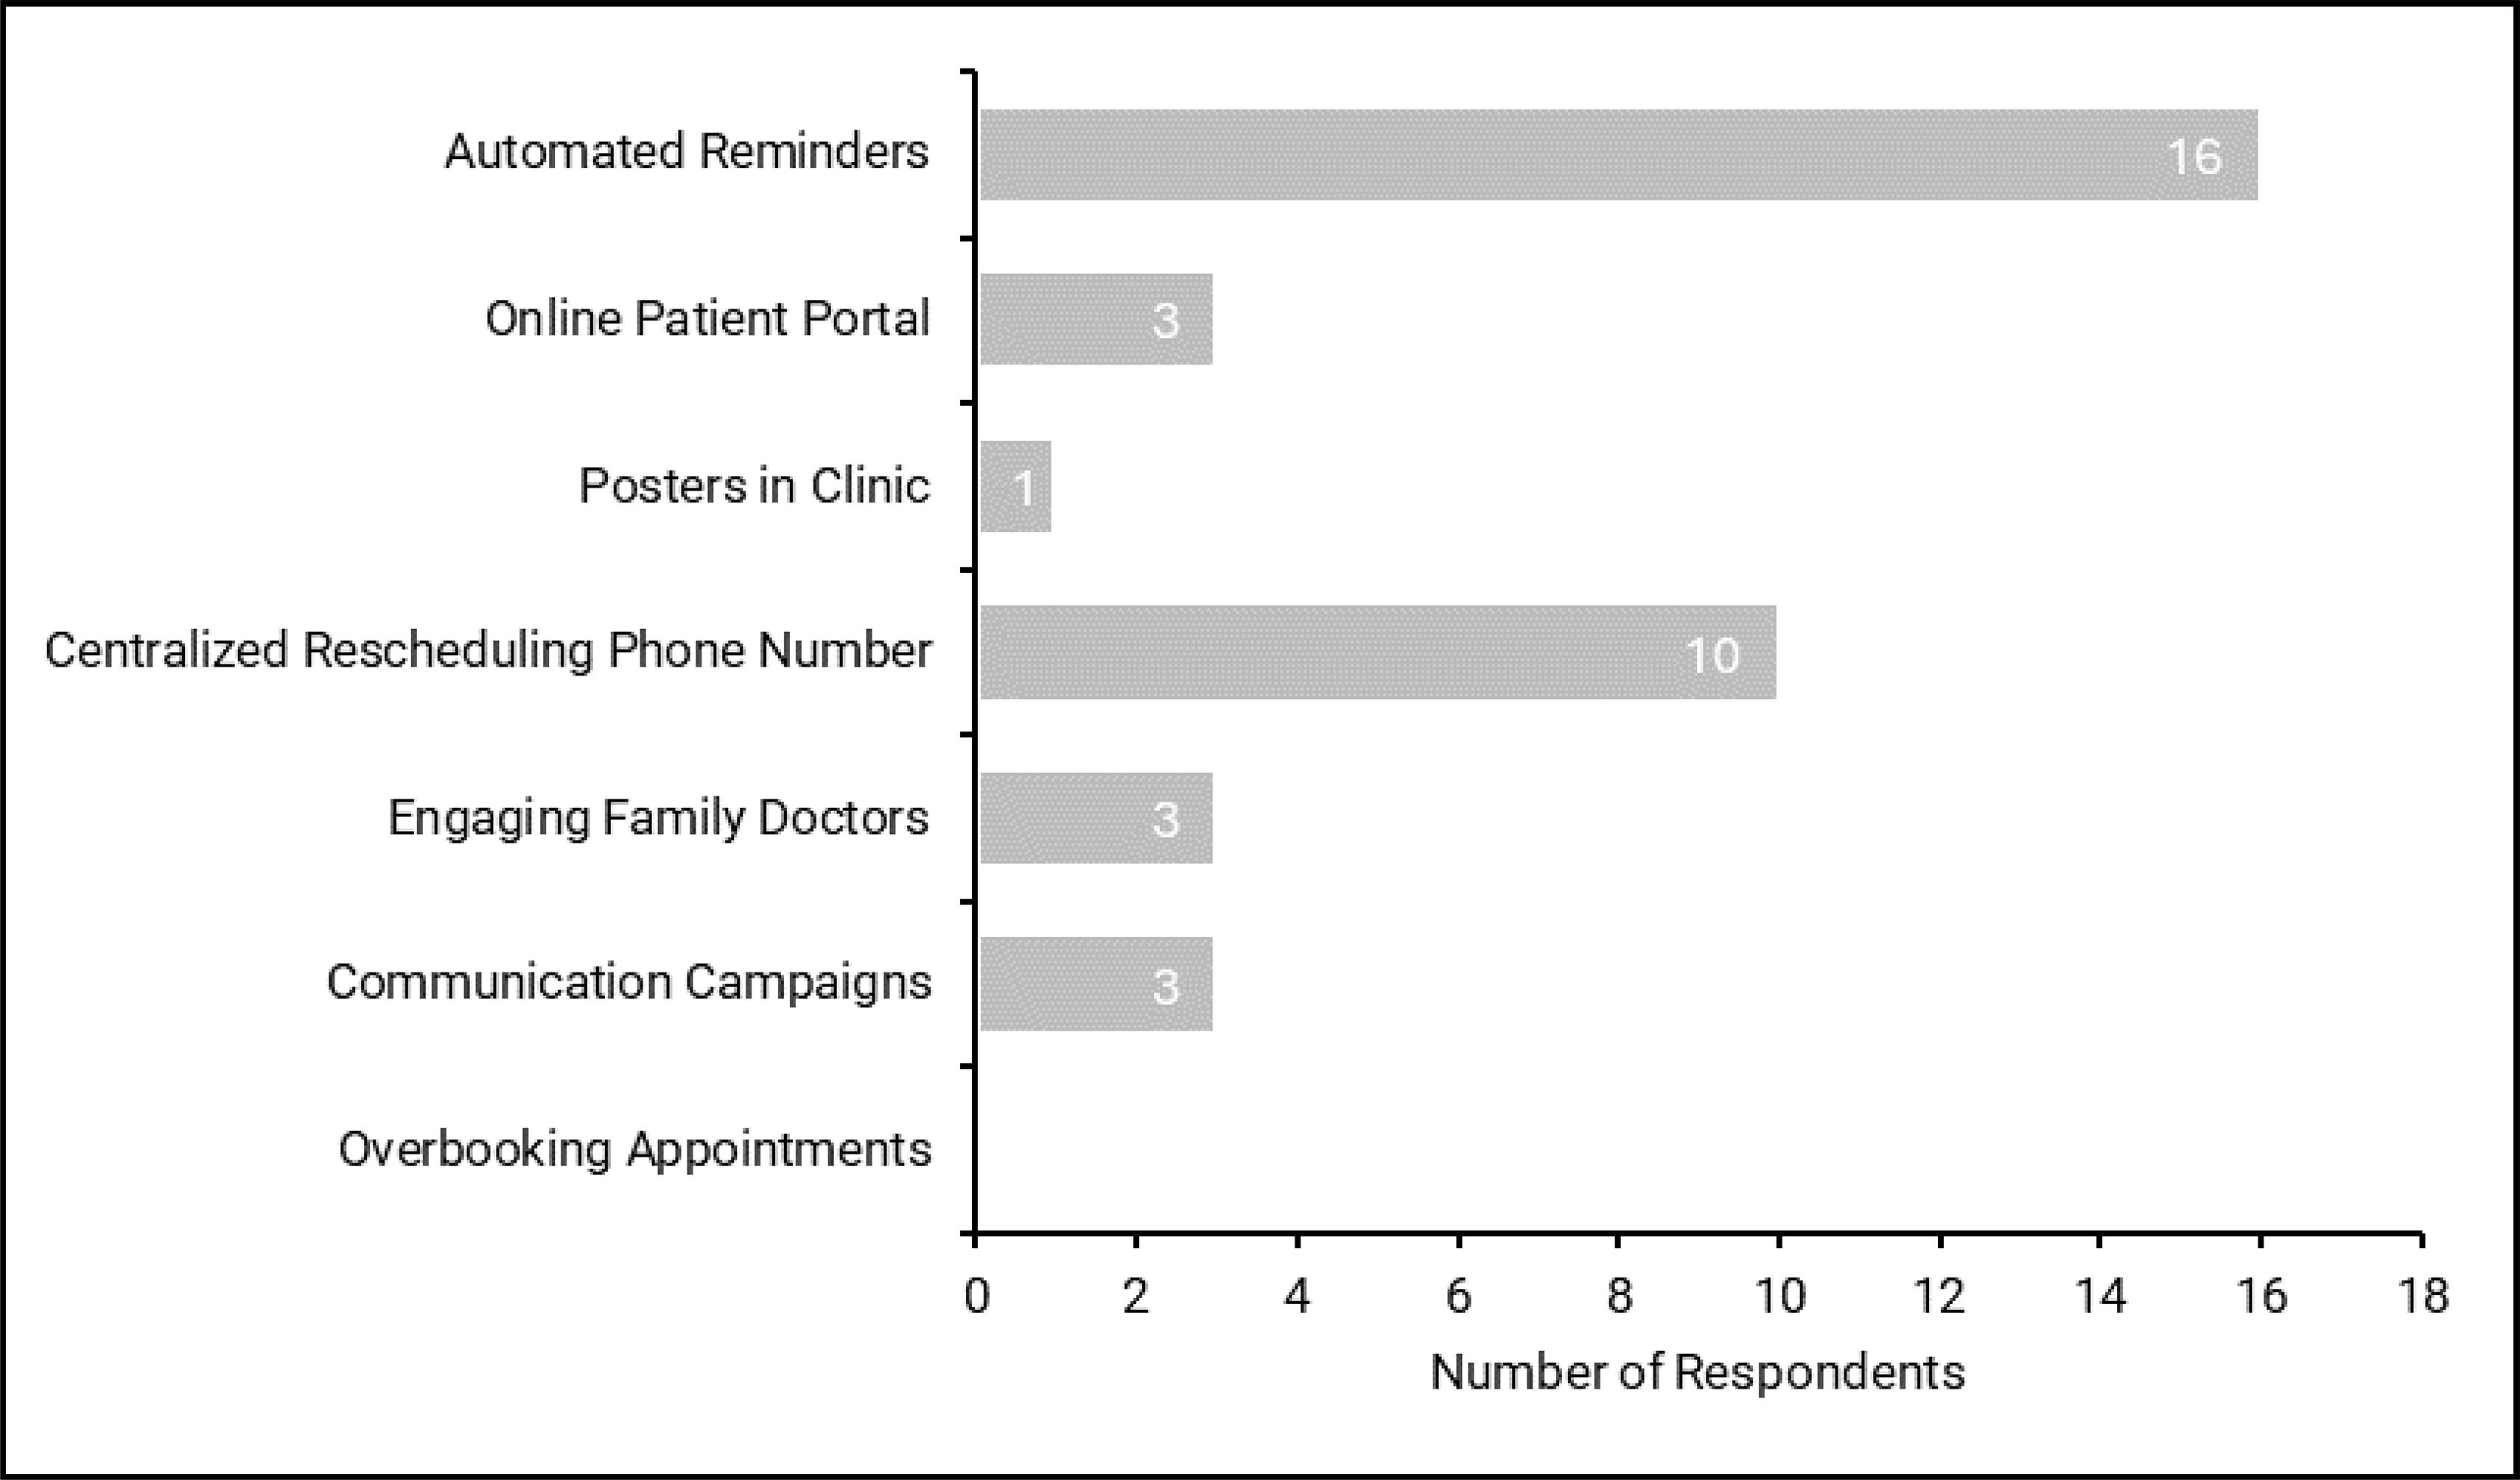
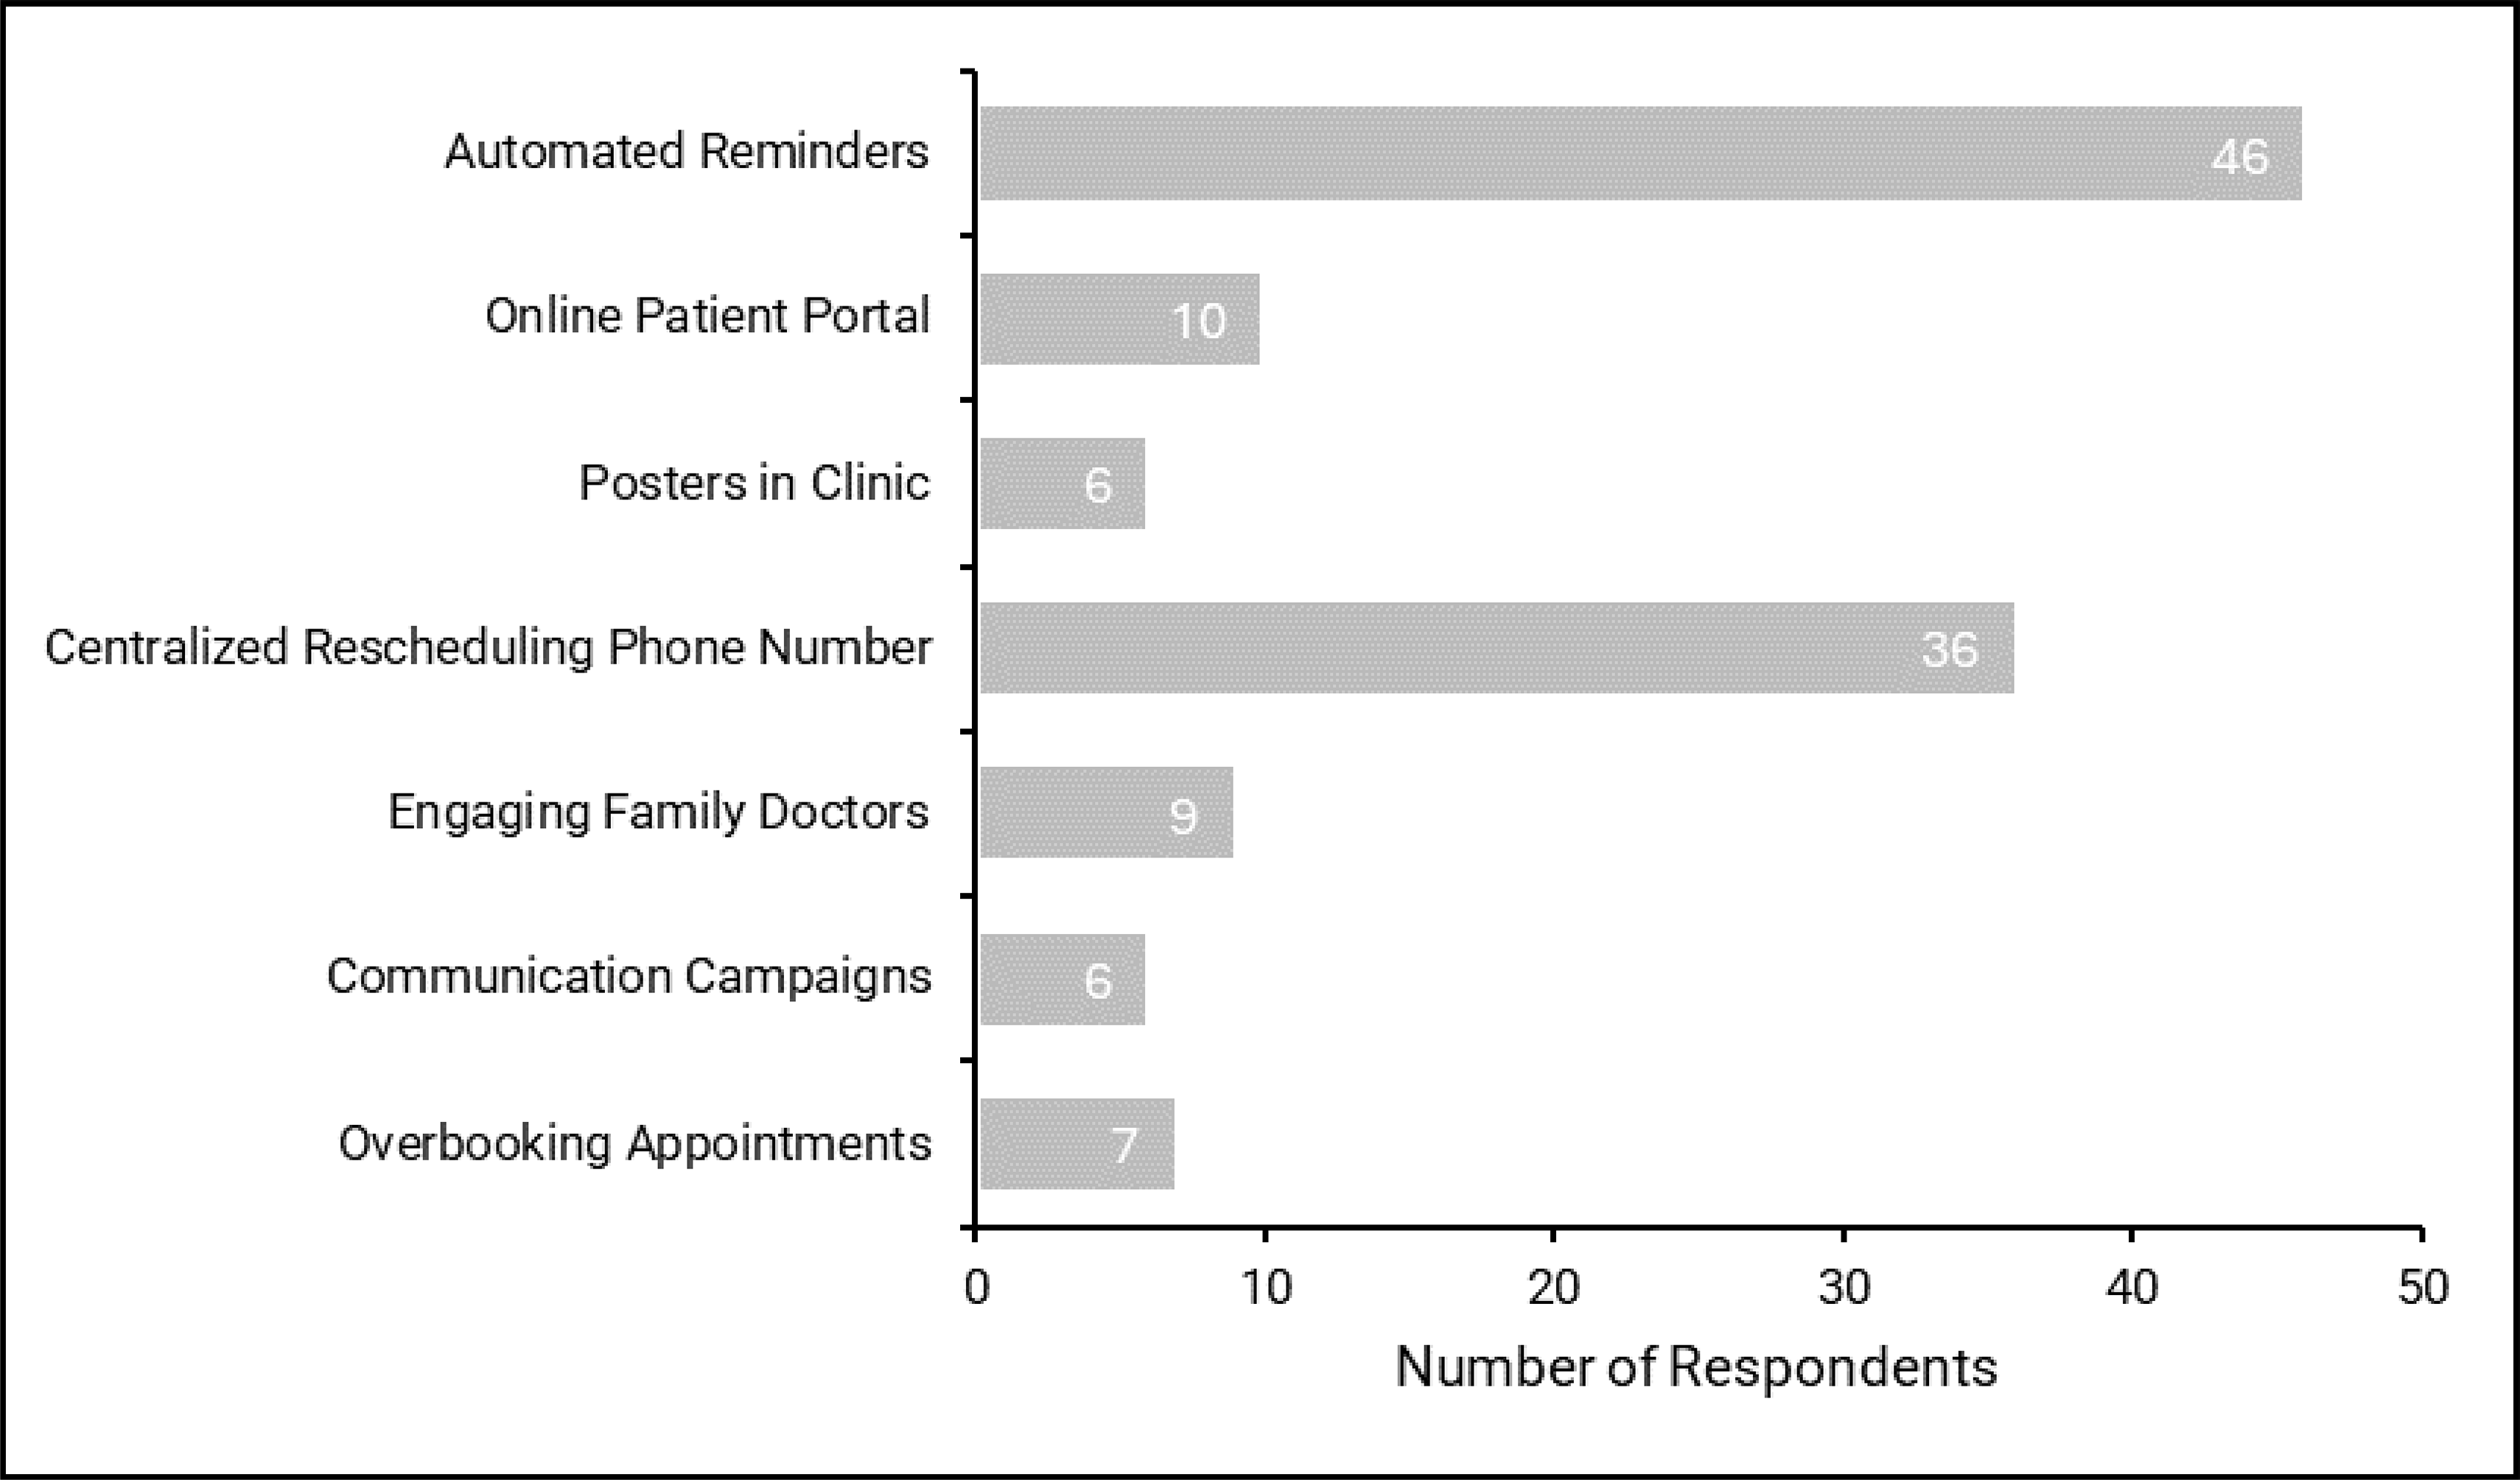
![Bar plot representing the proportion of responding sites that send reminders by phone in the following lead times for CT, MRI, X-ray, and ultrasound appointments: CT [1 day (21%), 2 to 3 days (42%), 4 to 7 days (27%), over 1 week (10%)], MRI [1 day (15%), 2 to 3 days (43%), 4 to 7 days (30%), over 1 week (12%)], X-ray [1 day (30%), 2 to 3 days (50%), 4 to 7 days (20%), over 1 week (0%)], and ultrasound [1 day (20%), 2 to 3 days (45%), 4 to 7 days (27%), over 1 week (8%)].](https://canjhealthtechnol.ca/index.php/cjht/article/download/CM0034/version/1381/3181/12256/CM0034-fig20.png)
![Bar plot representing the proportion of responding sites that send reminders by phone with the following frequencies for CT, MRI, X-ray, and ultrasound appointments: CT [once (74%), twice (18%), three times (8%)], MRI [once (72%), twice (21%), three times (7%)], X-ray [once (80%), twice (10%), three times (10%)], and ultrasound [once (76%), twice (20%), three times (4%)],](https://canjhealthtechnol.ca/index.php/cjht/article/download/CM0034/version/1381/3181/12257/CM0034-fig21.png)
![Bar plot representing the proportion of responding sites that send reminders by text in the following lead times for CT, MRI, X-ray, and ultrasound appointments: CT [1 day (17%), 2 to 3 days (50%), 4 to 7 days (28%), over 1 week (5%)], MRI [1 day (23%), 2 to 3 days (46%), 4 to 7 days (23%), over 1 week (8%)], X-ray [1 day (22%), 2 to 3 days (56%), 4 to 7 days (11%), over 1 week (11%)], and ultrasound [1 day (16%), 2 to 3 days (53%), 4 to 7 days (26%), over 1 week (85%)].](https://canjhealthtechnol.ca/index.php/cjht/article/download/CM0034/version/1381/3181/12258/CM0034-fig22.png)
![Bar plot representing the proportion of responding sites that send reminders by text with the following frequencies for CT, MRI, X-ray, and ultrasound appointments: CT [once (74%), twice (21%), three times (5%)], MRI [once (71%), twice (21%), three times (8%)], X-ray [once (55%), twice (33%), three times (12%)], and ultrasound [once (74%), twice (21%), three times (5%)].](https://canjhealthtechnol.ca/index.php/cjht/article/download/CM0034/version/1381/3181/12259/CM0034-fig23.png)
![Bar plot representing the proportion of responding sites that send reminders by email in the following lead times for CT, MRI, X-ray, and ultrasound appointments: CT [1 day (18%), 2 to 3 days (36%), 4 to 7 days (36%), over 1 week (12%)], MRI [1 day (28%), 2 to 3 days (44%), 4 to 7 days (28%), over 1 week (0%)], X-ray [1 day (20%), 2 to 3 days (40%), 4 to 7 days (40%), over 1 week (0%)], and ultrasound [1 day (20%), 2 to 3 days (40%), 4 to 7 days (40%), over 1 week (0%)].](https://canjhealthtechnol.ca/index.php/cjht/article/download/CM0034/version/1381/3181/12260/CM0034-fig24.png)
![Bar plot representing the proportion of responding sites that send reminders by email with the following frequencies for CT, MRI, X-ray, and ultrasound appointments: CT [once (83%), twice (17%)], MRI [once (25%), twice (75%)], X-ray [once (67%), twice (33%)], and ultrasound [once (82%), twice (18%)],](https://canjhealthtechnol.ca/index.php/cjht/article/download/CM0034/version/1381/3181/12261/CM0034-fig25.png)
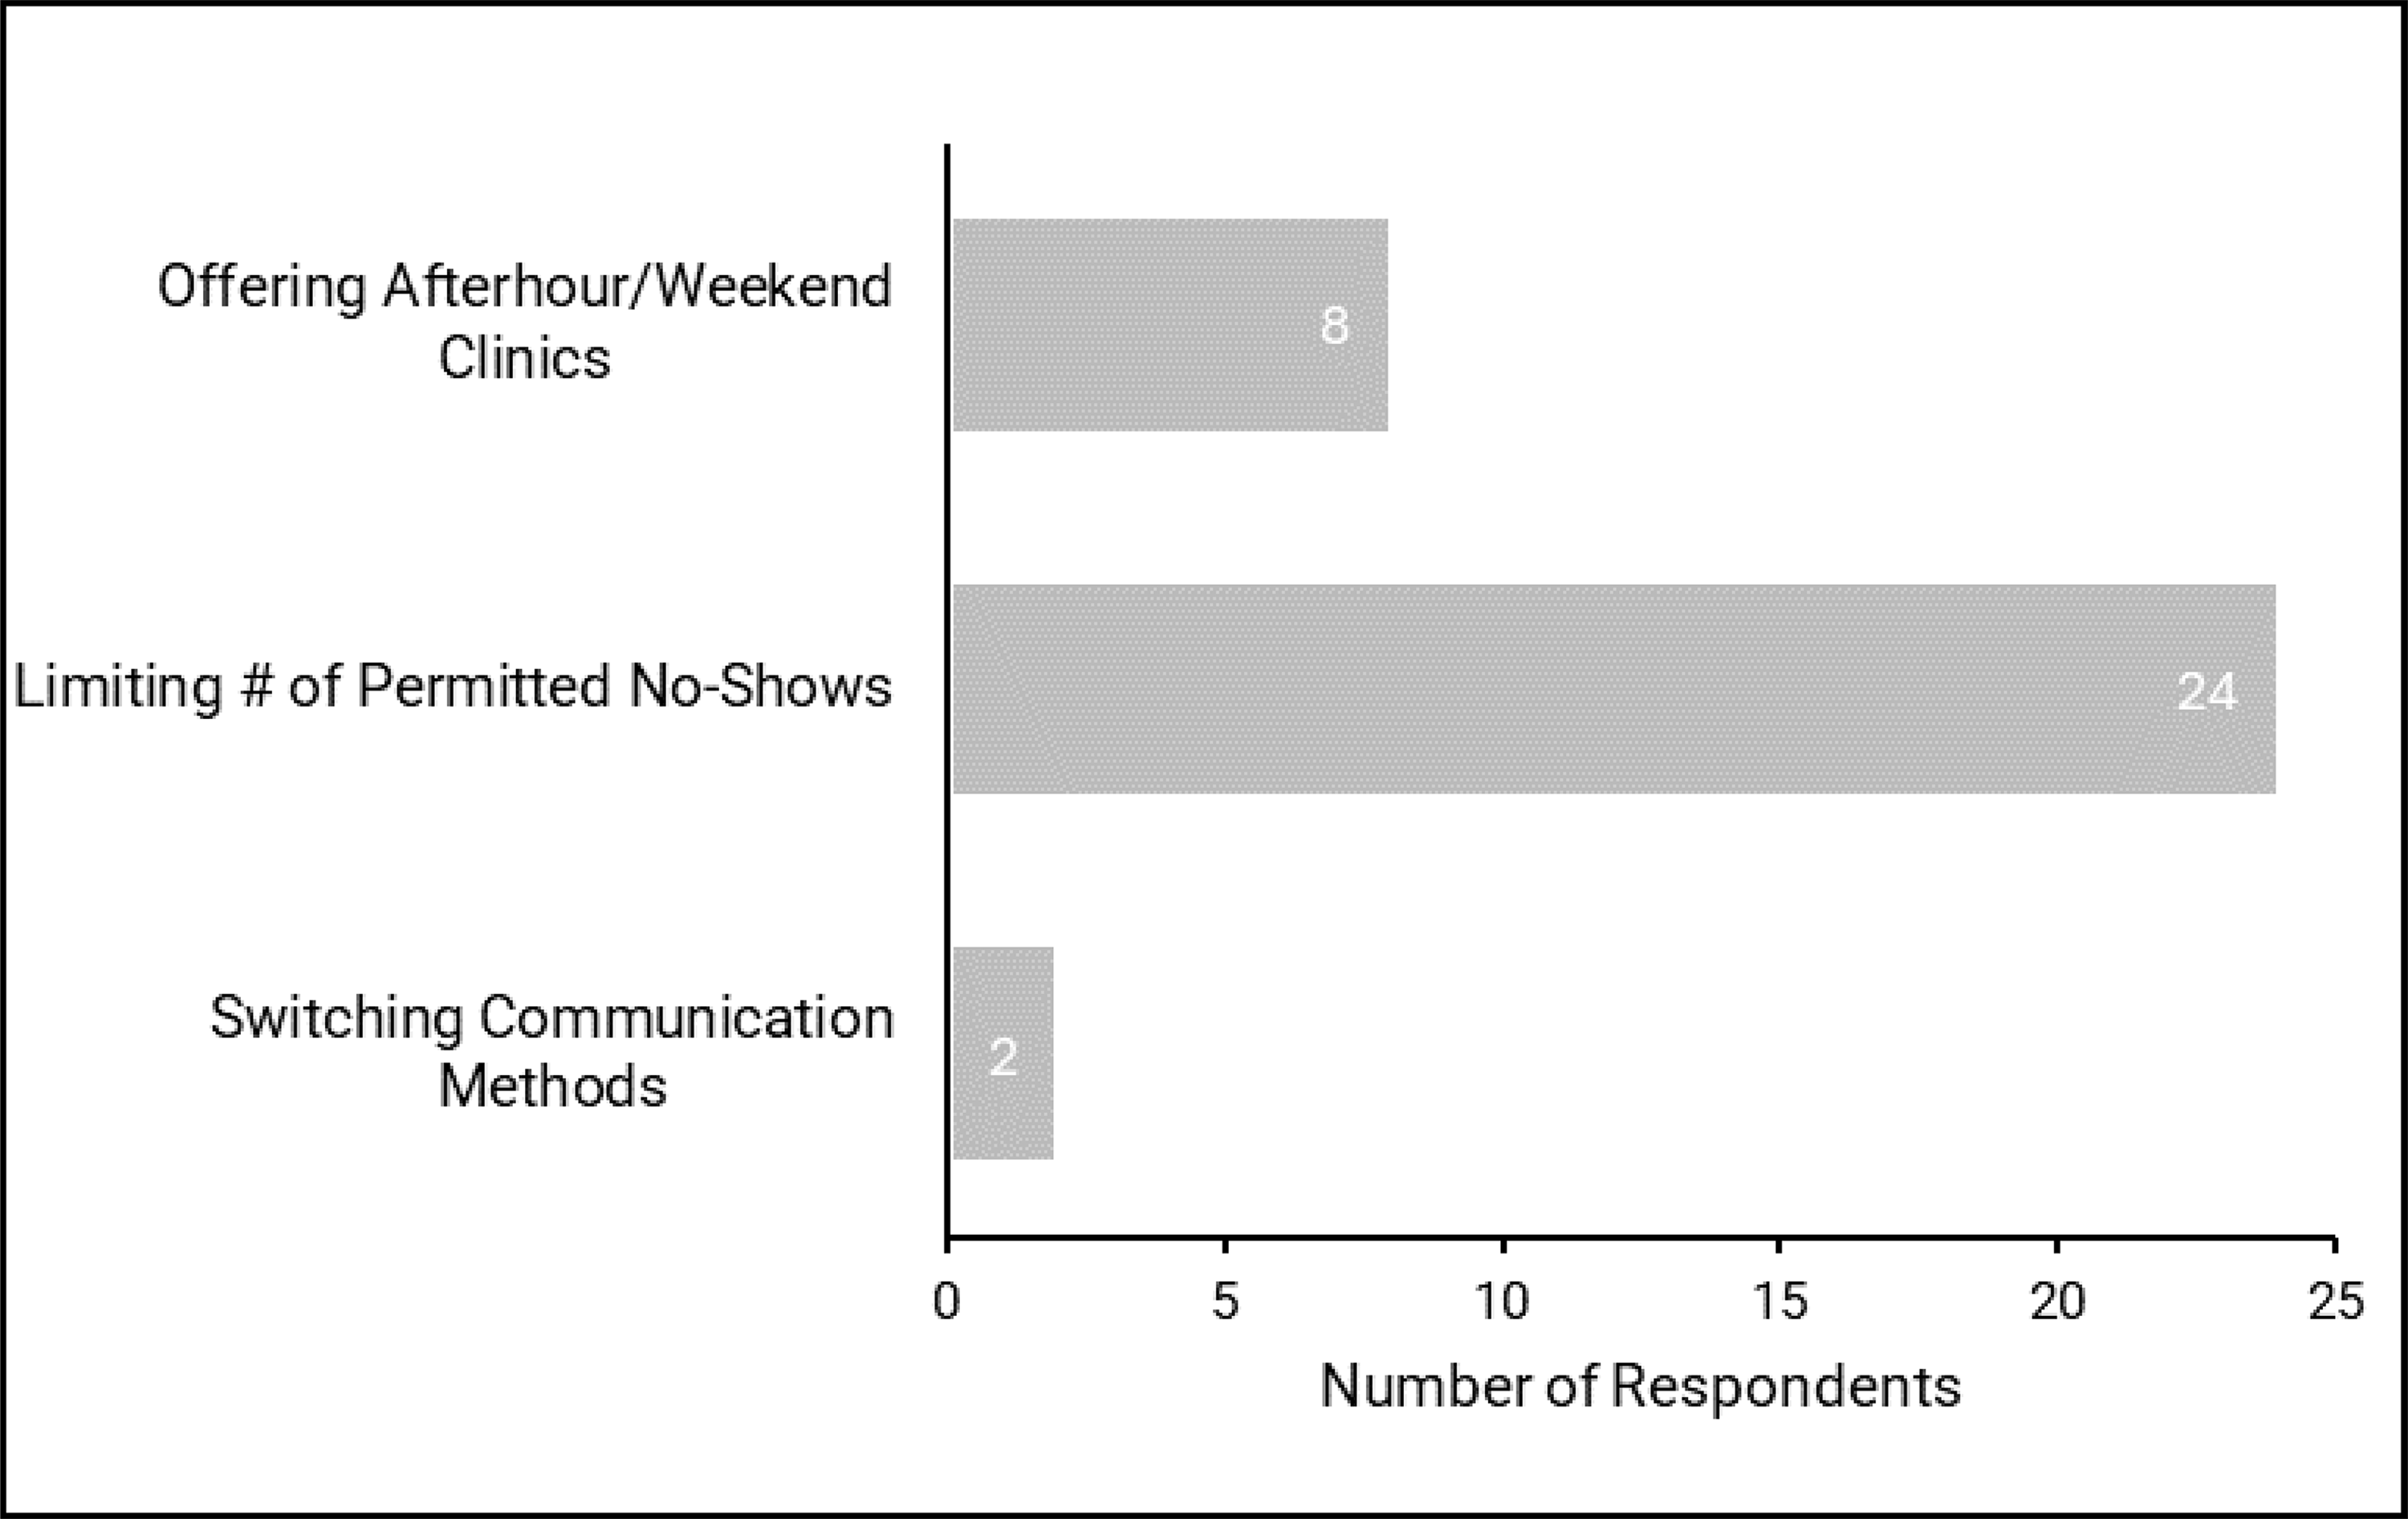
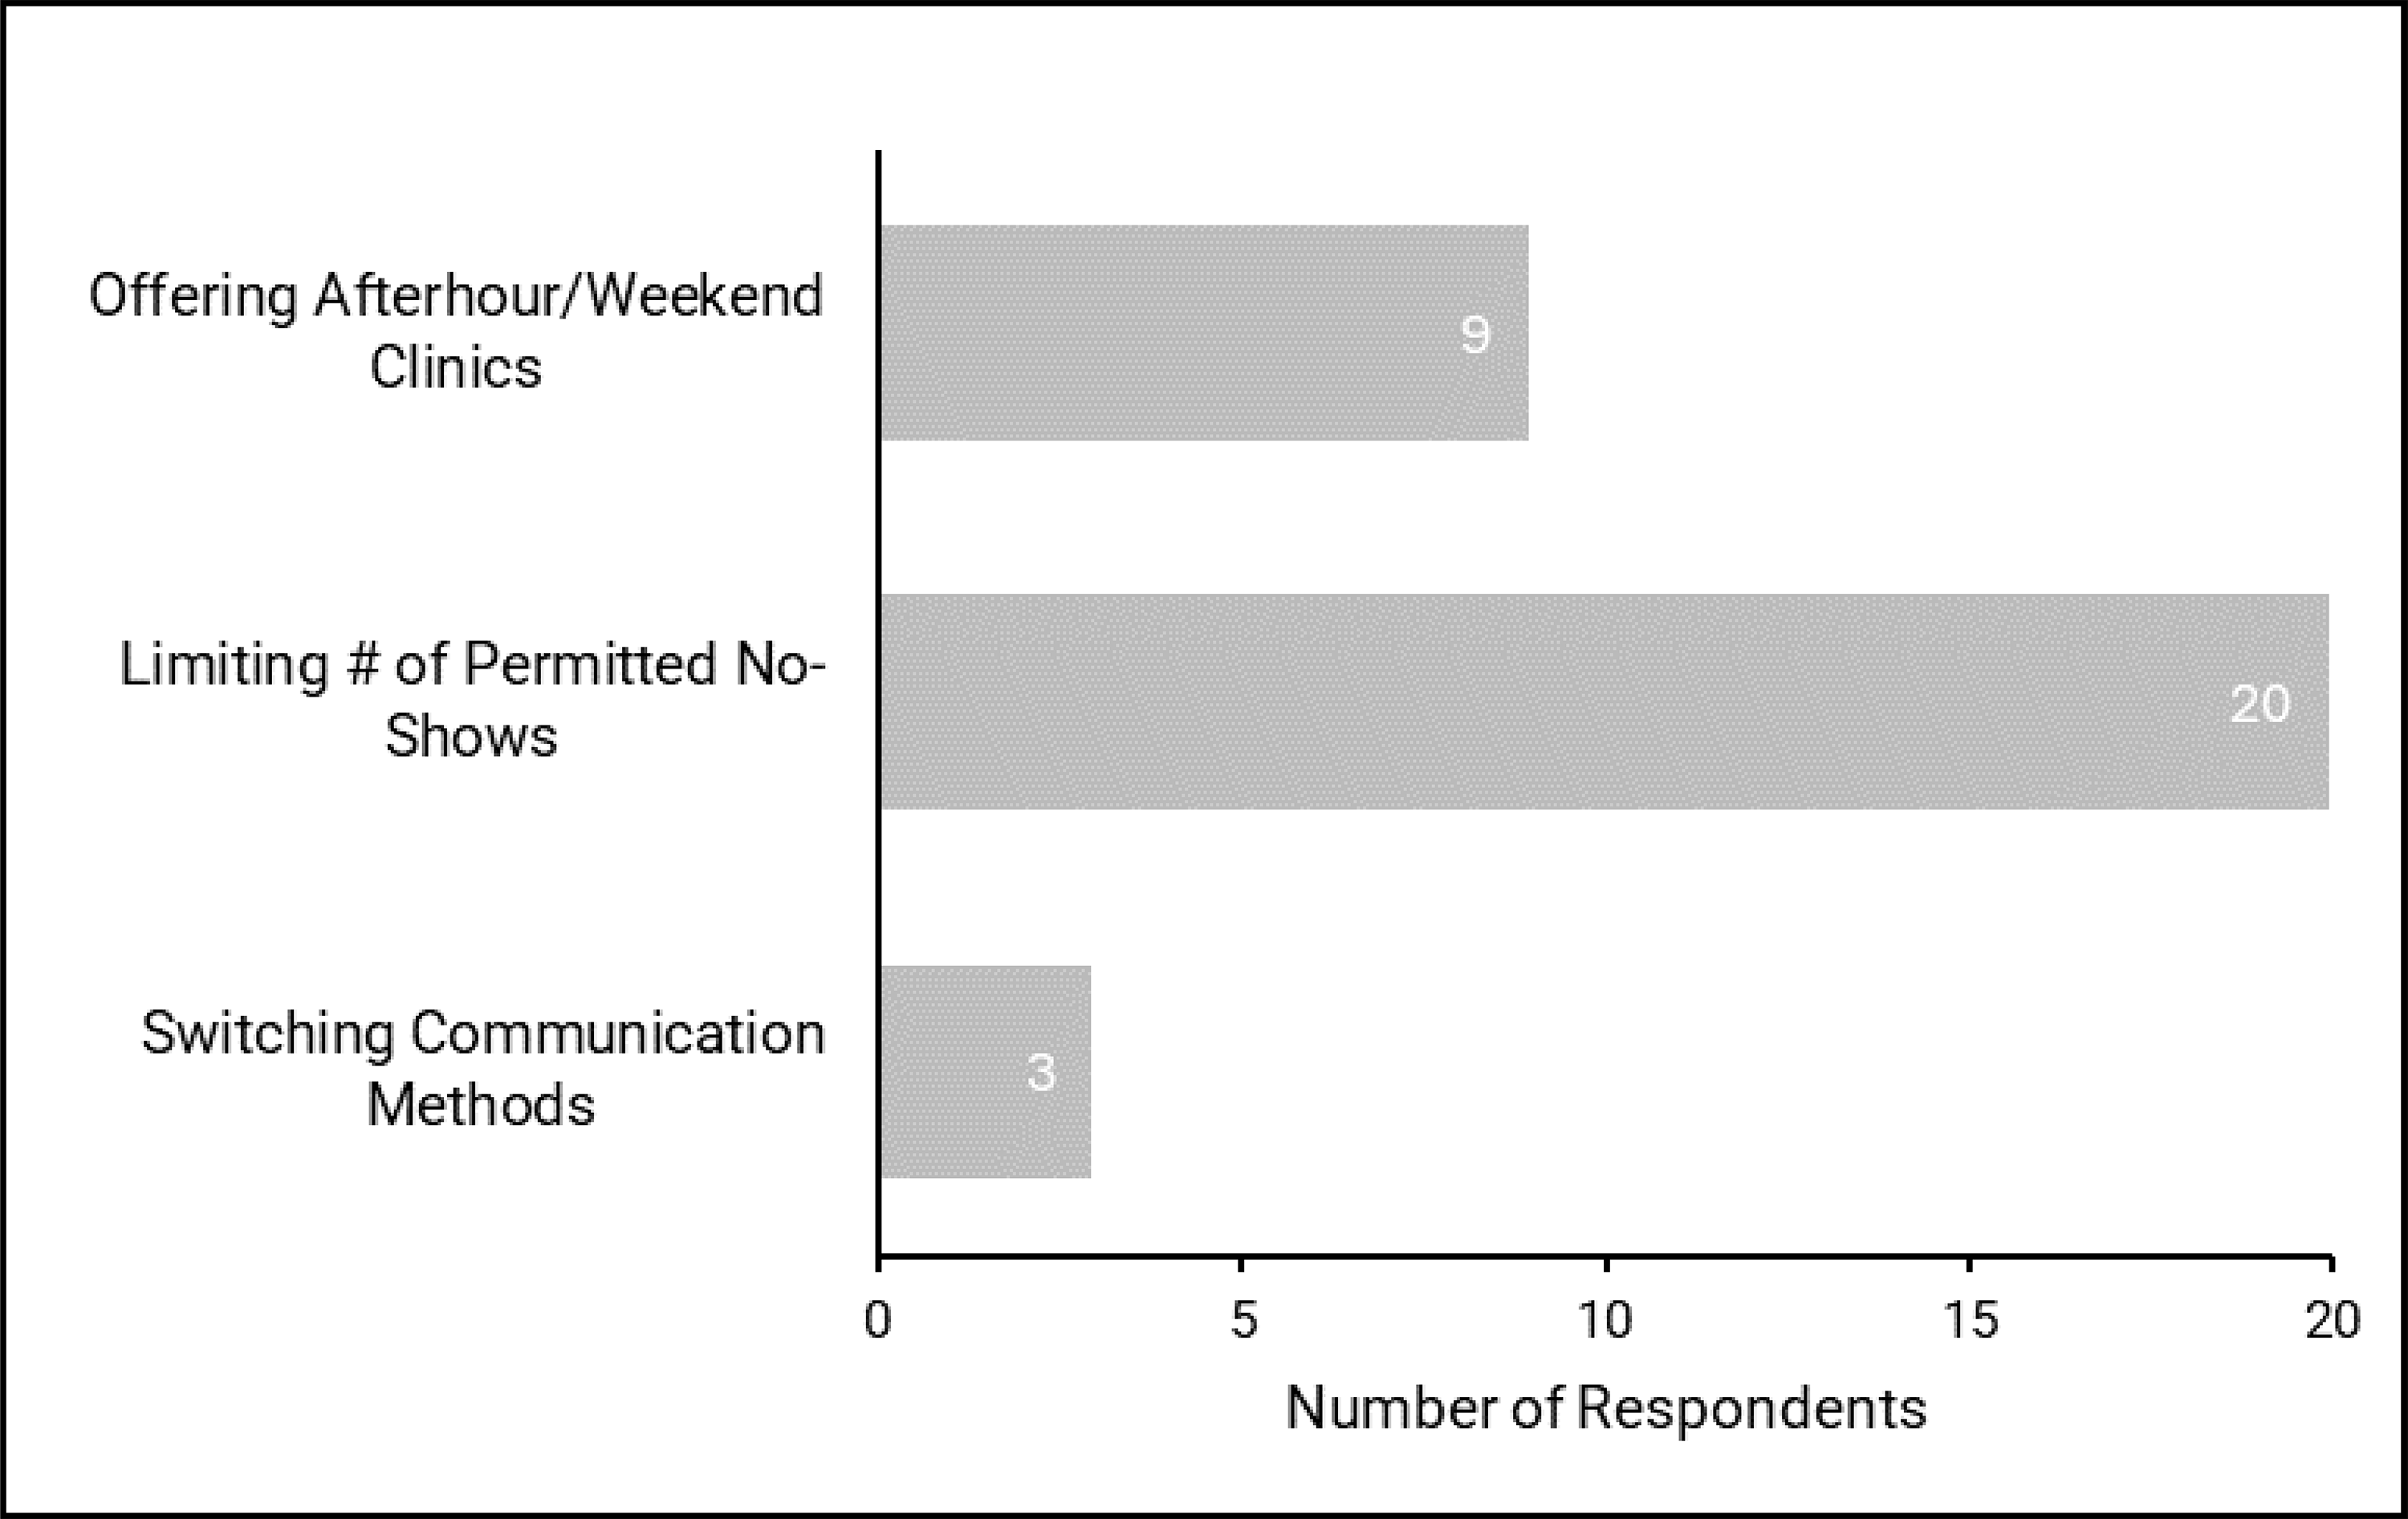
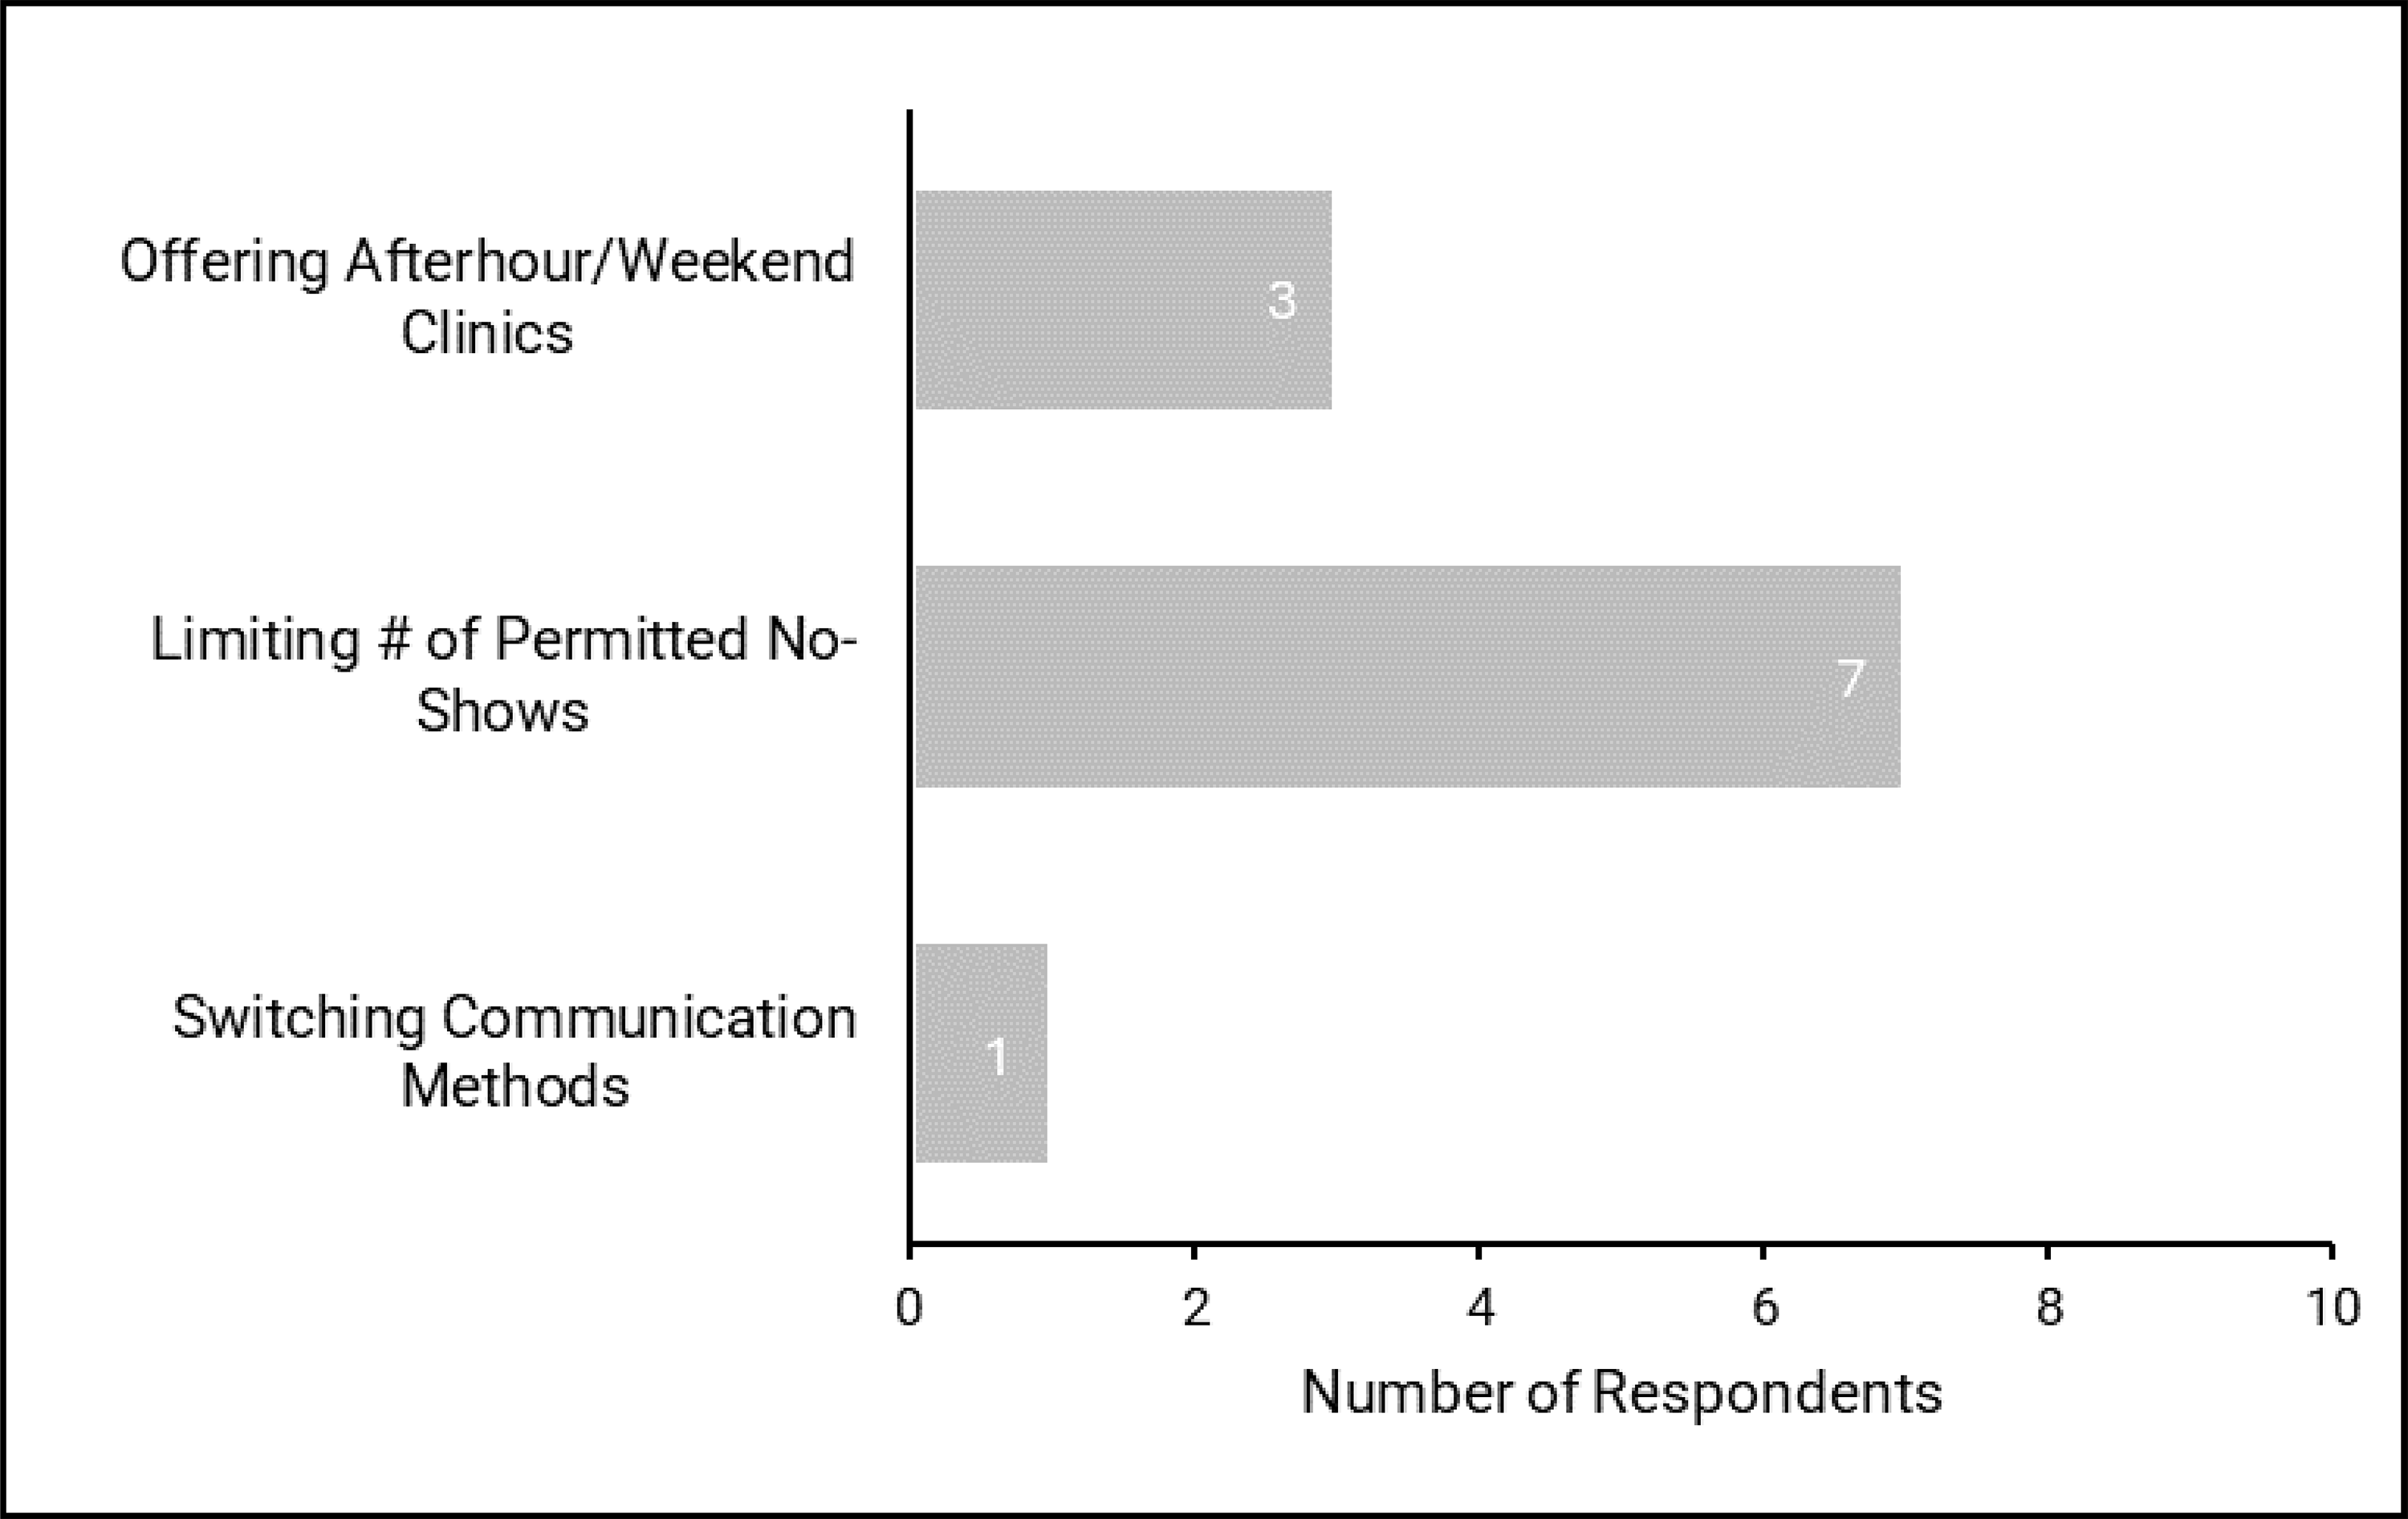
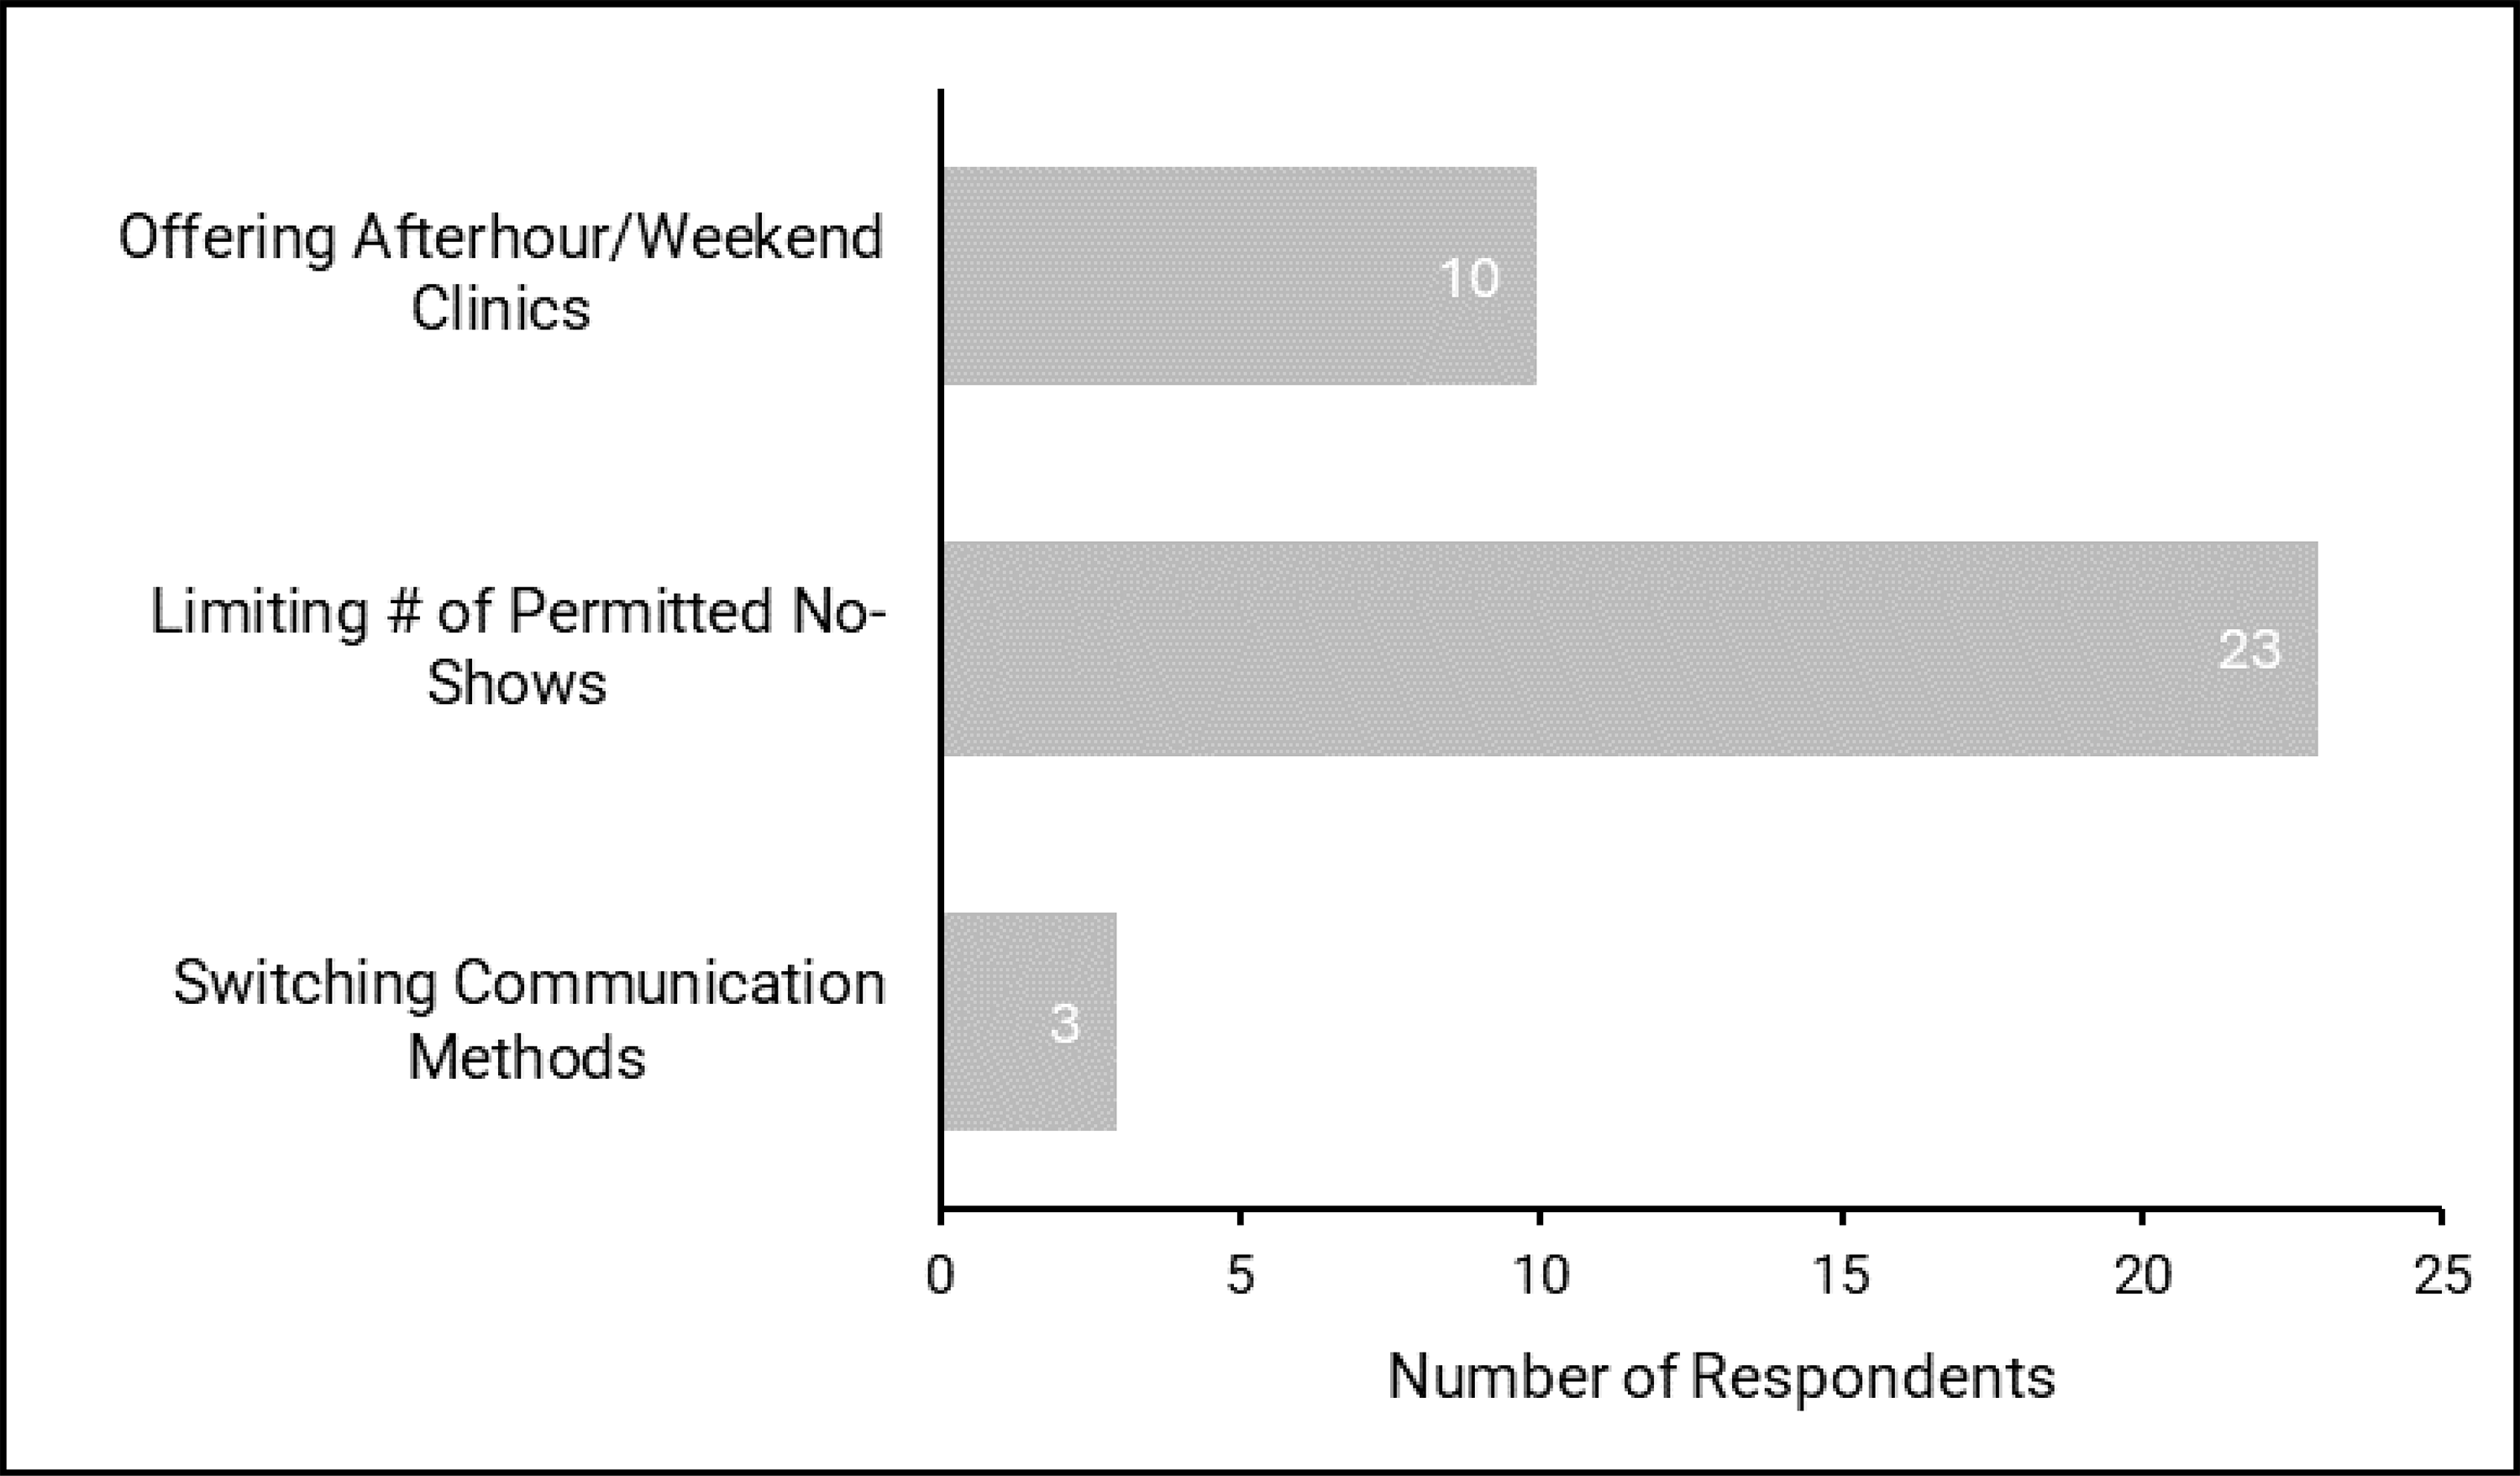
Table 3: Proactive and Reactive Strategies Reported to Reduce No-Show Rates
Modality | Proactive Strategies | Reactive Strategies |
|---|---|---|
CT |
|
|
MRI |
|
|
X-ray |
|
|
Ultrasound |
|
|
Figure 30: No-Show Rates Based on Referral Source
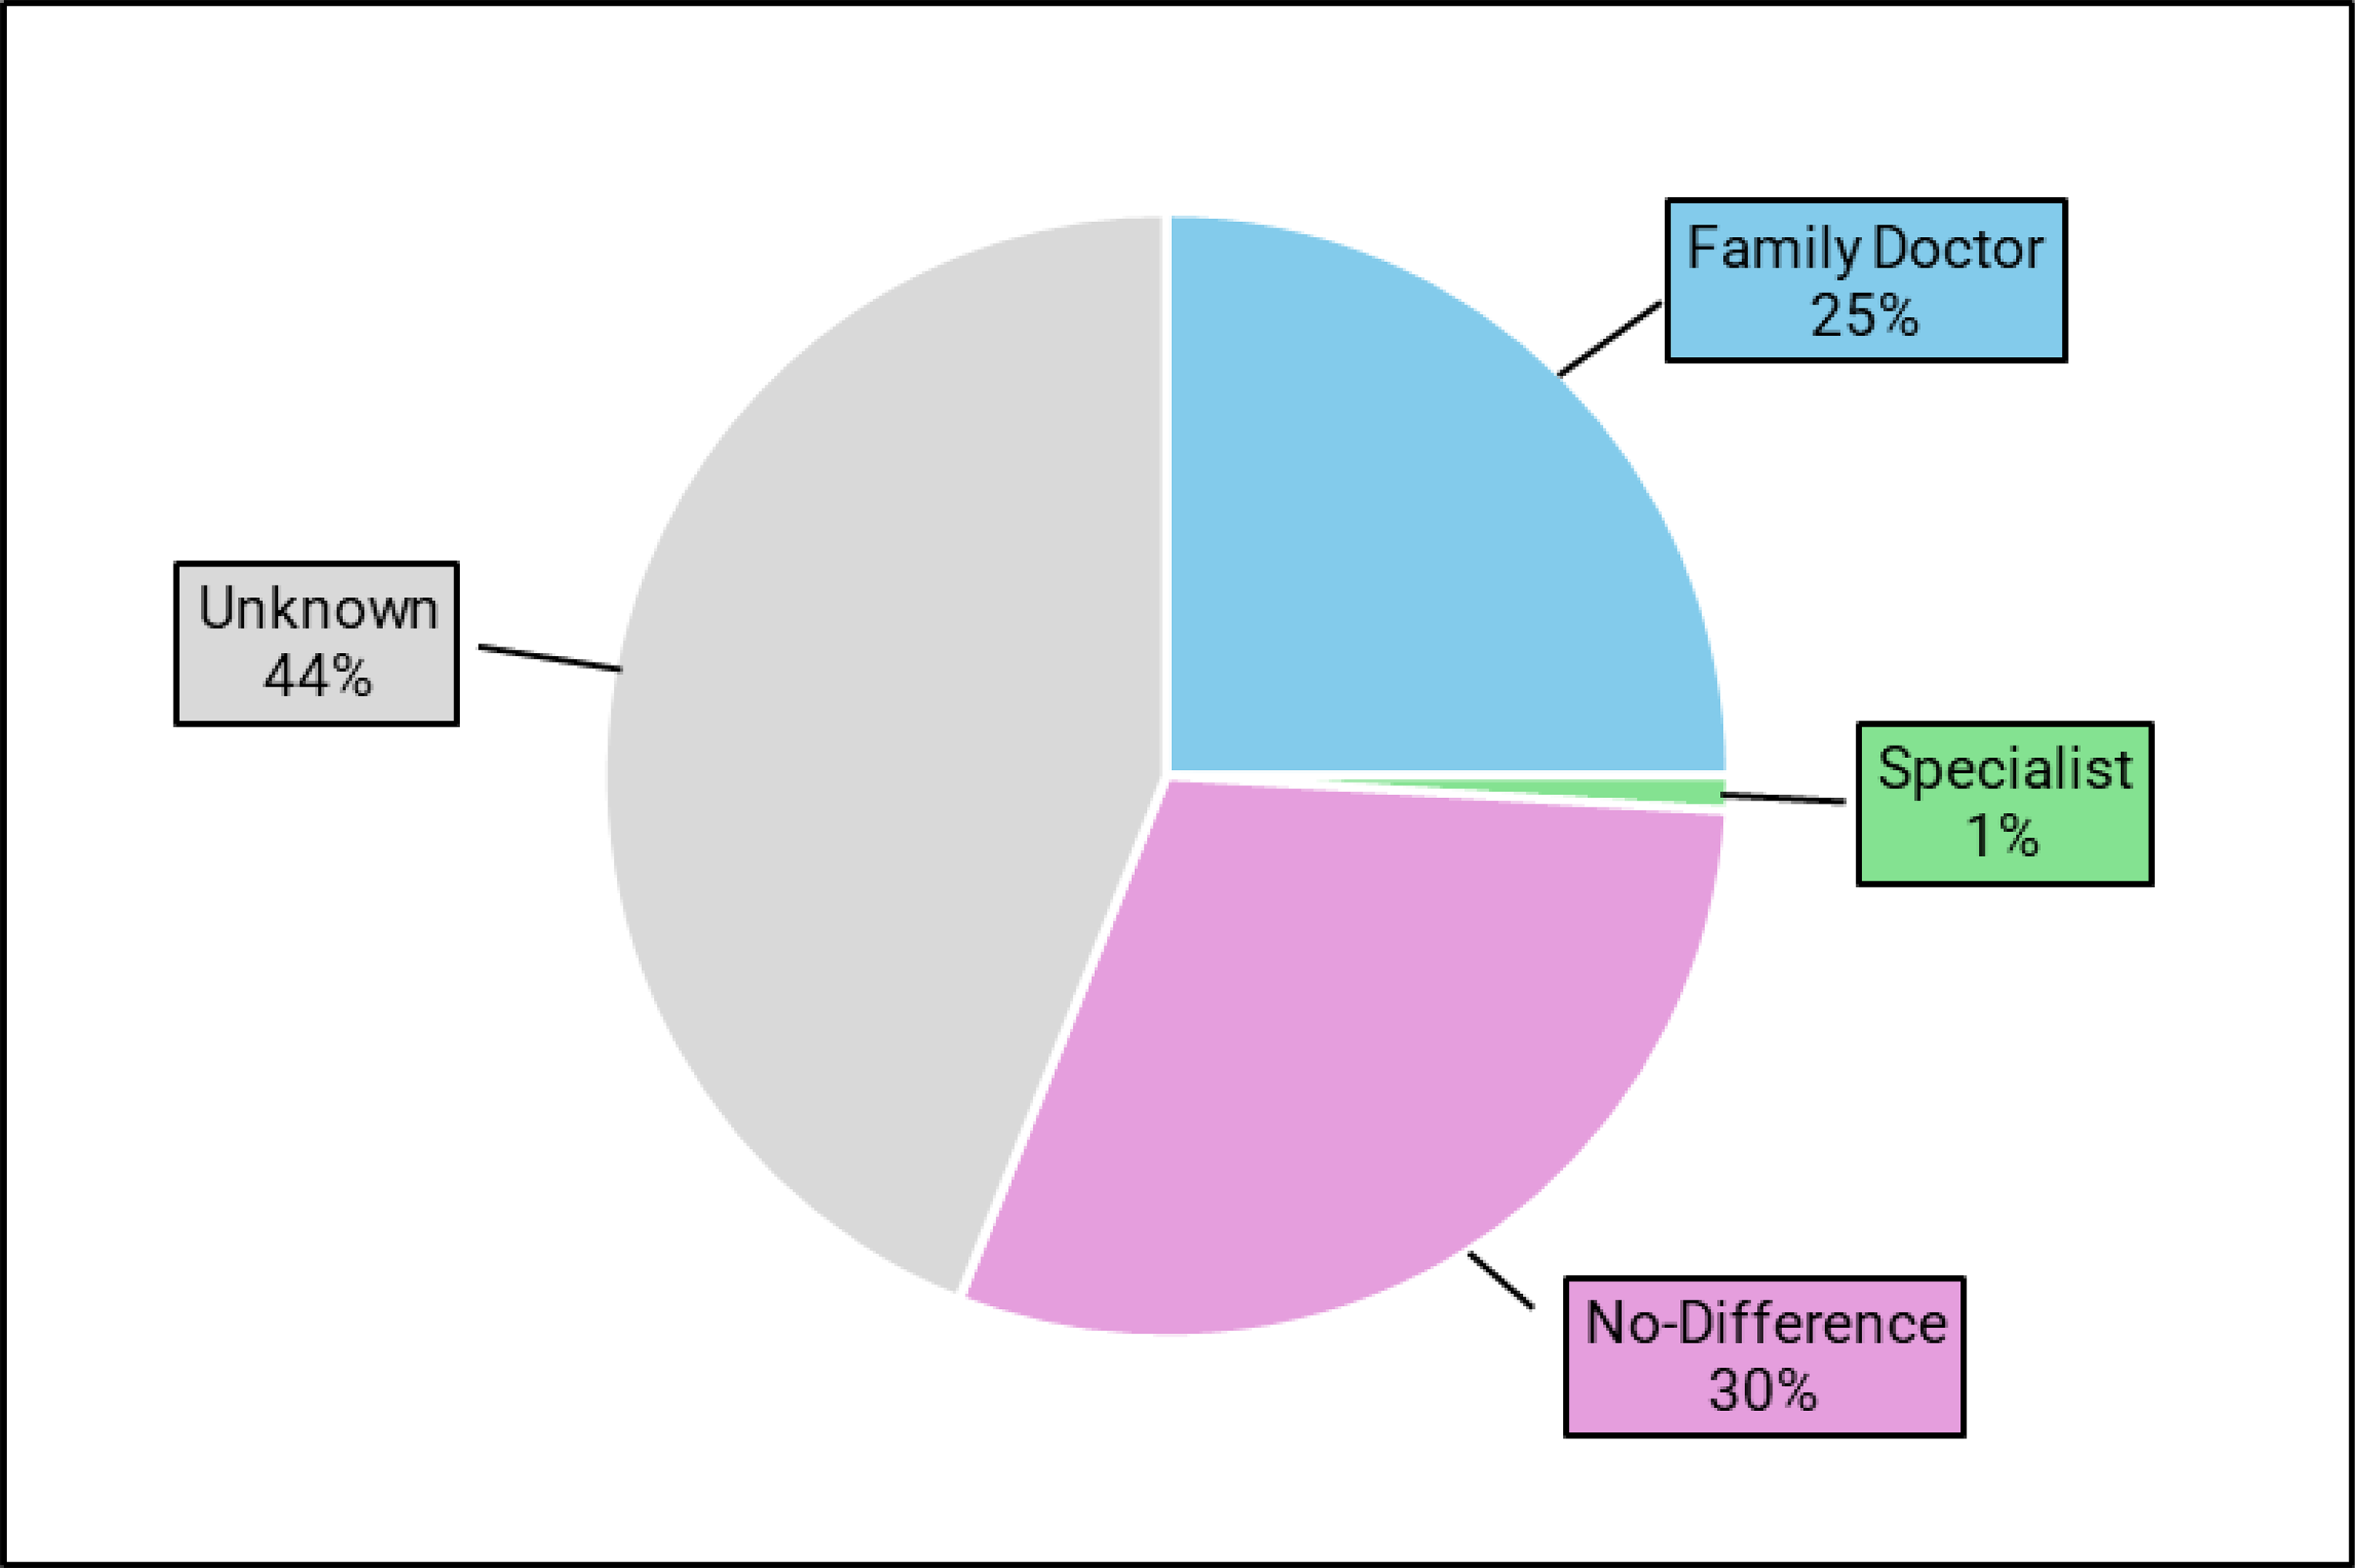
Notes: n = 85. Data are based on opinions from responding sites and may not be from quantitative sources.
Figure 31: Proportion of Responding Medical Imaging Sites Attributing Reductions in No-Shows to Automated Software
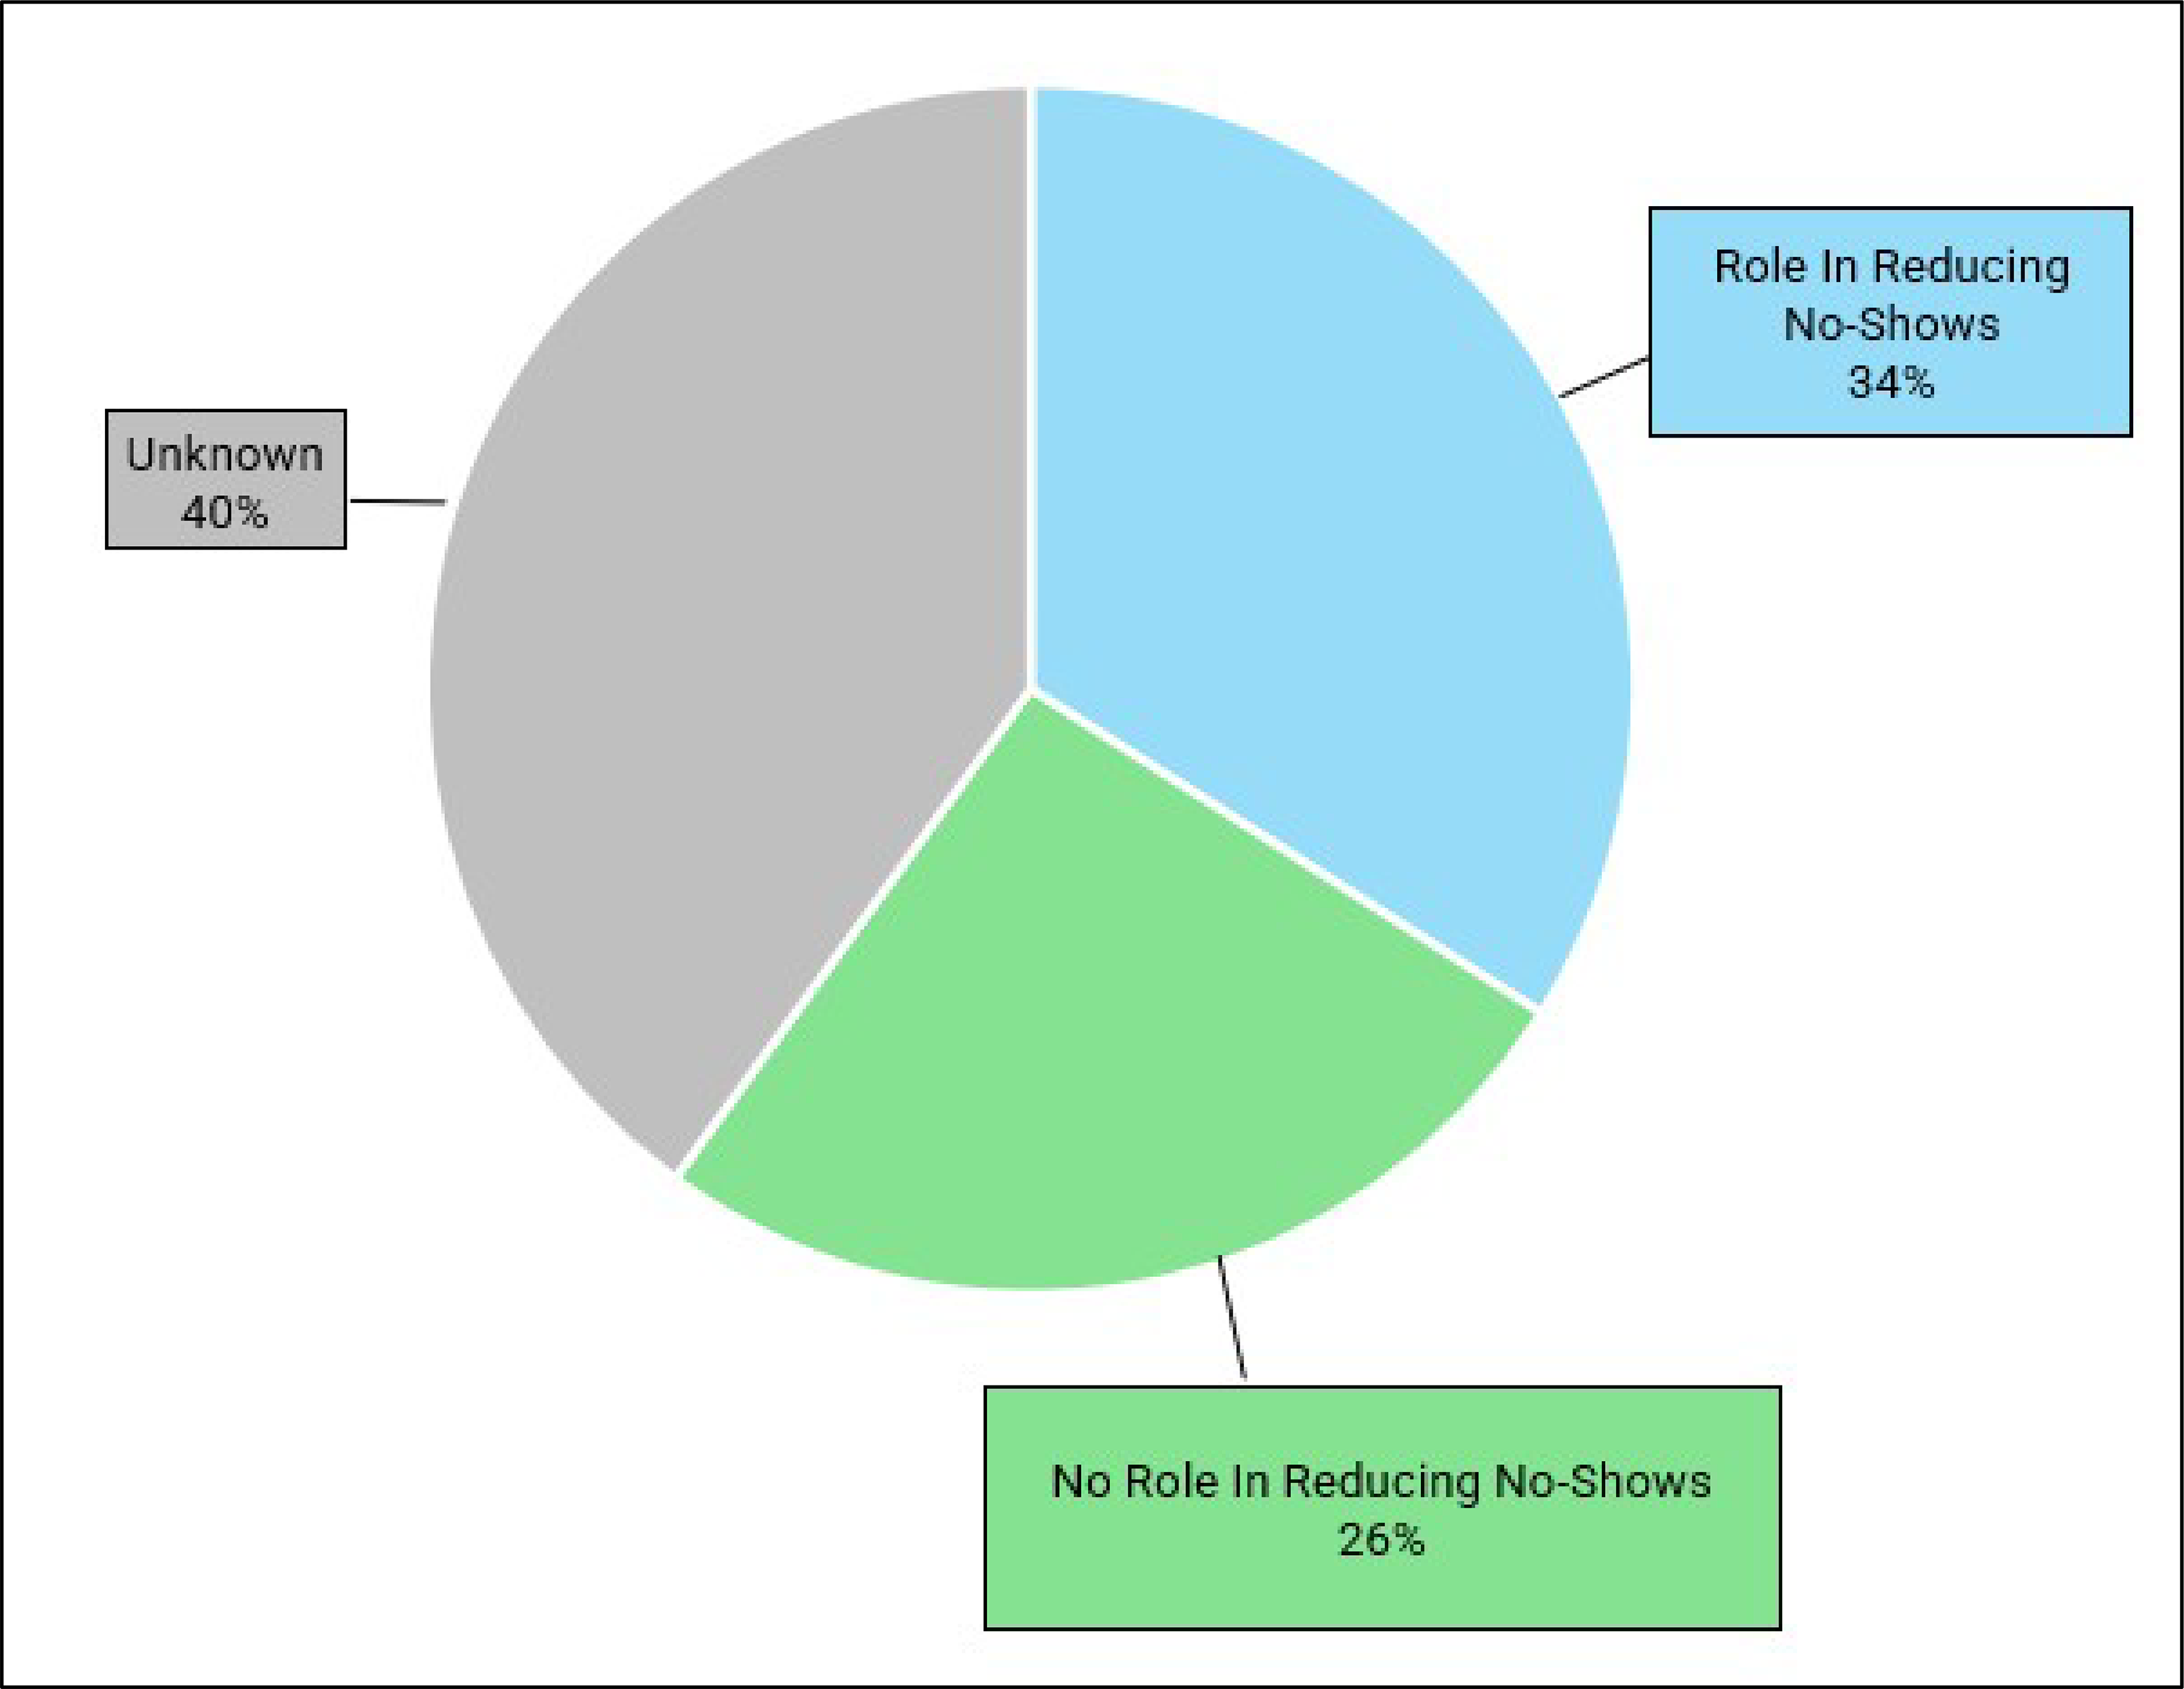
Notes: n = 85. Data are based on opinions from responding sites and may not be from quantitative sources.
Survey Questions
Note: Questions with CT/MRI/X-ray/Ultrasound or phone/text/email were asked for each item individually.
No-Shows in Your Imaging Department
What is the name of your facility?
Please enter your email address:
Please select the Province or Territory you are located in:
Newfoundland and Labrador
Nova Scotia
Prince Edward Island
New Brunswick
Quebec
Ontario
Manitoba
Saskatchewan
Alberta
British Columbia
Yukon
Northwest Territories
Nunavut
Is your site located in an urban, rural, or remote setting?
Urban
Rural
Remote
Which of the following modalities does your imaging department schedule appointments for (please select all that apply):
CT
MRI
X-ray
Ultrasound
Does your imaging department track and record no-show rates (either formally or informally)?
Yes
No
Which of the following modalities does your imaging department schedule appointments for (please select all that apply): CT, MRI, X-ray, and Ultrasound.
Do you track (either formally or informally) the total number of monthly outpatient CT/MRI/X-ray/Ultrasound appointments, and the corresponding number of no-shows on average?
Please provide the average number of CT/MRI/X-ray/Ultrasound appointments booked monthly at your clinic:
Please provide the average number of no-shows for CT/MRI/X-ray/Ultrasound appointments monthly at your clinic:
Proactive Strategies to Minimize No-Shows
Does your imaging department attempt to minimize no-shows using proactive strategies (i.e., overbooking, appointment reminders, posters in clinic, etc.)?
Yes
No
Don’t Know
Are proactive strategies to minimize no-shows applied to CT/MRI/X-ray/Ultrasound appointments in your imaging department?
Please select all proactive strategies used to minimize no-shows for CT/MRI/X-ray/Ultrasound appointments:
Overbooking
Advertisement and/or communication campaigns
Engaging general practitioners
Centralized phone number to reschedule/cancel appointments
Posted messages throughout the clinic
Online patient portal for managing appointments
Automated reminders (phone, text, or email)
Do you use any other proactive strategies not listed above to minimize no-shows for CT/MRI/X-ray/Ultrasound appointments?
Yes
No
Please specify the other proactive strategy(ies) used for CT/MRI/X-ray/Ultrasound appointments:
Have proactive strategies altered no-show rates for CT/MRI/X-ray/Ultrasound appointments:
In your opinion, what were the approximate no-show rates for each modality in your imaging department before the implementation of proactive strategy(ies): 0% to 5%, 6% to 10%, 11% to 15%, 16% to 20%, 21% to 25%, or over 25%?
In your opinion, what were the approximate no-show rates for each modality in your imaging department after the implementation of proactive strategy(ies): 0% to 5%, 6% to 10%, 11% to 15%, 16% to 20%, 21% to 25%, or over 25%?
Does your imaging department send appointment reminders by phone/text/email.
Yes
No
If no, why are phone/text/email reminders not used in your imaging department?
Please specify how far in advance of an appointment phone/text/email reminders are made for each modality: 1 day, 2 to 3 days, 4 to 7 days, or over 1 week.
Please specify how frequently phone/text/email reminders are made before an appointment: once, twice, three times, 4 or more times.
Do you use manual or automated phone/text/email reminders for each modality: manual, automated, or both?
Reactive Strategies to Minimize No-Shows
Does your imaging department attempt to minimize no-shows using reactive strategies (i.e., charging for missed appointments, offering after-hour clinics, limiting permitted number of no-shows, etc.)?
Yes
No
Don’t Know
Are reactive strategies to minimize no-shows applied to CT/MRI/X-ray/Ultrasound appointments in your imaging department?
Yes
No
Not Applicable
Please select all reactive strategies used to minimize no-shows for CT/MRI/X-ray/Ultrasound appointments.
Switching communication methods (i.e., if initial communication went unanswered).
Limiting the number of no-shows before a referral is cancelled.
Offering after hours or weekend clinics to accommodate those unable to attend during regular operating hours.
Do you charge for missed CT/MRI/X-ray/Ultrasound appointments?
Yes
No
If yes, please describe how much you charge ($) for missed CT/MRI/X-ray/Ultrasound appointments.
If yes, please describe how charging for missed CT/MRI/X-ray/Ultrasound appointments is managed at your site (i.e., finance department, booking clerks, booking manager, etc.):
Do you use any other reactive strategies not listed above to minimize no-shows for CT/MRI/X-ray/Ultrasound appointments?
Yes
No
If yes, please specify the other reactive strategy(ies) used for CT/MRI/X-ray/Ultrasound appointments:
Have reactive strategies altered no-show rates for CT/MRI/X-ray/Ultrasound appointments?
Yes
No
Don’t Know
If yes, please describe the reactive strategy(ies) that altered no-show rates for CT/MRI/X-ray/Ultrasound appointments:
In your opinion, what were the approximate no-show rates for each modality in your imaging department before the implementation of reactive strategy(ies): 0% to 5%, 6% to 10%, 11% to 15%, 16% to 20%, 21% to 25%, or over 25%?
In your opinion, what were the approximate no-show rates for each modality in your imaging department after the implementation of reactive strategy(ies) 0% to 5%, 6% to 10%, 11% to 15%, 16% to 20%, 21% to 25%, or over 25%?
General Information
In your experience, do no-show rates differ between patients referred by a family doctor and those referred by a specialist?
Higher rate of no-shows from family doctor referrals
Higher rate of no-shows from specialist referrals
No difference in no-show rates between referrals from family doctors or specialists
Don’t Know
Does automated software play a role in reducing no-shows in your imaging department (e.g., scheduling systems, tailored reminders, etc.)?
Yes
No
Don’t Know
If yes, please specify the type of software and how it is used to reduce no-shows:
Please provide any additional information related to no-shows in your medical imaging department not addressed in this survey that you feel are important to mention:
Figure 32: In-Clinic No-Show Reduction Poster Example 1

Source: https://horizonnb.ca/news/health-topics/missed-appointments-awareness-campaign/.
Figure 34: In-Clinic No-Show Reduction Poster Example 3
Source: https://www.nshealth.ca/improving-diagnostic-imaging-access-and-care.
Patient Engagement Questions
Factors Contributing to Missed Medical Imaging Appointments
Question 1: Do these findings reflect your experiences or observations about the phenomenon of missed appointments?
Question 2: Are you surprised by any of these factors?
Question 3: Are there any factors missing from your perspective?
Question 4: Are you comfortable using the term 'no-show' to describe instances when patients miss their medical imaging appointments, or would you prefer an alternative term?
Strategies to Reduce No-Shows in Medical Imaging
Question 1: Would any of these strategies help decrease the number of missed appointments in your experience?
Question 2: Are you surprised by any of these strategies?
Question 3: Are there any strategies missing from your perspective?
Question 4: Are there any special considerations for under-represented groups that should be brought to the attention of the report authors? In this context, under-represented and under-served groups include (but are not limited to):
people who speak a language other than English or French,
younger people (under 30) and older people (over 60),
people living further from a medical imaging clinic (5 km or further),
people living on a low income.
Patient Engagement Summary
Purpose
Since “no shows” are highly influenced by individual experiences, circumstances, behaviour, and environment of individuals, it was important to consult with patients and caregivers who have extensive experience with medical imaging to understand the phenomenon of missed appointments and to gain their feedback on the survey results and literature findings.
The purpose of holding the small group engagement sessions was to gain a more comprehensive understanding of current context in medical imaging, to explore patient and caregiver experiences with medical imaging, with particular attention to the systemic and personal impacts of missed or delayed appointments. This included understanding the factors contributing to missed appointments, as well as the indirect effects on others — such as the experience of waiting in clinical settings where other patients did not attend.
The input gathered from patient engagement sessions were focused on obtaining perspective from key interested parties who have lived experience either as patients or caregivers from across Canada.
Key findings
Many factors that contribute to “no shows” are connected. A coordinated, multifaceted approach is needed to facilitate change and reduce no-shows.
Systems need to be flexible to respond to individual patients and caregiver needs.
Approaches to reduce “no shows” must be tailored to individual circumstances, as they shift and evolve.
Engagement Approach
Interested parties were identified through an Open Call for participation in the CDA-AMC Medical Imaging Task Force. Participants included people with experience as patients and caregivers, from across Canada. Participants were invited to attend 1 of 2 90-minute consultations held August 27 and September 5, 2025. Participants included people with previous experiences in medical imaging, those who were experiencing medical imaging, or those who were caregivers for those who required medical imaging appointments.
Formats
Both consultations were carried out in the following format: authors presented findings from an informal survey and literature review, and a group discussion was held to assess these findings.
Part 1: Factors that Contribute to No-Shows in Medical Imaging
The first part included a presentation about the reported psychological, sociodemographic, logistical, and health care system factors that contribute to missed appointments, such as gender, age, distance from clinic, number of previous appointments, appointment lead times, modality type, referral source, booking method, wait times, forgetfulness, and financial challenges.
The following questions were proposed as part of the discussion:
Do these findings reflect your experience or observations about the phenomenon of missed appointments?
Are you surprised by any of these factors?
Are there any factors missing from your perspective?
Part 2: Proactive Strategies to Reduce No-Shows in Medical Imaging
The second part of the consultation included a presentation about strategies that are utilized to reduce rates of missed appointments, such as; reminders, flexible or dynamic scheduling, shorter lead times, support for transportation, training for health care providers, better communication/clear instructions, charging for missed appointments, overbooking, adaptive scheduling, and the use of AI to predict scheduling and highlight risks of missed appointments.
The following questions were proposed as part of the discussion:
Would any of these strategies help decrease the number of missed appointments in your experience?
Are you surprised by any of these strategies?
Are there any special considerations for these groups that should be brought to the attention of the report authors?
Using the term “no show” to describe instances when patients miss their medical imaging appointments.
Most participants agreed that the term “no show” is widely used across sectors and found it acceptable. Some participants understood the term “no show” as an internal term used by service providers and that a more formal term could be used with the public, such as “missed appointments.”
Some participants expressed concern that the term “no show” could be interpreted as labelling or placing the blame on those missing an appointment.
There was agreement that any term used to describe the phenomenon should be straight forward and easily understandable. Consistency in language was described as important.
Discussion: Factors that Contribute to “No-Shows”
Access and Infrastructure
We heard that transportation, family responsibilities, childcare and inflexible work schedules were significant barriers to attending MI appointments. Most participants agreed that those people who live in rural or remote communities face substantial transportation challenges including, but not limited to air travel, and cost of accommodations that may be necessary – particularly if they need to attend multiple appointments. One individual explained that there was pressure not to take time off work, and potential stigma for taking time off from work to attend appointments.
Cognitive and Informational
We heard participants articulate that having multiple different reminder options available helps to meet individual needs. We also heard that a tailored approach to how a person gets notified of upcoming appointments would be most helpful, depending on their background, preference and individual needs.
Participants also noted that clinics use different ways to schedule appointments and to send appointment reminders, which made it difficult to keep track, especially for people who are trying to manage multiple appointments. Many participants expressed support for a consistent, centralized approach across clinics.
Logistical Challenges
One participant shared a positive experience in which a clinic coordinated multiple appointments for them on the same day. This personalized scheduling was appreciated, as it reduced travel time and lessened the burden on their caregiver.
However, other participants reflected that when multiple appointments are scheduled in close succession, delays for 1 exam can result in the need to cancel or miss subsequent appointments.
Some patients noted that they have had scans done in emergency and their initial referral is not cancelled leading to a no-show. Patients may be unaware of the duplicate request, and the lack of coordination in the health care system causes it to go unnoticed.
Psychological and Behavioural
Many participants acknowledged anxiety related to attending appointments. Two participants referred to “scan-xiety” - the fear of receiving a diagnosis indicating a recurrence or relapse of a previous diagnosis as well as feeling tired of attending multiple scans as a contributing factor to missed appointments.
Two participants highlighted that shame and stigma associated with certain illnesses in some communities can contribute to missed appointments. Similarly, language barriers—particularly for individuals whose first language is not English were identified as a factor that contributes to missed appointments, especially in communities where stigma around specific health conditions may further discourage attendance.
Discussion: Strategies to Reduce No-Shows
Patient-Centric Approach
Throughout the discussions, we heard about a need for individualized approaches that meet the unique needs of each patient and/or caregiver. For example, participants highlighted that caregivers could support patients through appointment reminders and attendance.
Many participants described the need for support from a person in a system navigator role, and that cultural sensitivity training could facilitate positive health care experience and may reduce “no-show” rates. Some participants explained that they were unaware of support services, such as ride shares, and cultural liaisons (e.g., support person to help people from specific groups or communities). Participants shared that it would be helpful for MI requisitions to include referrals to a system navigator (e.g., care coordinator) particularly for people who may be differently abled, who live with a cognitive impairment, whose first language is not English or French, or who may need additional types of supports.
Many expressed the value of navigators, who can provide people with information about the services that are available that can reduce the financial impact of getting to appointments, for example, volunteer-run transportation services.
Appointment Reminders
We heard that a variety of tools are used to schedule and remind people of appointments, but they are not applied consistently across clinics/departments. Some clinics use telephone reminders, others email, applications, paper, decreased lead time and opportunity for walk-ins.
We heard that reminders were valued by individuals and caregivers. Most explained that the ideal timing of reminders varied between 2 and 4 weeks before the scheduled appointment, and again 2 to 3 days before the exam date. Many participants expressed that plain language was important, for example, reminders that had less text, particularly in situations where a person may be experiencing stress related to health conditions. We also heard that including appointment preparation instructions in appointment reminders would be helpful.
Many participants noted that reminders were most effective when done in multiple stages and included caregivers in communications, particularly for older adults or people living with cognitive impairments.
One participant articulated that post-visit surveys may be a way to help service providers tailor their services to meet patient needs.
Communication
We heard participants comment that communication between health care providers and patients could be enhanced to explain why medical imaging exams are important to their health. Most participants agreed that taking a trauma-informed, and patient-centric approach could facilitate these conversations. We heard from participants that patients may not understand the importance of MI for diagnosis and monitoring. Many agreed that if someone doesn’t attend an MI appointment, it would be important for providers to take the time to understand why it happened, may help providers understand how to support their patients in different ways.
Many participants also articulated that patients who miss appointments are not aware of the financial implications on the health care system or that other people who may need imaging may lose access to an open time slot. Some participants felt that it may be helpful for the implications that no-shows have on the public was important to communicate.
Dynamic Scheduling
One individual shared a positive experience when a medical imaging clinic noticed that they had multiple upcoming scans and coordinated them all on the same day. There was agreement among many participants that streamlined or centralized services would support accessibility and may be 1 of the factors that could reduce “no shows.”
We heard that some participants were in favour of making it possible for patients to self-refer and schedule their own appointments. Having a platform or application where 1 can book their own appointments rather than having to wait for a call would be a helpful tool.
Additional Comments
Overbooking
Many participants were surprised by the concept of overbooking and expressed concerns about how that would be implemented, as well as the negative impacts that would occur if all patients who were booked attended their appointments. One participant previously had a negative experience with this approach and therefore discouraged it.
Fees
No-show fees were also not supported. Most participants felt that this approach was punitive and did not support the goal of supporting patients in attending their medical imaging appointments.
ISSN: 2563-6596
Canada’s Drug Agency (CDA-AMC) is a pan-Canadian health organization. Created and funded by Canada’s federal, provincial, and territorial governments, we’re responsible for driving better coordination, alignment, and public value within Canada’s drug and health technology landscape. We provide Canada’s health system leaders with independent evidence and advice so they can make informed drug, health technology, and health system decisions, and we collaborate with national and international partners to enhance our collective impact.
Disclaimer: CDA-AMC has taken care to ensure that the information in this document was accurate, complete, and up to date when it was published, but does not make any guarantee to that effect. Your use of this information is subject to this disclaimer and the Terms of Use at cda-amc.ca.
The information in this document is made available for informational and educational purposes only and should not be used as a substitute for professional medical advice, the application of clinical judgment in respect of the care of a particular patient, or other professional judgments in any decision-making process. You assume full responsibility for the use of the information and rely on it at your own risk.
CDA-AMC does not endorse any information, drugs, therapies, treatments, products, processes, or services. The views and opinions of third parties published in this document do not necessarily reflect those of CDA-AMC. The copyright and other intellectual property rights in this document are owned by the Canadian Agency for Drugs and Technologies in Health (operating as CDA-AMC) and its licensors.
Questions or requests for information about this report can be directed to Requests@CDA-AMC.ca.